Embed Size (px)
Citation preview
Effectiveness of Radar Speed Feedback Signs &
Other Traffic Calming Techniques:
Final Draft
i Effectiveness of Radar Speed Feedback Signs - Final Draft
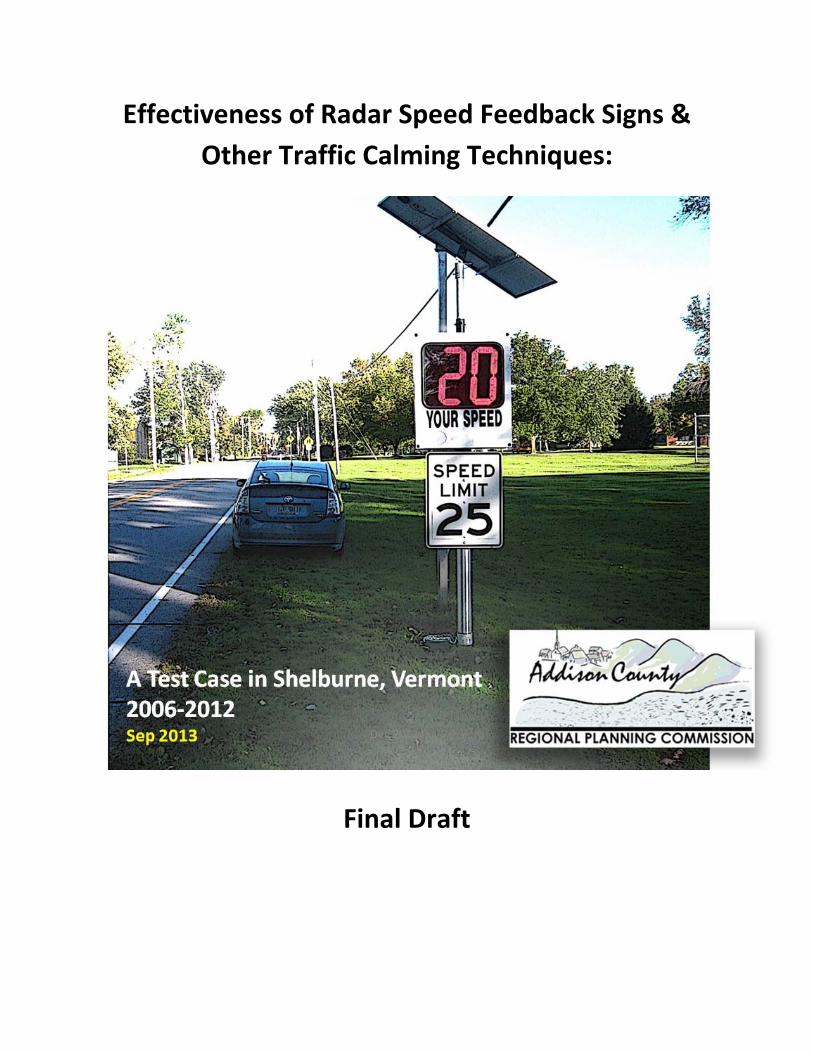
Effectiveness of Radar Speed Feedback Signs & Other Traffic Calming Techniques: A Test Case in Shelburne, Vermont: 2006‐2012 Final Draft: 16 September 2013 Table of Contents
I. Introduction ………………………………………………………………………………... 1
II. Impacts on Speeds ………………………………………………………………………… 1
III. A Time-Comparison Study on Harbor Road in Shelburne, Vermont ………………... 1
IV. Test Site 1 (SHEL-26) Harbor Road: Western Location ……………………………….. 2
V. Test Site 2 (SHEL-25) Harbor Road: About 430 ft. East of School Driveway ……….. 3
VI. Test Site 3 (SHEL-28) Harbor Road: Eastern Location ………………………………... 4 VII. Further Observations ……………………………………………………………………… 6 VIII. Conclusion ………………………………………………………………………………….. 6 IX. References ………………………………………………………………………………….. 7 X. Glossary …………………………………………………………………………………….. 7
Addison County Regional Planning Commission 14 Seminar Street Middlebury, Vermont 05753
T 802.388.3141 F 802.388.0038 http://www.acrpc.org/
1 Effectiveness of Radar Speed Feedback Signs - Final Draft
The effectiveness of deploying radar speed feedback signs as a traffic calming strategy is up for some debate. A number of studies have indicated that these units have a varying level of success in slowing traffic (FHWA, 2009). Roads posted with slower speed limits (generally 40 mph or less), such as school zones or neighborhood collectors may yield more favorable results, where higher speed roadways may tend to demonstrate less effective reduction in traffic speeds. Furthermore, some Vermont municipalities have reported that drivers actually speed up to see how high a speed they could register. In such case, some signage may be set-up to display the text "Slow Down" when a driver exceeds a pre-determined speed limit. Nevertheless, the installation of radar feedback signs is often perceived as a positive effort to control speed by nearby residents. Further information on the effectiveness of radar speed signs may be reviewed in the paper: “Effective Deployment of Radar Speed Signs” (Veneziano, Hayden & Ye, 2010).
Impacts on Speeds
In response to requests from Addison County municipalities to research the effectiveness of radar speed feedback sign applications within a rural Vermont context, Addison County RPC (ACRPC) implemented evaluation of traffic speed captured at locations where signs had been installed. Thus far, two sites in the nearby community of Shelburne, Vermont have been successfully evaluated for observed reduction in traffic speeds utilizing Automatic Traffic Recorders (ATRs).
There are numerous models of solar and/or battery powered signs available, which utilize radar technology to display to drivers (and record) their vehicle speed. The State Agency of Transportation has adopted a policy to enable communities to install Radar Speed Feedback Signs within the rights-of-way of the State Highway System (VTrans, 2009). Within rural Vermont there are local examples of municipalities which use this equipment as an intended low-cost strategy (when compared to increased speed enforcement) to lower traffic speeds. Examples of small portable sign mounted units have been utilized by the Town of Middlebury (which are planned for future evaluation). There are permanent installations of larger pole-mounted, solar-powered units in Hinesburg, Vermont on Silver Street, and in Shelburne, Vermont on Webster Road and Harbor Road (near the Shelburne Community School). This paper attempts to evaluate the installation of two signs at the latter location using traffic speed data collected before and after the signs were installed.
A Time-Comparison Study on Harbor Road in Shelburne, Vermont
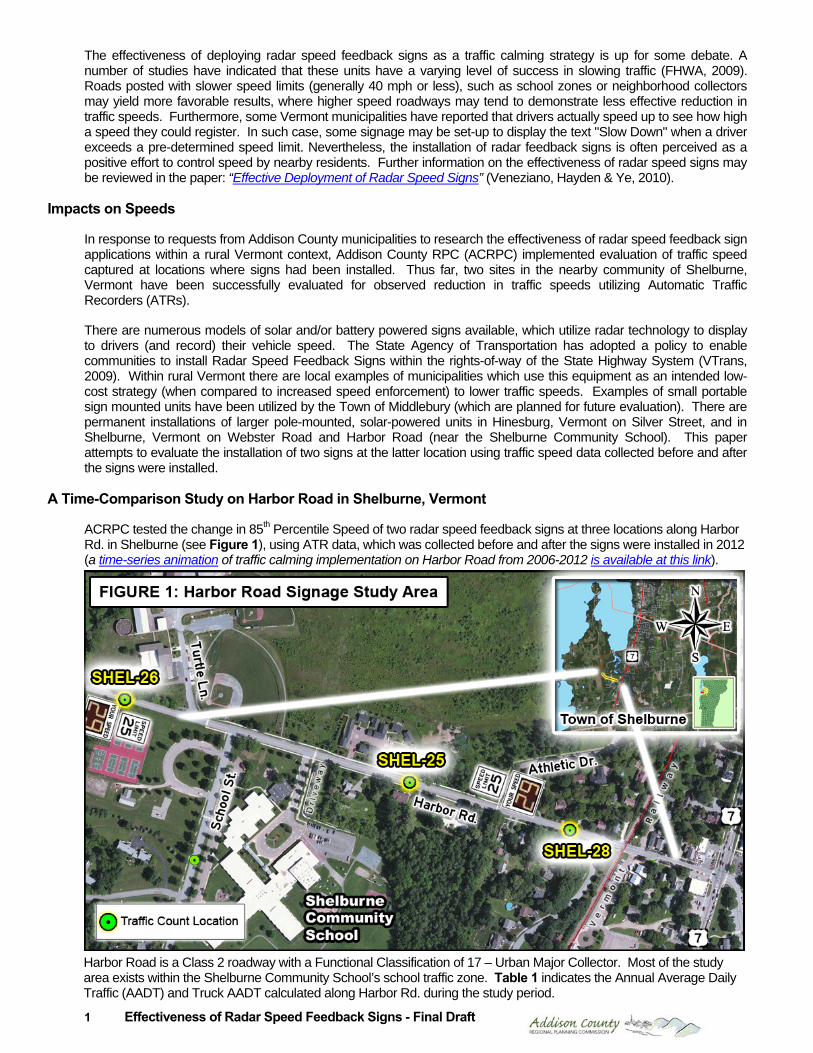
ACRPC tested the change in 85th Percentile Speed of two radar speed feedback signs at three locations along Harbor Rd. in Shelburne (see Figure 1), using ATR data, which was collected before and after the signs were installed in 2012 (a time-series animation of traffic calming implementation on Harbor Road from 2006-2012 is available at this link).
Harbor Road is a Class 2 roadway with a Functional Classification of 17 – Urban Major Collector. Most of the study area exists within the Shelburne Community School’s school traffic zone. Table 1 indicates the Annual Average Daily Traffic (AADT) and Truck AADT calculated along Harbor Rd. during the study period.
2 Effectiveness of Radar Speed Feedback Signs - Final Draft
TABLE 1b. SHEL-26 : 10 MPH Pace Speed Data
Posted Speed : 25 mph Eastbound Direction
Westbound Direction
Oct/Nov 2006 31-40 mph 31-40 mph Nov 2010 31-40 mph 31-40 mph
Oct 2012 24-33 mph 29-38 mph
∆ from 2010-2012 -7 mph -2 mph
TABLE 1c. SHEL-26 : Average Speed Data
Posted Speed : 25 mph Eastbound Direction
Westbound Direction
Oct/Nov 2006 35 mph 37 mph Nov 2010 33 mph 34 mph
Oct 2012 28 mph 33 mph
∆ from 2006-2012 -7 mph -4 mph
Test Site 1 (SHEL-26) Harbor Road: Western Location (Eastbound speed limit changes from 35 to 25 mph)
ATRs were set up in 2006, 2010 and 2012 at the signpost west of the Turtle Lane intersection on Harbor Road (see Figure 1). This location is also where a new radar speed feedback sign was installed to replace the 25 mph posted speed limit sign in 2012. This is the exact position where each ATR count occurred in for all three time periods. Table 1a indicates the changes in measured 85th percentile speed captured between 2006-2012.
The reduction of 85th percentile speed between 2006 and 2010 may have resulted from the installation of a fluorescent pedestrian warning sign just to the east of the SHEL-26 count location in 2009. Nevertheless, there was an additional 3-6 mph reduction between 2010 and 2012. The significant 6 mph reduction in the eastbound direction during this period is likely indicative of an often observed effect of a radar feedback sign installed within a transition zone
between a rural high-speed location, and a lower speed suburban school zone (Sandberg, Schoenecker, Sebastian & Soler, 2006). This reduction is also reflected in the 10 mph Pace Speed (which averages a little over 60% of the total traffic counted at this location) and the Average Speed (See Table 1b and 1c).
TABLE 1a. SHEL-26 : 85th Percentile Speed Data
Posted Speed : 25 mph Eastbound Direction
Westbound Direction
Oct/Nov 2006 41 mph 43 mph Nov 2010 39 mph 40 mph Oct 2012 33 mph 37 mph
∆ from 2010-2012 -8 mph -6 mph
Table 1. Annual Average Daily Traffic (AADT) and (Truck Traffic) for Harbor Rd. Year of Count SHEL-26 SHEL-25 SHEL-28 2012 2100 (70) 3500 (130) 3700 (120) 2010 1800 (150) 3600 (130) 4500 (170)
2006 1700 (130) 3600 (160) n/a
3 Effectiveness of Radar Speed Feedback Signs - Final Draft
TABLE 2a. SHEL-25 : 85th Percentile Speed Data
Posted Speed : 25 mph Eastbound Direction
Westbound Direction
Oct/Nov 2006 35 mph 38 mph Nov 2010 35 mph 37 mph
Sep 2012 32 mph 33 mph
∆ from 2006-2012 -3 mph -5 mph
TABLE 2b. SHEL-25 : 10 MPH Pace Speed Data
Posted Speed : 25 mph Eastbound Direction
Westbound Direction
Oct/Nov 2006 26-35 mph 26-35 mph Nov 2010 26-35 mph 26-35 mph
Sep 2012 24-33 mph 25-34 mph
∆ from 2006-2012 -2 mph -1 mph
TABLE 2c. SHEL-25 : Average Speed Data
Posted Speed : 25 mph Eastbound Direction
Westbound Direction
Oct/Nov 2006 29 mph 32 mph Nov 2010 29 mph 31 mph
Sep 2012 28 mph 28 mph
∆ from 2006-2012 -1 mph -4 mph
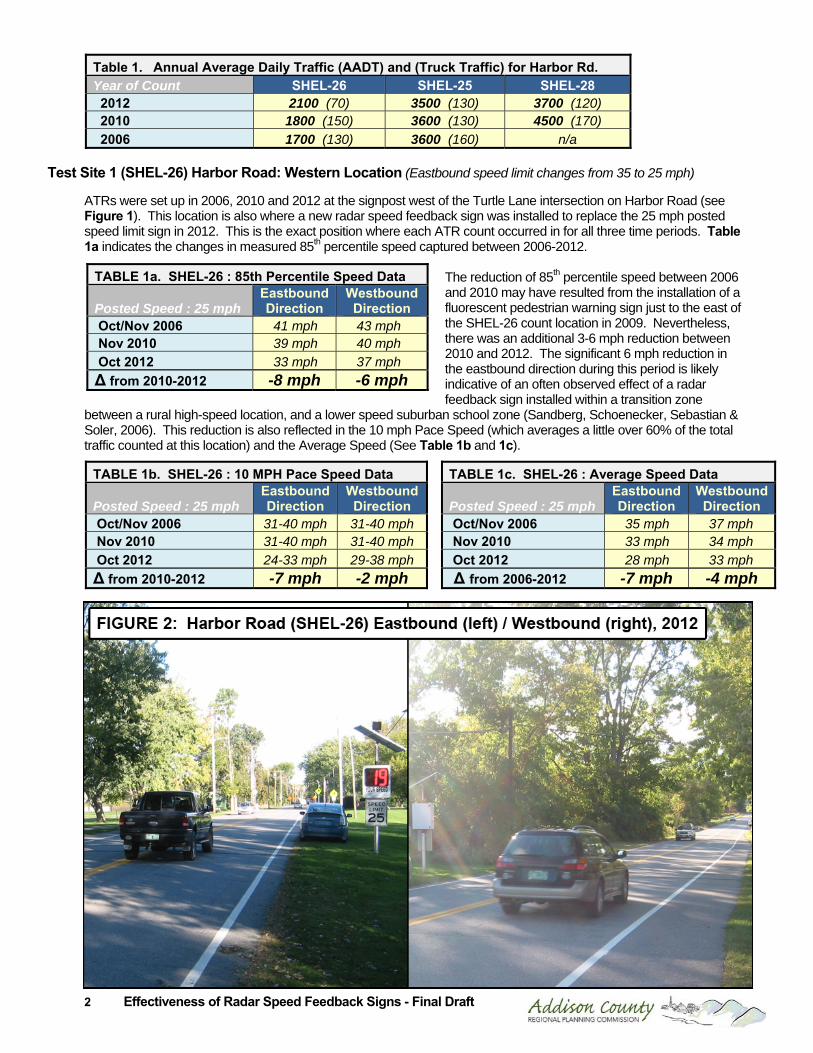
Figure 2 illustrates the transition zone along Harbor Rd. where eastbound traffic (left) transitions from a 35 mph posted speed limit to 25 mph with a clear view of the sign’s readout. The westbound traffic (right) does not face the readout.
Test Site 2 (SHEL-25) Harbor Road: About 430 ft. East of School Driveway (Posted speed limit: 25 mph)
ATRs were set up in 2006, 2010 & 2012 at GMPC Pole #12 between Athletic Drive and the Shelburne Community School on Harbor Road (see Figure 1). This is the exact position each ATR was installed during all three data collection periods. Table 2a shows the primary speed reduction occurred between the 2010 and 2012 period.
Unexpectedly, the results (illustrated in greater detail in the time-series animation) appear to indicate that the installation of pedestrian crossing signs, painted crosswalks, and accompanying curb extensions (i.e. bulb-outs) in 2009 had little to no effect in reducing the 85th percentile speed at this location. However, after the 2012 installation of a radar feedback sign (about 300 ft. to the east of the ATR setup), this location had an observed 3-5 mph reduction in 85th percentile speed. This reduction is minimally reflected in the 10
mph Pace Speed, which averaged just under 70% of the total traffic counted at this location for all of the 2006-2012 counts (See Table 2b). The Average Speed had reduction particularly in the westbound direction (See Table 2c), heading towards the School driveway from Athletic Drive. This direction of travel had the view of the sign’s readout.
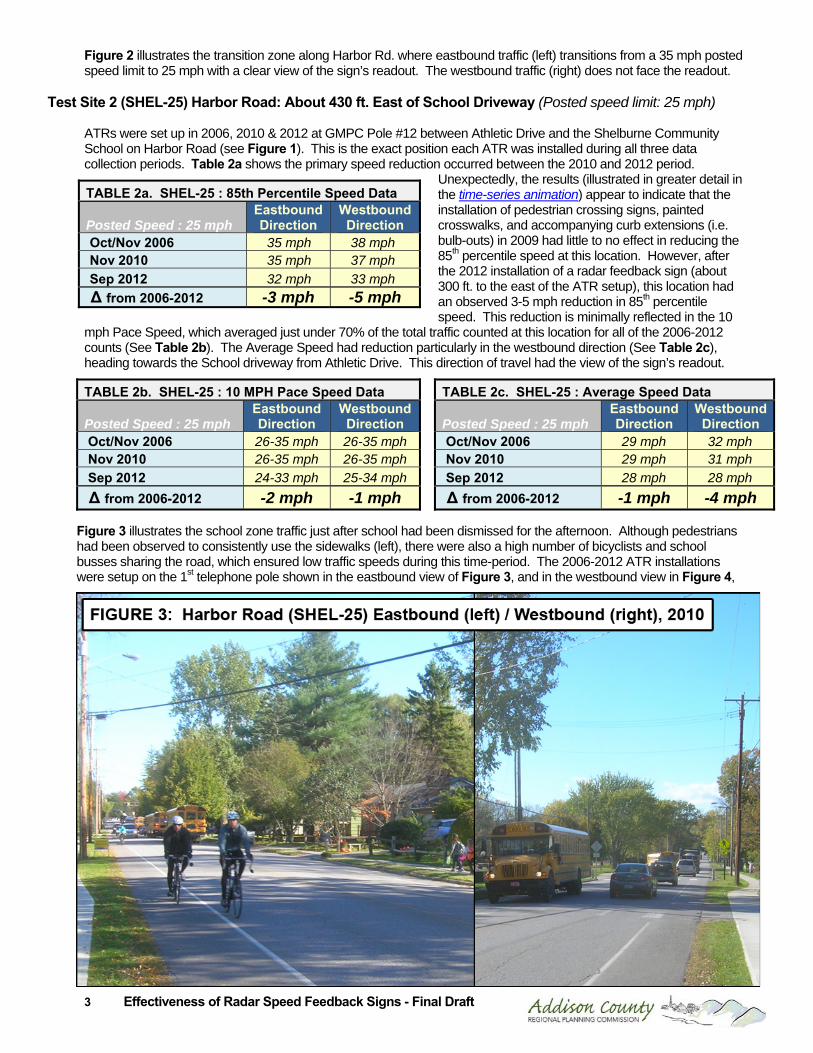
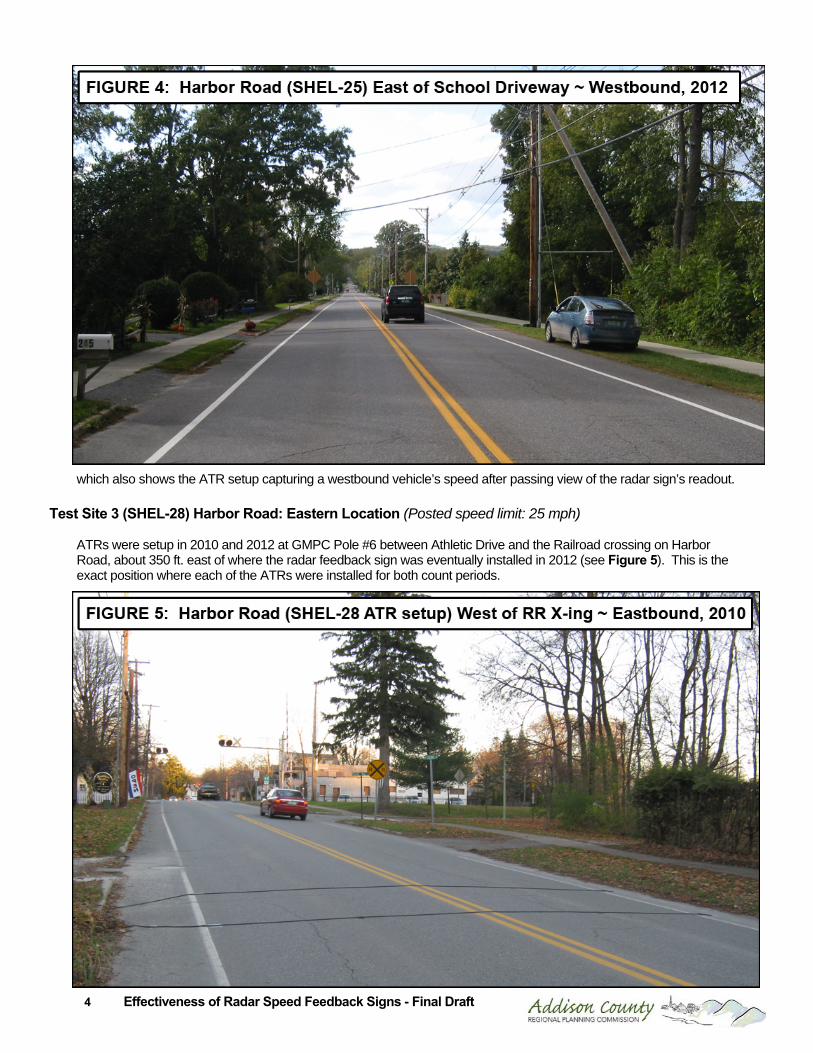
Figure 3 illustrates the school zone traffic just after school had been dismissed for the afternoon. Although pedestrians had been observed to consistently use the sidewalks (left), there were also a high number of bicyclists and school busses sharing the road, which ensured low traffic speeds during this time-period. The 2006-2012 ATR installations were setup on the 1st telephone pole shown in the eastbound view of Figure 3, and in the westbound view in Figure 4,
4 Effectiveness of Radar Speed Feedback Signs - Final Draft
which also shows the ATR setup capturing a westbound vehicle’s speed after passing view of the radar sign’s readout. Test Site 3 (SHEL-28) Harbor Road: Eastern Location (Posted speed limit: 25 mph)
ATRs were setup in 2010 and 2012 at GMPC Pole #6 between Athletic Drive and the Railroad crossing on Harbor Road, about 350 ft. east of where the radar feedback sign was eventually installed in 2012 (see Figure 5). This is the exact position where each of the ATRs were installed for both count periods.
5 Effectiveness of Radar Speed Feedback Signs - Final Draft
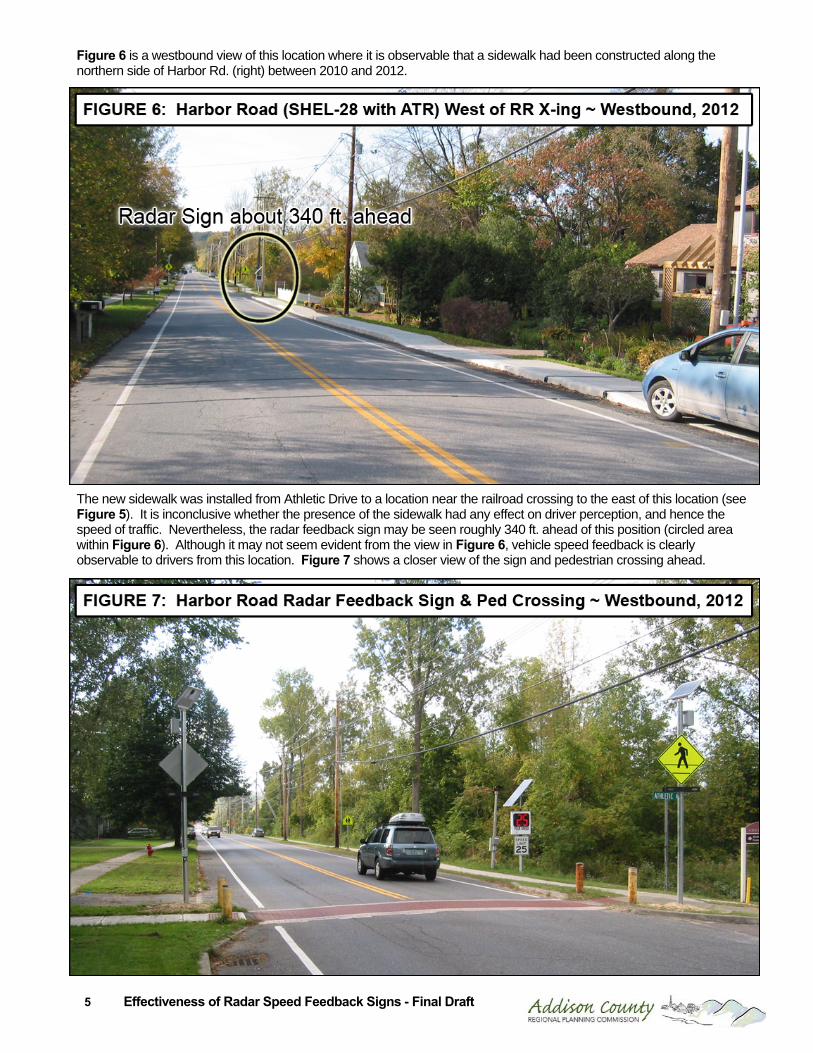
Figure 6 is a westbound view of this location where it is observable that a sidewalk had been constructed along the northern side of Harbor Rd. (right) between 2010 and 2012.
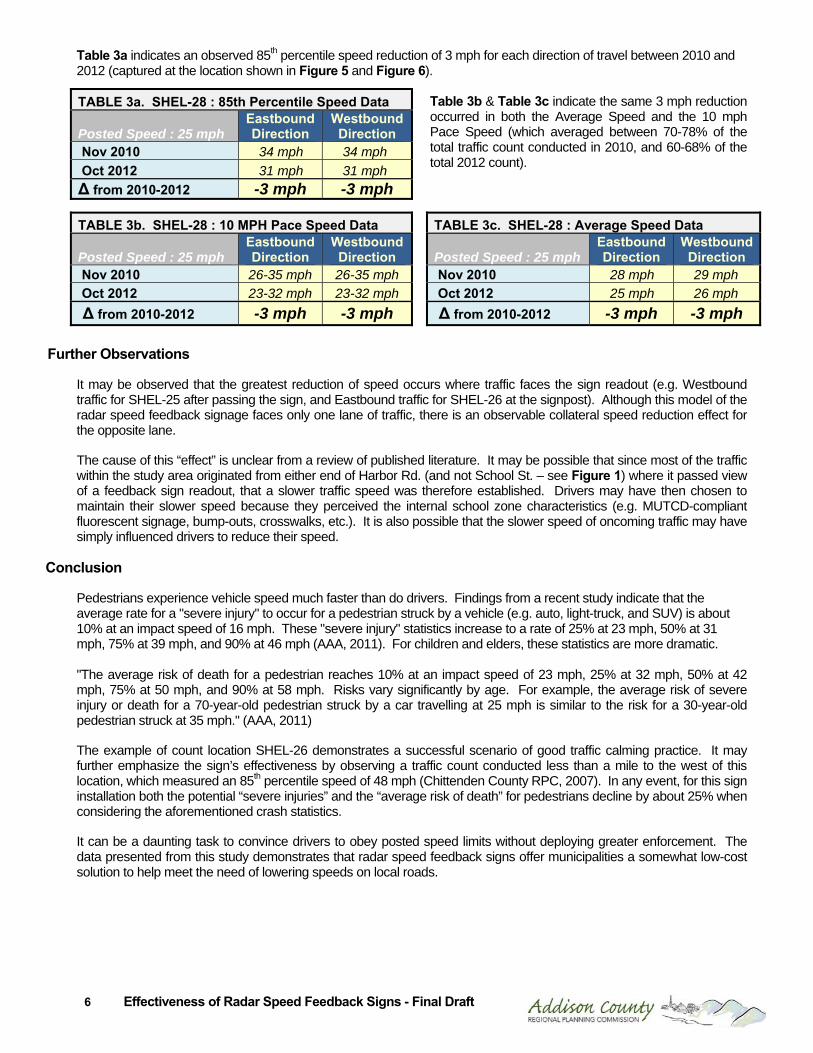
The new sidewalk was installed from Athletic Drive to a location near the railroad crossing to the east of this location (see Figure 5). It is inconclusive whether the presence of the sidewalk had any effect on driver perception, and hence the speed of traffic. Nevertheless, the radar feedback sign may be seen roughly 340 ft. ahead of this position (circled area within Figure 6). Although it may not seem evident from the view in Figure 6, vehicle speed feedback is clearly observable to drivers from this location. Figure 7 shows a closer view of the sign and pedestrian crossing ahead.
6 Effectiveness of Radar Speed Feedback Signs - Final Draft
TABLE 3a. SHEL-28 : 85th Percentile Speed Data
Posted Speed : 25 mph Eastbound Direction
Westbound Direction
Nov 2010 34 mph 34 mph
Oct 2012 31 mph 31 mph
∆ from 2010-2012 -3 mph -3 mph
TABLE 3b. SHEL-28 : 10 MPH Pace Speed Data
Posted Speed : 25 mph Eastbound Direction
Westbound Direction
Nov 2010 26-35 mph 26-35 mph
Oct 2012 23-32 mph 23-32 mph
∆ from 2010-2012 -3 mph -3 mph
TABLE 3c. SHEL-28 : Average Speed Data
Posted Speed : 25 mph Eastbound Direction
Westbound Direction
Nov 2010 28 mph 29 mph
Oct 2012 25 mph 26 mph
∆ from 2010-2012 -3 mph -3 mph
Table 3a indicates an observed 85th percentile speed reduction of 3 mph for each direction of travel between 2010 and 2012 (captured at the location shown in Figure 5 and Figure 6).
Table 3b & Table 3c indicate the same 3 mph reduction occurred in both the Average Speed and the 10 mph Pace Speed (which averaged between 70-78% of the total traffic count conducted in 2010, and 60-68% of the total 2012 count).
Further Observations
It may be observed that the greatest reduction of speed occurs where traffic faces the sign readout (e.g. Westbound traffic for SHEL-25 after passing the sign, and Eastbound traffic for SHEL-26 at the signpost). Although this model of the radar speed feedback signage faces only one lane of traffic, there is an observable collateral speed reduction effect for the opposite lane.
The cause of this “effect” is unclear from a review of published literature. It may be possible that since most of the traffic within the study area originated from either end of Harbor Rd. (and not School St. – see Figure 1) where it passed view of a feedback sign readout, that a slower traffic speed was therefore established. Drivers may have then chosen to maintain their slower speed because they perceived the internal school zone characteristics (e.g. MUTCD-compliant fluorescent signage, bump-outs, crosswalks, etc.). It is also possible that the slower speed of oncoming traffic may have simply influenced drivers to reduce their speed.
Conclusion
Pedestrians experience vehicle speed much faster than do drivers. Findings from a recent study indicate that the average rate for a "severe injury" to occur for a pedestrian struck by a vehicle (e.g. auto, light-truck, and SUV) is about 10% at an impact speed of 16 mph. These "severe injury" statistics increase to a rate of 25% at 23 mph, 50% at 31 mph, 75% at 39 mph, and 90% at 46 mph (AAA, 2011). For children and elders, these statistics are more dramatic.
"The average risk of death for a pedestrian reaches 10% at an impact speed of 23 mph, 25% at 32 mph, 50% at 42 mph, 75% at 50 mph, and 90% at 58 mph. Risks vary significantly by age. For example, the average risk of severe injury or death for a 70-year-old pedestrian struck by a car travelling at 25 mph is similar to the risk for a 30-year-old pedestrian struck at 35 mph." (AAA, 2011)
The example of count location SHEL-26 demonstrates a successful scenario of good traffic calming practice. It may further emphasize the sign’s effectiveness by observing a traffic count conducted less than a mile to the west of this location, which measured an 85th percentile speed of 48 mph (Chittenden County RPC, 2007). In any event, for this sign installation both the potential “severe injuries” and the “average risk of death” for pedestrians decline by about 25% when considering the aforementioned crash statistics.
It can be a daunting task to convince drivers to obey posted speed limits without deploying greater enforcement. The data presented from this study demonstrates that radar speed feedback signs offer municipalities a somewhat low-cost solution to help meet the need of lowering speeds on local roads.
7 Effectiveness of Radar Speed Feedback Signs - Final Draft
References
AAA - Foundation for Traffic Safety, “Impact Speed and a Pedestrian’s Risk of Severe Injury or Death”, by Tefft, Brian C., Senior Research Associate, 2011 Addison County RPC, Traffic Calming Implementation on Harbor Road from 2006-2012: Time-Series Animation: http://www.acrpc.info/transportation/traffic_calming/, 2012 Addison County RPC, Traffic Counts (Shelburne Counts): http://www.acrpc.info/transportation/data/, 2012
Chittenden County RPC, Traffic Count (SHEL-23): http://www.ccrpcvt.org/data/traffic.php, 2007 Federal Highway Administration (FHWA), “Engineering Countermeasures for Reducing Speeds: A Desktop Reference of Potential Effectiveness”, 2009
Sandberg, Schoenecker, Sebastian & Soler, “Long-Term Effectiveness of Dynamic Speed Monitoring Displays (DSMD) for Speed Management at Speed Limit Transitions”, Institute of Transportation Engineers, 2006 Annual Meeting & Exhibit Compendium of Technical Papers, 2006 Ullman & Rose, “Evaluation of Dynamic Speed Display Signs”, Texas Transportation Institute, Texas A&M University, Transportation Research Record: Journal of the Transportation Research Board, Vol. 1918, 2005 Vanasse Hangen Brustlin, Inc. (VHB), “Technical Evaluation: Harbor Road: Shelburne, Vermont”, Prepared for the Chittenden County Metropolitan Planning Organization in cooperation with the Vermont Agency of Transportation for the Town of Shelburne, 2011 Veneziano, Hayden & Ye, “Effective Deployment of Radar Speed Signs: A Project Conducted Under California and Oregon Advanced Transportation System (COATS) Phase IV”, Western Transportation Institute, Montana State University, 2010 Vermont Agency of Transportation (VTrans), “Guidelines for the Use of Radar Speed Feedback Signs on the State Highway System”, VTrans RSFS Guidelines with Policy #3014, 2009
Glossary
10 mph Pace Speed (or “Pace Speed”): The 10 mph range in which the highest percentage of vehicles are traveling,
85th Percentile Speed: The maximum speed at which 85% of all vehicles are travelling.
Annual Average Daily Traffic: A statistical indicator for roadway counts (i.e. traffic volume), known as the ‘Annual Average Daily Traffic’, or AADT, has been developed to represent the average amount of vehicular traffic in both directions of travel, passing on a given point of road, over a 24-hour period, on a typical day (i.e. seasonally adjusted) of a specified year. Average Speed: The statistic used to describe the typical (average or mean) value for a group of values that is calculated by dividing the sum of the observed values by the number of observed values.
![of Vermont Agency ojTransportation AOT -Traffic …54.172.27.91/transportation/speed/Request_ORWL_VT22A_2012.pdf · [phone1 Ifax] [ttd] RE: Speed Limit Request, VT 22A, Orwell](https://img.pdfslide.us/doc/110x75/5adf23107f8b9afd1a8c4bd7/of-vermont-agency-ojtransportation-aot-traffic-541722791transportationspeedrequestorwlvt22a2012pdfphone1.jpg)