Embed Size (px)
Citation preview
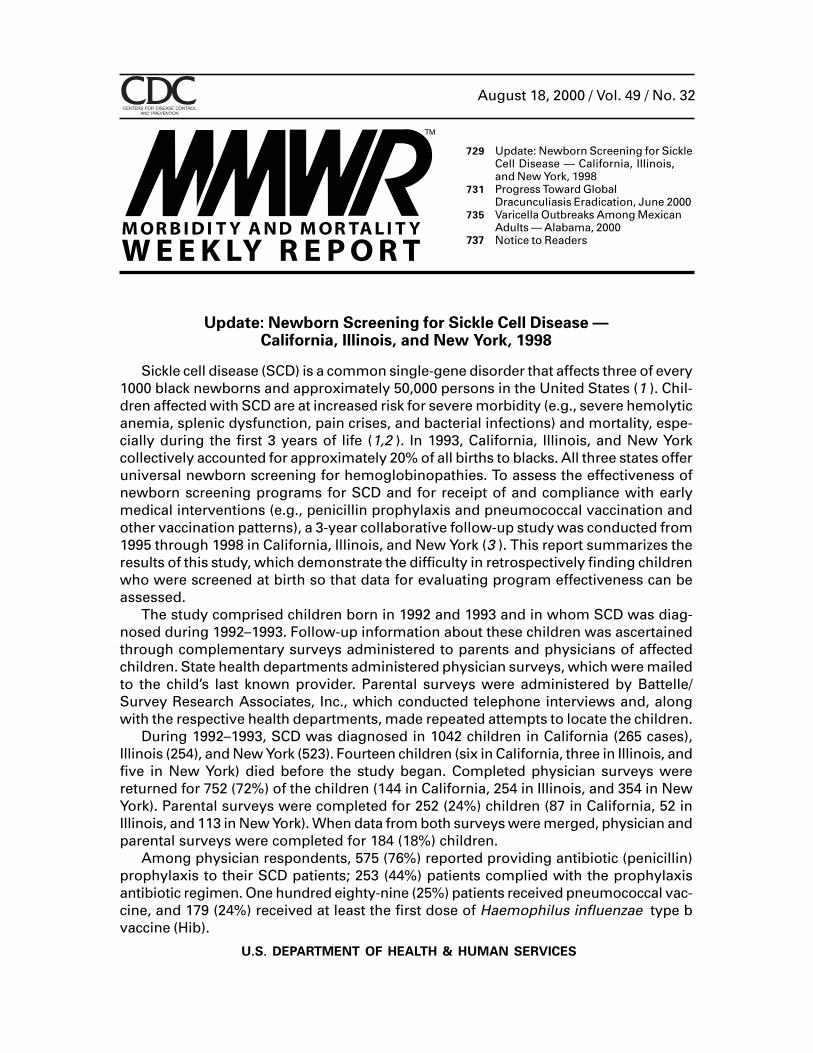
August 18, 2000 / Vol. 49 / No. 32
U.S. DEPARTMENT OF HEALTH & HUMAN SERVICES
Update: Newborn Screening for Sickle Cell Disease —California, Illinois, and New York, 1998
Sickle cell disease (SCD) is a common single-gene disorder that affects three of every1000 black newborns and approximately 50,000 persons in the United States (1 ). Chil-dren affected with SCD are at increased risk for severe morbidity (e.g., severe hemolyticanemia, splenic dysfunction, pain crises, and bacterial infections) and mortality, espe-cially during the first 3 years of life (1,2 ). In 1993, California, Illinois, and New Yorkcollectively accounted for approximately 20% of all births to blacks. All three states offeruniversal newborn screening for hemoglobinopathies. To assess the effectiveness ofnewborn screening programs for SCD and for receipt of and compliance with earlymedical interventions (e.g., penicillin prophylaxis and pneumococcal vaccination andother vaccination patterns), a 3-year collaborative follow-up study was conducted from1995 through 1998 in California, Illinois, and New York (3 ). This report summarizes theresults of this study, which demonstrate the difficulty in retrospectively finding childrenwho were screened at birth so that data for evaluating program effectiveness can beassessed.
The study comprised children born in 1992 and 1993 and in whom SCD was diag-nosed during 1992–1993. Follow-up information about these children was ascertainedthrough complementary surveys administered to parents and physicians of affectedchildren. State health departments administered physician surveys, which were mailedto the child’s last known provider. Parental surveys were administered by Battelle/Survey Research Associates, Inc., which conducted telephone interviews and, alongwith the respective health departments, made repeated attempts to locate the children.
During 1992–1993, SCD was diagnosed in 1042 children in California (265 cases),Illinois (254), and New York (523). Fourteen children (six in California, three in Illinois, andfive in New York) died before the study began. Completed physician surveys werereturned for 752 (72%) of the children (144 in California, 254 in Illinois, and 354 in NewYork). Parental surveys were completed for 252 (24%) children (87 in California, 52 inIllinois, and 113 in New York). When data from both surveys were merged, physician andparental surveys were completed for 184 (18%) children.
Among physician respondents, 575 (76%) reported providing antibiotic (penicillin)prophylaxis to their SCD patients; 253 (44%) patients complied with the prophylaxisantibiotic regimen. One hundred eighty-nine (25%) patients received pneumococcal vac-cine, and 179 (24%) received at least the first dose of Haemophilus influenzae type bvaccine (Hib).
729 Update: Newborn Screening for SickleCell Disease — California, Illinois,and New York, 1998
731 Progress Toward GlobalDracunculiasis Eradication, June 2000
735 Varicella Outbreaks Among MexicanAdults — Alabama, 2000
737 Notice to Readers
730 MMWR August 18, 2000
Sickle Cell Disease — Continued
Among parental respondents, 111 (44%) were informed of SCD services availablefor their children, and 68 (27%) had used these services. Parents reported that 234 (93%)of their children with SCD regularly received penicillin prophylaxis; 189 (75%) receivedpneumococcal vaccine, and 164 (65%) received a full series of Hib.
Merged results from physician and parental surveys provided discrepant resultsregarding provision of and compliance with standard medical interventions for childrenwith SCD. Although provision of penicillin prophylaxis was high in both surveys,physician-reported compliance for their patients’ medical intervention was low.Reported by: K Pass, PhD, K Harris, MBA, Wadsworth Center, New York State Dept of Health.F Lorey, PhD, R Choi, Genetic Disease Br, California Dept of Health Svcs. S Kling, MA, Div ofHealth Assessment and Screening, Illinois Dept of Public Health. Birth Defects and GeneticDiseases Br, Div of Birth Defects and Developmental Disabilities, and Office of Genetics andDisease Prevention, National Center for Environmental Health; and an EIS Officer, CDC.
Editorial Note: Evaluations of pediatric outcomes after newborn screening are importantto ensure provision and receipt of necessary services and to target high-risk groups forpublic health interventions. Data to assess program goals are incomplete for mostdisorders identified by newborn screening. The findings in this report demonstrate thedifficulties in finding and contacting families retrospectively and the need for ongoing,prospective collection of follow-up information to identify gaps in delivering propermedical services and interventions.
In 1972, Congress passed the National Sickle Cell Anemia Control Act, and the firststate newborn screening program for SCD was implemented in 1975*. However, statesdid not widely adopt newborn screening for SCD until 1986, when results of a randomizedtrial demonstrated that oral penicillin significantly reduced SCD-related morbidity andmortality in children (4 ). Results of this trial and statements from key organizations (5–7 )resulted in adoption of newborn screening. In 2000, most states screen newborns forSCD (8 ).
To reduce SCD-related morbidity and mortality, neonatal screening programs mustbe conducted as part of a comprehensive medical-care program (2,5–7,9 ). Newbornscreening programs identify children with SCD to allow early medical interventions,thereby preventing development of SCD-related complications and reducing morbidityand mortality. Standard preventive interventions for SCD include routine infant vaccina-tion (e.g., pneumococcal vaccination) and prophylactic administration of penicillin(2,5–7,9 ).
The findings in this report are subject to at least three limitations. First, because of thepoor contact rate, especially for parental surveys, results of this analysis are limited ingeneralizability and reflect the difficulty of ascertaining retrospective follow-up. Second,discrepant compliance rates should be interpreted with caution. The high compliancerate reported by parents was derived from a selected population (e.g., parents who werecontacted successfully). However, the low compliance rate recorded by providers needsfurther investigation to ensure that they followed the children past age 2 years when theinterventions actually were administered. Finally, ascertaining information retrospec-tively introduces possible recall bias.
A model program that allows program evaluation is the Cystic Fibrosis Foundation(CFF) Patient Registry, in which children diagnosed with cystic fibrosis are registered athealth-care centers nationwide. The CFF Patient Registry prospectively collects annual
*National Sickle Cell Anemia Control Act of 1972 (Public law no. 92-294).
Vol. 49 / No. 32 MMWR 731
Sickle Cell Disease — Continued
epidemiologic, clinical, and laboratory data that can be used readily to assess the effec-tiveness of interventions and cystic fibrosis programs. SCD and other disorders identi-fied by newborn screening would benefit from prospective evaluations of data related tomorbidity, mortality, and receipt of preventive services. As the role of public healthgenetics programs expands beyond newborn screening, these types of long-term out-come data will be essential for developing effective programs and policies.References1. Ashley-Koch A, Yang Q, Olney RS. Sickle hemoglobin (HbS) allele and sickle cell disease: a
HuGE review. Am J Epidemiol 2000;151:839–45.2. Olney RS. Preventing morbidity and mortality from sickle cell disease: a public health
perspective. Am J Prev Med 1999;16:116–21.3. CDC. Mortality among children with sickle cell disease identified by newborn screening
during 1990–1994—California, Illinois, and New York. MMWR 1998;47:169–72.4. Gaston MH, Verter JI, Woods G, et al. Prophylaxis with oral penicillin in children with sickle
cell anemia: a randomized trial. N Engl J Med 1986;314:1593–9.5. Consensus Conference. Newborn screening for sickle cell disease and other hemoglo-
binopathies. JAMA 1987;258:1205–9.6. American Academy of Pediatrics. Newborn screening fact sheets. Pediatrics 1996;98:473–
501.7. Sickle Cell Disease Guideline Panel. Sickle cell disease: screening, diagnosis, management,
and counseling in newborns and infants. Rockville, Maryland: US Department of Healthand Human Services, Public Health Service, Agency for Health Care Policy and Research,1993. (clinical practice guideline no. 6).
8. Newborn Screening Task Force. Serving the family from birth to the medical home. Pediat-rics 2000;106:389–427.
9. Reid CD, Charache S, Lubin B, eds. Management and therapy of sickle cell disease. 3rd ed.Bethesda, Maryland: US Department of Health and Human Services, National Institutes ofHealth, 1995 (publication no. 96-2117).
Progress Toward Global Dracunculiasis Eradication, June 2000
In 1986, an estimated 3 million persons were infected with dracunculiasis (Guineaworm disease) and another 120 million were at risk for infection (1 ). That year and in1991, the World Health Assembly called for the eradication of dracunculiasis (2,3 ), andas a result of the implementation of the Dracunculiasis Eradication Program (DEP)*, theannual incidence was reduced by approximately 95% by 1995 (4 ). This report updatesthe status of the eradication program as of June 2000, which indicates that dracunculia-sis has been eliminated from seven of 20 countries where it wasendemic in 1995; however, in parts of Africa, particularly Sudan, dracunculiasis remainsa serious public health problem.
For surveillance purposes, village-based health workers search for infected personsin each village with endemic disease and complete a register that provides the basis formonthly zonal, district, and national surveillance reports (5 ). During 1999, dracunculiasiswas endemic in 13 countries in Africa†. These countries reported 96,293 cases in 10,914
*Program partners include The Carter Center, CDC, United Nations Children’s Fund (UNICEF),the World Health Organization (WHO), ministries of health in countries where dracunculiasisis endemic, private industry, and many other donors, including the Bill and Melinda GatesFoundation.
† Benin, Burkina Faso, Central African Republic, Cote d’Ivoire, Ethiopia, Ghana, Niger, Nigeria,Mali, Mauritania, Sudan, Togo, and Uganda.
732 MMWR August 18, 2000
Dracunculiasis Eradication — Continued
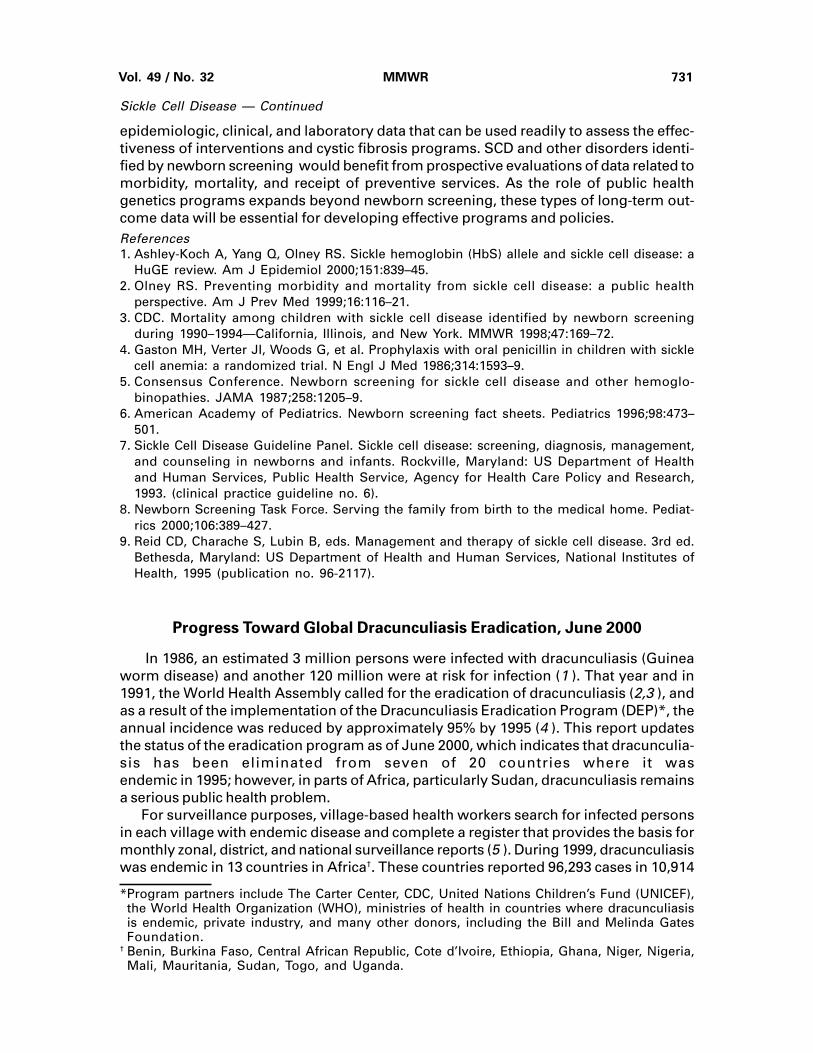
villages. Of the total number of cases, Sudan reported 66,097 (69%) cases in 7271villages; 2606 of the known villages with endemic disease in Sudan were not accessibleto program surveillance. Outside Sudan, 93% of 3068 villages reported monthly; in Sudan,44% of 4892 accessible villages reported monthly. Outside Sudan, 20% of all villageswith endemic disease reported 1 case each. Seven of the 13 countries with endemicdisease reported <500 cases each in 1999 (Figure 1).
During January–June 2000, the number of cases reported by all countries exceptSudan was 12,097, 18% less than the 14,828 cases reported during the same period in1999. The rate of reduction in all countries outside of Sudan was 35% except in Ghana,which reported a slight increase in cases during the first half of 2000. Niger reported 59%fewer cases during January–June 2000. Benin, Cote d’Ivoire, Ethiopia, Mali, Mauritania,and Uganda have reduced the number of cases by an average of 55% during January–June 2000. Nigeria reported 35% fewer cases during January–June 2000 than duringthe same period in 1999.
All programs attempt to control the spread of disease using case containment (i.e.,patients were not allowed to contaminate water and transmit infection) aimed at detect-ing cases within 24 hours of emergence of the worm and instituting prevention measuresimmediately. Approximately 62% of the case-patients reported outside of Sudan during1999 were contained; 68% were contained during January–June 2000. The long-stand-ing civil war in Sudan is the primary reason for the high rate of dracunculiasis in thesouthern part of that country; however, the 10 northern states of Sudan have reported66% fewer cases during the first 6 months of 2000 compared with the same period lastyear (21 versus 61 cases); 16 (76%) of the 21 cases were contained.Reported by: Global 2000, The Carter Center, Atlanta, Georgia. World Health OrganizationCollaborating Center for Research, Training, and Eradication of Dracunculiasis. Div of ParasiticDiseases, National Center for Infectious Diseases, CDC.
FIGURE 1. Number of dracunculiasis cases, by country, 1999
*Year last indigenous case reported.† Certification granted after �3 years without transmission.
66,09713,237
9,011
2,182
1,912
1,585
473
467
403
316
255
249
24
0
0
0
0
0
0
0
Sudan
Nigeria
Ghana
Burkino Faso
Niger
Togo
Benin
Cote d’Ivoire
Mali
Uganda
Mauritania
Ethiopia
Central African Republic Chad
Cameroon
Yemen
Senegal
India
Kenya
Pakistan
Cases
0 10,000 20,000 30,000 40,000 50,000 60,000 70,000
(1994)*(1993)* Certified by WHO in 1997
(1996)* Certified by World Health Organization (WHO) in 2000
(1997)*
(1997)*
(1997)*
(1998)*
†
Vol. 49 / No. 32 MMWR 733
Dracunculiasis Eradication — Continued
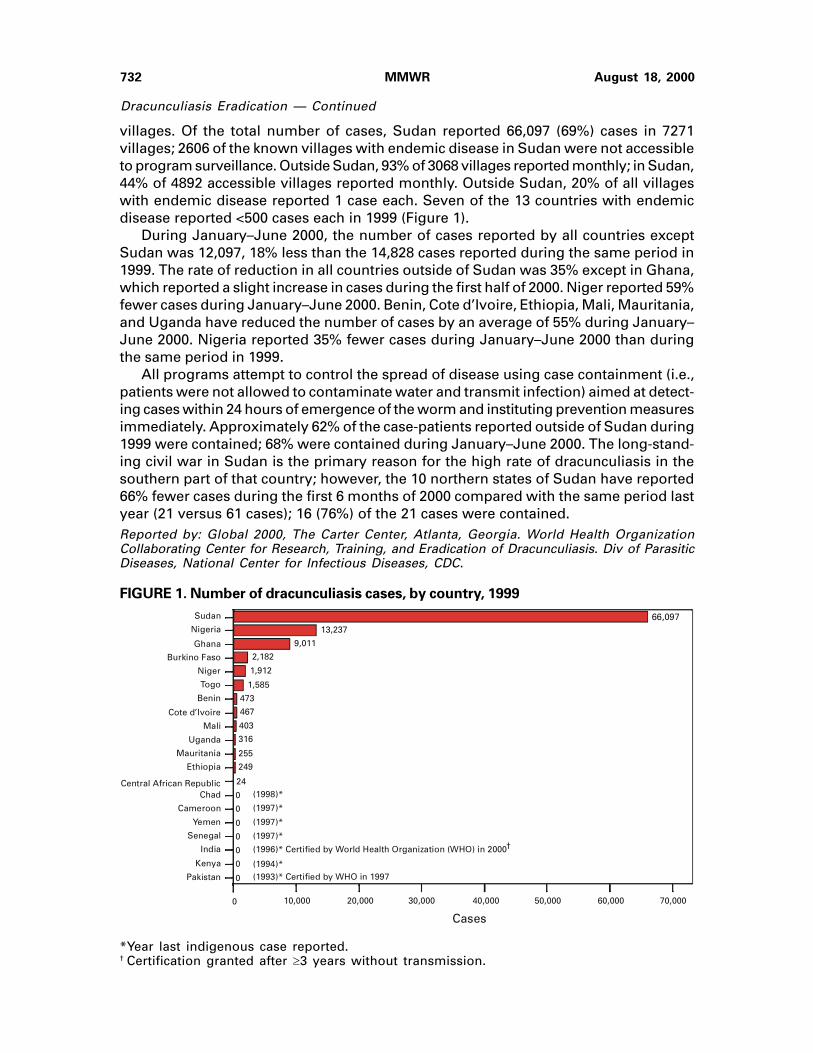
Editorial Note: Dracunculiasis is a parasitic infection acquired by drinking water fromponds contaminated by copepods (water fleas) that contain immature forms of theparasite. A year after entering the infected person, the 40-inch (1 meter) worm(s) emerge,usually on the lower limbs through skin wounds that frequently become contaminatedsecondarily. Reinfection can occur if the person again drinks contaminated water. Noeffective treatment exists; however, two countries in which dracunculiasis was endemicat the beginning of the program (Pakistan and India) have been certified by the WorldHealth Organization (WHO) to have interrupted transmission. WHO also has certifiedthe absence of transmission from almost all countries outside Africa (Figure 2) (6 ). Allcountries with endemic disease are required to submit a report to the InternationalCommission for the Certification of Dracunculiasis Eradication, documenting the absenceof indigenous cases of the disease for at least 3 consecutive years to be recommendedfor certification.
Most eradication programs have begun listing villages with endemic disease indescending order of number of cases reported to help monitor the status of interven-tions. Nylon filters have been distributed to all households in 47% of villages with knownendemic disease, including 67% outside Sudan. The larvicide Abate®§ (temephos) (Ameri-can Home Products, Princeton, New Jersey) is being used in approximately 35% ofvillages with endemic disease outside Sudan, and 43% of villages with endemic
§ Use of trade names and commercial sources is for identification only and does not constituteendorsement by CDC or the U.S. Department of Health and Human Services.
FIGURE 2. Countries and territories certified free of dracunculiasis transmission andcountries not certified free by the World Health Organization, May 2000
Countries not Certified
Countries and Territories Certified Free of Transmission
734 MMWR August 18, 2000
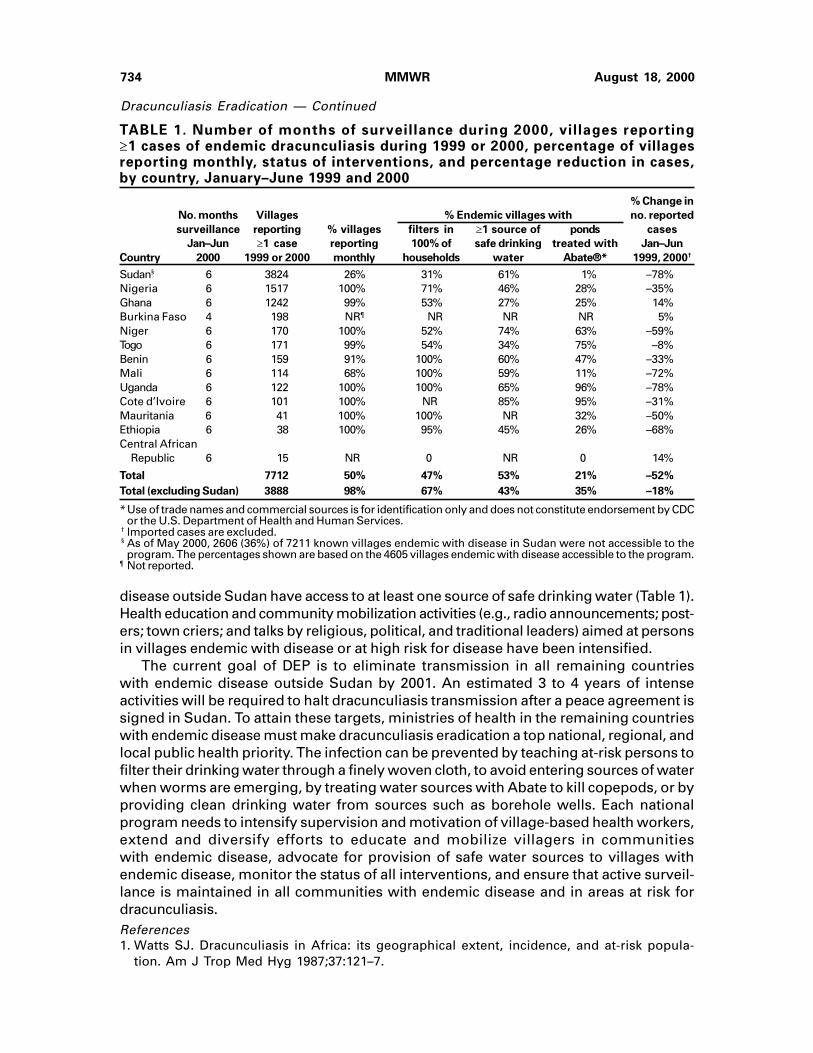
Dracunculiasis Eradication — Continued
TABLE 1. Number of months of surveillance during 2000, villages reporting�1 cases of endemic dracunculiasis during 1999 or 2000, percentage of villagesreporting monthly, status of interventions, and percentage reduction in cases,by country, January–June 1999 and 2000
% Change in
No. months Villages % Endemic villages with no. reported
surveillance reporting % villages filters in �1 source of ponds cases
Jan–Jun �1 case reporting 100% of safe drinking treated with Jan–Jun
Country 2000 1999 or 2000 monthly households water Abate®* 1999, 2000†
Sudan§ 6 3824 26% 31% 61% 1% –78%Nigeria 6 1517 100% 71% 46% 28% –35%Ghana 6 1242 99% 53% 27% 25% 14%Burkina Faso 4 198 NR¶ NR NR NR 5%Niger 6 170 100% 52% 74% 63% –59%Togo 6 171 99% 54% 34% 75% –8%Benin 6 159 91% 100% 60% 47% –33%Mali 6 114 68% 100% 59% 11% –72%Uganda 6 122 100% 100% 65% 96% –78%Cote d’Ivoire 6 101 100% NR 85% 95% –31%Mauritania 6 41 100% 100% NR 32% –50%Ethiopia 6 38 100% 95% 45% 26% –68%Central African
Republic 6 15 NR 0 NR 0 14%
Total 7712 50% 47% 53% 21% –52%
Total (excluding Sudan) 3888 98% 67% 43% 35% –18%
*Use of trade names and commercial sources is for identification only and does not constitute endorsement by CDCor the U.S. Department of Health and Human Services.
† Imported cases are excluded.§ As of May 2000, 2606 (36%) of 7211 known villages endemic with disease in Sudan were not accessible to theprogram. The percentages shown are based on the 4605 villages endemic with disease accessible to the program.
¶ Not reported.
disease outside Sudan have access to at least one source of safe drinking water (Table 1).Health education and community mobilization activities (e.g., radio announcements; post-ers; town criers; and talks by religious, political, and traditional leaders) aimed at personsin villages endemic with disease or at high risk for disease have been intensified.
The current goal of DEP is to eliminate transmission in all remaining countrieswith endemic disease outside Sudan by 2001. An estimated 3 to 4 years of intenseactivities will be required to halt dracunculiasis transmission after a peace agreement issigned in Sudan. To attain these targets, ministries of health in the remaining countrieswith endemic disease must make dracunculiasis eradication a top national, regional, andlocal public health priority. The infection can be prevented by teaching at-risk persons tofilter their drinking water through a finely woven cloth, to avoid entering sources of waterwhen worms are emerging, by treating water sources with Abate to kill copepods, or byproviding clean drinking water from sources such as borehole wells. Each nationalprogram needs to intensify supervision and motivation of village-based health workers,extend and diversify efforts to educate and mobilize villagers in communitieswith endemic disease, advocate for provision of safe water sources to villages withendemic disease, monitor the status of all interventions, and ensure that active surveil-lance is maintained in all communities with endemic disease and in areas at risk fordracunculiasis.References1. Watts SJ. Dracunculiasis in Africa: its geographical extent, incidence, and at-risk popula-
tion. Am J Trop Med Hyg 1987;37:121–7.
Vol. 49 / No. 32 MMWR 735
Dracunculiasis Eradication — Continued
2. World Health Assembly. Elimination of dracunculiasis: resolution of the 39th World HealthAssembly. Geneva, Switzerland: World Health Organization, 1986 (resolution no. WHA39.21).
3. World Health Assembly. Eradication of dracunculiasis: resolution of the 44th World HealthAssembly. Geneva, Switzerland: World Health Organization, 1991 (resolution no. WHA44.5).
4. CDC. Progress toward global eradication of dracunculiasis. MMWR 1995;44:875,881–2.5. Hopkins DR, Ruiz-Tiben E. Strategies for eradication of dracunculiasis. Bull World Health
Organ 1991;69:533–40.6. World Health Organization. International Commission for the Certification of Dracunculia-
sis Eradication, fourth meeting: report and recommendations. Geneva, Switzerland,February 15–17, 2000. (WHO/CDS/CPE/CEE/2000.6).
Public Health Dispatch
Varicella Outbreaks Among Mexican Adults — Alabama, 2000
On May 19, 2000, a physician in southern Alabama reported seven cases of varicellato the Alabama Department of Public Health (ADPH). All the cases were in previouslyhealthy young adults living in an apartment complex in town A and working in a poultryprocessing plant in nearby town B. On May 24, ADPH invited CDC to assist in outbreakinvestigation and control. This report summarizes the investigation.
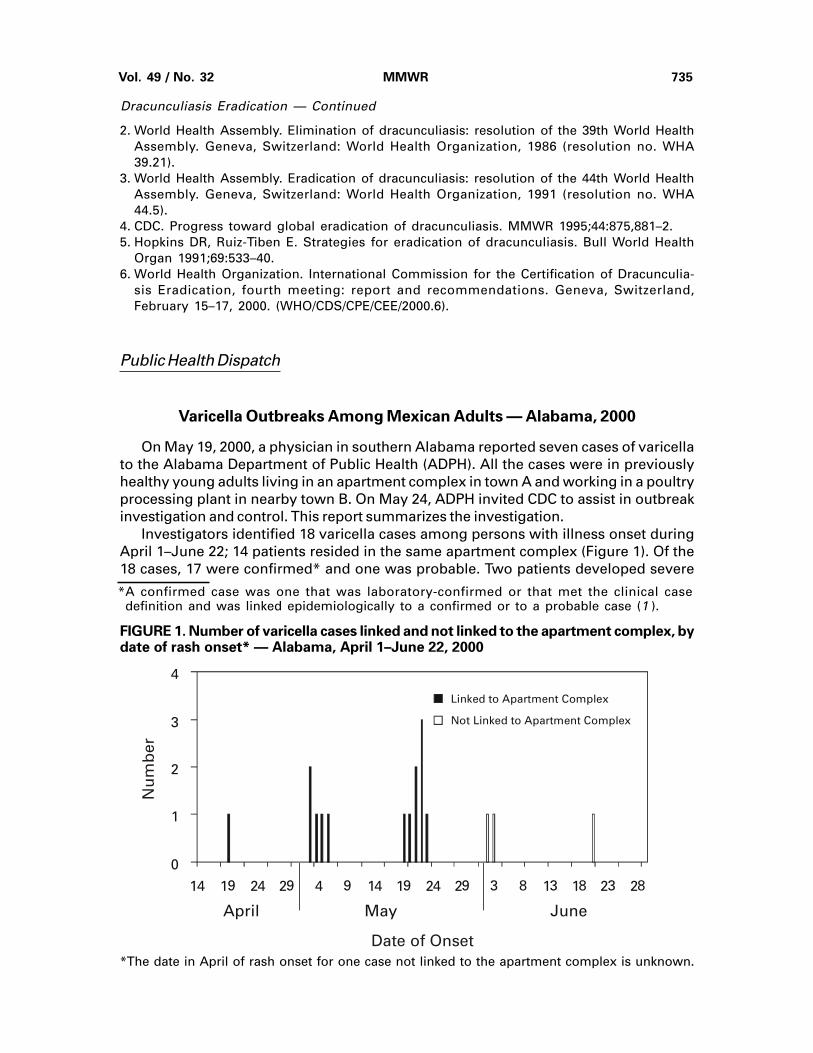
Investigators identified 18 varicella cases among persons with illness onset duringApril 1–June 22; 14 patients resided in the same apartment complex (Figure 1). Of the18 cases, 17 were confirmed* and one was probable. Two patients developed severe
*A confirmed case was one that was laboratory-confirmed or that met the clinical casedefinition and was linked epidemiologically to a confirmed or to a probable case (1 ).
FIGURE 1. Number of varicella cases linked and not linked to the apartment complex, bydate of rash onset* — Alabama, April 1–June 22, 2000
*The date in April of rash onset for one case not linked to the apartment complex is unknown.
0
1
2
3
4
14 19 24 29 4 9 14 19 24 29 3 8 13 18 23 28
Linked to Apartment Complex
Not Linked to Apartment Complex
April May June
Nu
mb
er
Date of Onset
736 MMWR August 18, 2000
Varicella — Continued
complications (pneumonia and ataxia with postviral sensory neuritis) and were hospital-ized. All the patients were born in Mexico. The median age was 22 years (range: 18–28years), and 17 were men.
On May 31, ADPH initiated control measures at the apartment complex and poultryprocessing plant. To increase community awareness, ADPH distributed flyers in Englishand Spanish and gave press releases to the local news media. In the apartment complex,ADPH vaccinated susceptible persons on the basis of disease history and performedserology to identify those who would need a second dose of vaccine. At the plant, ADPHoffered serologic testing to all workers and vaccinated persons with a negative varicellaIgG.
On June 22, a second cluster of seven varicella cases was identified among adultsborn in Mexico who worked at a sawmill in another Alabama county. The two outbreakscould not be linked.
Varicella outbreaks among adults are less common than among children. Becausethe potential for serious disease is higher in adults, state and local health departmentsshould be alert to these outbreaks. In addition, the susceptibility among adults fromcertain regions in Mexico is higher than in U.S.-born adults (2 ). Outbreaks associatedwith severe complications or among adults and adolescents should be investigated andcontrolled (1 ). During varicella outbreaks, infected patients should be isolated at home;varicella vaccine is recommended for exposed persons (3 ). Depending on urgency,vaccination can be offered on the basis of a negative or uncertain disease history and/ora negative serologic test. Because most adults with a negative or uncertain varicellahistory are immune to varicella when tested, serologic testing may decrease the numberof vaccine doses needed for outbreak control (4 ).
Virus isolation from vesicular fluid, a swab from the base of a skin lesion, or fromsaliva can assist in confirming an outbreak. Exposed persons who are at high risk forsevere disease, including susceptible pregnant women, should receive varicella zosterimmune globulin (VZIG) within 96 hours of varicella exposure (1 ). Managing varicella inadults includes the routine administration of acyclovir. The optimal strategy for varicellacontrol is to prevent outbreaks by implementing existing policy recommendations. TheAdvisory Committee on Immunization Practices recommends vaccinating susceptibleadults, especially those at high risk for exposure or transmission (3 ).Reported by: C Woernle, MD, G Higginbotham, R Judy, Alabama Dept of Public Health.E Gordon, DO; National Varicella-zoster Virus Laboratory, Div of Viral and Rickettsial Diseases,National Center for Infectious Diseases; Child Vaccine Preventable Diseases Br, Epidemiologyand Surveillance Div, National Immunization Program, CDC.References1. Seward J, Hall S, Galil K, Schmid S, Wharton M. Varicella. In: CDC manual for the surveillance
of vaccine-preventable diseases. Atlanta, Georgia: US Department of Health and HumanServices, CDC, 1999.
2. Kilgore PK, Kruszon-Moran D, Van Loon FPL, et al. Seroprevalence of antibody to varicella ina population-based survey. Toronto, Ontario: Abstracts for the 37th International Confer-ence on Antimicrobial Agents and Chemotherapy, 1997.
3. CDC. Prevention of varicella: update recommendations of the Advisory Committee onImmunization Practices (ACIP). MMWR 1999;48(no. RR-6).
4. CDC. Prevention of varicella: recommendations of the Advisory Committee on Immuniza-tion Practices (ACIP). MMWR 1996;45(no. RR-11).
Vol. 49 / No. 32 MMWR 737
Notice to Readers
Workshop on Vaccine Communication
The National Vaccine Advisory Committee, the Inter-Agency Vaccine Communica-tions Group, and the National Vaccine Program Office will co-sponsor a Workshop onVaccine Communication, October 5–6, 2000, in Arlington, Virginia. The purpose of theworkshop is to identify key issues, forces, and trends that influence and shape percep-tions about vaccines; determine how to establish more meaningful discussions regard-ing issues of concern; define options for establishing more effective mechanisms forcommunicating vaccine benefits and risks; and examine and discuss the effectiveness,purpose, methods, and timing of current vaccine communications.
This workshop should be of interest to persons working in the vaccine and immuniza-tion field including health communication and public affairs specialists, public and privatesector health-care providers, parent and consumer groups, vaccine manufacturers, andimmunization program managers and directors. Additional information is available fromthe National Vaccine Program Office, telephone (404) 687-6672 or from the World-WideWeb, http://www.cdc.gov/od/nvpo/calendar.htm.
Erratum: Vol. 49, No. 30
An error was made in the article “Missed Opportunities for Prevention of Tuberculo-sis Among Persons With HIV Infection — Selected Locations, United States, 1996–1997,”in the first paragraph on page 685. It should read, “The risk for active TB is increasedgreatly if the close contact is infected with the human immunodeficiency virus (HIV)(1,2 ).”
Erratum: Vol. 48, No. RR-1
In the MMWR Recommendations and Reports, “Human Rabies Prevention—UnitedStates, 1999,” on page 2 , Table 1, under the “Manufacturer” column, the telephonenumber for BioPort Corporation should be (517) 327-1500.

738 MMWR August 18, 2000
Vol. 49 / No. 32 MMWR 739
TABLE I. Summary of provisional cases of selected notifiable diseases,United States, cumulative, week ending August 12, 2000 (32nd Week)
Cum. 2000 Cum. 2000
Anthrax - HIV infection, pediatric*§ 127Brucellosis* 36 Plague 5Cholera - Poliomyelitis, paralytic -Congenital rubella syndrome 4 Psittacosis* 8Cyclosporiasis* 24 Rabies, human -Diphtheria - Rocky Mountain spotted fever (RMSF) 218Encephalitis: California serogroup viral* 15 Streptococcal disease, invasive, group A 1,882
eastern equine* - Streptococcal toxic-shock syndrome* 60St. Louis* - Syphilis, congenital¶ 85western equine* - Tetanus 17
Ehrlichiosis human granulocytic (HGE)* 99 Toxic-shock syndrome 99human monocytic (HME)* 34 Trichinosis 4
Hansen disease (leprosy)* 38 Typhoid fever 191Hantavirus pulmonary syndrome*† 17 Yellow fever -Hemolytic uremic syndrome, postdiarrheal* 79
-:No reported cases. *Not notifiable in all states. † Updated weekly from reports to the Division of Viral and Rickettsial Diseases, National Center for Infectious Diseases (NCID). § Updated monthly from reports to the Division of HIV/AIDS Prevention — Surveillance and Epidemiology, National Center for HIV,
STD, and TB Prevention (NCHSTP). Last update July 30, 2000. ¶ Updated from reports to the Division of STD Prevention, NCHSTP.
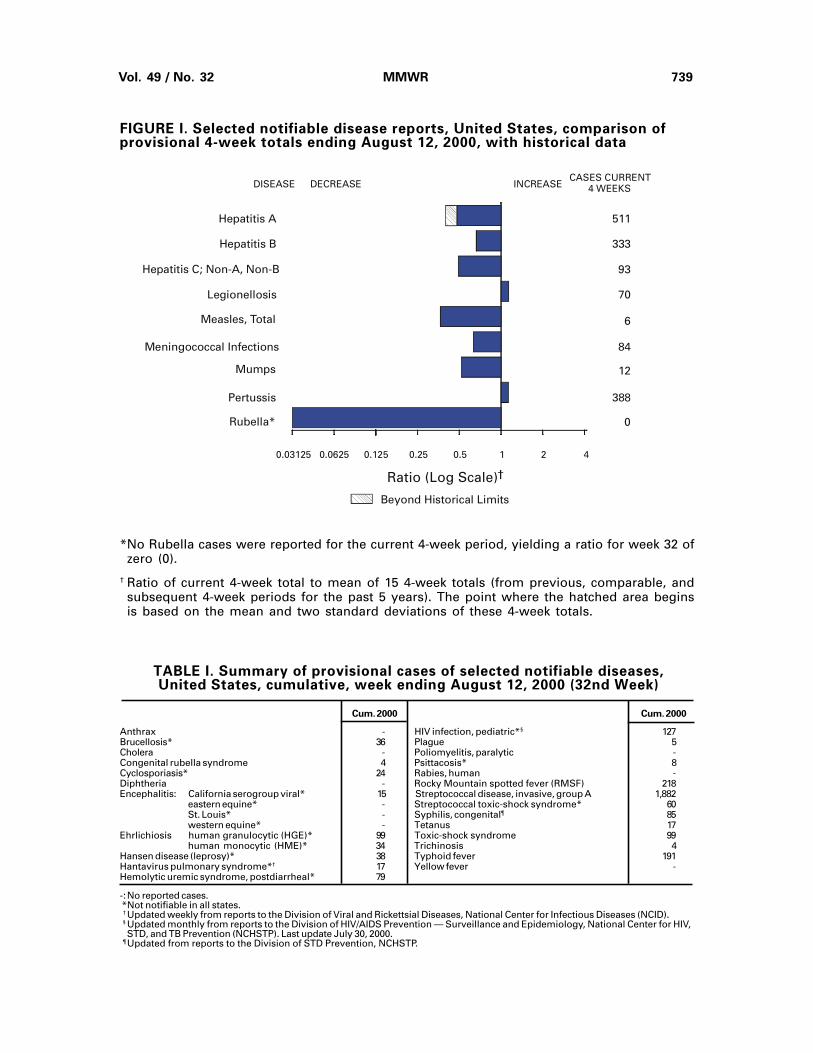
FIGURE I. Selected notifiable disease reports, United States, comparison ofprovisional 4-week totals ending August 12, 2000, with historical data
*No Rubella cases were reported for the current 4-week period, yielding a ratio for week 32 ofzero (0).
† Ratio of current 4-week total to mean of 15 4-week totals (from previous, comparable, andsubsequent 4-week periods for the past 5 years). The point where the hatched area beginsis based on the mean and two standard deviations of these 4-week totals.
DISEASE DECREASE INCREASECASES CURRENT
4 WEEKS
Ratio (Log Scale)†
Beyond Historical Limits
4210.50.250.125
511
333
93
70
6
84
12
388
0
Hepatitis A
Hepatitis B
Hepatitis C; Non-A, Non-B
Legionellosis
Measles, Total
Mumps
Pertussis
Rubella*
Meningococcal Infections
0.06250.03125
740 MMWR August 18, 2000
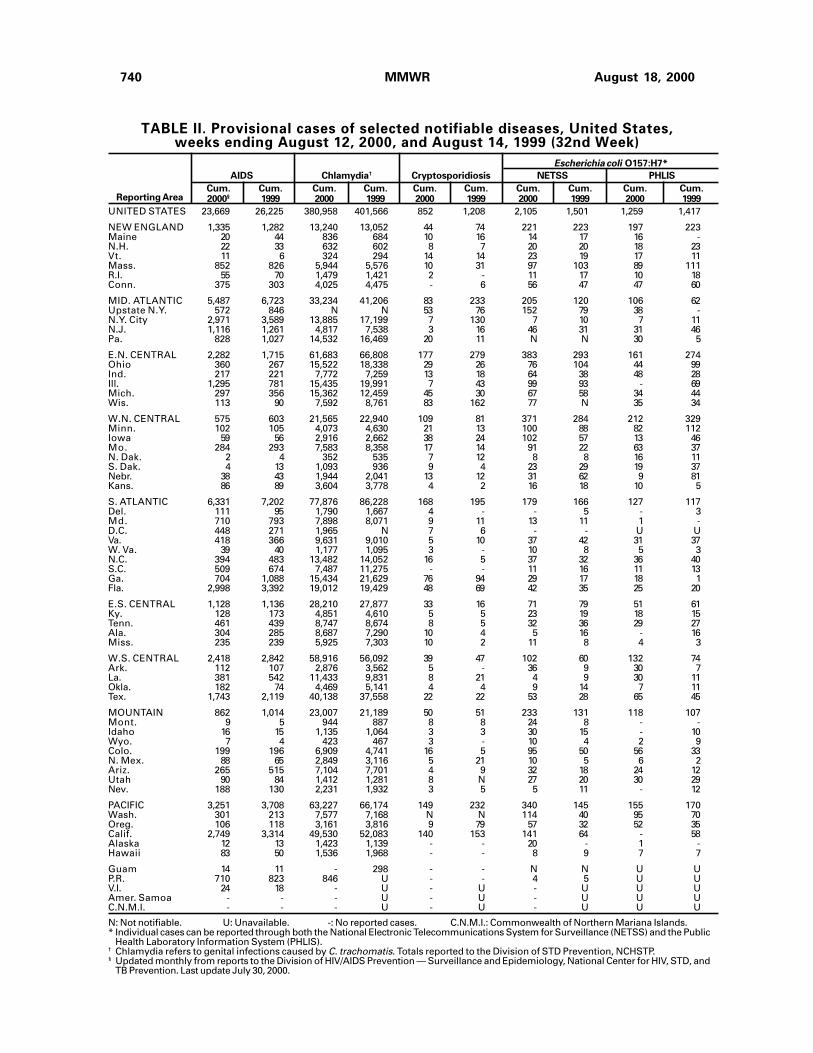
TABLE II. Provisional cases of selected notifiable diseases, United States,weeks ending August 12, 2000, and August 14, 1999 (32nd Week)
Cum. Cum. Cum. Cum. Cum. Cum. Cum. Cum. Cum. Cum.2000§ 1999 2000 1999 2000 1999 2000 1999 2000 1999
AIDS Chlamydia† Cryptosporidiosis NETSS PHLIS
Reporting Area
Escherichia coli O157:H7*
UNITED STATES 23,669 26,225 380,958 401,566 852 1,208 2,105 1,501 1,259 1,417
NEW ENGLAND 1,335 1,282 13,240 13,052 44 74 221 223 197 223Maine 20 44 836 684 10 16 14 17 16 -N.H. 22 33 632 602 8 7 20 20 18 23Vt. 11 6 324 294 14 14 23 19 17 11Mass. 852 826 5,944 5,576 10 31 97 103 89 111R.I. 55 70 1,479 1,421 2 - 11 17 10 18Conn. 375 303 4,025 4,475 - 6 56 47 47 60
MID. ATLANTIC 5,487 6,723 33,234 41,206 83 233 205 120 106 62Upstate N.Y. 572 846 N N 53 76 152 79 38 -N.Y. City 2,971 3,589 13,885 17,199 7 130 7 10 7 11N.J. 1,116 1,261 4,817 7,538 3 16 46 31 31 46Pa. 828 1,027 14,532 16,469 20 11 N N 30 5
E.N. CENTRAL 2,282 1,715 61,683 66,808 177 279 383 293 161 274Ohio 360 267 15,522 18,338 29 26 76 104 44 99Ind. 217 221 7,772 7,259 13 18 64 38 48 28Ill. 1,295 781 15,435 19,991 7 43 99 93 - 69Mich. 297 356 15,362 12,459 45 30 67 58 34 44Wis. 113 90 7,592 8,761 83 162 77 N 35 34
W.N. CENTRAL 575 603 21,565 22,940 109 81 371 284 212 329Minn. 102 105 4,073 4,630 21 13 100 88 82 112Iowa 59 56 2,916 2,662 38 24 102 57 13 46Mo. 284 293 7,583 8,358 17 14 91 22 63 37N. Dak. 2 4 352 535 7 12 8 8 16 11S. Dak. 4 13 1,093 936 9 4 23 29 19 37Nebr. 38 43 1,944 2,041 13 12 31 62 9 81Kans. 86 89 3,604 3,778 4 2 16 18 10 5
S. ATLANTIC 6,331 7,202 77,876 86,228 168 195 179 166 127 117Del. 111 95 1,790 1,667 4 - - 5 - 3Md. 710 793 7,898 8,071 9 11 13 11 1 -D.C. 448 271 1,965 N 7 6 - - U UVa. 418 366 9,631 9,010 5 10 37 42 31 37W. Va. 39 40 1,177 1,095 3 - 10 8 5 3N.C. 394 483 13,482 14,052 16 5 37 32 36 40S.C. 509 674 7,487 11,275 - - 11 16 11 13Ga. 704 1,088 15,434 21,629 76 94 29 17 18 1Fla. 2,998 3,392 19,012 19,429 48 69 42 35 25 20
E.S. CENTRAL 1,128 1,136 28,210 27,877 33 16 71 79 51 61Ky. 128 173 4,851 4,610 5 5 23 19 18 15Tenn. 461 439 8,747 8,674 8 5 32 36 29 27Ala. 304 285 8,687 7,290 10 4 5 16 - 16Miss. 235 239 5,925 7,303 10 2 11 8 4 3
W.S. CENTRAL 2,418 2,842 58,916 56,092 39 47 102 60 132 74Ark. 112 107 2,876 3,562 5 - 36 9 30 7La. 381 542 11,433 9,831 8 21 4 9 30 11Okla. 182 74 4,469 5,141 4 4 9 14 7 11Tex. 1,743 2,119 40,138 37,558 22 22 53 28 65 45
MOUNTAIN 862 1,014 23,007 21,189 50 51 233 131 118 107Mont. 9 5 944 887 8 8 24 8 - -Idaho 16 15 1,135 1,064 3 3 30 15 - 10Wyo. 7 4 423 467 3 - 10 4 2 9Colo. 199 196 6,909 4,741 16 5 95 50 56 33N. Mex. 88 65 2,849 3,116 5 21 10 5 6 2Ariz. 265 515 7,104 7,701 4 9 32 18 24 12Utah 90 84 1,412 1,281 8 N 27 20 30 29Nev. 188 130 2,231 1,932 3 5 5 11 - 12
PACIFIC 3,251 3,708 63,227 66,174 149 232 340 145 155 170Wash. 301 213 7,577 7,168 N N 114 40 95 70Oreg. 106 118 3,161 3,816 9 79 57 32 52 35Calif. 2,749 3,314 49,530 52,083 140 153 141 64 - 58Alaska 12 13 1,423 1,139 - - 20 - 1 -Hawaii 83 50 1,536 1,968 - - 8 9 7 7
Guam 14 11 - 298 - - N N U UP.R. 710 823 846 U - - 4 5 U UV.I. 24 18 - U - U - U U UAmer. Samoa - - - U - U - U U UC.N.M.I. - - - U - U - U U U
N: Not notifiable. U: Unavailable. -: No reported cases. C.N.M.I.: Commonwealth of Northern Mariana Islands.* Individual cases can be reported through both the National Electronic Telecommunications System for Surveillance (NETSS) and the Public
Health Laboratory Information System (PHLIS).† Chlamydia refers to genital infections caused by C. trachomatis. Totals reported to the Division of STD Prevention, NCHSTP.§ Updated monthly from reports to the Division of HIV/AIDS Prevention — Surveillance and Epidemiology, National Center for HIV, STD, and
TB Prevention. Last update July 30, 2000.
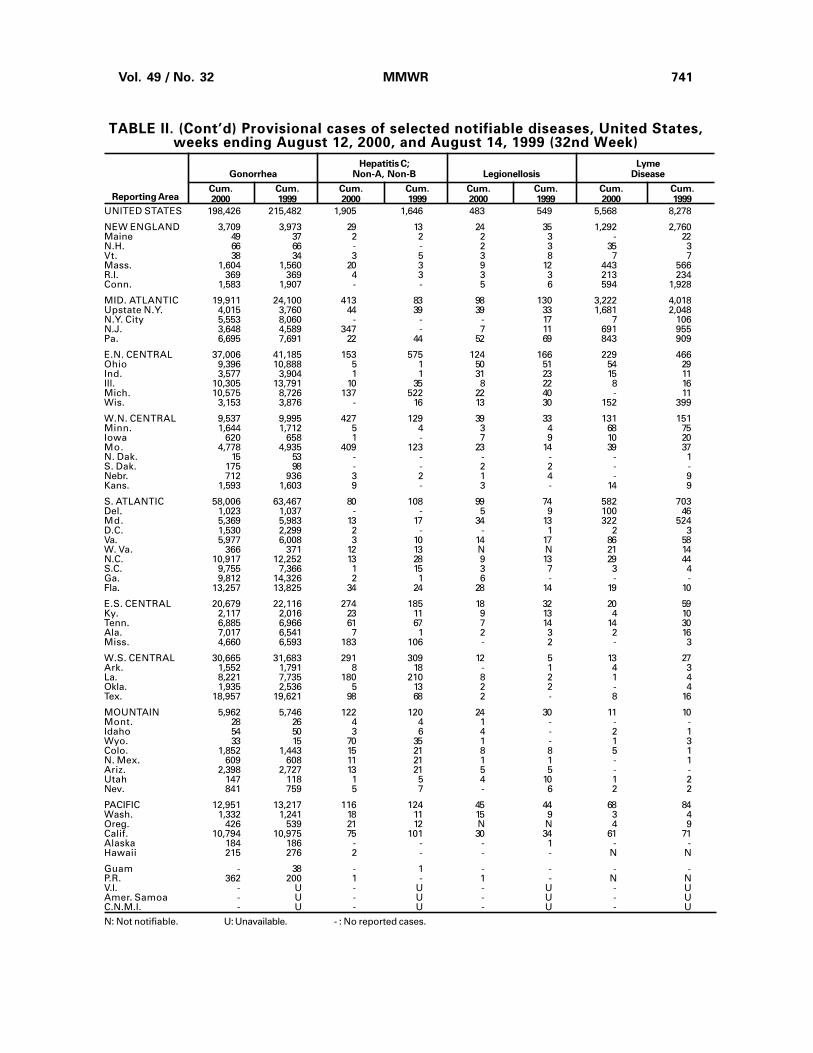
Vol. 49 / No. 32 MMWR 741
Hepatitis C; LymeGonorrhea Non-A, Non-B Legionellosis Disease
Cum. Cum. Cum. Cum. Cum. Cum. Cum. Cum.2000 1999 2000 1999 2000 1999 2000 1999Reporting Area
UNITED STATES 198,426 215,482 1,905 1,646 483 549 5,568 8,278
NEW ENGLAND 3,709 3,973 29 13 24 35 1,292 2,760Maine 49 37 2 2 2 3 - 22N.H. 66 66 - - 2 3 35 3Vt. 38 34 3 5 3 8 7 7Mass. 1,604 1,560 20 3 9 12 443 566R.I. 369 369 4 3 3 3 213 234Conn. 1,583 1,907 - - 5 6 594 1,928
MID. ATLANTIC 19,911 24,100 413 83 98 130 3,222 4,018Upstate N.Y. 4,015 3,760 44 39 39 33 1,681 2,048N.Y. City 5,553 8,060 - - - 17 7 106N.J. 3,648 4,589 347 - 7 11 691 955Pa. 6,695 7,691 22 44 52 69 843 909
E.N. CENTRAL 37,006 41,185 153 575 124 166 229 466Ohio 9,396 10,888 5 1 50 51 54 29Ind. 3,577 3,904 1 1 31 23 15 11Ill. 10,305 13,791 10 35 8 22 8 16Mich. 10,575 8,726 137 522 22 40 - 11Wis. 3,153 3,876 - 16 13 30 152 399
W.N. CENTRAL 9,537 9,995 427 129 39 33 131 151Minn. 1,644 1,712 5 4 3 4 68 75Iowa 620 658 1 - 7 9 10 20Mo. 4,778 4,935 409 123 23 14 39 37N. Dak. 15 53 - - - - - 1S. Dak. 175 98 - - 2 2 - -Nebr. 712 936 3 2 1 4 - 9Kans. 1,593 1,603 9 - 3 - 14 9
S. ATLANTIC 58,006 63,467 80 108 99 74 582 703Del. 1,023 1,037 - - 5 9 100 46Md. 5,369 5,983 13 17 34 13 322 524D.C. 1,530 2,299 2 - - 1 2 3Va. 5,977 6,008 3 10 14 17 86 58W. Va. 366 371 12 13 N N 21 14N.C. 10,917 12,252 13 28 9 13 29 44S.C. 9,755 7,366 1 15 3 7 3 4Ga. 9,812 14,326 2 1 6 - - -Fla. 13,257 13,825 34 24 28 14 19 10
E.S. CENTRAL 20,679 22,116 274 185 18 32 20 59Ky. 2,117 2,016 23 11 9 13 4 10Tenn. 6,885 6,966 61 67 7 14 14 30Ala. 7,017 6,541 7 1 2 3 2 16Miss. 4,660 6,593 183 106 - 2 - 3
W.S. CENTRAL 30,665 31,683 291 309 12 5 13 27Ark. 1,552 1,791 8 18 - 1 4 3La. 8,221 7,735 180 210 8 2 1 4Okla. 1,935 2,536 5 13 2 2 - 4Tex. 18,957 19,621 98 68 2 - 8 16
MOUNTAIN 5,962 5,746 122 120 24 30 11 10Mont. 28 26 4 4 1 - - -Idaho 54 50 3 6 4 - 2 1Wyo. 33 15 70 35 1 - 1 3Colo. 1,852 1,443 15 21 8 8 5 1N. Mex. 609 608 11 21 1 1 - 1Ariz. 2,398 2,727 13 21 5 5 - -Utah 147 118 1 5 4 10 1 2Nev. 841 759 5 7 - 6 2 2
PACIFIC 12,951 13,217 116 124 45 44 68 84Wash. 1,332 1,241 18 11 15 9 3 4Oreg. 426 539 21 12 N N 4 9Calif. 10,794 10,975 75 101 30 34 61 71Alaska 184 186 - - - 1 - -Hawaii 215 276 2 - - - N N
Guam - 38 - 1 - - - -P.R. 362 200 1 - 1 - N NV.I. - U - U - U - UAmer. Samoa - U - U - U - UC.N.M.I. - U - U - U - U
N: Not notifiable. U: Unavailable. - : No reported cases.
TABLE II. (Cont’d) Provisional cases of selected notifiable diseases, United States,weeks ending August 12, 2000, and August 14, 1999 (32nd Week)
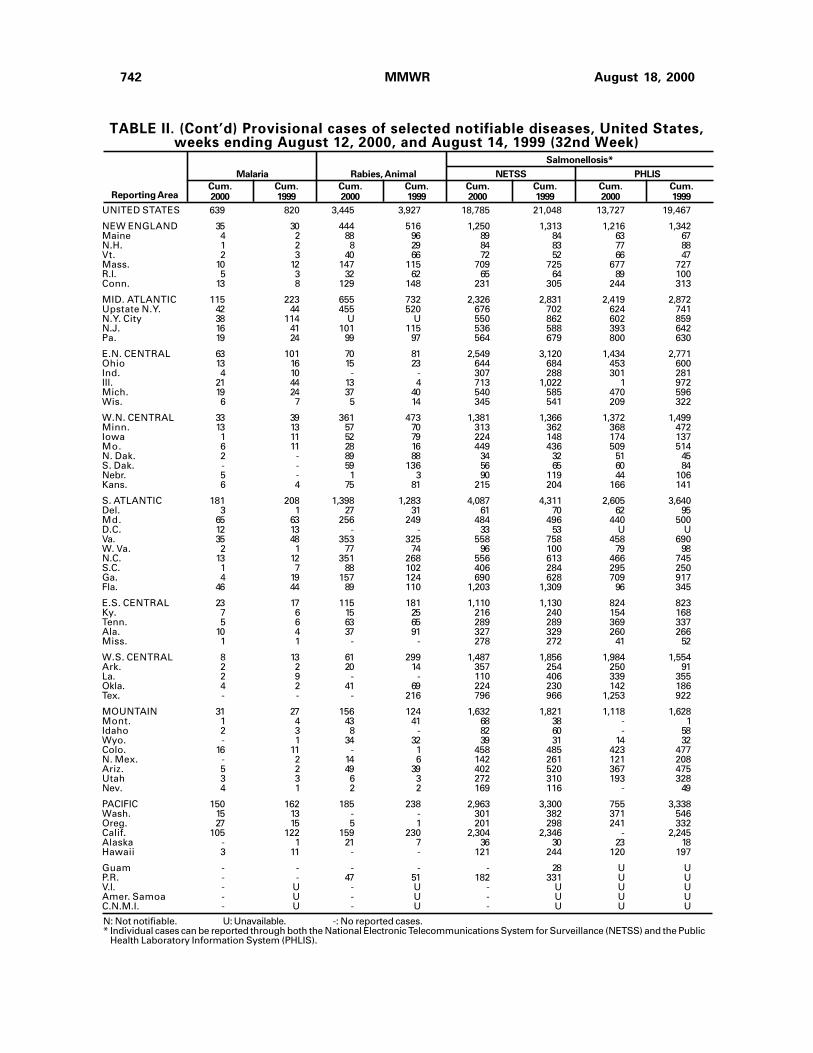
742 MMWR August 18, 2000
Malaria Rabies, Animal NETSS PHLIS
Cum. Cum. Cum. Cum. Cum. Cum. Cum. Cum.2000 1999 2000 1999 2000 1999 2000 1999Reporting Area
Salmonellosis*
UNITED STATES 639 820 3,445 3,927 18,785 21,048 13,727 19,467
NEW ENGLAND 35 30 444 516 1,250 1,313 1,216 1,342Maine 4 2 88 96 89 84 63 67N.H. 1 2 8 29 84 83 77 88Vt. 2 3 40 66 72 52 66 47Mass. 10 12 147 115 709 725 677 727R.I. 5 3 32 62 65 64 89 100Conn. 13 8 129 148 231 305 244 313
MID. ATLANTIC 115 223 655 732 2,326 2,831 2,419 2,872Upstate N.Y. 42 44 455 520 676 702 624 741N.Y. City 38 114 U U 550 862 602 859N.J. 16 41 101 115 536 588 393 642Pa. 19 24 99 97 564 679 800 630
E.N. CENTRAL 63 101 70 81 2,549 3,120 1,434 2,771Ohio 13 16 15 23 644 684 453 600Ind. 4 10 - - 307 288 301 281Ill. 21 44 13 4 713 1,022 1 972Mich. 19 24 37 40 540 585 470 596Wis. 6 7 5 14 345 541 209 322
W.N. CENTRAL 33 39 361 473 1,381 1,366 1,372 1,499Minn. 13 13 57 70 313 362 368 472Iowa 1 11 52 79 224 148 174 137Mo. 6 11 28 16 449 436 509 514N. Dak. 2 - 89 88 34 32 51 45S. Dak. - - 59 136 56 65 60 84Nebr. 5 - 1 3 90 119 44 106Kans. 6 4 75 81 215 204 166 141
S. ATLANTIC 181 208 1,398 1,283 4,087 4,311 2,605 3,640Del. 3 1 27 31 61 70 62 95Md. 65 63 256 249 484 496 440 500D.C. 12 13 - - 33 53 U UVa. 35 48 353 325 558 758 458 690W. Va. 2 1 77 74 96 100 79 98N.C. 13 12 351 268 556 613 466 745S.C. 1 7 88 102 406 284 295 250Ga. 4 19 157 124 690 628 709 917Fla. 46 44 89 110 1,203 1,309 96 345
E.S. CENTRAL 23 17 115 181 1,110 1,130 824 823Ky. 7 6 15 25 216 240 154 168Tenn. 5 6 63 65 289 289 369 337Ala. 10 4 37 91 327 329 260 266Miss. 1 1 - - 278 272 41 52
W.S. CENTRAL 8 13 61 299 1,487 1,856 1,984 1,554Ark. 2 2 20 14 357 254 250 91La. 2 9 - - 110 406 339 355Okla. 4 2 41 69 224 230 142 186Tex. - - - 216 796 966 1,253 922
MOUNTAIN 31 27 156 124 1,632 1,821 1,118 1,628Mont. 1 4 43 41 68 38 - 1Idaho 2 3 8 - 82 60 - 58Wyo. - 1 34 32 39 31 14 32Colo. 16 11 - 1 458 485 423 477N. Mex. - 2 14 6 142 261 121 208Ariz. 5 2 49 39 402 520 367 475Utah 3 3 6 3 272 310 193 328Nev. 4 1 2 2 169 116 - 49
PACIFIC 150 162 185 238 2,963 3,300 755 3,338Wash. 15 13 - - 301 382 371 546Oreg. 27 15 5 1 201 298 241 332Calif. 105 122 159 230 2,304 2,346 - 2,245Alaska - 1 21 7 36 30 23 18Hawaii 3 11 - - 121 244 120 197
Guam - - - - - 28 U UP.R. - - 47 51 182 331 U UV.I. - U - U - U U UAmer. Samoa - U - U - U U UC.N.M.I. - U - U - U U U
N: Not notifiable. U: Unavailable. -: No reported cases.* Individual cases can be reported through both the National Electronic Telecommunications System for Surveillance (NETSS) and the Public
Health Laboratory Information System (PHLIS).
TABLE II. (Cont’d) Provisional cases of selected notifiable diseases, United States,weeks ending August 12, 2000, and August 14, 1999 (32nd Week)
Vol. 49 / No. 32 MMWR 743
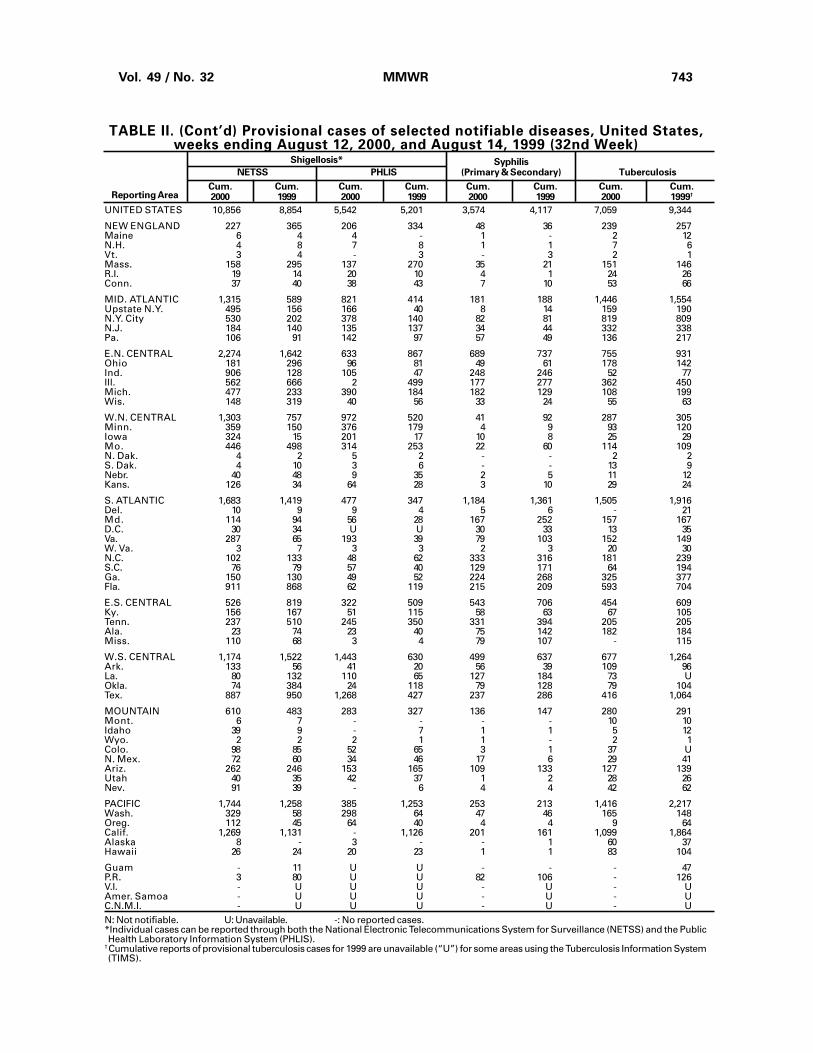
TABLE II. (Cont’d) Provisional cases of selected notifiable diseases, United States,weeks ending August 12, 2000, and August 14, 1999 (32nd Week)
SyphilisNETSS PHLIS (Primary & Secondary) Tuberculosis
Cum. Cum. Cum. Cum. Cum. Cum. Cum. Cum.2000 1999 2000 1999 2000 1999 2000 1999†Reporting Area
Shigellosis*
UNITED STATES 10,856 8,854 5,542 5,201 3,574 4,117 7,059 9,344
NEW ENGLAND 227 365 206 334 48 36 239 257Maine 6 4 4 - 1 - 2 12N.H. 4 8 7 8 1 1 7 6Vt. 3 4 - 3 - 3 2 1Mass. 158 295 137 270 35 21 151 146R.I. 19 14 20 10 4 1 24 26Conn. 37 40 38 43 7 10 53 66
MID. ATLANTIC 1,315 589 821 414 181 188 1,446 1,554Upstate N.Y. 495 156 166 40 8 14 159 190N.Y. City 530 202 378 140 82 81 819 809N.J. 184 140 135 137 34 44 332 338Pa. 106 91 142 97 57 49 136 217
E.N. CENTRAL 2,274 1,642 633 867 689 737 755 931Ohio 181 296 96 81 49 61 178 142Ind. 906 128 105 47 248 246 52 77Ill. 562 666 2 499 177 277 362 450Mich. 477 233 390 184 182 129 108 199Wis. 148 319 40 56 33 24 55 63
W.N. CENTRAL 1,303 757 972 520 41 92 287 305Minn. 359 150 376 179 4 9 93 120Iowa 324 15 201 17 10 8 25 29Mo. 446 498 314 253 22 60 114 109N. Dak. 4 2 5 2 - - 2 2S. Dak. 4 10 3 6 - - 13 9Nebr. 40 48 9 35 2 5 11 12Kans. 126 34 64 28 3 10 29 24
S. ATLANTIC 1,683 1,419 477 347 1,184 1,361 1,505 1,916Del. 10 9 9 4 5 6 - 21Md. 114 94 56 28 167 252 157 167D.C. 30 34 U U 30 33 13 35Va. 287 65 193 39 79 103 152 149W. Va. 3 7 3 3 2 3 20 30N.C. 102 133 48 62 333 316 181 239S.C. 76 79 57 40 129 171 64 194Ga. 150 130 49 52 224 268 325 377Fla. 911 868 62 119 215 209 593 704
E.S. CENTRAL 526 819 322 509 543 706 454 609Ky. 156 167 51 115 58 63 67 105Tenn. 237 510 245 350 331 394 205 205Ala. 23 74 23 40 75 142 182 184Miss. 110 68 3 4 79 107 - 115
W.S. CENTRAL 1,174 1,522 1,443 630 499 637 677 1,264Ark. 133 56 41 20 56 39 109 96La. 80 132 110 65 127 184 73 UOkla. 74 384 24 118 79 128 79 104Tex. 887 950 1,268 427 237 286 416 1,064
MOUNTAIN 610 483 283 327 136 147 280 291Mont. 6 7 - - - - 10 10Idaho 39 9 - 7 1 1 5 12Wyo. 2 2 2 1 1 - 2 1Colo. 98 85 52 65 3 1 37 UN. Mex. 72 60 34 46 17 6 29 41Ariz. 262 246 153 165 109 133 127 139Utah 40 35 42 37 1 2 28 26Nev. 91 39 - 6 4 4 42 62
PACIFIC 1,744 1,258 385 1,253 253 213 1,416 2,217Wash. 329 58 298 64 47 46 165 148Oreg. 112 45 64 40 4 4 9 64Calif. 1,269 1,131 - 1,126 201 161 1,099 1,864Alaska 8 - 3 - - 1 60 37Hawaii 26 24 20 23 1 1 83 104
Guam - 11 U U - - - 47P.R. 3 80 U U 82 106 - 126V.I. - U U U - U - UAmer. Samoa - U U U - U - UC.N.M.I. - U U U - U - UN: Not notifiable. U: Unavailable. -: No reported cases.*Individual cases can be reported through both the National Electronic Telecommunications System for Surveillance (NETSS) and the PublicHealth Laboratory Information System (PHLIS).
†Cumulative reports of provisional tuberculosis cases for 1999 are unavailable (“U”) for some areas using the Tuberculosis Information System(TIMS).
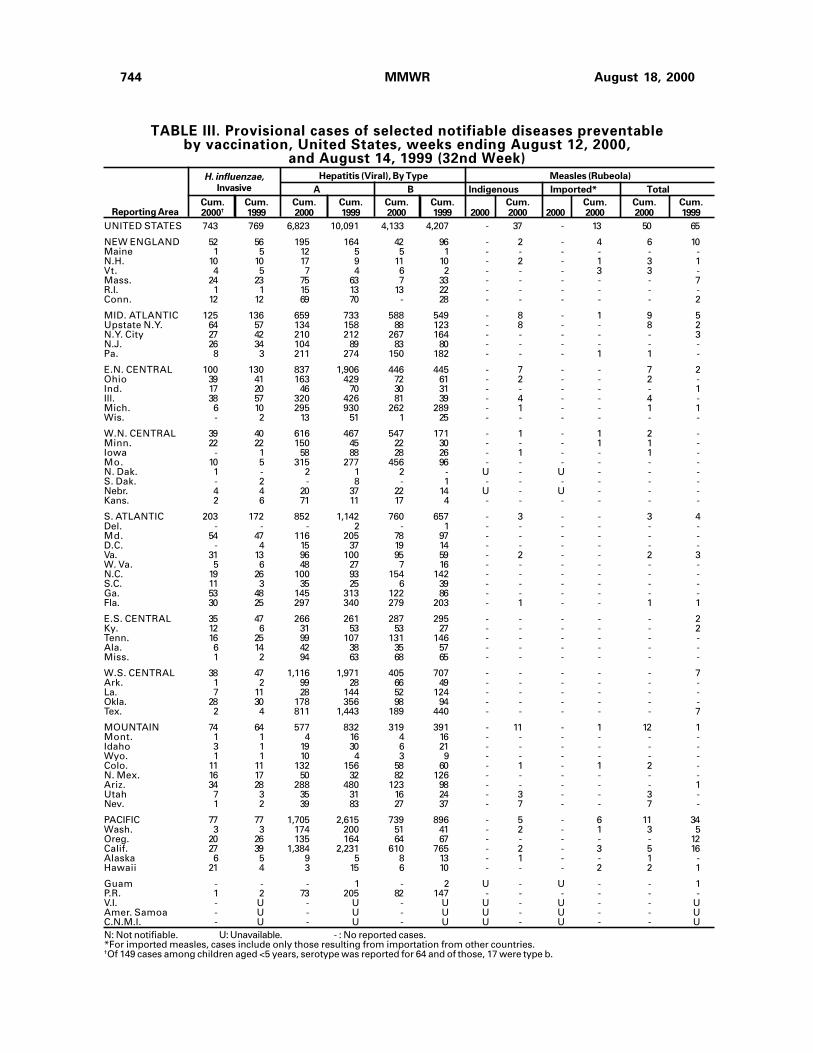
744 MMWR August 18, 2000
TABLE III. Provisional cases of selected notifiable diseases preventableby vaccination, United States, weeks ending August 12, 2000,
and August 14, 1999 (32nd Week)
A B Indigenous Imported* Total
Cum. Cum. Cum. Cum. Cum. Cum. Cum. Cum. Cum. Cum.2000† 1999 2000 1999 2000 1999 2000 2000 2000 2000 2000 1999Reporting Area
Hepatitis (Viral), By TypeH. influenzae,Invasive
UNITED STATES 743 769 6,823 10,091 4,133 4,207 - 37 - 13 50 65
NEW ENGLAND 52 56 195 164 42 96 - 2 - 4 6 10Maine 1 5 12 5 5 1 - - - - - -N.H. 10 10 17 9 11 10 - 2 - 1 3 1Vt. 4 5 7 4 6 2 - - - 3 3 -Mass. 24 23 75 63 7 33 - - - - - 7R.I. 1 1 15 13 13 22 - - - - - -Conn. 12 12 69 70 - 28 - - - - - 2
MID. ATLANTIC 125 136 659 733 588 549 - 8 - 1 9 5Upstate N.Y. 64 57 134 158 88 123 - 8 - - 8 2N.Y. City 27 42 210 212 267 164 - - - - - 3N.J. 26 34 104 89 83 80 - - - - - -Pa. 8 3 211 274 150 182 - - - 1 1 -
E.N. CENTRAL 100 130 837 1,906 446 445 - 7 - - 7 2Ohio 39 41 163 429 72 61 - 2 - - 2 -Ind. 17 20 46 70 30 31 - - - - - 1Ill. 38 57 320 426 81 39 - 4 - - 4 -Mich. 6 10 295 930 262 289 - 1 - - 1 1Wis. - 2 13 51 1 25 - - - - - -
W.N. CENTRAL 39 40 616 467 547 171 - 1 - 1 2 -Minn. 22 22 150 45 22 30 - - - 1 1 -Iowa - 1 58 88 28 26 - 1 - - 1 -Mo. 10 5 315 277 456 96 - - - - - -N. Dak. 1 - 2 1 2 - U - U - - -S. Dak. - 2 - 8 - 1 - - - - - -Nebr. 4 4 20 37 22 14 U - U - - -Kans. 2 6 71 11 17 4 - - - - - -
S. ATLANTIC 203 172 852 1,142 760 657 - 3 - - 3 4Del. - - - 2 - 1 - - - - - -Md. 54 47 116 205 78 97 - - - - - -D.C. - 4 15 37 19 14 - - - - - -Va. 31 13 96 100 95 59 - 2 - - 2 3W. Va. 5 6 48 27 7 16 - - - - - -N.C. 19 26 100 93 154 142 - - - - - -S.C. 11 3 35 25 6 39 - - - - - -Ga. 53 48 145 313 122 86 - - - - - -Fla. 30 25 297 340 279 203 - 1 - - 1 1
E.S. CENTRAL 35 47 266 261 287 295 - - - - - 2Ky. 12 6 31 53 53 27 - - - - - 2Tenn. 16 25 99 107 131 146 - - - - - -Ala. 6 14 42 38 35 57 - - - - - -Miss. 1 2 94 63 68 65 - - - - - -
W.S. CENTRAL 38 47 1,116 1,971 405 707 - - - - - 7Ark. 1 2 99 28 66 49 - - - - - -La. 7 11 28 144 52 124 - - - - - -Okla. 28 30 178 356 98 94 - - - - - -Tex. 2 4 811 1,443 189 440 - - - - - 7
MOUNTAIN 74 64 577 832 319 391 - 11 - 1 12 1Mont. 1 1 4 16 4 16 - - - - - -Idaho 3 1 19 30 6 21 - - - - - -Wyo. 1 1 10 4 3 9 - - - - - -Colo. 11 11 132 156 58 60 - 1 - 1 2 -N. Mex. 16 17 50 32 82 126 - - - - - -Ariz. 34 28 288 480 123 98 - - - - - 1Utah 7 3 35 31 16 24 - 3 - - 3 -Nev. 1 2 39 83 27 37 - 7 - - 7 -
PACIFIC 77 77 1,705 2,615 739 896 - 5 - 6 11 34Wash. 3 3 174 200 51 41 - 2 - 1 3 5Oreg. 20 26 135 164 64 67 - - - - - 12Calif. 27 39 1,384 2,231 610 765 - 2 - 3 5 16Alaska 6 5 9 5 8 13 - 1 - - 1 -Hawaii 21 4 3 15 6 10 - - - 2 2 1
Guam - - - 1 - 2 U - U - - 1P.R. 1 2 73 205 82 147 - - - - - -V.I. - U - U - U U - U - - UAmer. Samoa - U - U - U U - U - - UC.N.M.I. - U - U - U U - U - - UN: Not notifiable. U: Unavailable. - : No reported cases.*For imported measles, cases include only those resulting from importation from other countries.†Of 149 cases among children aged <5 years, serotype was reported for 64 and of those, 17 were type b.
Measles (Rubeola)
Vol. 49 / No. 32 MMWR 745
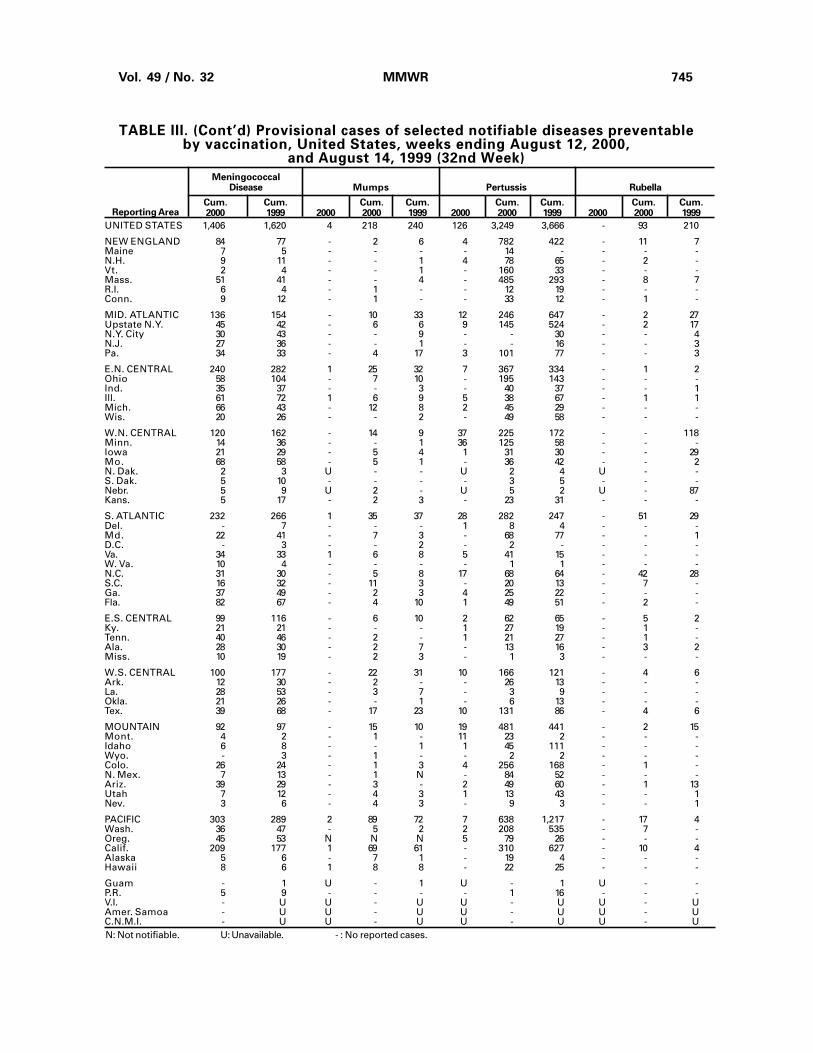
MeningococcalDisease Mumps Pertussis Rubella
Cum. Cum. Cum. Cum. Cum. Cum. Cum. Cum.2000 1999 2000 2000 1999 2000 2000 1999 2000 2000 1999Reporting Area
TABLE III. (Cont’d) Provisional cases of selected notifiable diseases preventableby vaccination, United States, weeks ending August 12, 2000,
and August 14, 1999 (32nd Week)
UNITED STATES 1,406 1,620 4 218 240 126 3,249 3,666 - 93 210
NEW ENGLAND 84 77 - 2 6 4 782 422 - 11 7Maine 7 5 - - - - 14 - - - -N.H. 9 11 - - 1 4 78 65 - 2 -Vt. 2 4 - - 1 - 160 33 - - -Mass. 51 41 - - 4 - 485 293 - 8 7R.I. 6 4 - 1 - - 12 19 - - -Conn. 9 12 - 1 - - 33 12 - 1 -
MID. ATLANTIC 136 154 - 10 33 12 246 647 - 2 27Upstate N.Y. 45 42 - 6 6 9 145 524 - 2 17N.Y. City 30 43 - - 9 - - 30 - - 4N.J. 27 36 - - 1 - - 16 - - 3Pa. 34 33 - 4 17 3 101 77 - - 3
E.N. CENTRAL 240 282 1 25 32 7 367 334 - 1 2Ohio 58 104 - 7 10 - 195 143 - - -Ind. 35 37 - - 3 - 40 37 - - 1Ill. 61 72 1 6 9 5 38 67 - 1 1Mich. 66 43 - 12 8 2 45 29 - - -Wis. 20 26 - - 2 - 49 58 - - -
W.N. CENTRAL 120 162 - 14 9 37 225 172 - - 118Minn. 14 36 - - 1 36 125 58 - - -Iowa 21 29 - 5 4 1 31 30 - - 29Mo. 68 58 - 5 1 - 36 42 - - 2N. Dak. 2 3 U - - U 2 4 U - -S. Dak. 5 10 - - - - 3 5 - - -Nebr. 5 9 U 2 - U 5 2 U - 87Kans. 5 17 - 2 3 - 23 31 - - -
S. ATLANTIC 232 266 1 35 37 28 282 247 - 51 29Del. - 7 - - - 1 8 4 - - -Md. 22 41 - 7 3 - 68 77 - - 1D.C. - 3 - - 2 - 2 - - - -Va. 34 33 1 6 8 5 41 15 - - -W. Va. 10 4 - - - - 1 1 - - -N.C. 31 30 - 5 8 17 68 64 - 42 28S.C. 16 32 - 11 3 - 20 13 - 7 -Ga. 37 49 - 2 3 4 25 22 - - -Fla. 82 67 - 4 10 1 49 51 - 2 -
E.S. CENTRAL 99 116 - 6 10 2 62 65 - 5 2Ky. 21 21 - - - 1 27 19 - 1 -Tenn. 40 46 - 2 - 1 21 27 - 1 -Ala. 28 30 - 2 7 - 13 16 - 3 2Miss. 10 19 - 2 3 - 1 3 - - -
W.S. CENTRAL 100 177 - 22 31 10 166 121 - 4 6Ark. 12 30 - 2 - - 26 13 - - -La. 28 53 - 3 7 - 3 9 - - -Okla. 21 26 - - 1 - 6 13 - - -Tex. 39 68 - 17 23 10 131 86 - 4 6
MOUNTAIN 92 97 - 15 10 19 481 441 - 2 15Mont. 4 2 - 1 - 11 23 2 - - -Idaho 6 8 - - 1 1 45 111 - - -Wyo. - 3 - 1 - - 2 2 - - -Colo. 26 24 - 1 3 4 256 168 - 1 -N. Mex. 7 13 - 1 N - 84 52 - - -Ariz. 39 29 - 3 - 2 49 60 - 1 13Utah 7 12 - 4 3 1 13 43 - - 1Nev. 3 6 - 4 3 - 9 3 - - 1
PACIFIC 303 289 2 89 72 7 638 1,217 - 17 4Wash. 36 47 - 5 2 2 208 535 - 7 -Oreg. 45 53 N N N 5 79 26 - - -Calif. 209 177 1 69 61 - 310 627 - 10 4Alaska 5 6 - 7 1 - 19 4 - - -Hawaii 8 6 1 8 8 - 22 25 - - -
Guam - 1 U - 1 U - 1 U - -P.R. 5 9 - - - - 1 16 - - -V.I. - U U - U U - U U - UAmer. Samoa - U U - U U - U U - UC.N.M.I. - U U - U U - U U - UN: Not notifiable. U: Unavailable. - : No reported cases.
746 MMWR August 18, 2000
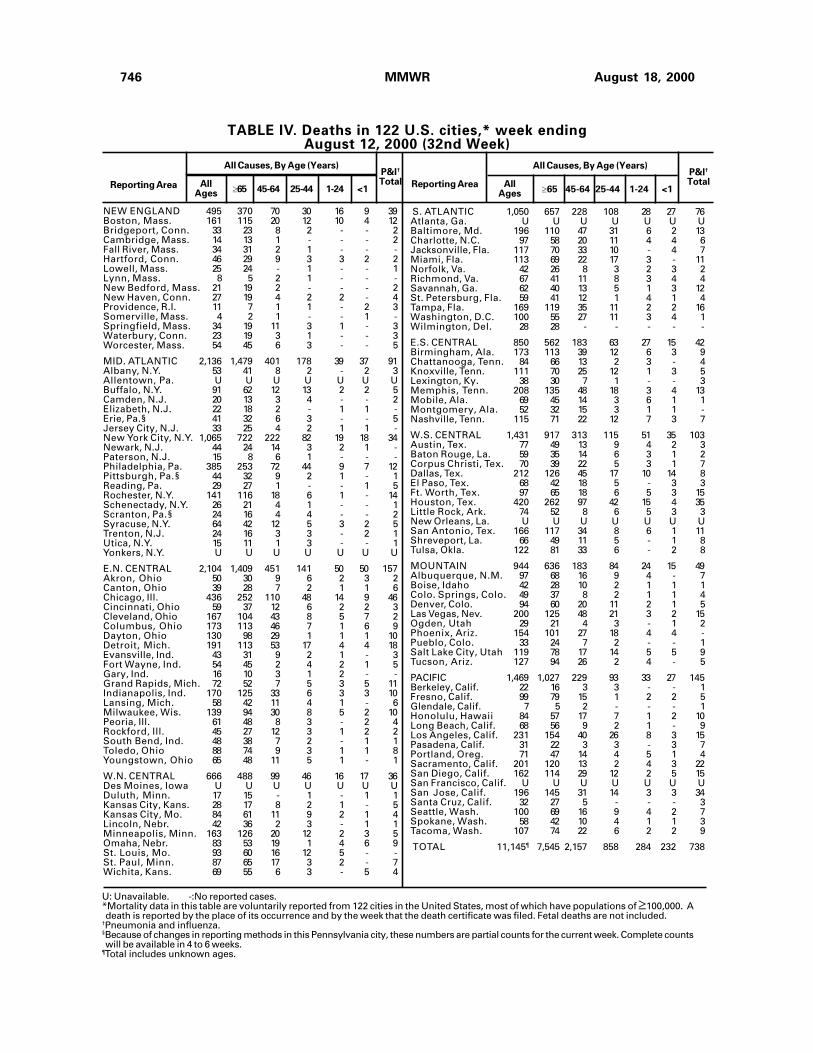
TABLE IV. Deaths in 122 U.S. cities,* week endingAugust 12, 2000 (32nd Week)
�65 45-64 25-44 1-24 <1Reporting Area
All Causes, By Age (Years)
AllAges
P&I†
Total������65 45-64 25-44 1-24 <1
Reporting Area
All Causes, By Age (Years)
AllAges
P&I†
Total
NEW ENGLAND 495 370 70 30 16 9 39Boston, Mass. 161 115 20 12 10 4 12Bridgeport, Conn. 33 23 8 2 - - 2Cambridge, Mass. 14 13 1 - - - 2Fall River, Mass. 34 31 2 1 - - -Hartford, Conn. 46 29 9 3 3 2 2Lowell, Mass. 25 24 - 1 - - 1Lynn, Mass. 8 5 2 1 - - -New Bedford, Mass. 21 19 2 - - - 2New Haven, Conn. 27 19 4 2 2 - 4Providence, R.I. 11 7 1 1 - 2 3Somerville, Mass. 4 2 1 - - 1 -Springfield, Mass. 34 19 11 3 1 - 3Waterbury, Conn. 23 19 3 1 - - 3Worcester, Mass. 54 45 6 3 - - 5
MID. ATLANTIC 2,136 1,479 401 178 39 37 91Albany, N.Y. 53 41 8 2 - 2 3Allentown, Pa. U U U U U U UBuffalo, N.Y. 91 62 12 13 2 2 5Camden, N.J. 20 13 3 4 - - 2Elizabeth, N.J. 22 18 2 - 1 1 -Erie, Pa.§ 41 32 6 3 - - 5Jersey City, N.J. 33 25 4 2 1 1 -New York City, N.Y. 1,065 722 222 82 19 18 34Newark, N.J. 44 24 14 3 2 1 -Paterson, N.J. 15 8 6 1 - - -Philadelphia, Pa. 385 253 72 44 9 7 12Pittsburgh, Pa.§ 44 32 9 2 1 - 1Reading, Pa. 29 27 1 - - 1 5Rochester, N.Y. 141 116 18 6 1 - 14Schenectady, N.Y. 26 21 4 1 - - 1Scranton, Pa.§ 24 16 4 4 - - 2Syracuse, N.Y. 64 42 12 5 3 2 5Trenton, N.J. 24 16 3 3 - 2 1Utica, N.Y. 15 11 1 3 - - 1Yonkers, N.Y. U U U U U U U
E.N. CENTRAL 2,104 1,409 451 141 50 50 157Akron, Ohio 50 30 9 6 2 3 2Canton, Ohio 39 28 7 2 1 1 6Chicago, Ill. 436 252 110 48 14 9 46Cincinnati, Ohio 59 37 12 6 2 2 3Cleveland, Ohio 167 104 43 8 5 7 2Columbus, Ohio 173 113 46 7 1 6 9Dayton, Ohio 130 98 29 1 1 1 10Detroit, Mich. 191 113 53 17 4 4 18Evansville, Ind. 43 31 9 2 1 - 3Fort Wayne, Ind. 54 45 2 4 2 1 5Gary, Ind. 16 10 3 1 2 - -Grand Rapids, Mich. 72 52 7 5 3 5 11Indianapolis, Ind. 170 125 33 6 3 3 10Lansing, Mich. 58 42 11 4 1 - 6Milwaukee, Wis. 139 94 30 8 5 2 10Peoria, Ill. 61 48 8 3 - 2 4Rockford, Ill. 45 27 12 3 1 2 2South Bend, Ind. 48 38 7 2 - 1 1Toledo, Ohio 88 74 9 3 1 1 8Youngstown, Ohio 65 48 11 5 1 - 1
W.N. CENTRAL 666 488 99 46 16 17 36Des Moines, Iowa U U U U U U UDuluth, Minn. 17 15 - 1 - 1 1Kansas City, Kans. 28 17 8 2 1 - 5Kansas City, Mo. 84 61 11 9 2 1 4Lincoln, Nebr. 42 36 2 3 - 1 1Minneapolis, Minn. 163 126 20 12 2 3 5Omaha, Nebr. 83 53 19 1 4 6 9St. Louis, Mo. 93 60 16 12 5 - -St. Paul, Minn. 87 65 17 3 2 - 7Wichita, Kans. 69 55 6 3 - 5 4
S. ATLANTIC 1,050 657 228 108 28 27 76Atlanta, Ga. U U U U U U UBaltimore, Md. 196 110 47 31 6 2 13Charlotte, N.C. 97 58 20 11 4 4 6Jacksonville, Fla. 117 70 33 10 - 4 7Miami, Fla. 113 69 22 17 3 - 11Norfolk, Va. 42 26 8 3 2 3 2Richmond, Va. 67 41 11 8 3 4 4Savannah, Ga. 62 40 13 5 1 3 12St. Petersburg, Fla. 59 41 12 1 4 1 4Tampa, Fla. 169 119 35 11 2 2 16Washington, D.C. 100 55 27 11 3 4 1Wilmington, Del. 28 28 - - - - -
E.S. CENTRAL 850 562 183 63 27 15 42Birmingham, Ala. 173 113 39 12 6 3 9Chattanooga, Tenn. 84 66 13 2 3 - 4Knoxville, Tenn. 111 70 25 12 1 3 5Lexington, Ky. 38 30 7 1 - - 3Memphis, Tenn. 208 135 48 18 3 4 13Mobile, Ala. 69 45 14 3 6 1 1Montgomery, Ala. 52 32 15 3 1 1 -Nashville, Tenn. 115 71 22 12 7 3 7
W.S. CENTRAL 1,431 917 313 115 51 35 103Austin, Tex. 77 49 13 9 4 2 3Baton Rouge, La. 59 35 14 6 3 1 2Corpus Christi, Tex. 70 39 22 5 3 1 7Dallas, Tex. 212 126 45 17 10 14 8El Paso, Tex. 68 42 18 5 - 3 3Ft. Worth, Tex. 97 65 18 6 5 3 15Houston, Tex. 420 262 97 42 15 4 35Little Rock, Ark. 74 52 8 6 5 3 3New Orleans, La. U U U U U U USan Antonio, Tex. 166 117 34 8 6 1 11Shreveport, La. 66 49 11 5 - 1 8Tulsa, Okla. 122 81 33 6 - 2 8
MOUNTAIN 944 636 183 84 24 15 49Albuquerque, N.M. 97 68 16 9 4 - 7Boise, Idaho 42 28 10 2 1 1 1Colo. Springs, Colo. 49 37 8 2 1 1 4Denver, Colo. 94 60 20 11 2 1 5Las Vegas, Nev. 200 125 48 21 3 2 15Ogden, Utah 29 21 4 3 - 1 2Phoenix, Ariz. 154 101 27 18 4 4 -Pueblo, Colo. 33 24 7 2 - - 1Salt Lake City, Utah 119 78 17 14 5 5 9Tucson, Ariz. 127 94 26 2 4 - 5
PACIFIC 1,469 1,027 229 93 33 27 145Berkeley, Calif. 22 16 3 3 - - 1Fresno, Calif. 99 79 15 1 2 2 5Glendale, Calif. 7 5 2 - - - 1Honolulu, Hawaii 84 57 17 7 1 2 10Long Beach, Calif. 68 56 9 2 1 - 9Los Angeles, Calif. 231 154 40 26 8 3 15Pasadena, Calif. 31 22 3 3 - 3 7Portland, Oreg. 71 47 14 4 5 1 4Sacramento, Calif. 201 120 13 2 4 3 22San Diego, Calif. 162 114 29 12 2 5 15San Francisco, Calif. U U U U U U USan Jose, Calif. 196 145 31 14 3 3 34Santa Cruz, Calif. 32 27 5 - - - 3Seattle, Wash. 100 69 16 9 4 2 7Spokane, Wash. 58 42 10 4 1 1 3Tacoma, Wash. 107 74 22 6 2 2 9
TOTAL 11,145¶ 7,545 2,157 858 284 232 738
U: Unavailable. -:No reported cases.*Mortality data in this table are voluntarily reported from 122 cities in the United States, most of which have populations of �100,000. Adeath is reported by the place of its occurrence and by the week that the death certificate was filed. Fetal deaths are not included.
†Pneumonia and influenza.§Because of changes in reporting methods in this Pennsylvania city, these numbers are partial counts for the current week. Complete countswill be available in 4 to 6 weeks.
¶Total includes unknown ages.
Vol. 49 / No. 32 MMWR 747
Contributors to the Production of the MMWR (Weekly)
Weekly Notifiable Disease Morbidity Data and 122 Cities Mortality Data
Samuel L. Groseclose, D.V.M., M.P.H.
State Support Team CDC Operations TeamRobert Fagan Carol M. KnowlesJose Aponte Deborah A. AdamsGerald Jones Willie J. AndersonDavid Nitschke Patsy A. HallScott Noldy Suzette Park
Felicia PerryPearl SharpCarol A. Worsham
InformaticsT. Demetri Vacalis, Ph.D.
Michele D. Renshaw Erica R. Shaver
The Morbidity and Mortality Weekly Report (MMWR) Series is prepared by the Centers for Disease Control andPrevention (CDC) and is available free of charge in electronic format and on a paid subscription basis for papercopy. To receive an electronic copy on Friday of each week, send an e-mail message to [email protected] body content should read SUBscribe mmwr-toc. Electronic copy also is available from CDC’s World-Wide Webserver at http://www.cdc.gov/ or from CDC’s file transfer protocol server at ftp.cdc.gov. To subscribe for papercopy, contact Superintendent of Documents, U.S. Government Printing Office, Washington, DC 20402; telephone(202) 512-1800.
Data in the weekly MMWR are provisional, based on weekly reports to CDC by state health departments. Thereporting week concludes at close of business on Friday; compiled data on a national basis are officially releasedto the public on the following Friday. Address inquiries about the MMWR Series, including material to beconsidered for publication, to: Editor, MMWR Series, Mailstop C-08, CDC, 1600 Clifton Rd., N.E., Atlanta, GA30333; telephone (888) 232-3228.
All material in the MMWR Series is in the public domain and may be used and reprinted without permission;citation as to source, however, is appreciated.
IU.S. Government Printing Office: 2000-533-206/28032 Region IV
Director, Centers for DiseaseControl and Prevention
Jeffrey P. Koplan, M.D., M.P.H.
Deputy Director for Science andPublic Health, Centers for DiseaseControl and Prevention
David W. Fleming, M.D.
Acting Director,Epidemiology Program Office
Barbara R. Holloway, M.P.H.
Editor, MMWR SeriesJohn W. Ward, M.D.
Acting Managing Editor, MMWR(Weekly)
Teresa F. Rutledge
Writers-Editors, MMWR (Weekly)Jill CraneDavid C. Johnson
Desktop PublishingMichael T. BrownLynda G. CupellMorie M. Higgins
748 MMWR August 18, 2000