Embed Size (px)
Citation preview

Update #1 on water quality monitoring in the Edward-Wakool system
Robyn Watts and Julia Howitt, Institute for Land, Water and Society Charles Sturt University, 11/3/2016
Water moving through Yallakool regulator 8/3/16 (Photo: R Watts)
Stevens Weir 8/3/16 (Photo R. Watts)

Monitoring sites
Water quality will be monitored at the following sites (see Figures 1 and 2) over 6 weeks between
1st March and 5th April 2016:
1. Yallakool Creek, LTIM zone 1 site 2 (Hopwood)
2. Yallakool Creek, LTIM zone 1 site 7 (Windra Vale)
3. Upper Wakool River, LTIM zone 2 site 2 (Yaloke)
4. Upper Wakool River, LTIM zone 2 site 6 (Widgee 1)
5. Mid Wakool River, LTIM zone 3 site 2 (Tralee)
6. Mid Wakool River, LTIM zone 3 site 10 (Llanos Park)
7. Mid Wakool River, LTIM zone 4 site 1 (Barham Bridge)
8. Mid Wakool River, LTIM zone 4 site 6, (Noorong 2)
9. Mid Wakool River, LTIM zone 5 site 2 (Gee Gee Bridge)
10. Colligen Creek, Murray LLS aquatic veg project sample site 1 (Bowen Park)
11. Colligen Creek, Murray LLS aquatic veg project sample site 4 (Werai station)
12. Mulwala canal, LTIM zone 21 site 1 (canal 1)
13. Edward River, LTIM zone 20 site 2 (Stevens Weir)
14. Niemur River, at Mallan School (not shown on map, but is upstream of zone 10 site 1)(will be
sampled weeks 3 to 6)
Figure 1. Edward-Wakool Long term Intervention Monitoring sites

Figure 2. Monitoring sites for aquatic vegetation in Colligen Creek. Water quality will be sampled at
sites 1 and 4.
Parameters sampled
Spot water quality: temperature (oC), electrical conductivity (mS/cm), dissolved oxygen (mg/L, %),
pH, and turbidity (NTU).
Hydrological data: available through automated gauging stations 409020 Yallakool Creek @ Offtake,
409019 Wakool River offtake regulator, 409045 Wakool River at Wakool-Barham Road, 409024
Colligen Creek regulator, 409062 Wakool River Gee Gee Bridge, 409086 Niemur at Mallan School.
Loggers: temperature and dissolved oxygen are being logged at eight sites: Hopwood, Windra Vale,
Yaloke, Widgee 2, Tralee, Llanos Park, Barham Bridge, Noorong 2. The data from these loggers is not
available instantaneously, and has to be manually downloaded.
Water samples:
Dissolved Organic Carbon (DOC)
Nutrients (Ammonia (NH4+), filtered reactive phosphorus (FRP), dissolved nitrate + nitrite
(NOx), Total Nitrogen (TN) and Total Phosphorus (TP)
Absorbance and fluorescence spectroscopy for organic matter characterisation
Total algae
Chlorophyll-a

Results
Samples from weeks one and two are being processed. Some preliminary results are presented here.
The algal bloom was evident at most of the monitoring sites. It had not reached the upper Wakool
River zone 2 site 4 on 3/3/16 (Figure 3) but it was very evident at Widgee on 8/3/16 (Figure 4). The
algal bloom had not evident Gee Gee Bridge on 7/3/16 (Figure 5), but it was present in zone 4
upstream of Gee Gee Bridge, so appears to be working its way downstream.
Figure 3. No algae evident at the upper Wakool River at zone 2 ‘Widgee’ 3/3/16 (Photo N. McCasker)
Figure 4. Algae very evident at the Upper Wakool River at zone 2 ‘Widgee’ 8/3/16 (Photo R. Watts)
Figure 5. Mid Wakool River at Gee Gee Bridge 7/3/16 (Photo: R. Watts)
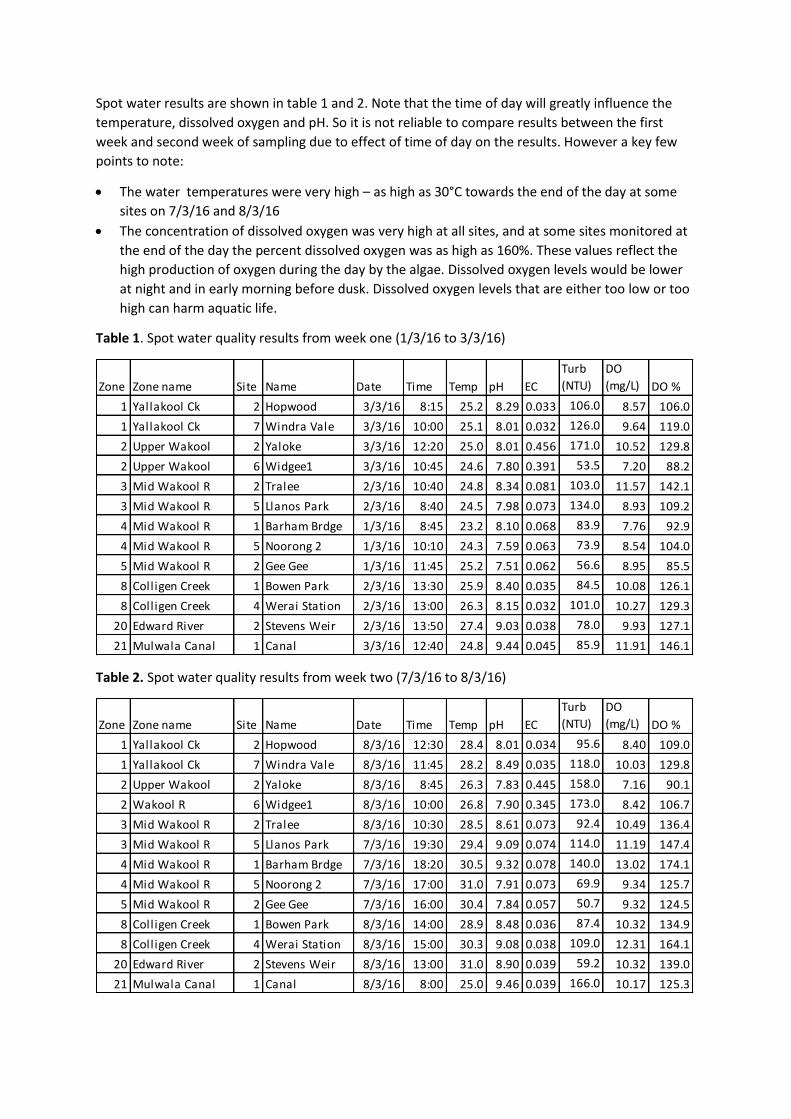
Spot water results are shown in table 1 and 2. Note that the time of day will greatly influence the
temperature, dissolved oxygen and pH. So it is not reliable to compare results between the first
week and second week of sampling due to effect of time of day on the results. However a key few
points to note:
The water temperatures were very high – as high as 30°C towards the end of the day at some
sites on 7/3/16 and 8/3/16
The concentration of dissolved oxygen was very high at all sites, and at some sites monitored at
the end of the day the percent dissolved oxygen was as high as 160%. These values reflect the
high production of oxygen during the day by the algae. Dissolved oxygen levels would be lower
at night and in early morning before dusk. Dissolved oxygen levels that are either too low or too
high can harm aquatic life.
Table 1. Spot water quality results from week one (1/3/16 to 3/3/16)
Table 2. Spot water quality results from week two (7/3/16 to 8/3/16)
Zone Zone name Site Name Date Time Temp pH EC
Turb
(NTU)
DO
(mg/L) DO %
1 Yallakool Ck 2 Hopwood 3/3/16 8:15 25.2 8.29 0.033 106.0 8.57 106.0
1 Yallakool Ck 7 Windra Vale 3/3/16 10:00 25.1 8.01 0.032 126.0 9.64 119.0
2 Upper Wakool 2 Yaloke 3/3/16 12:20 25.0 8.01 0.456 171.0 10.52 129.8
2 Upper Wakool 6 Widgee1 3/3/16 10:45 24.6 7.80 0.391 53.5 7.20 88.2
3 Mid Wakool R 2 Tralee 2/3/16 10:40 24.8 8.34 0.081 103.0 11.57 142.1
3 Mid Wakool R 5 Llanos Park 2/3/16 8:40 24.5 7.98 0.073 134.0 8.93 109.2
4 Mid Wakool R 1 Barham Brdge 1/3/16 8:45 23.2 8.10 0.068 83.9 7.76 92.9
4 Mid Wakool R 5 Noorong 2 1/3/16 10:10 24.3 7.59 0.063 73.9 8.54 104.0
5 Mid Wakool R 2 Gee Gee 1/3/16 11:45 25.2 7.51 0.062 56.6 8.95 85.5
8 Colligen Creek 1 Bowen Park 2/3/16 13:30 25.9 8.40 0.035 84.5 10.08 126.1
8 Colligen Creek 4 Werai Station 2/3/16 13:00 26.3 8.15 0.032 101.0 10.27 129.3
20 Edward River 2 Stevens Weir 2/3/16 13:50 27.4 9.03 0.038 78.0 9.93 127.1
21 Mulwala Canal 1 Canal 3/3/16 12:40 24.8 9.44 0.045 85.9 11.91 146.1
Zone Zone name Site Name Date Time Temp pH EC
Turb
(NTU)
DO
(mg/L) DO %
1 Yallakool Ck 2 Hopwood 8/3/16 12:30 28.4 8.01 0.034 95.6 8.40 109.0
1 Yallakool Ck 7 Windra Vale 8/3/16 11:45 28.2 8.49 0.035 118.0 10.03 129.8
2 Upper Wakool 2 Yaloke 8/3/16 8:45 26.3 7.83 0.445 158.0 7.16 90.1
2 Wakool R 6 Widgee1 8/3/16 10:00 26.8 7.90 0.345 173.0 8.42 106.7
3 Mid Wakool R 2 Tralee 8/3/16 10:30 28.5 8.61 0.073 92.4 10.49 136.4
3 Mid Wakool R 5 Llanos Park 7/3/16 19:30 29.4 9.09 0.074 114.0 11.19 147.4
4 Mid Wakool R 1 Barham Brdge 7/3/16 18:20 30.5 9.32 0.078 140.0 13.02 174.1
4 Mid Wakool R 5 Noorong 2 7/3/16 17:00 31.0 7.91 0.073 69.9 9.34 125.7
5 Mid Wakool R 2 Gee Gee 7/3/16 16:00 30.4 7.84 0.057 50.7 9.32 124.5
8 Colligen Creek 1 Bowen Park 8/3/16 14:00 28.9 8.48 0.036 87.4 10.32 134.9
8 Colligen Creek 4 Werai Station 8/3/16 15:00 30.3 9.08 0.038 109.0 12.31 164.1
20 Edward River 2 Stevens Weir 8/3/16 13:00 31.0 8.90 0.039 59.2 10.32 139.0
21 Mulwala Canal 1 Canal 8/3/16 8:00 25.0 9.46 0.039 166.0 10.17 125.3
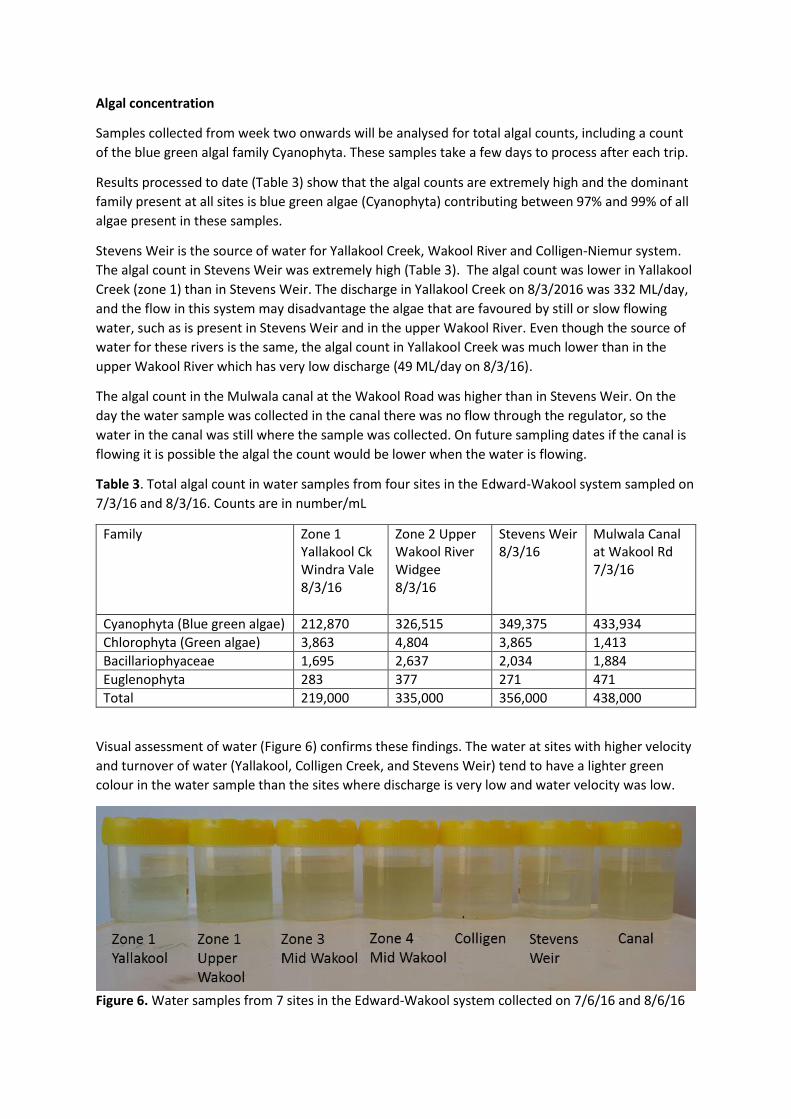
Algal concentration
Samples collected from week two onwards will be analysed for total algal counts, including a count
of the blue green algal family Cyanophyta. These samples take a few days to process after each trip.
Results processed to date (Table 3) show that the algal counts are extremely high and the dominant
family present at all sites is blue green algae (Cyanophyta) contributing between 97% and 99% of all
algae present in these samples.
Stevens Weir is the source of water for Yallakool Creek, Wakool River and Colligen-Niemur system.
The algal count in Stevens Weir was extremely high (Table 3). The algal count was lower in Yallakool
Creek (zone 1) than in Stevens Weir. The discharge in Yallakool Creek on 8/3/2016 was 332 ML/day,
and the flow in this system may disadvantage the algae that are favoured by still or slow flowing
water, such as is present in Stevens Weir and in the upper Wakool River. Even though the source of
water for these rivers is the same, the algal count in Yallakool Creek was much lower than in the
upper Wakool River which has very low discharge (49 ML/day on 8/3/16).
The algal count in the Mulwala canal at the Wakool Road was higher than in Stevens Weir. On the
day the water sample was collected in the canal there was no flow through the regulator, so the
water in the canal was still where the sample was collected. On future sampling dates if the canal is
flowing it is possible the algal the count would be lower when the water is flowing.
Table 3. Total algal count in water samples from four sites in the Edward-Wakool system sampled on
7/3/16 and 8/3/16. Counts are in number/mL
Family Zone 1 Yallakool Ck Windra Vale 8/3/16
Zone 2 Upper Wakool River Widgee 8/3/16
Stevens Weir 8/3/16
Mulwala Canal at Wakool Rd 7/3/16
Cyanophyta (Blue green algae) 212,870 326,515 349,375 433,934
Chlorophyta (Green algae) 3,863 4,804 3,865 1,413
Bacillariophyaceae 1,695 2,637 2,034 1,884
Euglenophyta 283 377 271 471
Total 219,000 335,000 356,000 438,000
Visual assessment of water (Figure 6) confirms these findings. The water at sites with higher velocity
and turnover of water (Yallakool, Colligen Creek, and Stevens Weir) tend to have a lighter green
colour in the water sample than the sites where discharge is very low and water velocity was low.
Figure 6. Water samples from 7 sites in the Edward-Wakool system collected on 7/6/16 and 8/6/16

A very preliminary analysis of the absorbance data for the study sites in February and March
suggests that the algal bloom has not resulted in substantial increases in dissolved organic carbon at
this time (Figure 7). Profiles for all sites in March were similar to those in February prior to the algal
bloom. Fluorescence analysis is more sensitive to changes in carbon composition and analysis of this
data is ongoing. Data for Stevens Weir (Figure 8) suggests a very slight increase in carbon on 8/3/16
but the overall signal remains low and within the expected range for this system at this time of year.
Figure 7. Absorbance scans representing two study sites in each zone, plus source waters in
February and March 2016.
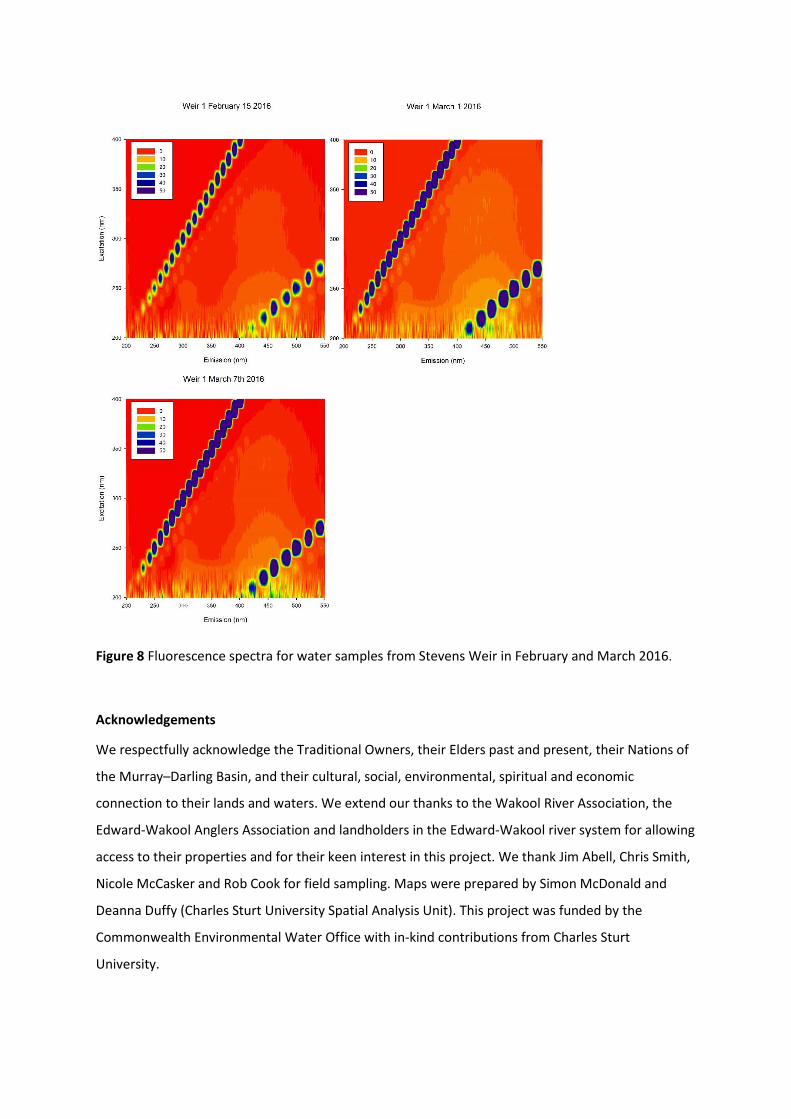
Figure 8 Fluorescence spectra for water samples from Stevens Weir in February and March 2016.
Acknowledgements
We respectfully acknowledge the Traditional Owners, their Elders past and present, their Nations of
the Murray–Darling Basin, and their cultural, social, environmental, spiritual and economic
connection to their lands and waters. We extend our thanks to the Wakool River Association, the
Edward-Wakool Anglers Association and landholders in the Edward-Wakool river system for allowing
access to their properties and for their keen interest in this project. We thank Jim Abell, Chris Smith,
Nicole McCasker and Rob Cook for field sampling. Maps were prepared by Simon McDonald and
Deanna Duffy (Charles Sturt University Spatial Analysis Unit). This project was funded by the
Commonwealth Environmental Water Office with in-kind contributions from Charles Sturt
University.