Embed Size (px)
Citation preview
Unsupervised classification of skeletal fibers using
diffusion maps
Radhouene Neji, Georg Langs, Jean-Francois Deux, Mezri Maatoouk, Alain
Rahmouni, Guillaume Bassez, Gilles Fleury, Nikolaos Paragios
To cite this version:
Radhouene Neji, Georg Langs, Jean-Francois Deux, Mezri Maatoouk, Alain Rahmouni, etal.. Unsupervised classification of skeletal fibers using diffusion maps. IEEE InternationalSymposium on Biomedical Imaging : from Nano to Macro, Jun 2009, Boston, United States.pp.410-413, 2009. <hal-00424543>
HAL Id: hal-00424543
https://hal-supelec.archives-ouvertes.fr/hal-00424543
Submitted on 16 Oct 2009
HAL is a multi-disciplinary open accessarchive for the deposit and dissemination of sci-entific research documents, whether they are pub-lished or not. The documents may come fromteaching and research institutions in France orabroad, or from public or private research centers.
L’archive ouverte pluridisciplinaire HAL, estdestinee au depot et a la diffusion de documentsscientifiques de niveau recherche, publies ou non,emanant des etablissements d’enseignement et derecherche francais ou etrangers, des laboratoirespublics ou prives.
UNSUPERVISED CLASSIFICATION OF SKELETAL FIBERS USING DIFFUSION MAPS
R. Neji1,2,3, G.Langs4, J-F. Deux5, M. Maatouk5, A. Rahmouni5, G. Bassez5, G. Fleury3, N. Paragios1,2
1Laboratoire MAS, Ecole Centrale Paris, Chatenay-Malabry, France2Equipe GALEN, INRIA Saclay -Ile-de-France, Orsay, France
3Departement SSE, Ecole Superieure d’Electricite, Gif-sur-Yvette, France4CIR lab, Department of Radiology, Medical University of Vienna, Vienna, Austria
5Centre Hospitalier Universitaire Henri Mondor, Creteil, France
ABSTRACT
In this paper, we propose an application of diffusion maps tofiber tract clustering in the human skeletal muscle. To thisend, we define a metric between fiber tracts that encompassesboth diffusion and localization information. This metric is in-corporated in the diffusion maps framework and clustering isdone in the embedding space using k-means. Experimentalvalidation of the method is performed over a dataset of dif-fusion tensor images of the calf muscle of thirty subjects andcomparison is done with respect to ground-truth segmentationprovided by an expert.
Index Terms— DTI, Fibers, Diffusion Maps, Fiber Met-rics, Human Skeletal Muscle
1. INTRODUCTION
Myopathies are neuromuscular diseases that result in a dis-order in the muscoskeletal system of the human body whosesymptoms are an atrophy and weakness of the muscles. Theyconcern a significant part of the population: for instance, theyaffect 4 to 6 % of the European population (25 to 30 millionpersons). It is therefore important to harness the potentialof emerging modalities like diffusion tensor imaging (DTI)to extract information about the impact of these diseases onthe fiber architecture within the human skeletal muscle and toprovide an assessment of the condition of a patient. A pre-liminary step towards this analysis is to classify the fibersob-tained from DTI in anatomically coherent fiber bundles.
While DTI studies of the skeletal muscle [1, 2] focusedon the evaluation of scalar values derived from DTI imageslike trace, fractional anisotropy and pennation angles, fibersegmentation has attracted less attention than in the studyofhuman brain white matter, where a rich literature of unsuper-vised classification methods was proposed. For instance, themethod presented in [3] introduced manifold learning tech-niques in the area of fiber bundling by relying on LaplacianEigenmaps. In [4], spectral clustering along with the Haus-dorff distance between fibers is considered. In [5], another
manifold learning technique is proposed based on a graph-based distance that captures local and global dissimilaritiesbetween curves and uses Locally Linear Embedding for clus-tering of the tracts. In [6], the Expectation-Maximizational-gorithm is used by considering Gamma distributions on thedistance maps between fibers and cluster centers. The methodproposed in [7] considers medoid-shift clustering combinedwith an Isomap-like manifold learning and suggested to in-clude prior knowledge in the segmentation process using awhite matter fiber atlas. Mean-shift was also used in [8] whereeach fiber is first embedded in a high dimensional space us-ing its sequence of points, and adaptive mean-shift clusteringwas applied. A differential-geometric approach was recentlyproposed in [9] where clustering was done recursively usinga consistency measure between fibers.
In this paper, we propose the combination of diffusionmaps with a metric defined in the fiber domain to cluster thefibers of the human skeletal muscle. Diffusion maps wereused for Orientation Distribution Function (ODF) segmenta-tion in Q-ball images in [10], where spatial coherence was im-posed using the Markovian relaxation of the affinity matrix.However the fiber domain provides no straightforward spa-tial neighborhood relationships like those given by the near-est neighbors in the 3D image grid. In the definition of themetric, we show how to impose spatial coherence in the fiberdomain, while taking into account the information providedby the tensor field. The metric is used in the diffusion mapsframework along with the k-means algorithm in the embed-ding space for clustering purposes. We build upon the methodwe proposed in [11], where we suggested an approach basedon kernel principal component analysis for fiber clustering. Inthis work, diffusion maps are used to better reflect the mani-fold structure of the fiber tracts.
2. DIFFUSION MAPS
Diffusion maps [12] are a spectral embedding of a setX ofn nodes, for whichlocal geometriesare defined by a kernelk : X × X → R. The kernelk satisfiesk(x, y) ≥ 0, and
k(x, y) = k(y, x). This kernel can be interpreted as anaffin-ity between nodes. The resulting graph (an edge betweenx
and y carries the weightsk(x, y)) can be transformed intoa reversible Markov chain by the socalled normalized graphLaplacian construction. A related construction was used in[13] to define a geometry on a set of observations, or trajec-tories. We define
s(x) =∑
y
k(x, y) and p(x, y) =k(x, y)
s(x). (1)
This new kernel is no longer symmetric, but it satisfies
∀x,∑
y
p(x, y) = 1. (2)
Therefore it can be interpreted as the probability of the tran-sition from node x to node y in one time step, or atransitionkernelof a Markov chain. It gives a diffusion operator
Pf(x) =∑
a(x, y)f(y)dµ(y), (3)
P is the Markov matrix with the entriesp(x, y) and its pow-ersP τ allow to propagate information through the Markovchain inτ timesteps according to the transition kernels. TheoperatorP defines a geometry which can be mapped to anEuclidean geometry by an eigenvalue decomposition ofP .The latter results in a sequence of eigenvaluesλ1, λ2 . . . andcorresponding eigenfunctionsΨ1,Ψ2, . . . that fulfill PΨi =λiΨi. The diffusion map afterτ timestepsΨτ : X → Rw
embeds each nodei = 1, . . . , n in the Markov chain into awdimensional Euclidean space where the clustering of the datapoints can be done using k-means
i 7→ Ψτ (i) ,
λτ1Ψ1(i)
λτ2Ψ2(i)
...λτ
wΨw(i)
(4)
A common choice for the kernelk(., .) is the Gaussian kernel,
i.e. k(x, y) = exp(−d2(x,y)
2σ2
), whered is a distance over the
setX andσ a scale factor. Therefore, in order to apply thediffusion maps to fiber tracts, we define in the following ametric over the fiber domain.
3. A METRIC BETWEEN FIBER TRACTS
Instead of considering a fiber tract as a set of points, we willview it as a set of Gaussian probability distributions. Indeed,this viewpoint is justified by the fact that tractography is basedon the integration of the field of principal directions of diffu-sion when the tensor field is assumed to be continuous (bymeans of interpolation). Therefore the tensor informationcanbe kept along with the spatial positions obtained by tractogra-phy. So one can consider that each fiber tractF is represented
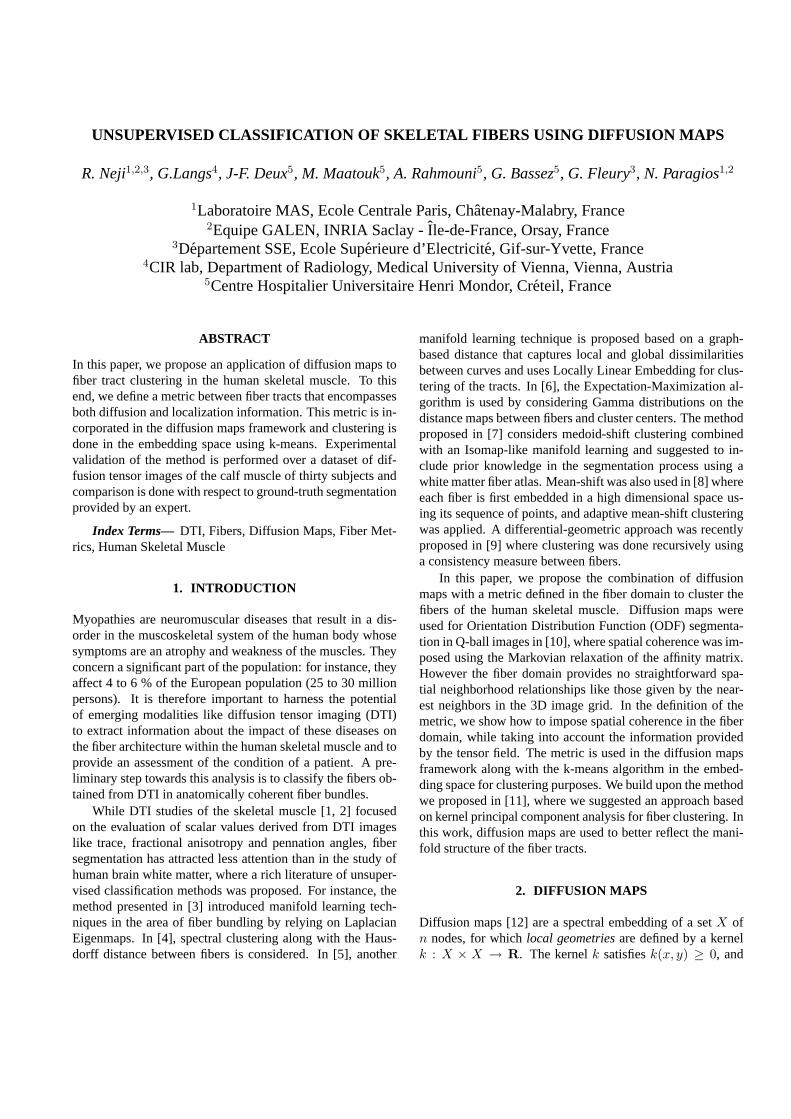
Fig. 1. An axial slice of a high-resolution T1-weighted imageshowing a manual segmentation of the calf muscle in sevengroups
Sigma = 0.5, k = 7 Sigma = 1, k = 7 Sigma = 0.5, k =10 Sigma =1, k =10
0.7
0.72
0.74
0.76
0.78
0.8
0.82
0.84
0.86
0.88
0.9
Dic
e co
effi
cien
ts
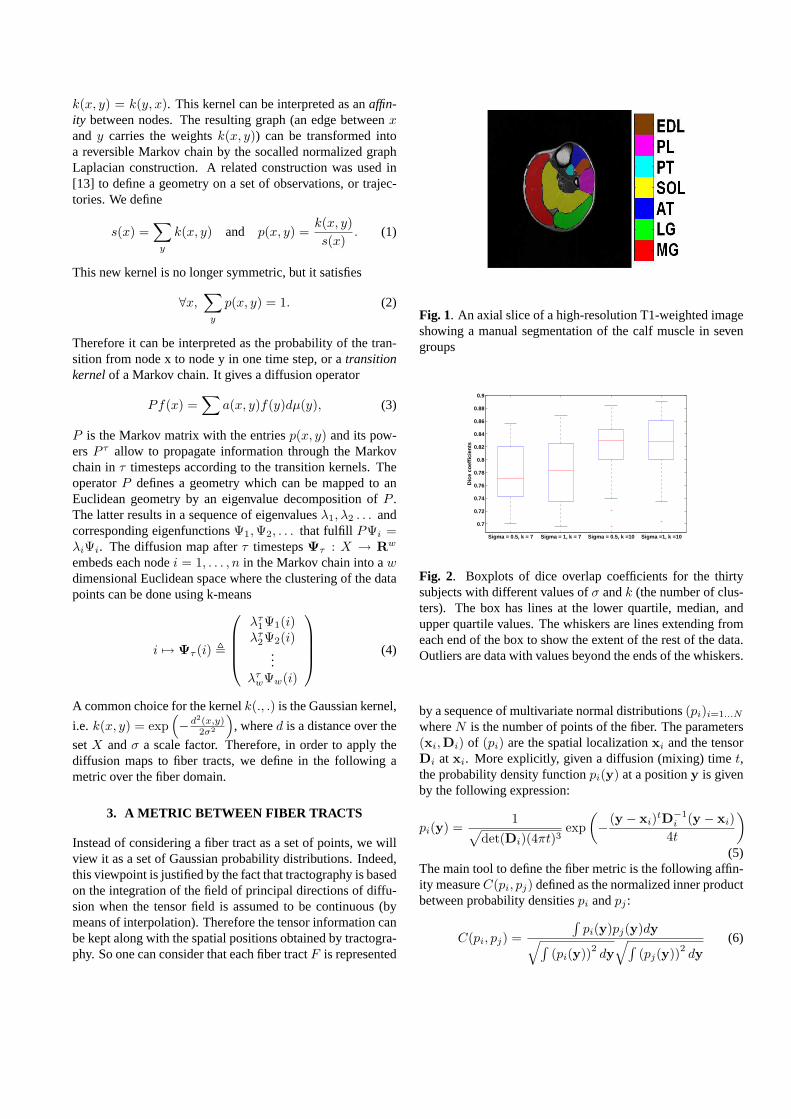
Fig. 2. Boxplots of dice overlap coefficients for the thirtysubjects with different values ofσ andk (the number of clus-ters). The box has lines at the lower quartile, median, andupper quartile values. The whiskers are lines extending fromeach end of the box to show the extent of the rest of the data.Outliers are data with values beyond the ends of the whiskers.
by a sequence of multivariate normal distributions(pi)i=1...N
whereN is the number of points of the fiber. The parameters(xi,Di) of (pi) are the spatial localizationxi and the tensorDi at xi. More explicitly, given a diffusion (mixing) timet,the probability density functionpi(y) at a positiony is givenby the following expression:
pi(y) =1√
det(Di)(4πt)3exp
(− (y − xi)
tD−1i (y − xi)
4t
)
(5)The main tool to define the fiber metric is the following affin-ity measureC(pi, pj) defined as the normalized inner productbetween probability densitiespi andpj :
C(pi, pj) =
∫pi(y)pj(y)dy√∫
(pi(y))2dy
√∫(pj(y))
2dy
(6)
Let us now consider two fiber tractsF1 andF2 represented bya set of probability densities(pi)i=1...N1
(resp. (pi)i=1...N2,
whereN1 (resp. N2) is the number of points ofF1 (resp.F2). The affinity between probability densities in (6) admitsa straightforward generalization to the fiber domain to obtaina similarity measureC(F1,F2) as follows:
C(F1,F2) =1
N1
1
N2
N1∑
i=1
N2∑
j=1
C(pi, pj) (7)
One can therefore derive the following metricd betweenfibers:
d(F1,F2) =
√√√√2 − 2C(F1,F2)√
C(F1,F1)
√C(F2,F2)
(8)
It turns out thatd(F1,F2) has an explicit expression. Indeed,one can show (computations are omitted) that we can derivea closed form expression ofC(pi, pj) for multivariate normaldistributions:
C(pi, pj) = 2√
2det(Di)
1
4 det(Dj)1
4
√det(Di + Dj)
×
exp
(− 1
4t(xi − xj)
t(Di + Dj)−1(xi − xj)
)(9)
The computation of the metricd(F1,F2) between fibers isstraightforward using (7) and (8). Note how this formulationprovides a natural way to take spatial relationships into ac-count while keeping the information provided by the tensorfield.
4. EXPERIMENTS AND RESULTS
Thirty subjects (twenty healthy subjects and ten patients af-fected by myopathies) underwent a diffusion tensor imagingof the calf muscle using a 1.5 T MRI scanner. The fol-lowing acquisition parameters were used : repetition time(TR)= 3600 ms, echo time (TE) =70 ms, slice thickness= 7 mm and ab value of 700 s.mm−2 with 12 gradientdirections and 13 repetitions. The size of the obtained vol-umes is64 × 64 × 20 voxels with a voxel resolution of3.125mm×3.125mm×7mm. We acquired simultaneouslyhigh-resolution T1-weighted images that were segmentedmanually by an expert into seven muscle groups to providethe ground truth. To give an idea about the muscle architec-ture in the calf, we present in [Fig.1] a manual segmentationoverlaid on an axial slice of a high-resolution T1-weightedimage. The following muscle groups are considered: thesoleus (SOL), lateral gastrocnemius (LG), medial gastroc-nemius (MG), posterior tibialis (PT), anterior tibialis (AT),extensor digitorum longus (EDL), and the peroneus longus(PL). We manually delineated a region of interest (ROI) for
(a) (b)
(c) (d)
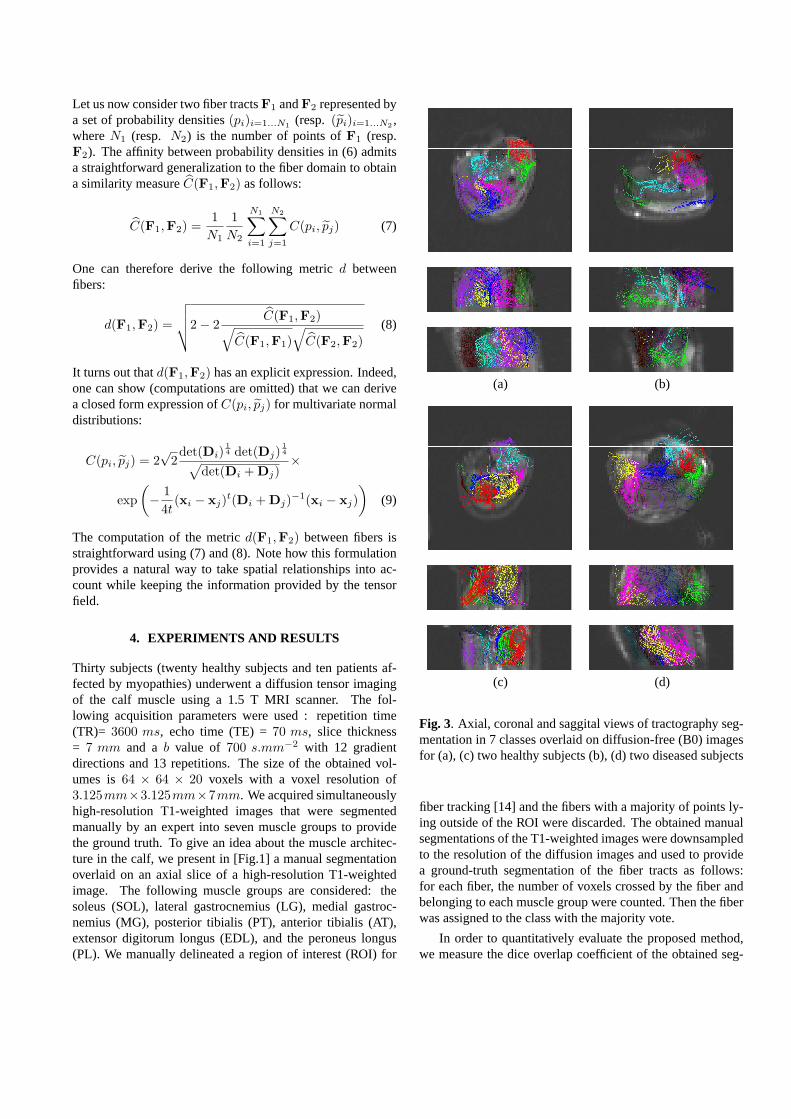
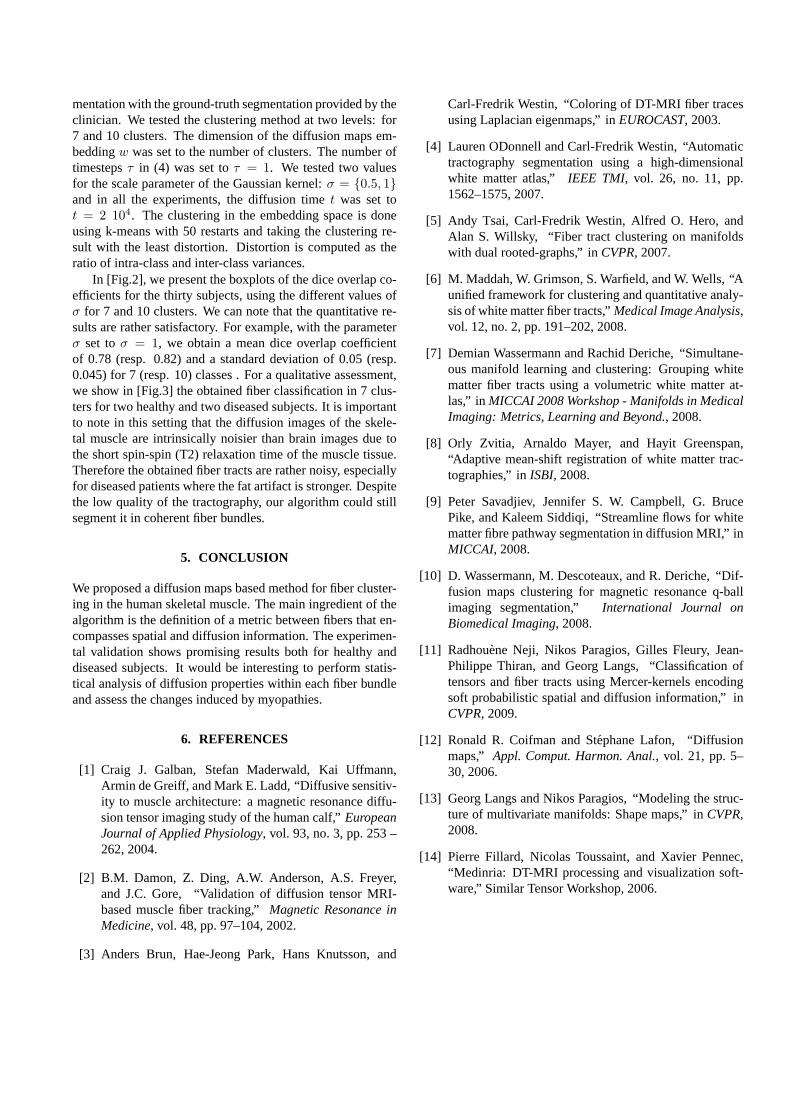
Fig. 3. Axial, coronal and saggital views of tractography seg-mentation in 7 classes overlaid on diffusion-free (B0) imagesfor (a), (c) two healthy subjects (b), (d) two diseased subjects
fiber tracking [14] and the fibers with a majority of points ly-ing outside of the ROI were discarded. The obtained manualsegmentations of the T1-weighted images were downsampledto the resolution of the diffusion images and used to providea ground-truth segmentation of the fiber tracts as follows:for each fiber, the number of voxels crossed by the fiber andbelonging to each muscle group were counted. Then the fiberwas assigned to the class with the majority vote.
In order to quantitatively evaluate the proposed method,we measure the dice overlap coefficient of the obtained seg-
mentation with the ground-truth segmentation provided by theclinician. We tested the clustering method at two levels: for7 and 10 clusters. The dimension of the diffusion maps em-beddingw was set to the number of clusters. The number oftimestepsτ in (4) was set toτ = 1. We tested two valuesfor the scale parameter of the Gaussian kernel:σ = {0.5, 1}and in all the experiments, the diffusion timet was set tot = 2 104. The clustering in the embedding space is doneusing k-means with 50 restarts and taking the clustering re-sult with the least distortion. Distortion is computed as theratio of intra-class and inter-class variances.
In [Fig.2], we present the boxplots of the dice overlap co-efficients for the thirty subjects, using the different values ofσ for 7 and 10 clusters. We can note that the quantitative re-sults are rather satisfactory. For example, with the parameterσ set toσ = 1, we obtain a mean dice overlap coefficientof 0.78 (resp. 0.82) and a standard deviation of 0.05 (resp.0.045) for 7 (resp. 10) classes . For a qualitative assessment,we show in [Fig.3] the obtained fiber classification in 7 clus-ters for two healthy and two diseased subjects. It is importantto note in this setting that the diffusion images of the skele-tal muscle are intrinsically noisier than brain images due tothe short spin-spin (T2) relaxation time of the muscle tissue.Therefore the obtained fiber tracts are rather noisy, especiallyfor diseased patients where the fat artifact is stronger. Despitethe low quality of the tractography, our algorithm could stillsegment it in coherent fiber bundles.
5. CONCLUSION
We proposed a diffusion maps based method for fiber cluster-ing in the human skeletal muscle. The main ingredient of thealgorithm is the definition of a metric between fibers that en-compasses spatial and diffusion information. The experimen-tal validation shows promising results both for healthy anddiseased subjects. It would be interesting to perform statis-tical analysis of diffusion properties within each fiber bundleand assess the changes induced by myopathies.
6. REFERENCES
[1] Craig J. Galban, Stefan Maderwald, Kai Uffmann,Armin de Greiff, and Mark E. Ladd, “Diffusive sensitiv-ity to muscle architecture: a magnetic resonance diffu-sion tensor imaging study of the human calf,”EuropeanJournal of Applied Physiology, vol. 93, no. 3, pp. 253 –262, 2004.
[2] B.M. Damon, Z. Ding, A.W. Anderson, A.S. Freyer,and J.C. Gore, “Validation of diffusion tensor MRI-based muscle fiber tracking,”Magnetic Resonance inMedicine, vol. 48, pp. 97–104, 2002.
[3] Anders Brun, Hae-Jeong Park, Hans Knutsson, and
Carl-Fredrik Westin, “Coloring of DT-MRI fiber tracesusing Laplacian eigenmaps,” inEUROCAST, 2003.
[4] Lauren ODonnell and Carl-Fredrik Westin, “Automatictractography segmentation using a high-dimensionalwhite matter atlas,” IEEE TMI, vol. 26, no. 11, pp.1562–1575, 2007.
[5] Andy Tsai, Carl-Fredrik Westin, Alfred O. Hero, andAlan S. Willsky, “Fiber tract clustering on manifoldswith dual rooted-graphs,” inCVPR, 2007.
[6] M. Maddah, W. Grimson, S. Warfield, and W. Wells, “Aunified framework for clustering and quantitative analy-sis of white matter fiber tracts,”Medical Image Analysis,vol. 12, no. 2, pp. 191–202, 2008.
[7] Demian Wassermann and Rachid Deriche, “Simultane-ous manifold learning and clustering: Grouping whitematter fiber tracts using a volumetric white matter at-las,” in MICCAI 2008 Workshop - Manifolds in MedicalImaging: Metrics, Learning and Beyond., 2008.
[8] Orly Zvitia, Arnaldo Mayer, and Hayit Greenspan,“Adaptive mean-shift registration of white matter trac-tographies,” inISBI, 2008.
[9] Peter Savadjiev, Jennifer S. W. Campbell, G. BrucePike, and Kaleem Siddiqi, “Streamline flows for whitematter fibre pathway segmentation in diffusion MRI,” inMICCAI, 2008.
[10] D. Wassermann, M. Descoteaux, and R. Deriche, “Dif-fusion maps clustering for magnetic resonance q-ballimaging segmentation,” International Journal onBiomedical Imaging, 2008.
[11] Radhouene Neji, Nikos Paragios, Gilles Fleury, Jean-Philippe Thiran, and Georg Langs, “Classification oftensors and fiber tracts using Mercer-kernels encodingsoft probabilistic spatial and diffusion information,” inCVPR, 2009.
[12] Ronald R. Coifman and Stephane Lafon, “Diffusionmaps,” Appl. Comput. Harmon. Anal., vol. 21, pp. 5–30, 2006.
[13] Georg Langs and Nikos Paragios, “Modeling the struc-ture of multivariate manifolds: Shape maps,” inCVPR,2008.
[14] Pierre Fillard, Nicolas Toussaint, and Xavier Pennec,“Medinria: DT-MRI processing and visualization soft-ware,” Similar Tensor Workshop, 2006.