Embed Size (px)
Citation preview
VORTICAL AND TURBULENT STRUCTURES AND INSTABILITIES IN UNSTEADY FREE-SURFACE WAVE INDUCED SEPARATION
Manivannan Kandasamy, Tao Xing, Robert Wilson, Frederick Stern
IIHR-Hydroscience & Engineering
C. Maxwell Stanley Hydraulics Laboratory The University of Iowa
ABSTRACT Free-surface wave-induced separation caused by interactions of free-surface waves and wall boundary layers has relevance to ship and platform hydrodynamics with regard to resistance and propulsion, stability, and signatures. This paper uses URANS and DES with complimentary EFD to investigate the separation patterns and Strouhal numbers for the different instability mechanisms on a surface piercing NACA0024 foil for Fr=0.37 and 0.55. Instability studies include laminar cases too. Frequency analysis and vortex core detection reveal the nature of free-surface wave induced separation. Normalized Strouhal numbers for shear layer instability (Stθ scaled by momentum thickness at separation θ), Karman instability (Sth scaled by wake thickness h), and flapping instability (StR scaled by mean reattachment length XR) show the effects of free surface and Fr on the instability mechanisms. Stθ (~0.013) for the laminar cases compare well with existing values for airfoils. Stθ for the turbulent cases have lower values that decrease with Fr. Stθ =0.0077 and 0.0052 for Fr=0.37 (Re=1.5e6) and 0.55 (Re=2e6) respectively. Sth for free-surface Karman shedding lies in a reduced range 0.065-0.069 compared to flows without free surface (0.07-0.09). StR = 0.2 lies in similar range as that for backward facing steps and blunt cylinders. A theoretical model constructed based on simple harmonic motion gives a good prediction of the flapping frequency. Unlike RANS, DES predicts non-reattaching separation for Fr=0.37. DES captures the same frequency for shear layer instability along with a much broader range of frequencies. DES provides a broader range of vortical structures in the separated regions and resolves more turbulent structures than URANS. Preliminary results using DES with single-phase level-set method show spilling wave near the toe which surface-tracking method does not capture. The overall results provide credible description of the flow physics.
INTRODUCTION
Three-dimensional flow separation, in general by itself, is a vast area of study and there are still a lot to understand. The free surface adds to the complications due to free-surface deformations, free-surface-boundary layer interactions, turbulence, air/water interface, bubble entrainment, surface tension effects, and free-surface vortex interactions. In recent years, researchers have started paying increasing attention to small-scale processes that arise on or near the surface and the associated interactions between the surface motions and the underlying flows. Gaining insight into the fluid mechanics of the above-mentioned areas would be of both fundamental and practical interest, especially regarding applications to ship hydrodynamics. Relatively less work has been done in the area of free surface wave induced separation compared to other three dimensional separations. Chow [1] first
discovered this phenomenon using a surface-piercing foil designed for insignificant separation for the deep condition. Stern et al. [2] made similar observations in their study of the effects of waves on the boundary layer of a surface-piercing flat plate with an upstream horizontal foil generating the Stokes waves in a towing-tank. For medium Fr separation initiated just beyond the wave trough and extended to the foil trailing edge. On the free surface, the separation region was wedge shaped, broken, and turbulent with vortical flow upstream towards the plate. Zhang and Stern [3] performed steady RANS simulations using free surface tracking and Baldwin-Lomax turbulence modeling along with wave-profile experiments for a surface-piercing NACA 0024 foil, which also has insignificant separation at large depths. The separation region on the free surface and plate is qualitatively similar in shape and depth as described by [1, 2]. The separation was naturally unsteady with two major vortices in the separation region, one going up the free surface and the other into the wake.
5th Osaka Colloquium, Mar 14-15, 2005, OSAKA, JAPAN 1

There are some general approaches to study three-dimensional flow separation. One is the study of the flow topology by examining the skin friction lines [9]. The other is by a) visualization and categorization of the gross separation patterns, b) identifying and analyzing the different frequencies associated with the separated shear layer and vortex structures and c) analyzing their interactions with the body and/or interactions with each other. According to Kiya [10], separated flows fall into two categories for this type of analysis: 1. Separation with reattachment (the separating shear layer reattaches to the body in backward facing step, leading edge separation bubbles of airfoils, blunt plates, or blunt cylinders) characterized by interactions between vortices and the solid surface and 2. Separation without reattachment (cylindrical bluff bodies like circular cylinders, spheres, and normal plates) characterized by interactions between opposite signed vortices shed from the separation points.
Researchers have identified three main instabilities in separated flows: the initial shear layer instability, which causes the roll up of the separated shear layer, the Karman type instability due to the interaction between opposite signed vortices, and a low frequency instability ranging from 1/3 to 1/10 of the vortex shedding frequency. The frequency of the initial instability (f SL) which causes roll up of the separating shear layer to form vortices scales inversely with the momentum thickness at separation (θ) and directly with the convection velocity (UC) of the separated shear layer. Stθ = f SL θ / UC. (1) UC is approximately US/2 at separation, US given by Bernoulli’s equation using base pressure at separation Michalke [11] used inviscid linearised spatial stability theory to find the growth rates in a free boundary layer of axisymmetric and plane jets and found good match with the experimental values with Stθ = 0.017. Bloor [12] demonstrated that the shear layer instability of a cylinder normalized by the cylinder diameter as the length scale (fSLD/U) scaled approximately with Re-1/2 and suggested that θ varies with Re1/2 thus ensuring Re independence of fSLθ/U. Early work by Freymuth [13] on a separating laminar boundary layer also show that by using θ as the length scale the instability properties of the disturbed shear layer are independent of Re. Later, Gaster [14] and
Pauley et al. [15] found similar Re independency for the shear layer roll up of leading edge laminar separation bubbles in airfoils. Pauley et al. [15] simulated three cases for Re=59629, 120544 and 238515. For all cases, the Stθ was 0.0137. Ripley and Pauley [16] geometry gave a Stθ of 0.011 for Re = 364747, 209038 and 113928. Conclusion was that Stθ is Re independent, but depends on the non-dimensional pressure distribution. Chart 1 provides a list of Stθ for laminar and turbulent cases for geometries investigated until now. The other major instability in separated flows, the most widely recognized and studied, is the Karman instability. Von Karman in 1912 investigated the linear stability of point vortex configurations and showed that two rows of oppositely signed vortices were unstable in both symmetric and asymmetric configurations. Almost all flows past bluff bodies exhibit this type of instability. The symmetric configuration occurs in reattaching flows where the interaction of the vortices is with the mirror image on the wall. In all symmetric type vortex shedding investigated the Karman shedding process is as follows; the shear layer vortices merge to form a large vortex that impinges on the body, interacts with its mirror image, and sheds. Here the successive merging of the shear layer vortices are the precursor to the Karman type vortex shedding. Backward facing step and blunt cylinders demonstrate this type of shedding. Similarly, for asymmetric vortex shedding which occurs in non-reattaching flows like in circular cylinders, the shear layer vortices amalgamate into the primary Karman vortex, before the vortex sheds downstream. But unlike flows with reattaching shear layers this amalgamation is not the precursor to the Karman shedding, evident from the fact that the shear layer vortices were not detectable below Re=1200 [17], but Karman shedding is still observed at Re as low as 150 [18]. Rosko [19] explained this lack of shear layer vortices as follows. There are two criteria for the shear-layer instability vortices to appear in the near wake. First, at least one wavelength has to fit into the formation length, wavelength given by λ/D ~ 37 / Re1/2. Second, the instability should have reached a significant level of amplification within the formation length. The transition region XT for the required amplification is XT/D ~ 75/Re1/2 [20]. The first criteria is not met for Re<360 and second is not met for Re<1200. Similar behavior occurs in spheres [21] where the Karman vortex shedding frequency exceed the expected frequency of the shear layer instability at Re<800. In this case, the shear layer
5th Osaka Colloquium, Mar 14-15, 2005, OSAKA, JAPAN 2

instability does not have time to manifest. Roshko[22] proposed a universal Strouhal number (Sth) for Karman shedding and theorized that it must have relation with the irrotational velocity at the point of separation US and the wake width 2h decided by Roshko’s notched hodograph theory giving Sth =f h / US. (2) Sth lies in range 0.07-0.09 for almost all flows without free surface. Investigations for reattaching flows in backward facing steps, leading edge separation bubble of blunt cylinders and airfoils have uncovered the existence of a low frequency oscillation of the separation bubble termed ‘flapping’ of the shear layer. The enlargement and shrinkage of the separation bubble cause this frequency. Eaton & Johnston [23] attributed the cause of flapping to an instantaneous imbalance between entrainment of fluid from the recirculation region and that rejected from near reattachment. Kiya & Sasaki [24] agree to this hypothesis, and add that the almost constant periodicity indicates some form of a feedback of disturbance from the reattaching zone to the shear layer near the separation line. They further suggest that a standing wave whose frequency is equal to the central frequency of the unsteadiness would approximate the velocity and pressure fluctuations associated with the low frequency unsteadiness. The general agreement is that the flapping frequency scales with the mean reattachment length XR (mean). StR= f XR (mean)/U∞ (3) The instantaneous reattachment length XR oscillates over a few H about XR (mean) due to the enlargement and shrinkage of the separation bubble. For blunt cylinders and backward facing step StR= 0.25 and 0.27 respectively, with XR (mean) =10.1 R, 7.4 H respectively [24, 25]. Researchers have investigated the effects of the free surface on separation. Chen and Chwang [26] performed numerical simulations on a submerged hydrofoil with a positive angle of attack. They found out that the presence of the free surface inhibits the onset of Karman instability. Their conjecture was that the transfer of kinetic energy to potential energy of the free surface causes this. Kawamura et al. [27] performed large eddy simulation of flow past surface piercing cylinder. They showed that periodic vortex shedding is attenuated near the free surface at high Fr.
The region in which the periodic vortex shedding is hampered extends to about one diameter from the mean water level. They attributed this to the generation of surface waves, which cause the separated shear layers to incline outward. Lin and Li [28] also used LES to simulate wave current interaction with a vertical square cylinder and the force analysis demonstrate that the presence of waves can reduce both the strength and frequency of vortex shedding induced by a uniform current due to the non-linear wave current interaction.
COMPUTATIONAL METHOD
Simulations used the general-purpose research code CFDSHIP_IOWA [29]. Governing equations for Cartesian coordinates, the continuity, and momentum equations in non-dimensional tensor form are
0∂
=∂
i
i
Ux
(4)
2
*ˆ 1 1ρ
∂ ∂ ∂∂ ∂+ =− + − +
∂ ∂ ∂ ∂ ∂ ∂ i
i i ij i
j i j j j
U U UpU ut x x Re x x x j bu f (5)
Where Ui = (U, V, W) are the Reynolds-averaged velocity components, xi = (x, y, z) are the independent coordinate directions, is the piezometric pressure
coefficient,
p̂
i ju u are the Reynolds stresses which are a two-point correlation of the turbulent fluctuations ui. A free surface tracking method with nonlinear kinematic and approximate dynamic free surface boundary conditions simulates the free surface. The kinematic boundary condition used updates the grid every time step to compute the free-surface location. The code restricts the free surface slope from exceeding 60 degrees. The dynamic boundary condition provides boundary conditions for velocity and pressure. The turbulence model used for URANS is a blended k-ω/k-e model. The BKW model used for unsteady RANS calculation extends to DES model. The modification follows the methodology used by Travin et al.[30] i.e., to modify the dissipative term of the k-transport equation:
(6) * 3 2
3 2
/kRANS k
kDES
D k k l
kDl
ωρβ ω ρ
ρ
−= =
= (7)
The length scale is:
5th Osaka Colloquium, Mar 14-15, 2005, OSAKA, JAPAN 3

1 2 *( )
min( , )k
k DES
l k
l l Cω
ω
β ω−
−
=
= ∆
Where CDES is the DES constant and is 0.65, following the typical value for homogeneous turbulence. CFDSHIPIOWA DES model is validated by simulation of massively separated flows around NACA 0012 with angle of attack 60 degrees. Compared to URANS, DES significantly improves the accuracy of the calculations of the lift and drag coefficients. Compared with EFD data, Errors for lift and drag coefficients decrease from 40% for URANS to less than 5% for DES, which is consistent with previous DES study on the same geometry with same flow conditions [31]. In this study, 3rd order upwind biased scheme was used for all convective terms in the momentum equation for both URANS and DES. SIMULATION DESIGN
Laminar cases simulated are 2D and Fr=0.37 for both Re=1500 and 2500. Turbulent cases simulated are Fr= 0.37, 0.55 with respective Re= (1.52, 2) × 106 for URANS. DES simulates only Fr=0.37 case. Fig. 1 shows the foil at Fr=0.37 in the tow-tank. CFD models flow with large foil draft (2×t) without towing-tank walls and bottom condition. Previous studies [5, 6] established relatively small dependence of the free-surface separation pattern to the wall, foil bottom (whose effects were confined only to the lower regions of the foil) and the tow-tank floor effects. The C-grid (Fig. 2) used has a far-field boundary that replaces the tow tank-wall boundary. Another C- grid generated with only half domain helps isolate and study the flapping instability in detail. The boundary condition on each boundary is as follows. On the foil surface (no slip), (U, V, W) = ∂P/∂n =0 (where n is normal to the body). On the exit plane, axial diffusion and pressure gradient are assumed negligible, i.e., ∂2(U, V, W)/ ∂X2 = ∂P/∂X=0. On the bottom deep boundary, an impenetrable slip condition is used, i.e. ∂ (U, V, P)/ ∂Z=W=0. On the outer boundary the far-field boundary condition, U=U∞, V=W=P= 0. The conditions on the turbulent quantities are as follows: on the foil surface (no slip), k=0, ω= 60 / (Re x 0.075 x ∆y2), eddy viscosity vt = 0; on the exit plane, on the bottom deep boundary, on
the outer boundary and on the free-surface ∂k/∂n=∂w/∂n=∂vt/∂n=0.
(8)
(9)
VERIFICATION Verification used Stern et al. [32] methodology with updated correction factors [33]. Referring to table 1 URANS uses grids 1, 2, 3, and 5 for verification. Two grids studies, first with grids 1, 2 and 3 with refinement ratio rK = 4 2 and second with grids 1,3 and 5 with rK = 2 are conducted for URANS. DES
has two more grid studies with rK= 4 2 with grids 2, 3 and 4, and grids 3, 4 and 5. Parametric studies on sub iterations (free-surface momentum coupling) for each time step ensured iterative solution convergence at each time step. Statistical convergence of the running average on the time histories of CTX and side forces (CTY) establishes statistically stationary unsteady solutions. For CTX our criterion for statistical convergence is that the fluctuations of the running mean drop down to less than 1 % of the mean value. CTY takes much longer to converge because of low frequency, high amplitude fluctuations and hence the relaxed convergence criterion is that the fluctuations be less than 5% of the dynamic range. All cases run for the verification studies satisfy the statistical convergence criteria. Both CTX and CTY converge after 10 of their longest periods (i.e. 3 s for CTX and 10 s for CTY). For URANS, both grid studies showed monotonic convergence for all integral quantities and point variables. Since the grid uncertainties are order of magnitude higher than the iterative and time-step uncertainties USN=UG. A summary of uncertainties for rK= 2 grid study follows: USN for CTX =4% mean, USN for averaged wave profile =2.26% dynamic range (ζmax), USN for domain averaged wave elevation = 1.78 % ζmax. For DES, monotonic convergence for all integral quantities and point variables is achieved only on grids 1, 2, 3 with grid uncertainties 3.6%. DES on other set of grids does not achieve convergence. Apart from the grids used for verification, results from grid 6 and grid 5 are used for presenting results for URANS and DES, respectively in this study. RESULTS Laminar Solutions
5th Osaka Colloquium, Mar 14-15, 2005, OSAKA, JAPAN 4

Laminar flow simulations for cases Re = 1500 and 2500 (2D case and Fr=0.37) revealed unsteady non-reattaching separation with shear layer and Karman instabilities. The frequencies in the separated shear layer are got by the FFT of pressure at (x,y)=(0.64,0.14) for the 2D cases and by the FFT of elevation at the free surface (x,y)=(0.47,0.16) for Fr=0.37 cases. Table 2 summarizes the results from the cases run. For all cases, Stθ (~0.013) lies in range similar to airfoils (Pauley et. al., 1993). Sth (~ 0.08) lies in the universal range for the 2_D cases. The free surface Fr=0.37 case has reduced Sth (0.069). For laminar flows, assuming UC scales with US the consensus is that the shear layer frequency scales with Re½ Sigurdsen [34] proposed the following reasonable approximation; not completely accurate as individual calculation of θ is not made.
=2/1ReDS
SL
UDF
Constant (10)
For the 2D cases the constant is about 0.013 and for Fr=0.37 cases the constant is about 0.025. Turbulent solutions URANS predicts reattaching shear layer for Fr=0.37 and non-reattaching shear layer for Fr=0.55. DES predicts non-reattaching shear layer for Fr=0.37. Wave elevation and surface pressures - Mean, RMS and FFT Fig. 3 shows time history of total drag coefficient CTX, FFT and PSD for both URANS and DES. CTX for DES is 15% higher than URANS, indicating bigger separation. FFT analysis shows that DES has a broader range of frequencies with higher amplitudes. Both show peaks at around 2 Hz. The low frequency region exhibits two distinct peaks at 0.32 and 0.74 Hz for URANS, and is much broader for DES. The PSD slope for both displays the Kolmogorov -5/3 spectrum. CTY statistical convergence for the URANS solution grid is too intensive because of the low frequency fluctuations and hence not achieved. Based on previous solutions with coarser grids, CTY shows high asymmetry for URANS, with RMS being order of magnitude higher than that of CTX. For DES, side force converges after 80 flow times. The maximum magnitude of the side force is about four times magnitude of the total drag and with RMS 20 times the RMS of total drag.
Fig. 4 illustrates mean wave profiles of EFD, URANS, DES, and DES level-set with 197,456 points. Both URANS and DES compare good with EFD. However, both URANS and DES fail to capture the sharp recovery of the wave right after toe because of the surface tracking slope restriction. Preliminary results using DES with single-phase level-set method predict the best wave profile. EFD mean wave elevations (Fig. 5a) are consistent with observations (Fig.1) showing blunt bow wave, wide separation region with relatively flat wave elevation, and displaced Kelvin waves. URANS free-surface elevation contours (Fig. 5b) show an over prediction of the wave amplitudes compared to EFD and DES. Fig. 6 shows the RMS distribution on free surface. URANS under predicts and DES over predicts RMS. The dominant frequency content contours in Fig. 7 have a cut off frequency of 0.2 Hz (as the time used for the FFT was 10s) with regions having amplitude less than 0.0005 blanked out as they lie within noise levels. URANS shows three distinct regions in the separation region: The high frequency 2 Hz region within the separation region (Shear layer instability dominates), the intermediate frequency 0.74 Hz right after reattachment (Karman instability dominates), and the low frequency 0.32 Hz region around the Kelvin wave crest (flapping instability dominates). All three are also evident in the EFD, but not quite as distinct. DES captures the same share layer instability (2 Hz) in the separation region but with a much broader range of frequencies. FFT of point oscillation in the separation region (x, y=0.74, 0.12) for URANS show clear 2 Hz shear layer frequency (Fig. 8). FFT of point oscillation in the separation region (x, y=0.49, 0.1948) for DES also shows clearly 2 Hz shear layer frequency (Fig. 9). Point-oscillation at other locations shows distinct peaks at 0.74 Hz and 0.32 Hz for URANS and EFD but with much broader frequency distributions for DES. The free-surface wave induced piezo-metric pressure gradient pushes the favorable pressure gradient region further downstream until x/L =0.4 in contrast to x/L = 0.2 in the deep region (z/L < -0.3) and increases the adverse pressure gradient in the trailing edge causing flow separation (Fig. 10). The flow separates at the region of minimum pressure just as the pressure gradient starts becoming adverse. In a sense, the free-surface curvature acts to change the geometry of flow past the foil into a flow past a buffer body. Both
5th Osaka Colloquium, Mar 14-15, 2005, OSAKA, JAPAN 5
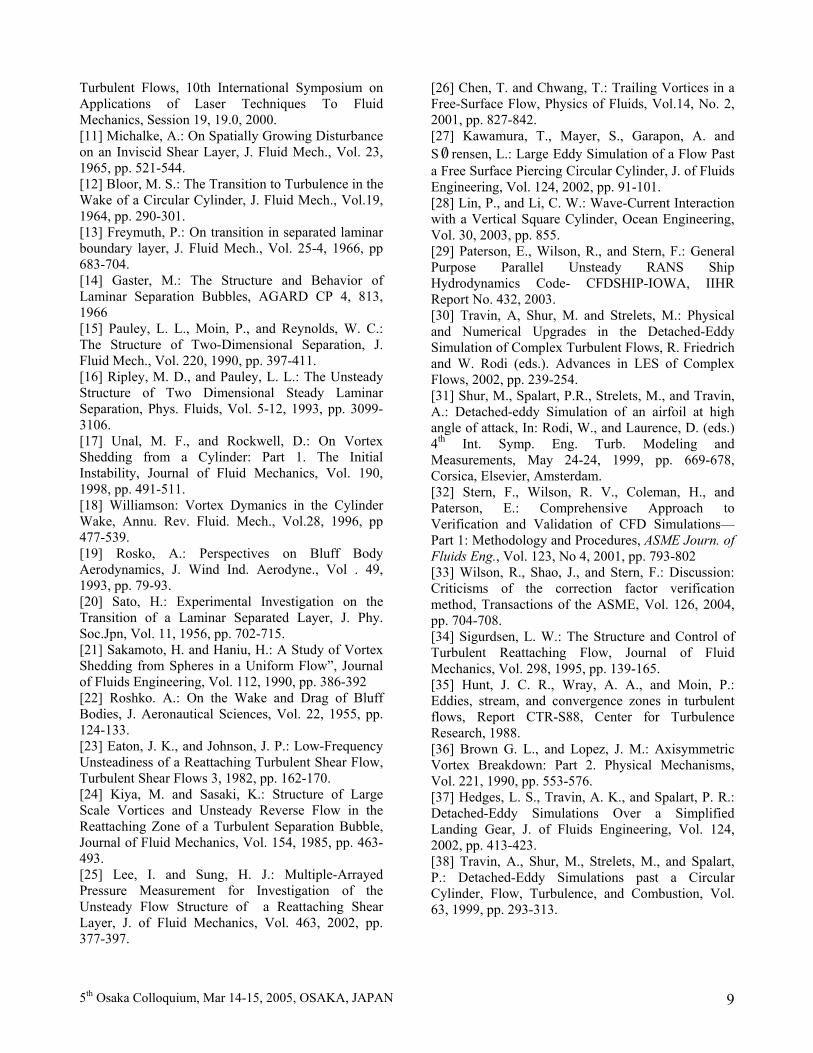
URANS and DES over-predict the pressure recovery in the separated regions. Fig. 11 shows the foil surface RMS. URANS under predicts the overall separation size. DES shows overall more reasonable separation region size but with much higher RMS than EFD data, especially near the toe. Note that EFD data is not available at the toe. The contours of dominant frequency (Fig. 12) show same three frequencies as the free surface for URANS: 2 Hz inside the separation bubble, 0.74 Hz outside reattachment and 0.32 Hz which envelopes the other two. The contour of dominant frequency for DES shows more frequency content which contains the above three frequencies but not as distinct. FFT of point oscillations for URANS (Fig. 13) at x=0.736, z= -0.078 show a max frequency of 2 Hz in regions of high RMS same as EFD. Running mean and RMS for DES of point oscillations (Fig. 14) at x=0.66, z= -0.11 agree with EFD data. The FFT of EFD shows a peak of 1.5 Hz. The same frequency with same amplitude found in DES, but not as dominant.
Vortical structures and instabilities URANS For Fr=0.37, the shear layer separates at the free surface (x/L=0.49) and the separation region is wedge shaped. There are two types of vortices associated with the separation. The first forms due to the recirculating fluid in the separation bubble at the free surface. The second is a result of the shear layer instability, which causes the separated shear layer to roll up. The Q-criterion proposed by Hunt et al. [35] enables visualization of the vortices. There are three instabilities associated with this case: the shear layer instability, the Karman instability for reattaching flows and flapping instability. The shear layer vortices form at the toe just after separation. Fig. 15 shows the flow pattern over one time-period corresponding to the shear layer vortex shedding. Vortical flow occurs in regions of positive Q shown by the blue isosurfaces with imbedded core lines contoured by vortex strength. The free surface seems to inhibit the shear layer roll up and hence the shear layer vortices have higher strength in the region below. The shear layer vortex convects downstream; then merges with the recirculation vortex for a brief time and then breaks down. It is a periodic process of frequency about 2 Hz. There is a low-pressure field created near the vortex core, magnitude of the low-pressure dependent on the strength of the vortex core.
The free-surface elevation has direct relation to the pressure and hence the free surface depresses along the vortex motion causing shoulder waves with frequency 2 Hz. The shear layer vortex has a higher strength when it first forms near the toe. This explains why the RMS of free-surface elevation is the highest near the toe. US=1.45 and θ=0.0028 giving Stθ = 7.7 x 10⁻³. The value is little more than half of that got for the laminar cases. Brown and Lopez (36) came up with a criterion for vortex breakdown in swirling flows which states for breakdown to occur the helix angle of velocity should exceed that of vorticity along some stream surface (necessary not sufficient condition). i.e. If, δ=tan-1 (ν/w)- tan-1 (η/ζ), where the ratios (ν/w) and (η/ζ) are of the azimuthal and axial components of velocity and vorticity respectively, then δ has to be positive in order for breakdown to occur. Contours of δ along the vortex core (Fig. 16) show the criterion satisfied with the breakdown occurring at maximum positive δ (0.4) on the core. Fig. 16 also shows the diverging streamlines and stagnation in the vortex core at the breakdown point with flow converging from the top and bottom.
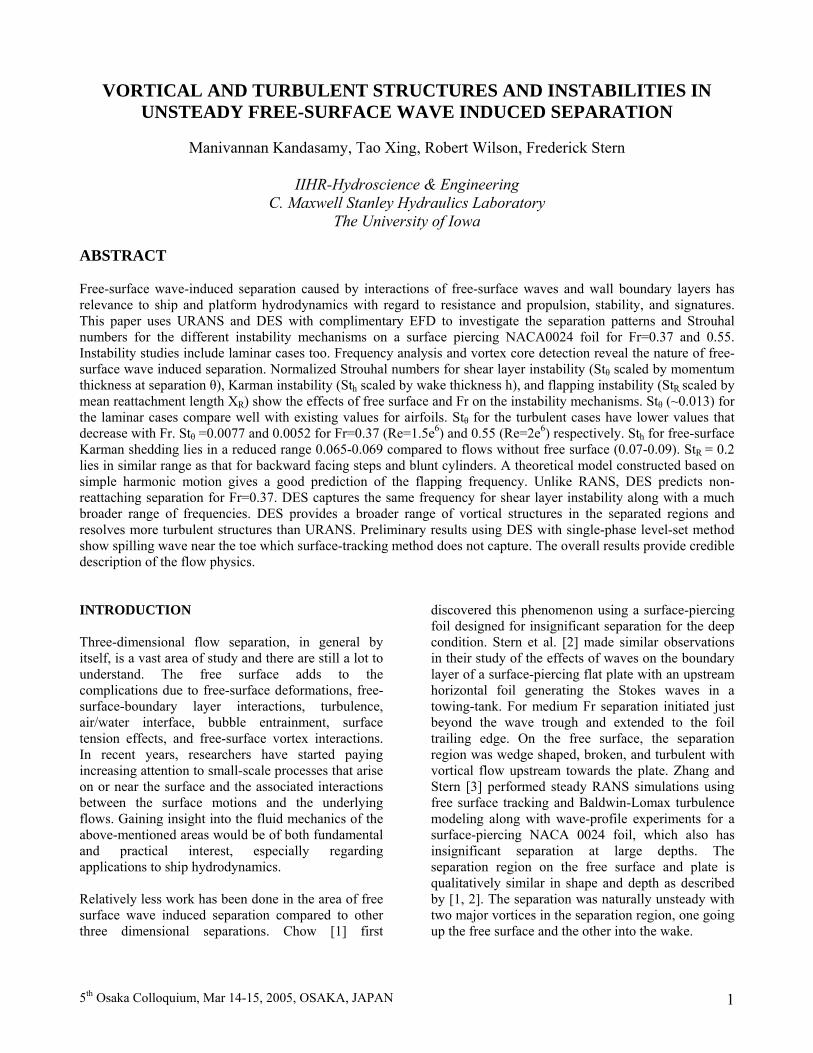
Fig. 17 illustrates the symmetric type Karman shedding process, namely the merger of the shear layer vortices to form bigger vortices that then shed. The blue isosurfaces denoting positive Q portray the behavior of vortical structures over one Karman shedding period. Two or three shear layer vortices merge after the reattachment point and then shed downstream with frequency 0.74 Hz. The normal distance of the separated shear layer from the foil at the free surface, used as the equivalent for half wake thickness h (=0.13), gives Sth = 0.066.
Analysis of the flow field shows periodic increase and decrease of the separation bubble size with frequency 0.32 Hz. A half-domain medium-grid (187,824 grid points) with symmetry conditions imposed on the center-plane serves better to study the flapping instability as it cuts off the asymmetric influences. Fig 18 shows two extremities of the flapping: the low mode and the high mode. The flapping frequency with the half domain medium grid (0.18 Hz) is lower than that got from the solution grid because of both the domain and grid density differences. The separation-bubble reattachment length for the high mode is 0.7 L and for the low mode is 0.46 L. The entrainment of fluid from the separation bubble increases with increase in number of the coherent vortices, which in turn increase with reattachment
5th Osaka Colloquium, Mar 14-15, 2005, OSAKA, JAPAN 6

length. The number of coherent vortices is quantified by the parameter we term entrainment number (En = LR/ λ SL). En = 2.2 for the high mode and 1.4 for the low mode. The pressure difference (∆ P) between separating and reattaching points which is higher for the low mode (∆ p= 0.86) compared to high mode (∆ p= 0.72) dictates the re-injection rate. To summarize, during the high mode the increased entrainment and decreased re-injection shrinks the separation bubble and at the low mode the decreased entrainment and increased re injection enlarges the bubble. Approximating the pressure wave similar to simple harmonic motion of a spring mass system at the crest and the trough gives a simple predictive model for the flapping instability. The free surface boundary conditions dictate that d (u, v, w)/ dz = 0, which implies that at the crest and the trough where the slope is zero the convective derivatives in the normal direction vanish. Assuming the free surface at the crest and trough oscillates only in the vertical direction (ignoring the minute transverse travel); the only vertical forcing factor is the pressure gradient at the free surface. In our model, a coefficient in terms of pressure replaces the spring coefficient giving
f = π2k
= DFr ρπ2
1 (11)
The only parameter required for this model is D, which is half the magnitude of oscillation at the crest. For the half domain case, D=0.0062, which gives f = 0.17. In spite of such crude approximation, the result matches surprisingly well with the simulation results i.e. f=0.18 Hz. The formula is also applicable for the full domain solutions. The solution grid D=0.0016 gives f= 0.34 and the actual observed frequency is 0.32 Hz. Non-linear interactions of the flapping between the two sides of the foil give rise to the low frequency far wake meandering. This is the reason why CTY take much longer to converge than CTX. For Fr=0.55, the separated flow is non-reattaching and has shear layer instability (Stθ = 0.0052) and asymmetric Karman instability (Sth = 0.0678). This differs from Fr=0.37 which has symmetric Karman shedding. In addition, the flapping instability is absent and so are the low frequency high amplitude fluctuations in CTY.
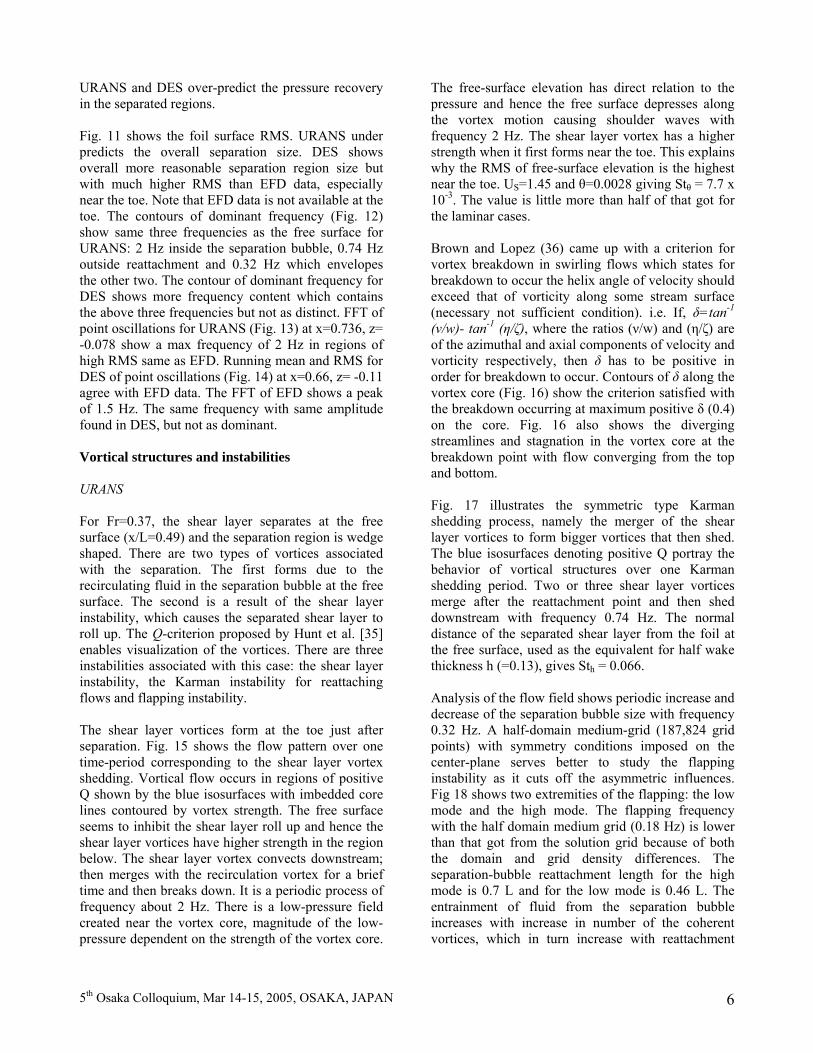
DES DES also predicts the same value for shear layer instability. Similar to URANS, the shear layer vortices formed near the toe region, grow to large vortices and shed, as illustrated in Fig. 19 (The grey color is the iso-surface of positive Q with imbedded vortex core contoured by vortex strength). The shear layer vortex has the highest strength near the regions right under the separation bubble on the free surface. The shear layer vortex connects to the foil surface (snapshot 2 from top in Fig. 19) and then shed downstream. The cycle has a period of 0.5 seconds (2 Hz). No Karman shedding frequency can be easily defined due to the broad range of frequency contents. There is no flapping frequency found in DES since flow is non-reattaching. Unlike URANS, DES predicts a much broader range scales of vortical structure, as illustrated in Fig. 19. Another example is the necklace vortex tubes near the bow region (Fig. 20), which can not be captured using URANS. More analysis of different frequency contents and Strouhal numbers for DES is underway. Turbulence structures Modeled, resolved, and total Reynolds stresses for URANS and DES (Fig. 21), use the same definition, and methodology proposed by Hedges et al. [37]. URANS destroys resolved turbulence and main part of the total Reynolds stress is modeled. DES resolves much more Reynolds stresses and the total Reynolds stress level is higher than URANS, especially in the separated regions. These findings are similar to those findings by Hedges et al. [37]. Iso-surface for Turbulent Kinetic Energy using DES shows that the maximum TKE occurs right under the separation bubble on the free surface. The overall distribution of TKE is along the path of the vortex shedding. The TKE and vortex strength decrease with breakdown of the vortex core further downstream. Fig. 22 illustrates one instantaneous time with iso-surface TKE value 0.03 (The maximum TKE value in the whole flow field is 0.1 at the toe). Compared to DES, URANS shows overall a higher level of TKE in the separated region (iso-surfaces of TKE=0.1) with maximum 0.2 at the toe. It is also interesting to compare the range of the turbulent eddy viscosities for URANS and DES. Its
5th Osaka Colloquium, Mar 14-15, 2005, OSAKA, JAPAN 7
overall values for DES range from 0 to 6.9e-4, which is about an order of smaller magnitude than the URANS predicts. This is another evidence to support previous discussions on the magnitude of modeled Reynolds stresses for URANS and DES. Work in process including more comprehensive turbulence analysis, such as Reynolds shear stress and Reynolds normal stress distributions in the separated regions, anisotropic components for URANS and DES, specially will focus on free surface effect on the change of these quantities. Also planned is to relate turbulence analysis to the different instabilities and frequencies reported in this study. CONCLUSIONS AND FUTURE WORK
Strouhal numbers from 2D laminar case agree well with literature for both shear layer and Karman instabilities. Addition of free surface lowers Sth for the laminar cases. URANS for Fr=0.37 and 0.55 supports this finding with agreeing Sth (0.065-0.069). Fr=0.37 has reattaching shear layer with symmetric type Karman shedding and Fr=0.55 has non-reattaching shear layer with asymmetric type shedding. The shear layer instability has Stθ around 0.013 for the laminar cases with/without free surface. URANS predicts lower Stθ for the turbulent cases (0.0077 for Fr=0.37 and 0.0052 for Fr=0.55). Flapping occurs for Fr=0.37 with StR= 0.2. A simple predictive model based on simple harmonic motion predicts the flapping frequency well with Fr and amplitude of oscillation as the only required input. Both URANS and DES predict similar frequencies for both shear layer instability and but with more frequency contents for DES. Future work will focus on the effect of mesh refinements on DES results. DES for the same flow conditions using 2 million grid points conducted. The results are worse than the current DES results compared with EFD data. It is possibly due to the restriction of the surface-tracking method. However, it is still an unresolved issue on improving DES predictions by continuously refining the grid, as discussed in previous DES study of flow past a circular cylinder [38]. The other focus is simulation of free-surface wave induced separations using single-phase level-set method with both URANS and DES (CFDSHIP-IOWA V.4). Preliminary simulation results on a half-domain coarse mesh (197, 456) using URANS and DES with level-set method shows similar flow patterns as those recorded in this study, except the spilling wave right after the toe region
(Fig. 23), which can not be captured using the current surface-tracking method, and non-reattaching separated flow patterns. In addition, DES successfully captures the dominant frequency for shear layer instability (2 Hz), but not with URANS on this relative coarse mesh, as illustrated by Fig. 24. A finer grid with whole domain simulation is in process.
ACKNOWLEDGEMENTS The Office of Naval Research under Grant N00014-01-1-0073, administered by Dr. Patrick Purtell, sponsored this research.
REFERENCES [1] Chow, S. K.: Free-Surface Effects on Boundary Layer Separation on Vertical Struts, PhD Thesis, the University of Iowa, Iowa City, IA, 1967. [2] Stern, F.: Effect of Waves on the Boundary Layer of a Surface Piercing Body, Journal of Ship Research, Vol.30., No.4, 1986, pp. 256–274. [3] Stern, F., Hwang, W.S., and Jaw, S.Y., 1989, “Effects of Waves on the Boundary Layer of a Surface-Piercing Flat Plate: Experiment and Theory,” Journal of Ship Research, Vol. 33, No. 1, pp. 63–80. [4] Zhang, Z. and Stern, F., "Free-Surface Wave-Induced Separation," ASME J. Fluids Eng., Vol. 118, September 1996, pp. 546-554. [5] Metcalf, B.: Experimental Investigations on Free-Surface Wave-Induced Separation, 2001, M.S. Thesis, the University of Iowa, Iowa City, IA. [6] Kandasamy, M., Wilson, R., and Stern, F.: RANS Simulation of Free-Surface Wave Induced Separation Around a Surface Piercing NACA-0024 Hydrofoil, 26th American Towing Tank Conference, Glen Cove, New York, 2001. [7] Xing, T., Kandasamy, M., Wilson, R. and Stern, F.: DES and RANS of Unsteady Free Surface Wave Induced Separation, AIAA 2004-0065, 2004. [8] Pogozelski, E. M., Katz, J., and Huang, T. T.: The Flow Structure around a Surface-Piercing Strut, Physics of Fluids, Vol. 9, No. 4, 1997, pp: 1387-1399. [9] Wang, K. C.: Features of Three Dimensional Separation and Separated Flow Structure, Invited Contributed Article To the Volume “Flows of Incompressible and Compressible Fluids at Large Reynolds Number”, (Volume II of “Advances in Fluid Mechanics Series”), Computational Mechanics International, Southampton, England, 1998. [10] Kiya, M., Mochizuki, O., and Ishikawa, H. : Challenging Issues in Separated and Complex
5th Osaka Colloquium, Mar 14-15, 2005, OSAKA, JAPAN 8
Turbulent Flows, 10th International Symposium on Applications of Laser Techniques To Fluid Mechanics, Session 19, 19.0, 2000. [11] Michalke, A.: On Spatially Growing Disturbance on an Inviscid Shear Layer, J. Fluid Mech., Vol. 23, 1965, pp. 521-544. [12] Bloor, M. S.: The Transition to Turbulence in the Wake of a Circular Cylinder, J. Fluid Mech., Vol.19, 1964, pp. 290-301. [13] Freymuth, P.: On transition in separated laminar boundary layer, J. Fluid Mech., Vol. 25-4, 1966, pp 683-704. [14] Gaster, M.: The Structure and Behavior of Laminar Separation Bubbles, AGARD CP 4, 813, 1966 [15] Pauley, L. L., Moin, P., and Reynolds, W. C.: The Structure of Two-Dimensional Separation, J. Fluid Mech., Vol. 220, 1990, pp. 397-411. [16] Ripley, M. D., and Pauley, L. L.: The Unsteady Structure of Two Dimensional Steady Laminar Separation, Phys. Fluids, Vol. 5-12, 1993, pp. 3099-3106. [17] Unal, M. F., and Rockwell, D.: On Vortex Shedding from a Cylinder: Part 1. The Initial Instability, Journal of Fluid Mechanics, Vol. 190, 1998, pp. 491-511. [18] Williamson: Vortex Dymanics in the Cylinder Wake, Annu. Rev. Fluid. Mech., Vol.28, 1996, pp 477-539. [19] Rosko, A.: Perspectives on Bluff Body Aerodynamics, J. Wind Ind. Aerodyne., Vol . 49, 1993, pp. 79-93. [20] Sato, H.: Experimental Investigation on the Transition of a Laminar Separated Layer, J. Phy. Soc.Jpn, Vol. 11, 1956, pp. 702-715. [21] Sakamoto, H. and Haniu, H.: A Study of Vortex Shedding from Spheres in a Uniform Flow”, Journal of Fluids Engineering, Vol. 112, 1990, pp. 386-392 [22] Roshko. A.: On the Wake and Drag of Bluff Bodies, J. Aeronautical Sciences, Vol. 22, 1955, pp. 124-133. [23] Eaton, J. K., and Johnson, J. P.: Low-Frequency Unsteadiness of a Reattaching Turbulent Shear Flow, Turbulent Shear Flows 3, 1982, pp. 162-170. [24] Kiya, M. and Sasaki, K.: Structure of Large Scale Vortices and Unsteady Reverse Flow in the Reattaching Zone of a Turbulent Separation Bubble, Journal of Fluid Mechanics, Vol. 154, 1985, pp. 463-493. [25] Lee, I. and Sung, H. J.: Multiple-Arrayed Pressure Measurement for Investigation of the Unsteady Flow Structure of a Reattaching Shear Layer, J. of Fluid Mechanics, Vol. 463, 2002, pp. 377-397.
[26] Chen, T. and Chwang, T.: Trailing Vortices in a Free-Surface Flow, Physics of Fluids, Vol.14, No. 2, 2001, pp. 827-842. [27] Kawamura, T., Mayer, S., Garapon, A. and S 0/ rensen, L.: Large Eddy Simulation of a Flow Past a Free Surface Piercing Circular Cylinder, J. of Fluids Engineering, Vol. 124, 2002, pp. 91-101. [28] Lin, P., and Li, C. W.: Wave-Current Interaction with a Vertical Square Cylinder, Ocean Engineering, Vol. 30, 2003, pp. 855. [29] Paterson, E., Wilson, R., and Stern, F.: General Purpose Parallel Unsteady RANS Ship Hydrodynamics Code- CFDSHIP-IOWA, IIHR Report No. 432, 2003. [30] Travin, A, Shur, M. and Strelets, M.: Physical and Numerical Upgrades in the Detached-Eddy Simulation of Complex Turbulent Flows, R. Friedrich and W. Rodi (eds.). Advances in LES of Complex Flows, 2002, pp. 239-254. [31] Shur, M., Spalart, P.R., Strelets, M., and Travin, A.: Detached-eddy Simulation of an airfoil at high angle of attack, In: Rodi, W., and Laurence, D. (eds.) 4th Int. Symp. Eng. Turb. Modeling and Measurements, May 24-24, 1999, pp. 669-678, Corsica, Elsevier, Amsterdam. [32] Stern, F., Wilson, R. V., Coleman, H., and Paterson, E.: Comprehensive Approach to Verification and Validation of CFD Simulations—Part 1: Methodology and Procedures, ASME Journ. of Fluids Eng., Vol. 123, No 4, 2001, pp. 793-802 [33] Wilson, R., Shao, J., and Stern, F.: Discussion: Criticisms of the correction factor verification method, Transactions of the ASME, Vol. 126, 2004, pp. 704-708. [34] Sigurdsen, L. W.: The Structure and Control of Turbulent Reattaching Flow, Journal of Fluid Mechanics, Vol. 298, 1995, pp. 139-165. [35] Hunt, J. C. R., Wray, A. A., and Moin, P.: Eddies, stream, and convergence zones in turbulent flows, Report CTR-S88, Center for Turbulence Research, 1988. [36] Brown G. L., and Lopez, J. M.: Axisymmetric Vortex Breakdown: Part 2. Physical Mechanisms, Vol. 221, 1990, pp. 553-576. [37] Hedges, L. S., Travin, A. K., and Spalart, P. R.: Detached-Eddy Simulations Over a Simplified Landing Gear, J. of Fluids Engineering, Vol. 124, 2002, pp. 413-423. [38] Travin, A., Shur, M., Strelets, M., and Spalart, P.: Detached-Eddy Simulations past a Circular Cylinder, Flow, Turbulence, and Combustion, Vol. 63, 1999, pp. 293-313.
5th Osaka Colloquium, Mar 14-15, 2005, OSAKA, JAPAN 9

Fig. 1 Surface-piercing NACA 0024 foil for Fr=0.37.
Fig. 2 Computational domain, boundary conditions, and fine grid
Fig. 3 Time history with running mean, FFT and power spectrum of CTX (Fr=0.37): a) URANS, b)
DES
Fig. 4 Fr=0.37 free-surface wave profile
a
b Far-field
Fig. 5 Fr=0.37 free-surface wave elevation: a) EFD,
b) URANS, c) DES
Exi
Free surface
RLe No-slip
c
5th Osaka Colloquium, Mar 14-15, 2005, OSAKA, JAPA
a
a
b
Fig. 6 Fr=0.37 free-surface elevation RMS: a) EFD,
b) RANS, c) DES (contoured by half of actual values)
b
c
N 10

Fig. 7 Fr=0.37 free surface dominant FFT: a) EFD, b) URANS, c) DES
Fig. 8 Free surface elevation at x=0.74, y=0.12 Time history and FFT: a) EFD, b) URANS
Fig. 9 Free surface elevation at x=0.49, y=0.1948, Time history and FFT: a) EFD, b) DES
a
a b c Fig. 10 Fr=0.37 mean surface pressures: a) EFD, b)
URANS, c) DES b
c
a b c Fig. 11 Fr=0.37 surface pressures RMS: a) EFD, b)
URANS, c) DES
a a b c
Fig. 12 Fr=0.37 surface pressures dominant frequencies: a) EFD, b) URANS, c) DES
b
a
0 1 2 3 4 5 60
0.001
0.002
0.003
0.004
0.005
0.006
0.007
0.008
Freq
con
tent
frequency (non-dim)0 1 2 3 4 5 6 7 8 9 10
-0.1
-0.05
0
0.05
0.1
0.15
Ele
vatio
n, Z
/L
t im e
X= 0.49,Y = 0.1948
wave elevationrunning m eanrunning rm s
b a
Fig. 13 Foil-surface pressure at (x=0.736,z= -0.078;
Time history and FFT: a) EFD, b) URANS b
5th Osaka Colloquium, Mar 14-15, 2005, OSAKA, JAPAN 11
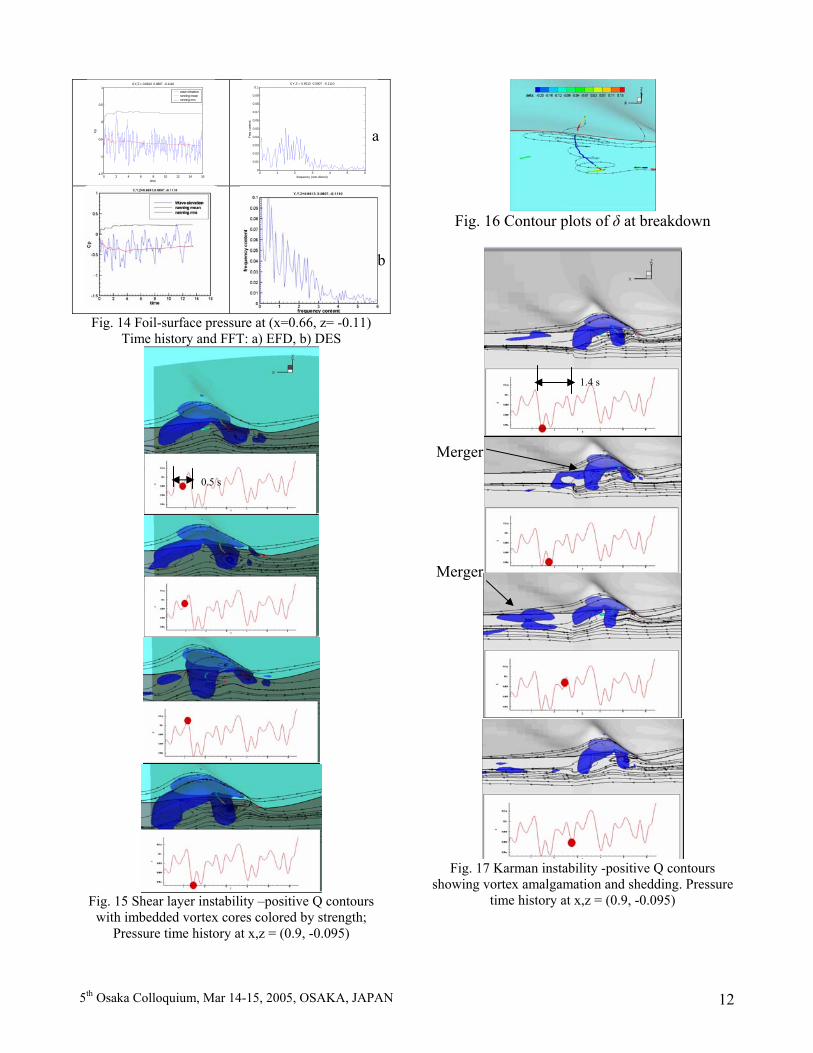
Fig. 14 Foil-surface pressure at (x=0.66, z= -0.11)
Time history and FFT: a) EFD, b) DES
Fig. 15 Shear layer instability –positive Q contours
with imbedded vortex cores colored by strength; Pressure time history at x,z = (0.9, -0.095)
0 2 4 6 8 10 12 14 16-1.5
-1
-0.5
0
0.5
1
Cp
time
X,Y,Z = 0.6613 0.0807 -0.1110
wave elevationrunning meanrunning rms
0 1 2 3 4 5 60
0.01
0.02
0.03
0.04
0.05
0.06
0.07
0.08
0.09
0.1
Freq
con
tent
frequency (non-dimen)
X,Y,Z = 0.6613 0.0807 -0.1110
a
Fig. 16 Contour plots of δ at breakdown
b
Fig. 17 Karman instability -positive Q contours
showing vortex amalgamation and shedding. Pressure time history at x,z = (0.9, -0.095)
Merger
Merger
1.4 s
0.5 s
5th Osaka Colloquium, Mar 14-15, 2005, OSAKA, JAPAN 12

Fig. 18 Top view of shear layer flapping: a) high mode, b) low mode
Fig. 19 Shear layer instability –positive Q (30)
contours showing vortex shedding with time history of CTX (DES).
Fig. 20 Fr=0.37 necklace vortex tubes (Q=10) in the
bow region (DES)
Total
Fig. 21 Fr=0.37, m otal Reynolds stress: a) URANS, b oints:
53
a
Modeled Resolved odeled, resolved and t
) DES (grid p1,006)
ig. 22 Fr=0.37, a.) Iso-surface of TKE (0.03), DES
of TKE (0F
b) Iso-surface .1), URANS
b
cut, y=0.12
0.5
a) b)
Fig. 23 Single-phase level- t instantaneous solutions: a) wave elevation on free surface, b) wave profile at
cut y=0.12 with streamlines.
se
Fig. 24 Time history and FFT of CTX for URANS and
DES using single-phase level-set method
5th Osaka Colloquium, Mar 14-15, 2005, OSAKA, JAPAN 13

5th
Chart 1 Stθ for different geometries
0
0.00
0.
5
01
0.015
0.02
inviscidtheory
jets (E) m ixing bump (E) ai (C)layer(E/C)
rfoil naca24 naca24 naca 242D Fr=0.37 Fr=0.37
mixinglayer (E)
BFS (E/C)
Laminar Turbulent
Table 1. Grids used for verification
Cases
2D
2D
Fr0.37
Fr0.37 At fs
Grids 1 2 3 4 5 6
Osaka Colloquium, Mar 14-15, 2005, OSAKA, JAPAN 14
Table 2 Laminar instability analysis
70,680 114,048 187,824 316,200 531,006 1,004,400
Re
θ US fSL Stθ h fkar StU =2/1ReDS
SL
UDF
1500 0.33 0.081 0.0135 0.012 1.14 0.6 0.0126 0.28
4 0. 0.0123 0.28 0.34 0.083 0.0126 2500 0.01 1.1 7
1500 0.025 0.0065 1.3 1.26 0.0126 0.45 0.2 0.069
2500 0.005 1.3 0.013 0.45 0.2 0.069 0.026 1.69


![marne-ke-baad-kiya-hoga? - [hindi-book] by: Tariq-Murtaza](https://img.pdfslide.us/doc/110x75/5571f81a49795991698ca385/marne-ke-baad-kiya-hoga-hindi-book-by-tariq-murtaza.jpg)