Embed Size (px)
Citation preview
THEORETICAL NOTE
Unrealistic Optimism About Future Life Events: A Cautionary Note
Adam J. L. Harris and Ulrike HahnCardiff University
A robust finding in social psychology is that people judge negative events as less likely to happen tothemselves than to the average person, a behavior interpreted as showing that people are “unrealisticallyoptimistic” in their judgments of risk concerning future life events. However, we demonstrate howunbiased responses can result in data patterns commonly interpreted as indicative of optimism for purelystatistical reasons. Specifically, we show how extant data from unrealistic optimism studies investigatingpeople’s comparative risk judgments are plagued by the statistical consequences of sampling constraintsand the response scales used, in combination with the comparative rarity of truly negative events. Weconclude that the presence of such statistical artifacts raises questions over the very existence of anoptimistic bias about risk and implies that to the extent that such a bias exists, we know considerably lessabout its magnitude, mechanisms, and moderators than previously assumed.
Keywords: wishful thinking, response scale bias, probability estimates, human rationality
For almost 30 years now, it has been the received wisdom that“people have an optimistic bias concerning personal risk” (Wein-stein, 1989b, p. 1232); that is, they “tend to think they are invul-nerable” (Weinstein, 1980, p. 806) and “are often overoptimisticabout the future” (Chambers, Windschitl, & Suls, 2003, p. 1343).This is based on the phenomenon, often referred to as unrealisticoptimism, whereby people seemingly perceive their own future asmore positive than the average person’s. Specifically, people ratenegative future events as less likely to happen to themselves thanto the average person and positive events as more likely to happento themselves than to the average person (e.g., Burger & Burns,1988; Campbell, Greenauer, Macaluso, & End, 2007; D. M. Harris& Guten, 1979; P. Harris & Middleton, 1994; Kirscht, Haefner,Kegeles, & Rosenstock, 1966; Lek & Bishop, 1995; Otten & vander Pligt, 1996; Perloff & Fetzer, 1986; Regan, Snyder, & Kassin,1995; Weinstein, 1980, 1982, 1984, 1987; Weinstein & Klein,1995; Whitley & Hern, 1991).
Not only is unrealistic optimism seemingly a firmly establishedempirical phenomenon, it is also deeply embedded in applied work
pertaining to risk perception and risk behavior, as documented bythe sizeable literature relating to the phenomenon within healthpsychology (e.g., Cohn, Macfarlane, Yanez, & Imai, 1995; Ger-rard, Gibbons, Benthin, & Hessling, 1996; Gerrard, Gibbons, &Bushman, 1996; Hampson, Andrews, Barckley, Lichtenstein, &Lee, 2000; Lek & Bishop, 1995; Rothman & Kiviniemi, 1999; vander Velde, Hooykas, & van der Pligt, 1992; van der Velde & vander Pligt, 1991; van der Velde, van der Pligt, & Hooykas, 1994;Weinstein, 1999, 2000; Weinstein & Klein, 1996; Welkenhuysen,Evers-Kiebooms, Decruyenaere, & van den Berghe, 1996). Here,researchers and practitioners are concerned that people will nottake the necessary preventative steps to protect themselves becausethey underestimate their chances of contracting disease. It sufficesto say, a clear understanding of the psychology of risk perceptionis essential for the effective communication of health information.
Not only has the basic finding of unrealistic optimism been repli-cated in many studies, but there has also been detailed investigation ofpotential mediators of the unrealistic optimism effect. Evidence hasbeen found in support of cognitive mediators of the effect as well asfor the contention that the effect results from a self-serving motiva-tional bias designed to protect self-esteem and guard against depres-sion (for reviews, see Chambers & Windschitl, 2004; Helweg-Larsen& Shepperd, 2001; Taylor & Brown, 1988).
Unrealistic optimism about risk is often viewed as but oneaspect of a more general self-enhancement bias that also encom-passes phenomena such as the planning fallacy (e.g., Buehler &Griffin, 2003; Buehler, Griffin, & MacDonald, 1997; Buehler,Griffin, & Ross, 1994; Kahneman & Tversky, 1979), the illusionof control (e.g., Langer, 1975; Langer & Roth, 1975), people’stendency to overestimate their own skill relative to others (theso-called better-than-average effect; e.g., Svenson, 1981), andfindings of overconfidence in judgment (e.g., Kahneman & Tver-sky, 1973). Though we return briefly to critiques of this wider setof phenomena in our Conclusions section, the immediate focus ofthis article is on how one might know that people’s judgments of
This article was published Online First November 8, 2010.Adam J. L. Harris and Ulrike Hahn, School of Psychology, Cardiff
University, Cardiff, Wales.Adam J. L. Harris was partly supported by an Economic and Social
Research Council (ESRC) studentship and partly by ESRC Grants RES-000-22-3339 and RES-062-23-0952. We thank Jacky Boivin for helpfulcomments on an earlier version of this manuscript. We also thank theCognitive Group and Social Psychology Club at Cardiff University’sSchool of Psychology for helpful discussion of this work. Finally, we wishto thank Don Moore for a very helpful exchange about optimism andregression.
Correspondence concerning this article should be addressed to AdamJ. L. Harris, who is now at Department of Cognitive, Perceptual and BrainSciences, University College London, Gower Street, London, WC1E 6BT,United Kingdom. E-mail: [email protected]
Psychological Review © 2010 American Psychological Association2011, Vol. 118, No. 1, 135–154 0033-295X/10/$12.00 DOI: 10.1037/a0020997
135

the likelihood of experiencing certain future events are genuinelyunrealistically optimistic. The term unrealistic optimism will hencebe used to refer specifically to judgments about risk for future lifeevents.
In the present article, we reexamine the methods of unrealisticoptimism research and seek to show how the results of studiesdemonstrating unrealistic optimism could parsimoniously beviewed as statistical artifacts rather than demonstrations of agenuine human bias. Specifically, we show how responses madeby participants in typical studies could result from accurate prob-abilistic knowledge but seemingly imply optimism due to thestatistical mechanisms of scale attenuation and minority undersam-pling. Seeming optimism could further be exaggerated through thestatistical mechanism of regressive base rate estimates. This callsinto question the widely held view that people are unrealisticallyoptimistic. Furthermore, we show that the majority of “known”moderators of unrealistic optimism are also consistent with theimpacts of these statistical confounds. These moderators are cen-tral to both theory development and practical applications; it thusseems imperative that they be conceptually and empirically reeval-uated in light of these artifacts, even if robust evidence for agenuine optimistic bias can be gained from other methods that donot suffer from these problems. In summary, we argue that thepresence of confounding artifacts means, at the very least, that weknow considerably less about the unrealistic optimism phenome-non than is presently assumed.
The Methodology of Unrealistic Optimism Research
It is usually impossible to demonstrate that an individual’s optimisticexpectations about the future are unrealistic. An individual might bequite correct in asserting that his or her chances of experiencing anegative event are less than average. (Weinstein, 1980, p. 806)
Without detailed individual knowledge about our participants,coupled (ideally) with an ability to see into the future, it isimpossible to determine whether a specific individual is accuratein stating that he or she is less likely to experience a given eventthan the average person. However, it has been assumed that therealism of people’s expectations can readily be assessed at a grouplevel. Campbell et al. (2007, p. 1275; see also Bauman & Siegel,1987, p. 331; Taylor & Brown, 1988, p. 194), for example, statedthat “on a group level unrealistic optimism is evident when themajority of respondents feel that negative events are less likely tohappen to them than the average person.” Both the terms majorityand average are ambiguous. Majority can refer simply to thelargest group (a simple majority) or to a group that constitutesmore than 50% (an absolute majority); average, of course, canrefer to a mean, median, or mode. In terms of detecting “unreal-ism,” simple majorities are useless, as it is readily possible to bethe largest group but nevertheless be below average, whether theaverage is assessed by the mean, median, or mode, as shown inthe left panel of Figure 1 (see also von Hippel, 2005). Absolutemajorities, however, are only somewhat more constraining, and itis still possible for more than 50% of observations to lie below themean or mode. Only a moderate degree of skew and a limitedrange of values are enough to give rise to distributions (such as inthe right panel of Figure 1) where the absolute majority is above orbelow the mean (see also Moore, 2007a; Weinstein, 1980, p. 809).
Moreover, many real-world distributions have this property. In par-ticular, it arises readily for binomial distributions associated withbinary outcomes, for example, whether or not a person will experi-ence a given negative life event.
Nevertheless, it has been suggested that further constraints onthe size of the majority allow the desired inference. For example,McKenna (1993, p. 39) proposed that “when as a group, the vastmajority perceive their chances of a negative event as being lessthan average then clearly this is not just optimistic but also unre-alistic.” The validity of such a conclusion depends on the fre-quency of the event being judged. The negative events used inunrealistic optimism studies are typically rare. To illustrate, can-cer, which is a disease generally considered to be quite prevalent,will affect less than half the population, approximately 40% (Of-fice for National Statistics [ONS], 2000).1 Moreover, contractingcancer is one of the least rare of the negative events typically usedin unrealistic optimism studies. In most studies a specific type ofcancer is specified. Weinstein (1982), for example, not only usedcancer, but also lung cancer and skin cancer, and reported unre-alistic optimism only for the two specific (and hence rarer) items.Lung cancer is the most common form of cancer in men and thethird most common in women. However, it is predicted that onlyapproximately 8.0% of men and 4.3% of women will contract lungcancer (ONS, 2000), that is, approximately 6% of the populationoverall.
In order to clarify the impact of event rarity, and to aid oursubsequent exposition of the statistical problems associated withstandard tests of unrealistic optimism, we introduce a simplethought experiment that we refer back to throughout this article.
A Thought Experiment: “Unrealistic Optimism” inPerfect Predictors
In this thought experiment, we initially assume that people haveperfect knowledge (an assumption that will subsequently be re-laxed). Because they have perfect knowledge, people know (forcertain) whether or not they will eventually contract Disease X,which has a lifetime prevalence of 5% (i.e., in the course of theirlifetime, 5% of people will contract Disease X). As they areperfect, our perfect predictors also know that the prevalence (baserate) of Disease X is 5%.
Experiment. Participants are asked whether they have achance of contracting Disease X that is smaller than, greater than,or the same as the average person’s.
Thought process. Participants know whether or not they willcontract the disease and thus assign a percentage of either 0% or100% to their chance. Participants also know the base rate of thedisease, which is the best answer they can give to the question“What is the chance of the average person . . .” (see also Klar,Medding, & Sarel, 1996). Consequently, they assign the averageperson a chance of 5%. To answer the question posed, participantswould compare their chance (0% or 100%) with the averageperson’s chance (5%) to report whether their chance is smallerthan or greater than the average person’s.
Results. Ninety-five percent of these participants (a percent-age presumably sufficiently high to be classified as a vast major-
1 All prevalence statistics reported are for England and Wales.
136 HARRIS AND HAHN

ity), knowing that their chance of catching Disease X is 0%, willaccurately report that they are less likely to contract the diseasethan the average person, whilst just 5% of participants will reportthat they are more likely to contract the disease than the averageperson. Crucially, the reports of these perfect predictors cannot (bydefinition) be unrealistic.
In other words, even a “vast majority” of people indicating thattheir chance of experiencing the event in question is less than theaverage person’s cannot guarantee that this group of people hasanything other than entirely realistic expectations. For sufficientlyrare events, not just the majority but also the “vast majority” ofpeople can genuinely have a less than average (mean) chance ofexperiencing those events.
In summary, any evaluation based merely on the number ofpeople providing an “optimistic” response relative to the numberproviding a nonoptimistic response is insufficient evidence that agroup of people are unrealistic in their reports.
A Different Methodology
The most popular measure for assessing unrealistic optimismwas first used by Weinstein (1980). This direct method does notask participants simply to indicate whether their chance of expe-riencing a given event is greater or less than the average person’s.Rather, participants are required to make a comparative, quantita-tive response indicating the degree to which they are more or lesslikely to experience an event than the average person. The logic ofthis approach is simple: Within a population, the average of allparticipants’ individual levels of risk should equal the average riskin that population. For example, with our perfect predictors, 95%of them have a 5% less than average chance (�5%) of contractingDisease X, whilst 5% have a 95% greater than average chance(�95%). If the members of this population accurately report thesepercentage differences, the mean of their responses will be (95% ��5) � (5% � 95) � 0. Consequently, a population average less
than zero would suggest that at least some of the population areunrealistically optimistic regarding this negative event. Weinsteinfound mean responses less than zero for negative events andgreater than zero for positive events. Thus, Weinstein’s partici-pants were seemingly unrealistically optimistic, perceiving theirfuture as likely to be rosier than that of the average person.
A variant of this methodology that is less widely used is theso-called indirect method (e.g., Dewberry, Ing, James, Nixon, &Richardson, 1990; Dewberry & Richardson, 1990; Eysenck& Derakshan, 1997; Hoorens & Buunk, 1993; Miller, Ashton, &McHoskey, 1990; Pietromonaco & Markus, 1985; Pyszczynski,Holt, & Greenberg, 1987; Salovey & Birnbaum, 1989; van derVelde et al., 1992, 1994; van der Velde & van der Pligt, 1991; fora review see Helweg-Larsen & Shepperd, 2001). Within thisparadigm, participants provide estimates of the average person’schance of experiencing an event and of their own chance ofexperiencing that same event. A relative judgment is then calculatedby the experimenter, who subtracts the participant’s judgment of theaverage person’s chance from his or her judgment of self risk. Thisprocedure yields a difference score, which (for negative events) istaken as evidence for relative optimism if negative.
In the following, we demonstrate that both these methodologiesare vulnerable to statistical artifacts from three different mecha-nisms: scale attenuation, minority undersampling, and base rateregression. We first demonstrate how any one of these statisticalmechanisms allows unbiased participants to falsely appear unre-alistically optimistic. We then detail the extent to which thesemechanisms fit with what is known about the determinants of(seeming) unrealistic optimism. All of this suggests a possiblealternative account for the data of unrealistic optimism studieswhereby it is the rare nature of the negative events most frequentlystudied that leads to a statistical illusion of an optimistic bias. Inthe presence of such confounds, it is evident that we know less aboutthe optimism of people’s risk judgments about future life events than
Figure 1. Sample distributions in which the majority outcome is less than the average. The histogramsrepresent the outcome distributions of simple simulations of binomial numbers. The left panel shows the resultsof 10,000 samples of 100 trials of a binomial process in which the probability of success is .1. The right panelpresents a simulation result for a binomial process in which the probability of a success is .005.
137UNREALISTIC OPTIMISM: A CAUTIONARY NOTE
presently believed. We conclude with general considerations for thefuture of unrealistic optimism research.
The Statistical Mechanisms
The First Mechanism: Scale Attenuation
The effects of scale attenuation differ somewhat across thedirect and indirect methods of optimism research. Hence, we dealwith each of these in turn.
Scale attenuation and the direct method. Unrealistic opti-mism studies using Weinstein’s (1980) direct method of compar-ative responses generally do not use a continuous –100% to�100% response scale. Rather, the response scale typically used inthis paradigm is a 7-point scale from –3 (chances much less thanthe average person’s) to �3 (chances much greater than theaverage person’s; e.g., Covey & Davies, 2004; Klar et al., 1996;Price, Pentecost, & Voth, 2002; Weinstein, 1982, 1984, 1987;Weinstein & Klein, 1995). It is the nature of this attenuatedresponse scale that could be producing the results most commonlyinterpreted as demonstrating unrealistic optimism, as we first dem-onstrate with further reference to the thought experiment outlinedpreviously.
In this version of our thought experiment, our perfect predictorsare required to make a response on a –3 to �3 response scaleregarding their relative chance of catching Disease X, which, onceagain, has a base rate of 5%. Thus 95% of these participants knowfor certain that they have a slightly lower chance than the averageperson of catching Disease X (because 0% is 5% less than the 5%average) and hence circle –1 on the response scale.2 Five percentof these participants know for certain that they have a much greaterchance than the average person of catching this disease (because100% is 95% greater than 5%) and therefore circle �3 on theresponse scale. The mean response of our population of perfectpredictors is therefore –0.8 and not 0. Indeed, even for a repre-sentative sample of just 20 participants, the standard analysis ofsuch data would find significant “unrealistic” optimism, t(19) � 4,p � .001.
At the heart of this seeming paradox, where individually unbi-ased responses lead to a seemingly biased group level response, isthe restricted nature of the response scale. The choice of the –3 to�3 response scale was justified in the original unrealistic opti-mism studies with the following considerations: “It emphasizes thecomparative aspect of the risk judgments, does not demand unnat-ural numerical estimates (such as percentile rankings), and, unlikea scale used previously (Weinstein, 1980), is not vulnerable to afew extreme responses” (Weinstein, 1982, p. 446, footnote 2,emphasis added).
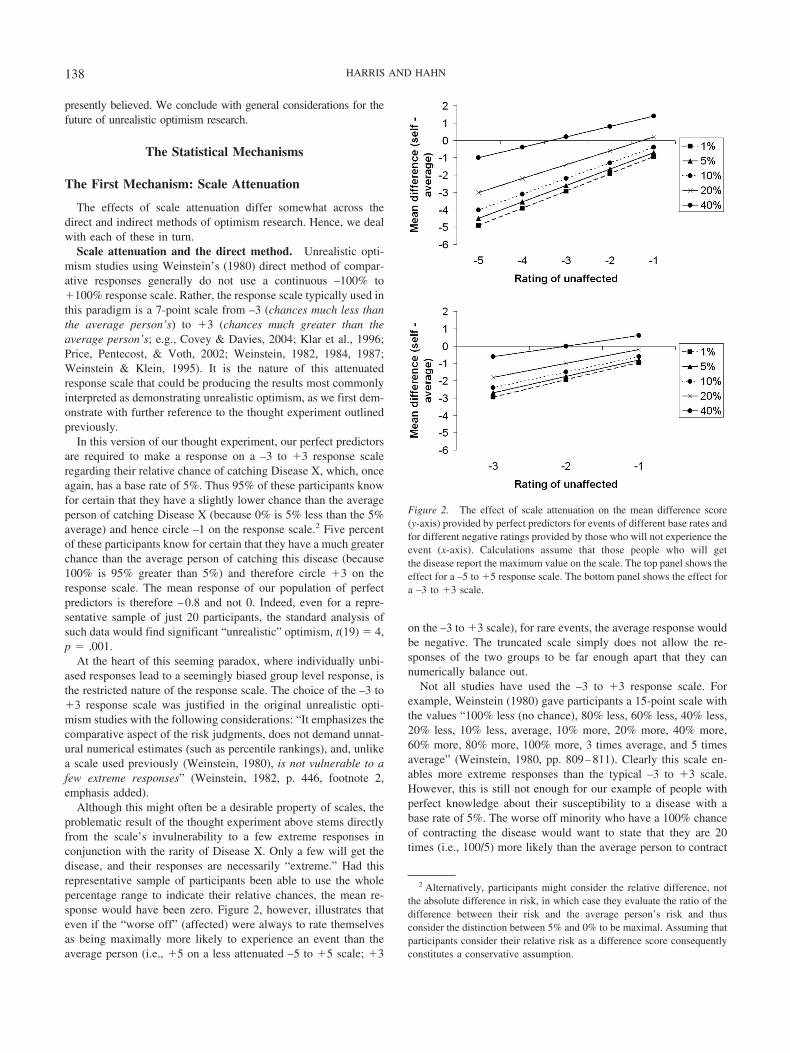
Although this might often be a desirable property of scales, theproblematic result of the thought experiment above stems directlyfrom the scale’s invulnerability to a few extreme responses inconjunction with the rarity of Disease X. Only a few will get thedisease, and their responses are necessarily “extreme.” Had thisrepresentative sample of participants been able to use the wholepercentage range to indicate their relative chances, the mean re-sponse would have been zero. Figure 2, however, illustrates thateven if the “worse off” (affected) were always to rate themselvesas being maximally more likely to experience an event than theaverage person (i.e., �5 on a less attenuated –5 to �5 scale; �3
on the –3 to �3 scale), for rare events, the average response wouldbe negative. The truncated scale simply does not allow the re-sponses of the two groups to be far enough apart that they cannumerically balance out.
Not all studies have used the –3 to �3 response scale. Forexample, Weinstein (1980) gave participants a 15-point scale withthe values “100% less (no chance), 80% less, 60% less, 40% less,20% less, 10% less, average, 10% more, 20% more, 40% more,60% more, 80% more, 100% more, 3 times average, and 5 timesaverage” (Weinstein, 1980, pp. 809–811). Clearly this scale en-ables more extreme responses than the typical –3 to �3 scale.However, this is still not enough for our example of people withperfect knowledge about their susceptibility to a disease with abase rate of 5%. The worse off minority who have a 100% chanceof contracting the disease would want to state that they are 20times (i.e., 100/5) more likely than the average person to contract
2 Alternatively, participants might consider the relative difference, notthe absolute difference in risk, in which case they evaluate the ratio of thedifference between their risk and the average person’s risk and thusconsider the distinction between 5% and 0% to be maximal. Assuming thatparticipants consider their relative risk as a difference score consequentlyconstitutes a conservative assumption.
Figure 2. The effect of scale attenuation on the mean difference score(y-axis) provided by perfect predictors for events of different base rates andfor different negative ratings provided by those who will not experience theevent (x-axis). Calculations assume that those people who will getthe disease report the maximum value on the scale. The top panel shows theeffect for a –5 to �5 response scale. The bottom panel shows the effect fora –3 to �3 scale.
138 HARRIS AND HAHN
the disease. The 15-point scale still does not, however, allow forsuch a response. Consequently, it can still give rise to an artifactualeffect of seeming optimism, although the effect will be less pro-nounced.
That greater scale attenuation leads to (seemingly) greater un-realistic optimism is demonstrated by comparing the two panels ofFigure 2. Figure 2 displays statistical optimism (mean differenceless than zero) and pessimism (mean difference greater than zero)in samples of perfect predictors for diseases with different baserates and in situations where the “better off” majority (unaffectedby the disease) report different less-than-average chances. Forexample, in situations where the unaffected report –1, greater“optimism” will be observed using the –3 to �3 response scale(bottom panel) than the less attenuated –5 to �5 scale (top panel).
Consistent with the proposed role of scale attenuation in unre-alistic optimism data is the empirical finding that greater optimismis observed when participants are given an attenuated (–4 to �4)scale than when they are given a larger (–100 to �100) scale(Otten & van der Pligt, 1996).
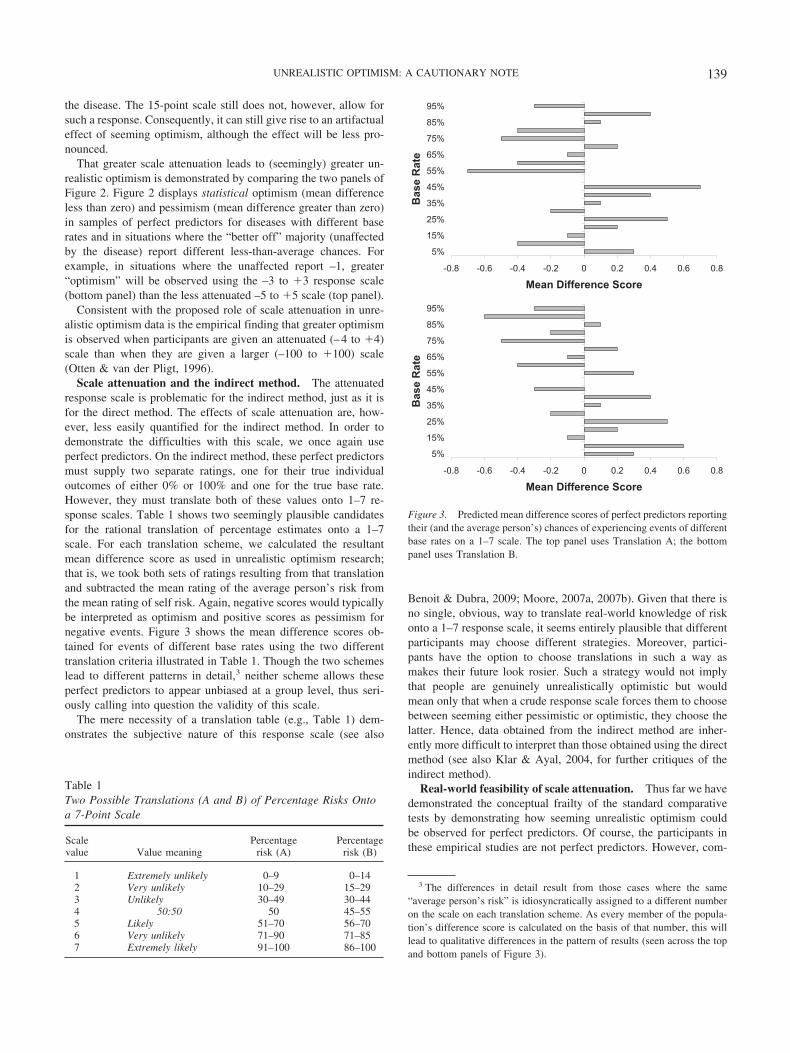
Scale attenuation and the indirect method. The attenuatedresponse scale is problematic for the indirect method, just as it isfor the direct method. The effects of scale attenuation are, how-ever, less easily quantified for the indirect method. In order todemonstrate the difficulties with this scale, we once again useperfect predictors. On the indirect method, these perfect predictorsmust supply two separate ratings, one for their true individualoutcomes of either 0% or 100% and one for the true base rate.However, they must translate both of these values onto 1–7 re-sponse scales. Table 1 shows two seemingly plausible candidatesfor the rational translation of percentage estimates onto a 1–7scale. For each translation scheme, we calculated the resultantmean difference score as used in unrealistic optimism research;that is, we took both sets of ratings resulting from that translationand subtracted the mean rating of the average person’s risk fromthe mean rating of self risk. Again, negative scores would typicallybe interpreted as optimism and positive scores as pessimism fornegative events. Figure 3 shows the mean difference scores ob-tained for events of different base rates using the two differenttranslation criteria illustrated in Table 1. Though the two schemeslead to different patterns in detail,3 neither scheme allows theseperfect predictors to appear unbiased at a group level, thus seri-ously calling into question the validity of this scale.
The mere necessity of a translation table (e.g., Table 1) dem-onstrates the subjective nature of this response scale (see also
Benoit & Dubra, 2009; Moore, 2007a, 2007b). Given that there isno single, obvious, way to translate real-world knowledge of riskonto a 1–7 response scale, it seems entirely plausible that differentparticipants may choose different strategies. Moreover, partici-pants have the option to choose translations in such a way asmakes their future look rosier. Such a strategy would not implythat people are genuinely unrealistically optimistic but wouldmean only that when a crude response scale forces them to choosebetween seeming either pessimistic or optimistic, they choose thelatter. Hence, data obtained from the indirect method are inher-ently more difficult to interpret than those obtained using the directmethod (see also Klar & Ayal, 2004, for further critiques of theindirect method).
Real-world feasibility of scale attenuation. Thus far we havedemonstrated the conceptual frailty of the standard comparativetests by demonstrating how seeming unrealistic optimism couldbe observed for perfect predictors. Of course, the participants inthese empirical studies are not perfect predictors. However, com-
3 The differences in detail result from those cases where the same“average person’s risk” is idiosyncratically assigned to a different numberon the scale on each translation scheme. As every member of the popula-tion’s difference score is calculated on the basis of that number, this willlead to qualitative differences in the pattern of results (seen across the topand bottom panels of Figure 3).
Table 1Two Possible Translations (A and B) of Percentage Risks Ontoa 7-Point Scale
Scalevalue Value meaning
Percentagerisk (A)
Percentagerisk (B)
1 Extremely unlikely 0–9 0–142 Very unlikely 10–29 15–293 Unlikely 30–49 30–444 50:50 50 45–555 Likely 51–70 56–706 Very unlikely 71–90 71–857 Extremely likely 91–100 86–100
-0.8 -0.6 -0.4 -0.2 0 0.2 0.4 0.6 0.8
5%
15%
25%
35%
45%
55%
65%
75%
85%
95%
Bas
e R
ate
Mean Difference Score
-0.8 -0.6 -0.4 -0.2 0 0.2 0.4 0.6 0.8
5%
15%
25%
35%
45%
55%
65%
75%
85%
95%
Bas
e R
ate
Mean Difference Score
Figure 3. Predicted mean difference scores of perfect predictors reportingtheir (and the average person’s) chances of experiencing events of differentbase rates on a 1–7 scale. The top panel uses Translation A; the bottompanel uses Translation B.
139UNREALISTIC OPTIMISM: A CAUTIONARY NOTE
plete knowledge of the future is not required in order for themechanism of scale attenuation to exert an influence, and we nextdemonstrate how the same statistical effects arise with only partial(but again, intuitively realistic) knowledge of the future. People’sknowledge of both their personal risk and the general, average risk(base rate) stems from a variety of sources: Accessible healthcare,public information campaigns, personal experience, and familyhistory all provide informative cues regarding the chance of con-tracting a certain disease. In fact, regarding personal risk, thestrongest predictor is typically also the most accessible, given that“for many common diseases, having an affected close relative isthe strongest predictor of an individual’s lifetime risk of develop-ing the disease” (Walter & Emery, 2006, p. 472). For example, alongitudinal study investigating the relationship between familyhistory and risk of coronary heart disease illustrated that relativerisk is substantially different for men with and without a familyhistory of heart disease. Hawe, Talmud, Miller, and Humphries(2003) reported that men with a family history of heart diseasewere 1.73 times more likely to suffer a “coronary heart diseaseevent” than men without a family history. Added to this, smokerswith a family history were 3.01 times more likely to suffer acoronary heart disease event than nonsmokers with no familyhistory. Were an unrealistic optimism study conducted with asample in possession of this knowledge (because they had heardabout this research, for example), what would the results look like?
To make this example “real,” one can simply use the actualfigures from the Hawe et al. (2003) study. Here, 6.6% of all menin the study had a coronary event during the follow-up period. This6.6% constitutes the “average risk” against which men shouldcompare themselves (see also Klar et al., 1996). The rate of heartattack in those reporting a family history of heart attack was 9.0%;it was 5.3% for those without. Given this, we can simulate theresponses from these two different groups on a –3 to �3 unreal-istic optimism scale with the simplification that knowledge offamily history is the only risk indicator these individuals possess.In Hawe et al.’s study, 1,827 men answered “no” to the question“Has any person in your family ever had a heart attack?” (Hawe etal., 2003, p. 99). Comparing the actual rate of 5.3% within thatgroup with the overall base rate, 6.6%, it would seem reasonable(and realistic) for all 1,827 of these men to answer “–1” (i.e., “I amslightly less likely than the average person to suffer a heartattack”). Exactly 1,000 men reported a family history of heartattack. For these men it would seem reasonable (and realistic) toanswer “�1” (i.e., “I am slightly more likely than the averageperson to suffer a heart attack”). An increase in risk from 6.6% to9.0% does not seem to merit a response higher than this on thescale (though clearly how people believe they should convert sucha relative risk onto such a response scale is an empirical question;see also footnote 2). Given this overall set of plausible and rationalseeming responses, what would be the result of the statisticalanalysis of this hypothetical unrealistic optimism study? The meanresponse from all 2,827 men would equal –0.29, and the standardsingle-sample t test would confirm that this is significantly lessthan zero, t(2826) � 16.26, p � .001. Thus, such responses wouldbe interpreted by an unrealistic optimism researcher as demon-strating unrealistic optimism.4 Moreover, a representative sampleof only 60 people from these 2,827 would give rise to a significanteffect of seeming unrealistic optimism, with 39 reporting –1 and21 reporting �1, t(59) � 2.42, p � .02. Once again, however, the
responses made by each individual seem perfectly realistic. Theobserved effect stems entirely from the rarity of the event and thelow discriminability of an attenuated response scale. This againdemonstrates the unsatisfactory nature of using group data to infera bias at the level of the individual. In the above example, it wouldbe hard to argue that any of the individuals’ responses were biased,but the group level results suggest exactly that.
More generally, any individual can have some knowledge re-flecting a disease’s base rate and, typically, some personal infor-mation that increases or decreases his or her own likelihood ofcontracting the disease. According to the normative procedure forestimating individual risk (see, e.g., Hardman, 2009; Kahneman &Tversky, 1973), the rational person should combine these twopieces of knowledge using Bayes’ theorem to calculate his or herown chance of contracting the disease. Even on the basis of a testresult with extremely limited diagnosticity, the responses of en-tirely rational individuals can easily result in seemingly unrealisticoptimism at a group level, once the responses are translated ontoan attenuated, –3 to �3, response scale.
The diagnosticity of a test is captured in the ratio between a truepositive test result, P(e|h), and a false positive test result, P(e|¬h),where evidence e is a positive test result, hypothesis h is contract-ing the disease, and ¬ is the negation symbol (i.e., ¬h means “noth”). Equations 1 and 2 (Bayes’ theorem) show the normativeupdating of belief in contracting a disease, given a positive testresult, P(h|e), and a negative test result, P(h|¬e), respectively. Inthese equations, P(h) represents the prior degree of belief thatDisease X will be contracted, which, if people are rational andpossess accurate knowledge, would equal the disease base rate (seealso Klar et al., 1996).
P(h�e) �P(h)P(e�h)
P(h)P(e�h) � P(¬ h)P(e�¬ h)(1)
P(h�¬ e) �P(h)P(¬ e�h)
P(¬ h)P(¬ e�¬ h) � P(h)P(¬ e�h)(2)
The actual proportion of people in the population who will receivea positive or negative test result is given by Equations 3 and 4,respectively.
P(h)P(e�h) � P(¬ h)P(e�¬ h) (3)
P(h)P(¬ e�h) � P(¬ h)P(¬ e�¬ h) (4)
We can now consider again a case like lung cancer with its baserate of 6% (ONS, 2000). To demonstrate, we assume that the ratiobetween true positives and false positives (the likelihood ratio) isonly 1.5:1; that is, P(e|h) � .6 and P(e|¬h) � .4. In other words,a positive test result is only marginally more likely if the hypoth-esis is true than if it is not. Finally, the same ratio is assumed to
4 This simulation is dependent on the assumption that those men with afamily history reported �1. We argue that this does not seem to constitutea biased response. For the reader who disagrees with this assumption, theinsufficiency of the response scale is demonstrated by showing that werethese individuals to report �2, the mean response would be 0.05, not zero,thus suggesting unrealistic pessimism in the population. The crucial pointis that this method is not consistent with the status of an average of zerobeing the gold standard of rationality, as is generally believed.
140 HARRIS AND HAHN
hold for negative test results. Given the base rate of 6% and thesetest characteristics, Equations 1–4 mean that, overall, 41% ofpeople should rate their chance of contracting lung cancer as 8.7%,and 59% of people should rate their chance as 4.1%. Were partic-ipants to report these figures on a continuous response scale, theirresponses would average out to equal 6%, that is, the base rate oraverage person’s risk.
However, participants must translate these figures onto a –3 to�3 response scale. It is not obvious how participants should dothis. However, the deviations from the base rate seem comparablefor both those receiving a positive test result and those receiving anegative result: 8.7% versus 6% for the “worse off” and 4.1% vs.6% for the “better off”. Consequently, 41% of responses of �1 forthe worse off might rationally be combined with 59% of responsesof –1 for the better off, resulting in an average response of –0.18.Even on the basis of such a nondiagnostic test result, significant“optimism” would be observed in a representative sample of 115participants, t(114) � 1.98, p � .05. This effect stems solely fromthe attenuated nature of the response scale used. Once again,entirely rational responses at the individual level resemble a bias atthe group level on such an attenuated scale. Less than perfectknowledge simply diminishes the effect somewhat, both for adirect and an indirect scale.
Empirical support for the notion that people both have access toand may make use of knowledge about risk factors can be foundwithin the unrealistic optimism literature and in the general liter-ature on risk perception. Though Weinstein (1984) expresseddoubts about a link between actual risk factors and people’srelative judgments, at least one risk factor correlated significantlywith risk judgments for seven out of the 10 events considered inhis study (Weinstein, 1984, Study 3). For one of the remainingthree events (automobile accident injury), no comparative opti-mism was observed either, and for the other two events (suicideand mugging) significant correlations between risk factors and riskjudgment were later observed (Weinstein, 1989a). Subsequentresearch has commonly found that engaging in risky behaviors isassociated with reduced unrealistic optimism (e.g., Cohn et al.,1995; Sparks, Shepherd, Wieringa, & Zimmermanns, 1995; seealso Shepperd, Helweg-Larsen, & Ortega, 2003, for further refer-ences). Finally, general studies on risk perception suggest thatpeople’s estimates of personal risk are grounded in an objectivereality: The more risk behaviors people engage in, the morevulnerable they rate themselves to negative consequences resultingfrom those behaviors (Gerrard, Gibbons, Benthin, & Hessling,1996; Gerrard, Gibbons, & Bushman, 1996; Martha, Sanchez, &Goma-i-Freixanet, 2009).5
In summary, there is evidence to suggest that people have accessto sufficient knowledge and are sufficiently sensitive to it in theirjudgments of risk for scale attenuation to make unbiased individualresponses appear biased at a group level.
The Second Mechanism: Minority Undersampling
Unrealistic optimism studies typically obtain responses from asample of the population and not the population as a whole. It is astatistical consequence of binomial distributions that minorities inthe population are more likely to be underrepresented than over-represented in a sample of that population (for implications of thisfact in other judgment contexts, see Fox & Hadar, 2006; Hertwig,
Barron, Weber, & Erev, 2004; Ungemach, Chater, & Stewart,2009). Consequently, regardless of the response scale chosen orthe methodology used, the worse off minority (those more likelythan the average person to contract the disease) are more likely tobe underrepresented in the sample than are the better off majority.If underrepresented, the crucial influence of the positive responsesfrom the worse off minority on the group average will be missing.Whereas scale attenuation means that the worse off minoritycannot provide sufficiently extreme responses to balance out thebetter off, undersampling means that the responses of some of theworse off are not even there. This too will lead to an overallappearance of optimism in the group data.
If we return to our hypothetical example in which all membersof the population have perfect knowledge as to whether they willcontract a given disease, the mean of these responses (given anunattenuated response scale) will be zero, assuming that responsesare obtained from the whole population. If responses are obtainedonly from a sample of that population, then the mean of theseresponses will equal zero only in the event that the characteristicsof the sample match the characteristics of the population. The factthat the minority are more likely to be undersampled than over-sampled from the population makes it more likely that the meanwill be less than zero as opposed to greater than zero, thus givingthe statistical illusion of an optimistic bias. The magnitude andprevalence of this undersampling can be estimated from distribu-tions such as those shown in Figure 1: Displayed are the results ofsamples drawn from a population in which a binary outcome (e.g.,success/no success reflecting disease/no disease) occurs with abase rate corresponding to the respective probability of success. Asthe base rate becomes lower (right panel vs. left panel) the pro-portion of samples that contain fewer than average successesbecomes more and more extreme.
Figure 4 graphs this excess proportion for different base ratesand sample sizes in order to give a further indication of the effectof event rarity and study sample size on the extent to which the lesslikely outcome (the minority) is undersampled rather than over-sampled relative to the population distribution.
The Third Mechanism: Base Rate Regression
We have already demonstrated how the responses of entirelyrational agents in possession of realistic amounts of partial knowl-edge could lead to data resembling unrealistic optimism as a result
5 The only other exception came from Bauman and Siegel (1987), whoreported that 83% of the gay men in their sample who engaged in sexualpractices that put them at high risk for contracting AIDS (66 men in total)rated the risk of their sexual practices (with regards to contracting AIDS)as 5 or less on a 10-point scale (on which 10 indicated most risky).Eight-five percent of these men reported engaging in at least one practicethat they believed to reduce the risk of AIDS but that objectively made nodifference. Consequently, the underestimation of risk reported in this studymight be a result of an accurate risk assessment based on inaccurateknowledge, rather than reflecting systematic optimism. In addition, Bau-man and Siegel did not include any questions relating to participants’knowledge about their sexual partners. Any men who engaged in high risksexual practices with a partner who they knew to be HIV negative wouldbe quite accurate in reporting the riskiness of these activities as low. In theabsence of such a question, it is difficult to interpret Bauman and Siegel’sresults.
141UNREALISTIC OPTIMISM: A CAUTIONARY NOTE

of scale attenuation and minority undersampling. The idea ofpartial knowledge is crucial to the third and final statistical mech-anism—base rate regression. Given limited knowledge, people’sstatistical estimates are likely to be regressive (e.g., Pfeifer, 1994);that is, they are likely to be less extreme than the true value.
Statistical regression to the mean, as depicted in Figure 5 (toppanel), explains the widely documented phenomenon wherebypeople generally overestimate the frequency of rare events andunderestimate the frequency of common events (on estimates offrequency see, e.g., Attneave, 1953; Lichtenstein, Slovic, Fis-chhoff, Layman, & Combs, 1978; for regression based explana-tions thereof see, e.g., Erev, Wallsten, & Budescu, 1994; Hertwig,Pachur, & Kurzenhauser, 2005; Pfeifer, 1994). Likewise, peopleseem to overestimate, and hence be pessimistic about, the preva-lence of the rare negative events used in unrealistic optimismresearch; this can be seen in those studies employing the indirectmethod where the estimate of average risk is explicitly reportedand the relevant statistics for the population in question are known,as in Klar and Ayal (2004), Rothman, Klein, and Weinstein(1996), and van der Velde et al. (1992).
Regression has already been invoked in explanations of seemingbiases in past research (e.g., Dawes & Mulford, 1996; Erev et al.,1994; Krueger, Acevedo, & Robbins, 2006; Moore, 2007a; Moore& Healy, 2008; Moore & Small, 2007). In particular, Moore andHealy (2008) provided a formalization and elegant experimentaldemonstration of how better-than-average/worse-than-average ef-fects regarding skilled performance might be explained.
We next detail how regressive estimates of event base rate willlead to seeming optimism with our hypothetical, entirely rationalpredictors. As discussed above, the normative, textbook procedurefor deriving estimates of individual risk requires that diagnosticinformation concerning that individual be combined with the baserate via Bayes’ theorem (e.g., Hardman, 2009; Kahneman &Tversky, 1973). Diagnostic information, such as family history,will be either positive or negative (i.e., indicating either greater orlesser risk). Bayes’ theorem ensures that the mean estimate ofindividual risk will equal the group base rate as long as theunderlying base rate estimate is accurate (see the Appendix). Thisis analogous to the way that the mean of a group of “perfect”individual predictions, reporting the true percentage of either 0%or 100%, will, by definition, equal the group base rate; further-
more, it is because Bayesian updating guarantees this equalitybetween mean individual risk and base rate that the procedure isnormative.
If estimates of the base rate itself, however, are regressive, thenthis equality will no longer hold. As we shall show, the mean of theindividual estimates will now be lower than the regressive baserate estimate and so would be interpreted as demonstrating opti-mism. However, this effect arises even though each individual is,in absolute terms, pessimistic: The base rate of rare negative eventsis overestimated, not underestimated, and this overestimation ispropagated into the estimate of individual (self) risk.
The effect of the base rate regression mechanism rests on thediscrepancy between the actual base rate and the perceived baserate. The absolute value of an individual’s self estimate depends onthe perceived base rate (because it is derived from it via Bayesianupdating). The actual number of individuals receiving particulartest outcomes (or any other individuating information such asfamily history), however, is driven by the actual base rate. The testresults necessarily depend on the way the world actually is, not theway it is perceived. As the actual base rate of rare events will belower than the regressive base rate estimate, more participants willreceive negative test results (indicating lesser risk) than is com-patible with the (over)estimated average risk. Hence the mean ofthe self estimates within the sample will be biased and will belower than the perceived base rate, once again suggesting relativeoptimism.
The effect of base rate regression is visualized in the bottompanel of Figure 5. Regressive base rate estimates were simulated
Figure 4. The excess of instances in which the minority was under-sampled relative to the majority. Graphed are the results for 1 millionsimulated samples of size 25–400, for five different base rates.
-4
-3
-2
-1
0
1
2
3
4
1% 5% 10% 20% 30% 40% 50% 60% 80%
Base rateM
ean
diffe
renc
e sc
ore
(%)
y = 0.9x + 0.05y = 0.8x + 0.1y = 0.7x + 0.15
Figure 5. Top panel: The effect of regression to the mean on probabilityestimates. Bottom panel: The effect of such base rate regression on meandifference scores for events of different base rates. Responses are made bypredictors who have a result of a test with a likelihood ratio of 4:1.Responses are made on an unattenuated response scale.
142 HARRIS AND HAHN

using the formula y � mx � c, where x is the objective probability,m is less than 1, and c is solved for the condition where bothobjective (x) and subjective (y) probability estimates equal .5.6 Wecalculated, via Bayes’ theorem (Equations 1 and 2), the effects ofregressive base rate estimates in a population of rational Bayesiansreceiving the outcome of a diagnostic test. For this test, individualswere 4 times more likely to contract the disease if they received apositive test score than if they received a negative test score (i.e.,the test’s hit rate, P(e|h), was .8, and its false positive rate, P(e|¬h),was .2). To demonstrate the effect of this statistical mechanism inisolation, our simulations involved participants rating both theirown and the perceived (regressive) average person’s risk on anunattenuated, continuous, 0–100 scale. Figure 5 (bottom panel)shows the resulting mean difference scores across the range ofbase rates for rare (and not so rare) events, at each of threedifferent levels of regressiveness. As can be seen, normativeupdating from a regressive estimate of the base rate gives rise tomean difference scores that appear optimistic for rare negativeevents.
Unpublished data from our lab provide a crude, first estimate ofthe degree of regressiveness that participants in unrealistic opti-mism studies actually exhibit: Clutterbuck (2008) presented par-ticipants with 10 standard negative events such as contractingparticular cancers, diabetes, or coronary heart disease or being ina road traffic accident. Participants indicated the expected inci-dence within a sample of 1,000 people. Their estimates werecompared with actual figures published by the United Kingdomgovernment and relevant health-related charities (e.g., BritishHeart Foundation). The actual mean rate for the events was ap-proximately 50 per 1,000; participants’ estimates, by contrast,were approximately 200 per 1,000. This corresponds to an objec-tive estimate of 5% and a subjective estimate of 20%. Thus, theregressive estimates assumed in Figure 5 seem psychologicallyplausible and, in fact, might even be considered conservative(however, see also Windschitl, 2002, on potential difficulties as-sociated with the interpretation of such data).
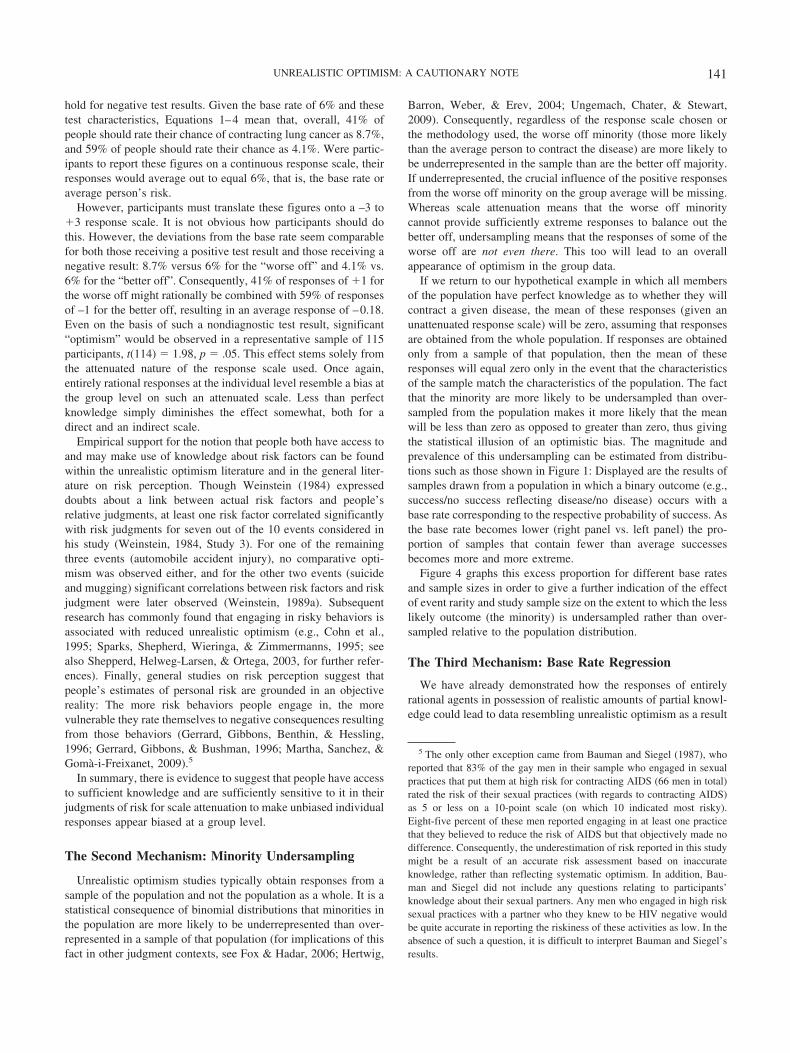
The effects of such regressive base rate estimates should bemitigated by providing participants in optimism studies with ac-curate base rate knowledge. Evidence to this effect comes from astudy by Rothman et al. (1996). In their Study 1, one group ofparticipants provided estimates of risk for the self and the averageperson for a variety of negative life events, whilst another groupwas provided with the actual base rate statistic and simply asked toestimate their own risk. Rothman et al.’s interests were differentfrom our own, but it is straightforward to derive from the reporteddata the standard difference scores of the indirect method for bothconditions and to compare the seeming degrees of optimism ob-served. Columns 3 and 4 of Table 2 show difference scores (selfrisk – average risk) for each of the two conditions.7 The differencescores in the condition where participants were given the actual baserate (column 3) are considerably less negative than where they werenot (column 4). This lends some support to the claim that base rateregression plays a role in unrealistic optimism studies.
Relationships Between Mechanisms
All three of the mechanisms outlined apply to both direct andindirect rating scales (though scale attenuation has a less uniformeffect for indirect scales). Hence, each mechanism can indepen-
dently give rise to seeming optimism. Jointly, they can exhibit addi-tive or even multiplicative effects, and we conclude with some ex-amples.
Figure 5 provided an estimate of the degree to which base rateregression brings about differences between the means of partici-pants’ underlying estimates of self and average person’s risk.These underlying estimates must still be translated into an overtresponse on either a direct or an indirect scale. In the case of theindirect scale, the exact outcome of the combination of scaleattenuation and base rate regression is impossible to predict, giventhat participants have a choice between more than one nonlinearmapping of estimates onto the response scale and that each of theseitself has a non-uniformly biasing effect. Figure 6 provides just oneexample of the combination of base rate regression and an atten-uated indirect response scale.
Conceptually straightforward, by contrast, is the relationshipbetween base rate regression and minority undersampling. Baserate regression is driven by a difference between the estimated andthe actual base rate; hence, its effects will be amplified by minorityundersampling. For rare events, minority undersampling will re-duce the actual base rate in the sample, thus increasing the dis-crepancy between this actual base rate and the regressive estimateof the population base rate. The resulting multiplicative relation-ship between these two mechanisms is demonstrated in Figure 7,which graphs the effect of both mechanisms on mean differencescores for an event with a base rate of 10%.
In conclusion, not only do the statistical mechanisms sufficeindividually to generate seeming optimism, their effects can mu-tually reinforce each other. These mechanisms can lend the judg-ments of rational agents the appearance of optimistic bias at thegroup level. Of course, participants in unrealistic optimism re-search need not be rational agents. However, the existence of thesestatistical mechanisms suggests that the most popular group levelmethodology of optimism research is inappropriate for establish-ing that fact: At a minimum, a suitable method for probing humanrationality should render rational judgments rational.
Reexamining Unrealistic Optimism Data
The three mechanisms of scale attenuation, undersampling, andbase rate regression potentially confound the results of unrealisticoptimism studies. However, research has sought to establish notonly the existence of an optimistic bias. Over the last three de-cades, there has also been much examination of the moderators ofthe optimism effect. In order to gauge the potential impact of these
6 This regression equation is a psychological simplification at the ex-treme ends of the probability scale. Probabilities of 0 and 1 will generallybe estimated accurately by participants. We do not consider impossible orcertain events in this article, nor does the following hinge in any way onextremely low or extremely high probabilities.
7 We excluded risk estimates relating to the likelihood of presently beinginfected with the human papillomavirus from Table 2, as Rothman et al.reported that participants had not generally heard of the virus, making theresponses difficult to interpret. It seems entirely plausible to assume one isnot infected with a disease one has never heard of when feeling healthy.For this disease too, however, the actual base rate condition displaysconsiderably less optimism than the estimated base rate condition.
143UNREALISTIC OPTIMISM: A CAUTIONARY NOTE
three mechanisms, an obvious next question is the extent to whichtheir effects fit with what is known about these moderators.8
Moderators of Unrealistic Optimism
It is known that event frequency, specificity of the comparisontarget, experience with the event, event controllability, and mood/anxiety of the participant all affect the degree of unrealistic opti-mism observed. We next demonstrate how these moderators relateto the three statistical mechanisms identified.
Event frequency. It is well established that unrealistic opti-mism decreases as the frequency of the event increases (e.g.,Chambers et al., 2003; P. R. Harris, Griffin, & Murray, 2008;Kruger & Burrus, 2004; Weinstein, 1980, 1982, 1987). Scale
attenuation, minority undersampling, and base rate regression allhave a direct relationship with event frequency (see Figures 2, 4,and 5), though the relationship between scale attenuation and eventfrequency is less uniform and hence less strong within the indirectmethod (see Figure 3). Hence the mechanisms identified not onlyexplain the general moderating effect of frequency, but they alsoprovide an explanation for why the effect of frequency is lesspronounced in studies using the indirect method (e.g., Klar &Ayal, 2004; Price et al., 2002; Rose, Endo, Windschitl, & Suls,2008; see also Chambers et al., 2003). Consequently, this moder-ator supports the contention that statistical artifacts are actuallypresent in the data.
Specificity of the comparison target. The degree of unreal-istic optimism generally decreases as the target with whom par-ticipants are comparing themselves becomes more specific (Burger& Burns, 1988; P. Harris & Middleton, 1994; Klar et al., 1996;Perloff & Fetzer, 1986; Regan et al., 1995; Whitley & Hern, 1991;Zakay, 1984, 1996; see also Alicke, Klotz, Breitenbecher, Yurak,& Vredenburg, 1995). We have assumed in the preceding that thejudgments people make of their own risks are qualitatively differ-ent from those they make for the average other. When assessingtheir own chances of experiencing a negative event they areestimating a probability about a singular event (an epistemicprobability). However, when assessing the chances of the averageperson experiencing the event, they estimate a frequentist proba-bility, which relies on distributional statistics, namely, the baserate—for example, what percentage of people contract cancer(see also Klar et al., 1996). As the comparison target is made morespecific, the judgments between self and the target become moreconsistent, for participants are now estimating an epistemic prob-
8 We follow Helweg-Larsen and Shepperd (2001) in our use of the termmoderator to refer to variables that have been shown to produce “differ-ences . . . in people’s optimistic bias reports” (Helweg-Larsen & Shepperd,2001, p. 75).
0 0.1 0.2 0.3 0.4 0.5−0.8
−0.6
−0.4
−0.2
0
0.2
0.4
0.6
0.8
1
Base Rate
Mea
n D
iffer
ence
Sco
re
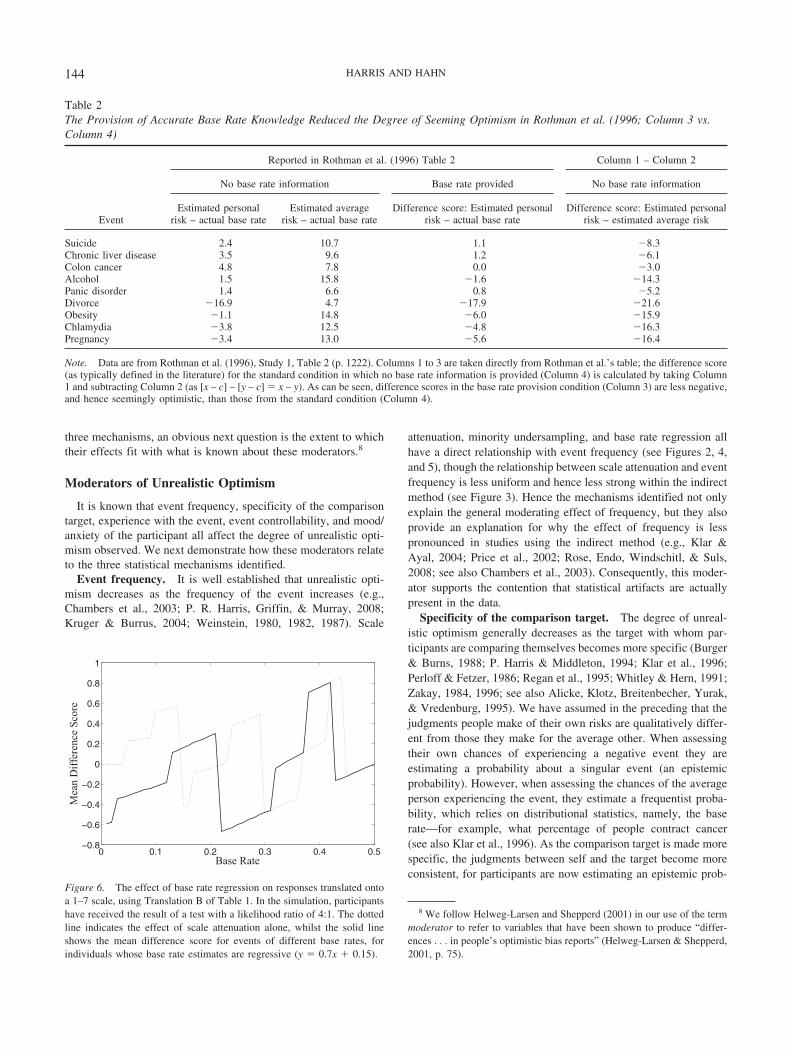
Figure 6. The effect of base rate regression on responses translated ontoa 1–7 scale, using Translation B of Table 1. In the simulation, participantshave received the result of a test with a likelihood ratio of 4:1. The dottedline indicates the effect of scale attenuation alone, whilst the solid lineshows the mean difference score for events of different base rates, forindividuals whose base rate estimates are regressive (y � 0.7x � 0.15).
Table 2The Provision of Accurate Base Rate Knowledge Reduced the Degree of Seeming Optimism in Rothman et al. (1996; Column 3 vs.Column 4)
Event
Reported in Rothman et al. (1996) Table 2 Column 1 – Column 2
No base rate information Base rate provided No base rate information
Estimated personalrisk – actual base rate
Estimated averagerisk – actual base rate
Difference score: Estimated personalrisk – actual base rate
Difference score: Estimated personalrisk – estimated average risk
Suicide 2.4 10.7 1.1 �8.3Chronic liver disease 3.5 9.6 1.2 �6.1Colon cancer 4.8 7.8 0.0 �3.0Alcohol 1.5 15.8 �1.6 �14.3Panic disorder 1.4 6.6 0.8 �5.2Divorce �16.9 4.7 �17.9 �21.6Obesity �1.1 14.8 �6.0 �15.9Chlamydia �3.8 12.5 �4.8 �16.3Pregnancy �3.4 13.0 �5.6 �16.4
Note. Data are from Rothman et al. (1996), Study 1, Table 2 (p. 1222). Columns 1 to 3 are taken directly from Rothman et al.’s table; the difference score(as typically defined in the literature) for the standard condition in which no base rate information is provided (Column 4) is calculated by taking Column1 and subtracting Column 2 (as [x – c] – [y – c] � x – y). As can be seen, difference scores in the base rate provision condition (Column 3) are less negative,and hence seemingly optimistic, than those from the standard condition (Column 4).
144 HARRIS AND HAHN

ability for the unique event of this other, single, person contractingcancer. Given the assumption that estimates concern the risks ofexperiencing rare events in these studies, once again it is probablethat the likelihood of an individuated comparison target experi-encing a negative event will be less than the average person’s; soless relative optimism should be observed. This proposal is furthersupported by Helweg-Larsen and Shepperd’s (2001) extensivereview, which established that the moderating effect of the com-parison target affected unrealistic optimism through the risk asso-ciated with the comparison target rather than the risk associatedwith the self.
The same conceptual difference between judgments about theself and judgments about the average person can also explainanother finding, namely that, overall, comparative judgments arebetter predicted by judgments of self risk than judgments of theaverage peer’s risk (e.g., Chambers et al., 2003; Kruger & Burrus,2004; Price et al., 2002; Rose et al., 2008). Together with themoderating effect of event frequency, this finding has been used tosupport the egocentrism account of unrealistic optimism, whichposits that people’s comparative judgments are predominantlybased on their own absolute chances of experiencing an event withan insufficient consideration of the chances of others (Chambers etal., 2003; Kruger & Burrus, 2004; Weinstein & Lachendro, 1982;see also Klar & Giladi, 1999; Kruger, 1999; Windschitl, Kruger, &Simms, 2003).9 There are, however, once again purely statisticalreasons for why group risk is expected to be a less powerfulpredictor (see also Moore, 2007a; Moore & Small, 2007, 2008).All estimates of group risk within a sample concern the sameobjective quantity; estimates of self risk should be individuallyderived from that on the basis of person-specific information.Hence there should be greater variability in estimates of self riskthan in estimates of group risk, which generally increases predic-tive power (Howell, 1997, p. 266).
Experience with the event and event controllability. Unre-alistic optimism has been shown to decrease as people’s experi-ence with the event increases, and to increase as the perceivedcontrollability of the event decreases (e.g., Helweg-Larsen, 1999;
van der Velde et al., 1992; Weinstein, 1980, 1982, 1987, 1989a;Zakay, 1984, 1986; see also Klein & Helweg-Larsen, 2002, for ameta-analytic review). Helweg-Larsen and Shepperd (2001) dem-onstrated that both these factors influenced estimates of personalrisk, rather than estimates of the comparison target’s risk. Such afinding makes sense, as both experience and controllability can beconsidered sources of knowledge. Consequently, given that familyhistory will increase experience with a disease as well as increas-ing susceptibility to it (Walter & Emery, 2006), it can be expectedto increase ratings of personal susceptibility whilst not changingperceptions of the average person’s susceptibility, thus making arelative response appear less optimistic. Controllability also affectsknowledge to the extent that people make efforts to avoid unde-sirable but controllable events. Self-knowledge of one’s endeavor(or lack thereof) to avoid the event provides information withwhich to differentiate one’s personal risk from the base rate. Thus,people become more like perfect predictors and the effects of thestatistical mechanisms are amplified.
Typically, people have been faulted for not sufficiently takinginto account protective measures made by the average person (e.g.,Chambers et al., 2003; Kruger & Burrus, 2004; Weinstein, 1980;Weinstein & Lachendro, 1982). However, calculation of the baserate, by definition, includes all people, which means it will includeboth people who do and people who do not take protective mea-sures. Hence those who do take protective measures are in actualfact necessarily less at risk than the average person (base rate).
Finally, in addition to being a source of knowledge, controlla-bility will have a separate impact through its influence on eventfrequency. The controllability of a negative event is likely toreduce its base rate because people will tend to take protectivemeasures to avoid it. Hence, the moderating effect of controllabil-ity is only interpretable once event frequency has been controlledfor. Zakay (1984), for example, observed significant interactionsbetween event valence and controllability in comparative re-sponses. It is clear from his data, however, that these effects arereadily explained with reference to the event’s perceived fre-quency, which is lower for controllable negative events and higherfor controllable positive events than it is for their uncontrollablecounterparts.
Mood and anxiety. Responses are typically less optimisticwhen a negative mood is induced in individuals (e.g., Abele &Hermer, 1993; Drake, 1984, 1987; Drake & Ulrich, 1992; Salovey& Birnbaum, 1989), and unrealistic optimism is frequently notobserved in dysphoric individuals (so-called depressive realism;e.g., Alloy & Ahrens, 1987; Pietromonaco & Markus, 1985;Pyszczynski et al., 1987; but see also Colvin & Block, 1994;Dunning & Story, 1991). That dysphoric individuals are morenegative about their future than normal individuals only impliesthat they are more realistic than normal individuals if normalindividuals are independently shown to be unrealistic in their
9 One difficulty for the egocentrism account lies in recent evidence byPrice, Smith, and Lench (2006), who found that comparative ratingsbetween the self and the average member of a group were reduced whenperceptions of the average member’s chance of experiencing an eventincreased, under circumstances where individual risk was held constant.This clearly indicates sensitivity to the average at least in some circum-stances.
Figure 7. The interaction between minority undersampling (x-axis) andbase rate regression. The mean difference scores result from simulatedresponses on a continuous response scale for an event with a populationbase rate of 10%.
145UNREALISTIC OPTIMISM: A CAUTIONARY NOTE
future expectations. This is the very issue challenged in the presentarticle. The same argument, finally, applies to other individualdifference moderators of the effect, such as anxiety and defensive-ness (see, e.g., P. R. Harris et al., 2008), as well as cross-culturalresults that have generally found less optimism in Eastern cultures(e.g., Chang & Asakawa, 2003; Chang, Asakawa, & Sanna, 2001;Heine & Lehman, 1995). Regarding this last phenomenon, how-ever, it is worth noting that research has also found cross-culturaldifferences in people’s general use of response scales (Chen, Lee,& Stevenson, 1995), as well as in probability judgment (for arecent review see Yates, 2010) and risk assessment more generally(e.g., Weber & Hsee, 2000). Such differences could readily influ-ence the effects of the statistical mechanisms we identified.
Implications. What is known about the moderators of unre-alistic optimism either supports, or otherwise does not conflictwith, a potential influence of the confounding statistical mecha-nisms of scale attenuation, minority undersampling, and base rateregression. In light of this, one must, we think, conclude that thesemechanisms render uninterpretable the evidence collected withinthe standard paradigm. There seems no way of disentanglingpotential artifacts from real effects in extant data.
However, the standard paradigm of either direct or indirectcomparative rating is also presently the main source of evidencefor unrealistic optimism about self risk. This raises the furtherpossibility that unrealistic optimism is, in fact, solely a statisticalartifact, a possibility we refer to as the statistical artifact hypoth-esis.
Demonstrating that present evidence fails to clearly establishthat people are unrealistically optimistic is distinct from establish-ing that they are, in fact, not optimistically biased. Whether morerobust evidence for unrealistic optimism might be found, orwhether it cannot, simply because people are not generally unre-alistically optimistic about risk, is a question that lies beyond thescope of this article.
It is worth pointing out, however, that critical comparisons existfor which the statistical artifact hypothesis and the hypothesis of agenuine optimistic bias make opposite predictions. Moreover,studies including these comparisons have already been conducted,and we discuss these next.
Evidence Against the Optimistic Bias: The Roleof Positive Events
As we have seen, the rare nature of negative events plays acritical role in producing what is potentially an illusion of unreal-istic optimism at a group level. Furthermore, under the statisticalartifact hypothesis, the rarer a negative event, the greater thedegree of seeming optimism that should be seen, and this isobserved in practice (e.g., Chambers et al., 2003; Kruger & Burrus,2004; Weinstein, 1980, 1982, 1987).
We have thus far focused on people’s estimates of negativeevents, as these constitute the bulk of the unrealistic optimismliterature. However, the same statistical mechanisms should applyto judgments about the chance of experiencing positive events, onthe reasonable assumption that very positive events, like verynegative events, are rare. Again, the low base rate of extremelypositive events implies that most people will not experience theevent in question. For positive events, however, this failure con-stitutes a bad thing, not a good thing. Hence, the statistical mech-
anisms introduced above that push the group response toward themajority outcome will result in seeming pessimism for positiveevents. By definition, this is the opposite of what should be foundif people were genuinely overoptimistic about their futures. Con-sequently, while the unrealistic optimism and statistical artifacthypotheses make the same predictions for negative events, theymake opposite predictions for positive events.
Studies investigating the possibility of unrealistic optimism forpeople’s estimates of positive events are far fewer than thoseinvestigating negative events, and the results for positive eventsare much more equivocal. A number of studies have reportedoptimism, such that people view themselves as more likely thanthe average person to experience positive events (e.g., Campbell etal., 2007; Regan et al., 1995; Weinstein, 1980), but others alsoreport pessimism (e.g., Chambers et al., 2003; A. J. L. Harris,2009; Kruger & Burrus, 2004; Moore & Small, 2008).
Crucially, the statistical artifact hypothesis predicts unrealisticpessimism only for positive events that are rare. For positiveevents that are relatively common, the reverse logic applies. Forcommon events, the chance of not experiencing them constitutesthe rare outcome. However, the positive events in those studiesthat have largely found optimism are arguably not rare, an obser-vation also made by Hoorens, Smits, and Shepperd (2008). Forexample, Weinstein’s (1980) seminal article used positive eventssuch as “owning your own home” and “living past eighty” (p.810), which were far less rare than the negative events, and thestatistical artifact hypothesis would thus not predict pessimism forthem. Weinstein found further that the perceived probability of theevent was the single biggest predictor of participants’ comparativejudgments for positive events, such that greater comparative re-sponses (interpreted as greater optimism) were displayed the moreprevalent the positive event was perceived to be, which is inkeeping with the statistical artifact claim.
Putting the unrealistic optimism and statistical artifact hypoth-eses in direct opposition requires studies that also include rarepositive events. A number of recent studies have explored bothpositive events and event frequency more fully. These studiesfound comparative responses indicative of optimism for commonevents but of pessimism for positive, rare events, as predicted bythe statistical artifact hypothesis and in direct opposition to agenuine optimistic bias (Chambers et al., 2003; A. J. L. Harris,2009; Kruger & Burrus, 2004; and see also, using a rankingmethodology, Moore & Small, 2008).
I Wish for, Therefore I Believe . . .?
Finally, a cautionary note regarding the existence of a genuineoptimistic bias for future life events may be taken from otherresearch within the judgment literature. There has been muchresearch on whether people consider what they find desirable to bemore likely. Early experiments found some evidence for the effectsof desirability (e.g., Irwin, 1953; Marks, 1951), and these findingshave sometimes been cited in the context of unrealistic optimismresearch (e.g., Taylor & Brown, 1988). Subsequent research, how-ever, has generally failed to find evidence of wishful thinkingunder well-controlled laboratory conditions (see for results as wellas critical discussion of early research, e.g., Bar-Hillel & Budescu,1995; Bar-Hillel, Budescu, & Amar, 2008; A. J. L. Harris, Corner,& Hahn, 2009). At the same time, previous observations of the
146 HARRIS AND HAHN
wishful thinking effect outside the laboratory (e.g., Babad & Katz,1991) seem well explained as “an unbiased evaluation of a biasedbody of evidence” (Bar-Hillel & Budescu, 1995, p. 100; see also,e.g., Denrell & Le Mens, 2007; Fiedler, 2000; Gordon, Franklin, &Beck, 2005; Kunda, 1990; Morlock, 1967; Radzevick & Moore,2008; Slovic, 1966). For example, Bar-Hillel et al. (2008) ob-served potential evidence of wishful thinking in the prediction ofresults in the 2002 and 2006 football World Cups. However,further investigation showed that these results were more parsi-moniously explained as resulting from a salience effect than froma “magical wishful thinking effect” (Bar-Hillel et al., 2008, p.282). Specifically, they seemed to stem from a shift in focus thatbiases information accumulation and not from any effect of desir-ability per se. Hence Krizan and Windschitl (2007) concluded intheir comprehensive review that, whilst there are circumstancesthat can lead to desirability indirectly influencing probability es-timates through a number of potential mediators, there is littleevidence that desirability directly biases estimates of probability.
In short, there is little evidence for a broad “I wish for, thereforeI believe . . .” (Bar-Hillel et al., 2008, p. 283) relationship betweendesirability and estimates of probability. This makes the existenceof a general optimistic bias seem somewhat less likely.
Of course, some of us might sometimes be overoptimistic.Certain subgroups of the population might demonstrate a bias: forexample, entrepreneurs, gamblers, smokers, motorcyclists, andindeed dispositional optimists (e.g., Cooper, Woo, & Dunkelberg,1988; Coventry & Norman, 1998; Delfabbro & Winefield, 2000;Griffiths, 1994, 1995; Hansen & Malotte, 1986; Ladouceur,Gaboury, Dumont, & Rochette, 1988; Lee, 1989; McKenna, War-burton, & Winwood, 1993; Rogers & Webley, 2001; Rutter,Quine, & Albery, 1998; Wagenaar, 1988; Walker, 1992; Wein-stein, Marcus, & Moser, 2005; but see also Delfabbro, 2004; Rise,Strype, & Sutton, 2002; Sutton, 1999, 2002). Similarly, almost allof us might be optimistic about some very particular things (and itmight, indeed, be considered positive to be optimistic about certainevents; see Armor, Massey, & Sackett, 2008). However, the exis-tence of a general optimistic bias about risk for future life eventscannot be inferred from these specific ones.
The Future for Unrealistic Optimism
The material presented thus far lends itself to skepticism aboutwhether unrealistic optimism genuinely exists. Whether or not itdoes, however, is an empirical question and one that we believe tobe important. It is clear, however, that changes to the standardmethodology are required if compelling evidence for optimism isto be found. As seen throughout this article, studying optimism isan extremely difficult task, and there are other methods that onemight consider that also suffer problems similar to the ones iden-tified here. Recent research, for example, has indicated that the useof rankings instead of comparative ratings also fails to offer aviable alternative (Benoit & Dubra, 2009). In considering alterna-tives, no single method clearly stands out as ideal. Nevertheless,we conclude with some tentative suggestions for the improvementof future research.
Improving Present Techniques
Our critique of traditional unrealistic optimism studies has cen-tered around the confounds associated with three statistical mech-
anisms: scale attenuation, minority undersampling, and base rateregression. Minimally, we suggest that researchers be sensitive tothese three mechanisms when designing future studies. We there-fore begin by specifying how their effects may be mitigated.
The effects of scale attenuation are removed if participants areable to provide any response required. This suggests the use of acontinuous response scale. This alone may not solve all problemsin that it must also be practically possible to distinguish suffi-ciently among low probabilities (see also Klar & Ayal, 2004). Itwill also not help if ratios, not differences, turn out to be a morenatural way to conceptualize discrepancies in risk. In this case, adirect scale would be preferable, but it would need to be un-bounded.
In practice, however, the use of a discrete –100 to �100 re-sponse scale should already dramatically reduce the confoundingimpact of scale attenuation. Indeed, future researchers might beable to convincingly argue that, despite its noncontinuous nature,such a scale would be psychologically superior to one that iscontinuous, though perhaps harder for participants to understand.
Minority undersampling is reduced as study size increases,reflecting the law of large numbers (Bernoulli, 1713) so thatincreasing the number of participants will have a beneficial effect.Moreover, undersampling is eliminated if research is conductedwith an entire population of individuals. Some researchers (e.g.,Moore & Small, 2008) have used this logic to design studies inwhich participants are required to rate themselves relative to “otherparticipants in the experiment” (Moore & Small, 2008, p. 147). Itis difficult to know, however, to what degree this question isinterpretable to participants. Without extra knowledge about thecharacteristics of this (newly defined) population, a reasonablesimplifying strategy would be to assume that this new populationis a representative subsample of the general population aboutwhich participants have more knowledge. In this case, minorityundersampling again becomes an issue. Furthermore, where par-ticipants must construct the sample risk ad hoc, the estimate islikely to be regressive (Moore & Small, 2008).
This leads to the final mechanism, base rate regression. Ifparticipants can be provided with accurate base rate statistics forthe population against whom they are to compare themselves, thismechanism is nullified. An example of this is seen in Rothman etal. (1996), as discussed above. Here participants were simply toldthe relevant percentage; however, there may be better methods forcommunicating the base rate information to participants than sim-ply stating it, for example, by using frequency formats (e.g.,Cosmides & Tooby, 1996; Gigerenzer & Hoffrage, 1995; but seealso Mellers & McGraw, 1999; Sloman, Over, Slovak, & Stibel,2003) or other graphical representations (e.g., Bar-Hillel &Budescu, 1995; A. J. L. Harris et al., 2009; A. J. L. Harris & Hahn,2009).10
10 It seems extremely confusing, however, to both provide an accuratebase rate and still ask participants to supply an estimate of the averageperson’s risk as in Lin, Lin, and Raghubir (2003) and Lin and Raghubir(2005). It is an important question whether participants do take the baserate to represent the average person’s risk, but this should be assessed inother ways.
147UNREALISTIC OPTIMISM: A CAUTIONARY NOTE
Longitudinal Designs
If researchers could see into the future, it would be possible tocompare individuals’ expectations with the outcomes that they willactually experience. Longitudinal studies essentially allow re-searchers to see into the future by comparing outcomes at Time 2with expectations at Time 1, and this provides an alternative routefor optimism research (see, e.g., Dunning & Story, 1991; Shep-perd, Ouellette, & Fernandez, 1996).
An issue, however, that requires consideration is that optimismstudies typically involve estimates about binary events: For exam-ple, a person will either have a heart attack or not have a heartattack; they cannot have 0.7 of a heart attack. Thus individualevents and probability estimates concerning these events cannotdirectly be compared.11 One potential method is to ask an indi-vidual to provide binary ratings for a whole range of events,providing either a “yes” or “no” response to the question ofwhether they will experience each one within a particular timeframe (e.g., 10 years). At a future date, the researcher checks thenumber of those events that the participant actually experienced.The total number of “yes” responses both for expectation andoutcome is then compared. For negative events, if the number of“yes” expectations is less than the number of “yes” outcomes thenthat individual might be considered unrealistically optimistic.
This method was employed by Dunning and Story (1991), whoasked participants to indicate whether they would or would notexperience 37 different events in the course of one semester.Reading from Table 4 in their article, it can be seen that partici-pants appeared to overestimate the likelihood of both desirable andundesirable events occurring; thus the degree to which these re-sults indicate optimism is unclear.12 The results of such a meth-odology do, however, appear to have the potential for a clearinterpretation as demonstrating unwarranted optimism, pessimism,or realism.
Dunning and Story (1991), however, predominantly used rela-tively benign undesirable events such as being ill one day as aresult of drinking and missing more than 2 days of class withsickness. The degree to which the same method can be extended tothe more severe events of standard optimism research is unclear.When completing a questionnaire whilst healthy, and without theability to forecast the future, it would seem strange for a participantto say “yes” to any individual, low probability, life-threateningevent (e.g., road accident, cancer, kidney failure, etc.). Yet itwould seem inappropriate to attribute such reluctance to unrealisticoptimism.
An alternative method would be to adopt the approach usedwidely in the literature on judgment confidence. This literaturestudies the extent to which people’s probability assessments are“calibrated”. This requires a large selection of potential events forwhich participants provide probability estimates. Events are thencombined by “binning” all events that the participant assigned aparticular range of probabilities to (e.g., 10%–20% chance; 21%–30% chance, etc.). The calibration of the participant’s responses isthen subsequently evaluated by calculating the proportion ofevents in each “bin” that actually occurred. To the degree that theparticipant’s responses were well calibrated, between 10% and20% of events that he or she assigned a 10%–20% chance ofoccurring should occur, and so on (see, e.g., Keren, 1991; Lich-tenstein, Fischhoff, & Phillips, 1982; Wallsten & Budescu, 1983;
Yates, 1990). However, this method is itself subject to statisticalartifacts, such as regression effects (e.g., Erev et al., 1994; Juslin,Winman, & Olsson, 2000).
Finally, longitudinal studies could use non-binary dependentvariables. Shepperd et al. (1996) asked student participants toestimate both future starting salary and an exam score, which werelater compared with actual salaries and exam performance. Shep-perd et al. reported that estimates 5 months prior to graduation(salaries) and 1 month prior to the exam appeared optimisticrelative to the salaries and exam results actually achieved. Al-though the events studied differ necessarily from the classic ma-terial of optimism research and the judgments do not concernprobability estimates, this methodology provides a promising ap-proach for future research.
Experimental Manipulation
A final route for optimism research is experimental manipula-tion. Participants can be asked to estimate the risks of experiencingevents that are experimentally defined. Participants could, forexample, be presented with a visual representation of probabilitysuch as the proportion of yellow cells in a black and yellow matrix(see, e.g., Bar-Hillel & Budescu, 1995; Cohen & Wallsten, 1992;A. J. L. Harris et al., 2009; Wallsten, Budescu, Rapoport, Zwick,& Forsyth, 1986). Such a matrix, if large enough, requires anestimate (because participants cannot simply count) but objec-tively defines the risk. A given matrix could be presented whereinthe yellow cells represent either the participant’s own risk or theaverage person’s risk. Any systematic difference between judg-ments of those risks then clearly indicates bias. An initial experi-ment within this paradigm failed to find evidence for such differ-ences (A. J. L. Harris, 2009); however, this methodology seemsworth further exploration.
Conclusions
We have introduced a range of methodological concerns thatplague traditional studies “demonstrating” that people are unreal-istically optimistic when judging the likelihood of future lifeevents. Typically, these demonstrations are based on people ratingtheir chances of experiencing negative events as being less than theaverage person’s. At the root of these concerns lies the fact that thenegative events that form the focus of these studies are generallyrare events. This gives rise to three statistical problems: the effectsof scale attenuation, minority undersampling, and base rate regres-sion. All three are independent statistical mechanisms by whichseeming optimism may emerge from entirely unbiased predictors.
Indeed, we demonstrated that the response scales most oftenused in this research give rise to seeming bias with predictors that
11 Although the Brier score was developed in order to measure thecalibration of probabilistic forecasts about binary outcomes and could, ofcourse, be used to compare the accuracy of different individuals’ forecasts,it could not be used to assess the systematicity of an optimistic or pessi-mistic bias.
12 Dunning and Story (1991) were primarily interested in the differencesbetween mildly depressed individuals and nondepressed individuals. Con-sequently, the pattern of results reported here has not been verified bystatistical analyses.
148 HARRIS AND HAHN
are not only rational, but perfect, that is, in possession of fullyaccurate knowledge about the state of the world. This is true of thescales used in both the prevalent so-called direct method and theless common indirect method. It would seem a minimum require-ment for any response measure of accuracy that responses that areentirely accurate do, in fact, appear accurate on that measure.Consequently, the response scales on which unrealistic optimismresearch is based would seem to fail most basic requirements ofvalidity.
We also demonstrated how scale attenuation would generateseeming optimism, given plausible amounts of imperfect, butunbiased, knowledge. Assuming only very weak diagnostic infor-mation, “unrealistic optimism” emerges readily, as we showedboth with general calculations and specific examples modeled onextant research. Moreover, we cited empirical evidence for aneffect of scale attenuation from comparisons of the amount ofoptimism observed when more and less attenuated scales are used.Finally, we showed how scale attenuation, minority undersam-pling, and base rate regression can combine and even mutuallyenhance each other.
These statistical mechanisms also seem able to explain a numberof established moderators of the unrealistic optimism phenome-non, including specificity of the comparison target, event control-lability, experience, and event frequency. Moreover, these mech-anisms readily explain the weaker correlation typically observedbetween optimism and event frequency when measured using theindirect method as opposed to the direct method. This lends furthercredibility to the claim that these mechanisms have given rise tostatistical artifacts in the data of unrealistic optimism research. Atthe very minimum, this suggests that even if unrealistic optimismdoes exist, these statistical problems cloud our present understand-ing of both its magnitude and determinants.
However, these statistical artifacts also raise questions about thevery existence of a general, unrealistically optimistic bias. Giventhat the majority of optimism studies have used the comparativemethodology, one may wonder whether such a bias actually existsand whether or not more compelling evidence could be found. Oneconcern here must be that there is evidence against an optimisticbias even within the standard paradigm; the studies that haveincluded events for which optimism and the statistical artifacthypothesis make opposing predictions have obtained results thatfavor the latter (e.g., Chambers et al., 2003). Moreover, the balanceof evidence in the wider judgment literature is moving away fromthe claim that people’s estimates of probability are inherentlybiased by desirability.
As we noted in the introduction, however, unrealistic optimismis often viewed as one of a wider range of self-enhancementphenomena, such as the better-than-average effect, the planningfallacy, or overconfidence (see, e.g., Dunning, Heath, & Suls,2004). Seen in this context, unrealistic optimism may seem morelikely. However, many of these related bias phenomena havethemselves come under critical scrutiny. People, for example, donot always consider themselves to be better than average but alsoworse than average (see, e.g., Kruger, 1999), nor is their planningalways overoptimistic (see, e.g., Boltz, Kupperman, & Dunne,1998), and Erev et al. (1994) demonstrated that the same judgmentdata could be interpreted as evidence of both overconfidence andunderconfidence depending on the mode of analysis. Moreover, agrowing body of literature has offered rational and statistical
accounts as explanations for many of these phenomena (e.g., onfalse consensus, see Dawes & Mulford, 1996; on the illusion ofcontrol, see Matute, Vadillo, Blanco, & Musca, 2007; on better-than-average/worse-than-average effects, see, e.g., Moore &Healy, 2008, and Kruger, Windschitl, Burrus, Fessel, & Chambers,2008; on under- or overconfidence, see Erev et al., 1994; Juslin etal., 2000; Pfeifer, 1994; Soll, 1996; and on overoptimism gener-ally, see van den Steen, 2004). Clearly, only time will tell forunrealistic optimism itself, and there remain a number of potentialmethodological avenues for future optimism research. However, aconsiderable, and growing, body of research suggests that people’sjudgments may be more rational than often assumed.
References
Abele, A., & Hermer, P. (1993). Mood influences on health-related judg-ments: Appraisal of own health versus appraisal of unhealthy behaviors.European Journal of Social Psychology, 23, 613–625. doi:10.1002/ejsp.2420230606
Alicke, M. D., Klotz, M. L., Breitenbecher, D. L., Yurak, T. J., & Vre-denburg, D. S. (1995). Personal contact, individuation, and the better-than-average effect. Journal of Personality and Social Psychology, 68,804–825. doi:10.1037/0022-3514.68.5.804
Alloy, L. B., & Ahrens, A. H. (1987). Depression and pessimism for thefuture: Biased use of statistically relevant information in predictions forself versus other. Journal of Personality and Social Psychology, 52,366–378. doi:10.1037/0022-3514.52.2.366
Armor, D. A., Massey, C., & Sackett, A. M. (2008). Prescribed optimism:Is it right to be wrong about the future? Psychological Science, 19,329–331. doi:10.1111/j.1467-9280.2008.02089.x
Attneave, F. (1953). Psychological probability as a function of experiencedfrequency. Journal of Experimental Psychology, 46, 81– 86. doi:10.1037/h0057955
Babad, E., & Katz, Y. (1991). Wishful thinking—against all odds. Journalof Applied Social Psychology, 21, 1921–1938. doi:10.1111/j.1559-1816.1991.tb00514.x
Bar-Hillel, M., & Budescu, D. (1995). The elusive wishful thinking effect.Thinking and Reasoning, 1, 71–103. doi:10.1080/13546789508256906
Bar-Hillel, M., Budescu, D. V., & Amar, M. (2008). Predicting World Cupresults: Do goals seem more likely when they pay off? PsychonomicBulletin & Review, 15, 278–283. doi:10.3758/PBR.15.2.278
Bauman, L. J., & Siegel, K. (1987). Misperception among gay men of therisk for AIDS associated with their sexual behavior. Journal of AppliedSocial Psychology, 17, 329 –350. doi:10.1111/j.1559-1816.1987.tb00317.x
Benoit, J.-P., & Dubra, J. (2009). Overconfidence? Retrieved from http://ssrn.com/abstract�1088746
Bernoulli, J. (1713). Ars conjectandi [Probability calculation]. Basel, Swit-zerland: Thurnisorum.
Boltz, M. G., Kupperman, C., & Dunne, J. (1998). The role of learning inremembered duration. Memory & Cognition, 26, 903–921.
Buehler, R., & Griffin, D. (2003). Planning, personality, and prediction:The role of future focus in optimistic time predictions. OrganizationalBehavior and Human Decision Processes, 92, 80–90. doi:10.1016/S0749-5978(03)00089-X
Buehler, R., Griffin, D., & MacDonald, H. (1997). The role of motivatedreasoning in optimistic time predictions. Personality and Social Psycho-logical Bulletin, 23, 238–247. doi:10.1177/0146167297233003
Buehler, R., Griffin, D., & Ross, M. (1994). Exploring the “planningfallacy”: Why people underestimate their task completion times. Journalof Personality and Social Psychology, 67, 366–381. doi:10.1037/0022-3514.67.3.366
Burger, J. M., & Burns, L. (1988). The illusion of unique invulnerability
149UNREALISTIC OPTIMISM: A CAUTIONARY NOTE
and the use of effective contraception. Personality and Social Psychol-ogy Bulletin, 14, 264–270. doi:10.1177/0146167288142005
Campbell, J., Greenauer, N., Macaluso, K., & End, C. (2007). Unrealisticoptimism in Internet events. Computers in Human Behavior, 23, 1273–1284. doi:10.1016/j.chb.2004.12.005
Chambers, J. R., & Windschitl, P. D. (2004). Biases in social comparativejudgments: The role of nonmotivated factors in above-average andcomparative-optimism effects. Psychological Bulletin, 130, 813–838.doi:10.1037/0033-2909.130.5.813
Chambers, J. R., Windschitl, P. D., & Suls, J. (2003). Egocentrism, eventfrequency, and comparative optimism: When what happens frequently is“more likely to happen to me.” Personality and Social PsychologyBulletin, 29, 1343–1356. doi:10.1177/0146167203256870
Chang, E. C., & Asakawa, K. (2003). Cultural variations on optimistic andpessimistic bias for self versus a sibling: Is there evidence for self-enhancement in the West and for self-criticism in the East when thereferent group is specified? Journal of Personality and Social Psychol-ogy, 84, 569–581. doi:10.1037/0022-3514.84.3.569
Chang, E. C., Asakawa, K., & Sanna, L. J. (2001). Cultural variations inoptimistic and pessimistic bias: Do Easterners really expect the worstand Westerners really expect the best when predicting future life events?Journal of Personality and Social Psychology, 81, 476–491. doi:10.1037/0022-3514.81.3.476
Chen, C., Lee, S., & Stevenson, H. W. (1995). Response style and cross-cultural comparisons of rating scales among East Asian and NorthAmerican students. Psychological Science, 6, 170–175. doi:10.1111/j.1467-9280.1995.tb00327.x
Clutterbuck, C. S. (2008). Depression as a moderator of the optimism bias:“Realism” or pessimism-in-disguise? (Unpublished bachelor’s thesis).Cardiff University, Cardiff, Wales.
Cohen, B. L., & Wallsten, T. S. (1992). The effect of outcome desirabilityon comparisons of numerical and linguistic probabilities. Journal ofBehavioral Decision Making, 5, 53–72. doi:10.1002/bdm.3960050107
Cohn, L. D., Macfarlane, S., Yanez, C., & Imai, W. K. (1995). Risk-perception: Differences between adolescents and adults. Health Psychol-ogy, 14, 217–222. doi:10.1037/0278-6133.14.3.217
Colvin, C. R., & Block, J. (1994). Do positive illusions foster mentalhealth? An examination of the Taylor and Brown formulation. Psycho-logical Bulletin, 116, 3–20. doi:10.1037/0033-2909.116.1.3
Cooper, A. C., Woo, C. Y., & Dunkelberg, W. C. (1988). Entrepreneurs’perceived chances for success. Journal of Business Venturing, 3, 97–108. doi:10.1016/0883-9026(88)90020-1
Cosmides, L., & Tooby, J. (1996). Are humans good intuitive statisticiansafter all? Rethinking some conclusions from the literature on judgmentunder uncertainty. Cognition, 58, 1–73. doi:10.1016/0010-0277(95)00664-8
Coventry, K. R., & Norman, A. C. (1998). Arousal, erroneous verbaliza-tions and the illusion of control during a computer-generated gamblingtask. British Journal of Psychology, 89, 629–645.
Covey, J. A., & Davies, A. D. M. (2004). Are people unrealisticallyoptimistic? It depends how you ask them. British Journal of HealthPsychology, 9, 39–49. doi:10.1348/135910704322778713
Dawes, R. M., & Mulford, M. (1996). The false consensus effect andoverconfidence: Flaws in judgment or flaws in how we study judgment?Organizational Behavior and Human Decision Processes, 65, 201–211.doi:10.1006/obhd.1996.0020
Delfabbro, P. (2004). The stubborn logic of regular gamblers: Obstaclesand dilemmas in cognitive gambling research. Journal of GamblingStudies, 20, 1–21. doi:10.1023/B:JOGS.0000016701.17146.d0
Delfabbro, P. H., & Winefield, A. H. (2000). Predictors of irrationalthinking in slot- machine gambling. Journal of Psychology, 134, 17–28.doi:10.1080/00223980009600854
Denrell, J., & Le Mens, G. (2007). Interdependent sampling and social
influence. Psychological Review, 114, 398–422. doi:10.1037/0033-295X.114.2.398
Dewberry, C., Ing, M., James, S., Nixon, M., & Richardson, S. (1990).Anxiety and unrealistic optimism. Journal of Social Psychology, 130,151–156.
Dewberry, C., & Richardson, S. (1990). Effect of anxiety on optimism.Journal of Social Psychology, 130, 731–738.
Drake, R. A. (1984). Lateral asymmetry of personal optimism. Journalof Research in Personality, 18, 497–507. doi:10.1016/0092-6566(84)90008-4
Drake, R. A. (1987). Conception of own versus others’ outcomes: Manip-ulation of monaural attentional orientation. European Journal of SocialPsychology, 17, 373–375. doi:10.1002/ejsp.2420170313
Drake, R. A., & Ulrich, G. (1992). Line bisecting as a predictor of personaloptimism and desirability of risky behavior. Acta Psychologica, 79,219–226. doi:10.1016/0001-6918(92)90058-L
Dunning, D., Heath, C., & Suls, J. M. (2004). Flawed self-assessment:Implications for health, education, and the workplace. PsychologicalScience in the Public Interest, 5, 69 –106. doi:10.1111/j.1529-1006.2004.00018.x
Dunning, D., & Story, A. L. (1991). Depression, realism, and the over-confidence effect: Are the sadder wiser when predicting future actionsand events? Journal of Personality and Social Psychology, 61, 521–532.doi:10.1037/0022-3514.61.4.521
Erev, I., Wallsten, T. S., & Budescu, D. V. (1994). Simultaneous over- andunderconfidence: The role of error in judgment processes. PsychologicalReview, 101, 519–527. doi:10.1037/0033-295X.101.3.519
Eysenck, M. W., & Derakshan, N. (1997). Cognitive biases for futurenegative events as a function of trait anxiety and social desirability.Personality and Individual Differences, 22, 597–605. doi:10.1016/S0191-8869(96)00258-9
Fiedler, K. (2000). Beware of samples! A cognitive–ecological samplingapproach to judgment biases. Psychological Review, 107, 659–676.doi:10.1037/0033-295X.107.4.659
Fox, C. R., & Hadar, L. (2006). “Decisions from experience” � samplingerror � prospect theory: Reconsidering Hertwig, Barron, Weber, & Erev(2004). Judgment and Decision Making, 1, 159–161.
Gerrard, M., Gibbons, F. X., Benthin, A. C., & Hessling, R. M. (1996). Alongitudinal study of the reciprocal nature of risk behaviors and cogni-tions in adolescents: What you do shapes what you think, and vice versa.Health Psychology, 15, 344–354. doi:10.1037/0278-6133.15.5.344
Gerrard, M., Gibbons, F. X., & Bushman, B. J. (1996). Relation betweenperceived vulnerability to HIV and precautionary sexual behavior. Psy-chological Bulletin, 119, 390–409. doi:10.1037/0033-2909.119.3.390
Gigerenzer, G., & Hoffrage, U. (1995). How to improve Bayesian reason-ing without instruction: Frequency formats. Psychological Review, 102,684–704. doi:10.1037/0033-295X.102.4.684
Gordon, R., Franklin, N., & Beck, J. (2005). Wishful thinking and sourcemonitoring. Memory & Cognition, 33, 418–429.
Griffiths, M. D. (1994). The role of cognitive bias and skill in fruit machinegambling. British Journal of Psychology, 85, 351–369.
Griffiths, M. D. (1995). Adolescent gambling. London, England: Rout-ledge.
Hampson, S. E., Andrews, J. A., Barckley, M., Lichtenstein, E., & Lee,M. E. (2000). Conscientiousness, perceived risk, and risk-reductionbehaviors: A preliminary study. Health Psychology, 19, 496–500. doi:10.1037/0278-6133.19.5.496
Hansen, W. B., & Malotte, C. K. (1986). Perceived personal immunity:The development of beliefs about susceptibility to the consequences ofsmoking. Preventive Medicine, 15, 363–372. doi:10.1016/0091-7435(86)90004-6
Hardman, D. (2009). Judgment and decision making: Psychological per-spectives. Chichester, England: BPS Blackwell.
Harris, A. J. L. (2009). Investigating the influence of outcome utility on
150 HARRIS AND HAHN
estimates of probability (Unpublished doctoral dissertation). CardiffUniversity, Cardiff, Wales.
Harris, A. J. L., Corner, A., & Hahn, U. (2009). Estimating the prob-ability of negative events. Cognition, 110, 51– 64. doi:10.1016/j.cognition.2008.10.006
Harris, A. J. L., & Hahn, U. (2009). Bayesian rationality in evaluatingmultiple testimonies: Incorporating the role of coherence. Journal ofExperimental Psychology: Learning, Memory, and Cognition, 35, 1366–1373. doi:10.1037/a0016567
Harris, D. M., & Guten, S. (1979). Health-protective behavior: An explor-atory study. Journal of Health and Social Behavior, 20, 17–29. doi:10.2307/2136475
Harris, P. R., Griffin, D. W., & Murray, S. (2008). Testing the limits ofoptimistic bias: Event and person moderators in a multilevel framework.Journal of Personality and Social Psychology, 95, 1225–1237. doi:10.1037/a0013315
Harris, P., & Middleton, W. (1994). The illusion of control and optimismabout health: On being less at risk but no more in control than others.British Journal of Social Psychology, 33, 369–386.
Hawe, E., Talmud, P. J., Miller, G. J., & Humphries, S. E. (2003). Familyhistory is a coronary heart disease risk factor in the second NorthwickPark heart study. Annals of Human Genetics, 67, 97–106. doi:10.1046/j.1469-1809.2003.00017.x
Heine, S. J., & Lehman, D. R. (1995). Cultural variation in unrealisticoptimism: Does the West feel more invulnerable than the East? Journalof Personality and Social Psychology, 68, 595–607. doi:10.1037/0022-3514.68.4.595
Helweg-Larsen, M. (1999). (The lack of) optimistic biases in response tothe Northridge earthquake: The role of personal experience. Basic andApplied Social Psychology, 21, 119–129.
Helweg-Larsen, M., & Shepperd, J. A. (2001). Do moderators of theoptimistic bias affect personal or target risk estimates? A review of theliterature. Personality and Social Psychology Review, 5, 74–95. doi:10.1207/S15327957PSPR0501_5
Hertwig, R., Barron, G., Weber, E. U., & Erev, I. (2004). Decisions fromexperience and the effect of rare events in risky choice. PsychologicalScience, 15, 534–539. doi:10.1111/j.0956-7976.2004.00715.x
Hertwig, R., Pachur, T., & Kurzenhauser, S. (2005). Judgments of riskfrequencies: Tests of possible cognitive mechanisms. Journal of Exper-imental Psychology: Learning, Memory, and Cognition, 31, 621–642.doi:10.1037/0278-7393.31.4.621
Hoorens, V., & Buunk, B. P. (1993). Social comparison of health risks:Locus of control, the person-positivity bias, and unrealistic optimism.Journal of Applied Social Psychology, 23, 291–302. doi:10.1111/j.1559-1816.1993.tb01088.x
Hoorens, V., Smits, T., & Shepperd, J. A. (2008). Comparative optimismin the spontaneous generation of future life-events. British Journal ofSocial Psychology, 47, 441–451. doi:10.1348/014466607X236023
Howell, D. C. (1997). Statistical methods for psychology (4th ed.). Bel-mont, CA: Duxbury Press.
Irwin, F. W. (1953). Stated expectations as functions of probability anddesirability of outcomes. Journal of Personality, 21, 329–335. doi:10.1111/j.1467-6494.1953.tb01775.x
Juslin, P., Winman, A., & Olsson, H. (2000). Naıve empiricism anddogmatism in confidence research: A critical examination of the hard–easy effect. Psychological Review, 107, 384–396. doi:10.1037/0033-295X.107.2.384
Kahneman, D., & Tversky, A. (1973). On the psychology of prediction.Psychological Review, 80, 237–251. doi:10.1037/h0034747
Kahneman, D., & Tversky, A. (1979). Intuitive prediction: Biases andcorrective procedures. TIMS Studies in Management Science, 12, 313–327.
Keren, G. (1991). Calibration and probability judgments: Conceptual and
methodological issues. Acta Psychologica, 77, 217–273. doi:10.1016/0001-6918(91)90036-Y
Kirscht, J. P., Haefner, D. P., Kegeles, S., & Rosenstock, I. M. (1966). Anational study of health beliefs. Journal of Health and Human Behavior,7, 248–254. doi:10.2307/2948771
Klar, Y., & Ayal, S. (2004). Event frequency and comparative optimism:Another look at the indirect elicitation method of self–others risks.Journal of Experimental Social Psychology, 40, 805–814. doi:10.1016/j.jesp.2004.04.006
Klar, Y., & Giladi, E. E. (1999). Are most people happier than their peers,or are they just happy? Personality and Social Psychology Bulletin, 25,586–595. doi:10.1177/0146167299025005004
Klar, Y., Medding, A., & Sarel, D. (1996). Nonunique invulnerability:Singular versus distributional probabilities and unrealistic optimism incomparative risk judgments. Organizational Behavior and Human De-cision Processes, 67, 229–245. doi:10.1006/obhd.1996.0076
Klein, C. T. F., & Helweg-Larsen, M. (2002). Perceived control and theoptimistic bias: A meta-analytic review. Psychology & Health, 17,437–446. doi:10.1080/0887044022000004920
Krizan, Z., & Windschitl, P. D. (2007). The influence of outcome desir-ability on optimism. Psychological Bulletin, 133, 95–121. doi:10.1037/0033-2909.133.1.95
Krueger, J. I., Acevedo, M., & Robbins, J. M. (2006). Self as sample. In K.Fiedler & P. Juslin (Eds.), Information sampling and adaptive cognition(pp. 353–377). New York, NY: Cambridge University Press.
Kruger, J. (1999). Lake Wobegon be gone! The “below-average effect” andthe egocentric nature of comparative ability judgments. Journal ofPersonality and Social Psychology, 77, 221–232. doi:10.1037/0022-3514.77.2.221
Kruger, J., & Burrus, J. (2004). Egocentrism and focalism in unrealisticoptimism (and pessimism). Journal of Experimental Social Psychology,40, 332–340. doi:10.1016/j.jesp.2003.06.002
Kruger, J., Windschitl, P. D., Burrus, J., Fessel, F., & Chambers, J. R.(2008). The rational side of egocentrism in social comparisons. Journalof Experimental Social Psychology, 44, 220 –232. doi:10.1016/j.jesp.2007.04.001
Kunda, Z. (1990). The case for motivated reasoning. Psychological Bul-letin, 108, 480–498. doi:10.1037/0033-2909.108.3.480
Ladouceur, R., Gaboury, A., Dumont, D., & Rochette, P. (1988). Gam-bling: Relationship between the frequency of wins and irrational think-ing. Journal of Psychology, 122, 409–414.
Langer, E. (1975). The illusion of control. Journal of Personality andSocial Psychology, 32, 311–328. doi:10.1037/0022-3514.32.2.311
Langer, E. J., & Roth, J. (1975). Heads I win, tails it’s chance: The illusionof control as a function of the sequence of outcomes in a purely chancetask. Journal of Personality and Social Psychology, 32, 951–955. doi:10.1037/0022-3514.32.6.951
Lee, C. (1989). Perceptions of immunity to disease in adult smokers.Journal of Behavioral Medicine, 12, 267–277. doi:10.1007/BF00844871
Lek, Y., & Bishop, G. D. (1995). Perceived vulnerability to illness threats:The role of disease type, risk factor perception and attributions. Psy-chology and Health, 10, 205–219. doi:10.1080/08870449508401950
Lichtenstein, S., Fischhoff, B., & Phillips, L. D. (1982). Calibration ofprobabilities: The state of the art to 1980. In D. Kahneman, P. Slovic, &A. Tversky (Eds.), Judgment under uncertainty: Heuristics and biases(pp. 306–334). Cambridge, England: Cambridge University Press.
Lichtenstein, S., Slovic, P., Fischhoff, B., Layman, M., & Combs, B.(1978). Judged frequency of lethal events. Journal of ExperimentalPsychology: Human Learning and Memory, 4, 551–578. doi:10.1037/0278-7393.4.6.551
Lin, Y.-C., Lin, C. H., & Raghubir, P. (2003). Avoiding anxiety, beingin denial, or simply stroking self-esteem: Why self-positivity? Jour-nal of Consumer Psychology, 13, 464 – 477. doi:10.1207/S15327663JCP1304_13
151UNREALISTIC OPTIMISM: A CAUTIONARY NOTE
Lin, Y. C., & Raghubir, P. (2005). Gender differences in unrealisticoptimism about marriage and divorce: Are men more optimistic andwomen more realistic? Personality and Social Psychology Bulletin, 31,198–207. doi:10.1177/0146167204271325
Marks, R. W. (1951). The effect of probability, desirability and “privilege”on the stated expectations of children. Journal of Personality, 19,332–351. doi:10.1111/j.1467-6494.1951.tb01107.x
Martha, C., Sanchez, X., & Goma-i-Freixanet, M. (2009). Risk perceptionas a function of risk exposure amongst rock climbers. Psychology ofSport and Exercise, 10, 193–200. doi:10.1016/j.psychsport.2008.07.004
Matute, H., Vadillo, M. A., Blanco, F., & Musca, S. C. (2007). Eithergreedy or well- informed: The reward maximization–unbiased evalua-tion trade-off. In S. Vosniadou, D. Kayser, & A. Protopapas (Eds.),Proceedings of the European Cognitive Science Conference (pp. 341–346). Hove, England: Erlbaum.
McKenna, F. P. (1993). It won’t happen to me: Unrealistic optimism orillusion of control? British Journal of Psychology, 84, 39–50.
McKenna, F. P., Warburton, D. M., & Winwood, M. (1993). Exploring thelimits of optimism: The case of smokers’ decision making. BritishJournal of Psychology, 84, 389–394.
Mellers, B. A., & McGraw, P. A. (1999). How to improve Bayesianreasoning: Comment on Gigerenzer and Hoffrage (1995). PsychologicalReview, 106, 417–424. doi:10.1037/0033-295X.106.2.417
Miller, A. G., Ashton, W. A., & McHoskey, J. W. (1990). What priceattractiveness? Stereotype and risk factors in suntanning behavior. Jour-nal of Applied Social Psychology, 20, 1272–1300. doi:10.1111/j.1559-1816.1990.tb01472.x
Moore, D. A. (2007a). Not so above average after all: When people believethey are worse than average and its implications for theories of bias insocial comparison. Organizational Behavior and Human Decision Pro-cesses, 102, 42–58. doi:10.1016/j.obhdp.2006.09.005
Moore, D. A. (2007b). When good � better than average. Judgment andDecision Making, 2, 277–291.
Moore, D. A., & Healy, P. J. (2008). The trouble with overconfidence.Psychological Review, 115, 502–517. doi:10.1037/0033-295X.115.2.502
Moore, D. A., & Small, D. A. (2007). Error and bias in comparativejudgment: On being both better and worse than we think we are. Journalof Personality and Social Psychology, 92, 972–989. doi:10.1037/0022-3514.92.6.972
Moore, D., & Small, D. (2008). When it is rational for the majority tobelieve that they are better than average. In J. I. Krueger (Ed.), Ratio-nality and social responsibility: Essays in honor of Robyn Mason Dawes(pp. 141–174). New York, NY: Psychology Press.
Morlock, H. (1967). The effect of outcome desirability on informationrequired for decisions. Behavioral Science, 12, 296–300. doi:10.1002/bs.3830120404
Office for National Statistics. (2000). Registrations of cancer diagnosed in1994–1997, England and Wales. Health Statistics Quarterly, 7, 71–82.
Otten, W., & van der Pligt, J. (1996). Context effects in the measurementof comparative optimism in probability judgments. Journal of Socialand Clinical Psychology, 15, 80–101.
Perloff, L. S., & Fetzer, B. K. (1986). Self–other judgments and perceivedvulnerability to victimization. Journal of Personality and Social Psy-chology, 50, 502–510. doi:10.1037/0022-3514.50.3.502
Pfeifer, P. E. (1994). Are we overconfident in the belief that probabilityforecasters are overconfident? Organizational Behavior and HumanDecision Processes, 58, 203–213. doi:10.1006/obhd.1994.1034
Pietromonaco, P. R., & Markus, H. (1985). The nature of negative thoughtsin depression. Journal of Personality and Social Psychology, 48, 799–807. doi:10.1037/0022-3514.48.3.799
Price, P. C., Pentecost, H. C., & Voth, R. D. (2002). Perceived eventfrequency and the optimistic bias: Evidence for a two-process model of
personal risk judgments. Journal of Experimental Social Psychology, 38,242–252. doi:10.1006/jesp.2001.1509
Price, P. C., Smith, A. R., & Lench, H. C. (2006). The effect of target groupsize on risk judgments and comparative optimism: The more, the riskier.Journal of Personality and Social Psychology, 90, 382–398. doi:10.1037/0022-3514.90.3.382
Pyszczynski, T., Holt, K., & Greenberg, J. (1987). Depression, self-focusedattention, and expectancies for positive and negative future life eventsfor self and others. Journal of Personality and Social Psychology, 52,994–1001. doi:10.1037/0022-3514.52.5.994
Radzevick, J. R., & Moore, D. A. (2008). Myopic biases in competitions.Organizational Behavior and Human Decision Processes, 107, 206–218. doi:10.1016/j.obhdp.2008.02.010
Regan, P. C., Snyder, M., & Kassin, S. M. (1995). Unrealistic optimism,self- enhancement or person positivity. Personality and Social Psychol-ogy Bulletin, 21, 1073–1082. doi:10.1177/01461672952110008
Rise, J., Strype, J., & Sutton, S. (2002). Comparative risk ratings and lungcancer among Norwegian smokers. Addiction Research and Theory, 10,313–320. doi:10.1080/16066350211865
Rogers, P., & Webley, P. (2001). “It could be us!”: Cognitive and socialpsychological factors in UK National Lottery play. Applied Psychology,50, 181–199. doi:10.1111/1464-0597.00053
Rose, J. P., Endo, Y., Windschitl, P. D., & Suls, J. (2008). Culturaldifferences in unrealistic optimism and pessimism: The role of ego-centrism and direct versus indirect comparison measures. Personalityand Social Psychology Bulletin, 34, 1236 –1248. doi:10.1177/0146167208319764
Rothman, A. J., & Kiviniemi, M. T. (1999). Treating people with infor-mation: An analysis and review of approaches to communicating healthrisk information. Journal of the National Cancer Institute Monograph,25, 44–51.
Rothman, A. J., Klein, W. M., & Weinstein, N. D. (1996). Absolute andrelative biases in estimations of personal risk. Journal of Applied SocialPsychology, 26, 1213–1236. doi:10.1111/j.1559-1816.1996.tb01778.x
Rutter, D. R., Quine, L., & Albery, I. P. (1998). Perceptions of risk inmotorcyclists: Unrealistic optimism, relative realism and predictions ofbehaviour. British Journal of Psychology, 89, 681–696.
Salovey, P., & Birnbaum, D. (1989). Influence of mood on health-relevantcognitions. Journal of Personality and Social Psychology, 57, 539–551.doi:10.1037/0022-3514.57.3.539
Shepperd, J. A., Helweg-Larsen, M., & Ortega, L. (2003). Are comparativerisk judgments consistent across time and events? Personality and SocialPsychology Bulletin, 29, 1169–1180. doi:10.1177/0146167203254598
Shepperd, J. A., Ouellette, J. A., & Fernandez, J. K. (1996). Abandoningunrealistic optimism: Performance estimates and the temporal proximityof self-relevant feedback. Journal of Personality and Social Psychology,70, 844–855. doi:10.1037/0022-3514.70.4.844
Sloman, S. A., Over, D., Slovak, L., & Stibel, J. M. (2003). Frequencyillusions and other fallacies. Organizational Behavior and Human De-cision Processes, 91, 296–309. doi:10.1016/S0749-5978(03)00021-9
Slovic, P. (1966). Value as a determiner of subjective probability. IEEETransactions on Human Factors in Electronics, HFE-7, 22–28. doi:10.1109/THFE.1966.231980
Soll, J. B. (1996). Determinants of overconfidence and miscalibration: Theroles of random error and ecological structure. Organizational Behaviorand Human Decision Processes, 65, 117–137. doi:10.1006/obhd.1996.0011
Sparks, P., Shepherd, R., Wieringa, N., & Zimmermanns, N. (1995).Perceived behavioural control, unrealistic optimism and dietary change:An exploratory study. Appetite, 24, 243–255. doi:10.1016/S0195-6663(95)99787-3
Sutton, S. R. (1999). How accurate are smokers’ perceptions of risk?Health, Risk and Society, 1, 223–230. doi:10.1080/13698579908407020
Sutton, S. R. (2002). Influencing optimism in smokers by giving informa-
152 HARRIS AND HAHN

tion about the average smoker. Risk Decision and Policy, 7, 165–174.doi:10.1017/S1357530902000595
Svenson, O. (1981). Are we all less risky and more skillful than our fellowdrivers? Acta Psychologica, 47, 143–148. doi:10.1016/0001-6918(81)90005-6
Taylor, S. E., & Brown, J. D. (1988). Illusion and well-being: A socialpsychological perspective on mental health. Psychological Bulletin, 103,193–210. doi:10.1037/0033-2909.103.2.193
Ungemach, C., Chater, N., & Stewart, N. (2009). Are probabilities over-weighted or underweighted when rare outcomes are experienced(rarely)? Psychological Science, 20, 473– 479. doi:10.1111/j.1467-9280.2009.02319.x
van den Steen, E. (2004). Rational overoptimism (and other biases).American Economic Review, 94, 1141–1151. doi:10.1257/0002828042002697
van der Velde, F. W., Hooykas, C., & van der Pligt, J. (1992). Riskperception and behavior: Pessimism, realism, and optimism aboutAIDS-related health behavior. Psychology and Health, 6, 23–38. doi:10.1080/08870449208402018
van der Velde, F. W., & van der Pligt, J. (1991). AIDS-related healthbehavior: Coping, protection motivation, and previous behavior. Journalof Behavioral Medicine, 14, 429–451. doi:10.1007/BF00845103
van der Velde, F. W., van der Pligt, J., & Hooykas, C. (1994). PerceivingAIDS- related risk: Accuracy as a function of differences in actual risk.Health Psychology, 13, 25–33. doi:10.1037/0278-6133.13.1.25
von Hippel, P. T. (2005). Mean, median, and skew: Correcting a textbookrule. Journal of Statistics Education, 13. Retrieved from http://www.amstat.org/publications/jse/v13n2/vonhippel.html
Wagenaar, W. A. (1988). Paradoxes of gambling behavior. Hove, En-gland: Erlbaum.
Walker, M. B. (1992). Irrational thinking among slot machine players.Journal of Gambling Studies, 8, 245–261. doi:10.1007/BF01014652
Wallsten, T. S., & Budescu, D. V. (1983). Encoding subjective probabil-ities: A psychological and psychometric review. Management Science,29, 151–173. doi:10.1287/mnsc.29.2.151
Wallsten, T. S., Budescu, D. V., Rapoport, A., Zwick, R., & Forsyth, B.(1986). Measuring the vague meanings of probability terms. Journal ofExperimental Psychology: General, 115, 348–365. doi:10.1037/0096-3445.115.4.348
Walter, F. M., & Emery, J. (2006). Perceptions of family history acrosscommon diseases: A qualitative study in primary care. Family Practice,23, 472–480. doi:10.1093/fampra/cml006
Weber, E. U., & Hsee, C. K. (2000). Culture and individual judgment anddecision- making. Applied Psychology, 49, 32–61. doi:10.1111/1464-0597.00005
Weinstein, N. D. (1980). Unrealistic optimism about future life events.Journal of Personality and Social Psychology, 39, 806–820. doi:10.1037/0022-3514.39.5.806
Weinstein, N. D. (1982). Unrealistic optimism about susceptibility tohealth problems. Journal of Behavioral Medicine, 5, 441–460. doi:10.1007/BF00845372
Weinstein, N. D. (1984). Why it won’t happen to me: Perceptions of riskfactors and susceptibility. Health Psychology, 3, 431–457. doi:10.1037/0278-6133.3.5.431
Weinstein, N. D. (1987). Unrealistic optimism about susceptibility tohealth problems: Conclusions from a community-wide sample. Journalof Behavioral Medicine, 10, 481–500. doi:10.1007/BF00846146
Weinstein, N. D. (1989a). Effects of personal experience on self-protectivebehavior. Psychological Bulletin, 105, 31–50. doi:10.1037/0033-2909.105.1.31
Weinstein, N. D. (1989b, December 8). Optimistic biases about personalrisks. Science, 246, 1232–1233. doi:10.1126/science.2686031
Weinstein, N. D. (1999). What does it mean to understand a risk? Evalu-ating risk comprehension. Journal of the National Cancer InstituteMonographs, 25, 15–20.
Weinstein, N. D. (2000). Perceived probability, perceived severity, andhealth- protective behavior. Health Psychology, 19, 65–74. doi:10.1037/0278-6133.19.1.65
Weinstein, N. D., & Klein, W. M. (1995). Resistance of personal riskperceptions to debiasing interventions. Health Psychology, 14, 132–140.doi:10.1037/0278-6133.14.2.132
Weinstein, N. D., & Klein, W. M. (1996). Unrealistic optimism: Presentand future. Journal of Social and Clinical Psychology, 15, 1–8.
Weinstein, N. D., & Lachendro, E. (1982). Egocentrism as a source ofunrealistic optimism. Personality and Social Psychology Bulletin, 8,195–200. doi:10.1177/0146167282082002
Weinstein, N. D., Marcus, S. E., & Moser, R. P. (2005). Smokers’ unre-alistic optimism about their risk. Tobacco Control, 14, 55–59. doi:10.1136/tc.2004.008375
Welkenhuysen, M., Evers-Kiebooms, G., Decruyenaere, M., & van denBerghe, H. (1996). Unrealistic optimism and genetic risk. Psychologyand Health, 11, 479–492. doi:10.1080/08870449608401984
Whitley, B. E., & Hern, A. L. (1991). Perceptions of vulnerability topregnancy and the use of effective contraception. Personality and SocialPsychology Bulletin, 17, 104–110. doi:10.1177/0146167291171016
Windschitl, P. D. (2002). Judging the accuracy of a likelihood judgment:The case of smoking risk. Journal of Behavioral Decision Making, 15,19–35. doi:10.1002/bdm.401
Windschitl, P. D., Kruger, J., & Simms, E. N. (2003). The influence ofegocentrism and focalism on people’s optimism in competitions: Whenwhat affects us equally affects me more. Journal of Personality andSocial Psychology, 85, 389–408. doi:10.1037/0022-3514.85.3.389
Yates, J. F. (1990). Judgment and decision making. Englewood Cliffs, NJ:Prentice Hall.
Yates, J. F. (2010). Culture and probability judgment. Social and Person-ality Psychology Compass, 4, 174 –188. doi:10.1111/j.1751-9004.2009.00253.x
Zakay, D. (1984). The influence of perceived event’s controllability on itssubjective occurrence probability. The Psychological Record, 34, 233–240.
Zakay, D. (1996). The relativity of unrealistic optimism. Acta Psycho-logica, 93, 121–134. doi:10.1016/0001-6918(96)00025-X
(Appendix follows)
153UNREALISTIC OPTIMISM: A CAUTIONARY NOTE
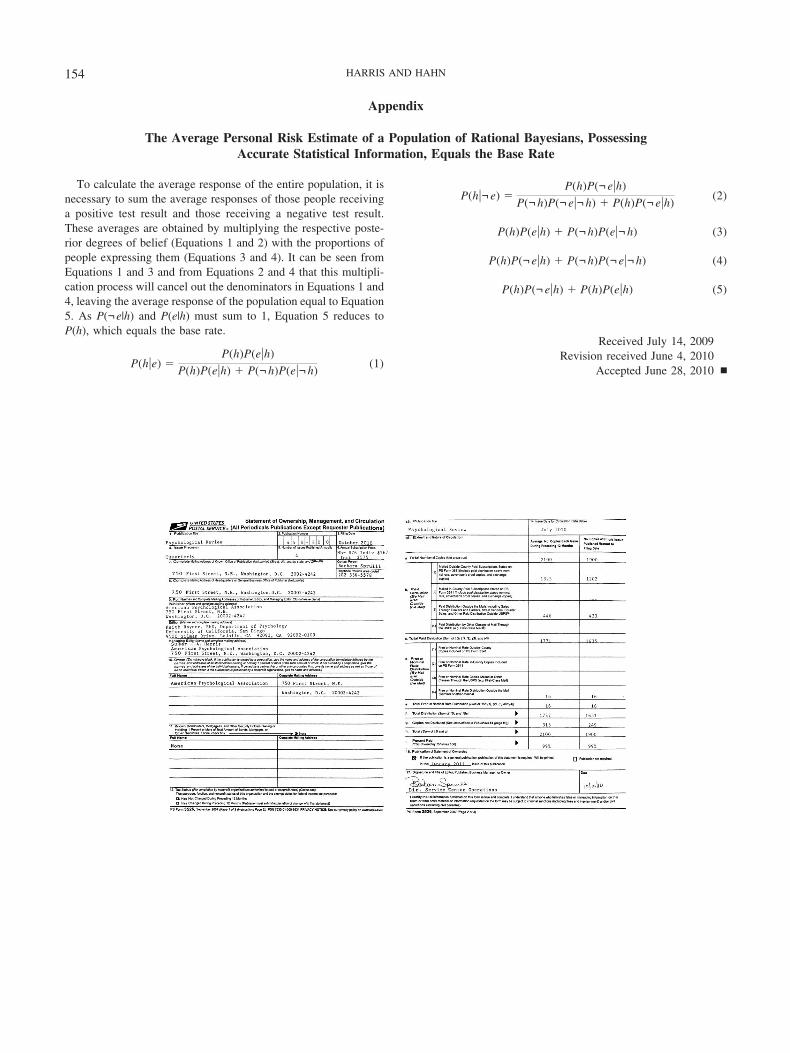
Appendix
The Average Personal Risk Estimate of a Population of Rational Bayesians, PossessingAccurate Statistical Information, Equals the Base Rate
To calculate the average response of the entire population, it isnecessary to sum the average responses of those people receivinga positive test result and those receiving a negative test result.These averages are obtained by multiplying the respective poste-rior degrees of belief (Equations 1 and 2) with the proportions ofpeople expressing them (Equations 3 and 4). It can be seen fromEquations 1 and 3 and from Equations 2 and 4 that this multipli-cation process will cancel out the denominators in Equations 1 and4, leaving the average response of the population equal to Equation5. As P(¬e|h) and P(e|h) must sum to 1, Equation 5 reduces toP(h), which equals the base rate.
P(h�e) �P(h)P(e�h)
P(h)P(e�h) � P(¬ h)P(e�¬ h)(1)
P(h�¬ e) �P(h)P(¬ e�h)
P(¬ h)P(¬ e�¬ h) � P(h)P(¬ e�h)(2)
P(h)P(e�h) � P(¬ h)P(e�¬ h) (3)
P(h)P(¬ e�h) � P(¬ h)P(¬ e�¬ h) (4)
P(h)P(¬ e�h) � P(h)P(e�h) (5)
Received July 14, 2009Revision received June 4, 2010
Accepted June 28, 2010 �
154 HARRIS AND HAHN