Embed Size (px)
Citation preview
1
Unmasking the middle-class: profile and determinants
Jose Ramon G. Albert, Ph.D., Angelo Gabrielle F. Santos, and Jana Flor V.
Vizmanosa
a First author is senior research fellow, second author is research associate/consultant,
while third author is research assistant of the Philippine Institute for Development
Studies (PIDS). First author was seconded to the now defunct National Statistical
Coordination Board as Secretary-General from October 2012 to February 2014.Views
expressed are the authors’ own.
2
Unmasking the middle-(income) class: profile and determinants
Long-term aspirations of Filipinos have been articulated in Ambisyon 2040,
which envisages a predominantly “middle class” society where no one is poor.
However, there is no international standard for defining the middle income class
that can be used as a tool to monitor progress towards this long-term aspiration.
This paper defines the middle-income class as those whose per capita incomes
are within two and twelve- times the (official) poverty line. Descriptive analyses
based on analysis of secondary data from the Family Income and Expenditure
Survey over 1991-2015, show a growing middle class in the country. Recent data
show that middle income households are largely found in urban areas (especially
Metro Manila and neighboring regions) and own their dwellings. Most members
of middle-class families who are economically active have attained more than
secondary education and are typically engaged in non-vulnerable salaried
employment. The determinants of middle-income status are identified using a
multinomial logistic model. Results of the empirical estimation are generally
consistent with the findings of the descriptive analyses. Further, they suggest that
the middle class has accumulated various assets, such as televisions, cell phones,
refrigerators, washing machines, radios, desktops/laptops, motorbike, stereo,
aircon, oven, and cars. The study also performs a simulation exercise to assess
whether the long-term goal of a predominantly “middle class” society can be
achieved using the thresholds for defining the middle-income class. The paper
also provides policy implications on the growth of the middle-class (and its
expenditure patterns), the importance of gaining behavioral insights on their
likely consumption behavior, and on the need for policy action to address
vulnerabilities, especially of those in the lower part of the middle class.
Keywords: middle-class; income distribution, economic development, poverty,
human capital, median voter

3
1. Introduction: how to define the middle-class
In the past 20 years, the Philippines has experienced a decline in poverty, and
consequently an increase in the non-poor who have much better purchasing power than
the poor. In this paper, we break-down the income distribution into the lower-, middle-
and upper- income classes. The increasing consumption of the middle-class is likely to
have socio-environmental consequences, particularly in shaping natural resource and
space availability, air pollution and carbon emissions. In the wake of sustained growth
prospects, Filipino middle-class consumer behavior is an interesting case for study.
The middle-class drives economic growth across societies, albeit with mixed evidence.
The strongest evidence for a connection between economic growth and middle-class
growth exists for consumption (Murphy et al. 1989; Chun et al. 2017) and human
capital factors (Banerjee & Duflo 2008). More consumption by growing middle-classes,
especially demand for products and services of higher quality, boosts investments in
production, government service quality and supports economies of scale (Huntington
1991; Kharas 2017; Chun et al. 2017). Conditioned on ethnic similarity, countries with
a large middle-class tend to grow faster (Easterly 2001). However, the historical role of
the middle-classes in 19th
century Europe as the backbone of society and of a thriving
economy, based on shared values (e.g., Weber 1985; Landes 1998), does not easily
apply to today‟s economies anymore (Knauss 2019).
While the middle-class plays a crucial role in a country‟s development, there is hitherto
no internationally accepted practice for defining the middle-class, just as there is no
universally accepted definition of poverty though poverty tends to be seen and
measured from a monetary lens (Joliffe and Prydz 2016). Economists tend to define the
middle-class either through absolute thresholds for income or consumption at
purchasing power parity (PPP) prices (Banerjee and Duflo 2008; Ravallion 2010; ADB
2010; Kharas 2017; Chun et al. 2017;), or relative thresholds based on the average or
median income (Easterly 2001; Foster and Wolfson 2009; Birdsall 2010). Definitions of
the middle-class involving non-monetary metrics also vary widely across sociology
(McEwan et al. 2015; Southall 2016; Neubert and Stoll 2018) and other social sciences
(Spronk 2012; Melber 2013). In the Philippines, Virola et al. (2013) use cluster analysis
on (per capita) income distribution to estimate the size of the middle-class, while market
researchers group households into five socio economic classifications based on a
scoring system of the quality of consumers (i.e., employment and educational
characteristics of the household), household assets, amenities, and facilities (Bersales et
al. 2013).
This essay, modifying slightly the work of Albert et al. (2015), makes use of an
absolute, income-based middle-class definition that results from dividing the (per
capita) income distribution into seven income clusters, and consequently three income-
based classes (see Table 1). The starting points for the clusters are the official poverty
lines, which account for meeting basic food and non-food needs such as clothing, rent,
paying for utilities, etc., and vary across provincial urban/rural areas; The seven (per
capita) income clusters consist of:
(1) the poor (whose per capita incomes fall below the poverty line);
(2) the low-income but not poor (with per capita incomes between the poverty line and
twice the poverty line);
4
(3) the lower-middle cluster (with per capita incomes between twice and four times the
poverty line);
(4) the middle-middle cluster (with per capita incomes between four times and seven times
the poverty line);
(5) the upper-middle cluster (with per capita incomes between seven times and twelve
times the poverty line);
(6) the upper income but not rich (with per capita incomes between twelve times and
twenty times the poverty threshold); and,
(7) the rich (with per capita incomes higher than twenty times the poverty line).
The three income classes are defined by grouping the clusters as follows: the low-
income class to consist of the two lowest clusters; the upper income class to comprise
the two highest income clusters; and the middle-income class, which we henceforth
refer to as middle-class, to include the three middle-income clusters.
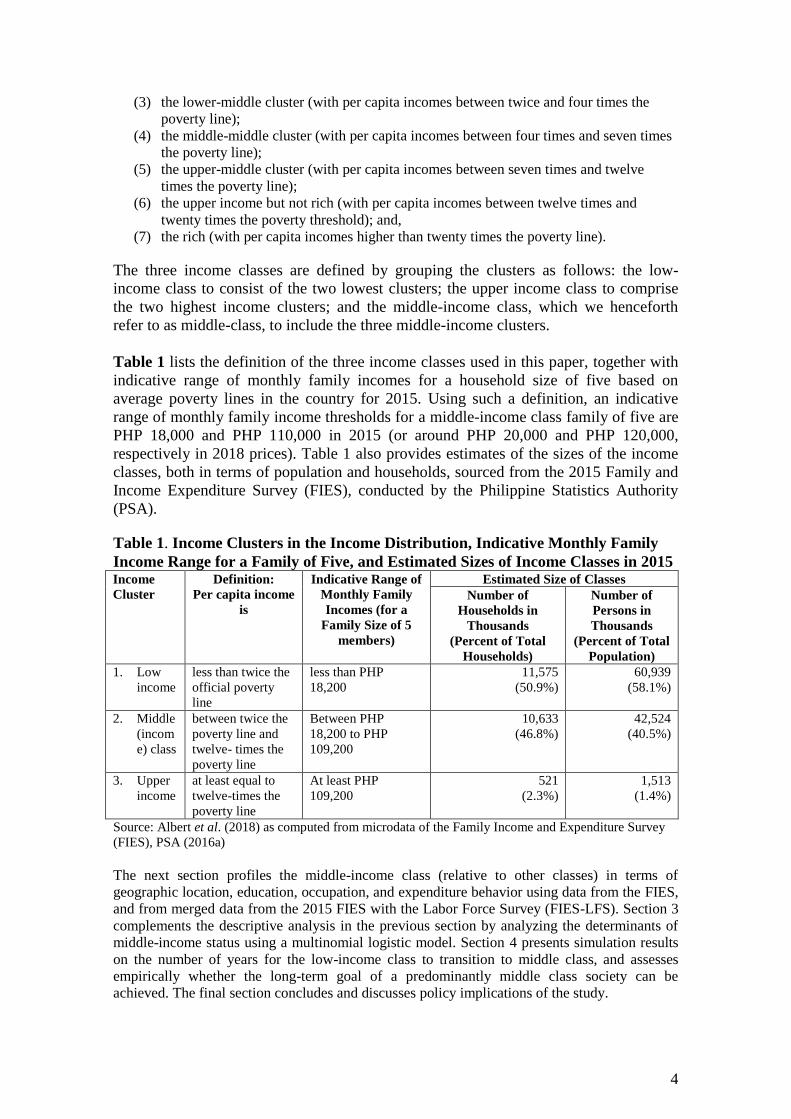
Table 1 lists the definition of the three income classes used in this paper, together with
indicative range of monthly family incomes for a household size of five based on
average poverty lines in the country for 2015. Using such a definition, an indicative
range of monthly family income thresholds for a middle-income class family of five are
PHP 18,000 and PHP 110,000 in 2015 (or around PHP 20,000 and PHP 120,000,
respectively in 2018 prices). Table 1 also provides estimates of the sizes of the income
classes, both in terms of population and households, sourced from the 2015 Family and
Income Expenditure Survey (FIES), conducted by the Philippine Statistics Authority
(PSA).
Table 1. Income Clusters in the Income Distribution, Indicative Monthly Family
Income Range for a Family of Five, and Estimated Sizes of Income Classes in 2015 Income
Cluster
Definition:
Per capita income
is
Indicative Range of
Monthly Family
Incomes (for a
Family Size of 5
members)
Estimated Size of Classes
Number of
Households in
Thousands
(Percent of Total
Households)
Number of
Persons in
Thousands
(Percent of Total
Population)
1. Low
income
less than twice the
official poverty
line
less than PHP
18,200
11,575
(50.9%)
60,939
(58.1%)
2. Middle
(incom
e) class
between twice the
poverty line and
twelve- times the
poverty line
Between PHP
18,200 to PHP
109,200
10,633
(46.8%)
42,524
(40.5%)
3. Upper
income
at least equal to
twelve-times the
poverty line
At least PHP
109,200
521
(2.3%)
1,513
(1.4%)
Source: Albert et al. (2018) as computed from microdata of the Family Income and Expenditure Survey
(FIES), PSA (2016a)
The next section profiles the middle-income class (relative to other classes) in terms of
geographic location, education, occupation, and expenditure behavior using data from the FIES,
and from merged data from the 2015 FIES with the Labor Force Survey (FIES-LFS). Section 3
complements the descriptive analysis in the previous section by analyzing the determinants of
middle-income status using a multinomial logistic model. Section 4 presents simulation results
on the number of years for the low-income class to transition to middle class, and assesses
empirically whether the long-term goal of a predominantly middle class society can be
achieved. The final section concludes and discusses policy implications of the study.

5
2. The profile of the middle-class
The current size and growth trend of the Filipino middle-class since 1991 already show
that it is steadily developing into a consumer group that matters to the country‟s
development trajectory (Figure 1). As of 2015, nearly half (46.8%) of households were
middle-class, while slightly more than half (50.9%) belonged to lower-income class,
and a much smaller share (2.3%) of households were upper-income class (FIES data,
income-based approach). In terms of population, about two in every five (40.5%)
Filipinos in 2015 belonged to the middle-class, nearly three-fifths (58.1%) to low-
income class, and the remaining (1.4%) to high-income. From 1991 to 2015, 23.4
million more Filipinos joined the middle-class, with the proportion of middle-class
Filipinos increasing by 12.3 percentage points from 28.5 percent to 40.8 percent. The
income distribution, however, hardly changed between 2006 and 2015 with the share of
the middle-class population increasing only by 1.4 percentage points from 39.1 percent
in 2006 to 40.5 percent in 2015 despite robust economic growth in this period.
Figure 1. Share of population (in percent) by income class: 2006-2015
Note: Authors‟ calculations from microdata of the Family Income and Expenditure Survey (FIES), PSA
(2016a); National Statistics Office (2006; 1991).
Increasing political strength
The government has traditionally focused social protection toward the low-income class
but of late, it has shifted toward implementing universal programs, particularly for
health and education, in the face of the increasing strengths of the middle-class and the
growing middle-class discontent over social assistance, often targeted to the poor
(Curato 2016). The political importance of the middle-class as a voter group becomes
clear in several policy fields. Two major legislation, the First Package of the Tax
Reform for Acceleration and Inclusion (TRAIN 1) as well as the Universal Access to
Quality Tertiary Education Act of 2017, both benefit the middle-classes more strongly
than the lower classes. The middle-class has also been widely viewed as pivotal to the
election of Rodrigo Duterte as President in 2016, thus explaining the shift in targeting of

6
political programmes; the middle-classes have also become a key interest group for
non-government organizations such as megachurches (Lang 2018; Curato 2016).
Place of residence
Urban dwellers are predominantly middle-class: three in five urban residents are
middle-class, while only 1 in 20 is high-income. Among rural households, only a third
are middle-class, while more than three-fifths are low-income. Among the regions,
Metro Manila Central Luzon, and CALABARZON are where the middle-class
dominantly reside.
Housing tenure
Middle-class households tend to own their dwellings: about three in every four (74%)
middle-income households reside in dwellings that they own, while, 23 percent of the
middle-class rent, and 3 percent are informal settlers. In Metro Manila, only three-fifths
(58%) of the middle-class own their residences, a third rent their dwellings (35%) and
nearly a tenth (7%) are informal settlers.
While a relatively small proportion of middle-class households live as informal settlers,
the middle-class constitutes a big proportion of informal settlers nationwide: two in
every five (42%) informal settlers belonged to the middle-class, while the remaining
(58%) were from the low-income class. In Metro Manila alone, roughly seven in every
ten (69%) informal settlers belonged to the middle-income class.
Education
In 2015, half of Filipino middle-class aged at least 24 years old attained education
beyond secondary education. While this figure was lower than that of the high-income
(78%), it was much higher than that of the low-income (13%). The middle and upper-
income classes put a high premium on education; they make use of their resources for
the schooling of their children that will yield future dividends in their living standards.
Labor and employment
Making use of merged data from the 2015 FIES and the Labor Force Survey (PSA
2016b), we find that unemployment rates are slightly higher among the middle-class
(2.8%) than among the lower income class (2.2%), as of 2015. Among the income
clusters, the bulk (70.0%) of unemployment is within the low-income but not poor, as
well as the lower middle-income. A quarter of the middle-class work in wholesale and
retail trade. Nearly a fifth (17%) are in transport, communication, and storage while
about 16 percent work in government, mostly as clerks or public-school teachers. Only
11 percent of middle-class workers depend on agriculture, and most belong to the lower
middle-income cluster.
The middle-class is neither into entrepreneurial activities nor into vulnerable
employment: in 2015, more than 6 in every 10 of the employed middle-class are in
salaried work. Self-employment account for only a quarter (23%) of jobs of the middle-
class compared to a third (30%) for the low-income (30%) class. Employed members of

7
middle-class households also work more hours than their counterparts from low-income
households. This pattern holds even for both sexes ,whether in urban or rural areas.
Overseas Filipino workers and remittances
Merged FIES-LFS data suggests that just more than a tenth (13%) of middle-class
households have a family member who is an Overseas Filipino worker (OFW),
compared to merely 4 percent for the low-income class, and 15 percent for the high-
income class. Among families with an OFW, three-quarters (73%) are middle-class,
while less than a quarter (23%) are low-income, and the remaining (4%0 are upper
income. Of the 73 percent families with OFWs from the middle-class, about half are
from the lower middle-income cluster. Among low-income families with an OFW, the
bulk (83%) is from the low-income but not poor. Two-fifths (38%) of middle-class
families receive remittances, compared to less than a fifth (17%) for the lower-income
class, and four-ninths (44%) for the upper-income class.
Education, Health, Transportation Expenditures
In terms of the share of education expenses to total household expenditure, the middle-
class education spends about similar (4.1%) to the upper-income class (4.7%), 63
percent more than that spent (2.5%) by low-income counterparts, according to the FIES
(Figure 2). The discrepancy in the share of health expenses across income classes is
much larger than those on education, transportation, and electricity, gas and other fuels.
The data also confirm Engel‟s law which states that the share of food in total
expenditures decreases with upward social mobility.
Figure 2. Share (in %) of Food, Education, Health, Transportation to Total
Household Expenditure, by Income Classes: 2015
Source: Authors‟ calculations from microdata of 2015 FIES, PSA (2016a) Note:
* = electricity, gas and other fuels
Disaggregation of FIES data on transportation expenses by passenger transport mode
shows that the middle- and upper-income classes spend nearly the same amount on road
8
transport services (which is more than twice the spending of the low income class), but
the upper-income far outspends the middle-income in air transport services.
Access to safe water
Middle-income households have better access to safe and clean water than low-income
counterparts. Five in every seven middle-income households used water from the
community water system; in contrast, around 60 percent of the low-income relied on
ground and surface water, considered potential sources of contamination from microbes
and chemicals (WHO 2006).
The low access to safe water services among low- income households is associated with
where they live. In rural areas, access to community water system was very low at only
41 percent in 2015. In some regions, a majority of the middle- income still use ground
and surface water. These areas include the Autonomous Region in Muslim Mindanao
(69%) and the Cordillera Administrative Region (56%).
In sum, the Filipino middle-class is mostly urban, growing in size and that they
contribute to human capital (steady jobs, education). While FIES data shows that living
conditions of middle-class households have been improving in the past 20 years, a
larger proportion of the middle-classes still belong to the lower middle cluster. The
sociodemographic profile of the middle class indicates its consumption capacities and
that opportunities of the middle-classes exist, but clearly, the lifestyle choices, including
transportation spending, determine the impact of consumption on economic
development. This applies especially to lower middle-class cluster households which
are more capital-constrained.
3. Determinants of the middle-class
While the previous section provides various insights in assessing how patterns of
economic change are likely to affect the middle class (and other income classes), it is
limited by its bivariate content. This section examines the determinants of being middle
class in the Philippines using a multinomial logistic model, which allows us to infer
causality of specific household characteristics and other factors on the welfare of the
middle-income class, and thus identify how the middle class may grow by making
changes in some of the determinants conditional on the level of other factors.
The dataset used in the analysis is a merged database of microdata of the FIES 2015,
with the Labor Force Survey (LFS) for the 1st Quarter of 2016, together with barangay
information sourced from the 2010 Census of Population and Housing (CPH) Form 5.
The merged data allowed for the use of various variables to understand determinants of
the middle class. The FIES contains household and housing characteristics; the LFS has
information on characteristics of household members; while the CPH has information
on the community to which the household belongs. The findings here, however, are
limited by the lack of availability of more recent Form 5 data.
Outcome groups in the analysis are (1) low-income, (2) middle-income, and (3) high-
income classes. The low-income class is treated as the base outcome. Explanatory
variables used in the model are the following:

9
Mostly, the results of the multinomial logistic regression (see Annex) confirm the
findings from the descriptive analysis in the previous section. Having a large family
decreases the likelihood of being middle class at an increasing rate. Also, having a large
share of school-aged children is less associated with being middle class. Meanwhile,
living in urban areas, owning durable goods, living in own house, and having strong
roof and walls are also positively associated with being middle class.
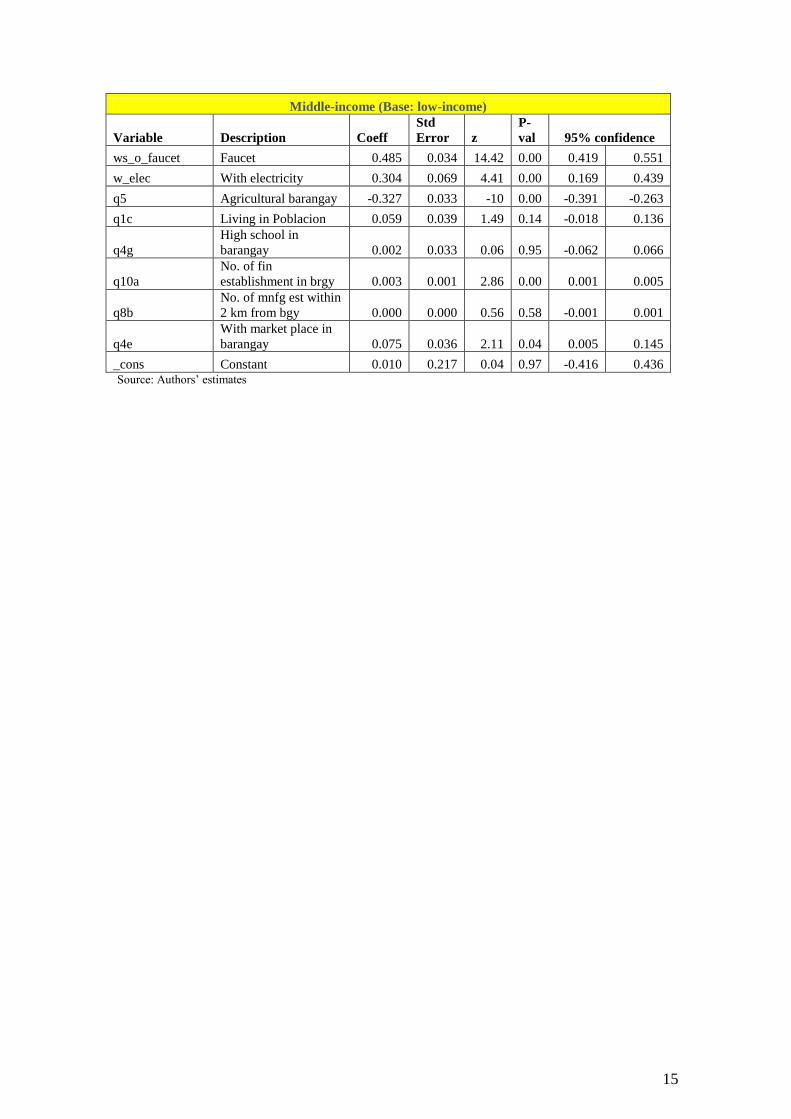
Results for the community characteristics describe how the communities of each income
group compare. While the low income class tends to living in agricultural communities,
the middle income class is associated with living close to financial establishments and a
market place, which are common in urban communities. The upper income households
are associated with living in the town center (poblacion) and having access to
manufacturing establishments.
4. Transition of the poor and lower-income class to middle-class
Future ambitions and simulations of middle-class development make clear that
strategies remains necessary to improve income mobility of Filipinos. In AmBisyon
Natin 2040, Filipinos articulated their long-term aspiration to “live in a prosperous,
predominantly middle-class society where no one is poor” (NEDA 2016).
Following Morduch (1998), this study examined how long it takes for the low-income
class to transition to middle-income status assuming that per capita income grows
annually at a constant rate. To adjust for differences in cost of living across the country,
the study also applied a spatial price index1 to the per capita income of each household
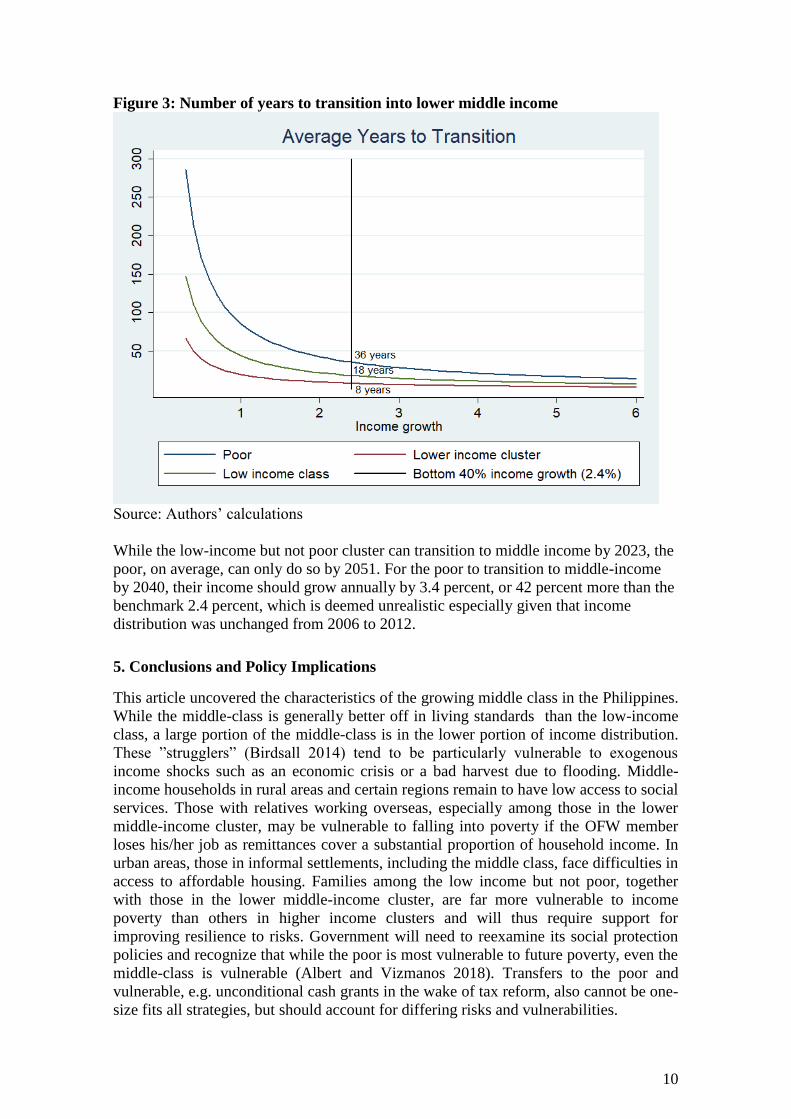
Simulations indicated that if real income per capita grows by 2.4 percent2 per year, the
average transition time for the low-income class to become middle class would be 18
years3 (Figure 3).
1 Based on the official poverty lines costed across urban and rural areas in each province
2 The estimated growth rate of the bottom 40 percent in the period 2009-2015
3 Under the assumption that the growth rate will be continuous and uniform across the
low-income population
Household characteristics
•Family size
•Square of family size
•Age of household head
•Squared age of household head
•Proportion of members aged 0 – 14
•Whether household head is married
•Whether household head is male
•Whether the household is in an urban area
•Regional dummies
•Household head education
Housing characteristics
•Strong roof and walls
•Tenure status: squatter
•Tenure status: own house or owner-like possession
•With faucet
•With electricity
Asset ownership
•With television
•With refrigerator
•With airconditioner
•With car
•With cellphone
Community characteristics
•Agricultural workers constitute more than half of population aged 10 and
above
•Living in the town proper/poblacion
•With high school in the barangay
•With market place in the barangay
•Number of financial establishments in the
barangay
•Number of manufacturing establishments within 2
kilometers from barangay
10
Figure 3: Number of years to transition into lower middle income
Source: Authors‟ calculations
While the low-income but not poor cluster can transition to middle income by 2023, the
poor, on average, can only do so by 2051. For the poor to transition to middle-income
by 2040, their income should grow annually by 3.4 percent, or 42 percent more than the
benchmark 2.4 percent, which is deemed unrealistic especially given that income
distribution was unchanged from 2006 to 2012.
5. Conclusions and Policy Implications
This article uncovered the characteristics of the growing middle class in the Philippines.
While the middle-class is generally better off in living standards than the low-income
class, a large portion of the middle-class is in the lower portion of income distribution.
These ”strugglers” (Birdsall 2014) tend to be particularly vulnerable to exogenous
income shocks such as an economic crisis or a bad harvest due to flooding. Middle-
income households in rural areas and certain regions remain to have low access to social
services. Those with relatives working overseas, especially among those in the lower
middle-income cluster, may be vulnerable to falling into poverty if the OFW member
loses his/her job as remittances cover a substantial proportion of household income. In
urban areas, those in informal settlements, including the middle class, face difficulties in
access to affordable housing. Families among the low income but not poor, together
with those in the lower middle-income cluster, are far more vulnerable to income
poverty than others in higher income clusters and will thus require support for
improving resilience to risks. Government will need to reexamine its social protection
policies and recognize that while the poor is most vulnerable to future poverty, even the
middle-class is vulnerable (Albert and Vizmanos 2018). Transfers to the poor and
vulnerable, e.g. unconditional cash grants in the wake of tax reform, also cannot be one-
size fits all strategies, but should account for differing risks and vulnerabilities.
11
With increasing wealth, middle-class Filipino households tend to spend more on non-
food items, particularly, on electricity, gas and other fuels as well as on transport
service. This increases households‟ carbon footprint. Motivating the middle-class to
remain in public and shared transport services require both strategies that target this
knowledge-action gap and the provision of attractive infrastructure and alternatives to
car ownership and use. As of now, the Philippines does not have a cross-cutting
sustainable consumption policy, but rather some supportive initiatives on promoting
energy efficiency labels and energy saving tips as well as some recycling and plastic
waste initiatives. A deeper understanding of the motivations, barriers and bottlenecks to
sustainable consumption through behavioral insights could lead to differentiated, more
successful policies and programmes across several fields of sustainable consumption.
Of particular importance is discovering how knowledge (which is high given increased
education) becomes consciousness and eventually action for sustainable consumption
(Never and Albert, 2019).
Ensuring availability and sustainable management of safe water and safe sanitation for
all can be achieved by expanding access to community water systems. For cities to be
more inclusive, safe, smart, resilient, and sustainable, the government should
considerably improve access to affordable housing. In the wake of risks of job losses
from automation, social protection measures are also important, especially for middle-
income households relying on OFW remittances (Albert et al. 2018). These steps to
manage risks and resilience are aligned with the country‟s commitment to attaining the
Sustainable Development Goals to ensure that divides that separate the low-, middle-,
and high-income classes will not get any wider.

12
References
Albert, J.R.G., R.E. Gaspar, M.J.M. Raymundo. 2015. Why we should pay attention to the middle class.
PIDS Policy Notes No. 2015-13. Quezon City, Philippines: Philippine Institute for Development Studies.
Albert, J.R.G., and Vizmanos, J. F. V. 2018. Vulnerability to Poverty in the Philippines: An Examination
of Trends from 2003 to 2015. PIDS Discussion Paper No. 2018-10. Quezon City, Philippines: Philippine
Institute for Development Studies.
Albert, J.R.G., A.C. Orbeta Jr., V.B. Paqueo, R.B. Serafica, E.P. Dadios, A.B. Culaba, A.A. Bandala, and
J.C.A.C. Bairan. 2018. Harnessing government‟s role for the Fourth Industrial Revolution. PIDS Policy
Notes No. 2018-14. Quezon City, Philippines: Philippine Institute for Development Studies.
Asian Development Bank (ADB). 2010. Special chapter: The rise of the middle class. Key Indicators for
Asia and the Pacific 2010. Mandaluyong City, Philippines: Asian Development Bank.
Banerjee, A. & Duflo, E.. 2008. What is middle class about the middle classes around the world? Journal
of Economic Perspectives 22(2):3-28.
Bersales, L. G. S., de Jesus, N., Barra, L. , Mercado, J. , Gobencion, B. & Lucagbo, M. D. 2013. 1SEC
2012: The New Philippine Socioeconomic Classification System. Proceedings of the 12th National
Convention on Statistics.
Birdsall, N. 2010. The (indispensable) middle class in developing countries. In R. Kanbur and M. Spence,
Equity and Growth in a Globalizing World. Washington D.C.: World Bank.
Chun, N., Hasan, R., Rahman, M. H. Ulubaşoğlu, M. A. 2017. The Role of Middle Class in Economic
Development: What Do Cross‐Country Data Show? Review of Development Economics.
Volume21, Issue2. May 2017 Pages 404-424.
Curato, N. 2016. Flirting with Authoritarian Fantasies? Rodrigo Duterte and the New Terms of Philippine
Populism. Journal of Contemporary Asia 47 (1), 142-153.
Easterly, W. 2001. “The Middle Class Consensus and Economic Development”, Journal of Economic
Growth 6(4): 317-335.
Foster, J. & Wolfson, M. 2009. Polarization and the decline of the middle class: Canada and the U.S.,
Journal of Economic Inequality, Springer, vol. 8(2), pp. 247-273.
Huntington, S. 1991. The third wave: Democratization in the late twentieth century. Norman, OK:
University of Oklahoma Press.
Joliffe, D. & Prydz, E.B. 2016. Estimating international poverty lines from comparable national
thresholds. World Bank Policy Research Working Paper 7606. Washington D.C. The World Bank.
Kharas, H. 2017. The unprecedented growth of the middle class. An update. Working Paper 100,
Brookings Institution. Washington, D.C.
Landes, D. S. 1998. The Wealth and Poverty of Nations Why Some Are So Rich and Some So Poor. New
York: W. W. Norton & Company, Inc.
Knauss, S. 2019. The myth of the global middle class, globalisation‟s fallback story. Canadian Journal of
Development Studies 40 (2),182-200.
Lang, G. 2018. Pentecoastal Megachurches in Southeast Asia: Negotiating Class, Consumption, and the
Nation. Book review. Journal of Contemporary Asia (ahead of print pp.1-2).
McEwan, C., Hughes, A. & Bek, D. 2015. Theorising middle class consumption from the global South: A
study of everyday ethics in South Africa‟s Western Cape. Geoforum 67, 233-243.

13
Melber, H. 2013. Africa and the Middle Class(es). Africa Spectrum 48 (3), 111-120.
Murphy, K. M., A. Shleifer & Vishny, R. W. 1989. Industrialization and the Big Push. Journal of
Political Economy, 97(5): 1003-1026
Morduch , J. 1998. Poverty, Economic growth and average exit time. Economics Letters, 59 (3), 385-390.
National Economic Development Authority (NEDA). 2015. Ambisyon 2040: A long term vision for the
Philippines. Pasig City, Philippines: NEDA.
National Statistics Office (NSO). 2006. Family Income and Expenditure Survey. Manila, Philippines:
NSO.
---. 2011. 2010 Census of Population and Housing . Manila, Philippines: NSO.
---. 1991. Family Income and Expenditure Survey. Manila, Philippines: NSO.
Neubert, D. & Stoll, F. 2018. The Narrative of the African Middle Class and Its Conceptual Limitations.
In: Kroeker L., O'Kane D., Scharrer T. (eds) Middle Classes in Africa. Frontiers of Globalization.
Palgrave Macmillan, Cham.
Never, B., and Albert, J. R. G. 2019. Unmasking the middle class in the Philippines: aspirations,
lifestyles, and prospects for sustainable consumption. Submitted for Publication.
Philippine Statistics Authority (PSA). 2016a. Family Income and Expenditure Survey 2015. Quezon City,
Philippines: PSA.
---. 2016b. Labor Force Survey July 2015. Quezon City, Philippines: PSA.
Ravallion, M. 2010. The developing world‟s bulging (but vulnerable) „middle class‟. World Development
Volume 38, Issue 4, April 2010, Pages 445-454.
Southall, R. 2016. The new black middle class in South Africa. Suffolk and Rochester, New York, USA:
Woodbridge.
Spronk, R. 2012: Ambiguous Pleasures. Sexuality and Middle Class Self-Perceptions in Nairobi. New
York, Oxford: Berghan Books.
Virola, R. A., J. O. Encarnacion, , B. B. Balamban, , M. B. Adawe, and M. M. Viernes. 2013. “Will the
recent robust economic growth create a burgeoning middle class in the Philippines?” Proceedings of the
12th National Convention on Statistics, October 1-2, 2013.
Weber, M. 1985 (1922). Markt und Gesellschaft. Grundriss der verstehenden Soziologie. Mohr.

14
Annex: Multinomial Logistic Regression results (R-squared: 0.45)
Middle-income (Base: low-income)
Variable Description Coeff
Std
Error z
P-
val 95% confidence
fsize Family size -0.884 0.027
-
33.09 0.00 -0.936 -0.831
fsize_sq Family size squared 0.043 0.002 20.14 0.00 0.039 0.047
age Age of HH head 0.027 0.007 4.2 0.00 0.015 0.040
age_sq
Age of HH head
squared 0.000 0.000 -4.65 0.00 0.000 0.000
p_mem_0_14
Proportion of
members aged 0 -14 -2.635 0.087 -30.2 0.00 -2.806 -2.464
married Married HH head -0.241 0.046 -5.22 0.00 -0.332 -0.151
male Male HH head 0.005 0.046 0.11 0.91 -0.085 0.095
urban Urban residence 0.205 0.040 5.15 0.00 0.127 0.283
regn1 Region I -0.269 0.086 -3.11 0.00 -0.438 -0.100
regn2 Region II -0.345 0.087 -3.98 0.00 -0.515 -0.175
regn3 Region III -0.256 0.082 -3.11 0.00 -0.418 -0.095
regn4 Region V -0.954 0.091
-
10.47 0.00 -1.132 -0.775
regn5 Region VI -0.515 0.085 -6.04 0.00 -0.682 -0.348
regn6 Region VII -0.698 0.088 -7.9 0.00 -0.872 -0.525
regn7 Region VIII -0.879 0.092 -9.58 0.00 -1.059 -0.699
regn8 Region IX -0.959 0.098 -9.74 0.00 -1.152 -0.766
regn9 Region X -1.113 0.097
-
11.49 0.00 -1.302 -0.923
regn10 Region XI -0.777 0.090 -8.61 0.00 -0.954 -0.600
regn11 Region XII -1.194 0.096 -12.5 0.00 -1.381 -1.007
regn12 CAR -0.200 0.091 -2.21 0.03 -0.377 -0.022
regn14 ARMM -1.395 0.115
-
12.18 0.00 -1.619 -1.170
regn15 Region XIII -1.516 0.101
-
15.03 0.00 -1.714 -1.318
regn16 Region IVA -0.290 0.081 -3.56 0.00 -0.450 -0.130
regn17 Region IVB -0.131 0.103 -1.27 0.21 -0.333 0.071
hoh_hgc_2
HH head: Some
elementary/elementary 0.343 0.110 3.11 0.00 0.127 0.559
hoh_hgc_3
HH head: Some
HS/HS 0.751 0.113 6.66 0.00 0.530 0.972
hoh_hgc_4
HH head: Some
college/college/post-
col 1.684 0.117 14.45 0.00 1.456 1.912
house_strong_3 Strong roof and walls 0.566 0.034 16.78 0.00 0.500 0.632
ts_squatter Squatter -0.005 0.092 -0.05 0.96 -0.185 0.176
ts_oh_ol
Own house/Owner-
like possession 0.103 0.035 2.95 0.00 0.034 0.171
w_tv With TV 0.681 0.044 15.34 0.00 0.594 0.768
w_ref With Ref 1.352 0.034 40.23 0.00 1.286 1.417
w_ac With Airconditioner 1.618 0.083 19.4 0.00 1.454 1.781
w_car With car 1.736 0.114 15.26 0.00 1.513 1.959
w_cellphone With cellphone 0.745 0.048 15.43 0.00 0.651 0.840
15
Middle-income (Base: low-income)
Variable Description Coeff
Std
Error z
P-
val 95% confidence
ws_o_faucet Faucet 0.485 0.034 14.42 0.00 0.419 0.551
w_elec With electricity 0.304 0.069 4.41 0.00 0.169 0.439
q5 Agricultural barangay -0.327 0.033 -10 0.00 -0.391 -0.263
q1c Living in Poblacion 0.059 0.039 1.49 0.14 -0.018 0.136
q4g
High school in
barangay 0.002 0.033 0.06 0.95 -0.062 0.066
q10a
No. of fin
establishment in brgy 0.003 0.001 2.86 0.00 0.001 0.005
q8b
No. of mnfg est within
2 km from bgy 0.000 0.000 0.56 0.58 -0.001 0.001
q4e
With market place in
barangay 0.075 0.036 2.11 0.04 0.005 0.145
_cons Constant 0.010 0.217 0.04 0.97 -0.416 0.436 Source: Authors‟ estimates

16
High_income
Variable Description Coeff
Std
Error z P-val
95%
confidence
fsize Family size -2.070 0.069 -30 0.00
-
2.205
-
1.935
fsize_sq Family size squared 0.107 0.005 19.73 0.00 0.096 0.117
age Age of HH head 0.074 0.021 3.56 0.00 0.033 0.114
age_sq
Age of HH head
squared -0.001 0.000 -3.4 0.00
-
0.001 0.000
p_mem_0_14
Proportion of members
aged 0 -14 -4.190 0.325
-
12.89 0.00
-
4.827
-
3.553
married Married HH head -0.080 0.125 -0.64 0.52
-
0.326 0.166
male Male HH head -0.324 0.116 -2.79 0.01
-
0.550
-
0.097
urban Urban residence 0.132 0.120 1.1 0.27
-
0.104 0.368
regn1 Region I -0.675 0.284 -2.38 0.02
-
1.232
-
0.118
regn2 Region II -0.309 0.277 -1.12 0.26
-
0.852 0.234
regn3 Region III -0.817 0.266 -3.08 0.00
-
1.338
-
0.297
regn4 Region V -1.627 0.329 -4.95 0.00
-
2.272
-
0.983
regn5 Region VI -1.118 0.299 -3.74 0.00
-
1.705
-
0.531
regn6 Region VII -1.094 0.284 -3.86 0.00
-
1.650
-
0.539
regn7 Region VIII -0.599 0.285 -2.1 0.04
-
1.158
-
0.040
regn8 Region IX -1.410 0.342 -4.12 0.00
-
2.081
-
0.740
regn9 Region X -1.617 0.313 -5.16 0.00
-
2.230
-
1.003
regn10 Region XI -1.355 0.289 -4.68 0.00
-
1.922
-
0.788
regn11 Region XII -1.504 0.311 -4.84 0.00
-
2.113
-
0.896
regn12 CAR -0.521 0.258 -2.02 0.04
-
1.025
-
0.016
regn14 ARMM -2.520 0.781 -3.23 0.00
-
4.052
-
0.989
regn15 Region XIII -2.014 0.324 -6.21 0.00
-
2.650
-
1.378
regn16 Region IVA -0.878 0.251 -3.5 0.00
-
1.369
-
0.386
regn17 Region IVB 0.838 0.299 2.81 0.01 0.253 1.423
hoh_hgc_2
HH head: Some
elementary/elementary -0.407 0.635 -0.64 0.52
-
1.650 0.837
hoh_hgc_3 HH head: Some HS/HS 0.539 0.628 0.86 0.39
-
0.692 1.770
hoh_hgc_4
HH head: Some
college/college/post-col 2.636 0.626 4.21 0.00 1.410 3.863
house_strong_3 Strong roof and walls 1.641 0.254 6.46 0.00 1.143 2.140
ts_squatter Squatter -0.936 0.785 -1.19 0.23
-
2.474 0.603

17
High_income
Variable Description Coeff
Std
Error z P-val
95%
confidence
ts_oh_ol
Own house/Owner-like
possession 0.461 0.144 3.21 0.00 0.180 0.743
w_tv With TV 1.033 0.275 3.76 0.00 0.494 1.571
w_ref With Ref 2.201 0.156 14.1 0.00 1.895 2.507
w_ac With Airconditioner 2.644 0.132 19.99 0.00 2.385 2.904
w_car With car 3.658 0.153 23.97 0.00 3.359 3.957
w_cellphone With cellphone 1.218 0.207 5.87 0.00 0.811 1.624
ws_o_faucet Faucet 0.664 0.119 5.57 0.00 0.430 0.898
w_elec With electricity 0.562 0.557 1.01 0.31
-
0.529 1.654
q5 Agricultural barangay -0.102 0.110 -0.93 0.35
-
0.318 0.114
q1c Living in Poblacion 0.178 0.103 1.74 0.08
-
0.023 0.379
q4g High school in barangay 0.159 0.100 1.58 0.11
-
0.038 0.355
q10a
No. of fin establishment
in brgy 0.010 0.002 6.18 0.00 0.007 0.014
q8b
No. of mnfg est within 2
km from bgy 0.002 0.001 1.87 0.06 0.000 0.003
q4e
With market place in
barangay -0.073 0.102 -0.71 0.48
-
0.274 0.128
_cons Constant -5.543 0.992 -5.59 0.00
-
7.486
-
3.599 Source: Authors‟ estimates