Embed Size (px)
Citation preview
University of Wisconsin-Madison
Institute for"Research onPovertySpecial Report Series
'LOTTERY PLAY .AMONG I-JISCONSIN ,RESIDENTS: A SECOND LOOK ATIfHO PLAYS .AND HOW MUCH THEYSPEND
Irving PiliavinBradley R. Entner Wright
June 1992
Institute for Research on PovertySpecial Report no. 54
Lottery Play among Wisconsin Residents:A Second Look at Who Plays and How Much They Spend
Report Commissioned by and Submitted tothe Wisconsin State Lottery Board
Irving PiliavinSchool of Social Work
Institute for Research on PovertyUniversity of Wisconsin-Madison
Bradley R. Bntner WrightDepartment of Sociology
Institute for Research on PovertyUniversity of Wisconsin-Madison
June 1992

Acknowledgments
We want to express our appreciation to several people who provided invaluable assistance in
the production of this report. Robert Lee of the Letters and Science Survey Center, University of
Wisconsin-Madison, assisted us in the development of our data gathering instruments and carried out
the survey on which our analyses are based. Diane Harmelink of the Wisconsin State Lottery Board
helped us define the objectives of the study and create the instrument. Michael Polakowski provided
technical and statistical assistance. And Paul Dudenhefer provided editorial assistance. We, of
course, bear the responsibility for the final manuscript, the findings we report, and our conclusions.

Table of Contents
Page
Executive Summary . . . . . . . . . . . . . . . . . . . . . . . . . . . . . . . . . . . . . . . . . . . . . . . . .. 1
Chapter 1: History and Prior Research 4
Chapter 2: Sample Collection, Analysis, and Description . . . . . . . . . . . . . . . . . . . . . . . .. 10
Chapter 3: Lottery Play and Attitudes in 1989 and 1991 . . . . . . . . . . . . . . . . . . . . . . . . .. 18
Chapter 4: Demographic and Attitudinal Correlates of Lottery Play, Expenditures, and
Lottery-Relevant Attitudes . . . . . . . . . . . . . . . . . . . . . . . . . . . . . . . . . . . . . . .. 27
Chapter 5: Racial Differences in Lottery Play, Lottery-Relevant Attitudes, and Lottery
Knowledge ' 44
Chapter 6: Multivariate Analysis of Lottery Play 54
References 65
EXECUTIVE SUMMARY
This report follows up a 1989 study on the lottery play of Wisconsin residents. The 1989
study, which became IRP Special Report no. 50, was completed before SuperCash! and Megabucks,
two lottery games that offer high payoffs but low probabilities of winning, were introduced in
Wisconsin. The 1989 study also sampled too few African-Americans to permit any reliable racial
comparisons. The present report, which, like the prior one, was commissioned by the Wisconsin
State Lottery Board, represents an improvement on both counts. Data on who plays SuperCash! and
Megabucks, how often they are played, and how much players spend on each are presented and
analyzed. And with the help of Survey Sampling Incorporated, a sample of African-American
residents in Wisconsin large enough to permit reliable racial comparisons has been obtained.
There are two samples used in this study. One is a sample of Wisconsin residents, randomly
selected from across the state; the other, as was just mentioned, is a sample of African-American
Wisconsin residents. The random sample of Wisconsin residents, called the "statewide" sample in the
tables of this report, contains 542 people. It is based on a cross-sectional sample of fifteen hundred
telephone numbers purchased from Nielsen Media Research. The African-American sample is drawn
from an initial list of nine hundred telephone numbers of households in Wisconsin census tracts whose
population is 30 percent African-American. All nine hundred numbers were called, and only those
respondents who identified themselves as African-American (n=225) were interviewed.
The data are from Computer Assisted Telephone Interviews conducted by the investigators.
Each interview lasted an average of fifteen minutes.
Before analyzing the data, the investigators present information on a number of important
items. How frequently did Wisconsin residents play lottery games in 1990? How much did lottery
players spend per month? What percentage of their income did they spend? Which of the four
games--Scratch-Off, Pull-Tab, SuperCash!, or Megabucks--were the most popular? In addition, we

2
learn about the attitudes Wisconsin residents have toward lottery games and how well they understand
how the lotteries work.
The analysis consists of cross-tabulations and a logistic regression. The cross-tabulations,
which make·up the· brunt of the report, allow one to see the interrelationship between two or more
variables. For example, what percentage of whites and African-Americans play lottery games? Or,
who spends more per month on lotteries, those younger than fifty or those older than fifty? The
investigators use cross-tabulations to illustrate the relationship among demographic characteristics
(e.g., age, education, income), attitudes toward lotteries, how frequently residents play lottery games,
and how much they spend on them.
Cross-tabulations, however, cannot let us know if the interrelationship between variables is
necessary or incidental. That is, to take one of the examples just mentioned, cross-tabulations cannot
tell us if someone is more disposed to play the lottery because he is white or black; perhaps the white
people in the sample are indeed more likely to play the lottery, but this may be because they have
high incomes, not because they are white. To determine which demographic attributes and what
attitudes toward lotteries actually "cause" one to play the lottery, a logistic regression analysis is
needed. In chapter 6 of this report, the investigators present such an analysis. They simultaneously
analyze the effects of variables such as gender, age, and attitudes toward lotteries on the selected
outcome of interest--in this case, whether or not one plays the lottery.
SUMMARY OF MAJOR FINDINGS
1. The number of state residents who play the lottery has changed little since 1989. As reported
in 1991, about three out of five played it sometime in the prior year.
3
2. Lottery spending is becoming more concentrated among those who spend more. Currently
about 10 percent of the state's populace (16 percent of lottery players) account for nearly 75
percent of all lottery revenue.
3. Scratch-Off and Megabucks are the most widely played lottery games. And heavy-spending
players prefer SuperCash! over Megabucks, but the reverse is true for light-spending players.
4. Attitudes toward the lottery have changed little in the past two years, except that overall
approval of the lottery may be slipping.
5. Few state residents (less than 5 percent) report that lottery play creates personal problems for
them.
6. Residents least likely to play include those who are either extremely poor, aged, either
without high school diplomas or with college degrees, or who do not participate in other
forms of gambling.
7. African-American and white respondents are equally likely to play the lottery, and spend
comparable amounts of their income on it.
8. African-American respondents, relative to whites, report more personal problems associated
with lottery play.
9. Demographic differences exist in who plays the lottery. Men, young people, married people,
high school graduates, and those with some college but no degree are the most likely to play.
The bulk of these differences existed in 1989 and 1991; thus the basic profile of lottery
players in Wisconsin has changed little since 1989.
10. The effects of demographic characteristics upon lottery play is mediated by attitudes.
Specifically, the effects of gender appear to be mediated by participation in other, non-lottery
forms of gambling; the effects of education, by attitudes toward the lottery; and the effects of
age, by both other gambling and attitudes.

CHAPTER 1
mSTORY AND PRIOR RESEARCH
HISTORICAL BACKGROUND!
Enthusiasm for lotteries has waxed and waned throughout our nation's history. As early as
the colonial era all levels of government operated lotteries, and they were supported by well-known
figures such as George Washington and Ben Franklin. These government-run lotteries funded
numerous, worthwhile endeavors including road building and education (Devereux 1980; Rosecrance
1988). But by the nineteenth century the inefficiency of government administration, evidenced by
long delays between ticket purchases and drawings, led state governments to contract with private
parties to operate lotteries. While privatization increased efficiency, it also opened the door to
widespread fraud and corruption in lottery administrations (Asbury 1938). The pilfering of lottery
money continued until 1895, when the federal government outlawed all games involving chance,
consideration, and reward (Devereux 1980; Clotfelter and Cook 1989).
The official return of lotteries in the United States took place in New Hampshire in 1964.
The return represented the culmination of a long-term series of developments involving the
introduction of games of chance at movie theaters, various forms of competition promoted by private
manufacturers, and perhaps most important, the introduction of bingo games by religious and
charitable organizations.
With the reappearance of lotteries, considerable public debate has developed concerning their
moral character and economic value. One position, argued by proponents of lotteries, holds that
legalized gambling brings to government money otherwise spent on other often illegal forms of
gambling (peterson 1951). Furthermore, proponents point out that today's lotteries, being state run,
5
experience minimal corruption, and their revenues fund worthy endeavors such as education and
property tax relief.
Countering this pro-lottery position, opponents contend that legalizing lotteries sends to the
public a mixed message:· why, after all, should a state legalize lotteries, but continue to outlaw other
forms of gambling such as pari-mutuel betting (Clotfelter and Cook 1989; Devereux 1980)?
Opponents also argue that lottery play can create enthusiasm for gambling which can in fact result in
increased illegal gambling (peterson 1951). Finally, some have claimed that should they
disproportionately target the poor and uneducated, lotteries potentially constitute regressive forms of
taxation (Brinner and Clotfelter 1975).
PAST LOTTERY RESEARCH
Given the recent popularity of lotteries, surprisingly few studies have rigorously examined
patterns of lottery participation. The studies conducted prior to 1989 suggest that most Americans,
especially those who lived irt states that offered lotteries, approved of them. However, lottery
approval varied among citizens, with older people, those earning under $5,000, and those without
high school educations expressing the lowest levels of approval (Commission on the Review of the
National Policy toward Gambling 1976).
As for lottery play itself, prior studies have indicated that those who are young (under twenty
four years of age), those who are old (over sixty-five), and men were more likely to play the lottery.
According to some studies, lottery play increased with income (Commission on the Review of the
National Policy toward Gambling 1976). Lottery expenditures, however, appeared to be independent
of income level, with the wealthy and the poor spending about the same on lottery play (Brinner and
Clotfelter 1975). This finding can be and has been interpreted as indicating that lottery play is a form
of regressive taxation. However, the validity of this conclusion depends in part on how individuals
6
regard these expenditures. Specifically, if they view lottery playas "entertainment," the argument is
weakened. Another important finding from some prior studies indicated that lottery play was highly
correlated with non-lottery forms of gambling (Koza 1984). However, the causal direction of this
association was not determined, thus leading to ambiguity as to whether or not lottery play led to
other gambling activities.
In 1989, at the request of the Wisconsin State Lottery Board, Irving Piliavin and Michael
Polakowski of the Institute for Research on Poverty, University of Wisconsin, undertook a study of
lottery play and players based on two samples, one a probability sample drawn in Wisconsin
(n=527), the other a probability sample drawn nationwide (n=733). From their analysis of the
Wisconsin sample, they concluded that in Wisconsin:
1. Most residents approve of the lottery.
2. Most residents have played the lottery at least once.
3. The mean lottery expenditure among players is $10.57, the median is $5.00.
4. Monthly lottery expenditures do not vary across age groups, income groups, race, educational
levels, or marital status.
5. Men spend more on lottery play than do women.
6. Among players, those with higher family incomes, more education, and who are currently
married spend proportionately less of their family incomes on lottery play.
7. Ninety-five percent of state residents who have played the lottery believe that playing the
lottery has no adverse effect upon their household expenses.
8. Approximately one in three residents believe they could create a system to increase the odds
of winning the lottery.
9. Sixty percent of residents underestimate the percentage of money spent on the lottery that is
returned as winnings.
7
In addition, based on national sample data, Piliavin and Polakowski made the following
predictions: that over time more males in Wisconsin would play the lottery; lottery spending would
become more concentrated among those who spend the most, meaning that the bulk of lottery revenue
would come from fewer state residents; approval of the lottery will become less associated with
lottery play; and finally levels of lottery approval should remain the same or increase.
While the 1989 study produced important findings about lottery play in Wisconsin, it had two
shortcomings, both recognized by its authors. First, because the study collected a cross-sectional
sample of Wisconsin households, the resulting data contained very few African-American
respondents--Iess than 6 percent of the whole sample. This substantially curtailed the statistical power
needed for racial comparisons. A second problem resulted from the timing of the survey. The. data
were collected between June 1 and August 6 of 1989, before the Lottery Board introduced two new
games, Megabucks (in August 1989) and SuperCash! (February 1991), which offer high payoffs but
low probabilities of winning. Thus, the 1989 study left unresolved the impact of these games upon
lottery attitudes and playing habits.
The present study overcomes these shortcomings in that it is based in part on a comparatively
large sample of African-American residents in Wisconsin and specifically investigates play in all the
games currently marketed by the state.
Before proceeding further, we offer a review of the four lottery games currently
available--Scratch-Off, Pull-Tab, SuperCash!, and Megabucks. These games vary along several
dimensions, including how they are played, their cost, and their potential payoff.2
Scratch-Off costs one dollar to play and it is offered at over 4,600 sales outlets, making it the
most widely available lottery game. To play, one scratches a latex patch off of a game card to reveal
any prizes won. Its potential jackpot ranges from $1 to $100,000, depending upon the particular
Scratch-Off game. The overall odds of winning any prize are about one in four to one in five.
8
Pull-Tab, similar to Scratch-Off, offers instant prizes, with the player pulling a tab off of a
game card to reveal any prizes won. Unlike Scratch-Off cards, Pull-Tab cards are sold mostly at bars
and organizational fund-raisers, and cost only 50 cents each. The game offers smaller jackpots--from
50 cents to $100--but the odds of winning any prize approximate those of Scratch-Off--about one in
four to one in five.
The remaining games, SuperCash! and Megabucks, entail a player attempting to correctly pick
randomly drawn numbers. For one dollar, the SuperCash! player picks six numbers from 1 to 36,
hoping to match those randomly drawn at the end of each day by the State Lottery Board. Correctly
picking all six wins the player $250,000. Those matching only four or five numbers win smaller
prizes. The odds of winning any prize with SuperCash! are estimated to be about 1 in 150.
Megabucks resembles SuperCash! in its basic structure and cost, but with one major
difference: Megabucks players pick from a much wider range of six numbers from 1 to 54. Each
Saturday and Wednesday night, the Multi-State Lottery Association, an organization which operates
Megabucks for fifteen states and Washington, D.C., randomly selects six winning numbers and pays a
jackpot to any individual who successfully picks all six. Should multiple players win, the jackpot is
split. If no one matches all six numbers, the jackpot rolls over to the next drawing. Megabucks pays
jackpots up to many millions of dollars. As with SuperCash!, players matching four or five numbers
win smaller prizes. The odds of winning any prize are about 1 in 750.
The remainder of this report is organized in the following manner. In chapter 2 we describe
the sampling and interview procedures we employed in this survey as well as provide descriptive
information on our respondents. In chapter 3 we examine changes since 1989 in the playing habits
and attitudes of Wisconsin residents toward the lottery. In chapter 4, we use bivariate analysis to
explore which factors are associated with lottery participation, lottery expenditures, and lottery-related
attitudes among Wisconsin residents. In chapter 5, we compare the African-American and white

9
respondents in terms of their lottery play, knowledge, and attitudes. Finally, in chapter 6, we use
multivariate analysis to investigate which demographic characteristics and attitudes best predict the
likelihood of playing the lottery.
CHAPTER 2
SAMPLE COLLECTION, ANALYSIS, AND DESCRIPTION
The data on which our analysis is based were collected during the fall of 1991 by the Letters
and Science Survey Research Center of the University of Wisconsin. The Survey Research Center, a
unit of the College of Letters and Science and supported by the College and the Graduate School,
surveyed a total of 767 Wisconsin residents. In this chapter, we review the sampling techniques used
to select and interview these respondents,3 and we describe the resulting sample.
SELECTING RESPONDENTS
The samples we employ in this survey are based on two lists of Wisconsin telephone
numbers, one representing a random, statewide sample, and the other, households in minority-dense
areas of the state.
The statewide, cross-sectional sample of fifteen hundred phone numbers was obtained from
Nielsen Media Research. This sample comes from a list of potentially working residential telephone
numbers in Wisconsin, including both listed and unlisted numbers. Nielsen updates this master list
three times a year. Though experts estimate that approximately 93 to 95 percent of U.S. households
have telephones, we do not know the proportion of such households in Wisconsin.
A second sample, comprised of African-Americans, was drawn from an initial list of nine
hundred telephone numbers in Wisconsin purchased from Survey Sampling Incorporated (SSI). Using
1980 U.S. Census data, SSI has identified census tracts where the density of African-American
households is found to be 30 percent or higher, and it uses these tracts as a sampling frame for its
Targeted African-American Sample. The nine hundred numbers purchased come from this Targeted
African-American Sample, and only the African-American households from the list were interviewed.
11
Because SSI bases its Targeted African-American Sample on census tracts, those
African-Americans living in rural, untracted areas of Wisconsin will not be represented in the sample.
Furthermore, since the sampling methodology identifies those areas in Wisconsin where African
American households tend to be clustered, African-Americans living in predominately
non-African-American neighborhoods will also be excluded.
In addition, certain African-American households (those with lower incomes and less
education, in particular) have been determined to be less likely to have listed telephone numbers than
the population as a whole. Because only households with listed telephones were included in the
sampling frame, we have an underrepresentation, probably small, of African-American households
with lower incomes and less education.
For the statewide sample, the Survey Research Center called each of the fifteen hundred
numbers provided by the Nielsen Organization. Interviews were initiated in all instances in which a
call resulted in contact with a household where at least one adult was present. If more than one adult
was present at the time of the call, each was identified and the individual interviewed was selected by
random sampling procedures. If a call did not result in a contact after eight attempts, the number was
dropped from the sample pool. Efforts to make contact took place at various times: aftemQons,
evenings, and weekends. The random sampling procedures netted a sample whose composition
resembles that of Wisconsin as a whole; thus, most members of the statewide sample are white and
only a few are African-American.
The selection procedures for the African-American sample were the same as those for the
statewide sample, with the exception that households were screened to determine the race of the
selected respondent. The interview continued only if the respondent identified him or herself as
African-American.
12
THE INTERVIEWING PROCEDURE
The interview was conducted using a Computer Assisted Telephone Interview (CAT!) system,
in which the text of all questions appear on the screen for the interviewer to read. The computer
routes the interview, based on previously programmed logical skip patterns. This system has several
advantages, including allowance for both precoded and open-ended questions, automated screening of
only valid responses, maintenance in memory of all sample telephone numbers, automatic routing of
no-answers to the proper directory for next attempts, and maintenance of an elaborate set of
management records. Interview length averaged fifteen minutes.
RESPONSE RATES
Response rates are provided below for the entire sample; the random, statewide sample; and
the African-American sample.
The Entire Sample
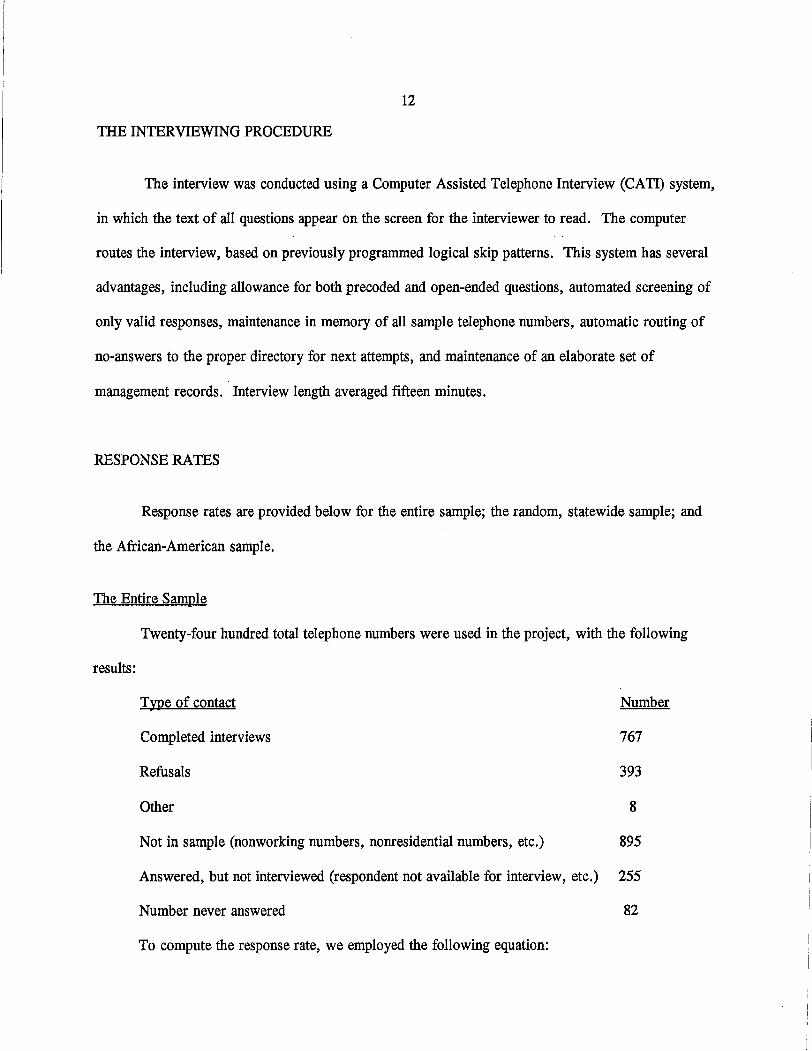
Twenty-four hundred total telephone numbers were used in the project, with the following
results:
Type of contact Number
Completed interviews 767
Refusals 393
Other 8
Not in sample (nonworking numbers, nonresidential numbers, etc.) 895
Answered, but not interviewed (respondent not available for interview, etc.) 255
Number never answered 82
To compute the response rate, we employed the following equation:
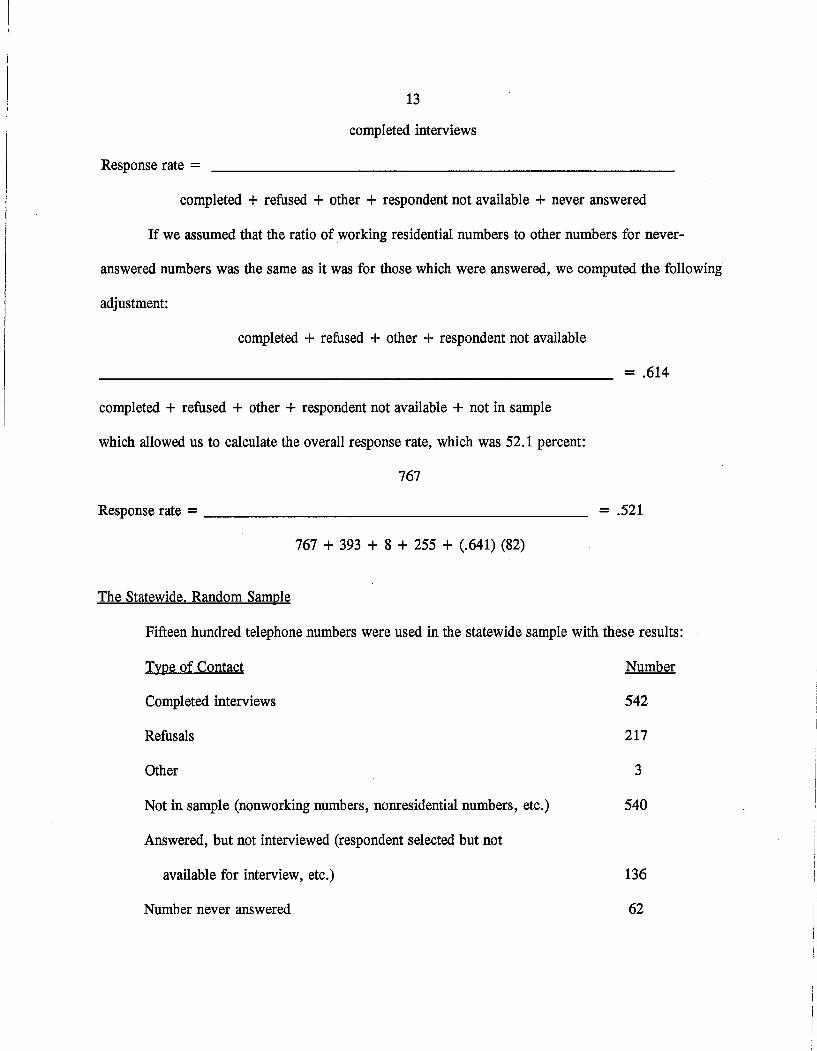
13
completed interviews
Response rate =
completed + refused + other + respondent not available + never answered
If we assumed that the ratio of working residential numbers to other numbers for never
answered numbers was the same as it was for those which were answered, we computed the following
adjustment:
completed + refused + other + respondent not available
= .614
completed + refused + other + respondent not available + not in sample
which allowed us to calculate the overall response rate, which was 52.1 percent:
767
Response rate = _
767 + 393 + 8 + 255 + (.641) (82)
= .521
The Statewide. Random Sample
Fifteen hundred telephone numbers were used in the statewide sample·with these results:
Type of Contact Number
Completed interviews 542
Refusals 217
OO~ 3
Not in sample (nonworking numbers, nonresidential numbers, etc.) 540
Answered, but not interviewed (respondent selected but not
available for interview, etc.) 136
Number never answered 62
14
Making the same assumptions and adjustments as above, we calculated that the response rate for the
statewide sample was 57.8 percent:
542
Response rate = -'-- = .578
542 + 217 + 3 + 136 + (.624) (62)
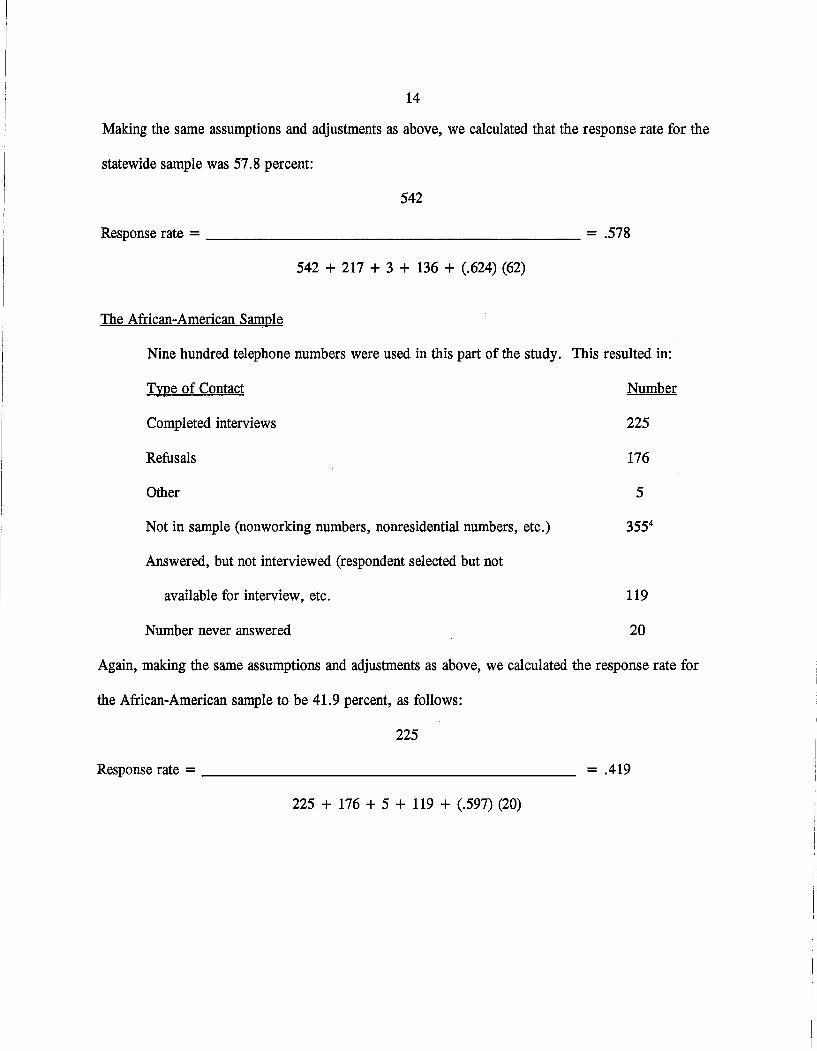
The African-American Sample
Nine hundred telephone numbers were used in this part of the study. This resulted in:
Txpe of Contact Number
Completed interviews 225
Refusals 176
~& 5
Not in sample (nonworking numbers, nonresidential numbers, etc.)
Answered, but not interviewed (respondent selected but not
available for interview, etc.
Number never answered
119
20
Again, making the same assumptions and adjustments as above, we calculated the response rate for
the African-American sample to be 41.9 percent, as follows:
225
Response rate = _
225 + 176 + 5 + 119 + (.597) (20)
= .419

15
DESCRIPTION OF THE SAMPLE
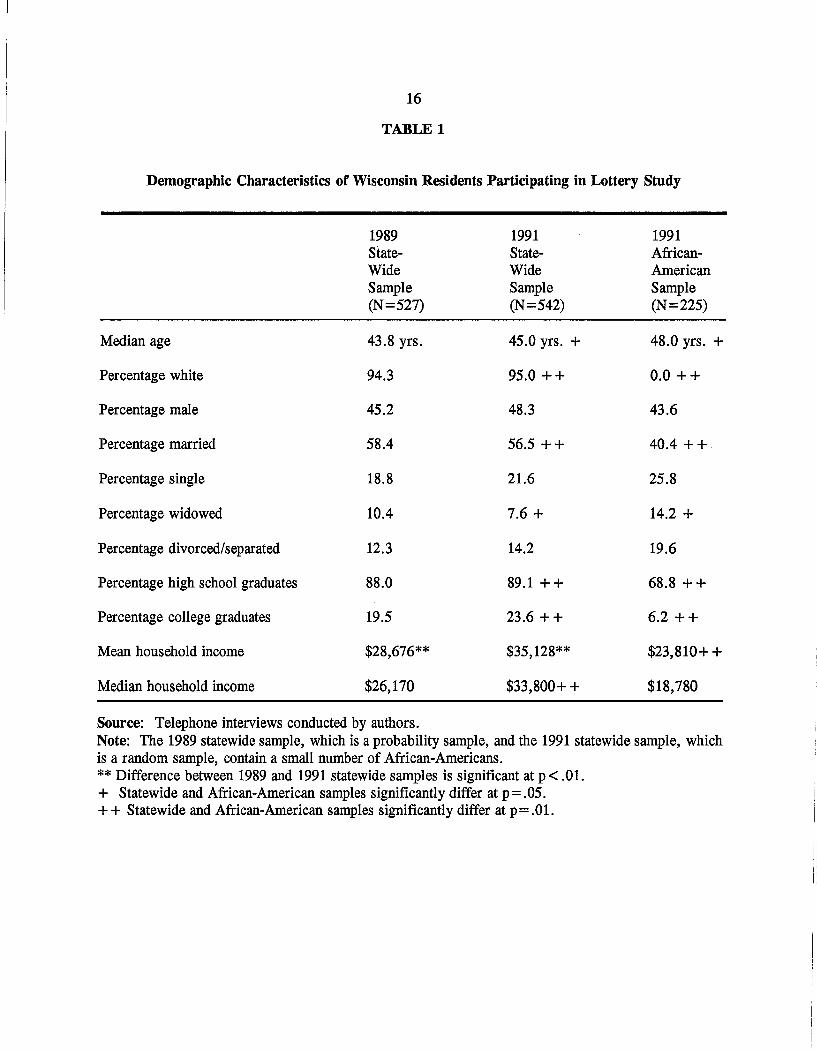
In Table 1, we describe the respondents interviewed in this survey. For the reader's
convenience, we also reprint a description of the 1989 study respondents. As shown, the 1991
statewide, random sample closely resembles that collected in 1989, for the average respondent is
white, middle-aged, female, married, and a high school, but not college, graduate. Respondents in
the 1991 survey reported significantly more family income than did the 1989 respondents ($35,128
vs. $28,676),5 an 18 percent increase that can only in part be accounted for by inflation. A
contributing factor to this increase might be the higher percentage of college graduates in the 1991
sample relative to the 1989 sample (23.6 percent vs. 19.5 percent).
Overall, the 1991 statewide sample resembles the state population. According to the 1990
census, the Wisconsin population was 49 percent male and 92 percent white, and the average age of
adults was 44.7 years (Department of Commerce 1991). These census figures correspond to those of
the 1991 statewide sample. Thus we believe our statewide sample represents adequately the
population of adults in Wisconsin.
Members of the African-American sample differ significantly6 from members of the statewide
sample on several characteristics. The former respondents on average are older (48 years vs. 45) and
are less likely to be married (40.4 percent vs. 56.5 percent respectively), but are more likely to be
widowed (14.2 percent vs. 7.6 percent). Additionally, the African-American respondents average
lower levels of education and have smaller average annual incomes.
Though the demographic differences between African-American and statewide, random
sample members were not unexpected, they did pose a potential problem in making racial
comparisons. That is, in making simple racial comparisons, we compared individuals who differed
not only by race, but who also possibly differed by education, income, and marital status.
African-American and white respondents differed in yet another regard, namely that most of the
16
TABLE 1
Demographic Characteristics of Wisconsin Residents Participating in Lottery Study
1989 1991 1991State- State- African-Wide Wide AmericanSample Sample Sample(N= 527) (N= 542) (N=225)
Median age 43.8 yrs. 45.0 yrs. + 48.0 yrs. +
Percentage white 94.3 95.0 ++ 0.0 ++
Percentage male 45.2 48.3 43.6
Percentage married 58.4 56.5 ++ 40.4 + +
Percentage single 18.8 21.6 25.8
Percentage widowed 10.4 7.6 + 14.2 +
Percentage divorced/separated 12.3 14.2 19.6
Percentage high school graduates 88.0 89.1 ++ 68.8 ++
Percentage college graduates 19.5 23.6 ++ 6.2 ++
Mean household income $28,676** $35,128** $23,810+ +
Median household income $26,170 $33,800+ + $18,780
Source: Telephone interviews conducted by authors.Note: The 1989 statewide sample, which is a probability sample, and the 1991 statewide sample, whichis a random sample, contain a small number of African-Americans.** Difference between 1989 and 1991 statewide samples is significant at p < .01.+ Statewide and African-American samples significantly differ at p= .05.+ + Statewide and African-American samples significantly differ at p= .01.
17
African-American sample members were from urban areas only whereas the white members of the
statewide sample were from urban and rural areas. These considerations must be kept in mind
throughout our presentation, and in chapter 6 we provide an analysis that specifically deals with these
concerns.
ANALYSIS OF THE DATA
To analyze the data contained in both the statewide and African-American samples, we
utilized two statistical techniques: cross-tabulation and logistic regression. Cross-tabulation compares
sample-member attitudes on one variable by the attributes of a second variable. For example, one
might calculate the average dollars spent on lottery play (the first variable) by gender (the second
variable). The difference in spending between men and women can be then tested for significance.
All cross-tabulations were performed using the SPSSX computer program (SPSS Inc. 1988).
Simple cross-tabulation has several advantages, including straightforward analysis and easily
interpretable results. Unfortunately this approach does not analyze more than two variables at a time,
which allows for the possibility of spurious correlation, that is, correlation that does not reflect a
causal connection. We will discuss this problem in more depth in chapter 6, and at that point we
review logistic regression, a technique for analyzing the effects of numerous variables that reduces the
possibility of spurious correlation.
CHAPrER3
WTTERY PLAY AND ATTITUDES IN 1989 AND 1991
In this chapter, we investigate the lottery-playing habits and attitudes of Wisconsin residents,
and we compare our results with those found by the Piliavin and Polakowski (1990) study.7
FREQUENCY OF LOTTERY PLAY
Table 2 contains lottery-play data as provided by members of the 1991 statewide sample. A
majority of the sample (61 percent) reported playing the lottery at least once in the prior year, but a
large percentage of those who played (47.2 percent, or 29.0 percent of the sample) claimed that they
played less than once a month. Only a very small proportion of the players, 7.9 percent (4.3 percent
of the sample) played the lottery once a week or more.
In comparing the prevalence of lottery players in the current sample with that of 1989, we
find little change. In 1989, 58 percent of survey respondents reported lottery play, a percentage not
significantly different than the 61 percent of the 1991 sample. However, the reported frequency of
play has decreased substantially over time. In the 1989 study, 18 percent of the respondents (31
percent of the players) reported playing the lottery at least once a week, more than four times the
percentage of once-a-week players in 1991. On the other hand, only 22.4 percent of the 1989 sample
(39 percent of the players) reported they played less than once a month.
DOLLARS SPENT ON THE LOTTERY
Despite the apparent decrease since 1989 in the frequency of lottery play among Wisconsin
residents, there is some evidence of an increase in money expended on lottery play. In the 1991
statewide sample, lottery players wagered, on average, $14.27 a month on the lottery--about 50 cents

19
TABLE 2
Overall Lottery Play and Expenditures of Wisconsin Residents in 1989 and 1991
Frequency of Lottery Play Last YearLottery play once a week or mqreLottery play once a month or moreLottery play less than once a monthDid not play
Player's Monthly Expenditure on LotteryMeanMedian
$0 to $4 per month$4 to $30 per month$31 to $99 per month$100 or more per month
1989 StateWide Sample
18.0% {95) **.17.6% (93)22.4% (118)41.9% (221)
$10.50 (306)$5.00 (306)
37.9% (116)59.2% (181)1.3% (4)1.6% (5)
1991 StateWide Sample
4}% (23) **28.1 % (150)29.0% (155)38.6% (206)
$14.27 (311)$2.50 (311)
58.2% (181)28.6% (89)11.3% (35)1.9% (6)
Player's Percentage of Total Family Income Spent on LotteryMean .65% (288)Median .24% (288)
.67% (284)
.12% (284)
0.0% to .10%.11 % to 1.00%1.01 % to 4.99%5.00% or more
28.5% (82)56.3% (162)13.2% (38)2.1 % (6)
47.22% (134)38.4% (109)12.0% (34)2.5% (7)
Source: Telephone interviews conducted by authors.Note: Number of sample members answering question/giving an answer is in parentheses; not all samplemembers responded to all questions.** Difference between 1989 and 1991 is significant at p < .01.
20
a day. This compares to the average expenditure among players in the 1989 sample of $10.50 per
month. Assuming that in fact the mean level of lottery spending has increased, it is a surprise that
the median spending level has actually decreased, from the 1989 level of $5.00 to the 1991 median of
$2.50. 8
That mean expenditures increased as the median expenditure decreased suggests that the
distribution of lottery spending changed from 1989 to 1991. That is, while many state lottery players
may have reduced their spending level, which would lower the median amount spent, a minority of
players may have increased their lottery spending enough to raise the overall mean spending level. In
Table 2, we offer data that indicate that this change may have actually occurred. In the 1989 sample,
about one-third of the players (37.9 percent) wagered less than one dollar a week, but in 1991 nearly
two-thirds of the players (58.2 percent) spent this little. This shift accounts for the observed decrease
in median spending level. In 1989, few players (2.9 percent) wagered a dollar a day or more, but in
1991, a full 13.2 percent of the lottery players spent this much. This increase in the percentage of
players who spent heavily was sufficient to increase the overall mean amount spent.
In effect, then, a small proportion of state residents accounts for the bulk of state lottery
revenue. Ten percent of the 1989 sample members (17 percent of the players) accounted for 61
percent of the total amount spent on the lottery by the sample in 1989.9 Lottery spending has since
concentrated even more. Ten percent of the 1991 sample (16 percent of the players) accounted for 75
percent of the amount the sample spent on lottery play. 10 To express this concentration in terms of
the Wisconsin populace, approximately 360,000 Wisconsin adults (10 percent of the estimated 3.6
million adults in Wisconsin [Department of Commerce 1991]) spent about 294 million (75 percent) of
the total 392 million dollars collected last year in lottery revenue.
21
PERCENTAGE OF INCOME SPENT ON LOTTERY PLAY
We now examine lottery expenditures as a percentage of total family income. As summarized
in Table 2, the lottery players in the 1989 and 1991 samples spent small percentages of their incomes
on lottery play, on average less than 1 percent.
The changes since 1989 in the percentage of income wagered somewhat mirror the changes
observed above with dollars spent. Though the mean percentage of income wagered has remained
stable, .65 to .67 percent, the median percentage has decreased substantially, from .24 to .12 percent
of family income. Accordingly, it appears that while many of the lottery players in 1991 spent less of
their income on the lottery than did players in 1989, some spent considerably more, allowing the
mean percentage to remain stable while the median percentage dropped.
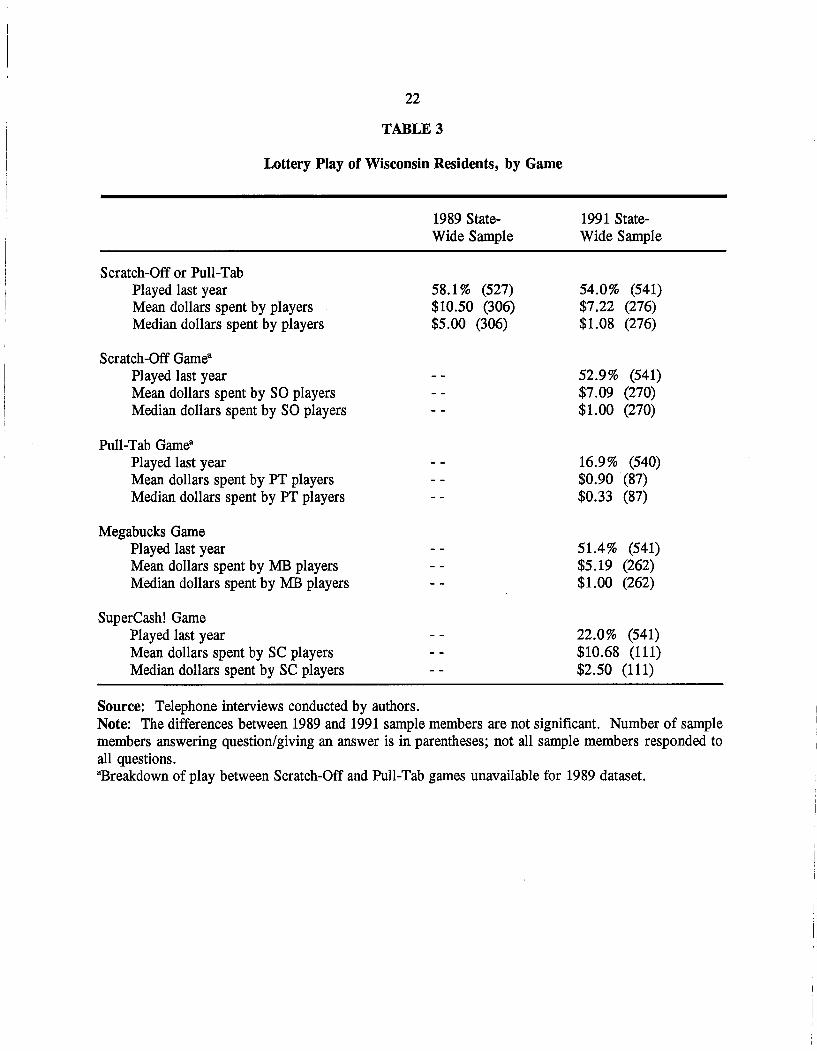
VARIATION BETWEEN LOTTERY GAMES
In the preceding sections we analyzed patterns of lottery play without differentiating between
specific lottery games. However, four distinct lottery games are currently available in
Wisconsin--Scratch-Off, Pull-Tab, Megabucks, and SuperCash!. The possibility exists that lottery
participation and expenditures vary by game type. We explored this possibility, and our findings are
presented in Table 3.
When the 1989 sample was collected only Scratch-Off and Pull-Tab were available. At that
time, 58.1 percent of the respondents played one of these two games. In 1991, 54 percent of the
respondents played either Scratch-Off or Pull-Tab. The difference is not statistically significant. In
1989, players of these games wagered an average of $10.50 per month. In 1991 the players' average
wager dipped to $7.22 a month. From 1989 to 1991, the median amount spent on these two games
substantially dropped, from $5.00 to $1.08.
22
TABLE 3
Lottery Play of Wisconsin Residents, by Game
Scratch-Off or Pull-TabPlayed last yearMean dollars spent by playersMedian dollars spent by players
Scratch-Off Gamea
Played last yearMean dollars spent by SO playersMedian dollars spent by SO players
Pull-Tab Gamea
Played last yearMean dollars spent by PT playersMedian dollars spent by PT players
Megabucks GamePlayed last yearMean dollars spent by MB playersMedian dollars spent by MB players
SuperCash! GamePlayed last yearMean dollars spent by SC playersMedian dollars spent by SC players
1989 StateWide Sample
58.1 % (527)$10.50 (306)$5.00 (306)
1991 StateWide Sample
54.0% (541)$7.22 (276)$1.08 (276)
52.9% (541)$7.09 (270)$1.00 (270)
16.9% (540)$0.90 ·(87)$0.33 (87)
51.4% (541)$5.19 (262)$1.00 (262)
22.0% (541)$10.68 (111)$2.50 (111)
Source: Telephone interviews conducted by authors.Note: The differences between 1989 and 1991 sample members are not significant. Number of samplemembers answering question/giving an answer is in parentheses; not all sample members responded toall questions.aBreakdown of play between Scratch-Off and Pull-Tab games unavailable for 1989 dataset.

23
As seen in Table 3, in 1991 Scratch-Off and Megabucks were the two most widely played
games, with 52.9 percent and 51.4 percent of the statewide sample playing each game, respectively.
Pull-Tab and SuperCash! attracted fewer players, with only 16.9 percent of the sample playing the
former and 22.0 percent playing the latter. In terms of lottery expenditures, however, a different
ranking em~rges. SuperCash! players spent the most money, averaging $10.68 on this game a month.
Scratch-Off players spent a somewhat smaller amount on their game, averaging $7.09. Megabucks
players spent even less, averaging $5.19, and finally Pull-Tab players spent the least on their game,
averaging just 90 cents a month.
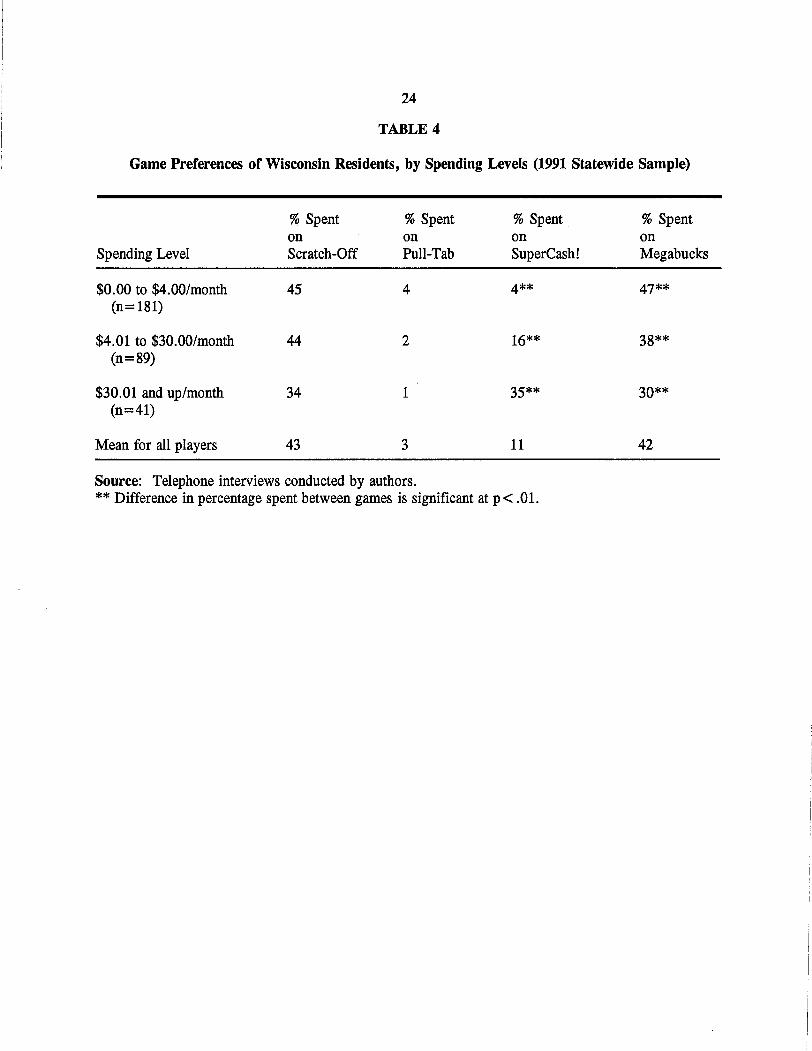
GAME SELECTION AS A FUNCTION OF MONEY SPENT
The above investigation of the separate lottery games suggests that game selection may vary
by spending habits. To test this possibility, we divided the lottery-playing respondents into three
groups, those spending large amounts (more than $30 a month), moderate amounts ($4 to $30), and
small amounts (less than $4 a month). Then, for each group, we calculated what portion of their total
lottery expenditure was spent on each of the four lottery games.
As indicated in Table 4, the three spending groups did not significantly differ in the
proportion of their money allocated to Scratch-Off and Pull-Tab games. However, they did differ
significantly in their expenditures on Megabucks and SuperCashL Small-expenditure players wagered
very little of their money on SuperCash! (4 percent). In contrast, large-expenditure players preferred
SuperCash!, spending more of their money on it (35 percent) than on any other game. Small
expenditure players appear to prefer playing Megabucks, spending almost half of their lottery funds
(47 percent) on it. In contrast, large-expenditure players bet less than a third of their lottery funds
(30 percent) on Megabucks.
24
TABLE 4
Game Preferences of Wisconsin Residents, by Spending Levels (1991 Statewide Sample)
%Spent % Spent % Spenton on on
Spending Level Scratch-Off Pull-Tab SuperCash!
$0.00 to $4.00/month 45 4 4**(n=181)
$4.01 to $30.00/month 44 2 16**(n=89)
$30.01 and up/month 34 1 35**(n=41)
Mean for all players 43 3 11
Source: Telephone interviews conducted by authors.** Difference in percentage spent between games is significant at p < .01.
% SpentonMegabucks
47**
38**
30**
42

25
ATTITUDES TOWARD THE LOTTERY
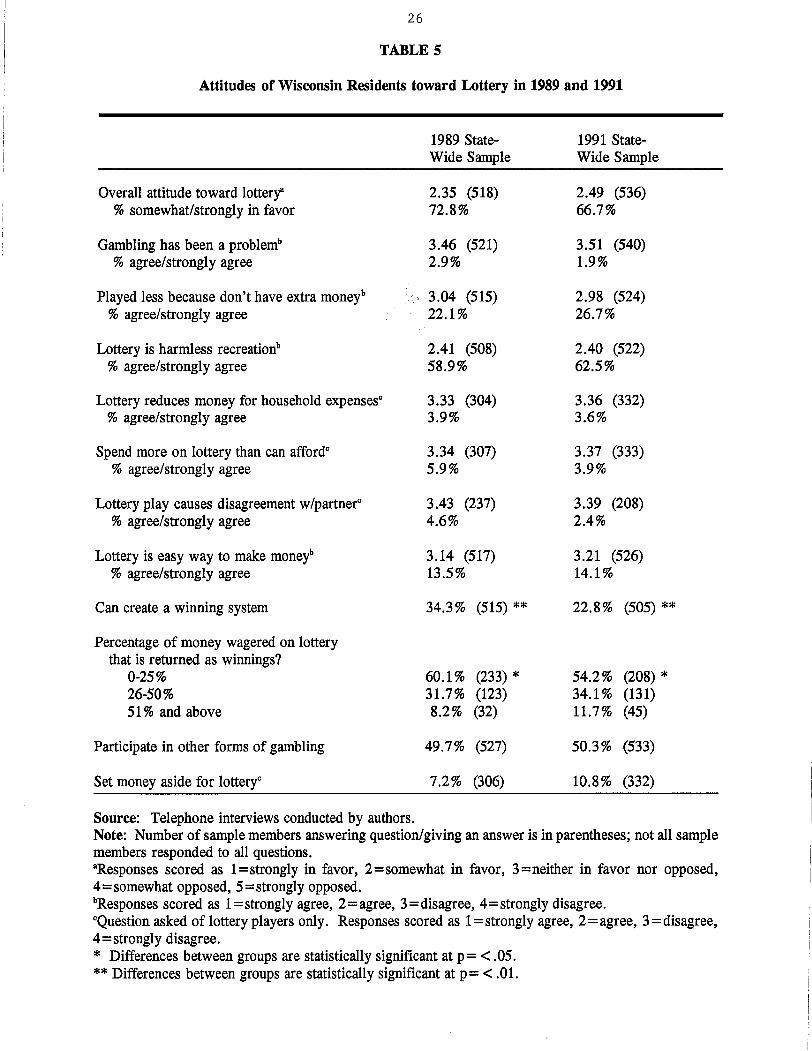
We now examine Wisconsin residents' knowledge about and attitudes toward lotteries. As
seen from the data in Table 5, overall approval of lotteries appears to have marginally slipped
somewhat between 1989 and 1991. While close to three-quarters of the 1989 sample either somewhat
or strongly approved of lotteries, this was true of but two-thirds of the 1991 sample. Additionally,
the 1991 sample members appear to have a better understanding than 1989 sample members of lottery
"systems." While 34 percent of the 1989 sample members believed systems could be developed to
beat lotteries, only 23 percent expressed this belief in 1991. Knowledge concerning lottery payoffs
also changed between 1989 and 1991, but only modestly. Though 60 percent of the 1989 sample
members believed that returns to players of monies wagered on lotteries was less than 25 percent (the
actual rate is a little over 50 percent), this was the case for 55 percent of the 1991 sample.
Aside from the preceding changes, Wisconsin residents were remarkably stable between 1989
and 1991 in their opinions about lottery play. Almost 59 percent of the 1989 respondents and 62.5
percent of the 1991 agreed that lottery play is harmless recreation. Over 13 percent of the 1989 and
14.1 percent of the 1991 respondents agreed that the lottery is an easy way to make money. And
22.1 percent of the 1989 and 26.7 percent of the 1991 respondents agreed that they played less due to
not having extra money.
Finally, few respondents in 1989 or 1991 expressed the belief that lottery play or gambling in
general causes personal problems. To illustrate, 98 percent of 1991 respondents thought gambling
was not a problem for them, 96 percent believed that lottery play had no effect on their household
expenses, 97 percent believed lottery play caused no disagreements with partners, and 96 percent
thought they could afford lottery play. In comparing these attitudes with those expressed in 1989, we
find no significant change. Seemingly, continued exposure to the state lottery has not engendered
more self-reported gambling problems for Wisconsin residents.
26
TABLE 5
Attitudes of Wisconsin Residents toward Lottery in 1989 and 1991
Overall attitude toward lottery"% somewhat/strongly in favor
Gambling has been a problemb
% agree/strongly agree
Played less because don't have extra moneyb% agree/strongly agree
Lottery is harmless recreationb
% agree/strongly agree
Lottery reduces money for household expensesc
% agree/strongly agree
Spend more on lottery than can affordc
% agree/strongly agree
Lottery play causes disagreement w/partnerc
% agree/strongly agree
Lottery is easy way to make moneyb% agree/strongly agree
Can create a winning system
Percentage of money wagered on lotterythat is returned as winnings?
0-25%26-50%51 % and above
Participate in other forms of gambling
Set money aside for lotterye
1989 StateWide Sample
2.35 (518)72.8%
3.46 (521)2.9%
3.04 (515)22.1%
2.41 (508)58.9%
3.33 (304)3.9%
3.34 (307)5.9%
3.43 (237)4.6%
3.14 (517)13.5%
34.3% (515) **
60.1 % (233) *31.7% (123)8.2% (32)
49.7% (527)
7.2% (306)
1991 StateWide Sample
2.49 (536)66.7%
3.51 (540)1.9%
2.98 (524)26.7%
2.40 (522)62.5%
3.36 (332)3.6%
3.37 (333)3.9%
3.39 (208)2.4%
3.21 (526)14.1%
22.8% (505) **
54.2 % (208) *34.1% (131)11.7% (45)
50.3% (533)
10.8% (332)
Source: Telephone interviews conducted by authors.Note: Number of sample members answering question/giving an answer is in parentheses; not all samplemembers responded to all questions.aResponses scored as l=strongly in favor, 2=somewhat in favor, 3=neither in favor nor opposed,4=somewhat opposed, 5 = strongly opposed.bResponses scored as 1= strongly agree, 2=agree, 3=disagree, 4=strongly disagree.cQuestion asked of lottery players only. Responses scored as 1= strongly agree, 2=agree, 3=disagree,4=strongly disagree.* Differences between groups are statistically significant at p= < .05.** Differences between groups are statistically significant at p= < .01.
CHAPrER4
DEMOGRAPIDC AND ATTITUDINAL CORRELATES OF LOTTERY PLAY,
EXPENDITURES, AND WTTERY-RELEVANT ATTITUDES
In their analysis of lottery play among Wisconsin residents, Piliavin and Polakowski (1990)
tested correlations between a variety of personal attributes, attitudes, and playing habits. Their
investigation yielded a number of significant correlates of both lottery play and attitudes. To measure
the extent to which these correlations have changed in the past two years, we replicated their bivariate
analysis using 1991 data. We present our findings in Tables 6 through 15, with the first column of
each table summarizing the 1989 findings, and the second column presenting the 1991 findings.
DEMOGRAPHIC CORRELATES OF LOTTERY PLAY
As we noted earlier, we investigated the association between personal attributes and having
played the lottery, utilizing bivariate analysis. The first association we tested regarded income. The
1989 study found that the likelihood of having played the lottery significantly varied by income level,
with the bottom two income groups having the lowest participation rates (see Table 6, panel a). The
participation pattern in the 1991 survey was similar except that only its bottom income group reported
relatively low participation rates.
Turning to marital status, as presented in Table 6, panel b, significantly fewer of the widowed
respondents in 1989 played the lottery (30.9 percent) than did those who were divorced (55.4
percent), married (60.1 percent), or single (68.7 percent). In the 1991 sample, however, we did not
find this pattern: lottery play did not significantly vary by marital status.
Panels c through e in Table 6 present the associations of lottery play with age, education, and
other gambling. As with income, the association between these factors and playing the lottery

28
TABLE 6
Percentage of Wisconsin Residents Who Played the Lotteryin Prior Year, by Demographic Characteristics
1989 Statewide Sample 1991 Statewide SamplePercentage Who Percentage Who
Demographic Characteristic Played Lottery N Played Lottery N
a. Annual family income (pretax)$0-$9,999 45.3* 75 42.5* 56$10,000-$19,999 47.7* 111 69.1* 84$20,000-$29,999 71.3* 94 68.2* 66$30,000-$39,999 61.8* 89 69.3* 75$40,000-$49,999 62.2* 45 75.9* 58$50,000 or more 69.9* 82 62.0* 129
b. Marital statusSingle 68.7* 99 54.7 117Married 60.1* 308 63.1 306Divorced/separated 55.4* 55 68.8 77Widowed 30.9* 65 56.1 41
c. Age18-25 70.8* 65 61.4* 7026-30 80.3* 71 77.6* 5831-35 66.7* 81 62.1* 6636-40 59.4* 64 70.7* 5841-45 62.5* 32 60.3* 5846-50 57.5* 40 73.7* 3851-60 54.7* 53 58.3* 7261-70 44.1* 59 62.5* 5671+ 21.0* 62 37.3* 59
d. EducationLess than high school 38.1* 63 54.2* 59High school graduate 61.2* 134 65.7* 131Some post-high school
education 56.8* 132 64.1* 142College associate arts degree 77.9* 95 71.8* 78College graduate 49.5* 103 53.1* 128
e. Does other gambling?Yes 72.5* 261 72.4* 268No 43.8* 264 50.2* 265
f. GenderMale 58.4 238 65.3 262Female 57.8 289 58.2 280
g. RaceWhite 59.0 496 62.5 514Nonwhite 43.3 29 44.4 27
Source: Telephone interviews conducted by authors.Note: N= number of sample members answering question/giving an answer; not all sample membersresponded to all questions.*Differences across groups within sample are statistically significant at alpha= .05.
29
appears unchanged from 1989 to 1991. In both samples, respondents over fifty years old played less
than those under fifty; high school dropouts and college graduates were less likely to play than those
with medium levels of education; and the respondents reporting other gambling were more likely to
play than non-gamblers.
As regards gender and race, our findings agree with those of 1989. Neither race nor gender
was significantly associated with having played the lottery (see panels f and g).
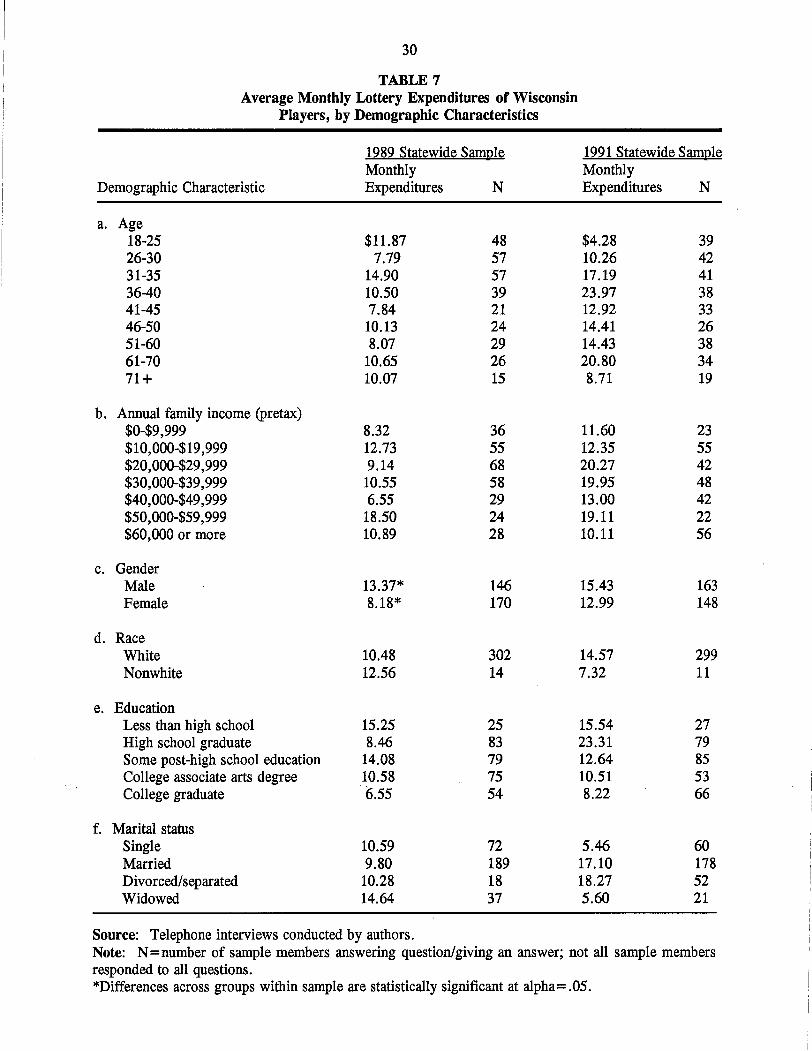
DEMOGRAPHIC CORRELATES OF DOLLARS SPENT PLAYING THE LOTTERY
In examining the associations between demographic attributes and dollars spent on the lottery,
we found that little had changed since 1989. Piliavin and Polakowski (1990) found that neither age,
family income, race, education, nor marital status was significantly associated with how much
players' spent on the lottery. They did, however, find that male lottery players wagered more than
female players, $13.37 vs. $8.18 a month (Table 7, panel c). Data for the 1991 sample largely
reveal similar patterns in that age, family income, race, education, and marital status were again not
significantly associated with lottery expenditures (Table 7, panels a, b, d, and e). In contrast to 1989,
however, we found that gender was no longer significantly correlated with spending levels. As seen
in Table 7, panel c, female lottery players in 1991 wagered nearly as much ($12.99) as did male
players ($15.43).
DEMOGRAPHIC CORRELATES OF THE PERCENTAGE OF INCOME SPENT ON THELOTTERY
As with dollars spent, the relationship between demographic characteristics and the percentage
of income spent changed little between 1989 and 1991. In both years neither age nor race was
significantly correlated with the percentage of income spent (Table 8, panels a and d). On the other
30
TABLE 7Average Monthly Lottery Expenditures of Wisconsin
Players, by Demographic Characteristics
1989 Statewide Sample 1991 Statewide SampleMonthly Monthly
Demographic Characteristic Expenditures N Expenditures N
a. Age18-25 $11.87 48 $4.28 3926-30 7.79 57 10.26 4231-35 14.90 57 17.19 4136-40 10.50 39 23.97 3841-45 7.84 21 12.92 3346-50 10.13 24 14.41 2651-60 8.07 29 14.43 3861-70 10.65 26 20.80 3471+ 10.07 15 8.71 19
b. Annual family income (pretax)$0-$9,999 8.32 36 11.60 23$10,000-$19,999 12.73 55 12.35 55$20,000-$29,999 9.14 68 20.27 42$30,000-$39,999 10.55 58 19.95 48$40,000-$49,999 6.55 29 13.00 42$50,000-$59,999 18.50 24 19.11 22$60,000 or more 10.89 28 10.11 56
c. GenderMale 13.37* 146 15.43 163Female 8.18* 170 12.99 148
d. RaceWhite 10.48 302 14.57 299Nonwhite 12.56 14 7.32 11
e. EducationLess than high school 15.25 25 15.54 27High school graduate 8.46 83 23.31 79Some post-high school education 14.08 79 12.64 85College associate arts degree 10.58 75 10.51 53College graduate 6.55 54 8.22 66
f. Marital statusSingle 10.59 72 5.46 60Married 9.80 189 17.10 178Divorced/separated 10.28 18 18.27 52Widowed 14.64 37 5.60 21
Source: Telephone interviews conducted by authors.Note: N = number of sample members answering question/giving an answer; not all sample membersresponded to all questions.*Differences across groups within sample are statistically significant at alpha= .05.

31
TABLE 8Percentage of Wisconsin Players' Income Spent on Lottery,
by Demographic Characteristics
1989 Statewide Sample 1991 Statewide SamplePercentage of Percentage of
Demographic Characteristic Income N Income N
a. Age18-25 .75 48 .28 3326-30 .40 57 .41 4131-35 .69 57 .66 3736-40 .40 39 1.00 3641-45 .34 21 .40 3146-50 .34 24 .51 2651-60 .42 29 1.15 3361-70 .71 26 1.51 3071+ .91 15 .66 16
b. Annual family income (pretax)$0-$9,999 1.00* . 36 1.90* 19$10,000-$19,999 1.02* 55 1.13* 55$20,000-$29,999 .44* 68 .99* 42$30,000-$39,999 .36* 58 .70* 48$40,000-$49,999 .17* 29 .36* 42$50,000-$59,999 .40* 24 .41* 22$60,000 or more .20* 28 .14* 56
c. GenderMale .68* 146 .74 154Female .43* 170 .71 130
d. RaceWhite .53 302 .70 272Nonwhite .87 14 1.38 11
e. EducationLess than high school· 1'.08* 25 1.18* 23High school graduate .48* 83 1.47* 72Some post-high school education .61* 79 .50* 80College associate arts degree .61* 75 .43* 49College graduate .23* 54 .20* 59
f. Marital statusSingle .62* 72 .21 53Married .39* 189 .72 162Divorced/separated .98* 18 1.16 51Widowed .97* 37 1.07 18
Source: Telephone interviews conducted by authors.Note: N=number of sample members answering question/giving an answer; not all sample membersresponded to all questions.*Differences across groups within sample are statistically significant at alpha= .05.
32
hand, as in 1989, the percentage of income spent on the lottery in 1991 significantly varied by family
income and education. In 1989, lottery players reporting higher family incomes wagered
comparatively less of their· income than those with lower incomes (Table 8, panel b), and respondents
with more education spent comparatively less of their income than those with less education (panel
e). These patterns were found again in 1991.
Two correlates of the percentage of income spent on lottery play have changed since 1989.
Piliavin and Polakowski (1990) found that women devoted less of their family income to lottery play
then did men (Table 8, panel c), and that married respondents wagered less of their income than did
single, divorced, or widowed respondents (Table 8, panel t). In 1991, however, neither gender nor
marital status were significantly associated with the percentage of income spent.
To summarize this chapter so far, demographic characteristics give insight into who plays the
lottery and how much is spent. For the 1989 and 1991 samples, we find that family income, age,
education, and other gambling experience are all significantly related to the likelihood of playing the
lottery. For the 1991 sample, we find no demographic correlates of dollars spent, but levels of
income and education influence the percentage of income spent. Overall, the relationship over time
between demographic characteristics and lottery play appears remarkably stable.
ATTITUDINAL CORRELATES OF LOTTERY PLAY
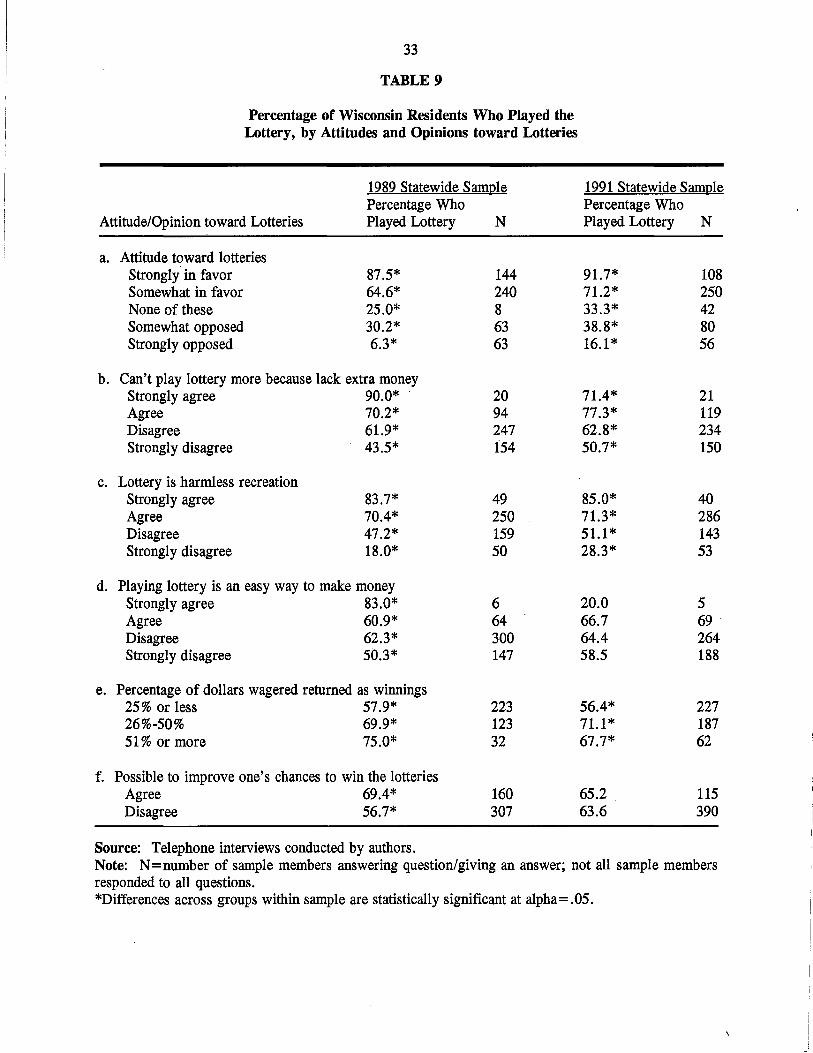
In their investigation of the relationship between attitudes and lottery play, Piliavin and
Polakowski (1990) found six significant correlations. These are found in Table 9. To summarize,
lottery play was found to be positively associated with approval of lotteries, players' belief that they
could not play more due to a lack of funds, their belief that the lottery was a harmless form of
recreation, their view that lottery play was an easy way to make money, and the beliefs that lotteries
33
TABLE 9
Percentage of Wisconsin Residents Who Played theLottery, by Attitudes and Opinions toward Lotteries
1989 Statewide Sample 1991 Statewide SamplePercentage Who Percentage Who
Attitude/Opinion toward Lotteries Played Lottery N Played Lottery N
a. Attitude toward lotteriesStrongly in favor 87.5* 144 91.7* 108Somewhat in favor 64.6* 240 71.2* 250None of these 25.0* 8 33.3* 42Somewhat opposed 30.2* 63 38.8* 80Strongly opposed 6.3* 63 16.1* 56
b. Can't play lottery more because lack extra moneyStrongly agree 90.0* 20 71.4* 21Agree 70.2* 94 77.3* 119Disagree 61.9* 247 62.8* 234Strongly disagree 43.5* 154 50.7* 150
c. Lottery is harmless recreationStrongly agree 83.7* 49 85.0* 40Agree 70.4* 250 71.3* 286Disagree 47.2* 159 51.1* 143Strongly disagree 18.0* 50 28.3* 53
d. Playing lottery is an easy way to make moneyStrongly agree 83.0* 6 20.0 5Agree 60.9* 64 66.7 69 .Disagree 62.3* 300 64.4 264Strongly disagree 50.3* 147 58.5 188
e. Percentage of dollars wagered returned as winnings25% or less 57.9* 223 56.4* 22726%-50% 69.9* 123 71.1* 18751% or more 75.0* 32 67.7* 62
f. Possible to improve one's chances to win the lotteriesAgree 69.4* 160 65.2 115Disagree 56.7* 307 63.6 390
Source: Telephone interviews conducted by authors.Note: N=number of sample members answering question/giving an answer; not all sample membersresponded to all questions.*Differences across groups within sample are statistically significant at alpha= .05.
34
not only offered players comparatively high odds of winning, but that the odds could be improved by
some form of wagering system.
Our 1991 study replicated four of these significant correlations. Three of the four follow
intuition: those more likely to play the lottery include those who favor it, those who consider it a
harmless form of recreation, and those who believe it returns a high percentage of wagers back as
winnings. The fourth correlation appears perverse. As in 1989, a higher percentage of players was
found among people who agreed that they could not play the lottery more because of a lack of funds.
As did Piliavin and Polakowski, we conclude that those likely to play the lottery would play even
more if they had extra money.
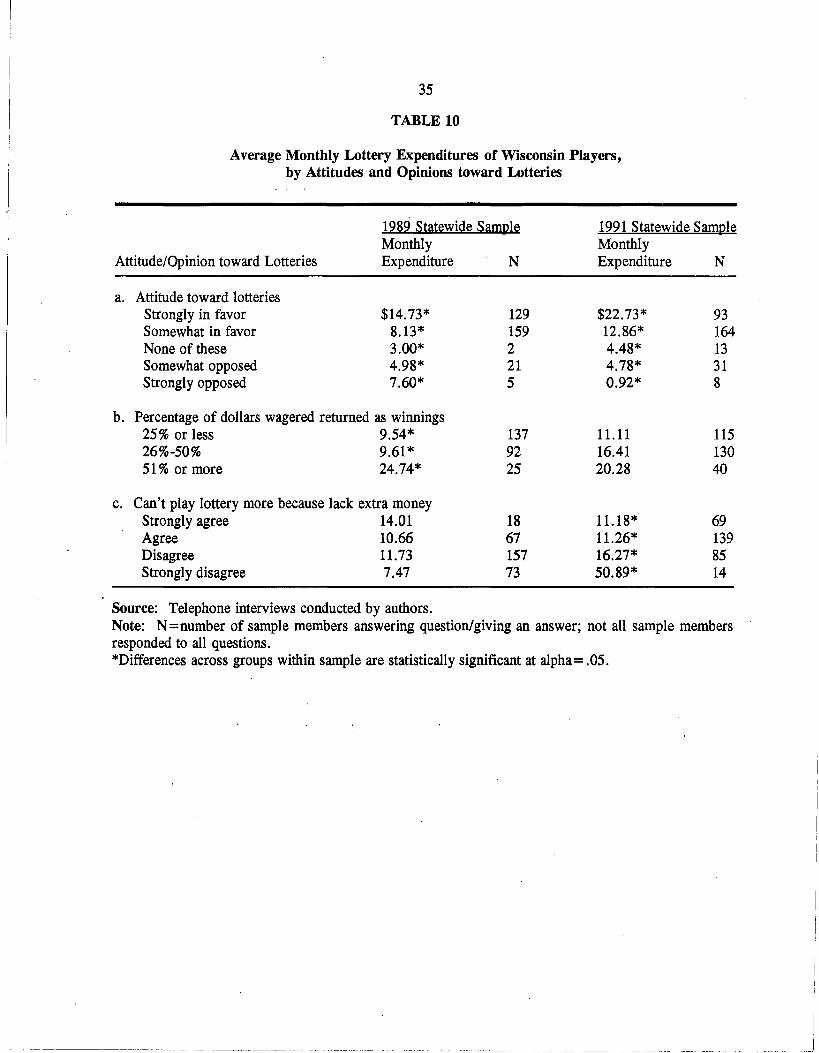
ATTITUDINAL CORRELATES OF DOLLARS SPENT ON LOTTERY PLAY
Piliavin and Polakowski (1990) found only two significant correlations of dollars spent on
lottery play with lottery-relevant attitudes and knowledge: those who favored the lottery spent more
than those who did not, and those who expected higher rates of returned winnings spent more than
those who expected lower returns. In the right-hand columns of Table 10 we present the 1991
results. These indicate again that respondents who favored the lottery spent far more per month than
those opposed. However, we did not find the second relation: respondents expecting large returns
and those expecting small returns were statistically indistinguishable in their spending levels.
Furthermore 1991 lottery players who agreed that a lack of extra money curtailed their lottery play
spent much less on lotteries than those who disagreed. This is in contrast to findings in 1989 when
no relationship was found between lottery play and the perception of financial constraint on lottery
play.
35
TABLE 10
Average Monthly Lottery Expenditures of Wisconsin Players,by Attitudes and Opinions toward Lotteries
1989 Statewide Sample 1991 Statewide SampleMonthly Monthly
Attitude/Opinion toward Lotteries Expenditure N Expenditure N
a. Attitude toward lotteriesStrongly in favor $14.73* 129 $22.73* 93Somewhat in favor 8.13* 159 12.86* 164None of these 3.00* 2 4.48* 13Somewhat opposed 4.98* 21 4.78* 31Strongly opposed 7.60* 5 0.92* 8
b. Percentage of dollars wagered returned as winnings25% or less 9.54* 137 11.11 11526%-50% 9.61* 92 16.41 13051% or more 24.74* 25 20.28 40
c. Can't play lottery more because lack extra moneyStrongly agree 14.01 18 11.18* 69Agree 10.66 67 11.26* 139Disagree 11.73 157 16.27* 85Strongly disagree 7.47 73 50.89* 14
Source: Telephone interviews conducted by authors.Note: N = number of sample members answering question/giving an answer; not all sample membersresponded to all questions.*Differences across groups within sample are statistically significant at alpha= .05.
36
ATTITUDINAL CORRELATES OF THE PERCENTAGE OF INCOME SPENT ON THELOTTERY
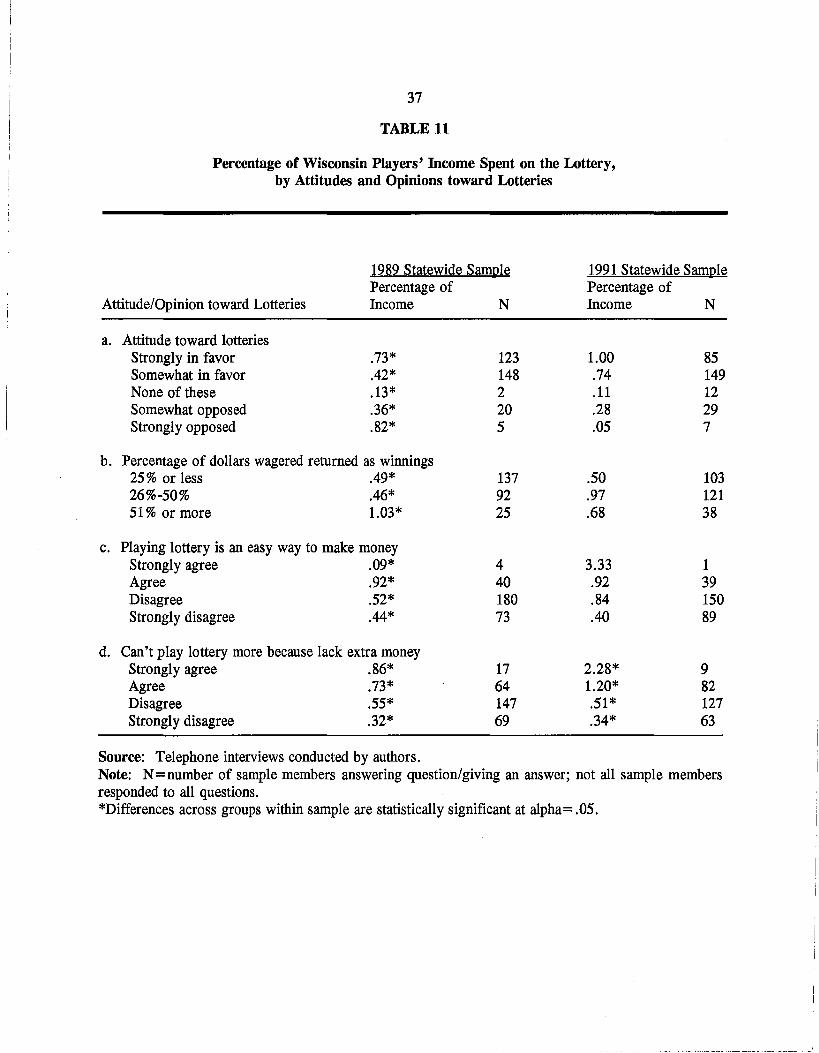
We found substantial differences between 1989 and 1991 sample members regarding the
relationship between lottery-relevant attitudes and the percentage of income spent on lotteries. In the
earlier study, respondents who favored the lottery, expected higher returns, considered it an easy way
to make money, and who believed they had more financial constraints on lottery play spent a greater
proportion of their income on lottery play than did respondents with contrary views. As indicated in
Table 11, we found that in 1991 the first three of these attitudes were no longer significantly
correlated with the percentage of income spent on lottery play. However, as in 1989, those who
agreed that they played less due to a lack of extra money wagered a higher proportion of their income
than those who disagreed.
DEMOGRAPHIC CORRELATES OF ATTITUDES TOWARD THE LOTTERY
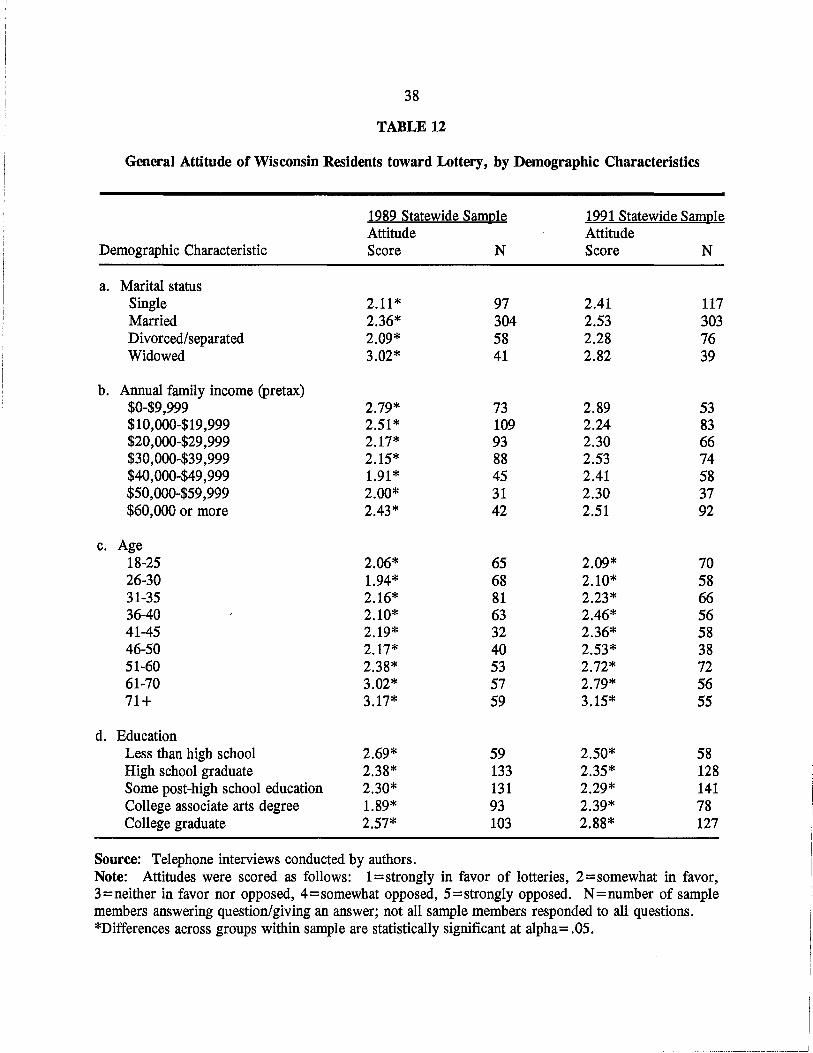
A last set of correlations we examine pertains to those between demographic characteristics
and attitudes toward the lottery.
Lottery Approval
As presented in Table 12, panels a through c, the 1989 study found that respondents who
were widowed, had lower incomes, and were older expressed the most disapproval of lotteries.
Additionally, 1989 respondents who were high school dropouts and college graduates expressed
disapproval of lotteries (Table 12, panel d). Findings from the 1991 survey essentially replicate only
the findings on age and education. Older respondents, high school dropouts, and college graduates
registered the most disapproval. Unlike the 1989 study, however, the 1991 study found no significant
links between either marital status or income and lottery approval.
37
TABLE 11
Percentage of Wisconsin Players' Income Spent on the Lottery,by Attitudes and Opinions toward Lotteries
1989 Statewide Sample 1991 Statewide SamplePercentage of Percentage of
Attitude/Opinion toward Lotteries Income N Income N
a. Attitude toward lotteriesStrongly in favor .73* 123 1.00 85Somewhat in favor .42* 148 .74 149None of these .13* 2 .11 12Somewhat opposed .36* 20 .28 29Strongly opposed .82* 5 .05 7
b. Percentage of dollars wagered returned as winnings25% or less .49* 137 .50 10326%-50% .46* 92 .97 12151% or more 1.03* 25 .68 38
c. Playing lottery is an easy way to make moneyStrongly agree .09* 4 3.33 1Agree .92* 40 .92 39Disagree .52* 180 .84 150Strongly disagree .44* 73 .40 89
d. Can't play lottery more because lack extra moneyStrongly agree .86* 17 2.28* 9Agree .73* 64 1.20* 82Disagree .55* 147 .51* 127Strongly disagree .32* 69 .34* 63
Source: Telephone interviews conducted by authors.Note: N= number of sample members answering question/giving an answer; not all sample membersresponded to all questions.*Differences across groups within sample are statistically significant at alpha= .05.
38
TABLE 12
General Attitude of Wisconsin Residents toward Lottery, by Demographic Characteristics
1989 Statewide Sample 1991 Statewide SampleAttitude Attitude
Demographic Characteristic Score N Score N
a. Marital statusSingle 2.11* 97 2.41 117Married 2.36* 304 2.53 303Divorced/separated 2.09* 58 2.28 76Widowed 3.02* 41 2.82 39
b. Annual family income (pretax)$0-$9,999 2.79* 73 2.89 53$10,000-$19,999 2.51* 109 2.24 83$20,000-$29,999 2.17* 93 2.30 66$30,000-$39,999 2.15* 88 2.53 74$40,000-$49,999 1.91* 45 2.41 58$50,000-$59,999 2.00* 31 2.30 37$60,000 or more 2.43* 42 2.51 92
c. Age18-25 2.06* 65 2.09* 7026-30 1.94* 68 2.10* 5831-35 2.16* 81 2.23* 6636-40 2.10* 63 2.46* 5641-45 2.19* 32 2.36* 5846-50 2.17* 40 2.53* 3851-60 2.38* 53 2.72* 7261-70 3.02* 57 2.79* 5671+ 3.17* 59 3.15* 55
d. EducationLess than high school 2.69* 59 2.50* 58High school graduate 2.38* 133 2.35* 128Some post-high school education 2.30* 131 2.29* 141College associate arts degree 1.89* 93 2.39* 78College graduate 2.57* 103 2.88* 127
Source: Telephone interviews conducted by authors.Note: Attitudes were scored as follows: 1=strongly in favor of lotteries, 2=somewhat in favor,3=neither in favor nor opposed, 4=somewhat opposed, 5=strongly opposed. N=number of samplemembers answering question/giving an answer; not all sample members responded to all questions.*Differences across groups within sample are statistically significant at alpha= .05.
39
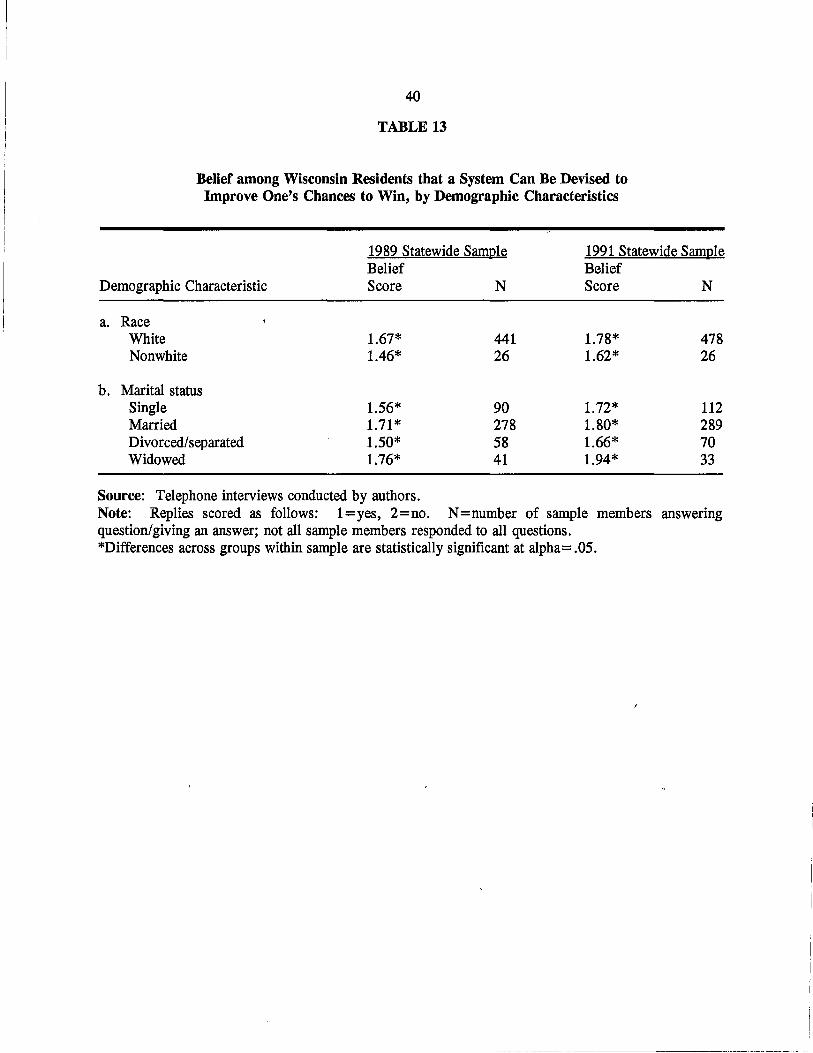
Devising Systems to Improve One's Chances of Winning
Piliavin and Polakowski (1990) found that race and marital status were related to the belief
that systems for beating the lottery could be devised. Specifically they found that sample members
most likely to believe in such systems were nonwhite, single, and divorced. As noted in Table 13,
these findings were replicated in the 1991 survey.
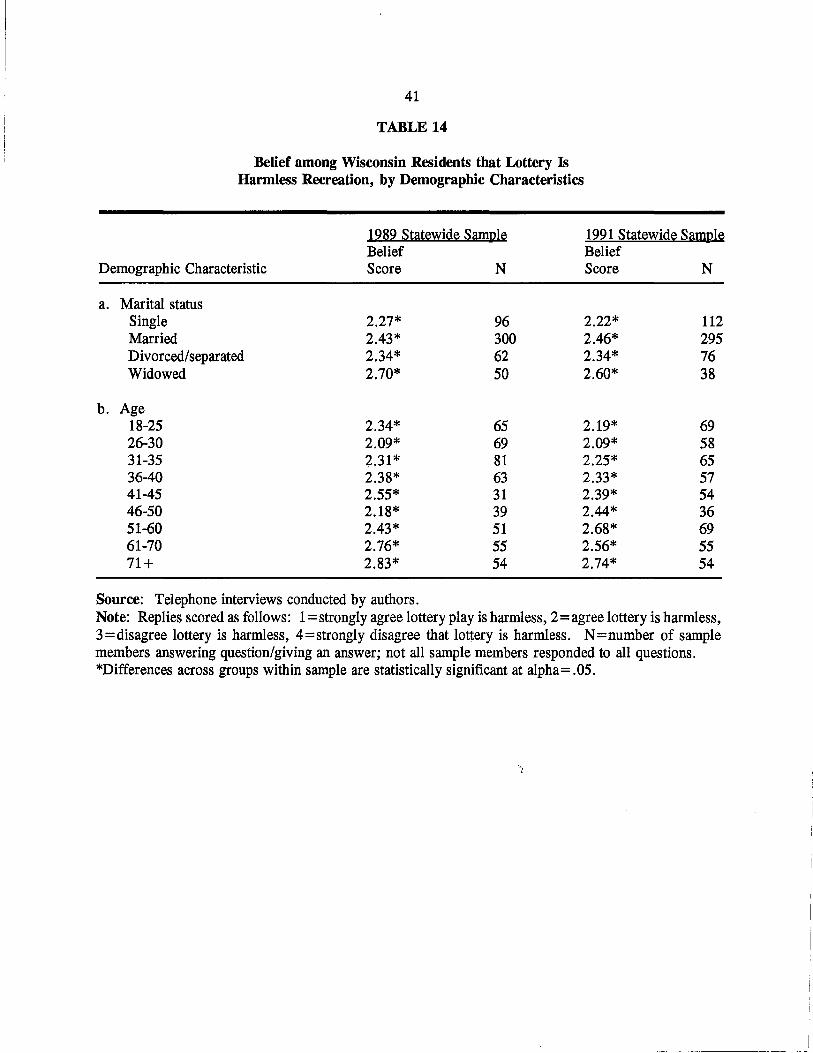
Lottery as Harmless Recreation
Piliavin and Polakowski (1990) found that marital status and age were related to the belief that
lotteries are a means of harmless recreation. Widowed respondents and older respondents were the
least likely to view lotteries as harmless. The findings for 1991, which are presented in Table 14,
parallel those of 1989, with widowed and older respondents still least likely to agree that lotteries are
harmless.
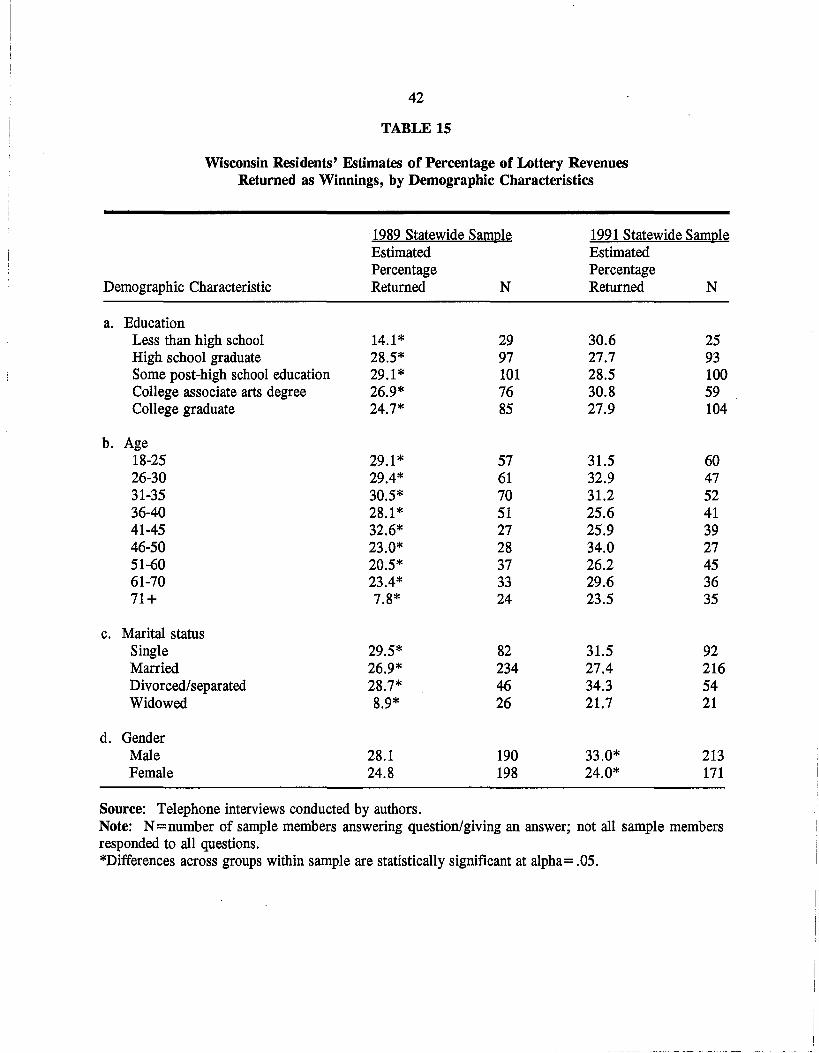
Percentage of Lottery Revenues Returned as Winnings
We found considerable changes since 1989 in the attitudinal correlates of the estimated
percentage of lottery revenues returned as winnings. Piliavin and Polakowski (1990) found this
attitude to significantly vary by education, age, and marital status. High school dropouts, older
respondents, and widowed respondents all estimated relatively low rates of return. In 1991, as
presented in the right-hand columns of Table 15, panels a through c, we discovered that none of these
correlations held. Estimated rates of return were no longer significantly associated with either
education, age, or marital status. We did, however, find that this attitude now varied by gender
(panel d). Male respondents in 1991 estimated significantly higher return rates (33 percent) than did
female respondents (24.0 percent).
40
TABLE 13
Belief among Wisconsin Residents that a System Can Be Devised toImprove One's Chances to Win, by Demographic Characteristics
Demographic Characteristic
1989 Statewide SampleBeliefScore N
1991 Statewide SampleBeliefScore N
a. RaceWhiteNonwhite
b. Marital statusSingleMarriedDivorced/separatedWidowed
1.67* 441 1.78* 4781.46* 26 1.62* 26
1.56* 90 1.72* 1121.71* 278 1.80* 2891.50* 58 1.66* 701.76* 41 1.94* 33
Source: Telephone interviews conducted by authors.Note: Replies scored as follows: 1=yes, 2=no. N=number of sample membersquestion/giving an answer; not all sample members responded to all questions.*Differences across groups within sample are statistically significant at alpha= .05.
answering
41
TABLE 14
Belief among Wisconsin Residents that Lottery IsHarmless Recreation, by Demographic Characteristics
Demographic Characteristic
1989 Statewide SampleBeliefScore N
1991 Statewide SampleBeliefScore N
a. Marital statusSingleMarriedDivorced/separatedWidowed
b. Age18-2526-3031-3536-4041-4546-5051-6061-7071+
2.27* 96 2.22* 1122.43* 300 2.46* 2952.34* 62 2.34* 762.70* 50 2.60* 38
2.34* 65 2.19* 692.09* 69 2.09* 582.31* 81 2.25* 652.38* 63 2.33* 572.55* 31 2.39* 542.18* 39 2.44* 362.43* 51 2.68* 692.76* 55 2.56* 552.83* 54 2.74* 54
Source: Telephone interviews conducted by authors.Note: Replies scored as follows: 1= strongly agree lottery play is harmless, 2= agree lottery is harmless,3=disagree lottery is harmless, 4=strongly disagree that lottery is harmless. N=number of samplemembers answering question/giving an answer; not all sample members responded to all questions.*Differences across groups within sample are statistically significant at alpha= .05.
42
TABLEtS
Wisconsin Residents' Estimates of Percentage of Lottery RevenuesReturned as Winnings, by Demographic Characteristics
·1989 Statewide Sample 1991 Statewide SampleEstimated EstimatedPercentage Percentage
Demographic Characteristic Returned N Returned N
a. EducationLess than high school 14.1* 29 30.6 25High school graduate 28.5* 97 27.7 93Some post-high school education 29.1* 101 28.5 100College associate arts degree 26.9* 76 30.8 59College graduate 24.7* 85 27.9 104
b. Age18-25 29.1* 57 31.5 6026-30 29.4* 61 32.9 4731-35 30.5* 70 31.2 5236-40 28.1* 51 25.6 4141-45 32.6* 27 25.9 3946-50 23.0* 28 34.0 2751-60 20.5* 37 26.2 4561-70 23.4* 33 29.6 3671+ 7.8* 24 23.5 35
c. Marital statusSingle 29.5* 82 31.5 92Married 26.9* 234 27.4 216Divorced/separated 28.7* 46 34.3 54Widowed 8.9* 26 21.7 21
d. GenderMale 28.1 190 33.0* 213Female 24.8 198 24.0* 171
Source: Telephone interviews conducted by authors.Note: N=number of sample members answering question/giving an answer; not all sample membersresponded to all questions.*Differences across groups within sample are statistically significant at alpha= .05.
43
CONCLUSION
The bivariate correlations examined in this chapter tell a twofold story. First, we find more
correlates of who plays the lottery than of how much is spent. We have identified many demographic
characteristics and attitudes that are significantly correlated with having played the lottery, and these
bivariate relationships give insight into which Wisconsin residents play the lottery. In contrast, we
find few characteristics or attitudes that are correlated with either dollars spent or the percentage of
income spent on lottery play. Second, we find several demographic traits that are correlated with
attitudes held toward the lottery. Residents most likely to disapprove of the lottery include the aged
and college graduates. Also, widowed and aged respondents are the least likely to consider the
lottery to be harmless recreation. We further find that many of the relationships Piliavin and
Polakowski observed in 1989 still held true in 1991.
CHAPfERS
RACIAL DIFFERENCES IN LOTTERY PLAY, LOTTERY-RELEVANT ATTITUDES,
AND LOTTERY KNOWLEDGE
In this chapter we compare the 1991 lottery play, lottery-relevant attitudes, and lottery
knowledge of African-Americans and whites in Wisconsin. The data we use for this comparison
come from caucasian members of the statewide sample (n=514) and members of the
African-American sample (n=225), augmented by African-American members of the statewide
sample (n= 18).
LOTTERY PLAY
We first examine racial differences in lottery play. In 1991, as presented in Table 16, 62.4
percent of the white respondents reported that they played the lottery in the prior year, as compared
to 56.0 percent of the African-American respondents. The difference is not statistically significant.
We next examine the likelihood of playing specific lottery games, and here we find significant racial
differences. Again in Table 16, a significantly higher percentage of whites than African-Americans
played Pull-Tab (20.0 percent vs. 9.5 percent) and Megabucks (53.9 percent vs. 44.0 percent).
Conversely, a significantly higher percentage of African-Americans than whites played SuperCash!
(31.7 percent to 22.0 percent), and roughly equal proportions of each played Scratch-Off (53.6
percent of the whites, 50.6 percent of the African-Americans).
Additional racial differences exist in the frequency of lottery play. While African-American
respondents who play the lottery do so on average 13.9 times a year, white lottery players play on
average 18.7 times a year. The difference is statistically significant.

45
TABLE 16
Lottery Play of Wisconsin Residents, by Race (1991 Sample)
Player's Percentage of Total Family Income Spent on LotteryMean .70% (273)Median .12% (273)
Games Played Last YearPlayed any gamePlayed Scratch-OffPlayed Pull-TabPlayed SuperCash!Played Megabucks
Player's Frequency of Lottery Play Last YearMeanMedian
Played once a week or morePlayed once a month or morePlayed less than once a month
Player's Monthly Expenditure on LotteryMeanMedian
$0 to $4 per month$4 to $30 per month$31 to $99 per month$100 or more per month
0.0% to .10%.11 % to 1.00%1.01 % or more
Whites
62.4% (514)53.6% (513)20.0% (514)22.0% (513)53.9% (514)
18.7 (315)12.0 (315)
7.3% (23)45.4% (143)47.3% (149)
$14.57 (299)$2.42 (299)
58.2% (174)28.1 % (84)11.7% (35)2.0% (6)
47.3% (129)37.4% (102)1504·% (42)
African-Americans
56.0% (243)50.6% (243)9.5% (243)**
31.7% (243)**44.0% (243)*
13.9 (132)*10.0 (132)
3.0% (4)40.2% (53)56.8% (75)
$10.72 (129)$2.50 (129)
58.1% (75)33.3% (43)7.0% (9)1.6% (2)
.80% (108)
.20% (108)
38.9% (42)46.3% (50)14.8% (16)
Source: Telephone interviews conducted by authors.Note: Number of sample members answering question/giving an answer is in parentheses; not all samplemembers responded to all questions. Whites are from the 1991 statewide sample; African-Americans arefrom the 1991 African-American sample, augmented by the African-Americans in the statewide sample.* Difference between whites and African-Americans is statistically significant at p < .05.** Difference between whites and African-Americans is statistically significant at p < .01.
46
LOTTERY EXPENDITURES
In the bottom two panels of Table 16, we present the lottery expenditures of white and
African-American lottery players. White respondents who play the lottery wager, on average, $14.57
a month. African-American lottery players average $10.72 a month. The difference is not statistically
significant. The median amount spent by the two groups is quite similar, that for whites being $2.42
and that for African-Americans $2.50.
Results dealing with the percentage of family income spent on lottery play follow those of
dollars spent. White lottery players wager, on average, .70 percent of their total family income.
Their median percentage is .12 percent of family income. African-American lottery players wager,
on average, .80 percent of their total family income on lottery play, and their median percentage is
.20 percent. As with dollars spent, the difference between groups in percentage of family income
wagered is not statistically significant. The data thus suggest that African-Americans and white
Wisconsin residents have similar lottery expenditures in terms of both dollars spent and percentage of
family income wagered.
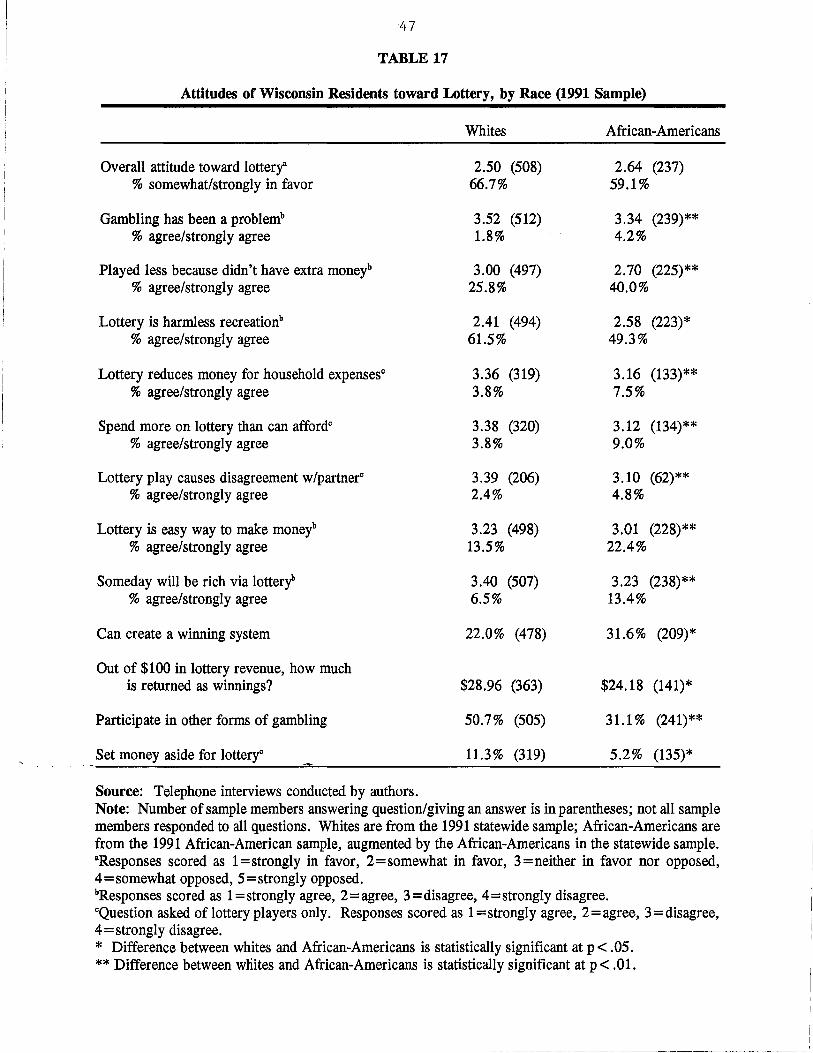
KNOWLEDGE ABOUT AND ATTITUDES TOWARD LOTTERIES
The knowledge and attitudinal queries on which we compare African-American and white
sample members are those discussed in chapters 3 and 4. Our results are presented in Table 17. The
two groups report apparent agreement on only one item, that concerning overall attitude toward the
lottery. Two-thirds of white sample members and almost 60 percent of African-Americans state they
are in favor of lotteries. The difference is not statistically significant.
Despite their common, generally favorable views of lotteries, whites and African-Americans
express significantly different perceptions concerning the payoffs and the character of lottery playas
47
TABLE 17
Attitudes of Wisconsin Residents toward Lottery, by Race (1991 Sample)
Participate in other forms of gambling
Overall attitude toward lottery"% somewhat/strongly in favor
Lottery is easy way to make moneyb% agree/strongly agree
Spend more on lottery than can affordc
% agree/strongly agree
Whites African-Americans
2.50 (508) 2.64 (237)66.7% 59.1%
3.52 (512) 3.34 (239)**1.8% 4.2%
3.00 (497) 2.70 (225)**25.8% 40.0%
2.41 (494) 2.58 (223)*61.5% 49.3%
3.36 (319) 3.16 (133)**3.8% 7.5%
3.38 (320) 3.12 (134)**3.8% 9.0%
3.39 (206) 3.10 (62)**2.4% 4.8%
3.23 (498) 3.01 (228)**13.5% 22.4%
3.40 (507) 3.23 (238)**6.5% 13.4%
22.0% (478) 31.6% (209)*
$28.96 (363) $24.18 (141)*
50.7% (505) 31.1% (241)**
11.3% (319) 5.2% (135)*..,.Set money aside for lottery"
Out of $100 in lottery revenue, how muchis returned as winnings?
Can create a winning system
Gambling has been a problemb
% agree/strongly agree
Lottery play causes disagreement w/partnerc
% agree/strongly agree
Lottery reduces money for household expensesc
% agree/strongly agree
Lottery is harmless recreationb
% agree/strongly agree
Played less because didn't have extra moneyb% agree/strongly agree
Someday will be rich via lotteryh% agree/strongly agree
Source: Telephone interviews conducted by authors.Note: Number of sample members answering question/giving an answer is in parentheses; not all samplemembers responded to all questions. Whites are from the 1991 statewide sample; African-Americans arefrom the 1991 African-American sample, augmented by the African-Americans in the statewide sample.aResponses scored as 1=strongly in favor, 2=somewhat in favor, 3=neither in favor nor opposed,4= somewhat opposed, 5= strongly opposed.bResponses scored as 1= strongly agree, 2=agree, 3 = disagree, 4=strongly disagree.cQuestion asked of lottery players only. Responses scored as 1= strongly agree, 2=agree, 3=disagree,4=strongly disagree.* Difference between whites and African-Americans is statistically significant at p < .05.** Difference between wliites and African-Americans is statistically significant at p < .01.
48
well as the consequences of lottery play on family life. As compared to whites, African-Americans
believe that the state of Wisconsin returns less of its lottery revenue to winners ($24 vs $29), but
conversely they are more likely to believe that systems of play can be developed to increase one's
chances of winning lotteries (32 percent vs 22 percent). African-Americans are also more likely to
perceive lottery playas an easy way to make money and to believe that someday lotteries will make
them rich (13.4 percent vs 6.5 percent).
Both whites and African-Americans are predominantly of the view that lottery play causes
them no problems. Thus, the majorities of both groups believe that lottery play places no financial
burden on their household expenses, that their lottery play is within bounds of affordability, and that
it causes no disagreements between them and their spouses (if present in the household). These
general views notwithstanding, African-Americans are still more likely than whites to report that
lottery play does in fact lead to financial problems and family conflict. While the percentages of
respondents who report these problems are small, African-Americans are significantly more likely to
report that lottery play reduces money for household expenses (7.5 percent vs. 3.8 percent), that they
wager more than they can afford (9.0 percent vs. 3.8 percent), that they play less due to financial
constraints (40.0 percent vs. 25.8 percent), and that playing lotteries causes disagreements with
partners (4.8 percent vs. 2.4 percent). Finally, African-Americans are more likely to report that
gambling in general is a problem for them (4.2 percent vs. 1.8 percent).
POSSIBLE MEDIATING INFLUENCES OF OBSERVED RACIAL DIFFERENCES
In reporting racial differences in lottery play and lottery-relevant attitudes between
African-American and white sample members, we cannot neglect the possibility that these differences
are caused by related demographic differences. As discussed in chapter 2, African-Americans
surveyed, on average, earn less family income, are less likely to be currently married, and have
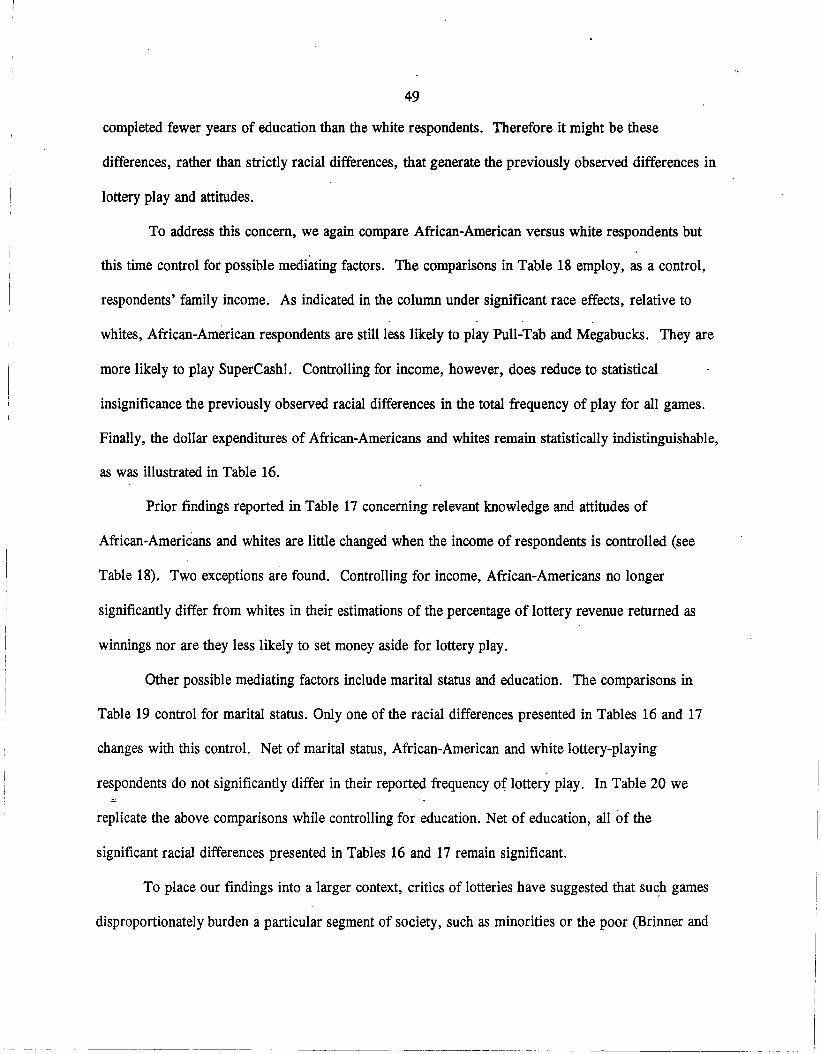
49
completed fewer years of education than the white respondents. Therefore it might be these
differences, rather than strictly racial differences, that generate the previously observed differences in
lottery play and attitudes.
To address this concern, we again compare African-American versus white respondents but
this time control for possible mediating factors. The comparisons in Table 18 employ, as a control,
respondents' family income. As indicated in the column under significant race effects, relative to
whites, African-American respondents are still less likely to play Pull-Tab and Megabucks. They are
more likely to play SuperCash!. Controlling for income, however, does reduce to statistical
insignificance the previously observed racial differences in the total frequency of play for all games.
Finally, the dollar expenditures of African-Americans and whites remain statistically indistinguishable,
as was illustrated in Table 16.
Prior findings reported in Table 17 concerning relevant knowledge and attitudes of
African-Americans and whites are little changed when the income of respondents is controlled (see
Table 18). Two exceptions are found. Controlling for income, African-Americans no longer
significantly differ from whites in their estimations of the percentage of lottery revenue returned as
winnings nor are they less likely to set money aside for lottery play.
Other possible mediating factors include marital status and education. The comparisons in
Table 19 control for marital status. Only one of the racial differences presented in Tables 16 and 17
changes with this control. Net of marital status, African-American and white lottery-playing
respondents do not significantly differ in their reported frequency oflottery play. In Table 20 we
replicate the above comparisons while controlling for education. Net of education, all of the
significant racial differences presented in Tables 16 and 17 remain significant.
To place our findings into a larger context, critics of lotteries have suggested that su~h games
disproportionately burden a particular segment of society, such as minorities or the poor (Brinner and
j
I
.~.__.~_._---_._._----~~-- I
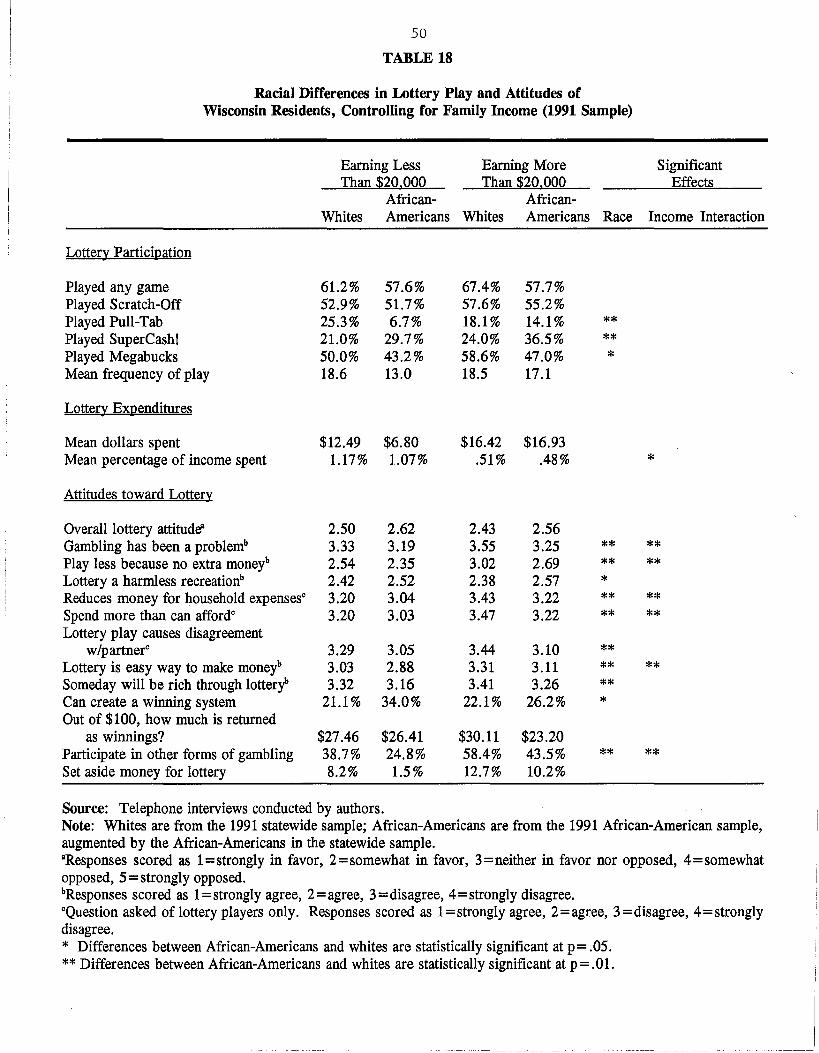
50
TABLE 18
Racial Differences in Lottery Play and Attitudes ofWisconsin Residents, Controlling for Family Income (1991 Sample)
Earning Less Earning More SignificantThan $20,000 Than $20,000 Effects
African- African-Whites Americans Whites Americans Race Income Interaction
Lottery Participation
Played any game 61.2% 57.6% 67.4% 57.7%Played Scratch-Off 52.9% 51.7% 57.6% 55.2%Played Pull-Tab 25.3% 6.7% 18.1% 14.1% **Played SuperCash! 21.0% 29.7% 24.0% 36.5% **Played Megabucks 50.0% 43.2% 58.6% 47.0% *Mean frequency of play 18.6 13.0 18.5 17.1
Lottery Expenditures
Mean dollars spent $12.49 $6.80 $16.42 $16.93Mean percentage of income spent 1.17% 1.07% .51% .48% *
Attitudes toward Lottery
Overall lottery attitude" 2.50 2.62 2.43 2.56Gambling has been a problemb 3.33 3.19 3.55 3.25 ** **Play less because no extra moneyb 2.54 2.35 3.02 2.69 ** **Lottery a harmless recreationb 2.42 2.52 2.38 2.57 *Reduces money for household expensesc 3.20 3.04 3.43 3.22 ** **Spend more than can affordc 3.20 3.03 3.47 3.22 ** **Lottery play causes disagreement
w/partnerc 3.29 3.05 3.44 3.10 **Lottery is easy way to make moneyb 3.03 2.88 3.31 3.11 ** **Someday will be rich through lotterY' 3.32 3.16 3.41 3.26 **Can create a winning system 21.1% 34.0% 22.1% 26.2% *Out of $100, how much is returned
as winnings? $27.46 $26.41 $30.11 $23.20Participate in other forms of gambling 38.7% 24.8% 58.4% 43.5% ** **Set aside money for lottery 8.2% 1.5% 12.7% 10.2%
Source: Telephone interviews conducted by authors.Note: Whites are from the 1991 statewide sample; African-Americans are from the 1991 African-American sample,augmented by the African-Americans in the statewide sample.BResponses scored as 1=strongly in favor, 2=somewhat in favor, 3=neither in favor nor opposed, 4=somewhatopposed, 5 = strongly opposed.bResponses scored as 1= strongly agree, 2=agree, 3=disagree, 4=strongly disagree.cQuestion asked of lottery players only. Responses scored as 1= strongly agree, 2 = agree, 3= disagree, 4 = stronglydisagree.* Differences between African-Americans and whites are statistically significant at p= .05.** Differences between African-Americans and whites are statistically significant at p = .01.
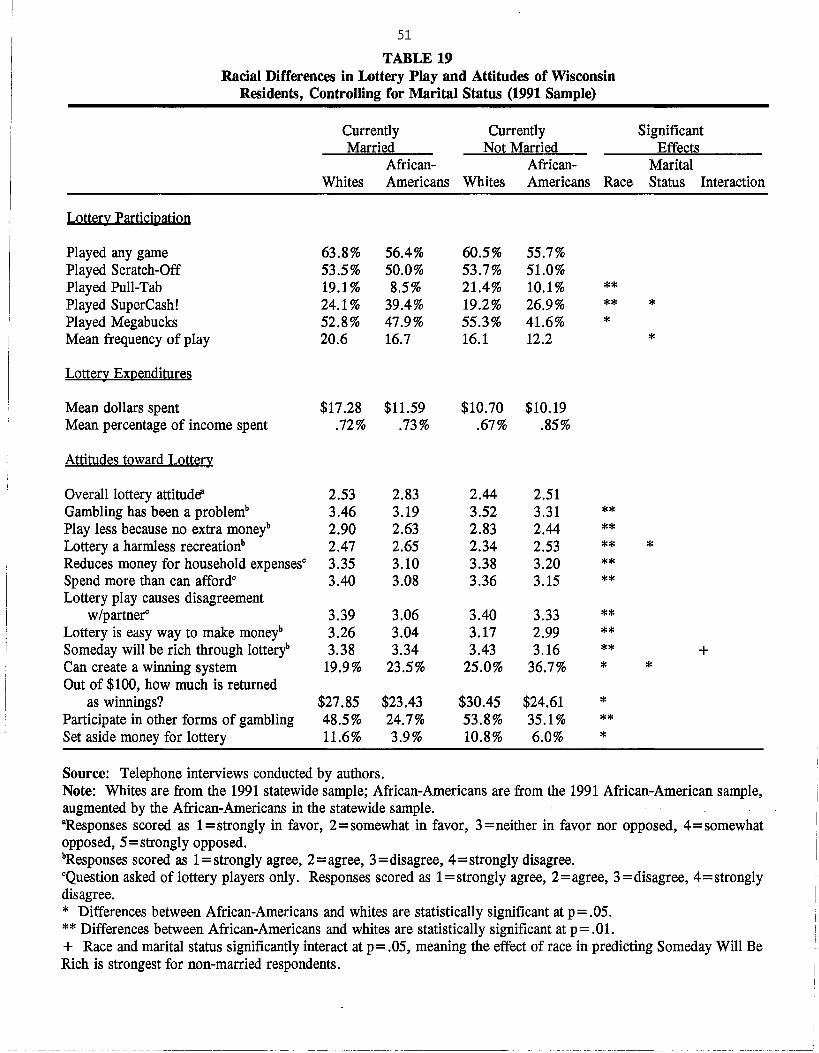
51
TABLE 19Racial Differences in Lottery Play and Attitudes of Wisconsin
Residents, Controlling for Marital Status (1991 Sample)
Currently Currently SignificantMarried Not Married Effects
African- African- MaritalWhites Americans Whites Americans Race Status Interaction
Lottery Participation
Played any game 63.8% 56.4% 60.5% 55.7%Played Scratch-Off 53.5% 50.0% 53.7% 51.0%Played Pull-Tab 19.1% 8.5% 21.4% 10.1% **Played SuperCash! 24.1% 39.4% 19.2% 26.9% ** *Played Megabucks 52.8% 47.9% 55.3% 41.6% *Mean frequency of play 20.6 16.7 16.1 12.2 *
Lottery Expenditures
Mean dollars spent $17.28 $11.59 $10.70 $10.19Mean percentage of income spent .72% .73% .67% .85%
Attitudes toward Lottery
Overall lottery attitude' 2.53 2.83 2.44 2.51Gambling has been a problemb 3.46 3.19 3.52 3.31 **Play less because no extra moneyb 2.90 2.63 2.83 2.44 **Lottery a harmless recreationb 2.47 2.65 2.34 2.53 ** *Reduces money for household expensesc 3.35 3.10 3.38 3.20 **Spend more than can affordc 3.40 3.08 3.36 3.15 **Lottery play causes disagreement
w/partnerc 3.39 3.06 3.40 3.33 **Lottery is easy way to make moneyb 3.26 3.04 3.17 2.99 **Someday will be rich through lotterY' 3.38 3.34 3.43 3.16 ** +Can create a winning system 19.9% 23.5% 25.0% 36.7% * *Out of $100, how much is returned
as winnings? $27.85 $23.43 $30.45 $24.61 *Participate in other forms of gambling 48.5% 24.7% 53.8% 35.1% **Set aside money for lottery 11.6% 3.9% 10.8% 6.0% *
Source: Telephone interviews conducted by authors.Note: Whites are from the 1991 statewide sample; African-Americans are from the 1991 African-American sample,augmented by the African-Americans in the statewide sample.aResponses scored as 1= strongly in favor, 2=somewhat in favor, 3=neither in favor nor opposed, 4=somewhatopposed,S = strongly opposed.bResponses scored as 1= strongly agree, 2=agree, 3=disagree, 4=strongly disagree.cQuestion asked of lottery players only. Responses scored as 1= strongly agree, 2=agree, 3=disagree, 4=stronglydisagree.* Differences between African-Americans and whites are statistically significant at p = .05.** Differences between African-Americans and whites are statistically significant at p= .01.+ Race and marital status significantly interact at p= .05, meaning the effect of race in predicting Someday Will BeRich is strongest for non-married respondents.
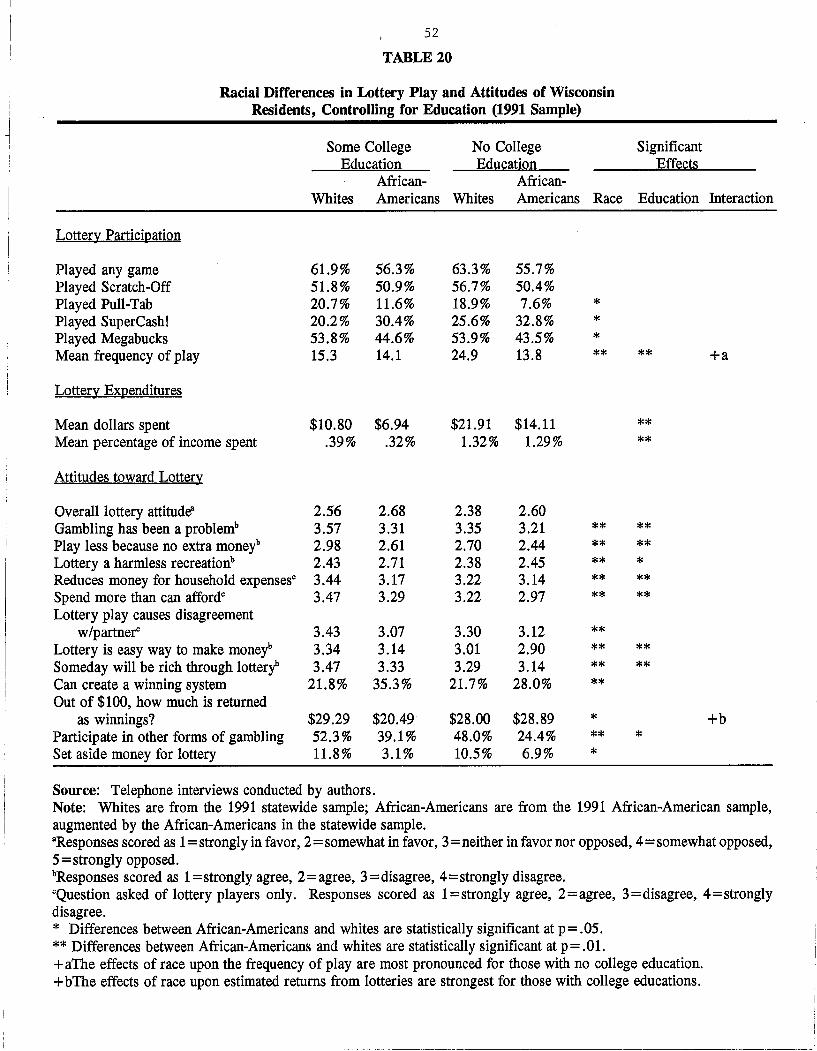
52
TABLE 20
Racial Differences in Lottery Play and Attitudes of WisconsinResidents, Controlling for Education (1991 Sample)
Some College No College SignificantEducation Education Effects
African- African-Whites Americans Whites Americans Race Education Interaction
Lottery Participation
Played any game 61.9% 56.3% 63.3% 55.7%Played Scratch-Off 51.8% 50.9% 56.7% 50.4%Played Pull-Tab 20.7% 11.6% 18.9% 7.6% *Played SuperCash! 20.2% 30.4% 25.6% 32.8% *Played Megabucks 53.8% 44.6% 53.9% 43.5% *Mean frequency of play 15.3 14.1 24.9 13.8 ** ** +a
Lottery Expenditures
Mean dollars spent $10.80 $6.94 $21.91 $14.11 **Mean percentage of income spent .39% .32% 1.32% 1.29% **
Attitudes toward Lottery
Overall lottery attitude" 2.56 2.68 2.38 2.60Gambling has been a problemb 3.57 3.31 3.35 3.21 ** **Play less because no extra moneyb 2.98 2.61 2.70 2.44 ** **Lottery a harmless recreationb 2.43 2.71 2.38 2.45 ** *Reduces money for household expensesc 3.44 3.17 3.22 3.14 ** **Spend more than can affordc 3.47 3.29 3.22 2.97 ** **Lottery play causes disagreement
w/partnerc 3.43 3.07 3.30 3.12 **Lottery is easy way to make moneyb 3.34 3.14 3.01 2.90 ** **Someday will be rich through lottery" 3.47 3.33 3.29 3.14 ** **Can create a winning system 21.8% 35.3% 21.7% 28.0% **Out of $100, how much is returned
as winnings? $29.29 $20.49 $28.00 $28.89 * +bParticipate in other forms of gambling 52.3% 39.1% 48.0% 24.4% ** *Set aside money for lottery 11.8% 3.1% 10.5% 6.9% *
Source: Telephone interviews conducted by authors.Note: Whites are from the 1991 statewide sample; African-Americans are from the 1991 African-American sample,augmented by the African-Americans in the statewide sample.aResponses scored as 1= strongly in favor, 2= somewhat in favor, 3= neither in favor nor opposed, 4=somewhat opposed,5= strongly opposed.bResponses scored as 1= strongly agree, 2=agree, 3=disagree, 4=strongly disagree.cQuestion asked of lottery players only. Responses scored as 1= strongly agree, 2= agree, 3= disagree, 4 = stronglydisagree.* Differences between African-Americans and whites are statistically significant at p= .05.** Differences between African-Americans and whites are statistically significant at p=.01.+ aThe effects of race upon the frequency of play are most pronounced for those with no college education.+ bThe effects of race upon estimated returns from lotteries are strongest for those with college educations.
53
Clotfelter 1975). We find mixed support for this concern. On one hand, our analysis suggests that
minority residents do not play more often or spend larger amounts on the lottery than whites. And in
general African-Americans report significantly less gambling than whites.
On the other hand, African-Americans are substantially more likely to characterize the lottery
as creating personal problems for them, that it reduces household expenses, creates family
disagreements, and causes other problems.
---- -----~------ -------~-------._-------------------- --
I
I
J
CHAPTER 6
MULTIVARIATE ANALYSIS OF WTfERY PLAY
MULTIVARIATE ANALYSIS
In chapter 4, we analyzed the relationship between attributes of sample members and various
dimensions of lottery play. These bivariate analyses uncovered a number of significant correlates of
lottery play. However, as we noted, bivariate correlations do not necessarily imply causal
connections. Specifically, two unrelated variables may correlate because each correlates with a
common third variable. To illustrate this concept, suppose that older people have more reticent
attitudes toward lotteries and that these attitudes are negatively associated with lottery play. In this
situation, the relationship between attitude and play may be spurious since both are determined by the
critically causal agent, namely, age.
So-called multivariate statistical analyses can be employed to reduce this potential pitfall by
simultaneously analyzing the effects of many explanatory variables (independent variables) upon an
outcome of interest (dependent variable). This approach tests the impact of each independent variable
upon a dependent variable while controlling for the remaining independent variables.
Correct use of multivariate analysis necessitates consideration of the form of the dependent
variable. The Piliavin and Polakowski (1990) study used multivariate analysis to determine which
demographic characteristics and attitudes significantly predicted lottery play. In replicating their
analysis, we also used as a dependent variable the answer to the question, "Did you (Le., the
respondent) play the lottery last year?" This variable is dichotomous: the answer can only be "yes"
or "no." We assigned the variable a value of 0 if the response was "no," and 1 if it was "yes."
Given this dichotomous form, a suitable multivariate statistical technique is logistic regression, for it
accounts for dichotomously distributed dependent variables. As such, logistic regression will provide
i-,---_._----,._-------~~._---~--,-,._. '
55
non-biased estimates of the influence of personal characteristics and attitudes upon the likelihood of
playing the lottery.
In replicating Piliavin and Polakowski (1990), we analyzed the effects on lottery play of three
categories of independent variables: demographic characteristics, other forms of gambling, and
attitudes. We analyzed these independent variables in the same causal order as did Piliavin and
Polakowski. First, we tested if demographic variables predict lottery play. Then we tested the
effects of participation in other forms of gambling while controlling for demographic variables. Last,
we added several attitudinal measures to the above variables and tested the relative impact of all three
categories of independent variables.
RESULTS
Table 21 contains the results of our multivariate analyses. In the first three columns we
present the findings of Piliavin and Polakowski (1990). In the last three columns we report our
findings. Columns one and four contain the estimates of lottery participation regressed upon
demographic characteristics. Columns two and five add a measure of having participated in
non-lottery gambling. And columns three and six add attitudinal measures.
We report two numbers for each independent variable in each column. The first is a logistic
regression coefficient, which measures the change in log odds of playing the lottery associated with a
one-unit increase in the independent variable. 11 When the coefficient is positive, the probability of
playing the lottery increases as the independent variable increases. Conversely, when the coefficient
is negative, the probability of lottery play decreases as the independent variable increases. Below the
regression coefficient, in parentheses, we report the standard error of the regression coefficient. If
the regression coefficient is twice the size or more of its standard error, the regression coefficient is
statistically significant at the 95 percent confidence level.
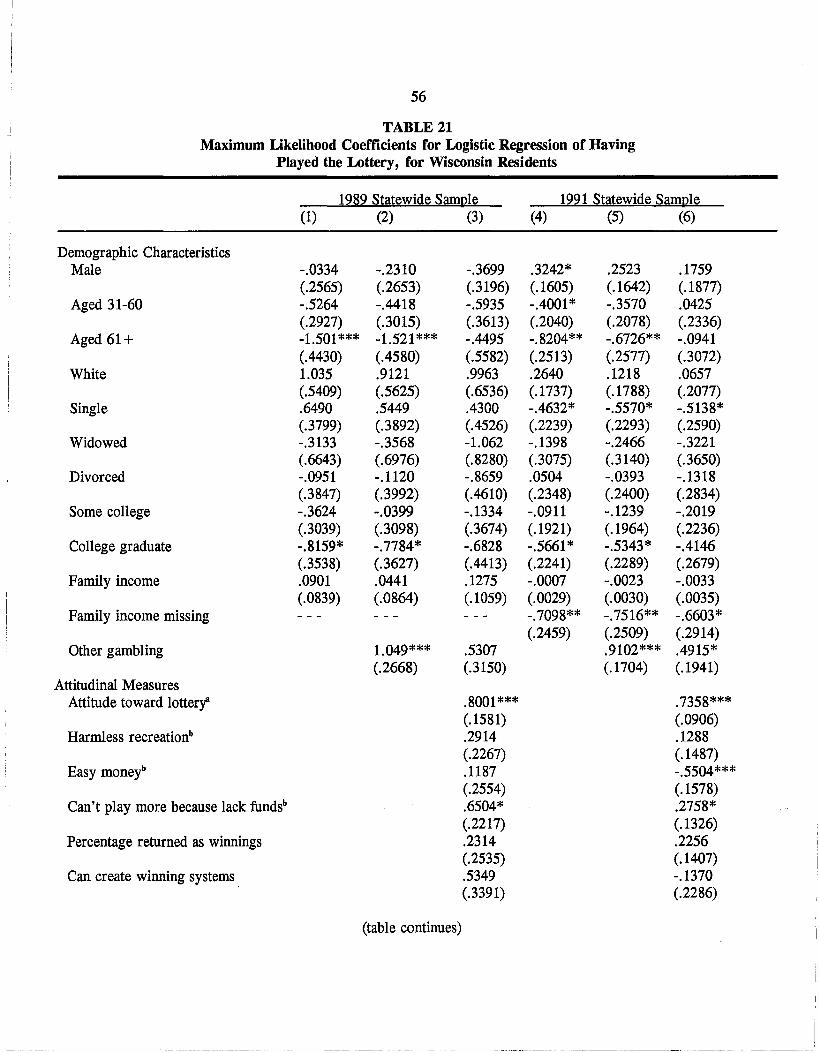
56ii TABLE 21-I
Maximum Likelihood Coefficients for Logistic Regression of HavingPlayed the Lottery, for Wisconsin Residents
1989 Statewide Sample 1991 Statewide Sample(1) (2) (3) (4) (5) (6)
Demographic CharacteristicsMale -.0334 -.2310 -.3699 .3242* .2523 .1759
(.2565) (.2653) (.3196) (.1605) (.1642) (.1877)Aged 31-60 -.5264 -.4418 -.5935 -.4001* -.3570 .0425
(.2927) (.3015) (.3613) (.2040) (.2078) (.2336)Aged 61+ -1.501*** -1.521*** -.4495 -.8204** -.6726** -.0941
(.4430) (.4580) (.5582) (.2513) (.2577) (.3072)White 1.035 .9121 .9963 .2640 .1218 .0657
(.5409) (.5625) (.6536) (.1737) (.1788) (.2077)Single .6490 .5449 .4300 -.4632* -.5570* -.5138*
(.3799) (.3892) (.4526) (.2239) (.2293) (.2590)Widowed -.3133 -.3568 -1.062 -.1398 -.2466 -.3221
(.6643) (.6976) (.8280) (.3075) (.3140) (.3650)Divorced -.0951 -.1120 -.8659 .0504 -.0393 -.1318
(.3847) (.3992) (.4610) (.2348) (.2400) (.2834)Some college -.3624 -.0399 -.1334 -.0911 -.1239 -.2019
(.3039) (.3098) (.3674) (.1921) (.1964) (.2236)College graduate -.8159* -.7784* -.6828 -.5661* -.5343* -.4146
(.3538) (.3627) (.4413) (.2241) (.2289) (.2679)Family income .0901 .0441 .1275 -.0007 -.0023 -.0033
(.0839) (.0864) (.1059) (.0029) (.0030) (.0035)Family income missing -.7098** -.7516** -.6603*
(.2459) (.2509) (.2914)Other gambling 1.049*** .5307 .9102*** .4915*
(.2668) (.3150) (.1704) (.1941)Attitudinal Measures
Attitude toward lotter1 .8001*** .7358***(.1581) (.0906)
Harmless recreationb .2914 .1288(.2267) (.1487)
Easy moneyb .1187 -.5504***(.2554) (.1578)
Can't play more because lack fundsb .6504* .2758*(.2217) (.1326)
Percentage returned as winnings .2314 .2256(.2535) (.1407)
Can create winning systems .5349 -.1370(.3391) (.2286)
(table continues)

57
TABLE 21 (continued)
1989 Statewide Sample(1) (2) (3)
1991 Statewide Sample(4) (5) (6)
Create winning systems missing
Gambling is a problemb
- log likelihood-2 log likelihooddfL-Squared
-194.89389.78
-193.03386.06
13.72
.4896(.3253)-170.69341.38
744.68***
-468.41936.82
-453.66907.32
129.50***
-.8376*(.3509)-.2720(.1789)-375.76751.52
777.90***
Source: Authors' computations based on telephone interviews conducted by authors.Note: Standard errors in parentheses. Dependent variable is answer to "Did you (Le., respondent) play the lottery lastyear?" (1 =yes, O=no).* Statistically significant at .05 level.** Statistically significant at .01 level.***Statistically significant at .001 level.aAttitude scored 1= strongly opposed to 5= strongly in favor.bBelief scored 1= strongly disagree to 5= strongly agree.
--- --~------~---------
58
As shown in column four, several demographic characteristics of the 1991 respondents
significantly predict lottery play. These include gender, age, marital status, and education. First,
men are more likely to play the lottery than women, with an estimated regression coefficient of .3242
(top of column four)" Being positive, this coefficient indicates that male respondents (coded as 1)
have higher probabilities of lottery play than female respondents (coded as 0). To put this change of
log odds into terms of probabilities,t2 men have a .64 probability (p= .64) of playing the lottery,
whereas women have only a .57 probability. Second, middle-aged respondents are significantly less
likely to play than younger respondents (P=.55 vs. p=.64 respectively) as are older respondents,
relative to younger respondents (p=.45 vs. p= .65). Third, single respondents, relative to married
respondents, have significantly lower probabilities of lottery play (p=.52 vs. p= .63). Last,
respondents with a college degree are significantly less likely to play relative to those with only high
school educations (p=.49 vs. p= .63).
Column five presents the effect of demographic characteristics upon the likelihood of lottery
play, net of participation in other forms of gambling. Net of other gambling, the effects of being
male and middle-aged are insignificant. However, older respondents are still less likely to play than
younger respondents (p=.48 vs. p= .64); single respondents, less likely than married respondents
(P =.50 vs. p = .63); and college graduates, less likely than those with only high school degrees
(p=.50 vs. p= .63). Non-lottery gambling is significantly associated with lottery play. Respondents
who gamble on non-lottery games have higher probabilities of lottery play than those who do not
(P=.71 vs. p= .50).
Column six tests the effects of demographic characteristics and other gambling on the
probability of playing the lottery, net of lottery-relevant attitudes. Controlling for attitudes reduces to
insignificance the effect of being older or having a college degree. Single respondents, however, are
-----
59
still less likely to play than married respondents (p=.51 vs. p=.63), and gamblers are still more
likely to play the lottery than non-gamblers (p=.67 vs. p=.54).
Several of the attitudes are significantly associated with lottery play. First and foremost,
positive evaluation of the lottery closely corresponds with playing the lottery. Respondents who
strongly favor the lottery have much higher probabilities of playing than those strongly opposed
(p=.20 vs. p=.82). Viewing the lottery as easy money is also associated with lottery play.
Respondents agreeing that the lottery is an easy way to make money have lower probabilities of
playing than those who disagree (p = .44 vs. P= .57). Last, a perceived lack of funds is associated
with lottery play. Respondents who strongly agree that a lack of extra money limits their lottery play
have higher probabilities of playing than those who strongly disagree (p=.72 vs. p= .54).
DISCUSSION
In generalizing from these findings, we draw several conclusions. First, in neither the 1989
nor 1991 analysis did race or family income significantly predict lottery play. Therefore, we find no
evidence that minority or poor state residents are more likely to play the lottery than white or wealthy
residents. This findings supports our supposition in chapter 5 that the lottery-playing levels of
minorities approximate those of whites. With the poor, however, even if they play at comparable
levels as the wealthy, they may still be spending a greater percentage of their income on the lottery.
Second, the basic profile of lottery players has changed little from 1989 to 1991. Although
the full equations ,(columns three and six) indicate that in 1991 several more phenomena predicted
lottery play than in 1989, all those phenomena relevant to lottery play in 1989 were also relevant in
1991. Specifically, in equations one and four, both old age and college degree predict less lottery
play. In equations two and five, both old age and college degree remain significant and other
60
gambling significantly increases the likelihood of playing. And in equations three and six, overall
approval and perceived lack of funds both increase the probability of lottery play.
Third, as in 1989, the effects of demographic characteristics on lottery play appear to be
mediated by attitudes and other gambling. Specifically our analysis suggests first that males and
married people are more likely to gamble generally and that this leads them, as compared to women
and younger respondents, to be more likely to play lottery games. The analyses suggest further that
college graduates and older people are less likely to play lottery games because they tend to have
more negative views of these games.
SUMMARY
To highlight the findings of our report, we find the following:
1. The number of state residents who play the lottery has changed little since 1989. As
reported, in 1991 about three out of five played it sometime in the prior year.
2. Lottery spending is becoming more concentrated over time among those who spend more.
Currently about 10 percent of the state's populace (16 percent of the players) account for
nearly 75 percent of all lottery revenue.
3. Scratch-Off and Megabucks are the most widely played lottery games. And heavy-spending
players prefer SuperCash! over Megabucks, but the reverse is true for light-spending players.
4. Attitudes toward the lottery have changed little in the past two years, except that overall
approval of the lottery may be slipping. ._,.' "'C,' . <~- ,.:'." .... , .. , ,.,:.,.-.'.":- ",·." ..<."'-."\''':''XlAO-r _
5. Few state residents (less than 5 percent) report that lottery play creates personal problems for
them.
61
6. Residents least likely to play include those who are either extremely poor, aged, female,
single, either without high school diplomas or with college degrees, or who do not participate
in other forms of gambling.
7. African-American and white respondents are equally likely to play the lottery, and spend
comparable amounts of their income on it.
8. African-American respondents, relative to whites, report more personal problems associated
with lottery play.
9. Demographic differences exist in who plays the lottery. Men, young people, married people,
high school graduates, and those with some college but no degree are the most likely to play.
The bulk of these differences existed in both 1989 and 1991; thus the basic profile of lottery
players in Wisconsin has changed little since 1989.
10. The effects of demographic characteristics upon lottery play is mediated by attitudes.
Specifically, the effects of gender appear to be mediated by participation in other, non-lottery
forms of gambling; the effects of education, by attitudes toward the lottery; and the effects of
age, by both other gambling and attitudes.
~~~ "~"---~-

63
Endnotes
lMuch of this chapter is condensed from Piliavin and Polakowski (1990), to which we refer the
reader for further detail.
ZWe thank Diane Harmelink of the State Lottery Board for the information used in this review.
3We thank Bob Lee, director of the Letters and Science Survey Center, for providing this
overview.
4Note: 117 of these 355 were excluded from the sample because the respondents identified
themselves as something other than African-American.
sThe 1989 and 1991 surveys used different measures of family income. To facilitate comparison,
we recomputed the 1989 income measure to equal the form used in 1991; hence we report a different
1989 mean income than did the 1989 report.
6Statistical significance refers to the likelihood that our findings result from chance rather than
actual differences in the population. At p= .05, we are 95 percent sure that our findings are not due
to chance. At p= .01, we are 99 percent sure.
7Piliavin and Polakowski's study was conducted in 1989; the results appeared in 1990 in Institute
for Research on Poverty Special Report no. 50.
SA median spending level of $2.50 means that one-half of the players spent more than this, and
one-half spent less.
9'fhe 1989 sample averaged spending $6.18 per month on the lottery, for a total monthly
expenditure of $3,258 (527 respondents * $6.18). The top 53 highest-spending respondents (10
percent of the sample) averaged wagering $37.23 a month, for a total monthly average expenditure of
$1,973 (53 * $37.27). Thus, the top 10 percent spent 61 percent of all lottery expenditures
($1,973/$3,258).
64
l%e 1991 sample averaged spending $8.57 per month on the lottery, for a total monthly
expenditure of $4,440 (518 * $8.57). The top 52 highest-spending respondents (10 percent of the
sample) averaged wagering $63.93 a month, for a total expenditure of $3,324 (52 * $63.93). Thus,
the top 10 percent spent 75 percent of all lottery expenditures ($3,324/$4,440).
llSince many of our readers are perhaps unfamiliar with log odds, we will translate the logistic
coefficients into probabilities when a variable is significant.
12'fhe equation used is p = exp(BX) / 1 + exp(BX), where BX is the matrix of logit coefficients
and x variables.
65
References
Asbury, Herbert. 1938. Sucker's Progress. New York: Dodd, Mead.
Brinner, Roger E., ·and Charles T. Clotfelter. 1975. "An Economic Appraisal of State Lotteries."
National Tax Journal (28:4), 395-404.
Clotfelter, Charles T., and Philip J. Cook. 1989. Selling Hope: State Lotteries in the United States.
Cambridge: Harvard University Press.
Commission on the Review of the National Policy toward Gambling. 1976. Gambling in America.
Final Report of the National Gambling Commission. Washington, D.C.: U.S. Government
Printing Office.
Devereux, Edward C. 1980. Gambling and the Social Structure. Vol. 1. New York: Arno Press.
Koza, John. 1984. "Who Is Playing What: A Demographic Study." Public Gaming Magazine
(April), 36-72.
Peterson, Virgil W. 1951. Gambling: Should It Be Legalized? Chicago, Illinois: Charles C.
Thomas Publishing.
Piliavin, Irving, and Michael Polakowski. 1990. Who Plays the Lottery? A Comparison of Patterns
in Wisconsin and the Nation. Institute for Research on Poverty Special Report no. 50,
University of Wisconsin-Madison.
Rosecrance, John. 1988. Gambling without Guilt. Pacific Grove, California: Brooks-Cole
Publishing Company.
-_._~--_._-- ---_..._-------------------_.