Embed Size (px)
Citation preview

1
Understanding the role of ion interactions in soluble salt flotation
Orhan Ozdemir1, Hao Du
2, Stoyan I. Karakashev
1,a, Anh V. Nguyen
1,b, M.S. Celik
3 and Jan D.
Miller4,b
1School of Chemical Engineering, The University of Queensland, Brisbane, Queensland 4072,
Australia.
2National Engineering Laboratory for Hydrometallurgical Cleaner Production Technology,
Institute of Process Engineering, Chinese Academy of Sciences, Beijing, China, 100190.
3Department of Mineral Processing Engineering, Istanbul Technical University, Istanbul,
34469, Turkey.
4Department of Metallurgical Engineering, University of Utah, Salt Lake City, Utah 84112,
USA.
Abstract
There is anecdotal evidence for the significant effects of salt ions on the flotation
separation of minerals using process water of high salt content. Examples include flotation of
soluble salt minerals such as potash, trona and borax in brine solutions. Although some of the
effects are expected, some do not seem to be encompassed by classical theories of colloid
science. Several experimental and modeling techniques for determining solution viscosity,
surface tension, bubble-particle attachment time, contact angle, atomic force microscopy, sum-
frequency vibrational spectroscopy and molecular dynamics simulation have been used to
provide further information on air-solution and solid-solution interfacial phenomena, especially
the interfacial water structure due to the presence of dissolved ions. These studies indicate that
the ion specific effect is the most significant factor influencing flotation in brine solutions.
Key words: flotation, soluble minerals, saline/brine solutions, dissolved ions, ion specific
effect.
a
Current address: Department of Physical Chemistry, Sofia University, 1 James Bourchier
Avenue, Sofia 1126, Bulgaria
b
Corresponding authors: Emails [email protected] and [email protected]
UU
IR Author M
anuscript UU
IR Author M
anuscript
University of Utah Institutional Repository Author Manuscript

2
1. Introduction
Froth flotation is one of the most important separation methods whereby hydrophobic
mineral particles are captured by air bubbles and removed from the slurry into a froth phase.
Particulate separations by flotation are of considerable significance in many areas of
technology ranging from water treatment and materials recycling, to the mining and
construction materials industries. Since froth flotation involves physico chemical phenomena at
the solid/water (S/W) and at the air/water (A/W) interfaces, surface chemistry principles play a
significant role in the development of improved flotation technology.
Soluble salt minerals (potash, trona, borax, etc.) are essential raw materials for the
production of many different commodities; fertilizers, magnesium metal, magnesium oxide,
soda ash, baking soda and many boron chemicals. These soluble mineral resources can be
processed using flotation technology and, in fact, the use of flotation technology is critical for
the potash industry. Since the flotation process for soluble minerals must be carried out in
saturated solutions due to the high solubility of these salt minerals, the interfacial water
structure is influenced and this affects collector adsorption at salt surfaces.
Dissolved ions in solutions can inhibit or activate the floatability of minerals due to their
effect on the properties of the solutions and interfaces involved. The ions present at relatively
high concentrations can significantly impact the colloidal interactions between bubbles and
particles during flotation. The most important example, perhaps, for the effect of the dissolved
ions in flotation is the soluble salt flotation of minerals such as potash, trona and borax. Since
these minerals are soluble in water, a saturated solution is used to prevent solubilization of the
floated salt particles from the gangue particles. Therefore, it is important to understand how the
dissolved ions behave in solutions and at the interfaces. For instance, the flotation of potash
minerals has to be carried out in a saturated brine of about 5 M of halite (NaCl) and sylvite
(KCl). The highly concentrated salt solutions influence the bulk and interfacial water structure
such that adsorption of flotation chemicals (e.g., insoluble collectors of long chain amines) at
the minerals surfaces and air bubbles (Burdukova et al., 2009; Cheng et al., 2008). At high salt
concentration, electrostatic interactions cease and thus zeta potential is almost zero, and the
solubility of collectors is limited.
Fundamental understanding for the flotation of soluble salts is limited when compared
with other flotation systems, e.g., oxides, silicates, sulphides and semisoluble salt minerals. For
instance, flotation experiments of soluble alkali halide salts with dodecylamine hydrochloride
(DAH) and sodium dodecylsulphate (SDS) collectors have demonstrated that KCl can be
floated with both cationic (DAH) and anionic (SDS) collectors. However, NaCl (halite) cannot
be floated with either of the collectors (Hancer et al., 2001). The electrical double-layer theory
fails to explain the floatability of NaCl and KCl crystals in these saturated solutions. It is
shown in the next section that the structure of water induced by the salt ions determines the salt
floatability.
Borax (Na2B4O7.10H2O) is another soluble salt, which must be upgraded to about 35%
B2O3 for the production of basic chemicals, such as boric acid. Boron minerals; colemanite
(Ca2B6O11.5H2O), ulexite (NaCaB5O9.8H2O), and kernite (Na2B4O7.4H2O), exhibit a spectrum
of chemical compositions with cations ranging from monovalent to multivalent ions. The type
and valence of the cation dictate the solubility of the minerals and in turn their electrokinetic
behavior. Borates release a number of species upon dissolving in water such as B4O72-
. The
ions released from boron minerals have been shown to interact with collectors to form
insoluble surface precipitates.
UU
IR Author M
anuscript UU
IR Author M
anuscript
University of Utah Institutional Repository Author Manuscript
3
The primary source of sodium carbonate (soda ash) in the United States consists mainly
of trona, sodium sesquicarbonate (Na2CO3.NaHCO3·2H2O), containing minor undesirable
gangue materials. Since sodium carbonate (Na2CO3) and bicarbonate (NaHCO3) are the main
constituents of trona, most of the studies have focused on the flotation of carbonate and
bicarbonate salts (Ozcan and Miller, 2002). Micro-flotation studies with carbonate salts
(Na2CO3 and NaHCO3) showed that contrary to the strong flotation of NaHCO3 with both
anionic and cationic collectors, Na2CO3 does not float at all (Ozcan and Miller, 2002).
In the past, the flotation chemistry of soluble salts has received relatively little attention
perhaps due to experimental difficulties such as high ionic strength, high viscosity and high pH
in the case of trona and borax minerals. More recently efforts have been made to explain the
mechanism of collector adsorption in soluble salt flotation systems. A number of experimental
and modeling techniques have been used to develop a better understanding of the effect of
dissolved salts on the flotation of soluble salt minerals as exemplified above.
In this paper, we use the results obtained by different methods to review the role of ion
interactions in the flotation of soluble salts. The available experimental results have provided a
better understanding of the flotation behavior of many systems, including potash, trona, and
borax. Possible mechanisms and practical implications will be discussed to highlight the
significance of ion interactions in brine solutions.
2. Flotation of typical soluble salts
The flotation process for soluble salt minerals such as potash, trona and borax is carried
out in saturated solutions due to their high solubility. Such high salt concentration appears to
have a significant effect on the interfacial water structure which influences the collector
adsorption at the salt surface and also has an impact on the adsorption of collector at the
surface of insoluble mineral components of the salt resource.
2.1 Potash flotation
Potash ores are a mixture of sylvite (KCl) and halite (NaCl) with water-insoluble
minerals such as clay and carbonate minerals. Potash is widely used as fertilizer in the
agriculture industry. Other uses for potash are glass manufacturing, soaps, plastics and
pharmaceuticals (Perucca, 2003). Most of the potash ores in the world are concentrated by
froth flotation.
Although there have been many studies on the flotation behavior of various soluble salts
in their saturated solutions, the collector adsorption mechanism at the surface of soluble salts
minerals is still not clearly explained (Rogers and Schulmann, 1957; Schubert, 1988; Miller
and Yalamanchili, 1994; Laskowski, 1994; Hancer et al., 1997; Hancer and Miller, 1999;
Hancer and Miller, 2000; Burdukova and Laskowski, 2009). There have been many models
proposed to explain the flotation behavior of soluble salts in their saturated solutions such as
ion exchange model (Fuerstenau and Fuerstenau, 1956), a heat of solution model (Rogers and
Schulman, 1957), and a surface charge-ion pair model (Schubert, 1988). Recently, significant
progress has been achieved in the areas of soluble salt flotation chemistry particularly by Miller
and his co-workers (Hancer et al., 2001; Hancer and Miller, 2000; Miller et al., 1992;
Yalamanchili et al., 1993). Subsequent research by Hancer showed that consideration of
hydration phenomena at salt crystal surfaces provided a better explanation for the flotation of
soluble salts even when the collector charge is the same as the salt (Hancer et al., 2001).
As seen in Figures 1 and 2, KCl can be floated with both cationic (dodecylamine
hydrochloride) and anionic (sodium laurate) collectors. However, NaCl (halite) cannot be
floated with either of the collectors (Miller et al., 1992). As mentioned above, in brines the
double layer thickness is very small at salt surfaces, which make measurement of the surface
UU
IR Author M
anuscript UU
IR Author M
anuscript
University of Utah Institutional Repository Author Manuscript

4
charge under these circumstances difficult. Nevertheless, surface charge measurements of salt
minerals were first made using a nonequilibrium electrophoretic technique (Miller et al., 1992).
This study showed that KCl has a negative surface charge, whereas NaCl has a positive surface
charge and these results were used to explain the flotation of KCl from NaCl with 12C amines.
According to this analysis, the positively charged amine collector colloid adsorbs on negatively
charged KCl particles, while there was no adsorption of the cationic collector at the positively
charged NaCl particles (Yalamanchili et al., 1993).
Figure 1. Flotation recovery of KCl and NaCl as a function of dodecylamine hydrochloride
concentration (Miller et al., 1992).
Figure 2. Flotation recovery of KCl and NaCl as a function of sodium laurate concentration
(Miller et al., 1992).
UU
IR Author M
anuscript UU
IR Author M
anuscript
University of Utah Institutional Repository Author Manuscript
5
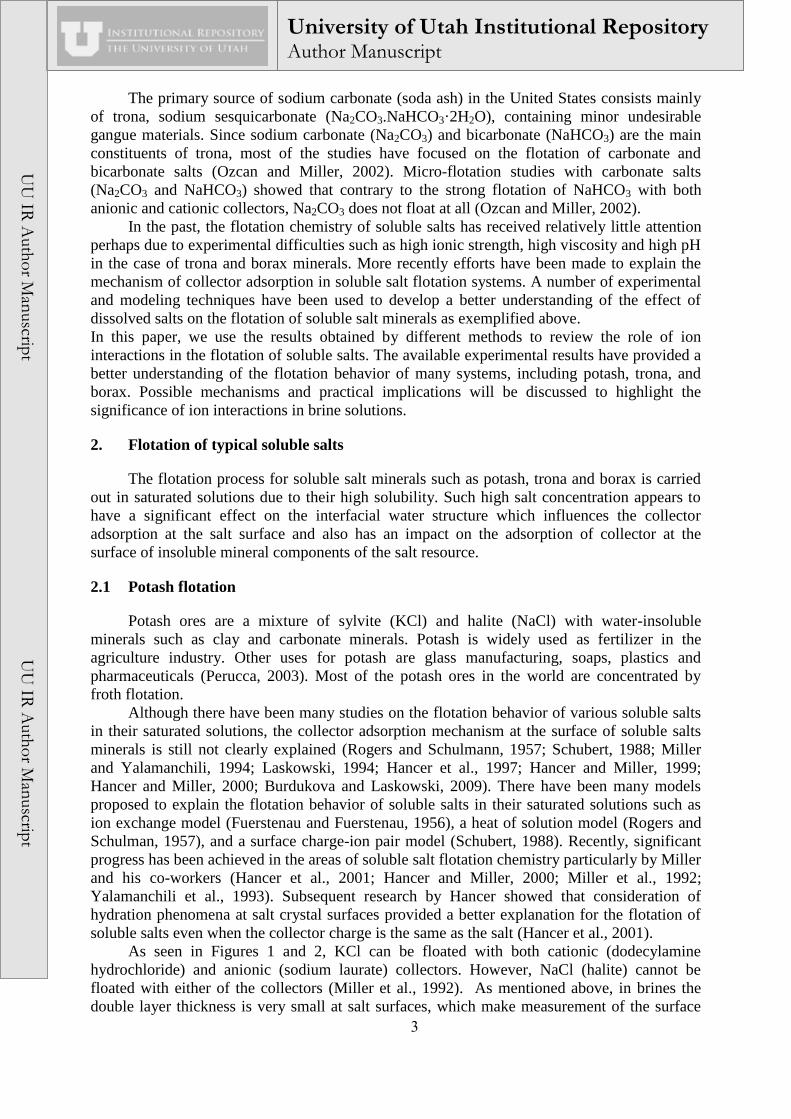
Unfortunately this theory could not answer the question of why negatively charged KCl
particles are also floated with 12C anionic collectors such as SDS. Subsequently research by
Hancer showed that consideration of hydration phenomena at salt surfaces provides a better
explanation for the flotation of alkali halide salts even when the collector charge is the same as
the salt (Hancer et al., 2001). These studies and the analysis of surface hydration indicate that a
salt may be either a water structure maker or a water structure breaker. If the salt serves as a
structure maker for water, the water molecules will be strongly bonded at the salt surface and
the adsorption of collector at the hydrated surface is prevented. As is well known, collectors
generally must adsorb at the particle surface in order to create a hydrophobic surface state for
flotation. Unlike the structure maker salts, the structure breaker salts have a tendency to destroy
the structure of water at the salt surface; thus a collector may more easily reach the surface,
create the hydrophobic surface state and thus allow for the flotation of such salts. Drawings
which illustrate these cases are presented in Figures 3 and 4, respectively.
Salt Surface
Structure MakerStructure Maker
Na+
Na+
Na+
Na+ Na+
Na+
Na+
Na+
Na+
Na+
Na+
Cl -
Cl -
Cl -
Cl -
Cl -
Cl -
Cl -
Cl -
Cl -
Cl -
Cl -
Figure 3. Collector Adsorption does not occur at the NaCl Surface for 12C amine and sulfate
collectors (NaCl is a water structure maker) (Hancer et al., 2001).
UU
IR Author M
anuscript UU
IR Author M
anuscript
University of Utah Institutional Repository Author Manuscript

6
Salt Surface
Structure BreakerStructure Breaker
K +
Cl -
Cl -
Cl -
Cl -
Cl -
Cl -
Cl -
Cl -
Cl -
Cl -
Cl -
K +
K +
K +K +
K +
K +
K +
K +
K +
K +
K +
K +
K +
K +
K +
Figure 4. Collector adsorption does occur at the KCl surface for 12C amine and sulfate
collectors (KCl is a water structure breaker) (Hancer et al., 2001).
The flotation response of the selected salts is presented in Table 1. As seen in Table 1,
salts that can be floated with either the cationic (DAH) or anionic collectors (SDS) are the
water structure breakers whereas salts that are classified as water structure makers stabilize the
interfacial water structure at the salt-brine interface and the flotation of these salts with either
collector is not possible.
Table 1. Correlation of floatability of alkali halide salts with water structure (Hancer 2001)
NF: No flotation; F: flotation
A molecular dynamics simulation (MDS) study regarding water structures at LiCl, NaCl,
KCl and RbCl salt surfaces in their saturated brine solutions is reported by Du and Miller (Du
and Miller, 2007b; Du et al., 2007a). This study showed that water molecules are highly
ordered at NaCl and LiCl surfaces with distinct orientations due to strong interaction between
water molecules and small surface cations, Na+ and Li
+. In contrast, water molecules oriented
at KCl and RbCl surfaces randomly due to weak interaction between water molecules and large
UU
IR Author M
anuscript UU
IR Author M
anuscript
University of Utah Institutional Repository Author Manuscript

7
surface cations such as K+ and Rb
+. This study also showed that the orientation of water
molecules at the salt surfaces is not as simple as shown in the drawings.
2.2 Borax flotation
Borax (Na2B4O7.10H2O), one of the most important boron minerals in the world,
contains about 20% B2O3 when mined and must be upgraded to about 35% B2O3 for the
production of basic chemicals, such as boric acid. The most commercially important boron
minerals beside borax are colemanite (Ca2B6O11.5H2O), ulexite (NaCaB5O9.8H2O), and kernite
(Na2B4O7.4H2O). Apart from these minerals, a considerable amount of boron compounds is
also produced from boron-rich lakes (Harben and Dickson, 1985).
Boron compounds are used in the manufacture of a variety of industrial products
including advanced materials. World reserves of boron minerals are estimated at 1,241Mt
B2O3, sufficient to meet world demand at current levels for over 600 years (Roskill, 2010). The
United States and Turkey are the world’s two largest producers of boron compounds. Together,
these two countries make up about 90% of the world’s boron reserves (Harben, 1995).
Boron minerals show a spectrum of solubilities depending upon the cations in the lattice
structure. While colemanite and ulexite are classified as semi-soluble minerals, borax and
kernite are soluble minerals. Borax is normally concentrated from its saturated brine by
scrubbing followed by classification. The friable nature of boron minerals, however, tends to
produce a large amount of fines mostly below 0.2 mm which are usually discarded as waste.
Recovery of these fines is possible only through particle separation processes such as flotation.
In most boron ores, the major accompanying gangue minerals are montmorillonite type clays
and carbonate minerals, and thus a common problem encountered in both classes of boron
minerals is the presence of significant amounts of clay type minerals which adversely affect
flotation recoveries in the form of slime coatings (Akin et al., 1997).
Despite the successful application of flotation technology in the potash industry, flotation
has not yet been well developed for borax recovery. This may be attributed to inherent
difficulties such as high ionic strengths, and particularly the presence of clay minerals, which
act as persistent slimes. While Miller and his co-workers provided new insight into explaining
the selective flotation of several soluble salt minerals from their saturated brines, Celik and his
associates have identified some particular characteristics of the flotation behavior of boron
minerals with cationic and anionic collectors (Celik et al., 1993; Celik and Bulut, 1996; Celik
et al., 2002; Celik and Yasar, 1995). For example, as seen in Figure 5, both surfactants SDS
and DAH float borax in the same manner at concentrations above 1×10⁻⁵
M. The lattice
structure of borax is composed of Na+ ions. This characteristics feature imparts high solubility
to borax. Although the collectors used are usually less soluble in concentrated brine solutions,
the floatability of boron minerals is enhanced in the presence of brine. The results indicate that
there appears to be a direct correlation between the onset of flotation and that of hemimicelle
formation. For borax it provided that the extent of CMC reduction in such saturated brines is
known. It is well known that the CMC of sulfonate shifts by an order of magnitude in the
presence of 0.1 M NaCl solutions. The extent of CMC reduction in concentrated brines would
be even greater. Therefore, it is possible that the onset of borax flotation may also coincide
with the formation of hemimicelles.
UU
IR Author M
anuscript UU
IR Author M
anuscript
University of Utah Institutional Repository Author Manuscript

8
Figure 5. Flotation recoveries of colemanite and borax vs. the concentration of anionic and
cationic surfactants at pH 9.3 (Celik et al., 1993).
The most prominent one is Na+ in the structure of borax. Apart from the effect of
monovalent ions in compressing the double layers of minerals, they also modify the bulk water
structure and micellization of collectors and consequently enhance surface activity of
collectors. There are controversial opinions about the role of monovalent ions in the floatability
of minerals. While some assert that monovalent cations and anions depending on their water-
breaking and-making structure modify the bulk structure of water and extrapolate the same
effect all the way to the surface, others emphasize adsorption of monovalent ions at solid
surfaces and their subsequent interaction with water (Clark and Cooke, 1968; Colic et al.,
1997; Hancer et al., 2001). The previous results showed that for all boron minerals the
potential determining ions are the constituent lattice ions, i.e., B4O72-
and the counterion, as
well as the H+ and OH
- ions. The addition of SDS and DAH marginally affects the zeta
potential of colemanite with pH. Especially, zeta potential of amine adsorbed onto borax
revealed an abrupt increase in zeta potentials above critical DAH concentrations. It is generally
accepted that monovalent ions are indifferent electrolytes and thus only function in the
compression of an electrical double layer; this compression ceases at about 1 M monovalent
salt addition where the thickness of the electrical double layer is on the order of the ionic size.
Some researchers believe that the electrostatic interactions sharply decay above 0.1 M of salt
addition. At monovalent salt levels higher than 0.1 M and especially at 1 M, the electrostatic
mechanism may be conveniently ruled out.
Accordingly, smaller, more strongly hydrated ions would produce a larger short-range
repulsive force because of the greater energy required to dehydrate the smaller cations (Colic et
al., 1997). The only plausible mechanisms that can be proposed under such high ionic strength
conditions are ion exchange or hydrogen bonding. Addition of monovalent salts is known to
reduce the CMC and consequently dissolve salts of multivalent ion precipitates at lower SDS
levels (Celik and Somasundaran, 1988). The precipitation appears to start at 0.1 M salt
concentration and undergoes dissolution with increasing of the salt concentration.
UU
IR Author M
anuscript UU
IR Author M
anuscript
University of Utah Institutional Repository Author Manuscript

9
2.3 Trona flotation
Trona (sodium sesquicarbonate, Na2CO3.NaHCO3.2H2O) is the major source of soda ash
in the United States. Soda ash, the common name for sodium carbonate, is one of the most
widely used raw materials in the U.S. (Kostick, 2004), and the largest use of soda ash is in the
production of glass. Since soda ash has a low melting point, the use of soda ash allows silica to
be melted at low temperatures and therefore easily handled and formed (Garrett, 1991). This
situation accounts for the important dependence that the glass industry has on soda ash
production.
The largest known trona deposits in the United States are located in Green River,
Wyoming where 14.5 million tons were mined in 2003 and the total estimated value of the
domestic soda ash produced was $800 million (Kostick, 2004). Trona is not so common and
significant deposits are found only in a few locations; Africa, China, Turkey, and Mexico.
None of these trona resources compare to the vast trona deposit of the Green River Basin in the
U.S.
Trona ore consists mainly of trona, including minor undesirable gangue materials a
number of double carbonate salts in addition to dolomitic shale, quartz and clays (Garrett,
1991). In the industry, conventional production of soda ash from trona is a complex process
with many steps to eliminate the insoluble components of the trona ore. Conventional soda ash
production involves the following unit operations; dissolution, clarification, filtration,
calcination and crystallization in different order depending on the process design. The
insoluble content of the trona ore plays an important role. The insoluble components of the
trona ore must be eliminated. In addition production of soda ash has a significant energy
demand due to calcination and crystallization operations. In this regard, mining and processing
costs, particularly energy costs, are higher than desired and these costs have a significant
impact on the cost for production.
With the present industrial practice, there is no particle separation process to remove
these insoluble minerals prior to thermochemical processing. Recently, a research at the
University of Utah showed that the removal of gangue minerals from trona ore could be
accomplished by froth flotation (Ozdemir et al., 2010; Wang et al., 2002). In this current
research appropriate conditions for trona flotation technology were established from
exploratory bench-scale experiments, and the conditions obtained from the bench scale
experiments were also applied to pilot scale flotation tests (Ozdemir et al., 2010).
Trona is a complex salt of sodium carbonate and sodium bicarbonate. Despite many
studies regarding the flotation of soluble salts, there is a little information about the flotation of
carbonate salts. One research study (Ozcan and Miller, 2002) reports that the flotation of
soluble carbonate salts is dependent on their water structure breaking or making properties
(Figure 6). It was found that the structure breaking sodium bicarbonate (NaHCO3) salt can be
floated with both 12C anionic and cationic collectors, but the structure making sodium
carbonate (Na2CO3) salt does not float due to the inability of the collector to break the
organized water structure and at the surface of Na2CO3. Also because trona
(Na2CO3.NaHCO3.2H2O) is a structure maker, flotation is generally difficult with 12C
collectors. In the trona brine, the structure making character of sodium carbonate dominates
and direct flotation of trona with 12C collectors is impossible. These facts support the use of a
reverse flotation strategy to float the gangue minerals by flotation and thus produce a trona
concentrate.
UU
IR Author M
anuscript UU
IR Author M
anuscript
University of Utah Institutional Repository Author Manuscript

10
Figure 6. Flotation recovery of the sodium bicarbonate salt as a function of collector
concentration at room temperature, pH 8.3 (Ozcan and Miller, 2002).
3. Bulk solution properties of ions in flotation systems
3.1 Viscosity of salt solutions
It has been long established that the dissolved ions in water increase or decrease water-
water interactions (Desnoyers and Perron, 1972). Ions of dissolved salts can increase or
decrease the solution viscosity. The solution viscosity is an important macroscopic parameter
which significantly affects the solid and gas dispersions, the bubble rise velocity and the
drainage of both foam and wetting films in flotation. The viscosity of salt solutions is also used
often to classify water-soluble salts into structure making (cosmotropes) and structure breaking
(chaotropes).
We therefore measure the viscosity of the salt solutions to provide us with information
about their structure making/breaking character. For example, Figures 7 shows the relative
viscosity values of selected salts as a function of salt concentration. As seen from Figure 1, the
salts such as LiCl, NaCl, NaI, LiI and KF generally result in a viscosity greater than 1.
However, the salts such as KCl, KI, CsI, RbCl, and KI result in viscosities less than 1. It can be
concluded from these results that salts of small ions such as Li+, Mg
2+, F
-, and Cl
- which
increase the viscosity of aqueous solutions, are considered structure makers and those salts of
large ions such as Cs+, Rb
+, and I
- decreasing the solution viscosity are called the structure
breaking (chaotropes) (Jiang and Sandler, 2003a; Kaminsky, 1957).
For example, salts such as NaCl increasing the solutions viscosity show the structure
making characteristic. However, salts such as KCl decreasing the solution viscosity, show
structure breaking character.
UU
IR Author M
anuscript UU
IR Author M
anuscript
University of Utah Institutional Repository Author Manuscript

11
Figure 7. Viscosity (relative to water) of structure making (a) and breaking (b) salt solutions
(Hancer et al., 2001).
The solution viscosity was also found to correlate well with the floatability of carbonates
and bicarbonates in trona flotation (Ozdemir et al., 2007). For example, Figure 8 shows the
viscosity values of carbonate and bicarbonate solutions as a function of salt concentration. The
viscosities of the salt solutions increase with increasing salt concentration up to the saturated
concentrations. The dependence of the viscosity on concentration for Na2CO3 and K2CO3 is
strong and highly non-linear. The viscosity for NaHCO3 and NH4HCO3 solutions, on the other
hand, shows a significantly weaker dependence on salt concentration. These results again
reveal that the Na+ has a stronger structure making effect than K
+. In fact the lower viscosity
for the K2CO3 solution may reflect the structure breaking influence of the K+ ion over the
strong structure making effect of the CO32-
. Since carbonate solutions increase considerably the
viscosity of water, Na2CO3 and K2CO3, as a general concept, can be classified as strong
structure maker salts. Unlike carbonates, bicarbonates, NaHCO3 and NH4HCO3, only slightly
increase the viscosity of their solutions. On this basis, they can be classified as weak structure
maker salts. It is interesting to note that carbonates cannot be floated with either DAH or SDS.
On the other hand, bicarbonates show high floatability with both collectors (Ozcan and Miller,
2002). The high viscosity values of carbonate salt solutions at saturation could be attributed to
the difficulty of floating carbonate salts. In contrast, the lower viscosity of the saturated
bicarbonate salt solutions can be responsible for their good floatability. It is very interesting
that bicarbonates here are found to be weak water structure makers and therefore expected to
hinder the adsorption of collectors on their surfaces. However, their floatability with both
cationic and anionic collectors do not agree with the findings of the previous work on alkali
halide salts (Hancer et al., 2001). These results suggest that some critical level of structure
making can be tolerated for flotation with 12C surfactants. The phenomena occurring at the
water–salt interface are complex and the flotation response cannot always be fully described by
consideration of just one factor.
UU
IR Author M
anuscript UU
IR Author M
anuscript
University of Utah Institutional Repository Author Manuscript

12
0.0
0.4
0.8
1.2
1.6
2.0
0.0 0.5 1.0 1.5 2.0 2.5
Vis
co
sit
y, c
St
Concentration, M
NaHCO3
NH4HCO3
0.0
1.0
2.0
3.0
4.0
5.0
0.0 1.0 2.0 3.0 4.0 5.0 6.0
Vis
co
sit
y, c
St
Concentration, M
Na2CO3
K2CO3
Figure 8. Viscosity of carbonate and bicarbonate solutions as a function of concentration at
23oC (Ozdemir et al., 2007).
3.2 Results of spectroscopy studies
The effect of dissolved ions on water structure at the molecular level can also be
determined experimentally by vibrational (IR and Raman) spectroscopy. Vibrational spectra
gives direct evidence about the changes in the strength of the hydrogen bonds between water
molecules, and therefore reflects the interaction between dissolved salt ions and water
molecules (Nickolov and Miller, 2005). Depending on the salt type, the interactions will
change (Figure 9). It has been proved that some ions showing structure making effect on water
structure increased the width of the O-D band and shifted its peak to lower wavenumbers while
others showing structure breaking effect on water structure decreased the width of the O-D
band and shifted its peak to higher wavenumbers (Nickolov and Miller, 2005).
Figure 9. O-D stretching band spectra of solutions of KF (left) and KI (right) in 4w% D2O in
H2O mixtures at different salt.
UU
IR Author M
anuscript UU
IR Author M
anuscript
University of Utah Institutional Repository Author Manuscript

13
The results with carbonates and bicarbonates (Figure 10) also showed a similar trend in
that the water structure was significantly affected with increasing sodium carbonate
concentration. On the other hand, the water structure in the presence of NaHCO3 increased
only slightly (Ozdemir et al., 2007).
Figure 10. OD stretching band in carbonate and bicarbonate solutions containing 4% D2O as at
different salt levels.
3.3 Results of molecular dynamics (MD) simulations
Molecular dynamics (MD) simulation is a fundamental tool which can be used to explore
water/water, water/ion and ion-ion interactions, and to elucidate the influence of salts on the
dynamic properties of brine solutions (Berendsen, 1988; Berendsen and Van Gunsteren, 1984;
Dang, 1992a; Haile, 1997). In the past decade, much research has been devoted to the study of
water structure, as well as the dynamic and thermodynamic characteristics of electrolyte
solutions (Chowdhuri and Chandra, 2001; Chowdhuri and Chandra, 2003; Dang, 1992b; Dang,
1994; Dang, 1995; Dang and Smith, 1993; Dang and Smith, 1995; Koneshan et al., 1998a;
Koneshan et al., 1998b; Lee and Rasaiah, 1994; Lee and Rasaiah, 1996; Lynden-Bell and
Rasaiah, 1996; Smith et al., 1997; Uchida and Matsuoka, 2004). Also efforts have been made
to characterize the energy parameters of various ions (Dang, 1992a; Dang, 1992b; Smith and
Dang, 1994a; Smith and Dang, 1994b; Smith et al., 1997). The thermodynamics of solvation of
simple ions as a function of their size, charge, and charge inversion, have been studied by MD
simulation at infinite dilution extensively (Koneshan et al., 1998b), and different types of
hydration have been identified and discussed in relation to the energy and entropy of solvation.
Systematic investigations by MD simulation of concentrated alkali halide solutions with
respect their effect on water structures and the physicochemical properties of the solutions are
limited.
3.3.1. Water structure
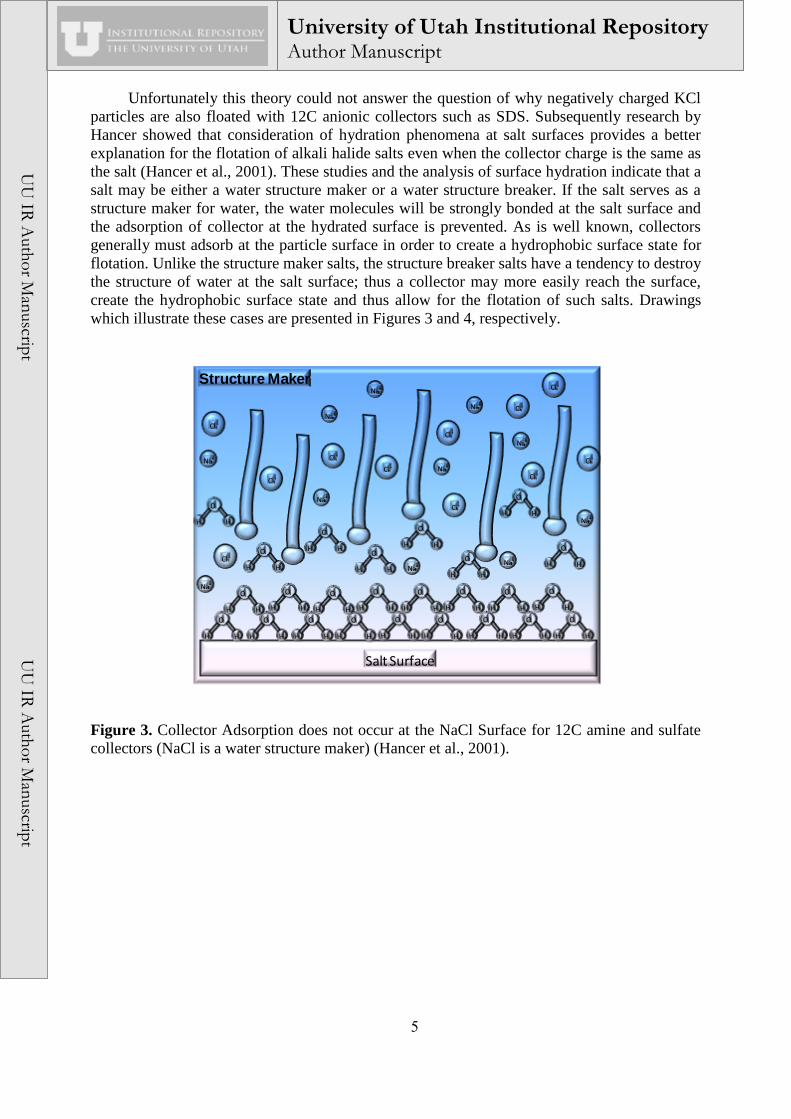
MD simulations of LiCl, RbCl, and CsI solutions have revealed that water structure is
dependent on the ions present in the solution as shown in Figure 11, which summarizes the
effect of different ions and their concentrations in solution on water/water coordination. In pure
water, water molecules form dynamic tetrahedral networks with average coordination of 4.5.
When Li+ ions are present, due to their large local electric field, water molecules are
UU
IR Author M
anuscript UU
IR Author M
anuscript
University of Utah Institutional Repository Author Manuscript
14
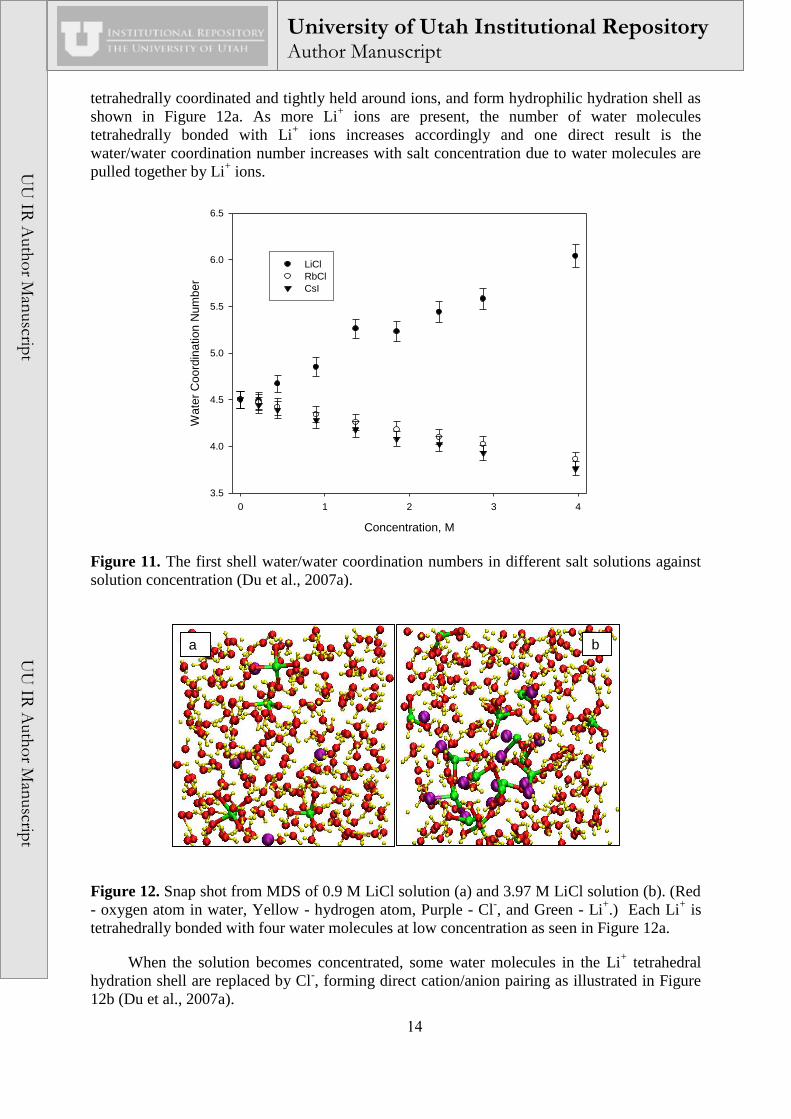
tetrahedrally coordinated and tightly held around ions, and form hydrophilic hydration shell as
shown in Figure 12a. As more Li+ ions are present, the number of water molecules
tetrahedrally bonded with Li+ ions increases accordingly and one direct result is the
water/water coordination number increases with salt concentration due to water molecules are
pulled together by Li+ ions.
Concentration, M
0 1 2 3 4
Wate
r C
oord
ination N
um
ber
3.5
4.0
4.5
5.0
5.5
6.0
6.5
LiCl
RbCl
CsI
Figure 11. The first shell water/water coordination numbers in different salt solutions against
solution concentration (Du et al., 2007a).
a b
Figure 12. Snap shot from MDS of 0.9 M LiCl solution (a) and 3.97 M LiCl solution (b). (Red
- oxygen atom in water, Yellow - hydrogen atom, Purple - Cl-, and Green - Li
+.) Each Li
+ is
tetrahedrally bonded with four water molecules at low concentration as seen in Figure 12a.
When the solution becomes concentrated, some water molecules in the Li+ tetrahedral
hydration shell are replaced by Cl-, forming direct cation/anion pairing as illustrated in Figure
12b (Du et al., 2007a).
UU
IR Author M
anuscript UU
IR Author M
anuscript
University of Utah Institutional Repository Author Manuscript

15
As the solution becomes more concentrated, some of the water molecules participating in
the Li+ ion hydration shell are replaced by negatively charged Cl
- ions, as shown in Figure 12,
hence, the hydration number of Li+ ions decreases as the solution concentration increases. On
the other hand, the water molecules in the Li+ tetrahedral hydration shell are counted into the
hydration shell of Cl- ion. Therefore, the larger the hydration number of the Cl
- ions increases
with solution concentrations.
For larger cations such as Rb+ and Cs
+, the size of the hydration shell increases
accordingly, and is larger than that of the pure water cluster. Similarly, owing to their large
size, the Cl- and I
- hydration shells are much larger than that of the pure water cluster. For very
large cations such as a Cs+ ion, the local electric fields at the ion surface have decreased
significantly, and behave more like uncharged particles (Koneshan et al., 1998b). Hence, as
the size of the cation increases, the dominating electrostatic hydrophilic hydration of small ions
is gradually replaced by hydrophobic hydration of large ions where hydrogen bonded water
molecules form a disordered cage surrounding the ions as can be seen in Figure 13a.
a b
Figure 13. Snap shot from MDS of 0.9 M CsI solution (a) and 3.97 M CsI solution (b). (Red -
oxygen atom in water, Yellow - hydrogen atom, Purple - I-, and Green - Cs
+.) Water molecules
form hydrophobic cages around cations, and stable hydration shells around anions.
At high solution concentration, cations and anions pair up minimizing the number of
water molecules in the primary hydration shell around ions (Du et al., 2007a).
For water molecules composing the cages, because one position has been taken by these large
ions, only three other water molecules can be hydrogen bonded to them and counted as primary
waters coordination, thus, the water/water coordination number of these cation bonded water
molecules is less than that of pure water cluster. As more ions are in the solution, more water
molecules will be around ions, and consequently, the water/water hydration number decreases
monotonically with salt concentrations. When hydrophobic hydration dominates, water
molecules are loosely bonded to the ion and the radius of the primary hydration shell is large,
allowing more water molecules to be accommodated. As the number of ions increases in the
solution, there will be fewer water molecules available to complete the cages around ions, and
the cations and anions will pair up to include less water molecules in their hydration shells
which are fragile and may break, as observed from Figure 13b.
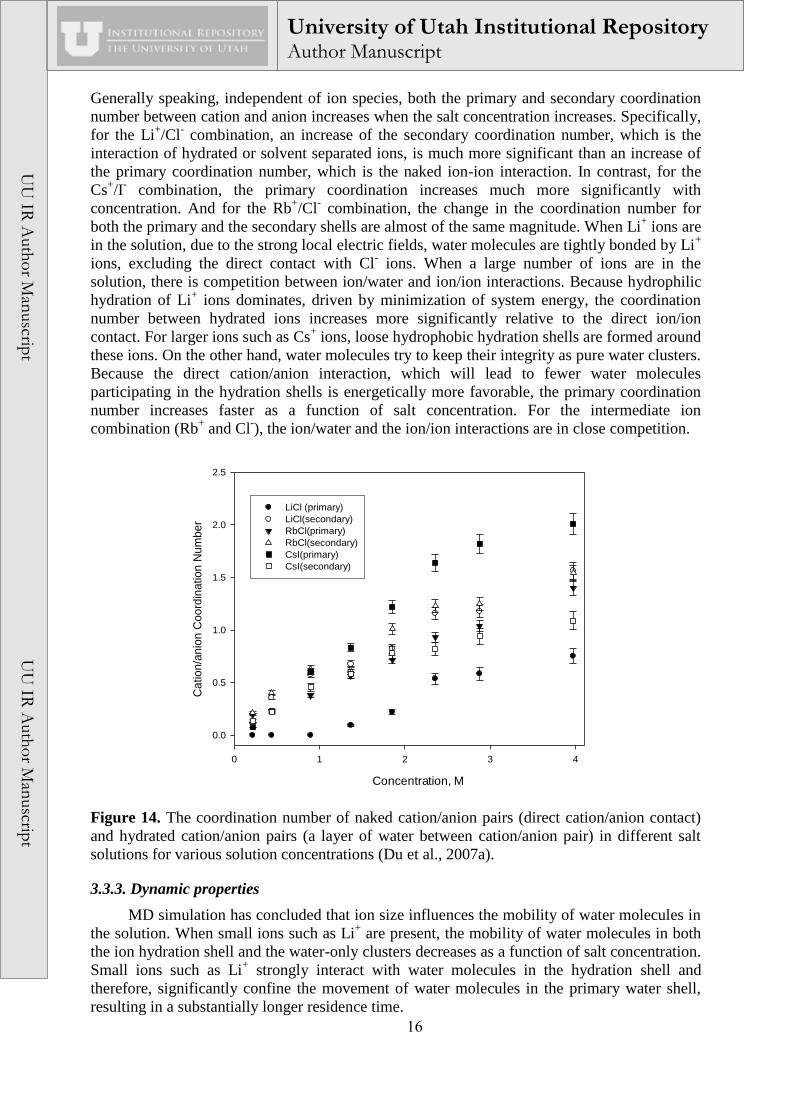
3.3.2. Cation/anion interactions
The cation/anion coordination number as a function of salt concentration is summarized
in Figure 14, where both the primary and secondary coordination numbers are presented.
UU
IR Author M
anuscript UU
IR Author M
anuscript
University of Utah Institutional Repository Author Manuscript
16
Generally speaking, independent of ion species, both the primary and secondary coordination
number between cation and anion increases when the salt concentration increases. Specifically,
for the Li+/Cl
- combination, an increase of the secondary coordination number, which is the
interaction of hydrated or solvent separated ions, is much more significant than an increase of
the primary coordination number, which is the naked ion-ion interaction. In contrast, for the
Cs+/I
- combination, the primary coordination increases much more significantly with
concentration. And for the Rb+/Cl
- combination, the change in the coordination number for
both the primary and the secondary shells are almost of the same magnitude. When Li+ ions are
in the solution, due to the strong local electric fields, water molecules are tightly bonded by Li+
ions, excluding the direct contact with Cl- ions. When a large number of ions are in the
solution, there is competition between ion/water and ion/ion interactions. Because hydrophilic
hydration of Li+ ions dominates, driven by minimization of system energy, the coordination
number between hydrated ions increases more significantly relative to the direct ion/ion
contact. For larger ions such as Cs+ ions, loose hydrophobic hydration shells are formed around
these ions. On the other hand, water molecules try to keep their integrity as pure water clusters.
Because the direct cation/anion interaction, which will lead to fewer water molecules
participating in the hydration shells is energetically more favorable, the primary coordination
number increases faster as a function of salt concentration. For the intermediate ion
combination (Rb+ and Cl
-), the ion/water and the ion/ion interactions are in close competition.
Concentraion, M
0 1 2 3 4
Cation/a
nio
n C
oord
ination N
um
ber
0.0
0.5
1.0
1.5
2.0
2.5
LiCl (primary)
LiCl(secondary)
RbCl(primary)
RbCl(secondary)
CsI(primary)
CsI(secondary)
Concentration, M
Figure 14. The coordination number of naked cation/anion pairs (direct cation/anion contact)
and hydrated cation/anion pairs (a layer of water between cation/anion pair) in different salt
solutions for various solution concentrations (Du et al., 2007a).
3.3.3. Dynamic properties
MD simulation has concluded that ion size influences the mobility of water molecules in
the solution. When small ions such as Li+ are present, the mobility of water molecules in both
the ion hydration shell and the water-only clusters decreases as a function of salt concentration.
Small ions such as Li+ strongly interact with water molecules in the hydration shell and
therefore, significantly confine the movement of water molecules in the primary water shell,
resulting in a substantially longer residence time.
UU
IR Author M
anuscript UU
IR Author M
anuscript
University of Utah Institutional Repository Author Manuscript

17
In contrast, for solutions containing large ions (CsI and RbCl), the ion/water electrostatic
interaction does not contribute significantly to immobilize the water molecules. Consequently,
the residence time of water molecules do not show a substantial change with solution
concentration. For large ions such as Cs+, Rb
+, and I
-, the local electric fields are weak as
discussed earlier, and water molecules in the primary hydration shell are more loosely bonded
to them. Thus they are more mobile and the residence time of water is shorter.
The changes of residence times support the observations of self-diffusion coefficients of
particles as a function of salt concentration as shown in Figure 15, which suggests that when
Li+ ions are present, the diffusion coefficients of water molecules in the solution decrease
significantly with salt concentration, and when Cs+ and I
- ions are present, there is no
significant change of the water diffusion coefficients with salt concentration.
Concentration, M
0 1 2 3 4
Diffu
sio
n C
oe
ffic
ient, 1
09m
2/s
ec
1.2
1.4
1.6
1.8
2.0
2.2
2.4
2.6
2.8
H2O/LiCl
H2O/RbCl
H2O/CsI
Figure 15. Self-diffusion coefficient of water molecules in water clusters for various solution
concentrations (Ref).
3.3.4. Viscosity
The viscosities calculated from our MD simulations of brine solutions as a function of
solution concentration are shown in Figure 16. As expected, the size of the ions has a
significant influence on the viscosity of the solution. When small ions are present (LiCl
solution), the system shear viscosity increases monotonically with solution concentration. As
the ion size increases (RbCl solution), the system viscosity shows very weak dependence on
the solution concentration. Further increasing in ion sizes (CsI solution), leads to an obvious
decrease of viscosity as a function of solution concentration. This variation of solution
viscosity as a function of ion size and solution concentration has also been observed
experimentally by several research groups (Hancer et al., 2001; Jiang and Sandler, 2003b), so
our simulations show the same trends.
In LiCl solution, Li+ ions interact strongly with either water molecules or corresponding
anions, and form stable tetrahedral structures, which contribute substantially to a “sticker”
system. Though Cl- ions, due to their large size, do not form strong bonds with water
molecules; the influence of cations is dominating. Consequently, the mobility of the solution
will decrease, and system shear viscosity, which describes mobility macroscopically, will
increase. The higher the solution concentration, the more significant role the Li+ ions play, and
UU
IR Author M
anuscript UU
IR Author M
anuscript
University of Utah Institutional Repository Author Manuscript

18
the higher the viscosity. In contrast, when large ions (Cs+ and I
-) are presented in the solution,
loose hydrophobic shells were formed around those ions, and the ion/water interaction is not as
strong as water/water interaction, accounting for the decrease in the system shear viscosity.
Concentration, M
0 1 2 3 4
Shear
Vis
cosity,
mpa*s
ec
1.0
1.5
2.0
2.5
CsI
LiCl
RbCl
Figure 16. Variation of system shear viscosity with solution concentration (Du et al., 2007a) Is
there any graph showing experimental and predicted viscosities?
The change of system viscosity with solution concentration as determined from MD
simulation in this study successfully compliments the experimental results reported in the
literature (Dang and Smith, 1995; Koneshan et al., 1998b), and provides an in-depth
understanding regarding the variation of viscosities as a function of ion sizes and salt
concentrations from a molecular perspective. For LiCl solutions, the system viscosity increases
monotonically with salt concentration due to the strong ion/water interactions in the solution.
As the ion size increases e,g. the case of RbCl, hydrophobic hydration becomes dominating,
and leads to negligible variation of system viscosity with salt concentration. Further increase in
the ion size to Cs+ and I
- revealed a noticeable decrease of system viscosity as a function of salt
concentration. The excellent agreement between the simulation results and the experimental
results for the variation of viscosity with ion size and concentration provides future information
to phenomenologically describe the behavior of particles in alkali halide solutions.
4. Effect of ions at air-water interfacial properties
4.1 Surface tension
The presence of salt ions in solution not only changes the properties of solid-water
interfaces but also the air–water interfaces, thus additionally effecting the interaction between
particles and bubbles during flotation. It is important to understand how these electrolytes
behave at the interfaces. As seen in Figure 17, most of the electrolytes increase the surface
tension of water with increasing salt concentration (Weissenborn and Pugh, 1996). An increase
in surface tension in the presence of electrolytes has been explained by negative adsorption of
ions at air-water interface, however, some electrolytes such as HCl, HNO3, etc., decrease the
surface tension of water so that they positively adsorb at the air-water interface.
UU
IR Author M
anuscript UU
IR Author M
anuscript
University of Utah Institutional Repository Author Manuscript

19
Ch
an
ge
in s
urf
ac
e te
ns
ion
re
lati
ve
to
wa
ter
(mN
/n)
Electrolyte concentration (M)
Figure 17. Effect of electrolyte on the change in surface tension relative to water for 1:1
electrolytes (Weissenborn and Pugh, 1996).
As mentioned before, the flotation of soluble salts must be carried out in their saturated
solutions. An interesting study about the surface tension of selected salts (NaCl, KCl, KI,
KNO3, NaF, and K2SO4) as a function of concentration up to their solubility limit showed that
the surface tension of the aqueous solutions increases with increasing salt concentration up to
their saturation points (Figure 18). It is interesting to note that the solubility of these salts play
a significant role on their surface tension values with a more soluble salt giving higher surface
tension at a given level of saturation (Ozdemir et al., 2009b). As mentioned before, NaCl and
NaF are structure makers. On the contrary, KCl, KI, KNO3, and K2SO4 are structure breaker
salts. It is evident that there is no correlation between the surface tension of these salts and their
structure making and breaking effect on the flotation response.
The surface tension experiments with carbonate (Na2CO3 and K2CO3) and bicarbonate
(NaHCO3 and NH4HCO3) solutions also showed the same trend that while carbonates
significantly increases the surface tension as the salt concentration increase, the increase in the
surface tension of NaHCO3 and NH4HCO3 solutions is not significant (Figure 19).
UU
IR Author M
anuscript UU
IR Author M
anuscript
University of Utah Institutional Repository Author Manuscript

20
70
72
74
76
78
80
82
84
0 2 4 6 8
Eq
uilib
iru
m S
urf
ace T
en
sio
n (m
N/m
)
Salt Concentration (M)
NaCl (5.2 M)
KCl (4.1 M)
KI (6.8 M)
KNO3 (3.5 M)
NaF (1 M)
K2SO4 (0.6 M)
Figure 18. Surface tension of salts versus concentration up to the point of saturation at 25oC
(Ozdemir et al., 2009b).
70
75
80
85
90
95
100
0 1 2 3 4 5 6
Eq
uilib
iru
m S
urf
ace T
en
sio
n (m
N/m
)
Salt Concentration (M)
K2CO3 (4.9 M)
Na2CO3 (2.3. M)
NH4HCO3 (2 M)
NaHCO3 (1.1. M)
Figure 19. Surface tension of carbonate and bicarbonate salts versus concentration up to the
point of saturation at 25oC (Ozdemir et al., 2006).
4.2 Sum-frequency vibrational spectroscopy (SFVS)
SFVS is a powerful nonlinear optical technique for investigating molecules at the salt
water-air interfaces. Figure 20 shows the SFVS spectra of pure water, saturated NaHCO3 and
saturated Na2CO3 solutions. The spectral feature of pure water as observed in the SFVS
UU
IR Author M
anuscript UU
IR Author M
anuscript
University of Utah Institutional Repository Author Manuscript

21
spectrum is similar to the previous studies at the same air/water interface (Gopalakrishnan et
al., 2005; Mucha et al., 2005; Shen and Ostroverkhov, 2006). Generally, three OH stretching
frequencies at ~3200, 3400, and 3700 cm-1
characterize the OH vibrations in water. The
spectrum of pure water indicates that the interfacial water structure consists of a partially
ordered and a partially disordered hydrogen bonding network. Compared to the spectrum of
pure water, the intensity of the “ice-like” peak at 3200 cm-1
slightly decreases in the spectrum
of the NaHCO3 solution, but significantly increases (~ by a factor of 4) in the Na2CO3 solution.
The increase in the SFVS intensity suggests that more polar-ordered hydrogen bonding water
network is formed at the surface of the Na2CO3 solution. In contrast, at the surface of the
NaHCO3 solution, a weakly ordered water structure is suggested. These results are in good
agreement with the surface tension of these salts.
2800 3000 3200 3400 3600 3800
0.0
.6
1.2
1.8
2.4
Frequency (cm-1
)
2800 3000 3200 3400 3600 3800
0.0
.3
.6
.9
1.2
2800 3000 3200 3400 3600 3800
SF
VS
Inte
nsi
ty (
arb
itrary
units
)
0.0
.3
.6
.9
1.2
2.3 M Na2CO3
1.1 M NaHCO3
H2O
Figure 20. The SFVS spectra for pure water, saturated sodium bicarbonate solution and
saturated sodium carbonate solution in the O-H stretching region at the air-liquid interfaces at
23oC (Du et al., 2008).
UU
IR Author M
anuscript UU
IR Author M
anuscript
University of Utah Institutional Repository Author Manuscript

22
4.3. Ion-specific effect on froth stability and thin liquid films (TLF)
4.3.1. Bubble coalesence in salt solutions
The density of the bubbles in froth is decisive for flotation. Therefore, the effect of the
inorganic salts on the froth stability was studied for the last four decades (Christenson and
Yaminsky, 1995; Craig, 2004; Craig et al., 1993a; Craig et al., 1993b; Deschenes et al., 1998;
Duineveld, 1998; Henry et al., 2007; Kim et al., 1990; Kim and Lee, 1988; Kumar and Ghosh,
2006; Marrucci and Nicodemo, 1967; Nicodemo et al., 1972; Pashley and Craig, 1997; Pugh et
al., 1997; Tsang et al., 2004; Vrtovsek et al., 1989; Weissenborn and Pugh, 1995a;
Weissenborn and Pugh, 1995b; Yu and Jer, 1983). It was established that a number of
inorganic salts inhibit the bubble coalescence above certain critical (transition) concentration in
gas dispersion as compared to other salts with no effect (Christenson and Yaminsky, 1995;
Craig, 2004; Craig et al., 1993a; Craig et al., 1993b; Deschenes et al., 1998; Duineveld, 1998;
Henry et al., 2007; Kim et al., 1990; Kim and Lee, 1988; Kumar and Ghosh, 2006; Marrucci
and Nicodemo, 1967; Nicodemo et al., 1972; Pashley and Craig, 1997; Pugh et al., 1997;
Tsang et al., 2004; Vrtovsek et al., 1989; Weissenborn and Pugh, 1995a; Weissenborn and
Pugh, 1995b; Yu and Jer, 1983).
Thermodynamically, gas dispersion is very unstable system tending to decrease its total
surface by multiple bubble collision. Physically, gas dispersion in the dynamic conditions of
flotation is complex system with given rheology (Duineveld, 1995; Duineveld, 1998; Kim and
Lee, 1988; Kumar and Ghosh, 2006; Yu and Jer, 1983) (approach velocity, bubble sizes,
surface tension, etc.) and surface forces between the bubbles (Derjaguin and Landau, 1941;
Verwey and Overbeek, 1948). In this context, inhibition of the bubble coalescence can occur
by decreasing the surface tension (this enhances the disperse-ability of the gas phase into the
liquid medium), by increasing the approach velocity of the bubbles (making them to bounce
after their contact) and by increasing the electrostatic repulsion between the bubbles (by
adsorption of ionic surfactants). The adsorption of surfactants on gas/liquid interface decreases
the surface tension significantly and consequently inhibits the bubble coalescence. In contrast,
the inorganic electrolytes increase the surface tension and suppress any electrostatic repulsion
between the bubbles. Therefore, they should promote the bubble coalescence. However, most
of the inorganic electrolytes stabilize bubbles above certain concentrations (Christenson and
Yaminsky, 1995; Craig, 2004; Craig et al., 1993a; Craig et al., 1993b; Deschenes et al., 1998;
Henry et al., 2007; Kim et al., 1990; Marrucci and Nicodemo, 1967; Nicodemo et al., 1972;
Pashley and Craig, 1997; Tsang et al., 2004; Vrtovsek et al., 1989; Weissenborn and Pugh,
1995b) at which the electrostatic repulsion between the bubbles is totally suppressed (Craig et
al., 1993a; Craig et al., 1993b; Pashley and Craig, 1997). In addition, the bubble size appears to
be important for the rate of bubble collision (Tsang et al., 2004). Some salts do not have an
effect on the bubble coalescence at any concentration.
It was observed that the density of bubbles in gas dispersion correlates well with certain
combinations of the cation and anion of the salt (Craig et al., 1993a; Craig et al., 1993b;
Pashley and Craig, 1997). An empirical rule was established (Craig et al., 1993a; Craig et al.,
1993b; Pashley and Craig, 1997) according to which the ions are classified as and ions.
This rule postulates that the effect of the salt is controlled by proper combination of ions: salt
consisting of cation and anion or cation and anion inhibit the coalescence of the
bubbles, while salts consisting of mixed and ions have no effect.
It was believed that Marangoni effect on the surfaces of bubbles in contact impedes their
coalescence by the Gibbs elasticity of the adsorption layer of the inorganic salts (Chan and
Tsang, 2005; Prince and Blanch, 1990a; Prince and Blanch, 1990b), however this hypothesis
was found recently inconsistent (Craig, 2004). An alternative way to explain the slower
coalescence of bubbles suggested recently (Marcelja, 2006), is the electrostatic repulsion
UU
IR Author M
anuscript UU
IR Author M
anuscript
University of Utah Institutional Repository Author Manuscript

23
between the bubbles. Their surface potential is generated by specific spatial distribution of
anions and cations in the vicinity of the air/water interface. This ionic distribution occurs at
distance less than 1 nm from water/air interface. Therefore, bubbles at distance larger than 2
nm do not interact electrostatically due to the very small inverted Debye length (less then
1nm). In addition, significant van der Waals and short-ranged spinodal cavitation attraction
forces (Stevens et al., 2005) act between the bubbles at distance less than 10 nm. Another way
to explain the prohibited coalescence of bubbles is that some combinations of ions can decrease
the surface mobility of the gas/liquid interface thus immobilizing the surfaces of the bubbles
however this hypothesis was refuted recently (Henry et al., 2008). This ion-specific effect does
not correlate with the increment of the surface tension of water/air interface (Henry et al.,
2007) as well.
Experiments with sum-frequency generation vibrational spectroscopy (SFG) and
molecular dynamic simulations report (Du et al., 2008) that some salts in their brine solutions
make the water structure network close to the water/air interface more compact while other
salts make it less compact as compared to pure water. Thus the salts were classified as structure
makers and structure breakers. However, these findings do not correlate with the ion-specific
effect on bubble coalescence (Tables 2) (Craig et al., 1993a) as well. As seen from Tables 2
there are structure makers and structure breakers (e.g. NaCl and KCl) both of which inhibit the
bubble coalescence.
Table 2. Effect of salts on the bubble coalescence (Craig, 2004)
Cations H+ Li+ Na+ K+ Cs+ Mg2+ Ca2+ NH4+ (CH3)4N
+ (CH3)4NH+ (CH3)4NH2+ (CH3)4NH3
+
Anions Type β α α α α α α α β β β β
OH- α ×
Cl- α × × × × ×
Br- α ×
NO3- α ×
ClO3- β ×
ClO4- Β × × ×
CH3COO- β × × × × × ×
SO42- α ×
(COO)22- α ×
Combining rules:
αα or ββ salts inhibit bubble coalescence ()
αβ or βα salts do not inhibit bubble coalescence ().
Therefore the ion-specific effect could be related to the bulk properties of the salt
solutions. Interestingly, it was reported in the literature (Pugh et al., 1997; Weissenborn and
Pugh, 1995b) that inorganic salts reduce the solubility of oxygen. Correlation between the
solubility of oxygen and ion-specific effect on the bubble coalescence can be found (Pugh et
al., 1997; Weissenborn and Pugh, 1995b). When existing, the ion-specific effect on bubble
coalescence can be evaluated by the transition concentration of salt, beyond which the effect
appears. The smaller the transition concentration, the stronger the ion-specific effect is. The
solubility of oxygen depends on the concentration of salt as an exponential decay function
(Weissenborn and Pugh, 1996). The larger the absolute value of exponential decay coefficient,
the smaller the solubility of oxygen is. Figure 21 shows correlation between the decay
coefficient and the transition concentration of salts. The lower the solubility of oxygen the
stronger the inhibition of the bubble coalescence is. The salts with multivalent ions have
strongest effect. Unfortunately, data on solubility of oxygen in the presence of different salts
are scarce. These last findings give a hope that the ion-specific effect could be understood in
near future. All of the experiments on bubble coalescence were performed with bubble
columns, where the multiple gas bubbles were generated by passing purified air or nitrogen
UU
IR Author M
anuscript UU
IR Author M
anuscript
University of Utah Institutional Repository Author Manuscript

24
through an orifice or through a porous surface such as a sintered glass disk. Therefore, the
experimentally established rate for bubble coalescence is a statistical value based on the
observation of multiple bubble collisions. There are no systematic literature data showing the
behavior of foam film between two bubbles in contact of highly concentrated salt solutions.
Such a study has been conducted recently by Karakashev et al (Karakashev et al., 2008).
Micro-interferometric method of Scheludko has been utilized for studying foam films with two
pairs of active (NaCl and LiCl) and inactive (NaClO3 and NaAc) salts. The foam films have
been studied in open and closed cells. In open cell the foam film is in contact with the air of the
lab, hence it can evaporate. In a closed system the foam film is in contact with saturated water
vapors and, hence it cannot evaporate. According to the DLVO theory all the foam films
should drain until rupture despite the kind of the salt. Indeed, in the case of open cell: the foam
films prepared from the NaAc and NaClO3 solutions thinned until rupture; the foam films
prepared from dilute (below 0.1 M) NaCl and LiCl salt solutions drained until rupture as well;
however, the foam films prepared from concentrated NaCl and LiCl salt solutions were
relatively stable and exhibited significant dynamics (see Fig. 22). Thus some salts stabilize the
foam films, while others not. This is deviation from the prediction of the DLVO theory and
ion-specific effect.
0
0.05
0.1
0.15
-0.8 -0.6 -0.4 -0.2 0
Exponential decay coeficient of oxygen solubility
Tra
ns
itio
n c
on
ce
ntr
ati
on
, m
ol/L
NH4Cl
NaCl
KOHCa(NO3)2
CaCl2Li2SO4
MgSO4
NH4NO3
KCl
Tra
nsit
ion
co
ncen
trati
on
, M
Figure 21. Correlation between the transition concentration exponential decay coefficients for
oxygen solubility (Weissenborn and Pugh, 1996).
UU
IR Author M
anuscript UU
IR Author M
anuscript
University of Utah Institutional Repository Author Manuscript

25
Figure 22. Evolution with significant dynamic surface corrugations of a 4 M NaCl foam film,
shown at a time interval of 5 s (from the top left to bottom right corner).
Evaporation No evaporation
Ion-specific effects DLVO theory
Foam films
Figure 23. The ion-specific effects in thin foam films of concentrated salts observed under
special conditions of evaporation and saturation.
In the study of the drainage and stability of foam films of concentrated salt solution using
the Scheludko cell technique (Karakashev et al., 2008) it was observed that in the case of
closed cell saturated by vapour of the salts all the foam films drained until rupture thus
exhibiting short lifetime. Hence, they followed the prediction by the classical colloidal theory
known as the DLVO (Derjaguin-Landau-Verwey-Overbeek) theory (Nguyen and Schulze,
2004). The ion-specific effects in thin liquid films were observed when the films were in
contact with unsaturated environment of the Scheludko cell open to the ambient atmosphere
and might undergo fast evaporation. These interesting observations of the effect of saturation
by salt vapour and the evaporation of salt solutions from the foam films are illustrated in Fig.
23.
UU
IR Author M
anuscript UU
IR Author M
anuscript
University of Utah Institutional Repository Author Manuscript

26
4.4 Molecular dynamics simulations
4.4.1. Brine/air interface
A MDS snapshot of the Na2CO3 solution and a corresponding number density
distribution plot is shown in Figure 24. It is evident from the snapshot that, both sodium and
carbonate ions are excluded from the air/water interface due to significant hydration of these
ions. The particle number density plot further reveals the deficiency of ions at the air/water
interface over a region extending to about 10 Angstroms in thickness, showing a strong
negative adsorption for both Na+ ions and CO3
2- ions, which accounts for the increased surface
tension reported previously (Andersson et al., 2007; Gopalakrishnan et al., 2005; Jungwirth et
al., 2006; Jungwirth and Tobias, 2002; Jungwirth and Tobias, 2006; Thomas Jennie et al.,
2007) and will be further discussed later. Similar MD simulation observations have also been
reported regarding Na2SO4 solutions (Gopalakrishnan et al., 2005).
Figure 24. Snapshot of aqueous sodium carbonate solution (2.0 M) (left) and particle number
density distributions along surface normal (right). The color representations are as follow:
Cyan-Carbon, Green-Sodium, Red-Oxygen, and White-Hydrogen (Du et al., 2008).
In contrast, for the NaHCO3 solution shown in Figure 25, HCO3- ions occupy a portion of
the air/water interface due to some affinity of HCO3- ions for the air/solution interface. The
obvious HCO3- ion number density peak at the interface suggests that the presence of
bicarbonate ions is energetically favorable. As might be expected, the Na+ ion peak follows
the HCO3-
ion peak in order to satisfy the cation/anion columbic interactions. However, the
concentration of sodium and bicarbonate ions at the interface is still lower than in the bulk
solution, suggesting a slightly negative adsorption state.
UU
IR Author M
anuscript UU
IR Author M
anuscript
University of Utah Institutional Repository Author Manuscript

27
Figure 25. Snapshot of aqueous sodium bicarbonate solution (1.1 M) (left) and particle number
density distributions along surface normal (right). The color representations are as follow:
Cyan-Carbon, Green-Sodium, Red-Oxygen, and White-Hydrogen (Du et al., 2008).
The changes in surface tension of salt solution (compared to pure water) from MDS
analysis and from experimental measurements are listed in Table 3. As seen in Table 3, the
calculated surface tension values with respect to the surface tension of pure water are in good
agreement with the experimental measurements qualitatively. The significant increase of
surface tension of saturated Na2CO3 solution is due to the strong negative adsorption of
carbonate at the air/water interface as discussed previously; the carbonate ion is excluded from
the interfacial region due to strong hydration forces. In contrast, only a slight surface tension
increase has been noticed for the saturated NaHCO3 solution due to a much less significant
negative adsorption of the bicarbonate ion at the interface.
Table 3. Comparison of simulated and experimental results for the increase in surface tension
relative to pure water (Du et al., 2008)
Salt Concentration, M Surface tension change, mN/m
MDS calculation Experimental measurement
Na2CO3 2.0 5.6 0.6 3.8
NaHCO3 1.1 2.0 1.0 0.8
It is also interesting to notice in Figure 26 that the orientations of water molecules in the
sodium carbonate solution are totally different when compared to pure water and/or sodium
bicarbonate solution as suggested by the sign of cos . In sodium carbonate solution, the
weak local electric field due to the presence of carbonate ions in the middle of the solution has
a significant influence on the orientation of water molecules. Thus, the water hydrogen atoms
point toward the bulk solution, while the water oxygen atoms point toward the air/solution
surfaces. On the other hand, in pure water and sodium bicarbonate solution, the water
orientation results from the inhomogeneous properties between the air and the solution phases.
Consequently, at the air/sodium bicarbonate solution interface, water hydrogen atoms are in
contact with air, and water oxygen atoms are in contact with the aqueous phase.
UU
IR Author M
anuscript UU
IR Author M
anuscript
University of Utah Institutional Repository Author Manuscript

28
Figure 26. Average water dipole moment cos as a function of location in the sodium
carbonate, sodium bicarbonate, and pure water solutions from MD simulations. (The Gibbs
dividing surface is defined as the position where water density is equal to one-half its bulk
density) (Du et al., 2008).
The combination of sum-frequency vibrational spectroscopy (SFVS) and molecular
dynamics simulation (MDS) has been validated to be able to provide further information on
air/solution interfacial phenomena, especially the interfacial water structures due to the
presence of ions (Andersson et al., 2007; Gopalakrishnan et al., 2005; Jungwirth et al., 2006;
Jungwirth and Tobias, 2002; Jungwirth and Tobias, 2006; Raymond and Richmond, 2004;
Thomas Jennie et al., 2007; Walker and Richmond, 2007a; Walker and Richmond, 2007b). It is
reported that charge, size, and polarizability of ions have significant effects on the distribution
of ions in the interfacial region (Andersson et al., 2007; Gopalakrishnan et al., 2005; Jungwirth
et al., 2006; Jungwirth and Tobias, 2002; Jungwirth and Tobias, 2006; Thomas Jennie et al.,
2007). For example, sulfate ions are significantly excluded from the interfacial region
(Gopalakrishnan et al., 2005). An increase of water SFVS signal has been obtained due to the
substantially expended interfacial distance and more ordered interfacial water structures due to
the strong hydration of the sulfate ions. In addition, calculation of the change of brine solution
surface tension from MDS has been reported for selected salts with satisfactory accuracy
(Jungwirth and Tobias, 2001; Jungwirth and Tobias, 2006).
4.5 Modelling of adsorption and surface tension of brine solutions
The Gibbs surface thermodynamics has been used to model adsorption at and surface
tension of the air-salt solution surfaces. The Gibbs adsorption equation gives the change, d ,
in surface tension relative to water (solvent) as;
1 1
lnn n
i i i i
i i
d d kT d c
[1]
UU
IR Author M
anuscript UU
IR Author M
anuscript
University of Utah Institutional Repository Author Manuscript

29
where i is the adsorption excess of the i-th solute with the bulk concentration ic , k is the
Boltzmann constant and T is the absolute temperature. The modeling of the adsorption excess
is critical to predicting surface tension of salt solutions and has been presented a major
modeling challenge for many decades as discussed below.
The increase in surface tension of electrolyte solutions was first modeled by Wagner
(Wagner, 1924), and then Onsager and Samaras (Onsager and Samaras, 1934). The potential,
iE , of the repulsive electrostatic image forces on the solute ions was used to determine the
adsorption excess by integrating the solute energy from infinity (in solution) to the Gibbs
dividing surface as;
0
exp / 1i i i i ic E x z e kT dx
[2]
2
1exp 2
4 1
i
i
z eE x x
x
[3]
where iz is the charge of the i-th solute, e is the charge of the proton, is the Debye constant,
is the dielectric constant of water, and x is the distance of the i-th solute measured from the
Gibbs dividing surface. The electric potential, i , of the i-th solute ion was obtained from the
solution of the Poisson-Boltzmann equation linearized for the low ionic potential. Onsager and
Samaras (Onsager and Samaras, 1934) calculated the surface tension as a sum of a series and
tabulated this sum. For very dilute salt solutions, the authors found an analytical expression for
the surface tension, referred to as the Onsager-Samaras limiting law nowadays, which shows a
linear increase in the surface tension with increasing salt concentration. For 1:1 salts, the
limiting law yields
1.012 ln 1.467 /water c c [4]
where the salt concentration is given in M.
Figure 27. Comparison of the Onsager-Samaras limiting law (dashed line) and the Markin-
Volkov theory (solid lines) with the experimental data (points) for the surface tension of
sodium and potassium chloride solutions (Markin and Volkov, 2002). water .
UU
IR Author M
anuscript UU
IR Author M
anuscript
University of Utah Institutional Repository Author Manuscript

30
Further efforts have been focused on developing a theory which accounts for the
additional effects on the ion distribution at the surface. Randles considered the effect of ion
hydration on the adsorption excess and assumed that there should be an salt ion-depletion
layer in the subsurface vicinity (Randles, 1957). The author considered that the smaller ions
should have larger hydration radii and vice versa. Therefore, the small ions have a larger
affinity to water, resulting in stronger repulsion (expel) from the water-air interface and higher
increment of the surface tension as experimentally determined (Weissenborn and Pugh, 1996).
The addition of the ion solvation energy into Eq. [2] can improve the prediction of the surface
tension of aqueous solutions of inorganic electrolytes (Manciu and Ruckenstein, 2003; Markin
and Volkov, 2002). Figure 27 shows a comparison between the experimental data and the
theories.
The role of dispersion forces (Mahanty and Ninham, 1977) in the ion-surface interactions
has also been investigated (Bostroem et al., 2005; Bostroem and Ninham, 2004; Bostroem et
al., 2001; Kunz et al., 2004; Ninham and Yaminsky, 1997). The ion distribution at the surface
was obtained by solving the recast Poisson-Boltzmann equation which for 1:1 salts can be
described as;
2
2
0
e c x c xd
dx
[5]
0 expimage dispersion solvationE E E e
c x ckT
[6]
Equations [5] and [6] have to be solved numerically to obtain the ionic potential and the
ion distributions which then can be used to calculate the ion adsorption excess and surface
tension. Generally, these improved theories show the increase in surface tension of alkali
halide solutions. However, the quantitative agreement between the theories and the
experimental data is still far from being satisfactory. The magnitude of the surface potential
obtained by the theories is also significantly different from the available experimental data.
Molecular dynamics (MD) simulation has also been used to predict the surface tension of
alkali halide salt solutions (Jungwirth and Tobias, 2001; Mahiuddin et al., 2008; Minofar et al.,
2007). Only qualitative agreement between the MD simulation results and the experimental
data has been achieved, i.e., the simulation confirms that the surface tension of alkali halide
solutions increases with increasing salt concentration. The simulation also shows different
distributions of cations and anions at the air-water surface, i.e., the anions are usually closer to
the interface than the cations. Based on these theories, most of the salts increase the surface
tension of aqueous solutions which means that salt ions are excluded from the air-brine
interface. Our previous studies showed that NaCl and NaF are structure makers. On the
contrary, KCl, KI, KNO3, and K2SO4 are structure breaker salts. As seen from the surface
tension results of these salts, they increase the surface tension of aqueous solutions.
It is noted that, while the molecular modeling of the adsorption excess of salt ions and
the surface tension of salt solutions has been difficult, a semi-analytical approach to the
prediction of the surface tension can be useful. It is based on the Gibbs adsorption equation and
the empirical correlation of the ion activity with the salt concentration (Ozdemir et al., 2006;
Ozdemir et al., 2009b). The Gibbs adsorption equation used in this modeling exercise is
generally expressed in term of the ion activity, a, rather than the concentration used in Eq. [1]
which is normally correct for low concentration only. For cation, M, and anion, X, dissociated
from a single salt, MX, the Gibbs adsorption equation used is given as;
UU
IR Author M
anuscript UU
IR Author M
anuscript
University of Utah Institutional Repository Author Manuscript

31
ln lnX X X M M Md kT v d a v d a [7]
where Mv and Xv are the stoichiometric coefficients of the salt. Equation [7] can be used, in
conjunction with the Langmuir adsorption isotherm for the salt ions and the Pitzer theory
(Pitzer, 1973; Pitzer and Kim, 1974; Pitzer and Mayorga, 1973; Pitzer and Mayorga, 1974) for
the ion activities, a , to calculate the surface tension as a function of salt concentration.
Figure 28 shows a few examples of the model predictions for the surface tension of
sodium and potassium chloride, and sodium carbonate and bicarbonate with concentration up
to the limit of saturation. The agreement is excellent. The only disadvantage of the semi-
empirical modeling approach is the required dependence of the ion activity on the salt
concentration. However, for many typical salts, the dependence is already measured and
readily available.
Salt concentration, M
Su
rface ten
sio
n, m
N/m
Salt concentration, M
Su
rface ten
sio
n, m
N/m
Figure 28. Comparison between the surface tension data (points) and the semi-empirical
predictions (lines) based on Eq. [7], the Langmuir adsorption isotherm and the the Pitzer theory
for the ion activity (Ozdemir et al., 2006; Ozdemir et al., 2009b).
5. Effect of ions at the solid/brine interfacial properties
5.1 Contact angle
Contact angle measurements are often used in flotation studies to describe the extent of
wetting or the hydrophobicity of a surface. It appears from previous studies that in the presence
of water structure maker ions, salt surfaces are hydrated to the greatest extent, and a contact
angle is not detected, whereas in the presence of water structure breaker ions the surface
appears to be less hydrated and finite contact angles can be measured in the absence of
collector (Hancer et al., 2001). For example, Table 4 presents sessile drop contact angle
measurements with a drop of brine in the absence of collector (Hancer et al., 2001).
Table 4. Advancing contact angle on soluble salt crystals in their saturated solutions in the
absence of collectors (Ozdemir et al., 2009a)
Salt Contact Angle, degree
UU
IR Author M
anuscript UU
IR Author M
anuscript
University of Utah Institutional Repository Author Manuscript

32
KI 25±2
KCl 7.9±0.5 (12±1.4)
NaCl 0
NaF 0
Na2CO3 0
NaHCO3 19.8
Trona 0.4
The contact angle measured for carbonate salts using the thin-layer wicking method also
indicated that the surfaces of structure making salts such as Na2CO3 and trona were hydrated to
such a great extent that a contact angle could not be measured for these salts, whereas the
structure breaking NaHCO3 salt was less hydrated and a finite contact angle was measured.
Table 5. Bubble attachment results for selected alkali salts (Yalamanchili et al., 1993)
Alkali
halide
Bubble
Attachment
LiF N
NaF N
KF N
RbF N
CsF N
LiCl Y
NaCl N
KCl Y
RbCl N
CsCl Y
LiBr Y
NaBr Y
KBr Y
RbBr Y
CsBr Y
LiI Y
NaI Y
KI Some
RbI Y
CsI N
NaI.H2O N
UU
IR Author M
anuscript UU
IR Author M
anuscript
University of Utah Institutional Repository Author Manuscript

33
.
0
20
40
60
80
100
10 100 1000 10000
Att
ac
hm
en
t E
ffic
ien
cy
(%
)
Contact Time (ms)
No Collector
1.10-6 M DAH
1.10-5 M DAH
5.10-5 M DAH
1x10⁻⁴ M DAH
NaHCO3 / DAH
No collector1.10-6 M DAH
1.10-5 M DAH5.10-5 M DAH
1.10-4 M DAH
0
20
40
60
80
100
10 100 1000 10000
Att
ac
hm
en
t E
ffic
ien
cy
(%
)
Contact Time (ms)
No Collector
1.10-6 M DAH
1.10-5 M DAH
5.10-5 M DAH
1x10⁻⁴ M DAH
NaHCO3 / SDS
No collector1.10-6 M SDS
1.10-5 M SDS5.10-5 M SDS
1.10-4 M SDS
Figure 29. The effect of (top) DAH and (bottom) SDS concentration on attachment time
between air bubbles and NaHCO3 particles at pH 8.4 in saturated solution of NaHCO3 (1.1 M)
(Ozdemir et al., 2009a).
UU
IR Author M
anuscript UU
IR Author M
anuscript
University of Utah Institutional Repository Author Manuscript

34
Table 6. Measured attachment times for different concentrations of DAH and SDS at a bed of
NaHCO3 and Na2CO3 particles (150×106 microns) (Ozdemir et al., 2009a)
5.2 Bubble attachment time
The bubble attachment time experiments can also be carried out to characterise the
hydrophobicity of mineral particles either in their natural state or with surfactant addition.
Table 5 presents the bubble attachment results for selected alkali salts with dodecylamine
hydrochloride. As seen from the table, while there is an attachment between the structure
breaker salts such as KCl, CsCl, and RbBr etc., and bubble, no attachment was observed
between the structure maker salts such as NaCl, and RbF and KF etc, and bubble
(Yalamanchili et al., 1993).
Ozdemir et al (Ozdemir et al., 2009a) studied the bubble-particle attachment carbonate
and bicarbonate soluble salts with dodecylamine hydrochloride and sodium dodecyl sulphate in
detail. As seen in Figure 29, there is an attachment between the NaHCO3 particles and a
bubble, and the bubble attachment times for NaHCO3 decrease with increasing DAH and SDS
concentrations. However, in the case of Na2CO3, as seen from Table 6, there is no attachment
of Na2CO3 particles in its saturated solutions (2.3 M) even at high concentrations of DAH and
SDS.
The results shown in Table 6 indicated that NaHCO3 surface has a lower stability which
allows easier penetration of both anionic and cationic collectors to the surface of NaHCO3
leading to good flotation, as shown in bubble attachment time measurements. However, it is
not the case for Na2CO3. This can be explained by the fact that the ion specific effect plays on
important role on attachment time of these salts. For instance, dissolved ions Na+ and CO3
2-
can significantly affect the interfacial water structure at the salt surface and inhibits the bubble-
particle attachment which accounts for the difficulty in the flotation of Na2CO3. In contrast, the
Na+ and HCO3
- ions cause only a modest increase in water structure at the salt surface and
make the bubble-particle attachment possible which accounts for the flotation of NaHCO3.
5.3 Electrokinetics of soluble salt minerals
Sparingly soluble minerals when dissolved in water will release a number of species into
solution. These ionic species will produced at the solid-liquid interface or may form in solution
and subsequently adsorb on the solid in amounts proportional to their concentrations. The
electrokinetic behavior is an indicator of the ability of ions to be incorporated in the double
layer and, in particular, may reveal the expected flotation response for a certain collector
scheme. In this matter, the measurement of surface charge is always important to understand
the interaction between mineral and collector. The electrophoretic mobilities, surface charge
and floatability of the salt crystals are presented in Table 7. As seen from the table, even the
negatively charged salts can float with both the cationic (DAH) and anionic (SDS) collectors,
Collector
Concentration
(M)
Attachment time with
NaHCO3 (ms)
Attachment time with
Na2CO3 (ms)
DAH SDS DAH SDS
No collector 1800 1800 No attachment No attachment
110-6
1800 1800 No attachment No attachment
110-5
270 200 No attachment No attachment
510-5
100 60 NA NA
110-4
45 40 No attachment No attachment
UU
IR Author M
anuscript UU
IR Author M
anuscript
University of Utah Institutional Repository Author Manuscript

35
whereas the others are not floated with either of collector. It is clear from these results that
surface charge is not a particularly important factor in the flotation of the salts (Veeramasuneni
et al., 1997; Yalamanchili et al., 1993).
Table 7. Electrokinetic mobility, surface charge and floatability of some salt crystals (Hancer
et al., 2001; Ozdemir et al., 2009a)
Salt Electrophoretic Mobility
(ζ/sec)/(V/cm)
Surface
Charge
Flotation
DAH SDS
KCl -0.43±0.19 - Yes Yes
NaCl +0.19±0.10 + No No
NaF +0.16±0.12 + No No
Na2B4O7.10H2O -1.68±0.11 - Yes Yes
Na2CO3 -0.91±0.23 - No No
NaHCO3 -1.16±0.31 - Yes Yes
As mentioned before, boron minerals exhibit a spectrum of different chemical
compositions with cations ranging from monovalent to multivalent ions. The type and valency
of the cation dictate the solubility of the mineral and in turn its electrokinetic behavior. Salt
type minerals such as borates release a number of species upon dissolving in water. For
example, colemanite containing Ca2+
ion in its structure undergoes acid base reactions in the
vicinity of pH 9.3. The following overall dissolution process for colemanite occurs in a system
open to the atmosphere (Celik and Yasar, 1995). As seen from Figure 30, the iep of borax
appears to be absent or impossible within the pH range of stability. Further studies showed that
the potential determining ions (pdi) for borax are found to be the constituent lattice cations, i.e.,
the anion B4O72-
(borate), and the H+ and OH
- ions which control ratio of HCO3
-/CO3
2- (Celik
and Yasar, 1995; Yarar, 1985).
-25
-20
-15
-10
-5
0
8 9 10 11pH
Ze
ta P
ote
nti
al
(mV
)
Borax/Saturated Borax
Figure 30. Zeta potential of borax as a function of pH (Muduroglu et al., 2000).
UU
IR Author M
anuscript UU
IR Author M
anuscript
University of Utah Institutional Repository Author Manuscript

36
Zeta potential measurements of borax were further conducted with SDS and DAH
collectors in order to test the validity of electrostatic interactions in saturated borax solutions.
Figure 31 presents the zeta potential profiles of borax in the presence of SDS and DAH. While
DAH reduces the zeta potentials from -14.4 down to -1.6 mV, SDS increases the negative
charges from -14.4 up to -26.1; these results distinctly illustrate the existence of electrostatic
interactions in the system.
Borax/Saturated borax
-30
-25
-20
-15
-10
-5
0
1.E-06 1.E-05 1.E-04 1.E-03
Reagent Concentration (M)
Ze
ta P
ote
nti
al
(mV
)
Borax/SDS
Borax/DAH
1.10-6
1.10-5
1.10-4
1.10-3
Figure 31. Zeta potential of borax in the presence of anionic (SDS) and cationic (DAH)
collectors (Muduroglu et al., 2000).
5.4 Molecular dynamics simulations
The obvious change of water molecule orientations at different alkali chloride crystal
surfaces is due to the variation of cation size and consequently the columbic interaction
between water molecules and lattice ions at salt surface. When small Li+ ions are present, the
interaction between surface Li+ ions and the oxygen atoms of water molecules dominates
compared to the interaction of water hydrogen and surface Cl- ions due to the larger local
electric field around the small Li+ (Koneshan et al., 1998b). Therefore, at a LiCl crystal
surface, a layer of water molecules with oxygen atoms in close contact at the crystal surface
and hydrogen atoms stretched out to the water phase (represented schematically in Figure 32a)
is energetically favorable. The presence of the second water layer with opposite orientation
neutralizes the dipole moment of water molecules in the first layer. As the cation size
increases, the magnitude of local electric field decreases accordingly, thus, at a NaCl surface
water molecules tilt to such an orientation that water oxygen atoms are further away from the
crystal surface while water hydrogen atoms are closer to the surface as seen in Figure 32b.
Similar water structures at a NaCl crystal surface have also been obtained from ab initio
calculation (Pramanik et al., 2005), density function calculation (Park et al., 2004), and Monte
Carlo simulations (Engkvist and Stone, 2000). With further increase of cation size to K+ and
Rb+, the interaction between water hydrogen atoms and surface Cl
- ions is significant enough
UU
IR Author M
anuscript UU
IR Author M
anuscript
University of Utah Institutional Repository Author Manuscript
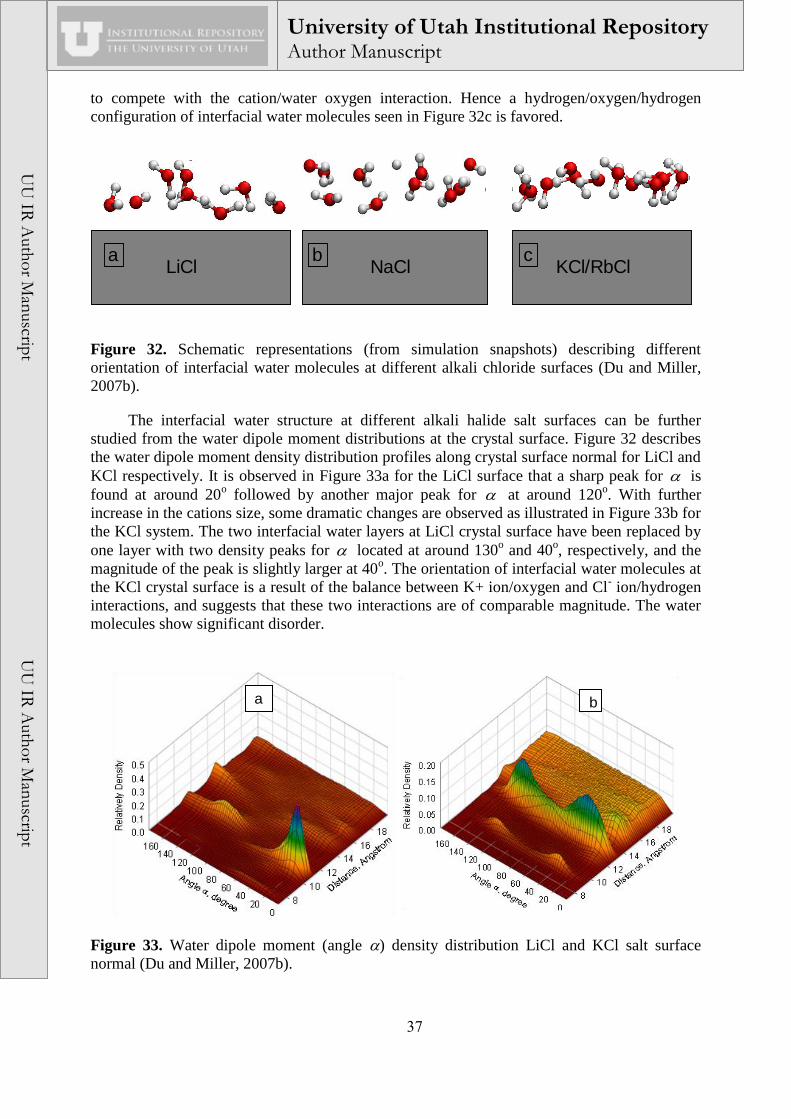
37
to compete with the cation/water oxygen interaction. Hence a hydrogen/oxygen/hydrogen
configuration of interfacial water molecules seen in Figure 32c is favored.
LiCl KCl/RbClNaCla b c
Figure 32. Schematic representations (from simulation snapshots) describing different
orientation of interfacial water molecules at different alkali chloride surfaces (Du and Miller,
2007b).
The interfacial water structure at different alkali halide salt surfaces can be further
studied from the water dipole moment distributions at the crystal surface. Figure 32 describes
the water dipole moment density distribution profiles along crystal surface normal for LiCl and
KCl respectively. It is observed in Figure 33a for the LiCl surface that a sharp peak for is
found at around 20o followed by another major peak for at around 120
o. With further
increase in the cations size, some dramatic changes are observed as illustrated in Figure 33b for
the KCl system. The two interfacial water layers at LiCl crystal surface have been replaced by
one layer with two density peaks for located at around 130o and 40
o, respectively, and the
magnitude of the peak is slightly larger at 40o. The orientation of interfacial water molecules at
the KCl crystal surface is a result of the balance between K+ ion/oxygen and Cl- ion/hydrogen
interactions, and suggests that these two interactions are of comparable magnitude. The water
molecules show significant disorder.
a b
Figure 33. Water dipole moment (angle ) density distribution LiCl and KCl salt surface
normal (Du and Miller, 2007b).
UU
IR Author M
anuscript UU
IR Author M
anuscript
University of Utah Institutional Repository Author Manuscript

38
An accurate measurement of equilibrium alkali halide crystal surface charge has always
been a challenging task due to the dynamic dissolution and recrystallization processes which
happen at the crystal surface. The surface charge of alkali halide crystals in saturated solution
has been calculated as the summation of cation and anion number density at a designated
distance from the surface, and the sign of the salt surface charge is summarized in Table 8. For
comparison, theoretical and experimental results reported in the literature are listed as well.
Table 8. Surface charge of selected alkali halide crystals in saturated solution and comparison
with analytical model and experimental results (Du and Miller, 2007b)
Salt
Cutoff
Distance
(Angstrom)
Surface Charge
This
Study
(MDS)
Analytical
Model (Veeramasuneni et al.,
1997)
Experimental
Results (Miller et al., 1992; Yalamanchili et
al., 1993)
LiCl 12.5 - - -
NaCl 13.0 + + +
KCl 14.0 + + -
RbCl 14.0 + + +
The sign of the surface charge for selected alkali chloride salt surfaces in saturated
solutions obtained from this MD simulation study are in excellent agreement with the results
from extended lattice hydration theory results, which takes into consideration the lattice ion
hydration free energy as well as ion size effects (Veeramasuneni et al., 1997). It has been
suggested that surface lattice ions are partially hydrated; therefore, instead of considering ion
hydration energy alone, which accounts for the hydration of the gaseous ions, an ion-water
dipole interaction has to be considered (Veeramasuneni et al., 1997). This ion-water dipole
interaction accounts for the transaction of a partially hydrated surface lattice ion to be a free
(vacuum) surface lattice ion (Veeramasuneni et al., 1997). In LiCl system, due to a much larger
hydration energy (-470.7 kJ/mole for Li+ and -347.27 kJ/mole for Cl
- (Hunt, 1963; Miller et al.,
1992), Li+ ions in the LiCl crystal lattice have a greater tendency than Cl- ions to be dissolved
into water, therefore leaving the salt surface negatively charged (Miller et al., 1992;
Veeramasuneni et al., 1997; Yalamanchili et al., 1993). In contrast, due to a much larger ion-
water dipole interaction (-35.37 kJ/mole for Cl- and 4.3 kJ/mole for Na
+ (Veeramasuneni et al.,
1997), the dissolving of partially hydrated surface lattice Cl-
is energetically more favorable
than the dissolving of surface Na+ despite the fact that Na
+ has a larger hydration energy (-
371.54 kJ/mole) (Hunt, 1963; Veeramasuneni et al., 1997). For KCl and RbCl salts, the
hydration of Cl- is dominating, consequently, the salt surfaces are positively charged
(Veeramasuneni et al., 1997). The obvious difference with respect to the sign of the surface
charge for the KCl experimental results has been attributed to the presence of oxygen defects in
the KCl crystal lattice (Veeramasuneni et al., 1997; Yalamanchili et al., 1993). Also, from the
extended lattice hydration theory, the difference between hydration energies of K+ and Cl
- is
3.46 kJ/mol (Veeramasuneni et al., 1997; Yalamanchili et al., 1993), and this might account
for the anomalous behavior of KCl during the sensitive nonequilibrium electrophoresis
measurement (Veeramasuneni et al., 1997; Yalamanchili et al., 1993). The consistency
between MD simulation and the literature results regarding the surface charge of alkali halide
salt crystal suggests that the MD simulation provides a valid method for the analysis of surface
charge in the case of ionic solids.
The dynamics of water molecules at selected alkali chloride salt surface study has
concluded that first of all, in general, water molecules in KCl and RbCl saturated solutions
diffuse significantly faster than they do in NaCl and LiCl saturated solution. This is because in
UU
IR Author M
anuscript UU
IR Author M
anuscript
University of Utah Institutional Repository Author Manuscript

39
NaCl and LiCl solutions the cation/water interaction is stronger, and thus water molecules have
been immobilized to a greater extent. Similar observations have also been reported for a variety
of alkali halide solutions (Allen and Tildesley, 1987; Chowdhuri and Chandra, 2001; Du and
Miller, 2007b; Du et al., 2007a; Koneshan and Rasaiah, 2000; Koneshan et al., 1998b).
Secondly, the self-diffusion coefficient for water molecules in the salt/water interfacial region
is significantly lower than that of in bulk water. In the interfacial region, where ion
dissolution/deposition processes dominate, there is a substantial accumulation of ions. As a
result, the movement of water molecules in this region is confined due to the ion/water
interactions. Thirdly, the diffusion of water molecules in bulk shows strong concentration
dependence. In LiCl saturated solution (~14 M), the self-diffusion coefficient of water
molecules in the bulk solution (~0.8.10-9
m2/sec) is significantly lower than the self-diffusion
coefficient in pure water (~2.5.10-9
m2/sec) (Berendsen et al., 1987; Du and Miller, 2007b; Du
et al., 2007a) due to the large concentration of ions (especially Li+ ions) which interact strongly
with water molecules and immobilize them. In contrast, in KCl saturated solution (~4.8 M), the
water self-diffusion coefficient in bulk solution (~2.5.10-9
m2/sec) is similar to the value of
pure water. Possible explanation is that a large number of ions are accumulated in the
crystal/water interfacial region, thus ion concentration in bulk solution is relatively low. Also,
the ion/water interactions are weaker when compared to LiCl system, and consequently water
molecules are more mobile.
For water molecules in the interfacial region, their residence time shows clear cation
dependence as LiCl NaCl KCl RbCl . This is due to the fact that small cations such as Li+
and Na+ interact stronger with water molecules when compared to large cations such as K
+ and
Rb+, consequently, water molecules are immobilized more significantly around small cations.
The inconsistency involving KCl and RbCl interfacial water is due to a higher RbCl saturation
solution concentration. The variation of interfacial water residence time is in excellent
agreement with water self-diffusion coefficients. In bulk solutions, water molecules move
faster when compared to water molecules at crystal lattice positions and interfacial water
molecules as indicated by the short residence times and large diffusion coefficients. Especially
for water molecules in bulk KCl solution, the residence time (5.9 ps) and self-diffusion
coefficient (~2.5.10-9
m2/sec) are very close to pure water value (~5 ps and ~2.5.10
-9 m
2/sec
respectively) (Berendsen et al., 1987; Du and Miller, 2007b; Du et al., 2007a; Koneshan et al.,
1998b).
5.5 General discussion
A high concentration of dissolved ions in brines modifies the bulk and interfacial water
structure, and this effect is a significant factor in the flotation chemistry of soluble salts.
Particularly, recent studies showed that consideration of hydration phenomena at salt crystal
surfaces provides a better explanation for the flotation of soluble salts even when the collector
is charged the same as the salt and the flotation of soluble salts depends on the dissolved ions
of these salts (Du et al., 2008; Hancer et al., 2001; Miller et al., 1992; Ozdemir et al., 2007;
Ozdemir et al., 2009a; Ozdemir et al., 2006). The previous studies in dilute electrolyte
solutions also showed the same effect of structure making and breaking properties of salt ions
on the adsorption process (Ma and Pawlik, 2006).
All the results show that the dissolved ions significantly affect the flotation of these
soluble salts. While some dissolved ions activate the flotation of minerals, some of them
reduce the flotation of these salts. As mentioned before while NaHCO3 floats with both
anionic and cationic collectors, Na2CO3 does not float at all. It can be said that NaHCO3
surface has a lower stability which allows easier penetration of both anionic and cationic
collectors to the surface of NaHCO3 leading to good flotation as shown in bubble attachment
UU
IR Author M
anuscript UU
IR Author M
anuscript
University of Utah Institutional Repository Author Manuscript

40
time measurements. However, this is not the case for Na2CO3. This can be explained by the
fact that the ion specific effect plays an important role on the bubble attachment time at the
surface of these salts. For instance, dissolved ions Na+ and CO3
2- can significantly affect the
interfacial water structure at the salt surface and inhibit the bubble-particle attachment which
accounts for the difficulty in the flotation of Na2CO3. In contrast, the Na+ and HCO3
- ions
cause only a modest increase in water structure at the salt surface and make the bubble-particle
attachment possible which accounts for the flotation of NaHCO3.
Trona does not float well in its saturated brine with DAH (Ozdemir et al., 2009a).
Additionally, the limited floatability of trona with DAH is reduced slightly after adding 110-2
M of Na2CO3 to the brine. This result indicates that the structure making character of Na2CO3
has a significant impact on trona flotation, making the direct flotation of trona from its brine
difficult. The same effect was also observed in the flotation of NaHCO3 in the presence of
Na2CO3. These results suggest that the effect of the bicarbonate ion on the water structure is
negligible when compared to the carbonate ion. It appears from these results that when one of
the ions in a salt is a water structure breaker whereas the other a structure maker, one of them
might be dominant in determining the extent of water structuring. The results reported here
indicate that instead of Na+ ion, which is normally a structure maker, it is rather the HCO
3-
anion, a structure breaker, dominates water structuring in soluble salt systems.
All this discussion refers to water structure making and braking effect of ions. However, MDS
studies are not conclusive in this. Ion specificity appears to be significant. Thus the above
analysis on trona does not include this aspect.
6. Conclusions
The flotation chemistry of soluble salts such as alkali halides and alkali oxyanion salts
has been studied by many researchers and it appears that the interfacial water structure and
hydration states of soluble salt surfaces are of considerable importance in explaining their
flotation behavior. Generally, soluble salts can be classified as structure makers or as structure
breakers. Structure making salts such as NaCl, strongly bond/order water molecules at the salt
surface, prevent adsorption of collector, and inhibit flotation with either a cationic or an anionic
collector. Structure breaking salts such as KCl have a tendency to disorganize the structure of
water at the salt surface; thus a collector may more easily reach the surface, creating the
hydrophobic state and further allowing for the flotation of such structure breaking salts with
both cationic and anionic collectors.
The flotation behaviour of soluble salt minerals is influenced by dissolved salts and is
determined by the specific effect of these ions. The effect of these ions at air/liquid, air/solid,
and solid/liquid interfaces has been investigated in more detail using several experimental
techniques. All of these studies suggest that ion specificity is the most significant factor in
governing the flotation surface chemistry of soluble salt minerals with both anionic and
cationic collectors.
ACKNOWLEDGMENTS
Part of this research conducted at the University of Queensland was supported under Australian
Research Council's Discovery Projects funding scheme (Grant DP0663688 awarded to AVN).
The views expressed herein are those of the authors and are not necessarily those of the
Australian Research Council.
UU
IR Author M
anuscript UU
IR Author M
anuscript
University of Utah Institutional Repository Author Manuscript

41
REFERENCES
Akin, Y., Gulgonul, I. and Celik, M.S., 1997. Interaction of amine with borate species in boron
flotation pulps, SME Annual Meeting Preprint number 97-135, Denver, CO.
Allen, M.P. and Tildesley, D.J., 1987. Computer Simulation of Liquids, 450 pp pp.
Andersson, G., Morgner, H., Cwiklik, L. and Jungwirth, P., 2007. Anions of Alkali Halide
Salts at Surfaces of Formamide Solutions: Concentration Depth Profiles and Surface
Topography. Journal of Physical Chemistry C, 111(11): 4379-4387.
Berendsen, H.J., 1988. Dynamic simulation as an essential tool in molecular modeling. Journal
of computer-aided molecular design, 2(3): 217-21.
Berendsen, H.J.C., Grigera, J.R. and Straatsma, T.P., 1987. The missing term in effective pair
potentials. Journal of Physical Chemistry, 91(24): 6269-71.
Berendsen, H.J.C. and Van Gunsteren, W.F., 1984. Molecular dynamics simulations:
techniques and approaches. NATO ASI Series, Series C: Mathematical and Physical
Sciences, 135(Mol. Liq.): 475-500.
Bostroem, M., Kunz, W. and Ninham, B.W., 2005. Hofmeister effects in surface tension of
aqueous electrolyte solution. Langmuir, 21(6): 2619-2623.
Bostroem, M. and Ninham, B.W., 2004. Dispersion self-free energies and interaction free
energies of finite-sized ions in salt solutions. Langmuir, 20(18): 7569-7574.
Bostroem, M., Williams, D.R.M. and Ninham, B.W., 2001. Surface tension of electrolytes:
Specific ion effects explained by dispersion forces. Langmuir, 17(15): 4475-4478.
Burdukova, E., Laskowski, J.S. and Forbes, G.R., 2009. Precipitation of dodecyl amine in KCl-
NaCl saturated brine and attachment of amine particles to KCl and NaCl surfaces.
International Journal of Mineral Processing, 93(1): 34-40.
Celik, M.S., Atak, S. and Onal, G., 1993. Flotation of boron minerals. Minerals and
Metallurgical Processing, 10: 149-153.
Celik, M.S. and Bulut, R., 1996. Sep. Sci. Technol., 31: 1817.
Celik, M.S., Hancer, M. and Miller, J.D., 2002. Flotation chemistry of boron minerals. Journal
of Colloid and Interface Science, 256(1): 121-131.
Celik, M.S. and Somasundaran, P., 1988. Journal of Colloid and Interface Science, 122: 163.
Celik, M.S. and Yasar, E., 1995. Electrokinetic properties of some hydrated boron minerals. J.
Colloid Interface Sci., 173(1): 181-5.
Chan, B.S. and Tsang, Y.H., 2005. A theory on bubble-size dependence of the critical
electrolyte concentration for inhibition of coalescence. J. Colloid Interface Sci., 286(1):
410-413.
Cheng, F.Q. et al., 2008. Surface chemistry features in the flotation of KCl, XXIV IMPC,
China.
Chowdhuri, S. and Chandra, A., 2001. Molecular dynamics simulations of aqueous NaCl and
KCl solutions: Effects of ion concentration on the single-particle, pair, and collective
dynamical properties of ions and water molecules. Journal of Chemical Physics, 115(8):
3732-3741.
Chowdhuri, S. and Chandra, A., 2003. Hydration structure and diffusion of ions in supercooled
water: Ion size effects. Journal of Chemical Physics, 118(21): 9719-9725.
Christenson, H.K. and Yaminsky, V.V., 1995. Solute Effects on Bubble Coalescence. J. Phys.
Chem., 99(25): 10420.
Clark, S.W. and Cooke, S.R.B., 1968. Trans. AIME, 241: 56.
Colic, M., Franks, G.V., Fisher, M.L. and Lange, F.F., 1997. Langmuir, 13: 129.
Craig, V.S.J., 2004. Bubble coalescence and specific-ion effects. Current Opinion in Colloid &
Interface Science, 9: 178.
UU
IR Author M
anuscript UU
IR Author M
anuscript
University of Utah Institutional Repository Author Manuscript

42
Craig, V.S.J., Ninham, B.W. and Pashley, R.M., 1993a. Effect of electrolytes on bubble
coalescence. Nature, 364(6435): 317-19.
Craig, V.S.J., Ninham, B.W. and Pashley, R.M., 1993b. The effect of electrolytes on bubble
coalescence in water. J. Phys. Chem., 97(39): 10192-7.
Dang, L.X., 1992a. Development of nonadditive intermolecular potentials using molecular
dynamics: solvation of lithium(1+) and fluoride ions in polarizable water. Journal of
Chemical Physics, 96(9): 6970-7.
Dang, L.X., 1992b. Fluoride-fluoride association in water from molecular dynamics
simulations. Chemical Physics Letters, 200(1-2): 21-5.
Dang, L.X., 1994. Free energies for association of Cs+ to 18-crown-6 in water. A molecular
dynamics study including counter ions. Chemical Physics Letters, 227(1-2): 211-14.
Dang, L.X., 1995. Mechanism and Thermodynamics of Ion Selectivity in Aqueous Solutions of
18-Crown-6 Ether: A Molecular Dynamics Study. Journal of the American Chemical
Society, 117(26): 6954-60.
Dang, L.X. and Smith, D.E., 1993. Molecular dynamics simulations of aqueous ionic clusters
using polarizable water. Journal of Chemical Physics, 99(9): 6950-6.
Dang, L.X. and Smith, D.E., 1995. Comment on \"Mean force potential for the calcium-
chloride ion pair in water\" [J. Chem. Phys. 99, 4229 (1993)]. Journal of Chemical
Physics, 102(8): 3483-4.
Derjaguin, B. and Landau, L., 1941. Theory of the stability of strongly charged lyophobic sols
and the adhesion of strongly charged particles in solutions of electrolytes. Acta Phys.-
chim., 14(6): 633-662.
Deschenes, L.A., Barrett, J., Muller, L.J., Fourkas, J.T. and Mohanty, U., 1998. Inhibition of
Bubble Coalescence in Aqueous Solutions. 1. Electrolytes. Journal of Physical
Chemistry B, 102(26): 5115-5119.
Desnoyers, J.E. and Perron, G., 1972. The Viscosity of Aqueous Solutions of Alkali and
Tetraalkylammonium Halides at 25°C. J. Solution Chem., 1(3): 199-212.
Du, H., Liu, J., Ozdemir, O., Nguyen, A.V. and Miller, J.D., 2008. Molecular features of the
air/carbonate solution interface. Journal of Colloid and Interface Science, 318(2): 271-
277.
Du, H. and Miller, J.D., 2007b. Interfacial water structure and surface charge of selected alkali
chloride salt crystals in saturated solutions: A molecular dynamics modeling study. The
Journal of Physical Chemistry C, 111(27): 10013-10022.
Du, H., Rasaiah, J.C. and Miller, J.D., 2007a. Structural and dynamic properties of
concentrated alkali halide solutions: A molecular dynamics simulation study. The
Journal of Physical Chemistry B, 111(1): 209-217.
Duineveld, P.C., 1995. Bouncing and coalescence of two bubbles in pure water. Fluid Mech.
Its Appl., 31(IUTAM Symposium on Waves in Liquid/Gas and Liquid/Vapour Two-
Phase Systems, 1994): 151-60.
Duineveld, P.C., 1998. Bouncing and Coalescence of Bubble Pairs Rising at High Reynolds
Number in Pure Water or Aqueous Surfactant Solutions. Applied Scientific Research,
58: 409–39.
Engkvist, O. and Stone, A.J., 2000. Adsorption of water on the NaCl(001) surface. III. Monte
Carlo simulations at ambient temperatures. Journal of Chemical Physics, 112(15):
6827-6833.
Fuerstenau, D.W. and Fuerstenau, M.C., 1956. Ionic size in flotation collection of alkali
halides. Transactions of the American Institute of Mining, Metallurgical, and Petroleum
Engineers, 4156-B: 205.
UU
IR Author M
anuscript UU
IR Author M
anuscript
University of Utah Institutional Repository Author Manuscript

43
Gopalakrishnan, S., Jungwirth, P., Tobias, D.J. and Allen, H.C., 2005. Air-Liquid Interfaces of
Aqueous Solutions Containing Ammonium and Sulfate: Spectroscopic and Molecular
Dynamics Studies. Journal of Physical Chemistry B, 109(18): 8861-8872.
Haile, J.M., 1997. Molecular Dynamics Simulation: Elementary Methods. Wiley, New York,
N. Y., 489 pp pp.
Hancer, M., Celik, M.S. and Miller, J.D., 2001. The Significance of Interfacial Water Structure
in Soluble Salt Flotation Systems. J. Colloid Interface Sci., 235(1): 150-161.
Hancer, M. and Miller, J.D., 2000. The flotation chemistry of potassium double salts:
schoenite, kainite, and carnallite. Miner. Eng., 13(14-15): 1483-1493.
Harben, P.W., 1995. Borates: The Industrial Minerals Handybook, 2nd Ed. Metal Bulletin
PLC, London, pp. 29.
Harben, P.W. and Dickson, E.M., 1985. Borates: Economic Geology and Production In:
J.M.B.a.S.J. Lefond (Editor), AIME, New York, pp. 4.
Henry, C.L., Dalton, C.N., Scruton, L. and Craig, V.S.J., 2007. Ion-Specific Coalescence of
Bubbles in Mixed Electrolyte Solutions. J. Phys. Chem. C, 111(2): 1015-1023.
Henry, C.L., Parkinson, L., Ralston, J.R. and Craig, V.S.J., 2008. A Mobile Gas-Water
Interface in Electrolyte Solutions. J. Phys. Chem. C, 112(39): 15094-15097.
Hunt, J.P., 1963. Metal Ions in Aqueous Solution, 124 pp pp.
Jiang, J. and Sandler, S.I., 2003a. Ind. Eng. Chem. Res., 42: 6267.
Jiang, J. and Sandler, S.I., 2003b. A New Model for the Viscosity of Electrolyte Solutions.
Industrial & Engineering Chemistry Research, 42(25): 6267-6272.
Jungwirth, P., Finlayson-Pitts, B.J. and Tobias, D.J., 2006. Introduction: Structure and
Chemistry at Aqueous Interfaces. Chemical Reviews (Washington, DC, United States),
106(4): 1137-1139.
Jungwirth, P. and Tobias, D.J., 2001. Molecular structure of salt solutions: A new view of the
interface with implications for heterogeneous atmospheric chemistry. Journal of
Physical Chemistry B, 105(43): 10468-10472.
Jungwirth, P. and Tobias, D.J., 2002. Ions at the Air/Water Interface. Journal of Physical
Chemistry B, 106(25): 6361-6373.
Jungwirth, P. and Tobias, D.J., 2006. Specific Ion Effects at the Air/Water Interface. Chemical
Reviews (Washington, DC, United States), 106(4): 1259-1281.
Kaminsky, M., 1957. Z. Phys. Chem., 12: 206.
Karakashev, S.I., Nguyen, P.T., Tsekov, R., Hampton, M.A. and Nguyen, A.V., 2008.
Anomalous Ion Effects on Rupture and Lifetime of Aqueous Foam Films Formed from
Monovalent Salt Solutions up to Saturation Concentration. Langmuir, 24: 11587-
11591.
Kim, J.W., Chang, J.H. and Lee, W.K., 1990. Inhibition of bubble coalescence by the
electrolytes. Korean J. Chem. Eng., 7(2): 100-8.
Kim, J.W. and Lee, W.K., 1988. Coalescence behavior of bubbles growing side-by-side. J.
Colloid Int. Sci., 123: 303-05.
Koneshan, S., Lynden-Bell, R.M. and Rasaiah, J.C., 1998a. Friction coefficients of ions in
aqueous solution at 25 Deg. Journal of the American Chemical Society, 120(46):
12041-12050.
Koneshan, S. and Rasaiah, J.C., 2000. Computer simulation studies of aqueous sodium
chloride solutions at 298 K and 683 K. Journal of Chemical Physics, 113(18): 8125-
8137.
Koneshan, S., Rasaiah, J.C., Lynden-Bell, R.M. and Lee, S.H., 1998b. Solvent Structure,
Dynamics, and Ion Mobility in Aqueous Solutions at 25 DegC. Journal of Physical
Chemistry B, 102(21): 4193-4204.
UU
IR Author M
anuscript UU
IR Author M
anuscript
University of Utah Institutional Repository Author Manuscript

44
Kumar, M.K. and Ghosh, P., 2006. Coalescence of Air Bubbles in Aqueous Solutions of Ionic
Surfactants in Presence of Inorganic Salt. IChemE, Part A, 84(A8): 703-710.
Kunz, W., Belloni, L., Bernard, O. and Ninham, B.W., 2004. Osmotic coefficients and surface
tensions of aqueous electrolyte solutions: Role of dispersion forces. Journal of Physical
Chemistry B, 108(7): 2398-2404.
Lee, S.H. and Rasaiah, J.C., 1994. Molecular dynamics simulation of ionic mobility.1. Alkali
metal cations in water at 25 C. Journal of Chemical Physics, 101(8): 6964.
Lee, S.H. and Rasaiah, J.C., 1996. Molecular Dynamics Simulation of Ion Mobility. 2. Alkali
Metal and Halide Ions Using the SPC/E Model for Water with Simple Truncation of
Ion-Water Potential. Journal of Physical Chemistry, 100(4): 1420-5.
Lynden-Bell, R.M. and Rasaiah, J.C., 1996. Mobility and solvation of ions in channels. Journal
of Chemical Physics, 105(20): 9266-9280.
Ma, X. and Pawlik, M., 2006. Adsorption of guar gum onto quartz from dilute mixed
electrolyte solutions. Journal of Colloid and Interface Science, 298(2): 609-614.
Mahanty, J.H. and Ninham, B.W., 1977. Colloid Science: Dispersion Forces. Academic Press,
London, 236 pp.
Mahiuddin, S., Minofar, B., Borah, J.M., Das, M.R. and Jungwirth, P., 2008. Propensities of
oxalic, citric, succinic, and maleic acids for the aqueous solution/vapour interface:
Surface tension measurements and molecular dynamics simulations. Chem. Phys. Lett.,
462(4-6): 217-221.
Manciu, M. and Ruckenstein, E., 2003. Specific ion effects via ion hydration: I. Surface
tension. Adv. Colloid Interface Sci., 105: 63-101.
Marcelja, S., 2006. Selective coalescence of bubbles in simple electrolytes. J Phys Chem B,
110(26): 13062-7.
Markin, V.S. and Volkov, A.G., 2002. Quantitative Theory of Surface Tension and Surface
Potential of Aqueous Solutions of Electrolytes. Journal of Physical Chemistry B,
106(45): 11810-11817.
Marrucci, G. and Nicodemo, L., 1967. Coalescence of gas bubbles in aqueous solutions of
inorganic electrolytes. Chem. Eng. Sci. , 22(9): 1257-65.
Miller, J.D., Yalamanchili, M.R. and Kellar, J., 1992. Surface charge of alkali halide particles
as determined by laser-doppler electrophoresis. Langmuir, 8(5): 1464-1469.
Minofar, B., Jungwirth, P., Das, M.R., Kunz, W. and Mahiuddin, S., 2007. Propensity of
Formate, Acetate, Benzoate, and Phenolate for the Aqueous Solution/Vapor Interface:
Surface Tension Measurements and Molecular Dynamics Simulations. Journal of
Physical Chemistry C, 111(23): 8242-8247.
Mucha, M. et al., 2005. Unified Molecular Picture of the Surfaces of Aqueous Acid, Base, and
Salt Solutions. Journal of Physical Chemistry B, 109(16): 7617-7623.
Muduroglu, M., Celik, M.S., Hancer, M. and Miller, J.D., 2000. Electrokinetic behavior of
borax in saturated solutions and its role in flotation. Miner. Process. 21st Century, Proc.
Int. Miner. Process. Symp., 8th: 231-236.
Nguyen, A.V. and Schulze, H.J., 2004. Colloidal science of flotation. Marcel Dekker, New
York, 840 pp.
Nickolov, Z.S. and Miller, J.D., 2005. Water structure in aqueous solutions of alkali halide
salts: FTIR spectroscopy of the OD stretching band. Journal of Colloid and Interface
Science, 287(2): 572-580.
Nicodemo, L., Marrucci, G. and Acierno, D., 1972. Bubble pair coalescence in electrolyte
solutions. Quad. Ing. Chim. Ital. , 8(1): 1-7.
Ninham, B.W. and Yaminsky, V., 1997. Ion Binding and Ion Specificity: The Hofmeister
Effect and Onsager and Lifshitz Theories. Langmuir, 13(7): 2097-2108.
UU
IR Author M
anuscript UU
IR Author M
anuscript
University of Utah Institutional Repository Author Manuscript

45
Onsager, L. and Samaras, N.N.T., 1934. The surface tension of Debye-Huckel electrolytes.
Journal of Chemical Physics, 2: 528-536.
Ozcan, O. and Miller, J.D., 2002. Flotation of sodium carbonate and sodium bicarbonate salts
from their saturated brines. Minerals Engineering, 15(8): 577-584.
Ozdemir, O., Celik, M.S., Nickolov, Z.S. and Miller, J.D., 2007. Water structure and its
influence on the flotation of carbonate and bicarbonate salts. Journal of Colloid and
Interface Science, 314(2): 545-551.
Ozdemir, O., Jain, A., Gupta, V., Wang, X. and Miller, J.D., 2010. Evaluation of flotation
technology for the trona industry. Minerals Engineering, 23(1): 1-9.
Ozdemir, O., Karaguzel, C., Nguyen, A.V., Celik, M.S. and Miller, J.D., 2009a. Contact angle
and bubble attachment studies in the flotation of trona and other soluble carbonate salts.
Minerals Engineering, 22(2): 168-175.
Ozdemir, O., Karakashev, S.I., Nguyen, A.V. and Miller, J.D., 2006. Adsorption of carbonate
and bicarbonate salts at the air-brine interface. International Journal of Mineral
Processing, 81(3): 149-158.
Ozdemir, O., Karakashev, S.I., Nguyen, A.V. and Miller, J.D., 2009b. Adsorption and surface
tension analysis of concentrated alkali halide brine solutions. Minerals Engineering,
22(3): 263-271.
Park, J.M., Cho, J.-H. and Kim, K.S., 2004. Atomic structure and energetics of adsorbed water
on the NaCl(001) surface. Physical Review B: Condensed Matter and Materials
Physics, 69(23): 233403/1-233403/4.
Pashley, R.M. and Craig, V.S.J., 1997. Effects of Electrolytes on Bubble Coalescence.
Langmuir, 13(17): 4772-4774.
Pitzer, K.S., 1973. Thermodynamics of electrolytes. I. Theoretical basis and general equations.
Journal of Physical Chemistry, 77(2): 268-277.
Pitzer, K.S. and Kim, J.J., 1974. Thermodynamics of electrolytes. IV. Activity and osmotic
coefficients for mixed electrolytes. Journal of the American Chemical Society, 96(18):
5701-5707.
Pitzer, K.S. and Mayorga, G., 1973. Thermodynamics of electrolytes. II. Activity and osmotic
coefficients for strong electrolytes with one or both ions univalent. Journal of Physical
Chemistry, 77(19): 2300-2308.
Pitzer, K.S. and Mayorga, G., 1974. Thermodynamics of electrolytes. III. Activity and osmotic
coefficients for 2-2 electrolytes. Journal of Solution Chemistry, 3(7): 539-546.
Pramanik, A., Kalagi, R.P., Barge, V.J. and Gadre, S.R., 2005. Adsorption of water on sodium
chloride surfaces: electrostatics - guided ab initio studies. Theoretical Chemistry
Accounts, 114(1-3): 129-136.
Prince, M.J. and Blanch, H.W., 1990a. Bubble coalescence and break-up in air-sparged bubble
columns. AIChE J., 36(10): 1485-99.
Prince, M.J. and Blanch, H.W., 1990b. Transition electrolyte concentrations for bubble
coalescence. AIChE J. , 36(9): 1425-9.
Pugh, R.J., Weissenborn, P. and Paulson, O., 1997. Flotation in Inorganic Electrolytes - the
Relationship between Recover of Hydrophobic Particles, Surface Tension, Bubble
Coalescence and Gas Solubility. International Journal of Mineral Processing, 51(1-4):
125-138.
Randles, J.E.B., 1957. Ionic hydration and the surface potential of aqueous electrolytes.
Discussions of the Faraday Society, No. 24: 194-199.
Raymond, E.A. and Richmond, G.L., 2004. Probing the Molecular Structure and Bonding of
the Surface of Aqueous Salt Solutions. Journal of Physical Chemistry B, 108(16):
5051-5059.
UU
IR Author M
anuscript UU
IR Author M
anuscript
University of Utah Institutional Repository Author Manuscript
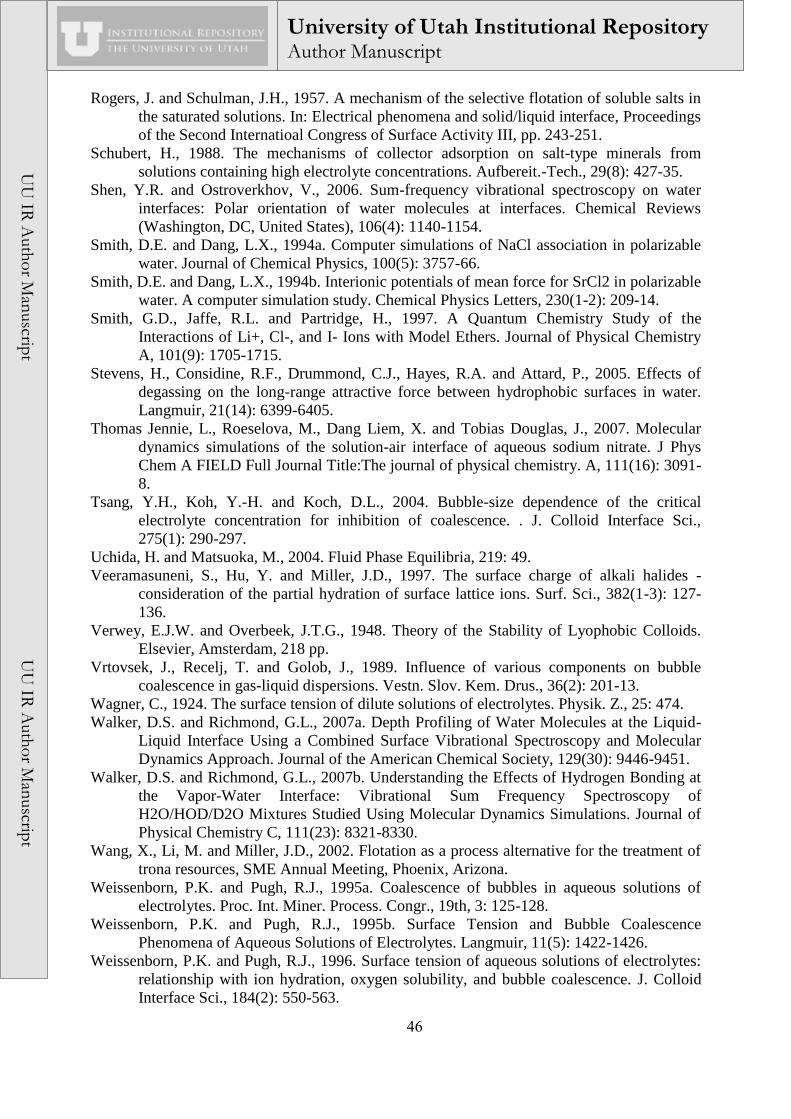
46
Rogers, J. and Schulman, J.H., 1957. A mechanism of the selective flotation of soluble salts in
the saturated solutions. In: Electrical phenomena and solid/liquid interface, Proceedings
of the Second Internatioal Congress of Surface Activity III, pp. 243-251.
Schubert, H., 1988. The mechanisms of collector adsorption on salt-type minerals from
solutions containing high electrolyte concentrations. Aufbereit.-Tech., 29(8): 427-35.
Shen, Y.R. and Ostroverkhov, V., 2006. Sum-frequency vibrational spectroscopy on water
interfaces: Polar orientation of water molecules at interfaces. Chemical Reviews
(Washington, DC, United States), 106(4): 1140-1154.
Smith, D.E. and Dang, L.X., 1994a. Computer simulations of NaCl association in polarizable
water. Journal of Chemical Physics, 100(5): 3757-66.
Smith, D.E. and Dang, L.X., 1994b. Interionic potentials of mean force for SrCl2 in polarizable
water. A computer simulation study. Chemical Physics Letters, 230(1-2): 209-14.
Smith, G.D., Jaffe, R.L. and Partridge, H., 1997. A Quantum Chemistry Study of the
Interactions of Li+, Cl-, and I- Ions with Model Ethers. Journal of Physical Chemistry
A, 101(9): 1705-1715.
Stevens, H., Considine, R.F., Drummond, C.J., Hayes, R.A. and Attard, P., 2005. Effects of
degassing on the long-range attractive force between hydrophobic surfaces in water.
Langmuir, 21(14): 6399-6405.
Thomas Jennie, L., Roeselova, M., Dang Liem, X. and Tobias Douglas, J., 2007. Molecular
dynamics simulations of the solution-air interface of aqueous sodium nitrate. J Phys
Chem A FIELD Full Journal Title:The journal of physical chemistry. A, 111(16): 3091-
8.
Tsang, Y.H., Koh, Y.-H. and Koch, D.L., 2004. Bubble-size dependence of the critical
electrolyte concentration for inhibition of coalescence. . J. Colloid Interface Sci.,
275(1): 290-297.
Uchida, H. and Matsuoka, M., 2004. Fluid Phase Equilibria, 219: 49.
Veeramasuneni, S., Hu, Y. and Miller, J.D., 1997. The surface charge of alkali halides -
consideration of the partial hydration of surface lattice ions. Surf. Sci., 382(1-3): 127-
136.
Verwey, E.J.W. and Overbeek, J.T.G., 1948. Theory of the Stability of Lyophobic Colloids.
Elsevier, Amsterdam, 218 pp.
Vrtovsek, J., Recelj, T. and Golob, J., 1989. Influence of various components on bubble
coalescence in gas-liquid dispersions. Vestn. Slov. Kem. Drus., 36(2): 201-13.
Wagner, C., 1924. The surface tension of dilute solutions of electrolytes. Physik. Z., 25: 474.
Walker, D.S. and Richmond, G.L., 2007a. Depth Profiling of Water Molecules at the Liquid-
Liquid Interface Using a Combined Surface Vibrational Spectroscopy and Molecular
Dynamics Approach. Journal of the American Chemical Society, 129(30): 9446-9451.
Walker, D.S. and Richmond, G.L., 2007b. Understanding the Effects of Hydrogen Bonding at
the Vapor-Water Interface: Vibrational Sum Frequency Spectroscopy of
H2O/HOD/D2O Mixtures Studied Using Molecular Dynamics Simulations. Journal of
Physical Chemistry C, 111(23): 8321-8330.
Wang, X., Li, M. and Miller, J.D., 2002. Flotation as a process alternative for the treatment of
trona resources, SME Annual Meeting, Phoenix, Arizona.
Weissenborn, P.K. and Pugh, R.J., 1995a. Coalescence of bubbles in aqueous solutions of
electrolytes. Proc. Int. Miner. Process. Congr., 19th, 3: 125-128.
Weissenborn, P.K. and Pugh, R.J., 1995b. Surface Tension and Bubble Coalescence
Phenomena of Aqueous Solutions of Electrolytes. Langmuir, 11(5): 1422-1426.
Weissenborn, P.K. and Pugh, R.J., 1996. Surface tension of aqueous solutions of electrolytes:
relationship with ion hydration, oxygen solubility, and bubble coalescence. J. Colloid
Interface Sci., 184(2): 550-563.
UU
IR Author M
anuscript UU
IR Author M
anuscript
University of Utah Institutional Repository Author Manuscript

47
Yalamanchili, M.R., Kellar, J.J. and Miller, J.D., 1993. Adsorption of collector colloids in the
flotation of alkali halide particles. International Journal of Mineral Processing, 39(1-2):
137-153.
Yarar, B., 1985. Borates: Economic Geology and Production. AIME, New York.
Yu, M.-Y. and Jer, R.-M., 1983. Bubble coalescence in dilute surfactant solutions. J. Colloid
Interface Sci., 98: 120-5.
UU
IR Author M
anuscript UU
IR Author M
anuscript
University of Utah Institutional Repository Author Manuscript