Embed Size (px)
Citation preview

UNIVERSITY OF SWAZILAND
MAIN EXAMINATION PAPER 2016
TITLE OF PAPER INFERENTIAL STATISTICS
COURSE CODE ST 220
TIME ALLOWED THREE (3) HOURS
REQUIREMENTS CALCULATOR AND STATISTICAL TABLES
INSTRUCTIONS THIS PAPER HAS SIX (6) QUESTIONS TWO SECTIONS ANSWER ALL QUESTIONSECTION ONE ANY THREE (3) QUESTIONSECTION TWO
AND S IN S IN
1
SECTION ONE
(ANSWER ALL QUESTIONS)
Question 1 [10 marks 1 mark each]
Choose the correct answer from the alternatives provided
1 Which of the following is not a property of the normal distribution
(a) It is symmetric about its mean
(b) It is bell-shaped
(c) It is common
(d) It is unimodal
2 The government claims that students earn an average of SZL4500 during their summer break from studies A random sample of students gave a sample average of SZL3975 and a 95 confidence interval was found to be (SZL3525 lt Jl lt SZL4425) This interval is interpreted to mean that
(a) if the study were to be repeated many times there is a 95 probability that the true average summer earnings is not SZL4500 as the government claims
(b) because our specific confidence interval does not contain the value SZL4500 there is a 95 probability that the true average summer earnings is not SZL4500
(c) if we were to repeat our survey many times then about 95 of all the confidence intervals will contain the value SZL4500
(d) if we repeat our survey many times then about 95 of our confidence intervals will contain the true value of the average earnings of students
(e) there is a 95 probability that the true average earnings are between SZL3525 and SZL4425 for all students
3 Which of the following statements about confidence intervals is incorrect
(a) If we keep the sample size fixed the confidence interval gets wider as we increase the confidence coefficient
(b) A confidence interval for a mean always contains the sample mean
(c) If we keep the confidence coefficient fixed the confidence interval gets narrower as we increase the sample size
(d) If the population standard deviation increases the confidence interval decreases in width
(e) If the confidence intervals for two means do not overlap very much there is evidence that the two population means are different
4 A 95 percent confidence interval for the mean time taken to process new insurance policies is (11 12) days This interval can be interpreted to mean that
(a) only 5 percent of all policies take less than 11 or more than 12 days to process
(b) only 5 percent of all policies take between 11 and 12 days to process
2
(c) about 95 out of every 100 such intervals constructed from random samples of the same size will contain the population mean processing time
(d) the probability is 95 that all policies take between 11 and 12 days to process
(e) none of the above
5 A turkey producer knows from previous experience that profits are maximized by selling turkeys when their average weight is 12 kilograms Before determining whether to put all their full grown turkeys on the market this month the producer wishes to estimate their mean weight Prior knowledge indicates that turkey weights have a standard deviation of around 15 kilograms The number of turkeys that must be sampled in order to estimate their true mean weight to within 05 kilograms with 95 confidence is
(a) 35
(b) 5
(c) 65
(d) 10
(e) 150
6 A confidence statement includes what two things
(a) margin of error and bias
(b) bias and variability
(c) bias and confidence level
(d) confidence level and margin of error
7 I read an advertisement recently in which a credit card company promised that I could reduce my debt by 150 percent Which of the following statements is (are) true
(a) This is possible if my debt is more than 150 dollars
(b) This is possible if my debt has recently increased by at least 150 percent
(c) The companys claim makes no sense
(d) Both (a) and (b)
8 The alternative hypothesis for the Chi-square test of independence is that the variables are
(a) dependent
(b) related
(c) independent
(d) always zero
9 The diameter of ball bearings are known to be normally distributed with unknown mean and variance A random sample of size 25 gave a mean 25 cm The 95 confidence interval had length 4 cm Then
(a) The sample variance is 486
(b) The sample variance is 2603
3
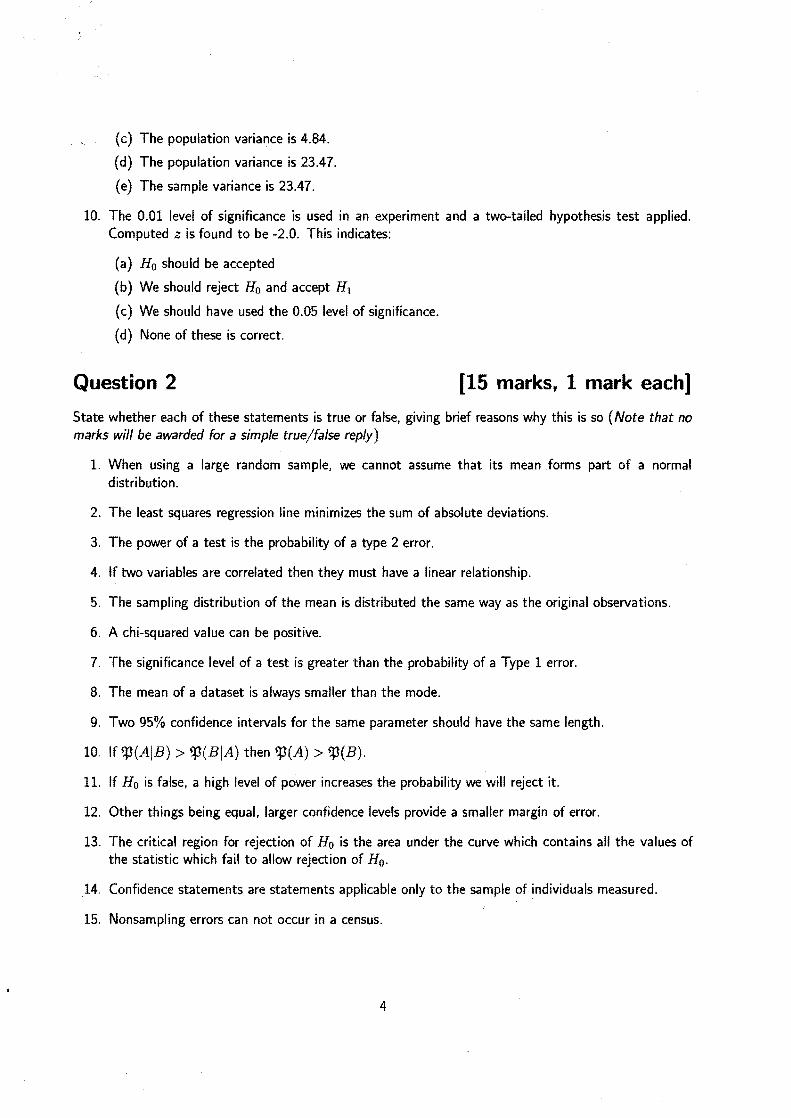
(c) The population variance is 484
(d) The population variance is 2347
(e) The sample variance is 2347
10 The 001 level of significance is used in an experiment and a two-tailed hypothesis test applied Computed z is found to be -20 This indicates
(a) Ho should be accepted
(b) We should reject Ho and accept HI
(c) We should have used the 005 level of significance
(d) None of these is correct
Question 2 [15 marks 1 mark each]
State whether each of these statements is true or false giving brief reasons why this is so (Note that no marks will be awarded for a simple truefalse reply)
1 When using a large random sample we cannot assume that its mean forms part of a normal distribution
2 The least squares regression line minimizes the sum of absolute deviations
3 The power of a test is the probability of a type 2 error
4 If two variables are correlated then they must have a linear relationship
5 The sampling distribution of the mean is distributed the same way as the original observations
6 A chi-squared value can be positive
7 The significance level of a test is greater than the probability of a Type 1 error
8 The mean of a dataset is always smaller than the mode
9 Two 95 confidence intervals for the same parameter should have the same length
10 If ~(AIB) gt ~(BIA) then ~(A) gt ~(B)
11 If Ho is false a high level of power increases the probability we will reject it
12 Other things being equal larger confidence levels provide a smaller margin of error
13 The critical region for rejection of Ho is the area under the curve which contains all the values of the statistic which fail to allow rejection of Ho
14 Confidence statements are statements applicable only to the sample of individuals measured
15 Nonsampling errors can not occur in a census
4
SECTION TWO
(ANSWER ANY THREE QUESTIONS)
Question 3 [25 marks 8+6+8+3] It is assumed that there is a linear relationship between yield of apple trees and the amount of fertiliser supplied to them In order to test this assumption nine apple trees of the same type were randomly selected and supplied weekly with a fixed quantity (x grams) offertiliser The yield of each apple tree (y kilograms) was recorded
43 55 64 69 71 73 77 8039
(a) Calculate the least squar~s line of yon x Ox2 96 LXY 18675 and Ly2 = 37951)
(b) Compute and interpret the coefficient of determination
(c) Is the relationship between the amount of fertiliser supplied and yield meaningful (or significant) Use Q = 005
(d) What prediction will you give for a tree that is treated weekly with 00032 kg of fertiliser
Question 4 [20 marks 10+15] (a) It is suspected that the number of faulty products produced by a manufacturing industry varies
depending on which day of the week they were made In order to test this a random sample of 200 products is taken from the warehouse and after inspection yields the following results
15 20 25 30 35 40 45 50
Day of manufacture Product Monday Tuesday-Thursday Friday Perfect 32 94 34 Faulty 3 21 16
Use the X2 test to decide if these results indicate that there is a connection between faulty products and when they were made
(b) The production manager of Raylite batteries a car battery manufacturer wants to know whether the three machines used for this process (labelled A B and C) produce equal amount of rejects A random sample of shifts for each machine was selected and the number of rejects produced per shift was recorded The number of shifts selected were 6 4 and 5 for machines A Band C respectively The average number of rejects for machines A and C were 105 and 140 respectively The following information is provided as well
Degrees of freedom
Sum of squares
Mean sum of squares F value
bull Battery 4165 Residuals 765 Total
5
By completing the table using the information provided can the production manager of Raylite batteries concluded that the three machines used to manufacture car batteries produce rejects at the same average rate per shift Use a = 005 and show the ANOVA table Also state the necessary assumptions
Question 5 [25 marks 10+10+5]
(a) A consumer report examined potential differences between two brands of tyres The mean life of the tyres is of primary concern The available data measured in thousands of miles are provided below
Sample Sample Sample standard size n meanm deviation s
Brand A 34 214 15 Brand B 38 223 18
Assuming that the population variances for the two brands are equal use an appropriate hypothesis test to determine whether the mean lives of the two brands are different
(b) The student union of a large university gathered a random sample of 525 students to determine whether they are in favour of a new grading system The results are summarized in the table below
Sample Number in favour or size new grading system
Humanities 325 221 Science 200 120
(i) Do the results indicate a difference between humanities and science in the population proporshytions in favour of the new grading system Conduct an appropriate test and comment of your results
(ii) Give a 97 confidence interval for the difference between the two proportions in the population
Question 6 [25 marks 10+4+6+5]
(a) Ten randomly selected oil wells in a large field of oil wells produced 21 19 20 22 24 21 19 22 22 and 20 barrels of crude oil per day Is this evidence at the 001 level of significance that the oil wells are not producing an average of 225 barrels of crude oil per day
(b) Suppose the probability is 030 that any given student in a large class can provide the answer to an assigned problem What is the probability that the fourth student randomly selected by the instructor will be the first one who can provide the answer to the problem
(c) A test is taken by some students their marks are recorded and we are interested in the properties of the sample mean Under the assumption that the marks follow a Normal distribution with exact mean 60 and variance 81 calculate the probability that the mark of a randomly selected student
6
(i) is greater than 595 exactly and
(ii) lies between 59 and 605 exactly
(d) A blended wine is intended to comprise two parts of Sauvignon to one part of Merlot The amounts dispensed to make up a nominal 75c1 bottle of this wine are X cI of Sauvignon and Y cI of Merlot where X and Yare assumed to be independent Normally distributed random variables with respective means 52 and 26 cI and respective variances 1 and 05625 Find the probability that the actual volume of wine dispensed into a bottle is less than the nominal volume
7
00
APPENDIX 1 LIST OF STATISTICAL TABLES TABLE 2 z - N (01) The t distribution
TABLE 1 This table gives the value of t(l(n
The standard normal distribution (z) where n is the degrees of freedom iebull=P[t~This table gives the area under the
standard normal curve between 0 and z Le prO lt Z lt z]
TABLE 3
The Chi-Squared distribution (Xl)
This table gives the value of Xl1dfOl
where dfls the degrees of freedom 2ie = P[X gt X2IdJlI]
o
co
TABLE 4 (a)
F distribution (0 =005)
The entries in this table are critical values of F for which the area under the curve to the right is equal to 005
(l
X 4IifJi
l i
n=005
h lt m o P(dfdfO05)
TABLE 4 (a) continued APPENDIX 2 LIST OF KEY FORMULAE
F distribution (II = 005) ffENlBAklOCATION
Arithmetic mean Ungrouped data
x
Grouped data
t~l~1 x= -n-
Mode Grouped data
= 0 + c(fm-1m_) rna 2Im-I_-I+1
Median Grouped data
c[y-Ilaquo)jM 0 +--~
f WI Ittpound
Lower quartile Grouped data
poundiLJIltraquo)0 = 0 + _lt4_-shy1 1 f
Upper quartile Grouped data
~~-jlaquo)10 3 = Oq3 + ---f-
qJ
Geometric mean Ungrouped data
GM VX I X x2 X X3 X bullbullbull X XII
Weighted Grouped data arithmetic mean
weighted x=
gtmiddot~gt~~(i~)~lt-~gt_ ~ middotmiddotM~~_~S()F[)f~PERSlON AND SKEWNESS
-
Range Range Maximum value - Minimum value + 1 =x -x +1
11Ifl
Variance Mathematical - ungrouped data
2 _ ~(X - xl S -lii=lf
Computational ungrouped data
LX -liX s-=--shy
(11 1)
Standard S = deviation
Coefficient of CV =ls x 100
variation shyshy
lIL(X-X)Pearsons skp (n l)(n - 2)s
coefficient of skewness
k - 3 (Mean - Median) (approximation)S p - Standard deviation
pltbullbullJ~fTYeuro()Neuro~PiS
P(AB) =PIA n B)Conditional PCB)probability
Addition rule Non-mutually exclusive events PIA U B) =PIA) + P(B) - PIA n B)
MutunlIy exclusive events PIA U B) =PIA) + P(B)
Multiplication rule Statistically dependent events P(A n B) P(AB) x P(B)
Statistically independent events PIA n B) =PIA) x P(B)
n = n factorial n x (n - 1) x (n - 2) x (It - 3) x x 3 x 2 x 1
Permutations n ItPr=(n-r)1
ICombinations C II r = rl (n-r)1
tl~~~~~~i~i~~~t~t~qll()NS
Binomial PIx) = Cxlf(l- p)IN) for x =o 1 2 3 n distribution
P(x successes) = xl (~X)I F(l- p)(Iltr) for x =01 23 n
Binomial Mean p =nr-p___ descriptive Standard deviation (J =~np(l- p)
measures
Poisson P(x)=~ for x =O 1 2 3 x distribution
Poisson Mean p=a descriptive Standard deviation (J = fii
measures
-I Standard normal Z=-(fshy
probability
CONfJJl)alCE INTERVALS
Single mean n large variance known q - q
X-ZrnSl$x+z -if
(lower limit) upper limit
n small variance unknown
x-t swx+ s
(lower limit) (upper limit)
Single proportion P z S 1f P + z (lower limit) (upper limit)
Hv~hFE~fSTESTS
Single mean
tv
Single proportion
Difference between two
means
Variance known
X-I- z-stat = -shy
if
Variance unknown n small
t-stat = x-II s
JIT
p-n t-stat = 10-11
1----
Variances known
z-stat =-----i==-c--shy
Variances unknown 111 and fl2 small
2 t-stat = where sp = 11 + 11
1- 2 2 F-stat
shyPaired t-tegt1 f-stat =
andsd
Differences Xl + Xl Xl _ Xl
between two z-stat = where 1f =i1+r PI it p - it 9S proportions
Chi-Sqnared
Overall mean
Total sum of squares (SSTotal)
SST
SSE ~2
SSTotal
MSTotal
MST 41
MSE
(n -l)s~ + (Il 1 )
1 1 ) - 2
x2-stat =
x 1 shy
=E(x- XF j i IJ
t I
rt(x-xl
SST + SSE
_ SSTotal -N=T
_ SST -Fl
_ SSE - N-k
_ MST - Km
~~ lJO

SECTION ONE
(ANSWER ALL QUESTIONS)
Question 1 [10 marks 1 mark each]
Choose the correct answer from the alternatives provided
1 Which of the following is not a property of the normal distribution
(a) It is symmetric about its mean
(b) It is bell-shaped
(c) It is common
(d) It is unimodal
2 The government claims that students earn an average of SZL4500 during their summer break from studies A random sample of students gave a sample average of SZL3975 and a 95 confidence interval was found to be (SZL3525 lt Jl lt SZL4425) This interval is interpreted to mean that
(a) if the study were to be repeated many times there is a 95 probability that the true average summer earnings is not SZL4500 as the government claims
(b) because our specific confidence interval does not contain the value SZL4500 there is a 95 probability that the true average summer earnings is not SZL4500
(c) if we were to repeat our survey many times then about 95 of all the confidence intervals will contain the value SZL4500
(d) if we repeat our survey many times then about 95 of our confidence intervals will contain the true value of the average earnings of students
(e) there is a 95 probability that the true average earnings are between SZL3525 and SZL4425 for all students
3 Which of the following statements about confidence intervals is incorrect
(a) If we keep the sample size fixed the confidence interval gets wider as we increase the confidence coefficient
(b) A confidence interval for a mean always contains the sample mean
(c) If we keep the confidence coefficient fixed the confidence interval gets narrower as we increase the sample size
(d) If the population standard deviation increases the confidence interval decreases in width
(e) If the confidence intervals for two means do not overlap very much there is evidence that the two population means are different
4 A 95 percent confidence interval for the mean time taken to process new insurance policies is (11 12) days This interval can be interpreted to mean that
(a) only 5 percent of all policies take less than 11 or more than 12 days to process
(b) only 5 percent of all policies take between 11 and 12 days to process
2
(c) about 95 out of every 100 such intervals constructed from random samples of the same size will contain the population mean processing time
(d) the probability is 95 that all policies take between 11 and 12 days to process
(e) none of the above
5 A turkey producer knows from previous experience that profits are maximized by selling turkeys when their average weight is 12 kilograms Before determining whether to put all their full grown turkeys on the market this month the producer wishes to estimate their mean weight Prior knowledge indicates that turkey weights have a standard deviation of around 15 kilograms The number of turkeys that must be sampled in order to estimate their true mean weight to within 05 kilograms with 95 confidence is
(a) 35
(b) 5
(c) 65
(d) 10
(e) 150
6 A confidence statement includes what two things
(a) margin of error and bias
(b) bias and variability
(c) bias and confidence level
(d) confidence level and margin of error
7 I read an advertisement recently in which a credit card company promised that I could reduce my debt by 150 percent Which of the following statements is (are) true
(a) This is possible if my debt is more than 150 dollars
(b) This is possible if my debt has recently increased by at least 150 percent
(c) The companys claim makes no sense
(d) Both (a) and (b)
8 The alternative hypothesis for the Chi-square test of independence is that the variables are
(a) dependent
(b) related
(c) independent
(d) always zero
9 The diameter of ball bearings are known to be normally distributed with unknown mean and variance A random sample of size 25 gave a mean 25 cm The 95 confidence interval had length 4 cm Then
(a) The sample variance is 486
(b) The sample variance is 2603
3
(c) The population variance is 484
(d) The population variance is 2347
(e) The sample variance is 2347
10 The 001 level of significance is used in an experiment and a two-tailed hypothesis test applied Computed z is found to be -20 This indicates
(a) Ho should be accepted
(b) We should reject Ho and accept HI
(c) We should have used the 005 level of significance
(d) None of these is correct
Question 2 [15 marks 1 mark each]
State whether each of these statements is true or false giving brief reasons why this is so (Note that no marks will be awarded for a simple truefalse reply)
1 When using a large random sample we cannot assume that its mean forms part of a normal distribution
2 The least squares regression line minimizes the sum of absolute deviations
3 The power of a test is the probability of a type 2 error
4 If two variables are correlated then they must have a linear relationship
5 The sampling distribution of the mean is distributed the same way as the original observations
6 A chi-squared value can be positive
7 The significance level of a test is greater than the probability of a Type 1 error
8 The mean of a dataset is always smaller than the mode
9 Two 95 confidence intervals for the same parameter should have the same length
10 If ~(AIB) gt ~(BIA) then ~(A) gt ~(B)
11 If Ho is false a high level of power increases the probability we will reject it
12 Other things being equal larger confidence levels provide a smaller margin of error
13 The critical region for rejection of Ho is the area under the curve which contains all the values of the statistic which fail to allow rejection of Ho
14 Confidence statements are statements applicable only to the sample of individuals measured
15 Nonsampling errors can not occur in a census
4
SECTION TWO
(ANSWER ANY THREE QUESTIONS)
Question 3 [25 marks 8+6+8+3] It is assumed that there is a linear relationship between yield of apple trees and the amount of fertiliser supplied to them In order to test this assumption nine apple trees of the same type were randomly selected and supplied weekly with a fixed quantity (x grams) offertiliser The yield of each apple tree (y kilograms) was recorded
43 55 64 69 71 73 77 8039
(a) Calculate the least squar~s line of yon x Ox2 96 LXY 18675 and Ly2 = 37951)
(b) Compute and interpret the coefficient of determination
(c) Is the relationship between the amount of fertiliser supplied and yield meaningful (or significant) Use Q = 005
(d) What prediction will you give for a tree that is treated weekly with 00032 kg of fertiliser
Question 4 [20 marks 10+15] (a) It is suspected that the number of faulty products produced by a manufacturing industry varies
depending on which day of the week they were made In order to test this a random sample of 200 products is taken from the warehouse and after inspection yields the following results
15 20 25 30 35 40 45 50
Day of manufacture Product Monday Tuesday-Thursday Friday Perfect 32 94 34 Faulty 3 21 16
Use the X2 test to decide if these results indicate that there is a connection between faulty products and when they were made
(b) The production manager of Raylite batteries a car battery manufacturer wants to know whether the three machines used for this process (labelled A B and C) produce equal amount of rejects A random sample of shifts for each machine was selected and the number of rejects produced per shift was recorded The number of shifts selected were 6 4 and 5 for machines A Band C respectively The average number of rejects for machines A and C were 105 and 140 respectively The following information is provided as well
Degrees of freedom
Sum of squares
Mean sum of squares F value
bull Battery 4165 Residuals 765 Total
5
By completing the table using the information provided can the production manager of Raylite batteries concluded that the three machines used to manufacture car batteries produce rejects at the same average rate per shift Use a = 005 and show the ANOVA table Also state the necessary assumptions
Question 5 [25 marks 10+10+5]
(a) A consumer report examined potential differences between two brands of tyres The mean life of the tyres is of primary concern The available data measured in thousands of miles are provided below
Sample Sample Sample standard size n meanm deviation s
Brand A 34 214 15 Brand B 38 223 18
Assuming that the population variances for the two brands are equal use an appropriate hypothesis test to determine whether the mean lives of the two brands are different
(b) The student union of a large university gathered a random sample of 525 students to determine whether they are in favour of a new grading system The results are summarized in the table below
Sample Number in favour or size new grading system
Humanities 325 221 Science 200 120
(i) Do the results indicate a difference between humanities and science in the population proporshytions in favour of the new grading system Conduct an appropriate test and comment of your results
(ii) Give a 97 confidence interval for the difference between the two proportions in the population
Question 6 [25 marks 10+4+6+5]
(a) Ten randomly selected oil wells in a large field of oil wells produced 21 19 20 22 24 21 19 22 22 and 20 barrels of crude oil per day Is this evidence at the 001 level of significance that the oil wells are not producing an average of 225 barrels of crude oil per day
(b) Suppose the probability is 030 that any given student in a large class can provide the answer to an assigned problem What is the probability that the fourth student randomly selected by the instructor will be the first one who can provide the answer to the problem
(c) A test is taken by some students their marks are recorded and we are interested in the properties of the sample mean Under the assumption that the marks follow a Normal distribution with exact mean 60 and variance 81 calculate the probability that the mark of a randomly selected student
6
(i) is greater than 595 exactly and
(ii) lies between 59 and 605 exactly
(d) A blended wine is intended to comprise two parts of Sauvignon to one part of Merlot The amounts dispensed to make up a nominal 75c1 bottle of this wine are X cI of Sauvignon and Y cI of Merlot where X and Yare assumed to be independent Normally distributed random variables with respective means 52 and 26 cI and respective variances 1 and 05625 Find the probability that the actual volume of wine dispensed into a bottle is less than the nominal volume
7
00
APPENDIX 1 LIST OF STATISTICAL TABLES TABLE 2 z - N (01) The t distribution
TABLE 1 This table gives the value of t(l(n
The standard normal distribution (z) where n is the degrees of freedom iebull=P[t~This table gives the area under the
standard normal curve between 0 and z Le prO lt Z lt z]
TABLE 3
The Chi-Squared distribution (Xl)
This table gives the value of Xl1dfOl
where dfls the degrees of freedom 2ie = P[X gt X2IdJlI]
o
co
TABLE 4 (a)
F distribution (0 =005)
The entries in this table are critical values of F for which the area under the curve to the right is equal to 005
(l
X 4IifJi
l i
n=005
h lt m o P(dfdfO05)
TABLE 4 (a) continued APPENDIX 2 LIST OF KEY FORMULAE
F distribution (II = 005) ffENlBAklOCATION
Arithmetic mean Ungrouped data
x
Grouped data
t~l~1 x= -n-
Mode Grouped data
= 0 + c(fm-1m_) rna 2Im-I_-I+1
Median Grouped data
c[y-Ilaquo)jM 0 +--~
f WI Ittpound
Lower quartile Grouped data
poundiLJIltraquo)0 = 0 + _lt4_-shy1 1 f
Upper quartile Grouped data
~~-jlaquo)10 3 = Oq3 + ---f-
qJ
Geometric mean Ungrouped data
GM VX I X x2 X X3 X bullbullbull X XII
Weighted Grouped data arithmetic mean
weighted x=
gtmiddot~gt~~(i~)~lt-~gt_ ~ middotmiddotM~~_~S()F[)f~PERSlON AND SKEWNESS
-
Range Range Maximum value - Minimum value + 1 =x -x +1
11Ifl
Variance Mathematical - ungrouped data
2 _ ~(X - xl S -lii=lf
Computational ungrouped data
LX -liX s-=--shy
(11 1)
Standard S = deviation
Coefficient of CV =ls x 100
variation shyshy
lIL(X-X)Pearsons skp (n l)(n - 2)s
coefficient of skewness
k - 3 (Mean - Median) (approximation)S p - Standard deviation
pltbullbullJ~fTYeuro()Neuro~PiS
P(AB) =PIA n B)Conditional PCB)probability
Addition rule Non-mutually exclusive events PIA U B) =PIA) + P(B) - PIA n B)
MutunlIy exclusive events PIA U B) =PIA) + P(B)
Multiplication rule Statistically dependent events P(A n B) P(AB) x P(B)
Statistically independent events PIA n B) =PIA) x P(B)
n = n factorial n x (n - 1) x (n - 2) x (It - 3) x x 3 x 2 x 1
Permutations n ItPr=(n-r)1
ICombinations C II r = rl (n-r)1
tl~~~~~~i~i~~~t~t~qll()NS
Binomial PIx) = Cxlf(l- p)IN) for x =o 1 2 3 n distribution
P(x successes) = xl (~X)I F(l- p)(Iltr) for x =01 23 n
Binomial Mean p =nr-p___ descriptive Standard deviation (J =~np(l- p)
measures
Poisson P(x)=~ for x =O 1 2 3 x distribution
Poisson Mean p=a descriptive Standard deviation (J = fii
measures
-I Standard normal Z=-(fshy
probability
CONfJJl)alCE INTERVALS
Single mean n large variance known q - q
X-ZrnSl$x+z -if
(lower limit) upper limit
n small variance unknown
x-t swx+ s
(lower limit) (upper limit)
Single proportion P z S 1f P + z (lower limit) (upper limit)
Hv~hFE~fSTESTS
Single mean
tv
Single proportion
Difference between two
means
Variance known
X-I- z-stat = -shy
if
Variance unknown n small
t-stat = x-II s
JIT
p-n t-stat = 10-11
1----
Variances known
z-stat =-----i==-c--shy
Variances unknown 111 and fl2 small
2 t-stat = where sp = 11 + 11
1- 2 2 F-stat
shyPaired t-tegt1 f-stat =
andsd
Differences Xl + Xl Xl _ Xl
between two z-stat = where 1f =i1+r PI it p - it 9S proportions
Chi-Sqnared
Overall mean
Total sum of squares (SSTotal)
SST
SSE ~2
SSTotal
MSTotal
MST 41
MSE
(n -l)s~ + (Il 1 )
1 1 ) - 2
x2-stat =
x 1 shy
=E(x- XF j i IJ
t I
rt(x-xl
SST + SSE
_ SSTotal -N=T
_ SST -Fl
_ SSE - N-k
_ MST - Km
~~ lJO


![SWAZILAND GOVERNMENT GAZETTE EXTRAORDINARY - Swaziland Competition … Commission Regulations... · SWAZILAND GOVERNMENT GAZETTE EXTRAORDINARY VOL. XLVIII] ... \ THE COMPETITION ACT,](https://img.pdfslide.us/doc/110x75/5ad0acb57f8b9a8b1e8e2be8/swaziland-government-gazette-extraordinary-swaziland-competition-commission.jpg)


![[--------------------- ---------------------] Chapter 8 Interval Estimation n Interval Estimation of a Population Mean: Large-Sample Case Large-Sample](https://img.pdfslide.us/doc/110x75/56649e895503460f94b8e9b8/-chapter-8-interval-estimation.jpg)