Embed Size (px)
Citation preview

1
University of São Paulo
“Luiz de Queiroz” College of Agriculture
Nitrogen impacts on maize yield and nutrient use efficiency in contrasting
stress environments
Adilson Nunes da Silva
Thesis presented to obtain the degree of Doctor in
Science. Area: Crop Science
Piracicaba
2015

2
Adilson Nunes da Silva
Agronomist
Nitrogen impacts on maize yield and nutrient use efficiency in contrasting stress
environments
versão revisada de acordo com a resolução CoPGr 6018 de 2011
Advisor:
Prof. Dr. KLAUS REICHARDT
Thesis presented to obtain the degree of Doctor in
Science. Area: Crop Science
Piracicaba
2015

Dados Internacionais de Catalogação na Publicação
DIVISÃO DE BIBLIOTECA - DIBD/ESALQ/USP
Silva, Adilson Nunes da Nitrogen impacts on maize yield and nutrient use efficiency in contrasting stress
environments / Adilson Nunes da Silva. - - versão revisada de acordo com a resolução CoPGr 6018 de 2011. - - Piracicaba, 2015.
178 p. : il.
Tese (Doutorado) - - Escola Superior de Agricultura “Luiz de Queiroz”.
1. Tempo e doses de nitrogênio 2. Densidade de plantio 3. Fotossíntese 4. Genótipos tolerantes ao deficit hídrico I. Título
CDD 633.15 S586n
“Permitida a cópia total ou parcial deste documento, desde que citada a fonte – O autor”

3
DEDICATION
To my parents Antonio Nunes and Nadir Olivia, who supported me with all the love that they
had to offer.

4

5
ACKNOWLEDGMENT
I am so grateful for all the support I have received while working on my dissertation.
First, none of this would have been possible without God’s love and the endless possibilities
He creates. Next, my family’s support has been endless. My parents, Antonio Nunes and
Nadir Olivia, and my brother and sister, André and Adriana, have always been there for me
with support, love, and encouragement. Their presence in my life has made this possible.
My advisor, Dr. Klaus Reichardt, has also been instrumental in my success. I cannot
thank him enough for his friendship, mentoring, and patience. In addition, my committee has
been very helpful. Specifically, Dr. Tony J. Vyn, his trust in me, and the opportunities he
provided for me at Purdue University helped make my dissertation possible.
Along these lines, I would like to thank Luiz de Queiroz College of Agriculture,
University of Sao Paulo (USP) and Purdue University. The departments of Crop Science and
Agronomy both provided an excellent education and numerous opportunities. Special thanks
needs to be given to two secretaries at USP, Luciane Aparecida Toledo and Maria Solizete
Silva, for answering numerous questions, providing moral support, and their continued
professionalism. At Purdue University, technicians Alicia West and Terry West taught me a
great deal about the equipment and methodologies in agronomy, thank you.
To Professor Paulo Cesar Ocheuze Trivelin and the Stabel Isotope Laboratory at
CENA/USP, I would like to thank for the access to the research area and the use of laboratory
equipment for my Brazilian research.
I would also like to thank Professors Durval Dourado Neto, Ricardo Kluge, Carlos
Guilherme Silveira Pedreira, José Laércio Favarin, Ricardo Antunes de Azevedo, Simone
Mello, Paulo Roberto de Camargo e Castro, Pedro Christoffoleti, and Ricardo Ferraz de
Oliveira, for access and use of laboratory equipment and the questions and help they were
willing to provide. The students, both graduate and undergraduate, who collected and
analyzed samples with me in the field and in the laboratories, were immensely helpful.
The continued financial support I received through scholarships from National
Counsel for Scientific and Technological Development (CNPq), my first year, and Sao Paulo
Research Foundation (FAPESP) for each progressive year, made my studies possible, thank
you.
To Professor Simone Alves Silva (UFRB) for introducing me to “Science” when I was
undergraduate student. Thank you for all that you have done for me.

6
Last, but not least, I am so grateful to all of my friends for their support,
encouragement, friendship, and help throughout this whole process. Special thanks needs to
be given to Márcia Carvalho, Marcela Muller, Paula Caroline, Jonathas Graças, Ronaldo
Sakai, Yuri Ramos, Naiara Célida, Gentil Cavalheiro, Cleucione Pessoa, Marilda (New Planet
Idiomas), Ana Schwantes, Halan Vieira, Rafael Labigalini, Karla Vilaça, Diego Pequeno,
Valdson Silva, Anderson Ramos, Clíssia Barboza, Carolina Andrade, Denis Costa, Rogério
Lorençoni, Leonardo Cirilo, Rafael Bortolotto, Francynês Macedo, Gabriel Daneluzzi, Tiago
Tezotto, Mateus Donega, Thiago Costa, Amanda Silva, Keru Chen, Hyungju Andy Park,
Martin Bielich, Heather Akin, Alencar Xavier, Jason Roth, Péter Kovács, Martha Rebellon-
Pavese, Maleja Bueno, Juan Rebellon, Jeff Pavese, Yolanda Montoya, Maira Aponte-
Rodriguez, Cesar Garbossa, Hebert, Cristiano, Sherwood Lee, Mabel Munoz, Oscar, Eduardo
Mariano, Evandro, Leonardo Cesar, and José Marcos. There are too many more people to list
who I owe a great deal too, but thank you all for taking the time to help me. Words alone
cannot express how appreciative I am of all of you. Thank you, for all that you have done for
me.

7
SUMMARY
RESUMO....................................................................................................................................9
ABSTRACT..............................................................................................................................11
1 INTRODUCTION .................................................................................................................13
1.1 Literature review.................................................................................................................15
1.1.1 Importance of maize crop for Brazil………...………...……….………………………15
1.1.2 Breeding for environmental stress tolerance and grain yield improvement
…..……………………………………………..…………………………….…………....…..16
1.1.3 Maize crop management aiming high yields…………………….………………...…...18
2.0 Principals of maize development …………………………………………...……………20
3.0 Final Consideration………………….………………………………………….……..….23
References..…………..………...……………………………………………………………..23
2 MAIZE NUTRIENT UPTAKE AND PARTITIONING FOR DROUGHT AND NON-
DROUGHT TOLERANT HYBRIDS INFLUENCED BY VARIED PLANT DENSITY AND
NITROGEN RATE………………....………………………………………………………...31
Abstract……………………………………………………………………………………….31
2.1 Introduction.........................................................................................................................32
2.2 Materials and Methods........................................................................................................34
2.3 Results and Discussion........................................................................................................38
2.4 Conclusions.........................................................................................................................62
References.................................................................................................................................96
3 PHYSIOLOGICAL CHARACTERIZATION OF RECENT DROUGHT-TOLERANT
MAIZE HYBRIDS AT VARYING STRESS LEVELS: PHOTOSYNTHESIS, GRAIN
YIELD, AND GRAIN YIELD COMPONENTS……………………...………...………….105
Abstract………………………..…………………………………………………………….105
3.1 Introduction......................................................................................................................106
3.2 Materials and Methods......................................................................................................107
3.3 Results and Discussion......................................................................................................110
3.4 Conclusions.......................................................................................................................117
References...............................................................................................................................131
4 MAIZE RESPONSE TO NITROGEN APPLICATION TIMING AND CORRELATION
AMONG LEAF VARIABLES WITH GRAIN YIELD AND COMPONENTS……….....137
Abstract……………………………………………………………………………………...137

8
4.1 Introduction.......................................................................................................................137
4.2 Materials and Methods......................................................................................................139
4.3 Results and Discussion......................................................................................................142
4.4 Conclusions.......................................................................................................................148
References...............................................................................................................................154
5. GENERAL DISCUSSION ............................................................................................... 157
APPENDICES........................................................................................................................159

9
RESUMO
Impactos do nitrogênio sobre o rendimento de milho e eficiência de uso do nutriente em
ambientes de estresses contrastantes
Adubação nitrogenada (N) e o estresse hídrico tem grande influência no rendimento
de grãos de milho, assim, estudos sobre genótipos e o manejo dessa cultura são muito
importantes para o aumento da produtividade. Este estudo é apresentado em três capítulos. Os
dois primeiros foram desenvolvidos nos Estados Unidos e o terceiro no Brasil. Os objetivos
são apresentados na seguinte ordem: (1) o objetivo principal foi entender quais características,
se existirem, diferem entre híbridos tolerantes e não-tolerantes à seca, com semelhança em
maturidade, que regem a absorção de nutrientes e concentrações destes sob diferentes
tratamentos de cultivo e sua influência na produção de grãos. (2) O objetivo principal foi
investigar as respostas fisiológicas (fotossíntese (A) e transpiração (E)) e a produção de milho
em genótipos, com semelhante maturidade, tolerantes e não tolerantes ao déficit hídrico
(P1151 vs. P1162 e P1498 vs. 33D49) em relação a variação de densidade de plantas e doses
de N. (3) O principal objetivo foi investigar as respostas de milho à aplicação de nitrogênio
em cobertura, ureia fertilizante (15N), em diferentes estádios fenológicos. O objetivo
secundário foi: verificar a correlação entre as clorofilas e carotenoides com SPAD (avaliado
em V14 e V16) e destas com a biomassa total (BM), índice de colheita (IC), produção de
grãos (PG) e do conteúdo de N nos grãos. Como resultados: (1 e 2) Todos os híbridos
responderam de forma semelhante para para PG em relação aos tratamentos. O Híbrido
P1151 demonstrou semelhantes A e E e menor area foliar do que seu semelhante em
maturidade (P1162). Híbrido P1498 pareceu ser capaz de manter a taxa de transpiração foliar
e de fotossíntese mais elevadas do que 33D49, durante o período de enchimento de grãos.
Este híbrido apresentou uma melhor persistência na captação de água pela raiz no final da
estação de cultivo. Geralmente maiores BM e PG na maturidade foram relacionadas a
menores intervalos de diferenciação floral e a maior acumulação, na estação seca, de
macronutrientes (P e S) no colmo, sendo as ultimas características consideradas como
mecanismos de tolerância à seca. (3) A cultura do milho respondeu de forma semelhante em
relação a PG à aplicação de N. O teor de nitrogênio nos grãos derivado do 15N fertilizante e a
eficiência de uso do fertilizante nitrogenado foram maiores em relação a aplicação de N nos
primeiros estádios. Houve correlação positiva e siginificativa para SPAD com a maioria dos
pigmentos no estádio de avaliação V16. Provando ser um instrumento eficaz de avaliação
indireta de clorofilas e carotenóides em estágios iniciais. A clorofila b, avaliada em V16,
apresentou correlação positiva significativa (p<0,05) com teor de N nos grãos, PG, e BM, a
clorofila total em V16 também apresentou uma correlação positiva com o teor de N nos grãos,
no entanto, as clorofilas a e total, avaliadas em V14, apresentaram correlação negativa com
PG. Assim, a medição do teor de pigmentos com o objetivo de estudar as condições
nutricionais e previr a produção de grãos deve ser realizada após o estágio V14.
Palavras-chave: Tempo e doses de nitrogênio; Densidade de plantio; Fotossíntese; Genótipos
tolerantes ao déficit hídrico

10

11
ABSTRACT
Nitrogen impacts on maize yield and nutrient use efficiency in contrasting stress
environments
Nitrogen (N) fertilization and drought stress have large influence on maize grain yield,
thus studies about genotypes and management technologies are very important to increase
maize production. This study is presented in three chapters; the first two were undertaken in
the United States of America and the third one in Brazil. The following objectives are
addressed in this order: (1) The primary objective was to understand which traits, if any, differ
between similar-maturity tolerant and non-drought tolerant hybrids that govern nutrient
uptake and concentrations under different management treatments (varied plant densities (PD)
and N rates) and their influence on grain yield (GY). (2) The primary objective was to
investigate the physiological and yield responses of comparable-maturity drought and non-
drought tolerant hybrids (P1151 vs. P1162, and P1498 vs. 33D49) to varied plant density and
N rates. (3) The main objective was to investigate the responses of maize to sidedress N
applications, using isotopically labeled urea fertilizer (15N), at different development stages.
The secondary objective was to verify the correlations between the chlorophylls and
carotenoids with SPAD index (evaluated at V14 and V16) and all these parameters with total
biomass (BM), harvest index (HI), GY and grain N content. The major results for objectives
1 and 2 were as follows: All hybrids had similar GY responses to PD (near 79,000 versus near
100,000 plants ha-1) and N rate (from 0 to 269 kg N ha-1) treatment factors. Hybrid 1
(AQUAmax™ P1151) demonstrated similar leaf photosynthetic (A) and transpiration (E )
rates than its non-drought tolerant counterpart of similar maturity since Hybrid 2 (P1162) had
a higher leaf area Index (LAI) (at the R2 and R3 stages) and a similar GY as Hybrid 1. Hybrid
AQUAmax™ P1498 maintained higher leaf A and E rates than P33D49 during the grain-fill
period, thus perhaps demonstrating improved persistence in root water uptake late in the
season. There was no single trait differentiation in photosynthesis or transpiration between
drought and non-drought tolerant hybrids. Highest BM and GY at maturity generally
followed shorter anthesis-silking intervals and more stover macronutrient (P and S)
accumulation, in the drought season, so these characteristics appeared to be important
drought-tolerant mechanisms regardless of hybrid designations. The major findings from the
objective 3 investigations: Maize crop responded similarly for GY to timing of sidedress N
application. Grain N content from 15N fertilizer and N uptake and efficiency were greater for
early N applications. SPAD values correlated positively with most pigment variables at V16
in both seasons, thus proving that SPAD was an efficient instrument of indirect evaluation of
chlorophylls and carotenoids in maize leaves at early stages. Chlorophyll b at V16, sample
stage, was positively correlated (P<0.05) with grain N content, GY, and BM, and total
chlorophyll at V16 was positively correlated with GY and grain N content. However the
chlorophylls a and total, evaluated at V14, were negatively correlated with GY. So,
measurement chlorophyll and carotenoid pigment contents should be done after V14 stage
when studies aim to evaluate crop nutritional conditions and prescribe future grain production
practices.
Keywords: Nitrogen time and rates; Plant density; Photosynthesis; Drought tolerant genotypes

12

13
1 INTRODUCTION
Maize (Zea mays L.) is one of the three most cultivated grains in terms of total MT
(metric ton) production in the world, with approximately 960 million tons (FAO, 2013).
United States of America, China, Argentina and Brazil are the largest producers, accounting
for 70% of world´s production (PIONEER, 2014). To encounter the demand for food for the
growing world population, a significant increase in the world grain production is required,
particularly in crops grown in developing countries. Grain yield (GY) has increased during
the last decades in many parts of the world as a result of agronomics practices and genetic
improvement of the maize crop.
The improvement in maize GY through the last decades, mostly due to increased
tolerance to crowding intensity, has indirectly been accompanied by a decline in grain N
concentration (%Ng) (DUVICK, 1997; CIAMPITTI; VYN, 2012). Therefore, gains over time
in N use efficiency (NUE) (yield versus applied N ratio) (MOLL et al., 1982). The average
U.S. maize yield has risen at a rate of 118 kg ha-1 yr-1 from 1930 to 2000, GY increased from
1.5 Mg ha-1 in the 1930ies to 9.5 Mg ha-1 for the 2006-2008 period, and similar rates of
improvement have been observed in other parts of the world (TOLLENAAR; LEE, 2011).
Furthermore, greater GY of newer maize hybrids might have resulted in a concomitant
increase in resource capture and/or resource use efficiency. In the same way, GY increases
can be explained as a result of higher tolerance of hybrids to different categories of
environmental stresses associated to the efficient use of nutrients and higher plant densities.
The water limited availability (drought) is the main stress factor limiting crop production
(SEGHATOLESLAMI KAFI.; MAJIDI, 2008; GOLBASHY et al., 2010). Drought is a
permanent constraint to agricultural production in many developing countries, and an
occasional cause of losses of agricultural production in developed countries (GOLBASHY et
al., 2010).
In some years, yield can be significantly reduced by transient water limitations of
varying timing, duration, and severity. Many of these water limitations have minor to
moderate impact on yield. However, widespread and continued drought that substantially
reduces grain yield over a wide area can occur in some years (BOYER et al., 2013). When
maize encounters water deficits, there is a decline in the photosynthesis per plant. This can be
due to a reduction in light interception as leaf expansion is reduced or as leaves senesce, and
to reductions in C fixation per unit leaf area as stomata close or as photo‐oxidation damages
the photosynthetic mechanism (LEUNG; GIRAUDAT, 1998; MUGO; BÄNZIGER.;

14
EDMEADES, 2000). Therefore, one of the main goals in breeding programs is selection of
the best genotypes under drought stress conditions (RICHARDS et al., 2002; MORADI et al.,
2012). Consequently, seed companies in response to these problems apply diverse strategies
to improve crop tolerance to drought stress (COOPER et al., 2014).
Past research has studied the physiological effects of water stress in maize
(SANCHEZ et al., 1983; ÇAKIR, 2004; MARKELZ; OSTERMAN; MITCHELL, 2011) as
well as physiological traits that may confer increased drought tolerance (BÄZINGER et al.,
2000; CAMPOS et al., 2006; LOPES et al., 2011). Therefore, little public and physiology-
focused research publications are available that have investigated these recently released
drought-tolerant hybrids.
Grain yield is a complex trait and is dependent on many factors including vigorous
growth, adequate water and nutrient supplies, enhanced solar radiation interception and
conversion to chemical energy, and improved genetics (RUSSELL, 1991). Nutrient, mainly
Nitrogen (N), use efficiency is one important factor for maize production, because the N
stress reduces GY by delaying plant growth and development (UHART; ANDRADE, 1995)
and reducing the leaf area index, leaf area duration, and photosynthetic rate (SINCLAIR;
HORIE, 1989; CONNOR et al., 1993) among other negative factors.
Management techniques and breeding approaches for N use efficiency differ in
different production conditions and regions in the world. Accordingly, the understanding of
the process that governs crop N uptake and its distribution in plants is of main importance to
optimize crop production with minimum N input (CASSMAN et al., 2002). Studies about
macro- and micro-nutrient uptake and partitioning, such N, P, K and S and Zn, Fe, Mn and Cu
for modern maize hybrids are also important to understand the mechanisms that govern
nutrient assimilation and their influence on grain yield under different environmental
conditions.
For N management studies it is also important to give attention to the evaluation
methods of this nutrient in the plant. Traditional methods used to determine the amount of
chlorophyll in the leaf require destruction of tissue samples and much work in the extraction
and quantification processes. The development of a portable chlorophyll meter, which allows
instantaneous measurements of the N amount corresponding to its content in the leaf without
destroying it, is an alternative to estimate the relative content of these pigments in the leaf
(DWYER et al., 1991; ARGENTA et al, 2001). The knowledge about the effective influence
of the factors that determine the performance of the plant can contribute decisively to
minimize the stress caused by nitrogen deficiency. Thus, it is extremely important to obtain

15
more reviews related to the correlation between the real content of chlorophyll and real
carotenoids with the values obtained by indirect chlorophyll (SPAD) measurements in the
early development stages of the maize.
This study is presented in three chapters. The first two were developed in the United
States of America and the third one in Brazil. The following objectives are presented in this
order: (1) the primary objective was to understand which traits, if any, differ between similar
maturity-tolerant and non-drought tolerant hybrids that govern the nutrient uptake and
concentrations under different management treatments (varied plant densities and N rates) and
their influence on GY. The second objective was to evaluate if the drought-tolerant hybrids
have an overall higher N recovery and use efficiencies, produce more grain per unit of whole-
plant nutrient uptake, and achieve higher N, P, K and S internal efficiency and indexes,
compared to the non-drought tolerant hybrids at varied plant densities and N rates. (2) The
primary objective was to investigate the physiological and yield responses of comparable-
maturity drought and non-drought tolerant hybrids (P1151 vs. P1162, and P1498 vs. 33D49)
to varied plant density and N rates. The secondary objective was to specifically examine leaf
photosynthesis (A) and transpiration (E) rates of hybrids across the growing season in
response to varied PD and N rate treatments. (3) The main objective was to investigate the
responses of maize to the nitrogen application, urea fertilizer (15N), in side-dress at different
development stages. The secondary objective was: verifying the correlation between the
chlorophylls and carotenoids with the SPAD index and these ones with total biomass, harvest
index (HI), grain yield (GY) and grain N content in response to the nitrogen side-dress in
different development stages.
1.1 Literature review
1.1.1 Importance of maize crop for Brazil
Maize production in Brazil shows a growth rate of about 4% per year. Cultivated
under different cropping systems, maize is grown mainly in the Center-West, Southeast and
South regions, in the states of Paraná, Mato Grosso, Minas Gerais, Goiás, Mato Grosso do
Sul, and Rio Grande do Sul, Brazil. A study of the production projection of this cereal made
by “Assessoria de Gestão Estratégica do Mapa”, indicates an increase of 19.11 million tons
between harvests of 2008/2009 and 2019/2020. In 2019/2020, a production of 70.12 millon
tons is expected, and for 2022/2023, 93.6 million tons (BRASIL, 2014).

16
The productive chain of maize is one of the most important of the Brazilian
agribusiness, corresponding to 37% of the national grain production. The growing demand for
grain, both nationally and internationally, reinforces the high potential of the sector. Together
with soybean, maize is the basic input for poultry and swine feed, two very competitive
markets that generate revenues to Brazil (BRASIL, 2007). There is an ever-growing demand
for maize due to the recent and fast development of Asiatic countries, increasing grain
consumption for animal feed and for alcohol production in the United States.
1.1.2 Breeding for environmental stresses tolerance and grain yield improvement
In the seed market, the maize genotypes availability with high yields and tolerance to
abiotic stresses characteristics is a challenge for the breeding programs. Plants adaptation to
adverse environments or situations under suboptimal environmental factors involves an
adaptation to multiple stresses that comes together with direct and indirect interactions. Thus
it is very important to identify and characterize genotypes, as well as studies on the interaction
and overlapping mechanisms, both physiologically as biochemical and molecular (DURÃES
et al., 2004).
Satisfactory results have been obtained with maize, improving the drought tolerance in
genotypes (MONNEVEUX et al., 2006), efforts in the architecture of plants has also been
made for improvements in the root system, to improve water absorption and nutrients and
disposal of leaves, in order to improve sunlight interception of over the canopy.
In relation to plant physiology, the improvements can be attributed to several factors
such as maintenance and longevity leaves state "stay-green" (THOMAS; HOWARTH, 2000).
The progress of leaf senescence can normally be observed by naked eye when there is
chlorophyll loss, so that the expression “stay-green” is generically assigned to an individual
when the senescence shows up later in relation to a reference genotype (THOMAS; SMART,
1993). Besides being related to water stress tolerance, the “stay green” state increases the
tolerance to insects and diseases, makes the crop more tolerant to a higher plant density, being
consequently related to productivity.
The efficiency in the uptake, partitioning and effective use of nutrients by the plant is
also very important for the production of maize. The efficiency in fertilizer use depends on
the ability of the roots of the plant has to obtain high concentrations of nutrients that are
available in the soil. Thus, in order to obtain more effective root systems, breeders have
studied variations in root system morphology and kinetic parameters of maize genotypes

17
(BALIGAR; BARBER, 1979; ANGHINONI et al., 1989), highlighting the importance of
handling of them in breeding programs to obtain more efficient cultivars in nutrient
absorption. The root system morphology is determined by the length, volume, area and radius
of the roots and root hairs (SCHENK; BARBER, 1979) that varies in direct proportion to the
length and thickness of roots because these attributes influence the absorption surface
(VILELA; ANGHINONI, 1984).
Other factors that have provided improvements in grain maize production are the high
activity of the source, leaves, and ability to meet the demand of the drains, ears
(TOLLENNAAR; WU, 1999), in which the leaves have shown greater photosynthetic
capacity, and retaining capacity of nitrogen uptake by the plant with extended nutrient
accumulation during the reproductive stage (CIAMPITTI; VYN, 2012), the older hybrids the
highest rate of nitrogen absorption was observed in periods prior the flowering period.
1.1.3 Maize crop management aiming high yields
1.1.3.1 Tillage influence in maize production
Several agronomic practices are employed to increase grain production in maize,
among them is important the soil preparation aiming weed control to favor crop development.
However, the intensive use of the soil can lead to the formation of compacted soil layers, to
the reduction of soil aggregate stability, and to the formation of a larger number of
microspores what may induce to a greater tendency for soil loss by erosion. In this way, the
maintenance of crop residues at soil surface in the minimum tillage management system
provides a better water retention and a better protection against the direct impact of rain drops
(IGUE, 1984), in comparison to the residue incorporation made in the conventional soil
preparation.
Minimum tillage has been highlighted among the most employed management
technologies for maize cultivation, mainly due to the awareness of farmers of the need for a
better quality of soils, looking to a more sustainable agriculture (COELHO, 2006). This type
of management is characterized by crop seeding without revolving the soil, crop rotation and
residue maintenance on the soil surface (PEREIRA et al., 2009). Minimum tillage studies
have observed a greater efficiency in relation to conventional soil preparation because the
avoiding of soil revolving leads to a less intense and gradual decomposition of crop residues
(CARVALHO et al., 2004), therefore improving chemical, physical and biological soil
characteristics with positive effects on soil fertility, reducing inputs of lime and fertilizer.

18
1.1.3.2 Nitrogen and other nutrients: influence in maize grain production
Nutrients have different translocation rates in stem, leaf and grain. In relation to
nutrient export, phosphorus (P) is highly transferred to grain (77 to 86 %), followed by N (70
to 77 %), sulfur (S) ( about 60 %), magnesium (Mg) (47 to 69 %), potassium (K) (26 to 43 %)
and calcium (Ca) (3 to 7 %). Anyway, the incorporation of plant residues returns a great part
of the absorbed nutrients, mainly K and Ca from the straw (COELHO, 2006). Maize crop
removes large quantities of nutrients from the soil, according to a review (STEWART et al.,
2013) which documents that the increase of 57% of the grain production from 1960 to 2000
can be attributed to fertilizer imputes into the production system. It is usual to employ N
fertilization as a soil cover application to complement the N supplied by the soil when high
productivities are aimed (CANTARELLA, 1993).
The recommended levels of NPK in Brazil for productivities above 8 t ha-1 is of 10 to
20 kg ha-1 of N at planting time, 120 kg ha-1, 100 kg ha-1, or 70 kg ha-1 of P2O5 for low,
medium and high availabilities of P, respectively. For K, recommended rates are 90 kg ha-1,
80 kg ha-1 and 60 kg ha-1 of K2O, for low, medium and high availabilities, respectively
(RIBEIRO et al., 1999). Important practices are related to N application timing and planting
date. Several authors support that the best moment for N application is at seeding time in one
single dose. However, the majority of the soil fertility scholars say that the N application has
to be split in two doses, one at seeding and the other after emergence, during the vegetative
period of the plant.
The nitrogen requirements for maize are considerably variable and different in each
plant development stage (ARNON, 1975). Although, it is known that the crop requires about
20 kg N ha-1 for each ton of grain produced (FANCELLI, 2000; SOUSA; LOBATO, 2004)
there are still many controversies and discussions regarding the ideal time of application, and
about the maximum ideal N rate for this crop. Cantarella (1993) states that even if the N
absorption by maize is intense 40 to 60 days after emergence, the plant still absorbs about
50% of the N that is needed after the beginning of flowering. The author comments that there
might be advantages in a late application of the N in cases of heavy fertilization, very sandy
soils or irrigated areas.

19
However, studying N application timing for corn, Neptune and Campanelli (1980),
observed that the higher grain yield was obtained when all of the N was applied at the
planting, and the production decreased when the N was applied from 73 to 83 days after the
emergency. Even though, Coelho (1987) reported that the full implementation of N rates at
the planting caused higher level of corn dry matter per kg of N than the gain obtained from
the N applied as sidedressing. França et al. (1994) reported that the splittings of N did not
affect the efficiency of nitrogen fertilizer, and the results obtained were similar when 106 kg
of N per ha were applied in a single dose, at the stage where the plant has 6 leaves (V6 stage),
or subdivided in half applied in the 6 leaves stage and the other half in the stage where the
plant has 10 leaves (V10 stage). These authors also concluded that most of the N in the plant
is accumulated until anthesis, reaching values of up to 93%, they concluded that the nitrogen
sidedressing should be made after seeding and before early anthesis, during which the rate of
absorption is virtually linear.
1.1.3.3 Plant density influence on maize grain yield
Planting density is one of the most important factors determining grain productivity of
the maize crop. This crop is the most sensitive member of the family Poaceas in relation to
plant density (ALMEIDA; SANGOI, 1996). The increase of the population density is one way
of maximizing solar radiation interception. The ideal plant density depends of the chosen
cultivar, soil fertility, water availability and sowing time. Therefore, productivity tends to
increase in relation to plant population, until a certain number of plants per area, considered as
the optimum population. Above this number the productivity decreases as the number of
plants per ha increases (PEREIRA, 1991). Among the forms of manipulation of the spatial
arrangement, plant density is having the greatest interference in maize yields, because small
changes in the population can affect significantly grain yield per hectare. This response occurs
because the maize does not have a space compensation mechanism as efficient as other
(ANDRADE et al., 1999).
Therefore, high plant densities can reduce the photosynthetic activity of the crop and,
consequently, the efficiency of the conversion of the photosyntates to grain production; can
increase the interval between anthesis and silk, and can reduce the number of grains per ears
(SANGOI et al., 2003). Nonetheless, plant densities below the optimum lead to a lower use of
the incident solar radiation decreasing productivity. Management taking into account plant
density lead to an increase in maize productivity due to a better use of environmental factors

20
by the modern genotypes found in the market (DOURADO NETO et al., 2003). The increase
of plant density up to a given limit is a technique used to increase maize grain yield. The ideal
number of plants per ha is variable, once the maize plant alters grain yield according to the
interspecific competition resulting from different plant densities (PEIXOTO et al., 1996).
Recent reports indicate that the frequently used optimum plant density aimed for
maize grain yield is in the United States of America approximately 8 plants m-2 (80,000 plants
ha-1) (TOLLENAR; LEE, 2011), and in Brazil only 3.5 to 5 plants m-2, corresponding to
55,000 to 72,000 plants ha-1. Therefore, maize breeding programs have been sought for
genotypes with high response to production at high population densities from 80,000 to
100,000 plants per hectare, and under lower spacing between lines (DOURADO NETO et al.,
2003).
2.0 Principles of maize development
During the vegetative period which extends from seeding to the beginning of the
appearance of reproductive organs, the maize plant accumulates dry matter through
photosynthesis. For this process the plant needs CO2 from the atmosphere, absorbed through
stomata. Therefore leaves are an essential part of the plant, the following factors being of
extreme importance for plant productivity: number of open stomata per unit leaf area; leaf
area (represented by the “leaf area index” - LAI); number of leaves per plant; plant density
(PD), indicating the population of plants per ha; plant architecture; plant height (PH); and
concentration of chlorophyll and carotenoid pigments, among others. These factors are
directly related to solar energy capture for photosynthesis (photo-chemical reaction).
Plants also need H2O for photosynthesis, which comes from the soil so that the root
system becomes important. Its length, surface area, and depth into the soil are very important
factors. The root system is also important for nutrient absorption, such as: nitrogen,
phosphorus, potassium, sulfur, calcium, and all other essential nutrients. The sugars fixed by
photosynthesis are responsible for the dry matter accumulation (Plant biomass - BM) and
finally for grain yield (GY). During the vegetative phase, these carbohydrates are allocated
initially to roots, then to stalks and leaves, as shown schematically in the Figure 1.1.

21
Figure 1.1 - Plant Biomass and grain yield influenced by the sugar translocation and nutrient
partitioning from different plant organs.
The dry matter accumulation, and consequently of all nutrients and its partitioning,
during the vegetative period, are of extreme importance for plant “health” and are crucial
processes for the final yield determination. In the case of maize, the kernel number (KN) is
determined during this phase, and logically, the larger the better GY. When the reproductive
organs start to be developed, the CO2 partitioning almost stops for roots, stalks, and leaves.
From that moment this CO2 flow turns to the reproductive organs, as shown schematically
above. During the reproductive period the already defined kernel number in the vegetative
period, will gain in weight or kernel weight (KW) (grain filling), which is important for the
final GY.
When all soil-plant-atmosphere conditions are in the optimum range, the crop tends its
maximum potential yield at a given location. Deviations from the optimum are the result of
stresses. These can be of different causes. Water deficit conditions, when the actual
evapotranspiration surpasses rainfall, induce hydric stress. Nutrient stresses occur when the
plant cannot obtain the needed amount of a given nutrient. In the case of nitrogen, for

22
example, splitting of the fertilizer dose are chosen to avoid N stress at given moments of crop
development. Competition among plants for nutrients or water is also an important type of
stress. Therefore, the stand of a crop, defined by the number of plants per ha, called plant
density (PD), is very important in crop management. The soil-plant-atmosphere local
conditions define the ideal values of PD. Just comparing the State of São Paulo, Brazil, with
the State of Indiana, USA, in average terms, we can say that in the first soils are poor. They
present CEC values of the order of 50 (meq/100g soil), with low surface organic matter, low
water availability (100 to 120 mm per m of soil profile), with possible daylight hours from 11
to 13, so that no high PDs can be adopted (of the order of 50 to 70,000 plants per ha).
Therefore our commercial Brazilian yields seldom reach 12,000 kg ha-1 of maize grain. On
the other hand, soils of Indiana are richer as well as in organic matter as in fertility (CEC of
the order of 300 (meq/100g soil)), and with a much higher water availability (200 to 300 mm
per m of soil profile) and 12 to 14 daylight hours. They can sustain PDs of 120,000 plants per
ha, or more, achieving commercial productivities over 20,000 kg ha-1. Figure 1.2 discusses
schematically effects of PD on yield, in the presence of other stresses.
Figure 1.2 - Schema - Plant density (PD) and different environmental stress influences on
maize grain yield
According to this figure, under a given soil-plant-atmosphere condition, the plant
productivity remains constant up to the point when PD reaches a critical value (PDcritA at A´)

23
and they start competing among themselves for water, nutrients, etc, reaching a maximum
yield YA with PDA. For a lower PDB (at point B) the yield is decreased to YB and a lower
PDcritB is established.
These are, in very short terms, the principles that govern maize development and
productivity. Since yield is our final goal, the study of the factors affecting it is of extreme
importance, mainly for newly developed hybrids. This study, comprised into three chapters,
presents there experiments that test different maize hybrids, mainly in relation to effects on
grain yield caused by drought and nitrogen stresses (Table 1.1).
Table 1.1 - Research characterization, treatment factors
Country Hybrid Drouth-
tolerance
Plant
population*
(pl ha-1)
Highest GY
productivity
(t ha-1)*
Brazil 30F35HR No 60,000 11.10
USA
AQUAmaxT
M P1151 HR
Yes 78,000 13.3
USA P1162 HR No 99,000 13.6
USA AQUAmaxT
M P1498 HR
Yes 78,000
12.7
USA 33D49 HR No 78,000
11.7
* GY of the best treatment of one of the three experiments
3.0 Final Consideration
Brazilian production and productivity of the maize crop suffered very significant
increases in Brazil, following a worldwide trend, which begun in the last century. This is the
result of studies in various fields of research with responses in production technology of the
crop and in the use of modern genotypes. There is, however, still need of more research
aiming for a better understanding of the productive and physiologic mechanisms of the new
hybrids appearing in the market in response to contrasting environments, in order to ensure a
more sustainable production respecting natural resources.
References
ALMEIDA, M.L. de; SANGOI, L. Aumento da densidade de plantas de milho para regiões de
curta estação estival de crescimento. Pesquisa Agropecuária Gaúcha, Porto Alegre, v. 2,
n. 2, p. 179-183, 1996.

24
AMADO, T.J.C.; MIELNICZUK, J.; AITA, C. Recomendação de adubação nitrogenada para
o milho no RS e SC adaptada ao uso de culturas de cobertura do solo, sob sistema plantio
direto. Revista Brasileira de Ciência do Solo, Viçosa, v. 26, p. 241-248, 2002.
ANDRADE, F.H.; VEGA, C.; UHART, S.O. Kernel number determination in maize. Crop
Science, Madison, v. 39, p. 453-459, 1999.
ANGHINONI, I.; VOLKART, K.; FATTORE, C.; ERNANI, P.R. Morfologia de raízes e
cinética da absorção de nutrientes em diversas espécies e genótipos de plantas. Revista
Brasileira de Ciência do Solo, Viçosa, v. 13, p. 355-361,1989.
ARNON, I. Mineral nutrition of maize. Bern: International Potash Institute, 1975. 452 p.
BALIGAR, V.C.; BARBER, S.A. Genotypic differences of corn for ion uptake. Agronomy
Journal, Madson, v 71, p. 870-873, 1979.
BÄNZINGER, M.; EDMEADES, G.O.; BECK, D.; BELLON, M. Breeding for drought
and nitrogen stress tolerance in maize: from theory to practice. Mexico: CIMMYT, 2000.
68 p.
BERNARDI, A.C.C.; MACHADO, P.L.O.A.; FREITAS, P.L.; COELHO, M.R.; LEANDRO,
W.M.; OLIVEIRA JÚNIOR, J.P.; OLIVEIRA, R.P.; SANTOS, H.G.; MADARI, B.E.;
CARVALHO, M.C.S. Correção do solo e adubação no sistema de plantio direto nos
cerrados. Rio de Janeiro: Embrapa Solos, 2003. 22 p. (Documentos, 46).
BOYER, J.S.; BYRNE, P.; CASSMAN, K.G.; COOPER, M.; DELMER, D.; GREENE, T.;
GRUIS, F.; HABBEN, J.; HAUSMANN, N.; KENNY, N.; LAFITTE, R.; PASZKIEWICZ,
S.; PORTER, D.; SCHLEGEL, A.; SCHUSSLER, J.; SETTER, T.; SHANAHAN, J.;
SHARP, R.E.; VYN, T.J.; WARNER, D.; GAFFNEY, J. The US drought of 2012 in
perspective: a call to action. Global Food Security. West Chester, v. 2, p. 139–143. 2013.
BRASIL. Ministério da Agricultura, Pecuária e Abastecimento. Cadeia produtiva do milho.
Brasília: IICA; MAPA, SPA, 2007. 140 p.
______. Disponível em: <http://www.agricultura.gov.br/vegetal/culturas/milho>. Acesso em:
06 ago. 2014.
ÇAKIR, R. Effect of water stress at different development stages on vegetative and
reproductive growth of corn. Field Crops Research, Aberdeenshire, v. 89, n. 1, p. 1-16,
2004.
CAMPOS, H.; COOPER, M.; EDMEADES, G.O.; LOFFLER, C., SCHUSSLER, J.R.;
IBANEZ, M. Changes in drought tolerance in maize associated with fifty years of breeding
for yield in the U.S. Corn Belt. Maydica, Bergamo, v. 51, p. 369-381, 2006.
CANTARELLA, H. Calagem e adubação do milho. In: BÜLL, L.T.; CANTARELLA, H.
(Ed.). Cultura do milho: fatores que afetam a produtividade. Piracicaba: POTAFOS, 1993.
p. 148-196.

25
CARVALHO, M.A.C. de; SORATTO, R.P.; ATHAYDE, M.L.F.; SÁ, M.E. Produtividade do
milho em sucessão a adubos verdes no sistema de plantio direto e convencional. Pesquisa
Agropecuária Brasileira, Brasilia, v. 39, p. 47-53, 2004.
CASSMAN, K.G.; DOBERMANN, A.; WALTERS, D.T.; YANG, H. Meeting cereal
demand while protecting natural resources and improving environmental quality. Annual
Review of Environment and Resources, Palo Alto, v. 28, p. 315-358, 2003.
CIAMPITTI, I.A.; VYN, T.J. Physiological perspectives of changes over time in maize yield
dependency on nitrogen uptake and associated nitrogen efficiencies: a review. Field Crops
Research, Aberdeenshire, v. 133, p. 48–67, 2012.
CIAMPITTI, I.A.; ZHANG, H.; FRIEDEMANN, P; VYN, T.J. Potential physiological
frameworks for mid-season field phenotyping of final plant nitrogen uptake, nitrogen use
efficiency, and grain yield in maize. Crop Sciense, Madison, v. 52, p. 2728-2742, 2012.
COELHO, A.M. Balanço de nitrogênio (15 N) na cultura do milho (Zea mays L.) em um
Latossolo Vermelho Escuro fase cerrado. 1987. 142 p. Dissertação (Mestrado em Solos e
Nutrição de Plantas) – Escola Superior de Agricultura de Lavras, Lavras, 1987.
______. Nutrição e adubação do milho. Sete Lagoas: Embrapa CNPMS, 2006. 10 p.
(Circular Técnica, 78).
COELHO, A.M.; CRUZ, J.C.; PEREIRA FILHO, I.A. Rendimento do milho no Brasil:
chegamos ao máximo? Informações Agronômicas, Piracicaba, n. 101, p. 1-12, mar. 2003.
Encarte Técnico.
COMPANHIA NACIONAL DE ABASTECIMENTO. Acompanhamento da safra
brasileira: grãos. Oitavo levantamento – junho de 2012. Brasília, 2012. 34p.
CONNOR, D.J., HALL, A.J.; V.O. SADRAS. Effect of nitrogen content on the
photosynthetic characteristics of sunflower leaves. Australian Journal of Plant Physiology,
Oxford, v. 20, p. 251–263, 1993.
COOPER, M.; GHO, C.; LEAFGREN, R.; TANG, T.; MESSINA, C. Breeding drought-
tolerant maize hybrids for the US corn-belt: discovery to product. Journal of Experimental
Botany, Oxford, v. 65, n. 21, p. 6191-204, 2014.
DOURADO NETO, D.; FANCELLI, A.L. Produção de milho. Guaíba: Agropecuária, 2000.
360 p.
DOURADO NETO, D.; PALHARES, M.; VIEIRA, P.A.; MANFRON, P.A.; MEDEIROS,
S.L.P.; ROMANO, M.R. Efeito da população de plantas e do espaçamento sobre a
produtividade de milho. Revista Brasileira de Milho e Sorgo, Sete Lagoas, v. 2, n. 3,
p. 63‐77, 2003.
DURÃES, F.O.M.; SANTOS, M.X.; GAMA, E.E.G.; MAGALHÃES, P.C.;
ALBUQUERQUE, P.E.P.; GUIMARÃES, C.T. Fenotipagem associada a tolerância a seca
em milho para uso em melhoramento, estudos genômicos e seleção assistida por

26
marcadores. Sete Lagoas: Embrapa Milho e Sorgo, 2004. 17 p. (Embrapa Milho e Sorgo.
Circular Técnica, 39).
DUVICK, D.N. What is yield? In: EDMEADES, G.O.; BANZIGER, M.; MICKELSON,
H.R.; PENA-VALDIVIA, C.B. (Ed.). Developing drought- and low N-tolerant maize.
Mexico: CIMMYT, 1996. p. 332–335.
DWYER, L.M.; TOLLENAAR, M.; HOUWING, L. A nondestructive method to monitor leaf
greenness in corn. Canadian Journal of Plant Science, Ottawa, v. 71, p. 505-509, 1991.
FANCELLI, A.L. Nutrição e adubação do milho. Piracicaba: ESALQ, 2000. 43 p.
FAOSTAT. Disponível em: <http://faostat.fao.org/>. Acesso em: 01 dez. 2013.
FNP CONSULTORIA E COMÉRCIO. Balanço 2008 & perspectivas 2009. In: ______.
AGRIANUAL 2009: anuário da agricultura brasileira. 14. ed. São Paulo, 2009. p. 371-376.
FRANÇA, G.E.; COELHO, A.M.; RESENDE, M.; BAHIA FILHO, A.F.C. Parcelamento da
adubação nitrogenada em cobertura na cultura do milho irrigado. In: EMBRAPA. Centro
Nacional de Pesquisa de Milho e Sorgo. Relatório técnico anual do Centro Nacional de
Pesquisa de Milho e Sorgo: 1992-1993. Sete Lagoas: 1994. p. 28-29.
GOLBASHY, M.; EBRAHIMI, M.; KHAVARI-KHORASANI, S.; CHOUCAN, R.
Evaluation of drought tolerance of some corn (Zea mays L.) hybrids in Iran. African Journal
of Agricultural Research, Nirobi, v. 5, n. 19, p. 2714-2719, 2010.
IGUE, K. Dinâmica da matéria orgânica e seus efeitos nas propriedades do solo. In:
ADUBAÇÃO verde no Brasil. Campinas: Fundação Cargill, 1984. p. 232-267.
LEUNG, J; GIRAUDAT, J. Abscisic acid signal transduction. Annual Review of Plant
Physiology and Plant Molecular Biology, Palo Alto, v. 49, p. 199–222, 1998.
LOPES, M.S.; ARAUS, J.L.; PHILIPPUS, D.R.VH., FOYER, C.H. Enhancing drought
tolerance in C4 crops. Journal of Experimental Botany, Oxford, v. 62, p. 3135-3153. 2011.
MARKELZ, R.J.C.; STRELLNER, R.S.; LEAKEY A.D.B. Impairment of C4 photosynthesis
by drought is exacerbated by limiting nitrogen and ameliorated by elevated [CO2] in maize.
Journal of Experimental Botany, Oxford, v. 62, p. 3235-3246, 2011.
MARKWELL, J.; OSTERMAN, J.C.; MITCHELL, J.L. Calibration of the Minolta SPAD-
502 leaf chlorophyll meter. Photosynthesis Research, Dordrecht, v. 46, p. 467-472, 1995.
MOLL, R.H.; KAMPRATH; E.J.; JACKSON, W.A. Analysis and interpretation of factors
which contribute to efficiency of nitrogen utilization. Agronomy Journal, Madison, v. 74,
p. 562–564, 1982.
MONNEVEUX, P.; SANCHEZ, C.; BECK, D.; EDMEADES, G. O. Drought tolerance
improvement in tropical maize source populations: evidence of progress. Crop Science,
Madison, v. 46, p. 180-191, 2006.

27
MORADI, H.; AKBARI, G.A.; KHAVARI, K.S.; RAMSHINI, H.A. Investigation of drought
stress effect on morphologic traits, yield and yield components of corn (Zea Mays L.) new
hybrids. International Journal of Recent Scientific Research, Sorappur, v. 3, n. 6, p. 518-
529, 2012.
MUGO, S.N.; BÄNZIGER, M.; EDMEADES, G.O. Prospects of using ABA in selection for
drought tolerance in cereal crops. In: WORKSHOP ON MOLECULAR APPROACHES FOR
THE GENETIC IMPROVEMENT OF CEREALS FOR STABLE PRODUCTION IN
WATER‐LIMITED ENVIRONMENTS: A STRATEGIC PLANNING, 1999, El Batan.
Proceedings… Mexico: CIMMYT, 2000. p. 73–78. 2000.
NEPTUNE, A.M.L.; CAMPANELLI, A. Efeitos de épocas e modo de aplicação do sulfato de
amônio - 15 N, fósforo - 32 P, na quantidade e teores de N, P e K na planta e na folha do
milho, na produção, na quantidade de proteína e eficiência do nitrogênio do fertilizante
convertido em proteína. Anais da Escola Superior de Agricultura Luiz de Queiroz,
Piracicaba, v. 37, n. 2, p. 1105-1143, 1980.
PEIXOTO, C.M. Resposta de genótipos de milho à densidade de plantas, em dois níveis
de manejo. 1996. 118 p. Dissertação (Mestrado em Agronomia) - Faculdade de Agronomia,
Universidade Federal do Rio Grande do Sul, Porto Alegre, 1996.
PEREIRA, R.G.; ALBUQUERQUE, A.W.; MADALENA, J.A.S. Influência dos sistemas de
manejo do solo sobre os componentes de produção do milho e Brachiaria decumbens.
Revista Caatinga, Mossoró v. 22, p. 64-71, 2009.
PEREIRA, R.S.B. Caracteres correlacionados com a produção e suas alterações no
melhoramento genético do milho (Zea mays L.). Pesquisa Agropecuaria Brasileira, Brasília,
v. 26, p. 745-751, 1991.
PIONEER. Disponível em: <http://www.pioneersementes.com.br/Media
Center/Pages/Detalhe-do-Artigo.aspx?p=165>. Acesso em: 08 jul. 2014.
RIBEIRO, A.C.; GUIMARÃES, P.T.G.; ALVAREZ V., V.H. Recomendação para o uso de
corretivos e fertilizantes em Minas Gerais: 5ª aproximação. Viçosa: Comissão de
Fertilidade do Solo do Estado de Minas Gerais, 1999. 359 p.
RICHARDS, R.A.; REBETZKE, G.J.; CONDON, A.G.; VAN HERWAARDEN, A.F.
Breeding opportunities for increasing the efficiency of water use and crop yield in temperate
cereals. Crop Science, Madison, v. 42, p. 111-121, 2002.
ROTH, J.A.; CIAMPITTI, I.A.; VYN, T.J. Physiological evaluations of recent drought
tolerant maize hybrids at varying stress levels. Agronomy Journal, Madison, v. 5, n. 4,
p. 1129 – 1141, 2013.
RUSSELL, W.A. Genetic improvements of maize yields. Advances in Agronomy, San
Diego, v. 46, p. 245–298, 1991.
SÁ, J.C.M. Manejo de nitrogênio na cultura do milho no sistema plantio direto. Passo
Fundo: Aldeia Norte, 1996. 23 p.

28
SANCHEZ, R.A.; HALL, A.J.; TRAPANI, N.; HUNAU, R. C. de. Effects of water stress on
chlorophyll content, nitrogen level and photosynthesis of leaves of two maize genotypes.
Photosynthesis Research, Dordrecht, v. 4, p. 35-47, 1983.
SANGOI, L.; SILVA, P.R.F.; ARGENTA, G.; HORN, D. Bases morfo-fisiológicas para
aumentar a tolerância de cultivares de milho a altas densidades de plantas. In: REUNIÃO
TÉCNICA CATARINENSE DE MILHO E FEIJÃO, 4., 2003, Lages. Resumos
expandidos... Lages: CAV, UDESC, 2003. p. 19-24.
SCHENK, M.K.; BARBER, S.A. Phosphate uptake by corn as affected by soil characteristics
and root morphology. Soil Science Society of America Journal, Madison, v. 43, p. 880-883,
1979.
SEGHATOLESLAMI, M.J.; KAFI, M.; MAJIDI, S. Effect of drought stress at different
growth stage on yield and water use efficiency of five proso millet (Panicum Miliaceum L.)
genotypes. Pakistan Journal of Botany, Karachi, v. 40, n. 4, p. 1427- 1432, 2008.
SINCLAIR, T.R.; HORIE, T. Leaf nitrogen, photosynthesis, and crop radiation use
efficiency: a review. Crop Science, Madison, v. 29, p. 90–98, 1989.
SOUSA, D.M.G. de; LOBATO, E. Calagem e adubação para culturas anuais e semiperenes.
In: ______. (Ed.). Cerrado: correção do solo e adubação. Planaltina: Embrapa Cerrados,
2004. p. 283‐315.
SOUZA, C.M. Efeito do uso contínuo de grade pesada sobre algumas características
físicas e químicas de um Latossolo Vermelho-Amarelo Distrófico, fase cerrado, e sobre o
desenvolvimento das plantas e absorção de nutrientes pela cultura de soja. 1988. 105 p.
Dissertação (Mestrado em Fitotecnia) - Universidade Federal de Viçosa, Viçosa, 1988.
STEWART, W.M.; DIBB, D.W.; JOHNSTON, A.E.; SMYTH, T.J. The contribution of
commercial fertilizer nutrients to food production. Agrononomy Journal, Madison, v. 97,
p. 1–6, 2005.
THOMAS, H.; HOWARTH, C.J. Five ways to stay green. Journal of Experimental Botany,
Oxford, v. 51, p. 329–337. 2000.
THOMAS, H; SMART C.M. Crops that stay green. Annals of Applied Biology, Oxford,
v. 123, p. 193–219, 1993.
TOLLENAAR, M.; LEE, E.A. Strategies for enhancing grain yield in maize. Plant Breeding
Reviews, Hoboken, v. 34, p. 37-81, 2011.
TOLLENAAR, M.; WU, J. Yield improvement in temperate maize is attributable to greater
stress tolerance. Crop Science, Madison, v. 39, p. 1597–1604, 1999.
UHART, S.A.; ANDRADE, F.H. Nitrogen deficiency in maize: I. Effects on crop growth,
development, dry matter partitioning, and kernel set. Crop Science, Madison, v. 35, p. 1376-
1383, 1995.

29

30

31
2 MAIZE NUTRIENT UPTAKE AND PARTITIONING FOR DROUGHT AND NON-
DROUGHT TOLERANT HYBRIDS INFLUENCED BY VARIED PLANT DENSITY
AND NITROGEN RATE
Abstract
Improvements in maize (Zea mays L.) drought tolerance are vital for maintaining local
and global food security. The research objectives were to understand whether and, if so, how
similar maturity-tolerant and non-drought tolerant hybrids differ in nutrient uptake, nutrient
concentrations and grain yield (GY) under different management treatments (varied plant
density and N rates) in rain-fed environments. Our specific focus was to evaluate if drought-
tolerant hybrids have overall higher N recovery and N use efficiencies, produce more grain
per unit of whole plant nutrient uptake, and achieve higher macro-nutrient efficiencies,
compared to non-drought tolerant hybrids. Two drought-tolerant (AQUAmax) hybrids were
compared to two comparable-maturity hybrids (non-drought tolerant) at varying plant density
(PD) (two levels) and N rates (four levels) over 2 years (2012 and 2013) in Northwestern
Indiana. Morphological, productivity and nutritional measurements were taken in both
seasons. All hybrids, whether labeled as more drought tolerant or less so, responded similarly
in grain yield to the treatments factors in both years. AQUAmax hybrids did not demonstrate
improvement in grain yield or more yield stability than non-AQUAmax.The drought-tolerant
Hybrid 1 (P1151) generally displayed a longer anthesis to silking interval than comparable-
maturity Hybrid P1162 (in 2013). In 2012, both drought-tolerant hybrids presented higher
values for stover P content than the non-drought tolerant. As the same way, drought-tolerant
Hybrid P1498, in the significant factorial for Hybrid x PD, presented higher stover S content
than the Hybrid 33D49, this specific quality found in drought-tolerant hybrids could be
considered as a drought-tolerance mechanism presented in this AQUAmax hybrid. Hybrid
P1498 generally showed a slightly earlier flowering, and a lower anthesis-to-silking interval,
than hybrid 33D49 in both seasons. Hybrid 1498 also had consistently lower kernel numbers
but higher final kernel weights than 33D49 (both years). In 2013, the majority of the
macronutrient harvest indices were higher than those observed in 2012. The PHI was lower
than normal in 2012, but also significantly lower in drought-tolerant hybrids than in the two
more drought susceptible hybrids. There was no evidence that AQUAmax hybrids were any
different than non-AQUAmax hybrids in their GY, BM, and yield stability responses to N
fertilizers or in their macronutrient use efficiencies. Agronomic-optimum N fertilizer rates are
not lower for these AQUAmax hybrids. However, because hybrid, N, and PD treatment
combinations with highest BM and GY at maturity generally achieved shorter anthesis-silking
intervals and, in the drought season, more stover macronutrient accumulation (P and S), the
latter traits appeared to be important drought-tolerant mechanisms regardless of hybrid
designations. There was no evidence that AQUAmax hybrids were any different than non-
AQUAmax hybrids in their response to N fertilizers or in their N use efficiencies. Thus it is
unlikely that N fertilizer management should change when AQUAmax hybrids are grown.
Certainly there is no evidence that optimum N fertilizer rates would be any lower for these
AQUAmax hybrids.
Keywords: Nitrogen use efficiency; Drought tolerance mechanism; Grain yield

32
2.1 Introduction
Commercial maize (Zea mays L.) yields have increased substantially as a result of
conventional breeding and agronomic practices. The average U.S. maize yield has risen at a
rate of 118 kg ha-1 yr-1 from 1930 to 2000, GY increased from 1.5 Mg ha-1 in the 1930s to 9.5
Mg ha-1 for the 2006-2008 period, and similar rates of improvement in maize GY have been
observed in other parts of the world (TOLLENAAR; LEE, 2011).
Grain yield increases have also been attributed to greater stress tolerance of modern
hybrids, especially stress from interplant competition (TOKATLIDIS; KOUTROUBAS,
2004). Plant density is an agronomic factor that changed significantly during the past decades,
suggesting that the selection under high plant density was the key to improve maize GY
(TROYER; ROSENBROOK, 1983). The tolerance to plant density is in essence the tolerance
to the resource scarcity of water, mineral nutrients and light (YAN; WALLACE, 1995).
Despite the high yield potential, maize has a marked sensitivity to biotic and abiotic
stresses; therefore, its cultivation needs careful planning and management, aiming to
maximize its productive capacity (Andrade, 1995). Two important environmental stresses that
decrease corn grain yield (GY) are (a) drought, specifically during the critical period two
weeks prior post-silking, and (b) nitrogen (N) deficiency, as N stress reduces crop
photosynthesis (BÄNZIGER et al., 2000) and also influences the uptake and internal
efficiency of other macronutrients at maturity (CIAMPITTI et al., 2013a).
Rising greenhouse gas concentrations increases the global temperatures that could
potentially accelerate maize growth and development, hasten maturity and reduce soil
moisture availability during the growing season. Therefore, improvements in maize drought
tolerance are vital for maintaining local and global food security (BOOMSMA; VYN, 2008).
Additionally improving maize nitrogen use efficiency would especially benefit many
developing countries, where yields are low and fertilizer application inadequate
(AKINTOYE; KLING; LUCAS, 1999; CASSMAN et al., 2004).
Maize productivity relies on carbon and nitrogen (N) metabolic activity. The direct
role of N in the accumulation of grain dry matter is represented by affecting maize dry matter
production, influencing the development and maintenance of the crop leaf area and
photosynthetic efficiency (BELOW et al, 1981; SWANK et al, 1982; MUCHOW, 1998). This
nutrient has important functions in maize plant metabolism, participating as part of protein
molecules, coenzymes, nucleic acids, cytochromes, and chlorophyll, among others. Nitrogen

33
fertilization influences not only maize productivity, but also the quality of the product as a
result of increased grain protein content (SABATA; MASON, 1992).
When subjected to drought, corn plants exhibit a lower water potential in relation to
non-stressed plants, causing stomatal closure and, consequently, decreased photosynthesis and
carbon assimilation (OTEGUI; ANDRADE; SUERO., 1995). The main effects of water
shortages on maize plants are decreased dry matter (biomass) production and grain yield
(KORSAKOV et al., 2008).
Seed companies, in response to these problems, are applying diverse strategies to
improve crop tolerance to drought stress (COOPER et al., 2014). In regions where the drought
stress is present, drought-tolerant hybrids have demonstrated yield benefits when compared
with the non-drought-tolerant hybrids with similar maturity (BECKER et al. 2012; PIONEER,
2013). Management techniques and breeding approaches for N use efficiency differ in
different production conditions and regions in the world. Accordingly, the understanding of
the process that governs crop N uptake and its distribution in plants is of main importance to
optimize crop production with minimum N input (CASSMAN; DOBERMANN; WALTERS,
2002). Studies about macro- and micro-nutrient uptake and partitioning, such N, P, K and S
and Zn, Fe, Mn and Cu for modern maize hybrids are also important to understand the
mechanisms that govern nutrient assimilation and their influence on grain yield under
different environmental conditions.
The primary objective of this study was to understand which traits, if any, differ
between similar maturity-tolerant and non-drought tolerant hybrids that govern the nutrient
uptake and concentrations under different management treatments (varied plant density and N
rates) and its influence on GY. The second objective was to evaluate if the drought-tolerant
hybrids have an overall higher N recovery and use efficiencies, produce more grain per unit
of whole-plant nutrient uptake, and achieve higher N, P, K and S internal efficiency and
indexes, compared to the non-drought tolerant hybrids at varied plant densities and N rates.
The following questions highlight the research objectives that examined the effects of
genotypes, plant densities and N rates on the underlying physiology of maize response to PD
and N stress factors: (1) Are the drought-tolerant hybrids different from their comparative-
maturity counterparts without the drought tolerance? (2) Do the drought-tolerant hybrids
respond differently to N rates when it comes not only just to yield but especially when it
comes to nutrient uptake, and does the drought-tolerant characteristic mean that there is an
increased capacity for nutrient uptake? (3) If we can expect an improvement in water use
efficiency, can we then also expect that the plant will be able to accumulate more nutrients

34
even at a lower overall N rate; if this occurs, would we see a situation develop where the
drought-tolerant hybrids lead to improved nutrient use efficiency as well as better water use
efficiency? (4) How do the drought tolerant hybrids differ from their similar-maturity hybrids
in their nutrient uptake response to N rates and response to plant density? (5) How are these
hybrids different in their allocation of nutrients, the harvest index, and internal efficiencies,
compared to the non-drought tolerant hybrids?
2.2 Materials and Methods
2.2.1 Location and Experimental Design
The experiment was conducted over two growing seasons (2012-13) in northwest
Indiana at the Pinney Purdue Agricultural Center (PPAC) (41° 26' 49" N, 86° 55' 42" W).
Non-irrigated field-experiments were established on the Tracy sandy loam (coarse-loamy,
mixed mesic Ultic Hapludalfs). In both seasons, the preceding crop was soybean [Glycine
max (L.) Merr.], and the tillage employed was fall chisel plow and spring secondary tillage.
The 2012 season experiment was planted on May 11th, and the 2013 season experiment was
planted on May 1st.
A five replicate split-split plot design was utilized with hybrid as main plot, plant
density (PD) as the subplot, and N rate as the sub-subplots. In both seasons, four hybrids were
compared consisting of two pairings with different drought-tolerance: 111 CRM hybrids
(AQUAmaxTM P1151 HR (Hybrid 1) versus P1162 HR (Hybrid 2), and 114 CRM hybrids
(AQUAmaxTM P1498 HR (Hybrid 3) versus 33D49 HR (Hybrid 4). Drought tolerance scores,
as determined by DuPont Pioneer on a nine point scale (1 = low, 9 = high), for P1151 and
P1498 were both 9, and for the hybrids less drought-tolerant, P1162 and 33D49, were 8 and 7,
respectively. The two PD levels were 79,000 (PD1) and 104,000 (PD2) pl ha-1 for 2012, and
78,000 (PD1) and 99,000 (PD2) plants ha-1 final stand for 2013.
All plots received 26 kg N ha-1 in a 5-cm x 5cm starter band (19-17-0) at planting.
Side-dress Urea Ammonium Nitrate, UAN, (28-0-0) treatments of either 0 (Nr1), 134 (Nr2),
202 (Nr3), or 269 (Nr4) kg N ha-1 were coulter-injected between corn rows around the V5
growth stage (ABENDROTH et al., 2011) in both years. Intensive measurements were
performed in three replicates whose individual plots measured 4.6 meters wide (six 76.2 cm
rows) by 27 meters long (18 m long for the remaining two replicates). Soil was sampled from
the 0 to 30cm layer, collecting 20 cores (2-cm diameter) from non-fertilized plots, for soil
mineral N concentration determination, before and after UAN side-dress application. Soil
samples (0 to 20 cm depth) from each replication for general fertility data were analyzed by

35
A&L Great Lakes Laboratories (Table 2.1); the resultant mean data indicates rather similar
soil organic matter and soil-test P concentrations between the 2 site-years, and that soil-test K
concentrations were above the critical levels in both years. Data about weather conditions
were recorded in both seasons (Figure 2.1).
Table 2.1 - Soil analysis for non-fertilized plots (inorganic nitrogen [NO3- - N / NH4
+ - N],
organic matter content [OM], soil pH, potassium content [K], and phosphorus,
Bray – P1 [P]) in the uppermost 0.3 m of the soil profile for each growing
season, 2012 (Roth et al., 2013) and 2013. At PPAC, Wanatah, IN, United States
Growing seasons
Soil parameters 2012 2013
OM content, g kg-1 16 (3.0) 17.05 (0.33)
pH units 6.10 6.59
P, mg P kg-1 43 (9.4) 48.45 (11.13)
K, mg K kg-1 103 (13.8) 134.60 (25.19)
The value within parenthesis refers to standard deviation
2.2.2 Morpho-Physiological Plant Measurements
Twenty continuous plants at representative plant densities were selected and marked
from the center rows of each plot (sampling areas) for repeated measurements during each
growing season. Plant heights were measured from the soil surface to the highest vertically-
extended leaf during the vegetative stages. At flowering (R1) plant heights were recorded up
to the uppermost developed leaf collar (MADDONNI; OTEGUI, 2004; BOOMSMA, 2009).
In 2012 height measurements were performed at the V5, V10, V15, and R1 stages, while in
2013 measurements were performed at the V5, V10 and V12 stages. Stalk diameter
measurements were determined at various vegetative and reproductive stages (V10, V15, R1,
R3, R4 – 2012; V10, V12, V14 – 2013) by using a Mitutoyo ABSOLUTE Digimatic 500-171
caliper (Mitutoyo America Corporation, Aurora, IL) connected to a Personal Digital Assistant
(PDA) and recorded into a spreadsheet. Calipers were placed at the widest inter-nodal
midpoint on plant stems between the lowest above-ground nodes without brace roots. A
Minolta SPAD-502 Chlorophyll Meter (Minolta Sensing Americas, Inc., Ramsey, NJ) was
used for estimating chlorophyll content of plants (SPAD). One measurement was taken from
the most fully expanded (collared) leaf during vegetative stages (~ V10 and V15) and from
the ear leaf at reproductive stages (R1, R3, R4, and R5) in the 2012 growth season, and (V10,
V12 and V14) in the 2013 growth season. For both years measurements were performed on
all 20 plants and the average value per plot was recorded. If the designated leaf was damaged,

36
the next lower leaf was used for measurement. Measurements were taken near the middle of
each leaf, about 2 cm from the leaf edge, and areas of non-representative leaf-necrosis were
avoided.
Information gathered on the 20 plants at flowering included anther suspension and silk
extrusion. Plots were monitored each day at the beginning of the tassel period (prior to silk
extrusion for hybrids evaluated) and observations continued until all plants completed silking.
Plants were counted as being at anthesis when at least 10 anthers were suspended from the
tassel, and at silking when silks extruded at least 1 cm from the husk. A 10-90% anthesis (or
silking) duration was calculated by subtracting the dates at which 2 plants (10%) had reached
anthesis (or silking) from the date at which at least 18 plants (90%) had reached anthesis (or
silking). The anthesis-silking interval (ASI) was calculated by subtracting the date at which
10 plants (50%) reached anthesis from the date at which 10 plants (50%) reached silking.
2.2.3 Grain Yield and Yield Components
A methodology identical to the one used by Roth, Ciampitti, and Vyn. (2013) was
followed. At maturity, GY and its components were determined in both seasons. Whole-plant
biomass (BM, procedure described by Burzaco, Ciampitti, and Vyn (2014)) and Harvest
Index (HI) were calculated from 10 plants harvested from the center rows of each treatment
from three replications. Actual kernel number (KN) per plant and kernel weight (KW)
(adjusted to 155 g kg-1) were determined from ears of the consecutive 20 plants ears from the
center rows at R6 three replications in each treatment. GY (also adjusted to 155 g kg-1) were
measured after harvesting the central two rows of each plot with a Kincaid XP plot combine.
2.2.4 Plant Nutrient Measurements
Plant nutrient content measurements were determined from the sampling areas as
described by Burzaco, Ciampitti, and Vyn (2014) and Ciampitti and Vyn (2012). Plant N
uptake was determined by sampling the total plant aboveground biomass (plant biomass) at
the physiological maturation stage (R6), from three of five replicates in each growth season.
The nutrient content was evaluated using 10 plants for stover (stem + leaves) and 20 plants for
grain and cob, from three replications for stover and grain (but only from the first replication
for cob). Grain, cob and stover were weighed from each plot after shelling and drying.
Unfortunately, due to funding restrictions, cob fractions were only ground and submitted for
nutrient analysis from the first replication. For replicates 2 and 3, cob nutrient concentrations
were estimated from replicate 1 data and then adjusted for each individual plot cob weight.

37
These plants were cut at the stem base, weighed, and dried to achieve a constant weight at
60°C. Total N determination was performed via combustion method (AOAC International,
2000, Method 990.03).
Nutrient quantities (g plant-1) of N, P, K, S, Zn, Fe, Mn and Cu in the grain, cob, and
stover components were calculated by multiplying the nutrient concentration (g g-1) by the dry
weight (g plant-1) of each fraction. Nutrient harvest indices were calculated for N (NHI), P
(PHI), K (KHI), S (SHI), Zn (ZnHI), Fe (FeHI), Mn (MnHI) and Cu (CuHI) by dividing the
grain nutrient content by the total plant nutrient content. The internal efficiencies of N, P, K
and S (NIE, PIE, KIE and SIE, respectively), were calculated following a procedure outlined
by Ciampitti and Vyn (2012) in which GY was divided by the total plant nutrient uptake in
the above-ground components. In this study only N, P, K and S data were discussed but all
data about nutrients are presented in the Appendix. To calculate the nitrogen use efficiency
(NUE) eq. 1, and nitrogen recovery efficiency (NRE) eq. 2, the procedure by Burzaco et al.
(2014) was followed:
(1)
(2)
Where GYN is the GY of N-fertilized plots, GY0 is the GY of unfertilized plots, PNUN is the
PNU (total plant nitrogen uptake) of N-fertilized plots, PNU0 is the PNU of unfertilized plots,
and ∆Napplied is the differential of N applied (N rates).
2.2.5 Statistical Analyses
Analysis of variance (ANOVA) was performed using the SAS PROC MIXED (SAS
Institute, 2004) program to evaluate if significant differences existed for treatment means. The
analysis was based on the factors of Hybrid, PD and N rate. All these factors were considered
fixed factors (with blocks as a random factor). For model evaluation, differences between
linear functions were tested (F test, Mead et al. 1993). For the total plant biomass (BM)
relationships to total plant nutrient uptake were determined via regression analyses to see the
possible influence of individual nutrients on total plant biomass.

38
2.3 Results and discussion
2.3.1 Phenology and Growing Seasons
The time for phenological development varied between the two growing seasons due
to different planting dates and climatic conditions (Figure 2.1). The 2012 season experienced
above-normal temperatures and record drought conditions (with only 61 mm of rain from
June 1 to mid-July), which resulted in severe plant stress that was most evident during the
V12-R1 interval, while the 2013 season experienced near normal temperatures and
precipitation (relative to historical trends referred to by Ciampitti and Vyn (2011)) with 304
mm of rainfall occurring during the critical months of June and July. The timing of anthesis
and silk emergence (Figure 2.2) was slightly different between the seasons; in 2012 plant
flowering (anther suspension and silk extrusion) happened early for all hybrids in relation to
2013. In 2013 (the normal precipitation year) there was a shorter period between anthesis and
silk emergence in comparison with the 2012 season (drought year). Hybrid 4 was the last
hybrid to shed pollen and silk in both years.

39
Figure 2.1 - Weather conditions (maximum and minimum air temperature and mean
precipitation) for 2012 and 2013 maize growing seasons at Pinney-Purdue
Agricultural Center (PPAC) in northwestern Indiana, USA

40
Figure 2.2 - Timing of anthesis and silk emergence (both show the day of 50%), for A
(2012) and B (2013) seasons in four hybrids (Hybrid 1 = AQUAmaxTM P1151,
Hybrid 2 = P1162, Hybrid 3 =AQUAmaxTM P1498, Hybrid 4 = 33D49)
averaged across each plant density level (PD1 = 79,000, and PD2 = 104,000 pl
ha-1, for 2012 season; and PD1 = 78,000, and PD2 = 99,000 pl ha-1 , for 2013
season), and all four N rate levels (Nr1 = 0, Nr2 = 134, Nr3 = 202, and Nr4 =
269 kg N sidedress ha-1) as related to maximum temperature and precipitation
before and after the flowering period
2.3.2 Morpho-Physiological Plant Measurements
2.3.2.1 Plant Height and Stalk Diameter
In 2012, only slight stem elongation occurred between V10 and V15 growth stages (in
a time interval of 14 days) due to drought conditions that occurred during this period (Figure
2.3; Appendix Table 5.1). At the V15 and R1 stages, PD1 demonstrated higher average
heights than PD2, possibly because the higher plant density resulted in more plant growth
stress under the prevailing drought conditions. A significant interaction between hybrid and
PD was observed at V10, V15, and R1 stages (Appendix Table 5.3). Hybrid 2 seemed to be
most negatively influenced by the PD, at R1 the Hybrid 2 plant height value was 20 cm less in
PD2 comparted in PD1, while the height for Hybrid 1 was numerically greater in PD2. This

41
ability of Hybrid 1 to conserve the higher plant height in higher PD compared with the
inability of Hybrid 2, could reflect a strategy of water conservation. It is very interesting that
both drought-susceptible hybrids (2 and 4) had significantly lower mean plant heights at the
V15 and R1 stages for PD2 than for PD1, while there was no significant drop in plant height
at the higher plant density in their drought-tolerant counterparts (Hybrids 1 and 3,
respectively).
In the 2013 season, plant heights were significantly influenced by the hybrids (all
sampled stages), and N rates, at V10 and V15 (Figure 2.4; Appendix Table 5.2). At V5 the
Hybrid 1 was shorter than Hybrid 2, however there was no difference between Hybrids 3 and
4. There was no evidence in 2013 of height differences between drought-tolerant and drought-
susceptible hybrids at later growth stages (V10 and V15). The zero N rate averaged
significantly shorter plant heights at all sampling stages, and there were no hybrid interactions
with either PD or N rate in 2013.
The “normal response” for maize at higher PD is for increased plant heights
(SANGOI; SALVADOR, 1998; SANGOI; SILVA; ARGENTA, 2002) due to competition for
light (APHALO et al., 1999), but in our population ranges we observed either a negative
influence of increased PD (for the drought-susceptible hybrids in 2012) or a neutral influence
of PD on plant heights (2013) .
The stalk diameter in 2012 was mainly affected by hybrid and PD, and was very little
affected by N rates (Figure 2.5; Appendix Table 5.1). Hybrid 1 had consistently wider stalks
than others (especially relative to Hybrids 2 and 3) from V15 to R4. As anticipated, higher PD
negatively affected the stalk diameter at all growth stages measured. In 2013 (Figure 2.6;
Appendix Table 5.2), all treatment factors significantly influenced the stalk diameters.
Hybrid 3 had a smaller stalk diameter in relation to the other hybrids at the V10 and V14
stages. In a similar way to the 2012 season, in 2013 the stalks were wider diameter in PD1
than in PD2. The N rate factor significantly impacted the stalk diameter at all sampled stages
in 2013, and especially so at V14, when the stalk value was greatest for the N rate 4. In 2012,
a significant interaction between hybrid versus PD, at R1 and R4 stages, was observed
(Appendix Table 5.3) because much smaller values were observed for Hybrid 2 when the
plant density changed from PD1 to PD2. While in 2013, a hybrid by PD interaction was
observed only at the V10 stage (Appendix Table 5.4), because Hybrids 3 and 4 had smaller
stalk diameter than Hybrids 1 and 2 at PD1, whereas no hybrid differences in stalk diameter
were observed at PD2.

42
Figure 2.3 - Mean treatment effects on plant height (cm) for all four hybrids (Hybrid 1 =
AQUAmaxTM P1151, Hybrid 2 = P1162, Hybrid 3 =AQUAmaxTM P1498,
Hybrid 4 = 33D49), each plant density level (PD1 = 79,000; and PD2 = 104,000
pl ha-1), and all four N rate levels (Nr1 = 0, Nr2 = 134, Nr3 = 202, and Nr4 =
269 kg N sidedress ha-1) at four growth stages (V5, V10, V15, and R1) at the
PPAC experimental site, for the 2012 growing season . Panel A = hybrid effect
(averaged over PDs and N rates), Panel B = PD effect (averaged over hybrids
and N rates), Panel C = N rate effect (averaged over hybrids and PDs)

43
Figure 2.4 - Mean treatment effects on plant height (cm) for all four hybrids (Hybrid 1 =
AQUAmaxTM P1151, Hybrid 2 = P1162, Hybrid 3 =AQUAmaxTM P1498,
Hybrid 4 = 33D49), each plant density level (PD1 = 78,000; and PD2 = 99,000
pl ha-1), and all four N rate levels (Nr1 = 0, Nr2 = 134, Nr3 = 202, and Nr4 =
269 kg N sidedress ha-1) at four growth stages (V5, V10, V15, and R1) at the
PPAC experimental site, for the 2013 growing season. Panel A = hybrid effect
(averaged over PDs and N rates), Panel B = PD effect (averaged over hybrids
and N rates), Panel C = N rate effect (averaged over hybrids and PDs)

44
Figure 2.5 - Mean treatment effects on stalk diameter (mm) for all four hybrids (Hybrid 1 =
AQUAmaxTM P1151, Hybrid 2 = P1162, Hybrid 3 =AQUAmaxTM P1498,
Hybrid 4 = 33D49), each plant density level (PD1 = 79,000; and PD2 = 104,000
pl ha-1), and all four N rate levels (Nr1 = 0, Nr2 = 134, Nr3 = 202, and Nr4 = 269
kg N sidedress ha-1) at four growth stages (V5, V10, V15, and R1) during the
2012 growing season at PPAC experimental site. Panel A = hybrid effect
(averaged over PDs and N rates), Panel B = PD effect (averaged over hybrids
and N rates), Panel C = N rate effect (averaged over hybrids and PDs)

45
Figure 2.6 - Mean treatment effects on stalk diameter (mm) for all four hybrids (Hybrid 1 =
AQUAmaxTM P1151, Hybrid 2 = P1162, Hybrid 3 =AQUAmaxTM P1498,
Hybrid 4 = 33D49), each plant density level (PD1 = 78,000; and PD2 = 99,000
pl ha-1), and all four N rate levels (Nr1 = 0, Nr2 = 134, Nr3 = 202, and Nr4 = 269
kg N sidedress ha-1) at three growth stages (V10, V12, and V14) during the 2013
growing season at PPAC experimental site. Panel A = hybrid effect (averaged
over PDs and N rates), Panel B = PD effect (averaged over hybrids and N rates),
Panel C = N rate effect (averaged over hybrids and PDs)

46
2.3.2.2 SPAD Values
Leaf chlorophyll estimates were taken at 7 growth stages in 2012 (from the V10 stage
and continuing to R5 stage), but only at 3 growth stages in 2013 (from the V10 to V14)
because of time constraints. There were significant treatment effects on SPAD values in 2012
(Figure 2.7; Appendix Table 5.5). The hybrid factor was not significant until the R3 and R4
development stages. Even then, the latter significant differences were quite minor and were
only significant between non-drought-tolerant Hybrid 2 and Hybrid 4. The SPAD values
averaged greater at PD1 than at PD2 from V10 to R4 stages. The effect of N rate was also
minor until late grain fill; the major treatment difference was between plots with and without
N (Figure 2.6 C). In 2013 (Figure 2.8; Appendix Table 5.6), SPAD differences were
significant for all treatments effects at one or more growth stages. At V12, the drought-
tolerant Hybrids (Hybrid 1 and 3) showed higher SPAD values relative to Hybrids 2 and 4.
The SPAD values in PD1 were greater than in PD2 for all sampled stages. The lowest N rate 1
(zero N) showed the lowest value for SPAD. This difference was much more apparent in 2013
than in 2012, presumably due to drought conditions and reduced biomass growth and N
uptake in 2012 season. Thus, in this study SPAD values were more significant at the later
stages. This results are in accordance with the study made by Argenta el al., (2001), they
concluded that the SPAD is positively correlated with the N concentration in the leaves of the
plants and this is more evident at the later stages. Additionally, according to Piekielek et al.
(1995) and Dwyer, Tollenaar, and Houwing (1991), the indirect chlorophyll content in the
leaf can be used to predict the nutritional N level in plants, because the correlation with the
amount of pigment was positive with the N concentration. Additionally, Lindsey and
Thomison (2014) in a field study conducted in 2013 and 2014, in Northwest (NWARS) and
Western (WARS) Ohio, evaluating the responses of two drought-tolerant hybrids and two
non-tolerant hybrids to sidedress N application rate (0, 67, 134, 202, and 269 kg N ha-1)
measured the chlorophyll content (SPAD) at R2 and conclude that the relative chlorophyll
content of each hybrid exhibited a similar response to N rate with maximum content occurring
at 134 kg N ha-1 at both sites in 2013.

47
Figure 2.7 - Mean treatment effects on estimated chlorophyll content (SPAD) for all four
hybrids (Hybrid 1 = AQUAmaxTM P1151, Hybrid 2 = P1162, Hybrid 3
=AQUAmaxTM P1498, Hybrid 4 = 33D49), each plant density level (PD1 =
79,000; and PD2 = 104,000 pl ha-1), and all four N rate levels (Nr1 = 0, Nr2 =
134, Nr3 = 202, and Nr4 = 269 kg N sidedress ha-1) at seven growth stages
(V10, V12, V15, R1, R3, R4, and R5) at the PPAC experimental site, 2012
growing season. Panel A = hybrid effect (averaged over PDs and N rates), Panel
B = PD effect (averaged over hybrids and N rates), Panel C = N rate effect
(averaged over hybrids and PDs)

48
Figure 2.8 - Mean treatment effects on estimated chlorophyll content (SPAD) for all four
hybrids (Hybrid 1 = AQUAmaxTM P1151, Hybrid 2 = P1162, Hybrid 3
=AQUAmaxTM P1498, Hybrid 4 = 33D49), each plant density level (PD1 =
78,000; and PD2 = 99,000 pl ha-1), and all four N rate levels (Nr1 = 0, Nr2 =
134, Nr3 = 202, and Nr4 = 269 kg N sidedress ha-1) at three growth stages (V10,
V12, and V14) at PPAC experimental site, 2013 growing season. Panel A =
hybrid effect (averaged over PDs and N rates), Panel B = PD effect (averaged
over hybrids and N rates), Panel C = N rate effect (averaged over hybrids and
PDs)

49
2.3.3 Anthesis-Silking Interval (ASI)
The first physiological change that affects the number of fertile ears and kernels per
plant is the time interval between differentiation of male and female inflorescences (anthesis
and silking, respectively). A longer time interval changes the transport rates of
phytohormones and carbohydrates within the plant. Thus, ears started later receive smaller
amounts of these substances, and are less likely to become functional (SANGOI, 2001).
Fewer potential kernels (ovules) become real kernels when silk extrusion is delayed because
of lower chances of successful pollination with still-viable pollen.
In 2012, the only single treatment effect on ASI (based on time from 50% pollen shed
to 50% silk emergence) was due to hybrid, but a hybrid versus PD interaction was also
observed (Table 2.12; Figure 2.2 A, and Appendix Figure 5.1). The lack of a significant N
rate effect on ASI in 2012 is not surprising since soil moisture was the major limitation for
biomass production (and N uptake) preceding the flowering period. It is also possible that the
cumulative effect of the drought during vegetative stages caused minimal moisture
availability differences between the PD treatments at flowering. While Hybrids 1 and 3
(drought-tolerant hybrids) did not vary in ASI, there was a significant difference between
Hybrid 1 and the pair formed by Hybrids 2 and 4 (non-drought tolerant hybrids). Hybrid 2
experienced the shortest ASI period in comparison with Hybrids 1 and 4. In 2013 (Table 2.12,
and Figure 2.2 B), there were ASI differences for both Hybrid and N rate factors. The highest
synchrony between anthesis and silk was observed for Hybrid 2, which was different from
Hybrids 3 and 4. For the N rate factor, only the control treatment (zero N) was different from
the treatments with N applied. Therefore in analyzing the pair of same maturity hybrids we
could to perceive that Hybrid 3 showed a numeric shorter ASI than Hybrid 4.
2.3.4 Biomass and Plant Nutrient Analysis
2.3.4.1 Total Biomass and Plant Nutrient Uptake and Partitioning
In 2012, the N rate was the sole factor influencing total plant biomass (BM) accumulation
at the end of the season, with the major difference being between unfertilized and N fertilized
treatments (Table 2.2). The grain and cob fractions were largely influenced by hybrid differences,
while the stover partitioning was most significantly influenced by N rate (Nr 1 < Nr 3 and 4).
Under more normal weather conditions in 2013 season (Table 2.3), there were significant
responses for both hybrid and N rate treatment factors, but not for the PD factor. The grain, cob,
and total plant masses responded progressively higher as N rates increased, while the stover

50
variable did not increase beyond the 134 kg ha-1 N rate. Hybrid 2 achieved the highest total plant
biomass; there were no statistical total biomass difference among other hybrids, but only between
them and Hybrid 2.
The Grain Harvest Index (GHI) in 2012 (Table 2.2) was affected only by hybrid, there
was no difference between the pair formed by Hybrid 1 and 2, but there was a difference between
Hybrids 3 and 4 (Hybrid 4 > Hybrid 3). However, a significant factorial (hybrid x PD) was
observed for GHI in 2012 (Figure 2.17). Looking at the PD response within the hybrids, there was
a significant difference only between Hybrids 1 and 4. The GHI in Hybrid 1 was affected
negatively by the higher PD (PD1 > PD 2), but Hybrid 4 was not affected negatively by the higher
PD (PD 1 < PD2). For Hybrids in the PD, at PD1 there was no difference between Hybrids 1 and
2, but Hybrid 3 had a lower value than Hybrid 4 for GHI. In analyzing the hybrids in PD2, Hybrid
4 was the greatest, and the drought-tolerant hybrids had lower values than their same maturity pair
counterparts. Nevertheless, in the 2013 season (Table 2.3), all treatment factors were significant
for GHI; the drought-tolerant hybrids had higher GHI in comparison to the non-drought tolerant
hybrids. The GHI was negatively affected by the PD (PD1 > PD2), but positively affected by N
rate as highest GHI occurred at the highest N rate (Nr4 > Nr2 > Nr 1). The GHI was higher in
2013 than in 2012, this could happened because the different weather conditions between the
seasons, with more rainfall in 2013.
In a similar manner as for plant biomass, the total plant N uptake in the 2012 season
was only affected by the N rate (Table 2.4), the greatest value for this variable being for the N
fertilized treatments, and there was only a significant difference between the treatments with
and without N fertilization. For the grain N content, there were significant effects for hybrid
(Hybrid 1 = Hybrid 2; Hybrid 3 < Hybrid 4) and for the N rate factor (Nr 4 > Nr 1).
In the factors evaluated at separate, for stover N content only the N rate factor caused
significant differences, in 2012, whereby the N fertilized treatments caused higher stover N
than the zero N control. However, there was also a significant interaction between hybrid and
PD (Figure 2.11). In the factorial Hybrid x PD, Stover N was higher for Hybrid 1 in PD2 than
in PD1. For the other hybrids there was no significant difference in Stover N content between
PD treatments. Evaluating the pairs of hybrids in relation to the PD factor, Hybrid 1 did not
differ from Hybrid 2, but the drought-tolerant Hybrid 3 did differ from Hybrid 4 (H1=H2; H3
> H4) in the PD2, so the drought-tolerant Hybrid 3 showed a higher value in relation to non-
drought tolerant Hybrid 4 for stover N content as PD increased.
In the 2013 season, total whole-plant N uptakes at maturity weren’t that different from
2012, but the 2013 grain N content averaged about 28% higher while the 2013 stover N

51
contents averaged about 41% lower than in 2012 (Tables 2.4 and 2.5), this happened because
the climatic difference between the seasons: different weather conditions between these two
seasons, with less precipitation and consequently less water availability in the soil in 2012
than in 2013 had influenced the nitrogen partitioning in the plant between the seasons.
Therefore, the stover N content was higher in 2012 than in 2013 because the deficiency of
water for the process of the N partitioning from the stover to the grains. As consequence of
the more normal precipitation in 2013 than in 2012, a higher grain N content was observed.
The hybrid and N rate factors resulted in significant differences in grain N content, but there
was no difference between the pairs of the same maturity hybrids (Hybrid 1 = Hybrid 2;
Hybrid 3 = Hybrid 4). A strong difference for N rate was observed (Nr1 < Nr2 < Nr3 < Nr4),
Table 2.4, in comparison to 2012. For stover N content and total plant N uptake, the hybrid
and N rate factors were also significant. For stover N content the Hybrid 2 was greater than
Hybrid 1 and there was no difference between Hybrids 3 and 4, and the higher N rate
increased N content in a predictable manner (Nr1 < Nr2 < Nr3=4). For total plant N uptake,
Hybrids 1 and 2 were greater than Hybrids 3 and 4 (there was no difference between the pairs
formed by Hybrids 1 and 2; and by Hybrids 3 and 4), each N rate increment resulted in
progressively higher total N uptake.
Unlike BM and N uptake, the P uptake and partitioning in the 2012 season was only
affected by the hybrid factor, but not by the N rate (Table 2.6). The stover P content was
higher for the Hybrid 3 in comparison to Hybrid 4, and the numeric average for Hybrid 1,
stover P content, was higher than Hybrid 2, so in this dry season the drought-tolerant hybrids
(AQUAmax) presented higher P concentration in the stover than the non-drought tolerant.
Nevertheless, significant interactions of the factorial Hybrid and PD for stover P content
(Figure 2.12), and for total plant P uptake (Figure 2.13) were observed. The Hybrid 4 had the
higher value for grain P content, in relation to the Hybrid 3 and also to the other hybrids, and
the highest total plant P uptake (Hybrid 4 > Hybrid 1 = 2), although Hybrid 4 did not differ
significantly from Hybrid 3. In a closer examination of the factorial Hybrid x PD for stover P
content (Figure 2.12), there was only a PD difference for Hybrid 4, whereby PD2 negatively
affected stover P content in this hybrid. Among hybrids in the same PD, Hybrid 4 had the
smallest value for stover P content in the PD2, while no difference among the other hybrids
was find. Only Hybrid 3, in the factorial PD versus Hybrid, demonstrated significantly higher
total plant P uptake with PD2. For the Hybrid and plant density interaction Hybrid 4
responded with more total plant P uptake than Hybrid 3. There was no difference between
Hybrid 1 and 2 in total plant P uptake at either PD. Hybrids 3 and 4 achieved highest total P

52
uptake in PD2, but there was no difference in total P uptake between hybrid pairs of similar
maturity.
In 2013 season (Table 2.7), N rate treatment factor was significant for these plant
component P uptake variables; both the grain P content and total plant P uptake were higher
in N rate 4 than in N rates 1 and 2. In contrast to 2012, overall P uptake increased
incrementally with higher N rates in 2013. However, for stover P content the hybrid and the N
rate were significant, Hybrid 2 was greater than Hybrid 1, while Hybrid 3 did not differ from
Hybrid 4. Therefore, the only significant difference that was observed was between N
fertilized and non-fertilized treatments been the stover P content superior in the zero N
treatment.
There was some differences for P uptake and partitioning between the drought and
more normal weather seasons. In 2012 (drought season) drought-tolerant hybrids (Hybrids 1
and 3) presented higher values for stover P content than the non-drought tolerant (Hybrids 2
and 4). This factor could be a drought tolerance mechanism because the drought tolerant
hybrids have greater area of roots that can explore the soil better and to do the uptake of the P
nutrient. The capacity of plants to access P under limiting conditions depends on important
adaptive traits (LÓPEZ-BUCIO et al., 2000). A primary adaptation to low P availability
involves postembryonic developmental changes in the root system, which are directed toward
enhancing P uptake. These include alterations in branching patterns, total root length, root
hair elongation, and lateral root formation (BATES; LYNCH, 1996; BORCH et al., 1999).
Plant K uptake values tended to be much lower in the drought year of 2012 (Table 2.8)
than in 2013 (Table 2.9). In 2012, the hybrid factor was significant for grain K content, but
only Hybrid 3 differed from its same maturity range counterpart (Hybrid 3 < Hybrid 4). For
total plant K uptake there was no difference between the hybrids with the similar maturity.
The N rate was significant only for stover K content and total plant K uptake (Nr4=3 > Nr1),
respectively, in the 2012 season (Table 2.8). In 2013 (Table 2.9), the grain K content and
stover K content were affected by the hybrid and N rate treatment factors, but the total plant K
uptake was only affected by the N rate. For the grain K content drought-tolerant hybrids did
not differ from the drought susceptible hybrids with the same maturity, while for this variable
the Nr4 lead to the greatest value (Nr4 > Nr2 > Nr1). For stover K content Hybrid 2 was
greater than all others, and the Nr4 lead to the highest value in relation to Nr 1 and 2. The
total plant K uptake was greater in Nr4 (Nr4> Nr2-3 > Nr1). Thus, in the normal weather
season the non-drought tolerant hybrids presented higher values for total plant K uptake,

53
however the drought-tolerant hybrids where numerically greater for grain S content than the
non-tolerant.
The S partitioning was affected by hybrid and N rate treatments in 2012 (Table 2.10)
when the grain S content was highest in Hybrid 4 (Hybrid 4 > Hybrid 3-2 > Hybrid 1). For the
total plant S uptake the Hybrid 4 was also the greatest. The N rate affected only stover S
content and total plant S uptake (Nr 1< Nr2-3-4). However, a significant factorial among
hybrids versus PD for stover S content was observed (Figure 2.14); only the Hybrid 4 was
affected negatively by PD2. For the hybrids analyzed separately in each PD treatment, there
was only a significant difference among the hybrids in the PD2 (Hybrid 3 > Hybrid 4) while
Hybrid 1 did not differ from Hybrids 2-3). In 2013 (Table 2.11), most of S partitioning
variables were affected by hybrid and N rate and a similar range of values was observed as in
2012. In the grain S content only the Hybrid 4 differed from Hybrids 1 and 2, and the Nr 4
had greater grain S than Nr 1 and 2. In the total plant S uptake, Hybrid 2 had the highest
value, and there was only difference between N fertilized and non-fertilized treatments (Nr1 <
Nr2-3-4). Stover S content was affected only by hybrids with Hybrid 2 being superior to all
other hybrids.
As the same way to the stover P content, drought-tolerant Hybrid 3, in the factorial
significant for Hybrid x PD, presented higher stover S content than the Hybrid 4, this also
could be a doughty tolerance mechanism presented in this AQUAmax hybrid.
In this study we evaluated also micro-nutrients Zn, Fe, Mn and Cu uptake and
partitioning as well its harvest indices and efficiencies, therefore the data are only presented in
Appendix (Table numbers 5.7, 5.8, 5.9, 5.10, 5.11, 5.12, 5.13, and 5.14), but not discussed.
In summary, BM, and plant nutrient uptake and partitioning (N, P, K, and S) were
more affected by N rates than by hybrid or plant density treatment factors. Highest nutrient
uptakes were normally observed in N fertilized treatments, and mainly for the highest N rate
treatment (Nr 4), in both seasons. In a study of nutrient accumulation and partitioning in
maize hybrids under varying PD and N rates, Ciampitti et al. (2013a) reported macro-nutrient
uptake to be predominately influenced by N rate, with greater P and K uptake occurring with
higher N rates. In the dry weather season (2012), we observed lower values for total biomass
and total plant K uptake than in 2013.
All hybrids generally experienced higher BM with N fertilization. In 2012, the overall
BM or GY responsive to the N rates was lower than in 2013; and the hybrids differences
largely affected the grain and cob fractions more than the stover fraction in 2012. In 2013 the
grain, cob, and total plant masses responded progressively higher as N rates increased. Ciampitti

54
and Vyn (2012), evaluating conventional maize hybrids, found a similar effect. The different
results in 2012 can presumably be related to low yields levels that constrained the
responsiveness of grain biomass to higher N rates. It is interesting that the total plant N
uptake were similar in both seasons, but in 2013 the grain N content was higher and the stover
N content was lower than in 2012. Also in 2012 the Hybrid 1 appeared to be least affected by
increasing N rates for both biomass and N uptake. Similar to N uptake and BM, the P uptake
and partitioning was mostly affected by the hybrids in 2012, while in 2013 both hybrids and N
rates influenced the P uptake. While the total plant P and S uptake were similar in both
seasons, the total plant K uptake was much higher in the more normal weather conditions
season of 2013. Figures 2.27 and 2.28 reveals the relationship between BM and uptake of N,
P, K, and S. Regardless of treatment factors, one unique slope fit all points for BM
relationships to N, P, K and S uptake (r2= 0.72, 0.58, 0.74, and 0.84, respectively, in 2012; r2
= 0.89, 0.28, 0.60, and 0.85, respectively, in 2013). Although BM does affect plant nutrient
uptake, it is also true that BM formation can be largely influenced by varying N rates
(CIAMPITTI; VYN, 2011). In 2012 (drought season) drought-tolerant hybrids (Hybrids 1 and
3) presented higher values for stover P content than the non-drought tolerant (Hybrids 2 and
4). This factor could be a drought tolerance mechanism, because the drought tolerant can use
cumulative nutrient to improve the water conductance in the plant by decreased water
potential inside the plant due to higher concentration of nutrient, and also can use the nutrient
for the metabolic processes in the plant. However in 2013 the Hybrid factor was not
significant factor.
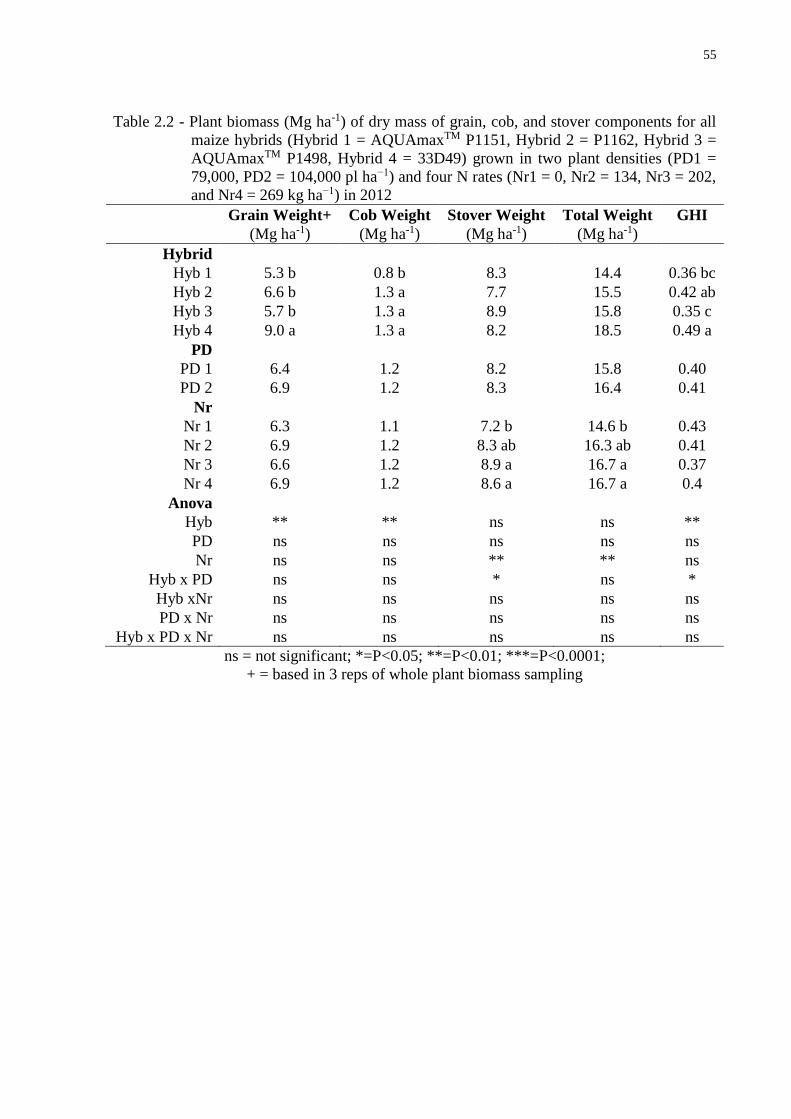
55
Table 2.2 - Plant biomass (Mg ha-1) of dry mass of grain, cob, and stover components for all
maize hybrids (Hybrid 1 = AQUAmaxTM P1151, Hybrid 2 = P1162, Hybrid 3 =
AQUAmaxTM P1498, Hybrid 4 = 33D49) grown in two plant densities (PD1 =
79,000, PD2 = 104,000 pl ha−1) and four N rates (Nr1 = 0, Nr2 = 134, Nr3 = 202,
and Nr4 = 269 kg ha−1) in 2012
Grain Weight+ Cob Weight Stover Weight Total Weight GHI
(Mg ha-1) (Mg ha-1) (Mg ha-1) (Mg ha-1)
Hybrid
Hyb 1 5.3 b 0.8 b 8.3 14.4 0.36 bc
Hyb 2 6.6 b 1.3 a 7.7 15.5 0.42 ab
Hyb 3 5.7 b 1.3 a 8.9 15.8 0.35 c
Hyb 4 9.0 a 1.3 a 8.2 18.5 0.49 a
PD
PD 1 6.4 1.2 8.2 15.8 0.40
PD 2 6.9 1.2 8.3 16.4 0.41
Nr
Nr 1 6.3 1.1 7.2 b 14.6 b 0.43
Nr 2 6.9 1.2 8.3 ab 16.3 ab 0.41
Nr 3 6.6 1.2 8.9 a 16.7 a 0.37
Nr 4 6.9 1.2 8.6 a 16.7 a 0.4
Anova
Hyb ** ** ns ns **
PD ns ns ns ns ns
Nr ns ns ** ** ns
Hyb x PD ns ns * ns *
Hyb xNr ns ns ns ns ns
PD x Nr ns ns ns ns ns
Hyb x PD x Nr ns ns ns ns ns
ns = not significant; *=P<0.05; **=P<0.01; ***=P<0.0001;
+ = based in 3 reps of whole plant biomass sampling

56
Table 2.3 - Plant biomass (Mg ha-1) of dry matter of grain, cob, and stover components for all
maize hybrids (Hybrid 1 = AQUAmaxTM P1151, Hybrid 2 = P1162, Hybrid 3 =
AQUAmaxTM P1498, Hybrid 4 = 33D49) grown at two plant densities (PD1 =
78,000, PD2 = 99,000 pl ha−1) and four N rates (Nr1 = 0, Nr2 = 134, Nr3 = 202,
and Nr4 = 269 kg ha−1) in 2013
Grain Weight+ Cob Weight Stover Weight Total Weight GHI
(Mg ha-1) (Mg ha-1) (Mg ha-1) (Mg ha-1)
Hybrid
Hyb 1 12.6 a 1.2 c 7.3 b 20.7 b 0.55 a
Hyb 2 12.0 a 1.6 a 8.2 a 22.0 a 0.51 bc
Hyb 3 11.4 b 1.2 c 7.5 b 20.0 b 0.52 b
Hyb 4 10.7 b 1.4 b 7.6 b 19.6 b 0.50 c
PD
PD 1 11.7 1.4 7.3 b 20.4 0.52 a
PD 2 11.7 1.3 8.0 a 20.8 0.51 b
Nr
Nr 1 7.0 c 0.9 c 6.2 b 13.8 c 0.45 c
Nr 2 12.5 b 1.4 b 8.1 a 21.8 b 0.52 b
Nr 3 13.3 ab 1.5 ab 8.2 a 23.1 ab 0.54 ab
Nr 4 13.8 a 1.6 a 8.1 a 23.6 a 0.55 a
Anova
Hyb ** ** ** ** **
PD ns ns ** ns **
Nr ** ** ** ** **
Hyb x PD ns ns ns ns ns
Hyb xNr ns ns ns ns ns
PD x Nr ns ns ns ns ns
Hyb x PD x Nr ns ns ns ns ns
ns = not significant; *=P<0.05; **=P<0.01; ***=P<0.0001;
+ = based in 3 reps of whole plant biomass sampling
2.3.5 Grain Yield and Its Components
The GY and its components are described in Tables 2.13 and 2.14, for 2012 and 2013,
respectively. In 2012, N rate and PD did not significantly affect KN, likely due to more
limiting drought conditions around the flowering time. There was only difference between
Hybrid 4 and all other (Hybrid 4 (3101) > Hybrid 3 (1819); Hybrid 2 (2188) = 1 (1843)). A
significant factorial, hybrid x PD, for KN was observed (Figure 2.9). PD presented only
difference for Hybrid 4, this hybrid was not affected by the higher PDs. For the hybrids within
the PD, for PD 1 the non-drought tolerant hybrids had greater values of KN than the drought-
tolerant, and for PD2, Hybrid 4 had the highest value.
Nevertheless, unlike the KN, the KW in 2012 (Table 2.13) was affected by all
treatment factors. The drought-tolerant hybrids showed the highest values for this variable,
during this drought weather season. However, the higher PDs negatively affected the KW, the

57
difference being more than 10 mg of kernel between PD1 and PD2. Among N rate treatments,
there was only difference between N fertilized and non-fertilized treatments (Nr1 < Nr 2-3-4).
A significant factorial (hybrid x PD) was also observed (Figure 2.9), KW being higher for
Hybrid 4 in the PD1. Looking at the hybrids in the PDs, Hybrid 2 showed the smallest KW
value in relation to all other hybrids in PD1.I In PD2 the Hybrid 4 was the only one to be
negatively affected by the higher PD. Maize final KW is the result of kernel growth during
two stages of the grain-filling period, and these stages may experience different resource
availability (CIRILO; ANDRADE, 1996). Kernel weight at physiological maturity depends
on the potential kernel size established early in grain filling, and the plant capacity to provide
assimilates needed to fulfill this potential during grain filling (BORRÁS; WESTGATE,
2006).
Significant differences (p<0.05) in KN and KW also were evident in all three
treatment factors (hybrid, plant density and N rate) in 2013 (Table 2.14). Hybrids 1 (P1151)
and 2 (P1162) had the highest KW values, but the lowest KN values, while hybrid 4 (33D49)
had just the opposite grain components (i.e. highest KN and lowest KW). As expected, KN
and KW were higher at the low density and as N rates increased, although the N rate of 269
kg of N did not significantly increase either KN or KW relative to the 202 kg N rate. The
higher PDs did not negatively affect this variable, and the higher N rates caused the greatest
values for KN; the mean difference between Nr4 and Nr1 (zero N) was around 2000 kernels
m-2.
It is well known that KN is normally the main grain yield component in maize in
different environments (TOLLENAAR, 1977), and genotypic variation in KN as drought
intensity changes was also documented by Chapuis et al. (2012), and Moradi et al. (2012).
Nitrogen stress reduces final grain number (Kernel Number) by increasing kernel abortion
(LEMCOFF; LOOMIS, 1986; PEARSON; JACOBS, 1987). Grain sink size is highly
associated with kernel number in grain crops, and kernel number is a function of plant dry
matter accumulation. In wheat (Triticum aestivum L.), kernel number was linearly related to
incident solar radiation in the 30 d preceding anthesis across a range of environments
(FISCHER, 1985). Andrade et al. (2000) suggest that water and-or N deficiency reduce the
carbon availability and dry BM partitioning to the ear during the critical period that
determines grain number. Unfavorable environmental conditions can cause a reduction in the
kernel number per plant (FISCHER; PALMER, 1984; KINIRY; RITCHIE, 1985).
Overall grain yields were very high in this experiment in 2013. Plot-combine
harvested grain yields were statistically different (P<0.05) for hybrid and N rate treatment

58
factors (Table 2.14); the same treatment factors were also significantly different for other
variables: grain N uptake, total plant N uptake, GHI, and NHI. We observed that hybrid
P1151 did not differ from P1162, and only differed from P1498 and 33D49. Hybrid 33D49
had the lowest grain yield, and this hybrid was also significantly lower in yield than its
comparable-maturity counterpart (P1498). Grain N uptake was similar for hybrid P1151 and
P1162, while 33D49 had the lowest grain N uptake. For whole plant N uptake, there was no
difference among P1151 and 1162, but both of these 111 CRM hybrids had about 10% more
total plant uptake than the 114 CRM hybrids P1498 and 33D49. The early maturing
AQUAmax hybrid P1151 had significantly higher grain harvest index and N harvest index
than the other 3 hybrids. In 2012, the PD and N rates were significant (Table 2.13), so that
GY was negatively affected by the higher PDs, and there was only difference between N
fertilized and non-fertilized treatments; GY in Nr1 (zero N) being approximately 10 Mg ha-1
lower than in N fertilized treatments. In contrast to grain yield, the GHI is impartially stable
when plant density increased from low PDs to the optimum plant density for grain yield, and
the GHI declines when PD increases beyond the optimum PD for GY (TOLLENAR, 2011).
However, in the 2013 season, the hybrids and N rates were significant in relation to GY,
because there was no difference between Hybrids 1, 2, and 3 but only with the Hybrid 4
(lowest value for this variable). The N rates strongly affected GY, Nr4 being the best one
(Nr1 < Nr2 < Nr3 < Nr4). The plant density is one of the cultural practices that most affects
GY, due to the small capacity of issuance of fertile tillers culture, its monoecious floral
organization and short flowering period (SANGOI, 2001). The use of high densities
stimulates apical dominance (SANGOI, 1996). Thus, the plant invests most of available
resources in the pollen production and dispersal due to a drop in growth rates and
development of ears and stigma, leading to female infertility and asynchrony between pollen
shed and silking (Sangoi and Salvador, 1998a). During the drought season, 2012, the highest
PD had an influence on GY, but not in 2013. However, the GHI was only affected by the
highest PD in the 2013 season, but not in 2012. Argenta et al. (2001), analyzing two single
hybrids of corn sown in four row spacing (0.40, 0.60, 0.80 and 1.00 m) and two populations
(50,000 and 60,000 plants ha-1), concluded that grain yield was influenced by reducing the
spacing between lines and the plant density.
The water stress effects on maize include the visible symptoms of delayed maturity
and reduced biomass and crop grain yield. For example, water stress on maize has been
shown to reduce plant height (ÇAKIR, 2004), and leaf area index (TRAORE et al., 2000).
Grain yield can be reduced by decreasing yield components as for example kernel number and

59
kernel weight (OTEGUI; ANDRADE; SUERO 1995; PANDEY; MARANVILLE; ADMOU,
2000). Results of older and newer hybrids grown at two PDs showed that grain yield was
closely associated with dry matter accumulation (BM) during the grain-filling period
(TOLLENAR; LEE, 2011). Lindsey and Thomison (2014) in a field study evaluating the
responses of two drought-tolerant hybrids and two non-tolerant hybrids to sidedress N
application rate (0, 67, 134, 202, and 269 kg N ha-1) suggested that drought-tolerant maize
hybrids exhibit similar N responses to non-tolerant hybrids, and can be managed using
existing N recommendations.
2.3.6 Nutrient Harvest Indices
Overall NHI values were much lower in 2012 than in 2013. Unlike for GHI, in 2012, the
hybrid and N rate treatment factor were significant for NHI (Table 2.4, Figure 2.15) the
drought-tolerant hybrids were inferior in NHI to the non-drought tolerant hybrids (Hybrid1 <
Hybrid 2, and Hybrid 3 < Hybrid 4). There was little NHI response to N rate treatments
between the N rate 1 in relation to the N rate 3 (Nr1 > Nr3). In 2013 (Table 2.5, Figure 2.16),
all treatments factors were significant for NHI; Hybrid 1 had higher NHI than Hybrid 2, and
there was no difference between Hybrids 3 and 4. The higher PD (PD2) negatively affected
the NHI in 2013, while higher NHI values were observed in the N fertilized treatments (Nr1 <
Nr2 < Nr4).
In a similar way for the GHI in 2012, in the PHI only the hybrid factor was significant
(Table 2.6, Figure 2.16); the non-drought tolerant hybrids achieved higher PHI values than
the drought-tolerant hybrids (Hybrid 1 < 2; Hybrid 3 < 4). . However, in 2013 only the N rate
factor was significant for PHI (Table 2.6), the higher value for that variable was for Nr4 (Nr4
> Nr2-3 > Nr1).
Hybrid treatments, but not PD or N rate treatments, significantly affected KHI in 2012
(Table 2.8), Hybrid 4 had higher KHI than Hybrids 1 and 2, but no difference was found
between the same maturity hybrids. In 2013 (Table 2.9), the KHI was affected by both hybrid
and N rate treatments, but the hybrids with the same maturity did not differ (Hybrid 1 >
Hybrid 3 = Hybrid 4) and only a KHI difference between treatments with and without N was
observed (Nr1< Nr2=3=4).
The SHI in 2012 was affected by the hybrid and N rate treatments (Table 2.10), the
drought-tolerant hybrids had lower values for this variable (Hybrid 1 < 2; Hybrid 3 < 4), and
Hybrid 4 had higher SHI than all other hybrids while Nr1 greater than Nr3 and Nr4. In 2013,

60
the SHI was also affected by all three treatment factors (Table 2.11), SHI was negatively
affected by the higher PD (PD1 > PD2), there was no difference among Hybrids 1 and 2, only
between Hybrids 3 and 4 since the Hybrid 3 superior in SHI than the Hybrid 4. The highest
value for SHI was for Nr 4 (Nr4> Nr2-3 > Nr1).
In 2013 season, the majority of the macronutrient harvest indices were higher than
those observed in 2012. For example, Hybrids 1, 2 and 3 had an incremental gain of
approximately 0.20 in the NHI between 2012 and 2013. Only the KHI were similar in both
seasons. The PHI was lower than normal in 2012, but also significantly lower in drought-
tolerant hybrids than in the two more drought susceptible hybrids.
2.3.7 Nutrient Internal Efficiencies
In 2012, the hybrids and N rate treatment factors were significant for Nitrogen Internal
Efficiency, NIE (Hybrid 3 < 4; Hybrid 1 = Hybrid 2) and N rate 1 was the greatest among all
N rates (Table 2.4). A positive factorial, hybrid x PD, for NIE was observed (Figure 2.18).
When we evaluated the PD within hybrids, Hybrid 4 had a higher value for NIE in the PD2.
While for the other hybrids, Hybrid 4 was greater than Hybrid 3 in the PD 1, and Hybrid 4
responded better in the PD2 than the other hybrids. For NRE only the Hybrids caused
significant differences (Hybrid 4 > 3; and Hybrid 1 = 2)). There was no significant treatment
factors for NUE.
In the 2013 season (Table 2.5), only the N rate treatment caused difference for NIE
(Nr1-2 > Nr4), and NRE (Nr2 > Nr3-4). However, hybrid and N rate treatment factors both
caused differences for NUE; Hybrid 1 had 6.7% NUE than Hybrid 2 but no NUE differences
were observed between Hybrids 3 and 4 (Hybrid 1 > Hybrid 2, 3 and 4) and (Nr2 > Nr3 >
Nr4).
The NRE, NIE, and NUE values, when significant for N rate, were greater for low N
rate treatments for both seasons. In the more normal weather season the drought-tolerant
hybrid (Hybrid 1) resulted in the highest value for NUE.
In 2012, PIE was affected only by the hybrid treatment factor (Hybrid 2=4 > Hybrid 1
> Hybrid 3) and the drought-tolerant hybrids were inferior to the non-drought tolerant hybrids
for this variable (Table 2.6). A significant interaction between hybrid and PD was observed in
2012 (Figure 2.19). In analyzing the PD within the hybrids, there were PD differences for the
Hybrids 1 and 4; the PD2 negatively affected the PIE in the Hybrid 1, but positively in the
Hybrid 4. Looking at the Hybrids in the PDs, Hybrid 3 had the smallest value at PD1, and

61
also Hybrid 1 was affected negatively by the PD2. In the 2013 season the PIE was affected
only by the N rate (Nr1< Nr2=3=4), Table 2.7.
Both hybrid and N rate treatment factors were significant for KIE in 2012. The
drought-tolerant hybrids presented the lower values (Hybrid 2 = 4 > Hybrid 1=3; and
Nr1=2=4 > Nr3), Table 2.8. In 2013, KIE was higher in the N fertilized treatments (Nr 1<
Nr2=3=4) but no hybrid or PD treatment effects were significant (Table 2.9).
Therefore, the SIE in 2012 (Table 2.10) was affected only by hybrid, and the more
drought susceptible hybrids had superior values for the SIE in 2012. However, in 2013 (Table
2.11), in a similar way PIE, the N rate was the only significant factor. The simple presence
of N fertilization resulted in higher SIE (Nr 2-4 > Nr1).
2.3.8 Nutrient ratios
The N/P ratio was affected by hybrid and N rate (Nr) in 2012, but only by Nr in the
2013 season (Table 2.12). In 2012, the Hybrids 2 and 3 had the greatest values for the N/P
ratio, and the Nr1 presented the smallest value for this variable in both seasons. Significant
factorials of Hybrid x PD (Figure 2.22), and Hybrid x Nr were observed (Figure 2.23). In the
factorial hybrid x PD, looking at the PD within the hybrids, there was only difference for the
Hybrid 2, and the N/P ratio increased in the higher plant density. Analyzing the hybrids within
the PD, Hybrids 1 and 2 were the greatest in the PD1. Therefore, in PD 2, the Hybrid 2 was
the less negatively affected by the higher PD (Hybrid 2 > Hybrid 1; Hybrid 4 > Hybrid 3). For
the factorial hybrid x Nr, for the Hybrids 1 and 2 most of the N rates only differed from zero
N, while for Hybrid 3 the N rate 3 lead to the greatest value for N/P, and in the Hybrid 4 the
N/P ratio was higher at the higher N rates. Looking at the hybrids within the N rates, we noted
that the Hybrids 1 and 2 were individually greater in most of them, but in the Nr4 also Hybrid
4 responded with a higher value for N/P, only Hybrid 3 had the smallest value.
The N/K ratio was affected by hybrid and Nr in both years. In a similar way as the N/P
ratio for the Hybrids 1 and 2, in 2012, these hybrids were again greater than Hybrids 3 and 4,
and the Nr1 (zero N) triggered the smallest value. Also, like for N/P, significant factorials
were observed for ratio N/K between Hybrid x PD (Figure 2.25), and Hybrid x Nr (Figure
2.26). In addition, there was a significant factorial between all three treatment factors (Hybrid
x PD x Nr), Figure 2.24. For the factorial hybrid x PD, looking at the PD within the hybrids,
there was only difference between the two PD for the Hybrid 3, the N/K was higher in PD 1,
while analyzing the hybrids within the PDs, we distinguished that the Hybrids 1 and 2 had
higher N/K ratios in both PDs.. Then, for the factorial hybrid x Nr, the Nr within the hybrids,

62
presented more differences between N fertilized and non-fertilized treatments, however for
the Hybrid 4 the highest Nr did not differ from the zero N fertilization. In examining the
hybrids within the N rates we could also see that Hybrids 1 and 2 had higher N/K rations in
the majority of the N rates.
Nevertheless in 2013, Hybrids 1 did not differ in its N/K ratio from Hybrid 2 and
Hybrid 4 was greater than Hybrid 3, and the higher N rates caused the greatest N/K values
(Nr3-4 > Nr2 > Nr1). However, the ratio N/S was affected by hybrid only in 2012, not in
2013, by PD only in 2012, and by Nr in both seasons. Similar tor N/P and N/K ratio results in
2012, Hybrids 1 and 2 resulted in higher N/S (although there was no difference between the
similar maturity hybrids). The N/S value was not negatively affected by higher PD, and the
higher Nr triggered the greater value (Nr3=4 > Nr2 > Nr1). Nonetheless, in 2013 only the Nr
was significant for N/S, was the greatest, and an increase in this variable was observed with
the increase of N rates (Nr 4> Nr3> Nr2 > Nr1). In summary, there was only difference
between the same maturity hybrids for the pair formed by Hybrid 3 and Hybrid 4 for the ratio
N/K in 2013, Hybrid 3 presented a lower value than Hybrid 4 for this variable.
2.3.9 Regression analysis
The total plant biomass (BM) had the highest r2 value in relation to total plant S
uptake, in the 2012 season (Figure 2.27). The weakest correlation between BM and nutrient
uptake was with total plant P uptake. The total plant N uptake was the third highest r2 for BM
x nutrient uptake (total plant S uptake > total plant K uptake > total plant N uptake > total
plant P uptake). In 2013 (Figure 2.28), the N uptake had the highest regression relationship
with BM. However, the total plant P uptake, as in 2012, had the weakest correlation values
(total plant N uptake > total plant S uptake > total plant K uptake > total plant P uptake).
In the normal weather season of 2013 the plant N uptake had a higher influence in the
total plant biomass. However, in the dry conditions season of 2012, the total plant S uptake
resulted in the highest regression between the BM and nutrient uptake. The total plant P
uptake was the macro-nutrient least related with the BM for all hybrids averaged across both
PD and all N rates. As a result, a rather substantial positive influence in relation to the amount
of nutrient uptake and BM was observed, mainly for N, K, and S, in both seasons.
2.4 Conclusions
In the dry season, drought-tolerant hybrids (Hybrids 1 and 3) presented higher values
for stover P content than the non-drought tolerant (Hybrids 2 and 4). The drought-tolerant

63
Hybrid 3, in the factorial significant for Hybrid x PD, presented higher stover S content than
the Hybrid 4. Demonstrating that these drought tolerant hybrids have greater root area than
the non-drought tolerant.
In 2013 season, the majority of the macronutrient harvest indices were higher than
those observed in 2012. Only the KHI were similar in both seasons. The PHI was lower than
normal in 2012, but also significantly lower in drought-tolerant hybrids than in the two more
drought susceptible hybrids.
All hybrids, whether labeled as more drought tolerant or less so, responded similarly
in grain yield to plant density and N rate treatments in the dry or more normal weather year.
AQUAmax hybrids (drought tolerant) did not demonstrate improvement in grain yield or
more yield stability than non-AQUAmax (non-drought tolerant). The drought-tolerant Hybrid
1 (P1151) generally displayed a longer anthesis to silking interval than comparable-maturity
Hybrid P1162 (in 2013 season). AQUAmax Hybrid P1498 generally showed a slightly earlier
flowering, and a shorter anthesis-to-silking interval, than comparable-maturity hybrid 33D49
in both seasons (2012 and 2013). Hybrid 1498 also had consistently lower kernel numbers but
higher final kernel weights than 33D49 in both years.
Achieving shorter periods between anthesis and silking and accumulation of more
nutrients in the stover, in the dry season, could be some of the mechanisms used by drought-
tolerant hybrids in achieving greater plant BM production and possible higher GY.
There was no evidence that AQUAmax hybrids were any different than non-
AQUAmax hybrids in their response to N fertilizers or in their N use efficiencies. Thus it is
unlikely that N fertilizer management should change when AQUAmax hybrids are grown.
Certainly there is no evidence that optimum N fertilizer rates would be any lower for these
AQUAmax hybrids.

64
Table 2.4 - Nitrogen partitioning (kg ha-1 dry weight) into grain, cob, and stover components,
nitrogen harvest index (NHI), nitrogen use efficiency (NUE) kg grain (kg N-1)
(ΔGY per unit N applied – relative to Nr1, control treatment), nitrogen recovery
efficiency (NRE), nitrogen internal efficiency (NIE) at physiological maturity for
all maize hybrids (Hybrid 1 = AQUAmaxTM P1151, Hybrid 2 = P1162, Hybrid 3
= AQUAmaxTM P1498, Hybrid 4 = 33D49) grown at two plant densities (PD1 =
79,000, PD2 = 104,000 pl ha−1) and four N rates (Nr1 = 0, Nr2 = 134, Nr3 = 202,
and Nr4 = 269 kg ha−1) in 2012
Grain N Cob N Stover N Total N NHI NUE NRE NIE
(kg ha-1) (kg ha-1) (kg ha-1) (kg ha-1)
Hybrid
Hyb 1 77.6 b 6.6 108.2 192.3 0.40 c 3.2 0.18 c 28.4 b
Hyb 2 96.9 ab 8.0 92.4 197.3 0.49 b 8.8 0.34 bc 33.8 b
Hyb 3 86. 2 b 8.5 103.3 198.1 0.44 bc 3.9 0.35 b 29.0 b
Hyb 4 127.0 a 8.4 90.0 225.4 0.56 a 6.7 0.49 a 40.9 a
PD
PD 1 94.8 6.8 97.0 199.6 0.47 5.0 0.30 32.4
PD 2 99.0 8.9 99.0 207.0 0.47 6.3 0.43 33.5
Nr
Nr 1 81.3 b 6.9 70.5 c 158.7 b 0.51 a - - 39.8 a
Nr 2 100.3 ab 7.6 98.9 b 206.8 a 0.48 ab 7.4 0.39 33.6 b
Nr 3 100.5 ab 8.0 116.2 a 224.6 a 0.43 b 5.1 0.36 28.2 b
Nr 4 105.7 a 8.9 108.3 ab 222.9 a 0.47 ab 4.3 0.26 30.3 b
Anova
Hyb * na ns ns ** ns ** **
PD ns na ns ns ns ns ns ns
Nr * na *** *** * ns ns ***
Hyb x PD ns na * ns ns ns ns *
Hyb xNr ns na ns ns ns ns ns ns
PD x Nr ns na ns ns ns ns ns ns
Hyb x PD x Nr ns na ns ns ns ns ns ns
ns = not significant; na = not available; *=P<0.05; **=P<0.01; ***=P<0.0001.
Cob nutrient concentration for the same treatments in reps 2 and 3 was estimated from rep 1
data but adjusted for each individual plot cob weight so statistical analysis was not possible

65
Table 2.5 - Nitrogen partitioning (kg ha-1 dry weight) into grain, cob, and stover components,
nitrogen harvest index (NHI), nitrogen use efficiency (NUE) kg grain (kg N-1)
(ΔGY per unit N applied – relative to Nr1 control treatment), nitrogen recovery
efficiency (NRE), nitrogen internal efficiency (NIE) at physiological maturity for
all maize hybrids (Hybrid 1 = AQUAmaxTM P1151, Hybrid 2 = P1162, Hybrid 3
= AQUAmaxTM P1498, Hybrid 4 = 33D49) grown at two plant densities (PD1 =
78,000, PD2 = 99,000 pl ha−1) and four N rates (Nr1 = 0, Nr2 = 134, Nr3 = 202,
and Nr4 = 269 kg ha−1) in 2013
Grain N Cob N
Stover
N Total N NHI NUE NRE NIE
(kg ha-1) (kg ha-1) (kg ha-1) (kg ha-1)
Hybrid
Hyb 1 135.8 a 8.4 52.8 b 197.0 a 0.67 a 40.7 a 0.55 68.0
Hyb 2 128.9 ab 7.8 65.2 a 201.9 a 0.62 b 34.0 b 0.58 66.8
Hyb 3 119.6 bc 8.6 53.4 b 181.5 b 0.64 b 29.6 b 0.50 69.9
Hyb 4 113.9 c 8.9 55.1 b 178.0 b 0.62 b 33.4 b 0.55 66.4
PD
PD 1 125.1 8.0 54.0 187.1 0.65 a 34.8 0.51 68.8
PD 2 124.0 8.8 59.3 192.1 0.62b 34.3 0.58 66.7
Nr
Nr 1 60.4 d 6.0 43.1 c 109.5 d 0.54 c - - 69.0 a
Nr 2 125.2 c 9.2 57.2 b 191.7 c 0.65 b 43.3 a 0.63 a 70.8 a
Nr 3 146.4 b 8.9 61.3 a 216.6 b 0.67 ab 33.7 b 0.53 b 67.5 ab
Nr 4 166.2 a 9.5 65.0 a 240.7 a 0.69 a 27.8 c 0.49 b 63.5 b
Anova
Hyb ** na * * ** ** ns ns
PD ns na ns ns * ns ns ns
Nr ** na ** ** ** ** * *
Hyb x
PD ns na ns ns ns ns ns ns
Hyb xNr ns na ns ns ns ns ns ns
PD x Nr ns na ns ns ns ns ns ns
Hyb x
PD x Nr ns na ns ns ns ns ns ns
ns = not significant; na = not available; *=P<0.05; **=P<0.01; ***=P<0.0001.
Cob nutrient concentration for the same treatment in reps 2 and 3 was estimated from rep 1
data but adjusted for each individual plot cob weight so statistical analysis was not possible.

66
Table 2.6 - Phosphorus partitioning (kg ha-1 dry weight) into grain, cob, and stover
components, phosphorus harvest index (PHI) and phosphorus internal
efficiency (PIE) at physiological maturity for all maize hybrids (Hybrid 1 =
AQUAmaxTM P1151, Hybrid 2 = P1162, Hybrid 3 = AQUAmaxTM P1498,
Hybrid 4 = 33D49) grown at two plant densities (PD1 = 79,000, PD2 = 104,000
pl ha−1) and four N rates (Nr1 = 0, Nr2 = 134, Nr3 = 202, and Nr4 = 269 kg
ha−1) in 2012
Grain P Cob P Stover P Total P PHI PIE
(kg ha-1) (kg ha-1) (kg ha-1) (kg ha-1)
Hybrid
Hyb 1 13.6 c 0.9 17.0 a 31.5 b 0.42 c 170.6 b
Hyb 2 16.8 c 1.1 13.2 ab 31.2 b 0.53 b 219.2 a
Hyb 3 22.5 b 1.4 17.0 a 40.8 ab 0.54 b 137.8 c
Hyb 4 32.1 a 0.8 11.0 b 44.0 a 0.73 a 210.2 a
PD
PD 1 20.5 0.8 15.1 36.4 0.54 180.4
PD 2 22 1.3 14 37.3 0.56 188.4
Nr
Nr 1 20.1 0.9 13.2 34.2 0.57 188
Nr 2 21 1.2 14.4 36.6 0.56 202.3
Nr 3 21.8 1 15.7 38.5 0.52 167.3
Nr 4 22.1 1.2 14.9 38.3 0.56 180.2
Anova
Hyb *** na * ** *** **
PD ns na ns ns ns ns
Nr ns na ns ns ns ns
Hyb x PD ns na * ** ns **
Hyb xNr ns na ns ns ns ns
PD x Nr ns na ns ns ns ns
Hyb x PD x Nr ns na ns ns ns ns
ns = not significant; na = not available; *=P<0.05; **=P<0.01; ***=P<0.0001
Cob nutrient concentration for the same treatments in reps 2 and 3 was estimated from rep 1
data but adjusted for each individual plot cob weight so statistical analysis was not possible

67
Table 2.7 - Phosphorus partitioning (kg ha-1 dry weight) into grain, cob, and stover
components, phosphorus harvest index (PHI) and phosphorus internal
efficiency (PIE) at physiological maturity for all maize hybrids (Hybrid 1 =
AQUAmaxTM P1151, Hybrid 2 = P1162, Hybrid 3 = AQUAmaxTM P1498,
Hybrid 4 = 33D49) grown at two plant densities (PD1 = 78,000, PD2 = 99,000
pl ha−1) and four N rates (Nr1 = 0, Nr2 = 134, Nr3 = 202, and Nr4 = 269 kg
ha−1) in 2013
Grain P Cob P Stover P Total P PHI PIE
(kg ha-1) (kg ha-1) (kg ha-1) (kg ha-1)
Hybrid
Hyb 1 34.6 0.46 5.3 b 40.4 0.83 347.1
Hyb 2 32.8 0.42 8.0 a 41.6 0.8 332.5
Hyb 3 30.9 0.52 5.2 b 36.6 0.82 356.2
Hyb 4 29.5 0.61 5.5 b 35.6 0.8 339.7
PD
PD 1 32.4 0.5 5.8 38.2 0.82 338.4
PD 2 31.4 0.5 6.2 38.2 0.81 349.6
Nr
Nr 1 20.3 c 0.5 10.9 a 31.6 c 0.63 c 241.8 b
Nr 2 31.0 b 0.6 4.9 b 36.5 bc 0.84 b 387.6 a
Nr 3 35.3 ab 0.4 4.6 b 40.4 ab 0.87 b 376.6 a
Nr 4 40.8 a 0.4 3.7 b 44.9 a 0.90 a 364.6 a
Anova
Hyb ns na ** ns ns ns
PD ns na ns ns ns ns
Nr ** na ** ** ** **
Hyb x PD ns na ns ns ns ns
Hyb xNr ns na ns ns ** ns
PD x Nr ns na ns ns ns ns
Hyb x PD x Nr ns na ns ns ns ns
ns = not significant; na = not available; *=P<0.05; **=P<0.01; ***=P<0.0001
Cob nutrient concentration for the same treatments in reps 2 and 3 was estimated from rep 1
data but adjusted for each individual plot cob weight so statistical analysis was not possible

68
Table 2.8 - Potassium partitioning (kg ha-1 dry weight) into grain, cob, and stover
components, potassium harvest index (KHI), and potassium internal efficiency
(KIE) at physiological maturity for all maize hybrids (Hybrid 1 =
AQUAmaxTM P1151, Hybrid 2 = P1162, Hybrid 3 = AQUAmaxTM P1498, and
Hybrid 4 = 33D49) grown at two plant densities (PD1 = 79,000, PD2 =
104,000 pl ha−1) and four N rates (Nr1 = 0, Nr2 = 134, Nr3 = 202, and Nr4 =
269 kg ha−1) in 2012
Grain K Cob K Stover K Total K KHI KIE
(kg ha-1) (kg ha-1) (kg ha-1) (kg ha-1)
Hybrid
Hyb 1 18.9 b 6.9 84 109.7 b 0.17 b 49.7 b
Hyb 2 21.5 b 8.4 80 110.0 b 0.20 b 61.4 a
Hyb 3 27.1 b 9.3 91.6 128.0 ab 0.21 ab 44.4 b
Hyb 4 38.2 a 16.3 99.5 154.1 a 0.25 a 60.2 a
PD
PD 1 25.3 9.2 87 121.4 0.21 53.4
PD 2 27.6 11.3 90.6 129.5 0.21 54.4
Nr
Nr 1 25.2 9.8 75.0 b 110.0 b 0.23 58.1 a
Nr 2 26.4 10.5 86.6 ab 123.5 ab 0.21 58.8 a
Nr 3 26.7 10 99.9 a 136.6 a 0.19 46.7 b
Nr 4 27.4 10.5 93.6 a 131.6 a 0.21 52.1 a
Anova
Hyb ** na ns * ** **
PD ns na ns ns ns ns
Nr ns na ns ** ns **
Hyb x PD ns na ns ns ns *
Hyb xNr ns na ns ns ns *
PD x Nr ns na ns ns ns ns
Hyb x PD x Nr ns na ns ns ns ns
ns = not significant; na = not available; *=P<0.05; **=P<0.01; ***=P<0.0001
Cob nutrient concentration for the same treatments in reps 2 and 3 was estimated from rep 1
data but adjusted for each individual plot cob weight so statistical analysis was not possible

69
Table 2.9 - Potassium partitioning (kg ha-1 dry weight) into grain, cob, and stover
components, potassium harvest index (KHI), and potassium internal efficiency
(KIE) at physiological maturity for all maize hybrids (Hybrid 1 =
AQUAmaxTM P1151, Hybrid 2 = P1162, Hybrid 3 = AQUAmaxTM P1498, and
Hybrid 4 = 33D49) grown at two plant densities (PD1 = 78,000, PD2 = 99,000
pl ha−1) and four N rates (Nr1 = 0, Nr2 = 134, Nr3 = 202, and Nr4 = 269 kg
ha−1) in 2013
Grain K Cob K Stover K Total K KHI KIE
(kg ha-1) (kg ha-1) (kg ha-1) (kg ha-1)
Hybrid
Hyb 1 47.5 a 10.3 98.4 b 156.3 0.30 a 85.2
Hyb 2 46.0 a 10.2 115.8 a 172.4 0.27 ab 77.8
Hyb 3 43.5 ab 11.6 108.5 b 163.7 0.26 b 77.3
Hyb 4 37.0 b 16.6 96.4 b 150.1 0.24 b 77.3
PD
PD 1 44.2 11.7 101.4 157.3 0.28 80.3
PD 2 43 12.8 108.1 163.7 0.26 78.5
Nr
Nr 1 29.1 c 10.2 87.5 c 125.9 c 0.23 b 59.3 b
Nr 2 43.8 b 13.7 104.5 b 162.0 b 0.27 a 84.8 a
Nr 3 47.6 ab 12.8 107.2 ab 167.7 b 0.28 a 88.8 a
Nr 4 53.6 a 12.2 119.8 a 185.6 a 0.29 a 83.4 a
Anova
Hyb * na * ns ** ns
PD ns na ns ns ns ns
Nr * na * ** ** **
Hyb x PD ns na ns ns ns ns
Hyb xNr ns na ns ns ns ns
PD x Nr ns na ns ns ns ns
Hyb x PD x Nr ns na ns ns ns ns
ns = not significant; na = not available; *=P<0.05; **=P<0.01; ***=P<0.0001
Cob nutrient concentration for the same treatments reps 2 and 3 was estimated from rep 1 data
but adjusted for each individual plot cob weight so statistical analysis was not possible

70
Table 2.10 - Sulfur partitioning (kg ha-1 dry weight) into grain, cob, and stover components,
sulfur harvest index (SHI), and sulfur internal efficiency (SIE) at physiological
maturity for all maize hybrids (Hybrid 1 = AQUAmaxTM P1151, Hybrid 2 =
P1162, Hybrid 3 = AQUAmaxTM P1498, Hybrid 4 = 33D49) grown at two plant
densities (PD1 = 79,000, PD2 = 104,000 pl ha−1) and four N rates (Nr1 = 0, Nr2 =
134, Nr3 = 202, and Nr4 = 269 kg ha−1) in 2012
Grain S Cob S Stover S Total S SHI SIE
(kg ha-1) (kg ha-1) (kg ha-1) (kg ha-1)
Hybrid
Hyb 1 5.6 c 0.4 7.3 13.1 c 0.42 c 386.0 b
Hyb 2 6.9 b 0.5 6.1 14.2 bc 0.50 b 493.2 a
Hyb 3 6.8 b 0.7 7.5 14.8 b 0.45 bc 374.9 b
Hyb 4 9.6 a 0.5 6.7 16.7 a 0.57 a 538.4 a
PD
PD 1 7.2 0.4 7 14.6 0.5 436.2
PD 2 7.2 0.6 6.8 14.7 0.5 460.2
Nr
Nr 1 7.1 0.5 5.7 b 13.3 b 0.53 a 471.8
Nr 2 7.5 0.6 7.0 a 15.1 a 0.49 ab 459.6
Nr 3 7.2 0.5 7.7 a 15.4 a 0.45 bc 409.4
Nr 4 7.2 0.6 7.1 a 15.0 a 0.47 b 451.9
Anova
Hyb ** na ns ** ** **
PD ns na ns ns ns ns
Nr ns na ** * * ns
Hyb x PD ns na * ns ns **
Hyb xNr ns na ns ns ns ns
PD x Nr ns na ns ns ns ns
Hyb x PD x Nr ns na ns ns ns ns
ns = not significant; na = not available; *=P<0.05; **=P<0.01; ***=P<0.0001
Cob nutrient concentration for the same treatments in reps 2 and 3 was estimated from rep 1
data but adjusted for each individual plot cob weight so statistical analysis was not possible

71
Table 2.11 - Sulfur partitioning (kg ha-1 dry weight) into grain, cob, and stover components,
sulfur harvest index (SHI), and sulfur internal efficiency (SIE) at physiological
maturity for all maize hybrids (Hybrid 1 = AQUAmaxTM P1151, Hybrid 2 =
P1162, Hybrid 3 = AQUAmaxTM P1498, Hybrid 4 = 33D49) grown at two plant
densities (PD1 = 78,000, PD2 = 99,000 pl ha−1) and four N rates (Nr1 = 0, Nr2 =
134, Nr3 = 202, and Nr4 = 269 kg ha−1) in 2013
Grain S Cob S Stover S Total S SHI SIE
(kg ha-1) (kg ha-1) (kg ha-1) (kg ha-1)
Hybrid
Hyb 1 9.1 a 0.4 4.0 b 13.5 b 0.66 a 974.2
Hyb 2 9.7 a 0.3 4.8 a 14.8 a 0.64 a 884.2
Hyb 3 8.9 ab 0.4 4.0 b 13.8 b 0.65 a 943.7
Hyb 4 8.1 b 0.4 4.0 b 12.5 c 0.63 b 918.6
PD
PD 1 9.1 0.4 4 13.5 0.66 a 928.9
PD 2 8.9 0.4 4.4 13.6 0.64 b 932.4
Nr
Nr 1 5.3 c 0.3 4 9.6 b 0.55 c 773.1 b
Nr 2 9.5 b 0.4 4.3 14.2 a 0.67 b 919.7 a
Nr 3 10.3 ab 0.4 4.4 15.1 a 0.68 b 892.4 ab
Nr 4 10.7 a 0.4 4.2 15.3 a 0.70 a 1007.0 a
Anova
Hyb ** na ** ** * ns
PD ns na ns ns * ns
Nr ** na ns ** * **
Hyb x PD ns na ns ns ns ns
Hyb xNr ns na ns ns ns ns
PD x Nr ns na ns ns ns ns
Hyb x PD
x Nr ns na ns ns ns ns
ns = not significant; na = not available; *=P<0.05; **=P<0.01; ***=P<0.0001
Cob nutrient concentration for the same treatments in reps 2 and 3 was estimated from rep 1
data but adjusted for each individual plot cob weight so statistical analysis was not possible

72
Table 2.12 - Plant nitrogen ratios to phosphorus (N/P), potassium (N/K), and sulfur (N/S), and
anthesis-silking interval (ASI) at physiological maturity for all maize hybrids
(Hybrid 1 = AQUAmaxTM P1151, Hybrid 2 = P1162, Hybrid 3 = AQUAmaxTM
P1498, Hybrid 4 = 33D49, and Hybrid 5 = P1184) grown at two plant densities
(PD1=79,000, PD2=104,000 pl ha−1) and (PD1 = 78,000, PD2 = 99,000 pl ha−1)
2012 and 2013 seasons, respectively, and four N rates (Nr1 = 0, Nr2 = 134, Nr3
= 202, and Nr4 = 269 kg ha−1) in 2012 and 2013
Ratio N/P Ratio N/K Ratio N/S ASI R1 (days)
2012 2013 2012 2013 2012 2013 2012 2013
Hybrid
Hyb 1 6.23 a 5.06 1.79 a 1.25 a 14.26 a 14.34 5.6 a 0.5 bc
Hyb 2 6.65 a 5.09 1.81 a 1.16 ab 14.67 a 13.4 3.5 b 0.29 c
Hyb 3 4.80 b 5.12 1.56 b 1.11 b 13.18 b 13.58 4.4 ab 0.75 ab
Hyb 4 5.10 b 5.14 1.47 b 1.17 a 13.31 b 13.94 5.6 a 1.0 a
PD
PD 1 5.64 4.99 1.66 1.18 13.67 b 13.65 4.3 0.52
PD 2 5.75 5.22 1.65 1.17 14.04 a 14 5.2 0.75
Nr
Nr 1 4.78 b 3.51 b 1.47 b 0.86 c 11.95 c 11.27 d 5.1 1.54 a
Nr 2 5.93 a 5.52 a 1.75 a 1.20 b 13.79 b 13.55 c 4.5 0.21 b
Nr 3 6.09 a 5.57 a 1.67 a 1.32 a 14.69 a 14.48 b 4.9 0.46 b
Nr 4 5.96 a 5.74 a 1.74 a 1.31 a 14.97 a 15.88 a 4.5 0.33 b
Anova
Hyb ** ns ** * ** ns * *
PD ns ns ns ns * ns ns ns
Nr ** ** ** ** ** ** ns **
Hyb x PD ** ns * ns ns ns * ns
Hyb xNr * ns ** ns ns ns ns ns
PD x Nr ns ns ns ns ns ns ns ns
Hyb x PD x Nr ns ns ** ns ns ns ns ns
ns = not significant; *=P<0.05; **=P<0.01; ***=P<0.0001

73
Table 2.13 - Grain yield (155 g kg-1 moisture) from combine harvest (GY), grain harvest
index (GHI), kernel number (KN), kernel weight (KW), at physiological
maturity for all maize hybrids (Hybrid 1 = AQUAmaxTM P1151, Hybrid 2 =
P1162, Hybrid 3 = AQUAmaxTM P1498, and Hybrid 4 = 33D49) grown at two
plant densities (PD1=79,000, PD2=104,000 pl ha−1) and four N rates (Nr1 = 0,
Nr2 = 134, Nr 3 = 202, and Nr 4 = 269 kg ha−1) in 2012
GY+ KN KW
(Mg ha-1) (kernel m-2) (mg kernel-1)
Hybrid
Hyb 1 6.81 1843 b 347 a
Hyb 2 6.94 2188 b 337 ab
Hyb 3 7.12 1819 b 352 a
Hyb 4 8.57 3101 a 323 b
PD
PD 1 8.13 a 2154 346 a
PD 2 6.59 b 2322 334 b
Nr
Nr 1 6.59 b 2163 321 b
Nr 2 7.56 a 2376 351 a
Nr 3 7.60 a 2067 347 a
Nr 4 7.67 a 2346 340 a
Anova
Hyb ns ** **
PD *** ns *
Nr ** ns **
Hyb x PD ** ** **
Hyb xNr ns ns ns
PD x Nr ns ns ns
Hyb x PD x Nr ns ns ns
ns = not significant; *=P<0.05; **=P<0.01; ***=P<0.0001
+ = based in 5 reps

74
Table 2.14 - Grain yield (155 g kg-1 moisture) from combine harvest (GY), grain harvest
index (GHI), kernel number (KN), kernel weight (KW), at physiological
maturity for all maize hybrids (Hybrid 1 = AQUAmaxTM P1151, Hybrid 2 =
P1162, Hybrid 3 = AQUAmaxTM P1498, Hybrid 4 = 33D49, and Hybrid 5 =
P1184) grown at two plant densities (PD1 = 78,000, PD2 = 99,000 pl ha−1) and
four N rates (Nr1 = 0, Nr2 = 134, Nr3 = 202, and Nr4 = 269 kg ha−1) in 2013
GY+ KN KW
(Mg ha-1) (kernel m-2) (mg kernel-1)
Hybrid
Hyb 1 13.24 a 4074 c 295 a
Hyb 2 12.96 a 3827 d 304 a
Hyb 3 12.68 a 4522 b 249 b
Hyb 4 11.56 b 4839 a 227 c
PD
PD 1 12.61 4196 b 274 a
PD 2 12.71 4435 a 263 b
Nr
Nr 1 7.44 d 2773 c 247 c
Nr 2 13.38 c 4672 b 265 b
Nr 3 14.46 b 4898 ab 278 a
Nr 4 15.14 a 4919 a 286 a
Anova
Hyb ** ** **
PD ns ** **
Nr ** ** **
Hyb x PD ns ns ns
Hyb xNr ns ns ns
PD x Nr ns ns ns
Hyb x PD x Nr ns ns ns
ns = not significant; *=P<0.05; **=P<0.01; ***=P<0.0001.
+ = based in 5 reps

75
Figure 2.9 - Mean separation test for kernel weight (mg kernel-1) in relation to the factorial Hybrid x PD, for each hybrid (Hybrid 1 =
AQUAmaxTM P1151, Hybrid 2 = P1162, Hybrid 3 =AQUAmaxTM P1498, Hybrid 4 = 33D49) and both plant densities (PD1 =
79,000; and PD2 = 104,000 pl ha-1), when averaged across all 4 N rates in 2012

76
Figure 2.10 - Mean separation test for kernel number (ear-1) in relation to the factorial Hybrid x PD, for each hybrid (Hybrid 1 = AQUAmaxTM
P1151, Hybrid 2 = P1162, Hybrid 3 =AQUAmaxTM P1498, Hybrid 4 = 33D49) and both plant densities (PD1 = 79,000; and PD2 =
104,000 pl ha-1), when averaged across all 4 N rates in 2012

77
Figure 2.11 - Mean separation test for stover N content (kg ha-1) in relation to the factorial Hybrid x PD, for each hybrid (Hybrid 1 =
AQUAmaxTM P1151, Hybrid 2 = P1162, Hybrid 3 =AQUAmaxTM P1498, Hybrid 4 = 33D49) and both plant densities (PD1 =
79,000; and PD2 = 104,000 pl ha-1), when averaged across all 4 N rates in 2012

78
Figure 2.12 - Mean separation test for stover P content (kg ha-1) in relation to the factorial Hybrid x PD, for each hybrid (Hybrid 1 =
AQUAmaxTM P1151, Hybrid 2 = P1162, Hybrid 3 =AQUAmaxTM P1498, Hybrid 4 = 33D49) and both plant densities (PD1 =
79,000; and PD2 = 104,000 pl ha-1), when averaged across all N rates in 2012
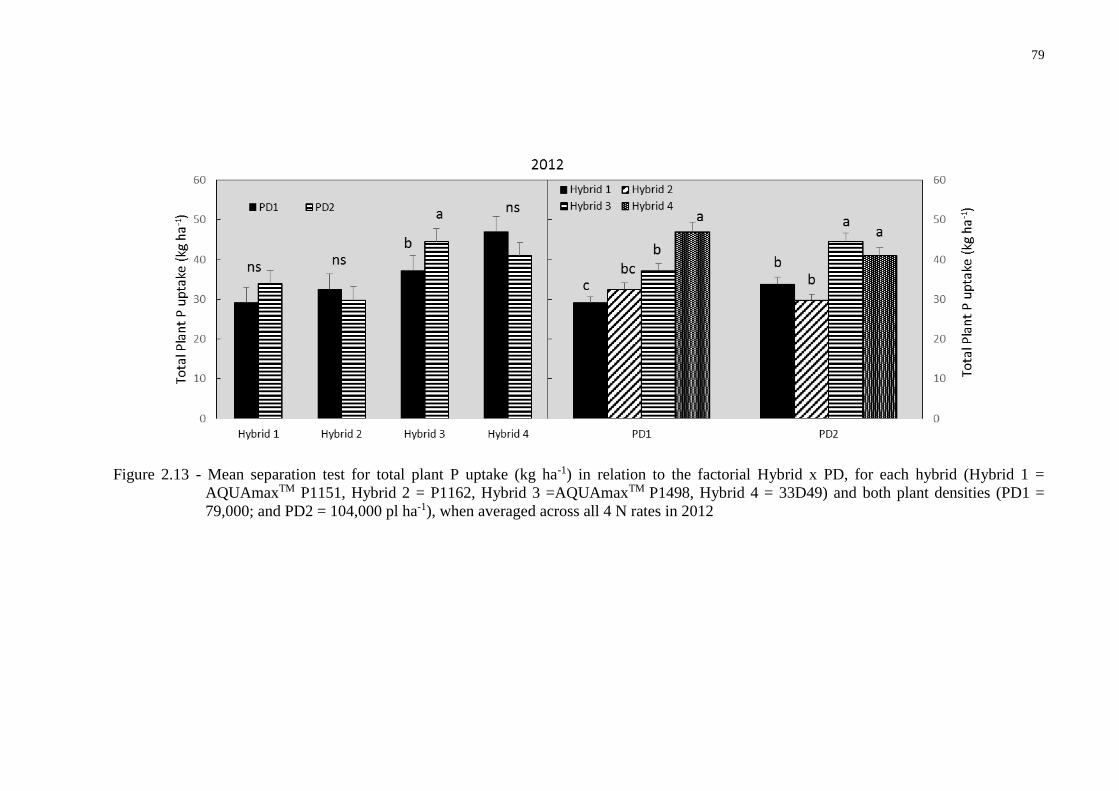
79
Figure 2.13 - Mean separation test for total plant P uptake (kg ha-1) in relation to the factorial Hybrid x PD, for each hybrid (Hybrid 1 =
AQUAmaxTM P1151, Hybrid 2 = P1162, Hybrid 3 =AQUAmaxTM P1498, Hybrid 4 = 33D49) and both plant densities (PD1 =
79,000; and PD2 = 104,000 pl ha-1), when averaged across all 4 N rates in 2012

80
Figure 2. 14 - Mean separation test for stover S content (kg ha-1) in relation to the factorial Hybrid x PD, for each hybrid (Hybrid 1 =
AQUAmaxTM P1151, Hybrid 2 = P1162, Hybrid 3 =AQUAmaxTM P1498, Hybrid 4 = 33D49) and both plant densities (PD1 =
79,000; and PD2 = 104,000 pl ha-1), when averaged across all 4 N rates in 2012

81
Figure 2.15 - Grain harvest index (GHI), nitrogen harvest index (NHI), phosphorus harvest index (PHI), potassium harvest index (KHI), and
Sulfur harvest index (SHI) for each hybrid (Hybrid 1 = AQUAmaxTM P1151, Hybrid 2 = P1162, Hybrid 3 =AQUAmaxTM P1498,
Hybrid 4 = 33D49) averaged across both plant densities (PD1 = 79,000; and PD2 = 104,000 pl ha-1) and four N rate levels (Nr1 =
0, Nr2 = 134, Nr3 = 202, and Nr4 = 269 kg N sidedress ha-1) in 2012

82
Figure 2.16 - Grain harvest index (GHI), nitrogen harvest index (NHI), phosphorus harvest index (PHI), potassium harvest index (KHI), and
sulfur harvest index (SHI) for each hybrid (Hybrid 1 = AQUAmaxTM P1151, Hybrid 2 = P1162, Hybrid 3 =AQUAmaxTM P1498,
Hybrid 4 = 33D49) averaged across both plant densities (PD1 = 78,000; and PD2 = 99,000 pl ha-1) and each N rate level (Nr1 = 0,
Nr2 = 134, Nr3 = 202, and Nr4 = 269 kg N sidedress ha-1) in 2013

83
Figure 2.17 - Mean separation test for GHI (Grain Harvest Index) in relation to the factorial Hybrid x PD, for each hybrid (Hybrid 1 =
AQUAmaxTM P1151, Hybrid 2 = P1162, Hybrid 3 =AQUAmaxTM P1498, Hybrid 4 = 33D49) and both plant densities (PD1 =
79,000; and PD2 = 104,000 pl ha-1), when averaged across all N rates in 2012

84
Figure 2.18 - Mean separation test for NIE (Nitrogen Internal Efficiency) in relation to the factorial Hybrid x PD, for each hybrid (Hybrid 1 =
AQUAmaxTM P1151, Hybrid 2 = P1162, Hybrid 3 =AQUAmaxTM P1498, Hybrid 4 = 33D49) and both plant densities (PD1 =
79,000; and PD2 = 104,000 pl ha-1), when averaged across all 4 N rates in 2012

85
Figure 2.19 - Mean separation test for PIE (Phosphorus Internal Efficiency) in relation to the factorial Hybrid x PD, for each hybrid (Hybrid 1 =
AQUAmaxTM P1151, Hybrid 2 = P1162, Hybrid 3 =AQUAmaxTM P1498, Hybrid 4 = 33D49) and both plant densities (PD1 =
79,000; and PD2 = 104,000 pl ha-1), when averaged in all 4 N rates in 2012

86
Figure 2.20 - Mean separation test for KIE (Potassium Internal Efficiency) in relation to the factorial Hybrid x PD, for each hybrid (Hybrid 1 =
AQUAmaxTM P1151, Hybrid 2 = P1162, Hybrid 3 =AQUAmaxTM P1498, Hybrid 4 = 33D49) and both plant densities (PD1 =
79,000; and PD2 = 104,000 pl ha-1), when averaged across all 4 n rates in 2012

87
Figure 2.21 - Mean separation test for SIE (Sulfur Internal Efficiency) for the factorial Hybrid x PD, for all four hybrids (Hybrid 1 =
AQUAmaxTM P1151, Hybrid 2 = P1162, Hybrid 3 =AQUAmaxTM P1498, Hybrid 4 = 33D49), and each plant density level (PD1
= 79,000; and PD2 = 104,000 pl ha-1), when averaged in all 4 N rates in 2012

88
Figure 2.22 - Mean separation test for Ratio N/P in relation to the factorial Hybrid x PD, for each hybrid (Hybrid 1 = AQUAmaxTM P1151,
Hybrid 2 = P1162, Hybrid 3 =AQUAmaxTM P1498, Hybrid 4 = 33D49) averaged across both plant densities (PD1 = 79,000; and
PD2 = 104,000 pl ha-1), when averaged across all 4 N rates in 2012

89
Figure 2.23 - Mean separation test for Ratio N/P in relation to the factorial Hybrid x N rate, for each hybrid (Hybrid 1 = AQUAmaxTM P1151,
Hybrid 2 = P1162, Hybrid 3 =AQUAmaxTM P1498, Hybrid 4 = 33D49) and four N rate levels (Nr1 = 0, Nr2 = 134, Nr3 = 202, and
Nr4 = 269 kg N sidedress ha-1) when averaged across both plant densities in 2012

90
Figure 2.24 - Ratio N/P for the factorial Hybrid x PD x N rate at physiological maturity for all four hybrids (Hybrid 1 = AQUAmaxTM P1151,
Hybrid 2 = P1162, Hybrid 3 =AQUAmaxTM P1498, Hybrid 4 = 33D49), each plant density level (PD1 = 79,000; and PD2 =
104,000 pl ha-1), and all four N rate levels (Nr1 = 0, Nr2 = 134, Nr3 = 202, and Nr4 = 269 kg N sidedress ha-1), for 2012

91
Figure 2.25 - Mean separation test for Ratio N/P for the factorial Hybrid x PD, for all four hybrids (Hybrid 1 = AQUAmaxTM P1151, Hybrid 2 =
P1162, Hybrid 3 =AQUAmaxTM P1498, Hybrid 4 = 33D49), and each plant density level (PD1 = 79,000; and PD2 = 104,000 pl ha-
1), when averaged across all N rates in 2012

92
Figure 2.26 - Mean separation test for Ratio N/K for the factorial Hybrid x N rate, for all four hybrids (Hybrid 1 = AQUAmaxTM P1151, Hybrid
2 = P1162, Hybrid 3 =AQUAmaxTM P1498, Hybrid 4 = 33D49), and all four N rate levels (Nr1 = 0, Nr2 = 134, Nr3 = 202, and Nr4
= 269 kg N sidedress ha-1), when averaged across both plant density levels in 2012

93
Figure 2.27 - Total plant nutrient uptake for Nitrogen (A), Phosphorus (B), Potassium (C), and Sulfur (D) relative to the total plant biomass at
physiological maturity for all four hybrids (Hybrid 1 = AQUAmaxTM P1151, Hybrid 2 = P1162, Hybrid 3 =AQUAmaxTM P1498,
Hybrid 4 = 33D49), each plant density level (PD1 = 79,000; and PD2 = 104,000 pl ha-1), and all four N rate levels (Nr1 = 0, Nr2 =
134, Nr3 = 202, and Nr4 = 269 kg N sidedress ha-1) in 2012

94
Figure 2.28 - Total plant nutrient uptake for Nitrogen (A), Phosphorus (B), Potassium (C), and Sulfur (D) relative to the total plant biomass at
physiological maturity for all four hybrids (Hybrid 1 = AQUAmaxTM P1151, Hybrid 2 = P1162, Hybrid 3 =AQUAmaxTM P1498,
Hybrid 4 = 33D49), each plant density level (PD1 = 78,000; and PD2 = 99,000 pl ha-1), and all four N rate levels (Nr1 = 0, Nr2 =
134, Nr3 = 202, and Nr4 = 269 kg N sidedress ha-1) in 2013

95
Figure 2.29 - Mean separation test for grain yield for the factorial Hybrid x PD, for all four hybrids (Hybrid 1 = AQUAmaxTM P1151, Hybrid 2 =
P1162, Hybrid 3 =AQUAmaxTM P1498, Hybrid 4 = 33D49), and each plant density level (PD1 = 79,000; and PD2 = 104,000 pl ha-
1), when averaged across all 4 N rates in 2012

96
Figure 2.30 - Mean separation test for PHI (phosphorus harvest index), in A and B, for the
factorial Hybrid x N rate, for all four hybrids (Hybrid 1 = AQUAmaxTM P1151,
Hybrid 2 = P1162, Hybrid 3 =AQUAmaxTM P1498, Hybrid 4 = 33D49), and all
four N rate levels (Nr1 = 0, Nr2 = 134, Nr3 = 202, and Nr4 = 269 kg N
sidedress ha-1), when averaged across both plant density in 2012
References
ABENDROTH, L.J.; ELMORE R.W.; BOYER M.J., MARLAY, S.K. Corn growth and
development. Ames: Iowa State University Extension, 2011. 50 p. PMR 1009.
AGRIANUAL. Anuário da agricultura brasileira. São Paulo: FNP, 2009. p. 371-376.

97
AKINTOYE, H.A.; KLING, J.G.; LUCAS, E.O. N-use efficiency of single, double and
synthetic maize lines grown at four N levels in three ecological zones of West Africa. Field
Crops Research Amsterdam, v. 60, n. 3, p. 189-199, 1999.
ALMEIDA, M.L.; SANGOI, L. Aumento da densidade de plantas de milho para regiões de
curta estação estival de crescimento. Pesquisa Agropecuária Gaúcha, Porto Alegre, v. 2,
n. 2, p. 179-183, 1996.
ALVES, A.C.; OLIVEIRA, P.P.A.; HERLING, V.R.; TRIVELIN P.C.O.; CERQUEIRA-
LUZ, P.H.; ALVES, T.C.; ROCHETTI, R.C.; BARIONI JÚNIOR, W. New methods to
quantify NH3 volatilization from fertilized surface soil with urea. Revista Brasileira de
Ciência do Solo, Viçosa, v. 35, n. 1, p. 133-140, 2011.
AMADO, T.J.C.; MIELNICZUK, J.; AITA, C. Recomendação de adubação nitrogenada para
o milho no RS e SC adaptada ao uso de culturas de cobertura do solo, sob sistema plantio
direto. Revista Brasileira de Ciência do Solo, Viçosa, v. 26, p. 241-248, 2002.
ANDRADE, F.H. Analysis of growth and yield of maize, sunflower and soybean grown at
Balcarce, Argentina. Field Crops Research, Amsterdam, v. 41, n. 1, p. 1-12, 1995.
ANDRADE, F.H.; VEGA, C.; UHART, S.O. Kernel number determination in maize. Crop
Science, Madison, v. 39, n. 2, p. 453-459, 1999.
ANGHINONI, I.; VOLKART, K.; FATTORE, C.; ERNANI, P.R. Morfologia de raízes e
cinética da absorção de nutrientes em diversas espécies e genótipos de plantas. Revista
Brasileira de Ciência do Solo, Viçosa, v. 13, n. 1, p. 355-361,1989.
APHALO, P.J.; BALLAR, C.L.; SCOPEL, A.L. Plant-plant signaling, the shade-avoidance
response and competition. Journal of Experimental Botany, Oxford, v. 50, p. 1629-1634,
1999.
ARGENTA, G.S.; SILVA, P.R.F.; BORTOLINI, C.G.; FORSTHOFER, E.L.;
MANJABOSCO, E.A.; BEHEREGARAY NETO, V. Resposta de híbridos simples à redução
do espaçamento entre linhas. Pesquisa Agropecuária Brasileira, Brasília, v. 36, n. 1, p. 71-
78, 2001.
ARGENTA, G.; SILVA, P.R.F.; BORTOLINI, C.G.; FORSTHOFER, E.L.; STRIEDER,
M.L.; STEFANI, G.F. Relação entre teor de clorofila extraível e leitura do clorofilômetro na
folha de milho. In: CONGRESSO NACIONAL DE MILHO E SORGO, 23., 2000,
Uberlândia. Resumos... Uberlândia: ABMS, 2000. p. 197.
BALIGAR, V.C.; BARBER, S.A. Genotypic differences of corn for ion uptake. Agronomy
Journal, Madison, v. 71, n. 5, p. 870-873, 1979.
BÄNZINGER, M.; EDMEADES, G.O.; BECK, D.; BELLON, M.R. Breeding for drought
and nitrogen stress tolerance in maize: from theory to practice. Mexico: CIMMYT, 2000.
68 p.
BATES, T.R.; LYNCH, J.P. Stimulation of root hair elongation in Arabidopsis thaliana by
low phosphorus availability. Plant Cell Environ, Chichester, v. 19, p. 529–538, 1996.

98
BECKER, J.; BEAN, B.; XUE, Q.; MAREK, T. Pioneer Optimum AquaMaxTM first
generation drought tolerant corn trial: progress report. Texas A&M Agrilife Research,
2012. Disponível em: <http:// http://amarillo.tamu.edu/files/2010/11/2011-AQUAmax-
trial.pdf>. Acesso em: 23 jan. 2015.
BELOW, F.E.; CHRISTENSEN, L.E.; REED, A.J.; HAGEMAN, R.H. Availability of
reduced N and carbohydrates for ear development of maize. Plant Physiology, Lancaster,
v. 68, n. 5, p. 1186-1190, 1981.
BERNARDI, A.C.C.; MACHADO, P.L.O.A.; FREITAS, P.L.; COELHO, M.R.; LEANDRO,
W.M.; OLIVEIRA JÚNIOR, J.P.; OLIVEIRA, R. P.; SANTOS, H.G.; MADARI, B.E.;
CARVALHO, M.C.S. Correção do solo e adubação no sistema de plantio direto nos
cerrados. Rio de Janeiro: Embrapa Solos, 2003. 22 p.
BOOMSMA, C.R.; VYN, T.J. Maize drought tolerance: Potential improvements through
arbuscular mycorrhizal symbiosis? Field Crops Research, Amsterdam, v. 108, n. 1, p. 14-31,
2008.
BORCH, K.; BOUMA, T.J.; LYNCH, J.P.; BROWN, K.M. Ethylene: a regulator of root
architectural responses to soil phosphorus availability. Plant Cell Environ, Chichester, v. 22,
p. 425–431, 1999.
BORRÁS, L.; WESTGATE, M.E. Predicting maize kernel sink capacity early in
development. Field Crops Research, Amsterdam, v. 95, p. 223-233, 2006.
BRASIL. Ministério da Agricultura, Pecuária e Abastecimento. Cadeia produtiva do milho.
Brasília: IICA/MAPA/SPA, 2007. 108 p.
______. Milho. Disponível em: <http://www.agricultura.gov.br/vegetal/culturas/milho>.
Acesso em: 06 ago. 2014.
BURZACO, J.P.; CIAMPITTI, I.A.; VYN, T.L. Nitrapyrin impacts on maize yield and
nitrogen use efficiency with spring-applied nitrogen: field studies vs. meta-analysis
comparison. Agronomy Journal, Madison, v. 106, n. 2, p. 753-760. 2014.
ÇAKIR, R. Effect of water stress at different development stages on vegetative and
reproductive growth of corn. Field Crops Research, Amsterdam, v. 89, n. 1, p. 1-6, 2004.
CANTARELLA, H. Calagem e adubação do milho. In: BÜLL, L.T.; CANTARELLA, H.
(Ed.). Cultura do milho: fatores que afetam a produtividade. Piracicaba: POTAFOS, 1993.
p. 148-196.
CARVALHO, M.A.C.; SORATTO, R.P.; ATHAYDE, M.L.F.; SÁ, M.E. Produtividade do
milho em sucessão a adubos verdes no sistema de plantio direto e convencional. Pesquisa
Agropecuária Brasileira, Brasília, v. 39, p. 47-53, 2004.
CASSMAN, K.G.; DOBERMANN, A.; WALTERS, D.T.; YANG, H. Meeting cereal
demand while protecting natural resources and improving environmental quality. Annual
Review of Environment and Resources, Palo Alto, v. 28, n. 1, p. 315-358, 2004.

99
CHAPUIS, R.; DELLUC, C.; DEBEUF, R.; TARDIEU, F.; WELCKER, C. 2012.
Resiliencies to water deficit in a phenotyping platform and in the field: How related are they
in maize? European Journal of Agronomy, Amsterdam, v. 42, p. 59–67, 2012.
CHENG, P.C.; PAREDY, D.R. Morphology and development of the tassel and ear. In:
FREELING, M.; WALBOT, V. (Ed.). The maize handbook. New York: Springler-Verlag,
1994. chap. 3, p. 37-47.
CIAMPITTI, I.A.; VYN, T.J. A comprehensive study of plant density consequences on
nitrogen uptake dynamics of maize plants from vegetative to reproductive stages. Field Crops
Research, Amsterdam, v. 121, n. 1, p. 2-18, 2011.
______. Physiological perspectives of changes over time in maize yield dependency on
nitrogen uptake and associated nitrogen efficiencies: a review. Crop Science, Madison,
v. 133, n. 11, p. 366-377, 2012.
______. Grain nitrogen source changes over time in maize: a review. Crop Science, Madison,
v. 53, p. 336-377, 2013.
CIAMPITTI, I.A., CAMBERATO, J.; MURRELL, S.T.; VYN, T.J. Maize nutrient
accumulation and partitioning in response to plant density and nitrogen rate: I.
Macronutrients. Agronomy Journal, Madison, v. 05, n. 3, p. 1-13, 2013.
CIAMPITTI, I.A.; ZHANG, H.; FRIEDEMANN, P.; VYN, T.J. Potential physiological
frameworks for mid-season field phenotyping of final plant nitrogen uptake, nitrogen use
efficiency, and grain yield in maize. Crop Science, Madison, v. 52, p. 2728-2742, 2012.
CIRILO, A.G.; ANDRADE, F.H. Sowing date and kernel weight in maize. Crop Science,
Madison, v. 36, p. 325-331, 1996.
COELHO, A.M. Balanço de nitrogênio (15 N) na cultura do milho (Zea mays L.) em um
Latossolo Vermelho Escuro fase cerrado. 1987. 142 p. (Dissertação - Mestrado em Solos e
Nutrição de Plantas) – Escola Superior de Agricultura, Lavras, 1987.
______. Nutrição e adubação do milho. Sete Lagoas: Embrapa CNPMS, 2006. 10 p.
COELHO, A.M.; CRUZ, J.C.; PEREIRA FILHO, I.A. Rendimento do milho no Brasil:
chegamos ao máximo? Informações Agronômicas, Piracicaba, n. 101, 2003.
COOPER, M.; GHO, C.; LEAFGREN, R.; TANG, T.; MESSINA, C. Breeding drought-
tolerant maize hybrids for the US corn-belt: discovery to product. Journal of Experimental
Botany, Oxford, 2014. Disponível em: <doi:10.1093/jxb/eru064. 2014>. Acesso em 22 jan.
2015.
DOURADO NETO, D.; FANCELLI, A.L. Produção de milho. Guaíba: Agropecuária, 2000.
360 p.

100
DOURADO NETO, D.D.; PALHARES, M.; VIEIRA, P.A.; MANFRON, P.A.; MEDEIROS,
S.L.P.; ROMANO, M.R. Efeito da população de plantas e do espaçamento sobre a
produtividade de milho. Revista Brasileira de Milho e Sorgo, Sete Lagoas, v. 2, n. 3,
p. 63‑77, 2003.
DWYER, L.M.; TOLLENAAR, M.; HOUWING, L. A nondestructive method to monitor leaf
greenness in corn. Canadian Journal of Plant Science, Ottawa, v. 71, p. 505-509, 1991.
FAOSTAT. Food and agriculture commodities production. 2013. Disponível em:
<http://faostat.fao.org/>. Acesso em: 10 mar. 2014.
FISCHER, K.S.; PALMER, A.F.E. Tropical maize. In: GOLDSWORTHSY, P.R.; FISHER,
N.M. (Ed.). The physiology of tropical field crops. Chichester: John Wiley, 1984. p. 213-
248.
FRANCELLI, A.L.; DOURADO NETO, D. Produção de milho. 2. ed. Piracicaba:
Livroceres, 2004. 360 p.
IGUE, K. Dinâmica da matéria orgânica e seus efeitos nas propriedades do solo. In:
FUNDAÇÃO CARGILL. Adubação verde no brasil. Campinas, 1984. p. 232-267.
KINIRY, J.R.; RITCHIE, J.T. Shade-sensitive interval of kernel number of maize. Agronomy
Journal, Madison, v. 77, n. 5, p. 711-715, 1985.
LANDRY, J.; DELHAYE, S. The Tryptophan contents of wheat, maize and barley grains as a
function of nitrogen content. Journal of Cereal Science, London, v. 18, n. 3, p. 259-266,
1993.
LINDSEY, A.J.; THOMISON, P.R. Drought Tolerant Corn Hybrid Response to Nitrogen
Application Rate. In: ASA, CSSA, & SSSA International Annual Meeting, 158-2,
Proceedings… Long Beach: ASA, 2014.
LÓPEZ-BUCIO, J.; MARTÍNEZ, V. de la, O.; GUEVARA-GARCÍA, A.; HERRERA-
ESTRELLA, L. Enhanced phosphorus uptake in transgenic tobacco plants that overproduce
citrate. Nat Biotechnol, New York, v. 18, p 450–453, 2000.
MADDONNI, G.A.; OTEGUI, M.E. Intra-specific competition in maize: early establishment
of hierarchies among plants affects final kernel set. Field Crops Research, Amsterdam, v.
85, p. 1-13, 2004.
MONNEVEUX, P.; SANCHEZ, C.; BECK, D.; EDMEADES, G.O. Drought tolerance
improvement in tropical maize source populations: evidence of progress. Crop Science,
Madison, v. 46, n. 1, p.180-191, 2006.
MORADI, H.; AKBARI, G.A.; KHAVARI KHORASANI S.; RAMSHINI H.A. Evaluation
of drought tolerance in corn (Zea mays L.) new hybrids with using stress tolerance indices.
European Journal of Sustainable Development, Rome, v. 1, p. 543–560. 2012.
MUCHOW, R.C. Nitrogen utilization efficiency in corn and sorghum. Field Crops
Research, Amsterdam, v. 56, p. 209-216, 1998.

101
NILSON, E.T.; ORCUTT, D.M. Water limitation. In: ________. The physiology of plants
under stress. New York: Wiley, 1996.
OTEGUI, M.E.; ANDRADE, F.H.; SUERO, E.E. Growth, water use, and kernel abortion of
maize subjected to drought at silking. Field Crops Research, Amsterdam, v. 40, n. 2, p. 87-
94, 1995.
PANDA, R.K.; BEHERA, S.K.; KASHYAP, P.S. Effective management of irrigation water
for maize under stressed conditions. Agricultural Water Management, Amsterdam, v. 66,
n. 3, p. 181-203, 2004.
PANDEY, R.K.; MARANVILLE, J.W.; ADMOU, A. Deficit irrigation and nitrogen effects
on maize in a Sahelian environment. I. Grain yield and yield components. Agricultural
Water Management, Amsterdam, v. 46, n. 1, p. 1-13, 2000.
PEIXOTO, C.M. Resposta de genótipos de milho à densidade de plantas, em dois níveis
de manejo. 1996. 118 p. Dissertação (Mestrado em Fitotecnia) - Faculdade de Agronomia,
Universidade Federal do Rio Grande do Sul, Porto Alegre, 1996.
PEREIRA, R.G.; ALBUQUERQUE, A.W.; MADALENA, J.A.S. Influência dos sistemas de
manejo do solo sobre os componentes de produção do milho e Brachiaria decumbens.
Revista Caatinga, Mossoró, v. 22, n. 1, p. 64-71, 2009.
PEREIRA, R.S.B. Caracteres correlacionados com a produção e suas alterações no
melhoramento genético do milho (Zea mays L.). Pesquisa Agropecuária Brasileira, Porto
Alegre, v. 26, n. 5, p. 745-751, 1991.
PIEKIELEK, W.P.; FOX, R.H.; TOTH, J.D.; MACNEAL, K.E. Use of a chlorophyll meter at
the early dent stage of corn to evaluate N sufficiency. Agronomy Journal, Madison, v. 87, n.
3, p. 403-408, 1995.
PIONNER. Hibridos de milho: 30F35HR. Santa Cruz do Sul, 2014. Disponivel em:
<http://www.pioneersementes.com.br/DownloadCenter/Catalogo-De-Produtos-Milho-
Safrinha-2014.pdf>. Acesso em: 20 jan. 2015.
RIBEIRO, A.C.; GUIMARÃES, P.T.G.; ALVAREZ V., V.H. Recomendação para o uso de
corretivos e fertilizantes em Minas Gerais. Viçosa: SBCS, 1999. 359 p.
RITCHIE, S.W.; HANWAY, J.J.; BENSON, G.O. Como a planta de milho se desenvolve.
Informações Agronômicas, Piracicaba, n. 103, p. 1-11, 2003.
ROTH, J.A.; CIAMPITTI, I.A.; VYN, T.J. Physiological evaluations of recent drought
tolerant maize hybrids at varying stress levels. Agronomy Journal, Madison, v. 5, n. 4,
p. 1129-1141. 2013.
SABATA, R.J.; MASON, S.C. Corn hybrid interactions with soil nitrogen level and water
regime. Journal of Production Agriculture, Madison, v.5, n. 1, p.137-142, 1992.

102
SANGOI, L. An ideotype of maize for conditions of high temperature and low moisture.
350 p. Dissertation (Ph.D. in Agronomy) - Iowa State Universtiy, Ames, 1996.
______. Understanding plant density effects on maize growth and development: an important
issue to maximize grain yield. Ciência Rural, Santa Maria, v.31, n.1, p.159-168, 2001.
SANGOI, L.; SALVADOR, R.J. Maize susceptibility to drought at flowering: a new approach
to overcome the problem. Ciência Rural, Santa Maria, v. 28, n. 4, p. 699-706, 1998.
SANGOI, L., SILVA, P.R.F.; ARGENTA, G. Bases morfofisiológicas para maior tolerância
dos híbridos modernos de milho a altas densidades de plantas. Bragantia, Campinas, v. 61,
n. 2, p.101-110, 2002.
______. Estratégias de manejo do arranjo de plantas para aumentar o rendimento de
grãos de milho. Lages: Graphel, 2010. 64p.
SANGOI, L.; ERNANI, P.R.; LECH, V. A.; RAMPAZZO, C. Volatilização de N-NH3 em
decorrência da forma de aplicação de uréia, manejo de resíduos e tipo de solo, em laboratório.
Ciência Rural, Santa Maria, v. 33, n. 4, p. 687-692, 2003.
SANGOI, L.; SILVA, P.R.F.; ARGENTA, G.; HORN, D. Bases morfo-fisiológicas para
aumentar a tolerância de cultivares de milho a altas densidades de plantas. In: REUNIÃO
TÉCNICA CATARINENSE DE MILHO E FEIJÃO, 4., 2003, Lages. Resumos... Lages:
CAV-UDESC, 2003. p. 19-24.
SAS INSTITUTE. SAS/STAT 9.1 User’s Guide. Cary: SAS Institute, 2004. 824 p.
SCHENK, M.K.; BARBER, S.A. Phosphate uptake by corn as affected by soil characteristics
and root morphology. Soil Science Society of America Journal, Madison, v. 43, n. 4, p. 880-
883, 1979.
SOUZA, C.M. Efeito do uso contínuo de grade pesada sobre algumas características
físicas e químicas de um Latossolo Vermelho-Amarelo Distrófico, fase cerrado, e sobre o
desenvolvimento das plantas e absorção de nutrientes pela cultura de soja. 1988. 105 p.
Dissertação (Mestrado em Agronomia) - Universidade Federal de Viçosa, Viçosa, 1988.
STEWART, W.M.; DIBB, D.W.; JOHNSTON, A.E.; SMYTH, T.J. The contribution of
commercial fertilizer nutrients to food production. Agronomy Journal, Madison, v. 97, n. 1,
p. 1–6, 2005.
SWANK, J.C.; BELOW, F.E.; LAMBERT, RJ.; HAGEMAN, R.H. Interaction of carbon and
nitrogen metabolism in the productivity of maize. Plant Physiology, Lancaster, v. 70, n. 4,
p. 1185- 1190, 1982.
THOMAS, H.; HOWARTH, C.J. Five ways to stay green. Journal of Experimental Botany,
Oxford, v. 51, p. 329–337, 2000. Disponível em : <doi:10.1093/jexbot/51.suppl_1.329>.
Acesso em: 22 jan. 2015.
THOMAS, H.; SMART, C.M. Crops that stay green. Annals of Applied Biology, Chichester,
v. 123, n. 1, p. 93–219, 1993.

103
TOKATLIDIS, I.S.; KOUTROUBAS, S.D. A review of maize hybrids’ dependence on high
plant populations and its implications for crop yield stability. Field Crops Research,
Amsterdam, v. 88, n. 2/3, p. 103–114, 2004.
TOLLENAAR, M. Sink-source relationships during reproductive development in maize: a
review. Maydica, Bergamo, v. 22, p. 49-75, 1977.
TOLLENAAR, M.; LEE, E.A. Strategies for enhancing grain yield in maize. In: JANICK, J.
(Ed.). Plant breeding reviews. Hoboken: John Wiley, 2010. v. 4, p. 37-82.
TOLLENAAR, M.; WU, J. Yield improvement in temperate maize is attributable to greater
stress tolerance. Crop Science, Madison, v. 39, n. 6, p. 1597–1604, 1999.
TRAORE, S.B., CARLSON, R.E., PILCHER, C.D., RICE, M.E. Bt and Non-Bt maize
growth and development as affected by temperature and drought stress. Agronomy Journal,
Madison, v. 92, n. 5, p. 1027–1035, 2000.
TROYER A.F.; ROSENBROOK, R.W. Utility of higher plant densities for corn performance
testing. Crop Science, Madison, v. 23, n. 5, p. 863-867, 1983.
UHART, S.A.; ANDRADE, F.H. Nitrogen deficiency in maize: I. Effects on crop growth,
development, dry matter partitioning, and kernel set. Crop Science, Madison, v. 35, n. 5,
p. 1376-1383, 1995.
YAN W.; WALLACE D.H. Breeding for negatively associated traits. In: JANICK, J. (Ed.).
Plant breeding reviews. Hoboken: John Wiley, 1995. v. 13, p. 141-177.

104
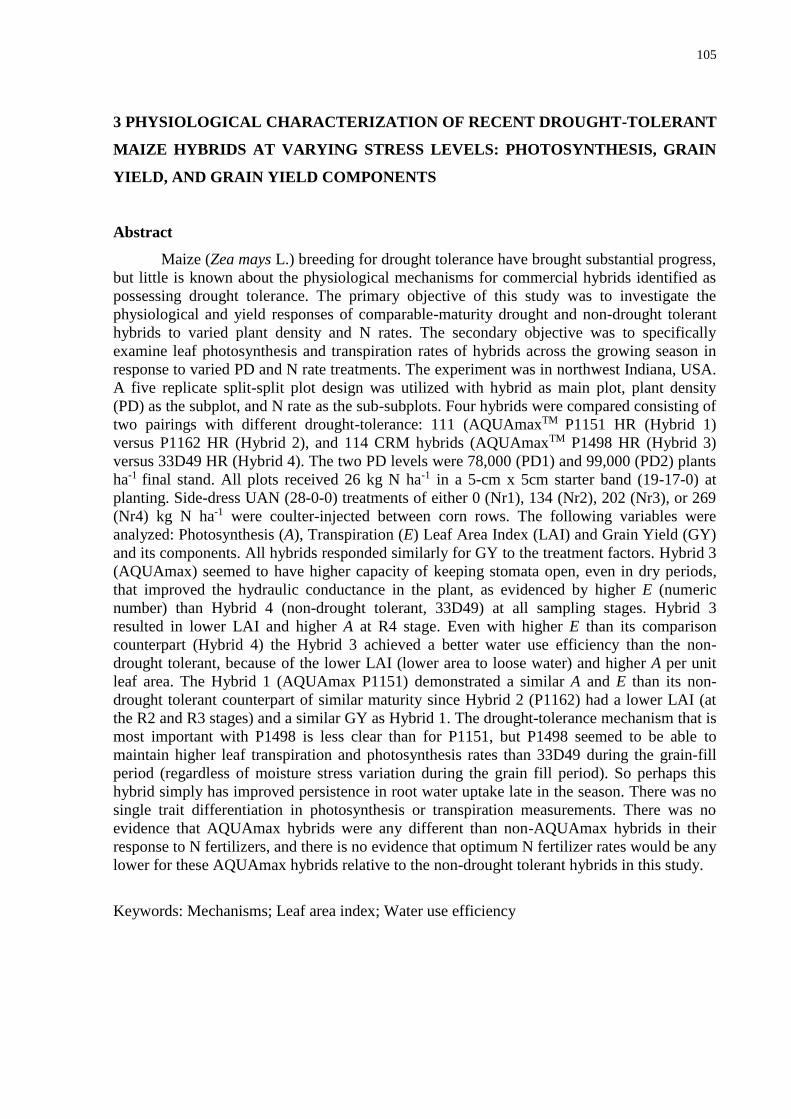
105
3 PHYSIOLOGICAL CHARACTERIZATION OF RECENT DROUGHT-TOLERANT
MAIZE HYBRIDS AT VARYING STRESS LEVELS: PHOTOSYNTHESIS, GRAIN
YIELD, AND GRAIN YIELD COMPONENTS
Abstract
Maize (Zea mays L.) breeding for drought tolerance have brought substantial progress,
but little is known about the physiological mechanisms for commercial hybrids identified as
possessing drought tolerance. The primary objective of this study was to investigate the
physiological and yield responses of comparable-maturity drought and non-drought tolerant
hybrids to varied plant density and N rates. The secondary objective was to specifically
examine leaf photosynthesis and transpiration rates of hybrids across the growing season in
response to varied PD and N rate treatments. The experiment was in northwest Indiana, USA.
A five replicate split-split plot design was utilized with hybrid as main plot, plant density
(PD) as the subplot, and N rate as the sub-subplots. Four hybrids were compared consisting of
two pairings with different drought-tolerance: 111 (AQUAmaxTM P1151 HR (Hybrid 1)
versus P1162 HR (Hybrid 2), and 114 CRM hybrids (AQUAmaxTM P1498 HR (Hybrid 3)
versus 33D49 HR (Hybrid 4). The two PD levels were 78,000 (PD1) and 99,000 (PD2) plants
ha-1 final stand. All plots received 26 kg N ha-1 in a 5-cm x 5cm starter band (19-17-0) at
planting. Side-dress UAN (28-0-0) treatments of either 0 (Nr1), 134 (Nr2), 202 (Nr3), or 269
(Nr4) kg N ha-1 were coulter-injected between corn rows. The following variables were
analyzed: Photosynthesis (A), Transpiration (E) Leaf Area Index (LAI) and Grain Yield (GY)
and its components. All hybrids responded similarly for GY to the treatment factors. Hybrid 3
(AQUAmax) seemed to have higher capacity of keeping stomata open, even in dry periods,
that improved the hydraulic conductance in the plant, as evidenced by higher E (numeric
number) than Hybrid 4 (non-drought tolerant, 33D49) at all sampling stages. Hybrid 3
resulted in lower LAI and higher A at R4 stage. Even with higher E than its comparison
counterpart (Hybrid 4) the Hybrid 3 achieved a better water use efficiency than the non-
drought tolerant, because of the lower LAI (lower area to loose water) and higher A per unit
leaf area. The Hybrid 1 (AQUAmax P1151) demonstrated a similar A and E than its non-
drought tolerant counterpart of similar maturity since Hybrid 2 (P1162) had a lower LAI (at
the R2 and R3 stages) and a similar GY as Hybrid 1. The drought-tolerance mechanism that is
most important with P1498 is less clear than for P1151, but P1498 seemed to be able to
maintain higher leaf transpiration and photosynthesis rates than 33D49 during the grain-fill
period (regardless of moisture stress variation during the grain fill period). So perhaps this
hybrid simply has improved persistence in root water uptake late in the season. There was no
single trait differentiation in photosynthesis or transpiration measurements. There was no
evidence that AQUAmax hybrids were any different than non-AQUAmax hybrids in their
response to N fertilizers, and there is no evidence that optimum N fertilizer rates would be any
lower for these AQUAmax hybrids relative to the non-drought tolerant hybrids in this study.
Keywords: Mechanisms; Leaf area index; Water use efficiency

106
3.1 Introduction
Maize (Zea mays L.) is one of major cereals grown throughout the world, providing
widely used products for food, feed and raw material for industry, mainly due to the amount
and the nature of energy reserves accumulated in grains (WEILAND, 2006). This crop
belongs to the group with C4 type photosynthesis metabolism type, which is characterized by
high productive potential. Among the C4 plants, maize is in the group of species with greater
use efficiency for solar radiation or quantum efficiency, mostly because of its leaf architecture
(HATTERSLEY, 1984). However, despite the C4 advantage, maize is strongly negatively
affected by the environmental stress such as those caused by drought and nutrient
deficiencies.
The stress caused by low water availability (drought) is a major problem to
agriculture, and the ability of plants to survive such stress is of paramount importance to the
development of agribusiness in any country (SHAO et al., 2008). Drought stress is triggered
by climatic, edaphic and agronomic factors. For example, drought stress can be exacerbated
by high plant densities. The plant’s susceptibility to drought stress varies in dependence on
the degree of stress, different accompanying stress factors, plant species, and their
developmental stages (DEMIREVSKA et al., 2009). Drought stress affects almost all aspects
related to the crop development; it reduces the photosynthesis and chlorophyll per unit leaf
area, but also reduces leaf area, wilting and curling of the leaves, and stomatal closure, and
affects other factors such flowering, nutrient uptake and partitioning (HSIAO, 1973;
SANCHEZ et al., 1983; BERGAMASCHI et al, 2006; JALEEL et al., 2009; XIA, 2012).
Even in climatically favorable years, if the water deficit occurs in critical period,
which is about 1 week prior to and 2 weeks post silking, there may be reduction in the yield of
maize (BÄNZIGER et al., 2000; BERGAMASCHI et al., 2004; TOLLENAAR; LEE, 2011).
This critical period in maize unfortunately corresponds to the period between late June and
late July in the Eastern Corn Belt when periodic drought is most likely to occur. Studies about
drought tolerance in maize crop can bring improvements in growth and crop yield in regions
with water limitations (LI; SPERRY; SHAO, 2009). The selection of cultivars with some
tolerance or resistance to water stress is considered a cost-effective strategy of adaptation
management in areas susceptible to drought (TURNER, 1991).
Substantial progresses in studies about maize breeding for drought tolerance have
brought satisfactory results, generating several tolerant genotypes (CAMPOS et al., 2006;
MONNEVEUX et al., 2006; HAMMER et al., 2009; COOPER et al., 2014). Gains in yield
8.9 and 1.9% under drought and non-drought conditions, respectively, for the non-transgenic

107
drought-tolerant vs. conventional hybrids were claimed by a privately owned seed company
(PIONEER, 2013). However, little is known about the physiological mechanisms for drought
tolerance (BANZIGER et al., 2002). Accordingly, there are very few public research
publications focused in physiology that have investigated the recently released drought-
tolerant hybrids (ROTH; CIAMPITTI; VYN, 2013). Plant tolerance to any individual stress
also needs to be demonstrated in the context of associated stress factors. Thus, for example,
tolerance to plant density stress in maize is very much related to the timing and intensity of
water and nutrient stresses. High plant densities are much more likely to result in lower yields
at below-optimum N rates (BOOMSMA et al., 2009; CIAMPITTI et al., 2013).
The primary objective of this study was to investigate the physiological and yield
responses of comparable-maturity drought and non-drought tolerant hybrids (P1151 vs.
P1162, and P1498 vs. 33D49) to varied plant density and N rates. The secondary objective
was to specifically examine leaf photosynthesis (A) and transpiration (E) rates of hybrids
across the growing season in response to varied PD and N rate treatments. The questions we
want to answer with this study are: Are the drought-tolerant hybrids different from their
comparable-maturity hybrid counterparts (without drought tolerance)? Which physiological
mechanisms do the drought-tolerant hybrids have to be more efficient in water use?
3.2 Materials and Methods
3.2.1 Location and Experimental Design
The experiment was conducted over one growing season (2013) in northwest Indiana
at the Pinney Purdue Agricultural Center (PPAC) (41° 26' 49" N, 86° 55' 42" W). The non-
irrigated field experiment was established on the Tracy sandy loam (coarse-loamy, mixed
mesic Ultic Hapludalfs). The preceding crop was soybean [Glycine max (L.) Merr.], and the
tillage system employed was fall chisel plow and spring secondary tillage. The experiment
was planted on May 1st.
A five replicate split-split plot design was utilized with hybrid as main plot, plant
density (PD) as the subplot, and N rate as the sub-subplots. Four hybrids were compared
consisting of two pairings with different drought-tolerance: 111 CRM hybrids (AQUAmaxTM
P1151 HR (Hybrid 1) versus P1162 HR (Hybrid 2), and 114 CRM hybrids (AQUAmaxTM
P1498 HR (Hybrid 3) versus 33D49 HR (Hybrid 4). Drought tolerance scores, as determined
by DuPont Pioneer on a nine point scale (1 = low, 9 = high), for P1151 and P1498 were both
9, and for the hybrids less drought-tolerant, P1162 and 33D49, were 8 and 7, respectively.

108
Although the seeding rates were 79,000 and 104,000 plants ha-1, the two actual PD levels
were 78,000 (PD1) and 99,000 (PD2) plants ha-1 final stand.
All plots received 26 kg N ha-1 in a 5-cm x 5cm starter band (19-17-0) at planting.
Side-dress urea ammonium nitrate, UAN, (28-0-0) treatments of either 0 (Nr1), 134 (Nr2),
202 (Nr3), or 269 (Nr4) kg N ha-1 were coulter-injected between corn rows around the V5
growth stage (ABENDROTH et al., 2011). Intensive measurements were performed in three
replicates whose individual plots measured 4.6 meters wide (six 76.2 cm rows) by 27 meters
long (18 m long for the remaining two replicates). Soil was sampled from the 0 to 30cm layer,
collecting 20 cores (2-cm diameter) from non-fertilized plots, before and after the side-dress
N application. Soil samples for the standard soil-test fertility data were randomly collected by
coring to the 20-cm depth in each replication; these samples were then analyzed by A&L
Great Lakes Laboratories (Table 3.1). Soil cores for soil mineral N status were only taken
from the 0N plots, again for each replication, close to the date of side-dress N application to a
30-cm depth. Data about weather conditions were recorded in both seasons (Figure 3.2).
Table 3.1 - Soil analysis for non-fertilized plots (inorganic nitrogen [NO3- - N / NH4
+ - N],
organic matter content [OM], soil pH, potassium content [K], and phosphorus,
Bray – P1 [P]) in 2013 season. At PPAC, Wanatah, IN, United States
Soil parameters 2013 season
NO3-/NH4
+ - N, mg kg-1 11.9 (3.10)/3.1 (0.54)
OM content, g kg-1 17.1 (0.33)
pH units 6.59
P, mg P kg-1 48.5 (11.13)
K, mg K kg-1 134.6 (25.19)
The value within parenthesis refers to standard deviation
3.2.2 Photosynthesis (A) and Transpiration (E) at the Leaf Level
A Li-Cor 6400XT – IRGA, Infra-Red Gas Analyzer (LI-COR, Lincoln, NE) was used
to determine rates of photosynthesis (A, CO2 exchange rate) and transpiration (E), leaf
temperature, and vapor pressure deficit (VPD); all parameters determined at the leaf-scale.
Measurements were taken at V10, V12, R2, R3, and R4 growth stages. Measurements were
performed in the center two rows on all hybrids and PDs but only at two N rates (Nr1 vs.
Nr3), in three replications for V10, V12, and R4 and only in two replications for R2 and R3.
Two plants were measured per plot and two measurements were taken at the midpoint on each
leaf (opposite the mid-rib).
109
During the vegetative phase the youngest collared leaf was selected, while the ear leaf
was used during the reproductive period. An isolation technique was performed [XIA (2012),
modified from Dwyer et al. (1995) and EARL and Tollenaar (1999)]. Representative plants
were selected for measurements and all neighboring plants within 0.50-0.75 m were removed
to eliminate shading. Plants were allowed to acclimate to the full sunlight for 1 hour prior to
measurements with measurements occurring approximately between 11 a.m. and 3 p.m. Each
replication required approximately 2.5 hours to complete all measurements.
In order to minimize environmental influence, measurements were taken on cloudless
days and artificial light was used. Settings for the Li-Cor 6400XT were: i) photosynthetic
photon flux density (PPFD) set at 2000 μmol photons m-2 s-1; ii) sample chamber CO2 held
constant by the CO2 mixer at 400 μmol CO2 mol-1 air; and iii) flow set at 400 μmol air s-1.
3.2.3 Leaf Area Index (LAI)
Leaf area index (LAI) was estimated by using the Li-Cor 2200 Plant Canopy Analyzer
(LI-COR, Lincoln, NE). Three measurements were taken at ground level in the center rows,
one at the ¼ row position, one at the ½ row position, and one at the ¾ row position. Individual
plot LAI values were means of these three measurements. The measurements were taken at
V10, V12, R2, R3, and R4 development stages.
3.2.4 Flowering Development
The information gathered on 20 plants/plot at flowering included anther suspension
and silk extrusion. Plots were monitored each day at the beginning of the tassel period (prior
to silk extrusion for hybrids evaluated) and observations continued until all plants completed
silking. Plants were counted as being at anthesis when at least 10 anthers were suspended
from the tassel, and at silking when silks extruded at least 1 cm from the ear. A 10-90%
anthesis (or silking) duration was calculated by subtracting the dates at which 2 plants (10%)
had reached anthesis (or silking) from the date at which 18 plants (90%) had reached anthesis
(or silking). The anthesis-silking interval (ASI) was calculated by subtracting the date at
which 10 plants (50%) reached silking from the date at which 10 plants (50%) reached
anthesis, sinse ASI is usually a positive number.
3.2.5 Grain Yield and Yield Components
A methodology identical to the one used by Roth et al. (2013) was followed. At
maturity, GY and its components were determined in both seasons. Actual kernel number

110
(KN) per plant and kernel weight (KW) (adjusted to 155 g kg-1) were determined from ears of
the consecutive 20 plants ears from the center rows at R6 in three replications of each
treatment. GY (also adjusted to 155 g kg-1) were measured after harvesting the central two
rows with a Kincaid XP plot combine.
3.2.6 Statistical Analyses
For statistical analyses, the hybrid treatment was treated as a fixed variable. The analysis
of variance (ANOVA) was executed using SAS PROC MIXED (SAS INSTITUTE, 2004) and
differences among treatment means were also analyzed. For photosynthetic parameters, the VPD
factor was analyzed aiming to see if this is an influential and significant covariable.
3.3 Results and Discussion
3.3.1 Growing Season and Phenology
The weather conditions during the whole growth season can be seen in at Figure 3.2.
The growing season experienced near normal temperatures and precipitation relative to
historical trends at this location that can be reviewed at Ciampitti and Vyn (2011). Of most
pertinence to this study was that there was little moisture stress during the critical period
bracketing silking.
3.3.1.1 Anthesis-Silking Interval (ASI)
Because of generally favorable rain in early July (until July 11th), all four hybrids had
good pollination conditions as well as a low anthesis to silking interval (Figure 3.1). The ASI
(based on time from 50% pollen shed to 50% silk emergence) was as short as zero for Hybrid
2 (P1162), and was never more than 2 days for Hybrid 4 (P33D49). As anticipated from the
comparison of 111 CRM versus 114 CRM hybrid pairs, hybrids P1151 and P1162 had early
flowering in relation to P1498 and 33D49. Is important to comment that the Hybrid P1498
achieved a shorter ASI than Hybrid 33D49. The ASI trait is widely recognized as an
important indicator of the sensitivity tolerance of maize to water deficits that coincide with
the flowering period. Under water deficit at flowering, a shorter ASI indicates better potential
to avoid or tolerate the effects of water deficits and a higher ASI values indicates greater
sensitivity and intolerance to the effects of water deficit (COOPER et al., 2014).
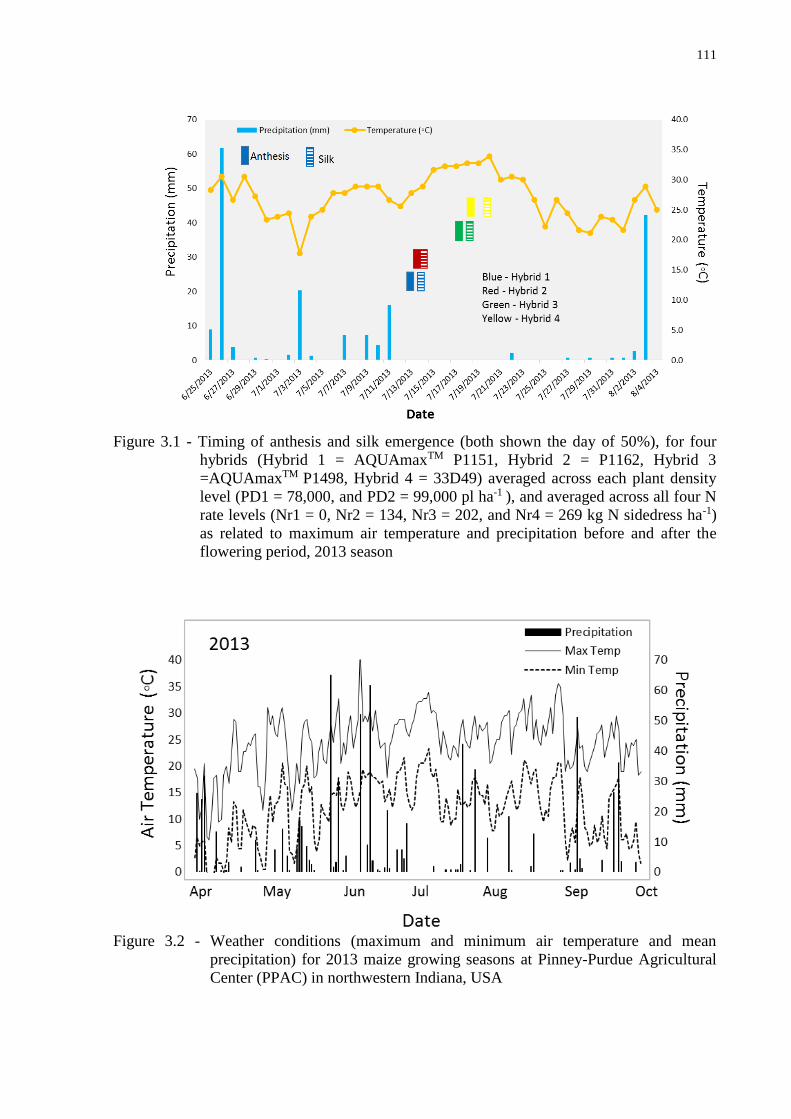
111
Figure 3.1 - Timing of anthesis and silk emergence (both shown the day of 50%), for four
hybrids (Hybrid 1 = AQUAmaxTM P1151, Hybrid 2 = P1162, Hybrid 3
=AQUAmaxTM P1498, Hybrid 4 = 33D49) averaged across each plant density
level (PD1 = 78,000, and PD2 = 99,000 pl ha-1 ), and averaged across all four N
rate levels (Nr1 = 0, Nr2 = 134, Nr3 = 202, and Nr4 = 269 kg N sidedress ha-1)
as related to maximum air temperature and precipitation before and after the
flowering period, 2013 season
Figure 3.2 - Weather conditions (maximum and minimum air temperature and mean
precipitation) for 2013 maize growing seasons at Pinney-Purdue Agricultural
Center (PPAC) in northwestern Indiana, USA

112
3.3.2 Leaf area index
The effects of hybrid, plant density, nitrogen rates, stage of development, and the
Hybrid x Stage interaction all resulted in significant differences for LAI (Table 3.2; Figure
3.3). The Hybrid 2 (P1162) had higher mean LAI than all other hybrids when averaged over
the 5 measurement dates as well as for the R2 growth stage itself. Hybrid 1 (P1151) had lower
LAI than its similar-maturity counterpart (P1162) all season. Hybrid 3 (1498) had fairly
similar LAI to its similar-maturity counterpart Hybrid 4 (33D49) except at the R3 stage,
especially at the higher plant density, when P1498 had higher LAI than 33D49. This short-
term advantage for P1498 did not persist through the end of grain filling since P1498 had the
lowest LAI value of all hybrids at the R4 stage. Also a significant factorial between PD x Nr
at V12 stage was observed Figure 3.8); the treatments with sidedress N (at all rates of 134 kg
N ha-1 or above) caused higher LAI in PD2 than in PD1, while in the zero N treatment there
was no difference for LAI between the plant densities. After analyzing the N rates in the plant
densities, there was only difference between N fertilized versus the non-fertilized treatments
(Nr1< Nr2=3=4) in both PD treatments. Hybrids achieved higher LAI values for PD2 at R2
and R3 stages with a decrease of LAI at the R4. These interaction relationships are presented
for Hybrid x PD (Figure 3.6) and for Hybrid x Nr (Figure 3.7), the latter without a mean
separation test.
In general, earlier maturing (lower CRM) hybrids, with lower demand in thermal time
for flowering, had less leaf area per plant and less crop canopy shading, and therefore require
higher plant density compared to normal cycle hybrids to achieve their yield potential
(SANGOI, 2000). Abortion of ovules, kernels, and ears can occur from one week before to
two weeks after silking. Drought, shade, high density, and/or N deficiency stress during this
period accentuate these processes (UHART; ANDRADE, 1995).
3.3.3 Overall Photosynthesis (A) and Transpiration (E) Patterns
Photosynthetic (A - CO2 exchange rate) and transpiration (E) rates are presented in
Tables 1.3 and 1.4, respectively. The A at leaf and canopy scales declined progressively
during the growing season following the leaf senescence process (Figures 3.3 and 3.4).
Several studies have reported the same situation for the A declination during the growing
season in field-grown maize (KIM et al., 2006; LEAKEY et al., 2006; ECHARTE et al, 2008;
MARKELZ; STRELLNER; LEAKEY, 2011; XIA, 2012; ROTH et al., 2013). Significant
decreases in A (after V10) and in E (after V12) for all hybrids were observed. Roth et al
(2013), in a similar study, observed that both heat and drought stresses substantially reduced

113
A and E during the late vegetative-phase (V12, V15 and R1) that resulted in lower total plant
biomass (BM) at the same location in 2012.
In this study, the green LAI declined by 50% or more from R2 to R4 growth stages
(Table 3.2). The decrease of A and E per unit leaf area were a result more related to
progressively later development stages (leaf senescence) than to the temperature responses.
Newer hybrids maintain higher plant and grain biomass under N deficiency because their
photosynthetic capacity decreases more slowly after anthesis than in older hybrids (DING et
al., 2005).
Extending the duration of active photosynthesis can elevate the yield of crops and
delaying leaf senescence is one of the ways to accomplish this (SPANO et al., 2003). Ma and
Dwyer (1998) concluded that a maize hybrid with a long duration of active photosynthesis
produced 24% more dry matter and assimilated 20% more N than a quick-leaf-senescence
hybrid during grain filling stage. However, the photosynthesis in leaves, especially in leaves
of quick-leaf-senescence genotypes, begins to decrease during the later developmental stages,
which severely limits grain yield (TOLLENAAR; DAYNARD, 1978).
3.3.4 Growth Stage Evaluation: Photosynthesis (A) and Transpiration (E) per unit Leaf
Area
In analyzing the Figures 3.4, 3.5, 3.9 and 3.10 it is clear that Hybrid 1 (AQUAmax
P1151) has consistently lower Photosynthesis (A) and Transpiration (E) than its counterpart
(Hybrid 2, P1162); this trend was more evident from V12 to R3 stages. However at R4 most A
values had a tendency to be equalized. Nevertheless the Hybrid 3 (AQUAmax P1498) showed
an overall higher A and E than the Hybrid 4 (33D49). There was a stronger difference for both
A and E values in the PD1 than in the PD2 at the R2 stage (this stage happened after July
12th). In July a deficiency of precipitation after the 11th day was observed; consequently, there
was less water availability in the soil from this stage until the beginning of August. Even with
this water deficiency, from mid-July to early August, the Hybrid 3 exhibited a higher A and
numerically E than the Hybrid 4. Thus, Hybrid 3 could have a mechanism of keeping open
stomata even in the situation with lower water availability in the soil that could improve
hydraulic conductance in the plant. Stomatal response is considered to be related to the
hydraulic dynamics in the plant. High water vapor loss from guard cells and/or a shortage of
water supply to the epidermal cells, including the guard cells in particular, can result in
decreased turgor pressure and cause partial stomata closure (EAMUS et al., 2008).
Transpiration restriction by stomata at high vapor pressure deficit (VPD) appears to result

114
from limiting hydraulic conductance in the plant, which constrains the flow of water from
roots to transpiration sites in the leaf surface (SINCLAIR; ZWIENIECKI; HOLBROOK,
2008; SADOK; SINCLAIR, 2010).
Similar air temperatures during the photosynthesis measurement periods from V10 to
R2 were observed with a value close to 33 ºC; however at the R3 sampling date a decrease of
air temperature was observed (mean of 29.3ºC ) and at R4 there was once again a higher
mean air temperature averaging 34.2ºC (Table 3.3). These changes in the air temperature,
plus the resumption of precipitation just prior to R4, could explain the increase from R3 to R4
of the E after subsequent decreases from V12 to R3. However, numerically, the A of
AQUAmax hybrids did not strongly decrease as much as the non-AQUAmax hybrids did. The
values for A (micromol CO2 m-2s-1) in R3 and R4 were, respectively: Hybrid 1 (22.9 and
23.3) - Hybrid 2 (27.2 and 23.2) and Hybrid 3 (28.3 and 26.8) – Hybrid 4 (23.1 – 22.2), the A
of Hybrid 2 was the most negatively affected by the combination of the later development
stage with higher air temperature in the first pair of similar-maturity hybrids (P1151 and
P1162) when there was a decrease of almost 4 (micromol CO2 m-2s-1) in the A value.
However, even though Hybrid 3 (P1498) had a small decrease of A, the A value of this hybrid
still was very much higher than its pair of comparison with the non-AQUAmax Hybrid 4
(33D49) that also showed a decline in the A value from R3 to R4. Photosynthesis is usually
inhibited when leaf temperature exceeds about 38ºC (BERRY; BJÖRKMAN, 1980;
EDWARDS; WALKER, 1983). Decreased leaf photosynthesis at high temperatures is
principally due to reduced efficiency in photosystem II, rather than an increase in
maintenance dark respiration or a decrease in leaf area (PRANGE et al., 1990).
Therefore, the higher E during the dry period could be a water deficiency tolerance
mechanism caused by a more continuous open stomata pattern. As a result of this, high
photosynthesis rates were maintained longer for Hybrid 3. Nonetheless, statistically there was
only a difference for E in the V12 stage (Table 3.4), but the pairs of hybrids did not differ
between each other (Hybrid 1 = 2; Hybrid 3 = 4). Similar results for A in V10 was observed
(Hybrid 1 = 2; Hybrid 3 = 4), Table 1.3. Nevertheless in R4 stage the Hybrid 3 exhibited a
higher A value than Hybrid 4 (with a difference of the 5 micromol Co2 m-2s-1). The PD
treatment factor was not significant for A nor for E. While the N rate caused a significant
difference for both, the A and E were greater in the plots with N treatment (Nr3) in
comparison to without N application in sidedressing. There were no significant interactions
between Hybrid and PD nor for Hybrid x Nr in all sampling growth stages. Similar results
were observed by Roth et al. (2013) in a similar research across two seasons (2011 and 2012).

115
They observed minimal hybrid differences in A and E, and also for GY. In this study the N
rate also was the primary factor governing A and E responses during late drought periods. The
higher N rate had a positive impact on A and E under adequate moisture, but a minor negative
effect during drought conditions.
The lower LAI with Hybrid 3 at R4 stage, in comparison with Hybrid 4, in addition
with the maintenance of higher photosynthesis and transpiration rates could be traits that
confer drought stress tolerance. Because even with higher transpiration this hybrid had lower
leaf area to experience water loss. Additionally, the transpiration is a factor totally related to
the maintaining photosynthesis capacity. Both long- and short-term water deficit resources
lead to many physiological alterations. Long-term drought response includes altered root to
shoot ratio (BLUM; ARKIN, 1984), reduced leaf area; and short-term drought responses
include altered osmotic adjustment (TURNER et al., 1986).
3.3.5 Total Plant Biomass, and Grain Yield and Its Components
There were significant responses for both hybrid and N rate treatment factors for total
plant biomass (BM), but not for the PD factor. The BM responded progressively higher as N rates
increased. Hybrid 2 achieved the highest total plant biomass; there were no statistical total
biomass difference among other hybrids, but only between them and Hybrid 2 (Table 3.5).
Significant differences (P<0.05) in KN and KW were evident in all three treatment
factors (hybrid, plant density and N rate), Table 3.5. Hybrids P1151 and P1162 had the
highest KW values, but the lowest KN values, while hybrid 33D49 had just the opposite grain
component responses. As expected, both mean KN and mean KW across the 4 maize hybrids
were higher at the low density and as N rates increased, although the N rate of 269 Kg per
hectare of N did not significantly increase either KN or KW relative to the 202 kg N rate.
The drought-tolerant hybrids (AQUAmax) revealed higher grain harvest index (GHI)
in comparison to non-drought tolerant hybrids (Hybrid 1 > Hybrid 2; Hybrid 3 > Hybrid 4)
(Table 3.5). The higher PD negatively affected the GHI (PD1 > PD2). The higher N rates
increased GHI; the actual GHI gain between N rate 4 (269 kg N ha-1) and N rate 1 (zero N)
averaged 0.10 (or a full 10% of the total BM).
Grain yields are first presented as mean yields averaged over plant densities and N
rates (Table 3.5). Overall grain yields were very high in this experiment. Plot-combine
harvested grain yields were statistically different (P<0.05) for hybrid and N rate treatment
factors (Table 3.5; Figure 3.11); the same treatment factors were also significantly different
for other variables. We observed that hybrid P1151 did not differ from P1162, and only

116
differed from Hybrid 33D49. Hybrid 33D49 had the lowest grain yield, and this hybrid was
also significantly lower in yield than its comparable-maturity counterpart with the drought-
tolerance trait (P1498). There was a huge response to N rates. Each increment of N fertilizer
increased yields significantly, and the N rate 4 (269 kg N per hectare) resulted in an average
yield increase of 7.7 Mg per hectare compared to the control.
Of greatest interest in this study is the relative comparison of the AQUAmax hybrids
versus comparable-maturity conventional hybrids. All hybrids, whether labeled as more
drought tolerant or less so, responded fairly similarly in grain yield to plant density and N rate
treatments. Specific AQUAmax hybrids vary considerably in their physiology differences
with comparable-maturity hybrids, but did not demonstrate improved grain yields or more
yield stability than non-AQUAmax hybrids when grown at high plant density (99,000 plants
per hectare) than at the standard plant density (78,000 plants per hectare), or when grown with
a N deficiency stress. The AQUAmax hybrid P1151 generally displayed lower LAI during the
reproductive period, a longer anthesis to silking interval, as well as lower leaf photosynthesis
and leaf transpiration rates during the entire growing season, than comparable-maturity hybrid
P1162. These results confirm that P1151 seems to have a root-zone water conservation
strategy relative to other commercial hybrids that would benefit corn plants in certain
persistent drought environments. The benefits of a water-conserving strategy would be most
likely if drought symptoms were severe during the reproductive period. AQUAmax hybrid
P1498 generally showed approximately equal LAI, a slightly earlier flowering, a lower
anthesis-to-silking interval, and similar to higher leaf photosynthesis and leaf transpiration
rates than comparable-maturity hybrid 33D49. Hybrid 1498 also had consistently lower kernel
numbers but higher final kernel weights than 33D49. Grain yields were higher with P1498,
perhaps because 33D49 was the last hybrid to flower in the middle of a 3-week period with no
rain (July 12 to August 1, 2013).
3.3.6 Discussion
Roth, Ciampitti and Vyn (2013), in a similar study, in two grown seasons (2011 and
2012) with same hybrids (Hybrid 1 - P1151 and Hybrid 2 - P1162, in 2011) and (Hybrid 1 -
P1151, Hybrid 2 - P1162, Hybrid 3 - P1498, and Hybrid 4 - 33D49, in 2012), at the same all 4
N rates, and similar two PD, evaluated A and E at R3, R4, and R5 (in 2011) and at V10, V12,
V15, R1, R3, R4, and R5 (in 2012). They reported above-normal temperatures and record of
drought conditions with only 61 mm of rain from 1st June to mid-July in 2012 season, and
near normal weather conditions in 2011. The weather conditions in 2012 resulted in severe
117
plant stress most evident from V12 to R1. In this study, N rate significantly affected A only at
R4 and R5 stages. As the same way in our study, that presented more normal weather
conditions in comparison with 2012, related to historical climatological trend by made
CIAMPITTI and VYN (2011), the N rate was significant at R4, however was also significant
at earlier stages V10 and V12. The lack of N rate effect at earlier stages in 2012 season might
be associated with the interaction between N and low water supply. Additionally in this
study, N rates rather than the hybrid or PD, was the mainly factor governing A and E in both
seasons (ROTH, CIAMPITTI; VYN, 2013). Therefore, in our study there was a statistical
significant difference for the hybrid factor, Hybrid 3 (AQUAmax P1498) showed an overall
higher A and E than the Hybrid 4 (33D49), thus the first one presented to be more efficient in
water use than the Hybrid 4. Bunce (2010, 2011) observed significant differences in E for
maize inbreds and hybrids. Genetic variation at the inbred level was recently documented by
Benešova et al. (2012) with major improvements in A for some inbreds under drought
conditions but with lesser variation in E.
3.4 Conclusions
The N rate, rather than hybrid or PD, was the primary factor governing leaf A and E
responses during the different development stages. In summary, all hybrids whether labeled as
more drought-tolerant or less so, responded similarly (for GY and some parameters measured)
to PD and N treatment factors. Hybrid differences in A and E per unit leaf were not found
across a range of simultaneous stress conditions arising from low N or high PD. However the
Hybrid 2 achieved higher BM than Hybrid 1 and also than all hybrids in this study.
Nevertheless, the actual LAI attained and retained was the most important factor in biomass
and yield formation.
The Hybrid 1 (AQUAmax P1151) never achieved a higher A and E than its non-
drought tolerant counterpart of equal maturity Hybrid 2 (P1162). Hybrid 1 had a lower LAI
(at the R2 and R3 stages) than the second hybrid and a similar GY. Hybrid 3 (AQUAmax
P1498) had a capacity of keeping stomata open, even in the dry stage, that improved the
hydraulic conductance in the plant, as evidenced by the higher E (numeric number) than
Hybrid 2 (non-drought tolerant) in all sampling periods. Additionally, Hybrid 3 presented
lower LAI and higher A at R4 stage. Even with higher E than its pair of comparison, Hybrid
4, the Hybrid 3 presented a better water use efficiency than the non-drought tolerant hybrid 4,
perhaps because of a lower LAI (lower area to loose water) and higher A.

118
The drought-tolerance mechanism that is most important with P1498 is less clear than
for P1151, but P1498 seemed to be able to maintain higher leaf transpiration and
photosynthesis rates than 33D49 in the grain-fill period (regardless of moisture stress
variation during the grain fill period). So perhaps this hybrid simply has improved persistence
in root water uptake late in the season. There was no single trait differentiation in
photosynthesis or transpiration measurements among these hybrids during the 2013 growing
season.
There was no evidence that AQUAmax hybrids were any different than non-
AQUAmax hybrids in their response to N fertilizers or to PD. Thus it is unlikely that N
fertilizer management should change when AQUAmax hybrids are grown or that the
AQUAmax hybrids could perform better at the higher plant density. Certainly there is no
evidence that optimum N fertilizer rates would be any lower for these AQUAmax hybrids.
3.5 Future Research
The search for maize genotypes more tolerant to abiotic stresses is and will be a
constant task in order to get higher grain yields in maize. As the same, periodic or persistent
drought stress during growing season is and will continue be a frequent negative factor in
maize crop production. Thus, companies will be working diligently towards the goal of
having tolerant genotypes to diverse kinds of abiotic stresses, but with a priority on achieving
better yields when to water deficiency occurs in the soil.
Accordingly, new studies with an even wider range of hybrids should continue to
evaluate traits or mechanisms that makes maize crop tolerant to varying drought stress at
different growth stages. The further continued research should have more seasons of
evaluation that can be compared to each other to investigate crop responsiveness in different
environments. Also is important that the evaluations be made during all the growing season,
including the early and late (senescence) stages, preferably by aiming to study maize crop
responsese related to the environment from germination until the physiological maturity.
Another important factor is to conduct more plant evaluations below ground, these studies are
very important to see how root patterns and root activity in different genotypes affect water
use efficiency. Also is important to conduct evaluation of photosynthesis and transpiration
during the different times of the day aiming to see the maize behavior with more variation of
light and temperature resources during the diurnal cycles as the season progresses.

119
Table 3.2 - Leaf area index (LAI) (m2 m-2) obtained using Licor 2200 (LI-COR, Lincoln, NE)
for all hybrids (Hybrid 1 = AQUAmaxTM P1151, Hybrid 2 = P1162, Hybrid 3 =
AQUAmaxTM P1498, Hybrid 4 = 33D49) at both densities (PD1 = 78,000 pl ha-1,
PD2 = 99,000 pl ha-1), and at four N rates (Nr1 = 0 kg N ha-1, Nr2 = 134 kg N ha-
1, Nr3 = 202 kg N ha-1, Nr4 = 269 kg N ha-1) at various growth stages throughout
the 2013 season. Mean values represent the average of 3 replications of 3
measurements per plot
LAI (m2 m-2)
2013 V10 V12 R2 R3 R4 Mean
Hybrid
Hyb 1 2.2 ab 3.0 3.8 c 3.2 d 1.9 a 2.81 b
Hyb 2 2.3 a 3.2 4.9 a 4.6 a 2.0 a 3.42 a
Hyb 3 2.1 b 2.9 4.2 b 4.1 b 1.2 b 2.89 b
Hyb 4 1.8 c 2.9 4.1 bc 3.4 cd 2.0 a 2.83 b
PD
PD 1 2.0 b 2.8 b 3.9 b 3.6 b 1.7 2.79 b
PD 2 2.2 a 3.3 a 4.5 a 4.0 a 1.8 3.18 a
Nr
Nr 1 1.9 b 2.5 b 3.3 c 2.9 c 1.5 b 2.39 c
Nr 2 2.2 ab 3.2 a 4.3 b 2.7 b 1.6 b 3.02 b
Nr 3 2.1 a 3.2 a 4.8 a 4.2 a 2.1 a 3.28 a
Nr 4 2.1 a 3.2 a 4.5 ab 4.3 a 1.9 ab 3.22 ab
Anova
Hyb ** ns ** ** ** *
PD ** ** ** ns ns **
Nr ** ** ** * * **
Hyb x PD ns ns ns ns ns ns
Hyb xNr ns ns ns ns ns ns
PD x Nr ns * ns ns ns ns
Hyb x PD x
Nr ns ns ns ns ns
ns
ns = not significant; *=P<0.05; **=P<0.01; ***=P<0.0001

120
Table 3.3 - Leaf photosynthesis (A) (micromol CO2 m-2s-1) using Licor 6400XT (LI-COR,
Lincoln, NE) for all hybrids (Hybrid 1 = AQUAmaxTM P1151, Hybrid 2 =
P1162, Hybrid 3 = AQUAmaxTM P1498, Hybrid 4 = 33D49) at both densities
(PD1 = 78,000 pl ha-1, PD2 = 99,000 pl ha-1) and at two N rates (Nr1 = 0 kg N ha-
1, Nr3 = 202 kg N ha-1) at various growth stages throughout the 2013 season.
Each value represents three replications (total 4 points per plot) from field
isolated, light acclimated plants on the youngest fully expanded leaf at vegetative
stages and the ear leaf at reproductive stages
Photosynthesis (A)
V10 V12 R2 R3 R4
AT(ºC)# (33.1) (33.9) (33.8) (29.3) (34.2)
Hybrid
Hybrid 1 48.5 a 41.3 21.4 22.9 23.3 ab
Hybrid 2 49.1 a 41.7 27.9 27.2 23.2 ab
Hybrid 3 48.1 ab 39.8 30.7 28.3 26.8 a
Hybrid 4 44.2 b 40.1 24.9 23.1 22.2 b
PD
PD1 48.0 41.3 26.8 26.2 25.8
PD2 46.8 40.2 25.6 24.6 21.8
Nr
Nr1 44.5 b 36.2 b 25.2 21.5 21.6 b
Nr3 50.4 a 44.9 a 27.2 29.3 26.0 a
ANOVA
Hyb ** ns NA NA **
PD ns ns NA NA ns
Nr ** ** NA NA **
Hyb x PD ns ns NA NA ns
Hyb x Nr ns ns NA NA ns
PD x Nr ns ns NA NA ns
Hyb x PD x
Nr ns ns NA NA ns
#AT = Mean air temperature in each sample stage in ◦C.
NA = not applicable; ns = not significant; *=P<0.05; **=P<0.01; ***=P<0.0001.
Only 2 reps were completed for R2 and R3 stage measurements and treatments could not be
evaluated statistically

121
Table 3.4 - Leaf transpiration (E) (µmol H2O m-2 s-1) using Licor 6400XT (LI-cor, Lincoln,
NE) for all hybrids (Hybrid 1 = AQUAmaxTM P1151, Hybrid 2 = P1162, Hybrid
3 = AQUAmaxTM P1498, Hybrid 4 = 33D49) at both densities (PD1 = 78,000 pl
ha-1, PD2 = 99,000 pl ha-1) and at two N rates (Nr1 = 0 kg N ha-1, Nr3 = 202 kg N
ha-1) at various growth stages throughout the 2013 season. Each value represents
three replications (total 4 points per plot) from field isolated, light acclimated
plants on the youngest fully expanded leaf at vegetative stages and the ear leaf at
reproductive stages
Transpiration (E)
V10 V12 R2 R3 R4
Hybrid
Hybrid 1 8.04 8.18 ab 3.81 3.79 4.72
Hybrid 2 8.53 8.85 a 5.65 5.09 5.39
Hybrid 3 8.07 7.31 ab 5.52 4.46 4.92
Hybrid 4 7.61 7.00 b 4.32 3.44 4.17
PD
PD1 8.12 7.97 4.91 4.37 5.07
PD2 8.00 7.77 4.74 3.98 4.49
Nr
Nr1 7.47 b 6.86 b 4.81 3.68 4.64
Nr3 8.63 a 8.82 a 4.85 4.66 4.93
ANOVA
Hyb ns ** NA NA ns
PD ns ns NA NA ns
Nr ** ** NA NA ns
Hyb x PD ns ns NA NA ns
Hyb x Nr ns ns NA NA ns
PD x Nr ns ns NA NA ns
Hyb x PD x
Nr ns ns NA NA ns
ns = not significant; *=P<0.05; **=P<0.01; ***=P<0.0001.
NA = not applicable; ns = not significant; *=P<0.05; **=P<0.01; ***=P<0.0001.
Only 2 reps were completed for R2 and R3 stage measurements and treatments could not be
evaluated statistically

122
Table 3.5 - Grain yield (155 g kg-1 moisture) from combine harvest (GY), grain harvest index
(GHI), kernel number (KN), kernel weight (KW), and total plant biomass, BM (Mg ha-
1) at physiological maturity for all maize hybrids (Hybrid 1 = AQUAmaxTM P1151,
Hybrid 2 = P1162, Hybrid 3 = AQUAmaxTM P1498, Hybrid 4 = 33D49, and Hybrid 5
= P1184) grown at two plant densities (PD1 = 78,000, PD2 = 99,000 pl ha−1) and four
N rates (Nr1 = 0, Nr2 = 134, Nr3 = 202, and Nr4 = 269 kg ha−1) in 2013
GY GHI KN KW Total BM
(Mg ha-1) (kernel m-2) (mg kernel-1) (Mg ha-1)
Hybrid
Hyb 1 13.24 a 0.55 a 4074 c 295 a 20.7 b
Hyb 2 12.96 a 0.51 bc 3827 d 304 a 22.0 a
Hyb 3 12.68 a 0.52 b 4522 b 249 b 20.0 b
Hyb 4 11.56 b 0.50 c 4839 a 227 c 19.6 b
PD
PD 1 12.61 0.52 a 4196 b 274 a 20.4
PD 2 12.71 0.51 b 4435 a 263 b 20.8
Nr
Nr 1 7.44 d 0.45 c 2773 c 247 c 13.8 c
Nr 2 13.38 c 0.52 b 4672 b 265 b 21.8 b
Nr 3 14.46 b 0.54 ab 4898 ab 278 a 23.1 ab
Nr 4 15.14 a 0.55 a 4919 a 286 a 23.6 a
Anova
Hyb ** ** ** ** **
PD ns ** ** ** ns
Nr ** ** ** ** **
Hyb x PD ns ns ns ns ns
Hyb xNr ns ns ns ns ns
PD x Nr ns ns ns ns ns
Hyb x PD
x Nr ns ns ns ns ns
ns = not significant; *=P<0.05; **=P<0.01; ***=P<0.001

123
Figure 3.3 - LAI – Leaf Area Index (m2 m-2) for all hybrids (Hybrid 1 = AQUAmaxTM P1151,
Hybrid 2 = P1162, Hybrid 3 = AQUAmaxTM P1498, Hybrid 4 = 33D49) at both
densities (PD1 = 78,000 pl ha-1, PD2 = 99,000 pl ha-1) and at four N rates (Nr1 = 0 kg
N ha-1, Nr2 = 134 kg N ha-1, Nr3 = 202 kg N ha-1, Nr4 = 269 kg N ha-1) at various
growth stages throughout the 2013 season. Mean values represent the average of 3
replications of 3 measurements per plot

124
Figure 3.4 - A – Photosynthesis rates (µmol CO2 m
-2 s-1) using Licor 6400XT (LI-COR, Lincoln,
NE) for all hybrids (Hybrid 1 = AQUAmaxTM P1151, Hybrid 2 = P1162, Hybrid 3 =
AQUAmaxTM P1498, Hybrid 4 = 33D49) at both densities (PD1 = 78,000 pl ha-1, PD2
= 99,000 pl ha-1) and at two N rates (Nr1 = 0 kg N ha-1, Nr3 = 202 kg N ha-1) at
various growth stages throughout the 2013 season. Each value represents three
replications (total 4 points per plot) from field isolated, light acclimated plants on the
youngest fully expanded leaf at vegetative stages and the ear leaf at reproductive
stages. Note: Only 2 reps were completed for R2 and R3 stage measurements
Figure 3.5 - E – Leaf transpiration rates (µmol H2O m-2 s-1) using Licor 6400XT (LI-COR, Lincoln,
NE) for all hybrids (Hybrid 1 = AQUAmaxTM P1151, Hybrid 2 = P1162, Hybrid 3 =
AQUAmaxTM P1498, Hybrid 4 = 33D49) at both densities (PD1 = 78,000 pl ha-1, PD2
= 99,000 pl ha-1) and at two N rates (Nr1 = 0 kg N ha-1, Nr3 = 202 kg N ha-1) at various
growth stages throughout the 2013 season. Each value represents three replications
(total 4 points per plot) from field isolated, light acclimated plants on the youngest fully
expanded leaf at vegetative stages and the ear leaf at reproductive stages. Note: Only 2
reps were completed for R2 and R3 stage measurements

125
Figure 3.6 - Factorial for Hybrid x PD for Leaf Area Index (LAI) (m2 m-2) for all maize hybrids (Hybrid 1 = AQUAmaxTM P1151, Hybrid 2 =
P1162, Hybrid 3 = AQUAmaxTM P1498, Hybrid 4 = 33D49) grown at two plant densities (PD1=78,000, PD2=99,000 pl ha−1) and
four N rates (Nr1 = 0, Nr2 = 134, Nr3 = 202, and Nr4 = 269 kg ha−1) at various growth stages throughout the 2013 season. Mean
values represent the average of 3 replications of 3 measurements per plot

126
Figure 3.7 - Factorial for Hybrid x Nr for Leaf Area Index (LAI) (m2 m-2) for all maize hybrids (Hybrid 1 = AQUAmaxTM P1151, Hybrid 2 =
P1162, Hybrid 3 = AQUAmaxTM P1498, Hybrid 4 = 33D49) grown at two plant densities (PD1=78,000, PD2=99,000 pl ha−1) and
four N rates (Nr1 = 0, Nr2 = 134, Nr3 = 202, and Nr4 = 269 kg ha−1) at various growth stages throughout the 2013 season. Mean
values represent the average of 3 replications of 3 measurements per plot

127
Figure 3.8 - Mean separation test for Leaf Area Index (LAI) (m2 m-2) for the factorial PD x Nr at V12 stage, for all maize hybrids (Hybrid 1 =
AQUAmaxTM P1151, Hybrid 2 = P1162, Hybrid 3 = AQUAmaxTM P1498, Hybrid 4 = 33D49) grown at two plant densities
(PD1=78,000, PD2=99,000 pl ha−1) and four N rates (Nr1 = 0, Nr2 = 134, Nr3 = 202, and Nr4 = 269 kg ha−1) in 2013

128
Figure 3.9 - A – Photosynthesis rates (µmol CO2 m
-2 s-1) using Licor 6400XT (LI-COR, Lincoln, NE) for all hybrids (Hybrid 1 = AQUAmaxTM
P1151, Hybrid 2 = P1162, Hybrid 3 = AQUAmaxTM P1498, Hybrid 4 = 33D49) at both densities (PD1 = 78,000 pl ha-1, PD2 =
99,000 pl ha-1) and at only one N rate (Nr3 = 202 kg N ha-1) at various growth stages throughout the 2013 season. Each value
represents three replications (total 4 points per plot) from field isolated, light acclimated plants on the youngest fully expanded leaf
at vegetative stages and the ear leaf at reproductive stages. Note: Only 2 reps were completed for R2 and R3 stage measurements

129
Figure 3.10 - E – Leaf transpiration rates (µmol H2O m-2 s-1) using Licor 6400XT (LI-COR, Lincoln, NE) for all hybrids (Hybrid 1 =
AQUAmaxTM P1151, Hybrid 2 = P1162, Hybrid 3 = AQUAmaxTM P1498, Hybrid 4 = 33D49) at both densities (PD1 = 78,000 pl
ha-1, PD2 = 99,000 pl ha-1) and at only one N rate (Nr3 = 202 kg N ha-1) at various growth stages throughout the 2013 season. Each
value represents three replications (total 4 points per plot) from field isolated, light acclimated plants on the youngest fully
expanded leaf at vegetative stages and the ear leaf at reproductive stages. Note: Only 2 reps were completed for R2 and R3 stage
measurements

130
Figure 3.11 - Grain yields (t ha-1) at physiological maturity for all maize hybrids (Hybrid 1 = AQUAmaxTM P1151, Hybrid 2 = P1162,
Hybrid 3 = AQUAmaxTM P1498, Hybrid 4 = 33D49, and Hybrid 5 = P1184) grown at two plant densities (PD1 = 78,000, PD2
= 99,000 pl ha−1), and four N rates (Nr1 = 0, Nr2 = 134, Nr3 = 202, and Nr4 = 269 kg ha−1) in 2013

131
References
BANZIGER, M.; EDMEADES, G.O.; LAFITTE, H.R. Physiological mechanisms
contributing to the increased N stress tolerance of tropical maize selected for drought
tolerance. Field Crops Research, Amsterdam, v. 75, p. 223-233, 2002.
BANZIGER, M.; EDMEADES, G.O.; BECK, D.; BELLON, M. Breeding for drought land
nitrogen stress tolerance in maize: from theory to practice. Mexico: CIMMYT, 2000. 68 p.
BENEŠOVA, M.; HOLA, D.; FISCHER, L.; JEDELSKY, P.L; HNILIČKA, F.;
WILHELMOVA, N. The physiology and proteomics of drought tolerance in maize: Early
stomatal closure as a cause of lower tolerance to short-term dehydration? PLoS ONE, San
Francisco, v. 7, n. 6, e38017, 2012.
BERGAMASCHI, H.; DALMAGO, G.A.; BERGONCI, J.I.; BIANCHI, C.A.M.; MÜLLER,
A.G.; COMIRAN, F.; HECKLER, B.M.M. Distribuição hídrica no período crítico do milho e
produção de grãos. Pesquisa Agropecuária Brasileira, Brasília, v. 39, p. 831-839, 2004.
BERGAMASCHI, H.; DALMAGO, G.A.; COMIRAN, F.; BERGONCI, J.I.; MÜLLER,
A.G.; FRANÇA, S.; SANTOS, A.O.; RADIN, B.; BIANCHI, C.M.M.; PEREIRA, P.G.
Déficit hídrico e produtividade da cultura do milho. Pesquisa Agropecuária Brasileira,
Brasília, v. 41, n. 2, p. 243-249, 2006.
BERRY, J.A.; BJÖRKMAN, O. Photosynthetic response and adaptation to temperature in
higher plants. Annual Review of Plant Physiology and Plant Molecular Biology, Palo Alto,
v. 31, p. 491–543, 1980.
BLUM, A.; ARKIN, G.F. Sorghum root growth and water use as affected by water supply
and growth duration. Field Crops Research, Amsterdam, v. 9, p. 131-142, 1984.
BOOMSMA, C.R.; SANTINI, J.B.; TOLLENAAR, M.; VYN, T.J. Maize morpho-
physiological responses to intense crowding and low nitrogen availability: An analysis and
review. Agronomy Journal, Madison, v. 101, p. 1426-1452, 2009.
BRUCE, W.B.; EDMEADES G.O.; BARKER T.C. Molecular and physiological approaches
to maize improvement for drought tolerance. Journal of Experimental Botany, Oxford,
v. 53, p 13– 25, 2002.
BUNCE, J.A. Leaf transpiration efficiency of some drought-resistant maize lines. Crop
Science, Madison, v. 50, p. 1409–1413, 2010.
______. Leaf transpiration efficiency of sweet corn varieties from three eras of breeding.
Crop Science, Madison, v. 51, p 793–799, 2011.
CAMPOS, H.; COOPER, M.; EDMEADES, G.O.; LÖFFLER, C.; SCHUSSLER, J.R;
IBANEZ, M. Changes in drought tolerance in maize associated with fifty years of breeding
for yield in the U.S. Corn Belt. Maydica, Rome, v. 51, p 369–381, 2006.

132
CIAMPITTI, I.A.; VYN, T.J. A comprehensive study of plant density consequences on
nitrogen uptake dynamics of maize plants from vegetative to reproductive stages. Field Crops
Research, Amsterdam, v. 121, p. 2–18, 2001.
CIAMPITTI, I.A.; MURRELL, S.T.; CAMBERATO, J.J.; TUINSTRA, M.; XIA, Y.;
FRIEDEMANN, P.; VYN, T.J. Physiological dynamics of maize nitrogen uptake and
partitioning in response to plant density and nitrogen stress factors: II. Reproductive phase.
Crop Science, Madison, v. 53, n. 6, p. 2588-2602, 2013.
COOPER, M.; GHO, C.; LEAFGREN, R.; TANG, T.; MESSINA, C. Breeding drought-
tolerant maize hybrids for the US corn-belt: discovery to product. Journal of Experimental
Botany, Oxford, v. 65, n. 21, p. 6191-204, 2014.
COSTA, J.R.; PINHO, J.L.N.; BEZERRA, M.L.; AQUINO, B.F.; CAVALCANTE JR, A.T.
Variáveis hídricas e morfológicas em cultivares de milho (Zea mays, L.) submetidas ao
estresse hídrico em dois estádios fenológicos da cultura. In: CONGRESSO BRASILEIRO DE
FISIOLOGIA VEGETAL, 8., 2001, Ilhéus. Resumos... Ilhéus: Sociedade Brasileira de
Fisiologia Vegeta, 2001. p. 20.
DEMIREVSKA, K.; ZASHEVA, D.; DIMITROV, R.; SIMOVA-STOILOVA, L.;
STAMENOVA, M.; FELLER, U. Drought stress effects on Rubisco in wheat: changes in the
Rubisco large subunit. Acta Physiology Plantarum, Heidelberg, v. 31, p. 1129- 1138, 2009.
DING, L.; WANG, K.J.; JIANG, G.M.; BISWAS, D.K.; Xu, H.; LI, L.F.; LI, Y.H. Effects of
nitrogen deficiency on photosynthetic traits of maize hybrids released in different years.
Annals of Botany, Oxford, v. 96, p. 925-930, 2005.
DWYER, L. M.; TOLLENAAR, M.; HOUWING, L. A nondestructive method to monitor
leaf greenness in corn. Canadian Journal of Plant Science, Ottawa, v. 71, p. 505-509, 1991.
DWYER, L.M.; ANDERSON, A.M.; STEWART, D.W.; MA, B.L., TOLLENAAR, M.
Changes in maize hybrid photosynthetic response to leaf nitrogen, from preanthesis to grain
fill. Agronomy Journal, Madison, v. 87, p. 1221–1225, 1995.
EARL, H. J.; TOLLENAAR, M. Maize leaf absorptance of photosynthetically active
radiation and its estimation using a chlorophyll meter. Crop Science, Madison, v. 37, n. 2,
p. 436-440, 1997.
EARL, H.J.; TOLLENAAR, M. Using chlorophyll fluorometry to compare photosynthetic
performance of commercial maize (Zea mays L.) hybrids in the field. Field Crops Research,
Amsterdam, v. 61, p. 201-210, 1999.
EAMUS, D.; TAYLOR, D.T.; MACINNIS-NG, C.M.O.; SHANAHAN, S.; DE SILVA, L.
Comparing model predictions and experimental data for the response of stomatal conductance
and guard cell turgor to manipulations of cuticular conductance, leaf-to-air vapour pressure
difference and temperature: feedback mechanisms are able to account for all observations.
Plant, Cell and Environment, Oxford, v. 31, p. 269-277, 2008.

133
ECHARTE, L.; ROTHSTEIN, S.; TOLLENAAR, M. The response of leaf photosynthesis
and dry matter accumulation to nitrogen supply in an older and a newer maize hybrid. Crop
Science, Madison, v. 48, p. 656-665, 2008.
EDWARDS, G.; WALKER, D. C3, C4: mechanisms and cellular and environmental
regulation of photosynthesis. Berkeley; Davis: University of California Press, 1983.
HATTERSLEY, P.W. Characterization of C4 type leaf anatomy in grasses (Poaceae).
Mesophyll: bundles sheath area ratios. Annals of Botany, Oxford, v. 53, p. 163-179, 1984.
JALEEL, C.A.; PARAMASIVAM, M.; WAHID, A.; FAROOQ, M.; AL-JUBURI, H.J.;
SOMASUNDARAM, F.; PANNEERSELVAM, R. Drought stress in plants: A review on
morphological characteristics and pigment compositions. International Journal of
Agriculture and Biology, Faisalabad, v. 11, p. 100-105, 2009.
KIM, S.H.; SICHER, R.C.; BAE, H.; GITZ, D.C.; BAKER, J.T.; TIMLIN, D.J.; REDDY,
V.R. Canopy photosynthesis, evapotranspiration, leaf nitrogen, and transcription profiles of
maize in response to CO2 enrichment. Global Change Biology, Chichester, v. 12, p. 588-
600, 2006.
LEAKEY, A.D.B.; URIBELARREA, M.; AINSWORTH, E.A.; NAIDU, S.L.; ROGERS, A.;
ORT, D.R.; LONG, S.P. Photosynthesis, productivity, and yield of maize are not affected by
open-air elevation of CO2 concentration in the absence of drought. Plant Physiology.
Rockville, v. 140, p. 779-790, 2006.
LI; Y.; SPERRY; J. S.; SHAO, M. Hydraulic conductance and vulnerability to cavitation in
corn (Zea mays L.) hybrids of differing drought resistance. Environmental and
Experimental Botany, Oxford, v. 66, p. 341-346, 2009.
MA, B.L.; DWYER, L.M. Nitrogen up take and use of two contrasting maize hybrids
differing in leaf senescence. Plant and soil, Dordrecht, v. 199, p. 283-291, 1998.
MARKELZ, R.J.C.; STRELLNER, R.S.; LEAKEY, A.D.B. Impairment of C4 photosynthesis
by drought is exacerbated by limiting nitrogen and ameliorated by elevated [CO2] in maize.
Journal of Experimental Botany, Oxford, v. 62, p. 3235-3246, 2011.
MONNEVEUX, P.; SANCHEZ, C.; BECK, D.; EDMEADES, G.O. Drought tolerance
improvement in tropical maize source populations: evidence of progress. Crop Science,
Madison, v. 46, p. 180-191, 2006.
PIONEER. Optimum AQUAmaxTM products from DuPont Pioneer. Disponível em:
<https://www.pioneer.com/CMRoot/Pioneer/US/products/seed_trait_technology/see_the_diff
erence/AQUAmax_Product_Offerings.pdf>. Acesso em: 15 dez. 2013.
______. Disponível em: <http://www.pioneersementes.com.br/Media Center/Pages/Detalhe-
do-Artigo.aspx?p=165>. Acesso em: 08 jul. 2014.
PRANGE, R.K.; McRAE, K.B.; MIDMORE, D.J., DENG, R. Reduction in potato growth at
high-temperature - role of photosynthesis and dark respiration. American Potato Journal,
New York, v. 67, p. 357-369, 1990.

134
ROTH, J.; CIAMPITTI, I.A.; VYN, T.J. Physiological evaluations of recent drought-tolerant
maize hybrids at varying stress levels. Agronomy Journal, Madison, v. 105, p. 1129-1141,
2013.
SADOK, W.; SINCLAIR, T.R. Genetic variability of transpiration response of soybean
(Glycine max (L.) Merr.) shoots to leaf hydraulic conductance inhibitor AgNO3. Crop
Science, Madison, v. 50, p. 1423-1430, 2010.
SANCHEZ, R.A.; HALL,A.J.; TRAPANI N.; COHEN DE HUNAU, R. Effects of water
stress on chlorophyll content, nitrogen level and photosynthesis of leaves of two maize
genotypes. Photosynthesis Research, Dordrecht, v. 4, p. 35–47, 1983.
SANGOI, L. Understanding plant density effects on maize growth and development: an
important issue to maximize grain yield. Ciência Rural, Santa Maria, v. 31, n. 1, p. 159-168,
2000.
SAS INSTITUTE. SAS/STAT 9.1: users guide. Cary, 2004. 824 p.
SCHITTENHELM, S. Chemical composition and methane yield of maize hybrids with
contrasting maturity. European Journal of Agronomy, Córdoba, v. 29, n. 2, p. 72-79, 2008.
______. Effect of drought stress on yield and quality of maize/sunflower and maize/sorghum
intercrops for biogas production. Journal of Agronomy and Crop Science, Berlin, v. 196,
n. 4, p. 253–261, 2010.
SHAO, H.; CHU, L.; JALEEL, C. A.; ZHAO, C. Water-deficit stress induced anatomical
changes in higher plants. Comptes Rendus Biologies, Paris, v. 331, p. 215-225, 2008.
SINCLAIR, T.R.; ZWIENIECKI, M.A.; HOLBROOK, N.M. Low leaf hydraulic conductance
associated with drought tolerance in soybean. Physiology Plantarum, Oxford, v. 132, p. 446-
451, 2008.
SPANO, G.; DI FONZO, N.; PERROTTA, C.; PLATANI, C.; RONGA, G. Physiological
characterization of ‘stay green’ mutants in durum wheat. Journal of Experimental Botany,
London, v. 54, p. 1415-1420, 2003.
TOLLENAAR, M.; DAYNARD, T.B. Leaf senescence in short-season maize hybrids.
Canadian Journal of Science, Ottawa, v. 58, p. 869-875, 1978.
TOLLENAAR, M.; LEE, E.A.Strategies for enhancing grain yield in maize. Plant Breeding
Reviews, Hoboken, v. 34, p. 37-81, 2011.
TURNER, L.B. The effect of water stress on the vegetative growth of white clover (Trifolium
repens L.), comparative of long-term water deficit and short-term developing water stress.
Journal of Experimental Botany, Oxford, v. 42, p. 311-316, 1991.
TURNER, N.C.; OTOOLE, J.C.; CRUZ, R.T.; YAMBAO, E.B.; AHMAD, S.; NAMUCO,
O.S.; DINGKHUM, M. Response of seven diverse rice cultivars to water deficit. II. Osmotic
adjustment, leaf elasticity, leaf expansion, leaf death, stomatal conductance and
photosynthesis. Field Crops Research, Amsterdam, v. 13, p. 273-286, 1986.

135
UHART, S. A.; ANDRADE, F. H. Nitrogen deficiency in maize. I. Effects on crops growth,
development, dry matter partitioning, and kernel set. Crop Science, Madison, v. 35, p. 1376-
1383, 1995.
WEILAND, P. Biomass digestion in agriculture: a successful pathway for the energy
production and waste treatment in Germany. Engineering Life Science, Dresden, v. 6, n. 3,
p. 302-309, 2006.
WELCKER, C.; BOUSSUGE, B.; BENCIVENNI, C.; RIBAUT, M.; TARDIEU, F. Are
source and sink strengths genetically linked in maize plants subjected to water deficit: a QTL
study of the responses of leaf growth and of anthesis-silking Interval to water deficit. Journal
of Experimental Botany, London, v. 58, p. 339-349, 2007.
WOLFE, D.W.; HENDERSON, D.W.; HSIAO, T.C.; ALVINO, A. Interactive water and
nitrogen effects on senescence of maize. 1. Leaf area duration, nitrogen distribution, and
yield. Agronomy Journal, Madison, v. 80, p. 859-864, 1988.
WU, Y.; HUANG, M.; WARRINGTON, D.N. Growth and transpiration of maize and winter
wheat in response to water deficits in pots and plots. Environmental and Experimental
Botany, Paris, v. 71, n. 1, p. 65-71, 2011.
XIA, Y. Photosynthesis-related physiological responses of field-grown maize to plant
density and nitrogen stress during vegetative and reproductive stages. 2012. 181 p.
Dissertation. (Ph.D. in Agronomy) - Purdue University, West Lafayette, 2012.

136

137
4 MAIZE RESPONSE TO NITROGEN APPLICATION TIMING AND
CORRELATION AMONG LEAF VARIABLES WITH GRAIN YIELD AND
COMPONENTES
Abstract
The knowledge about the effective influence of the factors that determine the
performance of the plant can contribute decisively to minimize the stress caused by nitrogen
deficiency. Thus, it is extremely important to obtain more reviews related to the correlation
between the real content of chlorophyll and real carotenoids with the values obtained by
chlorophyll (SPAD) in the early development stages of the maize. The development of
research in relation to the maize crop response to the nitrogen fertilization at different
development stages is as well as important. The primary objective of this study was to
investigate the responses of maize to the nitrogen application, urea fertilizer (15N), in
sidedress at different development stages. The secondary objective was verifying the
correlation between chlorophylls and carotenoids with SPAD index and these with total
biomass (BM), harvest index (HI), grain yield (GY) and grain N content in response to the
nitrogen side-dress at different development stages. The hybrid used in this study was the
30F35HR. The nitrogen fertilization was carried out in plots, with the application of 30 kg ha-
1 of N at planting and 140 kg ha-1 N as side-dress at vegetative stages V4, V6, V8, V10 and
V12, without incorporation into the soil, and control treatment consisted of non-nitrogen side-
dress application was also utilized. The 2011/2012 season presented higher precipitation than
2012/2013. Maize crop responded similarly for GY to the nitrogen application in sidedress
both seasons, however the nitrogen application in the early stages caused higher values for
leaf variables, leaf pigments and SPAD. Higher amount of nitrogen in all parts of the plants
was observed in the 2011/2012 season than in 2012/2013, influenced by the adequate weather
conditions at the nitrogen application moment. Grain N content from 15N fertilizer and N
uptake and efficiency were greater for early N applications. SPAD values correlated
positively with most pigment variables at V16 in both seasons, thus proving that SPAD was
an efficient instrument of indirect evaluation of chlorophylls and carotenoids in maize leaves
at early stages. Chlorophyll b at V16 was positively correlated (P<0.05) with grain N content,
GY, and BM, and total chlorophyll at V16 was positively correlated with GY and grain N
content. However the chlorophylls a and total, evaluated at V14, were negatively correlated
with GY. So, measurement of real chlorophyll and carotenoid pigment contents should be
done after V14 stage when studies aim to evaluate crop nutritional conditions and prescribe
future grain production practices.
Keywords: Chlorophylls; Carotenoids; SPAD; Early growth stages
4.1 Introduction
The appropriate mineral nutrition is among the factors which have the greatest
influence on the productivity increase of crops, and nitrogen (N) is the most essential required
nutrient, especially for the maize, which is one of the crops that respond to high increases in
productivity in response to N fertilization. The non-availability of N in the soil causes several

138
problems to crops such as: reduced leaf area, decrease in photosynthesis, developmental
delays and reduced yield. On the other hand, excessive application of N to the soil implies in
higher production costs and can cause environmental problems such as contamination of the
water, contributing to the increase of global warming due to the formation of nitrous oxide.
Maize nitrogen requirements vary considerably in different plant development stages
(ARNON, 1975). Although it is known that this crop requires about 20 kg ha-1 of N for each
ton of produced grain (FANCELLI, 2000; SOUSA; LOBATO, 2004) there is still some
controversy about the ideal time for nitrogen application to this crop. Some authors state that
the ideal time is to make the application at seeding or close to this time, but others report that
it is ideal to apply at the later stages, thus avoiding losses by leaching and volatilization and
increasing the efficiency of absorption and the use of the nitrogen fertilizer (COELHO, 1987;
NEPTUNE; CAMPANELLI, 1980; CANTARELLA, 1993; SÁ, 1996; DA ROS et al., 1999;
PAULETTI; COSTA, 2000; CERETTA et al., 2000; BASSO; CERETTA, 2000).
Great advances have been made to improve the nitrogen use efficiency (NUE), which
is defined as the ratio of dry matter production unit by unit applied N. The ways of how to
assess the nutritional status of the plants are among the evaluation factors of plant response to
management practices. The use of indirect measurements to determine the nutritional status of
plants has been the object of research for many crops. Research studies have shown that, for
some crops, the concentration of chlorophyll or the greening of leaves is positively correlated
with leaf N concentrations, because 70% of N contained in the leaves is in the chloroplasts,
participating in the synthesis and the structure of chlorophyll molecules (MARENCO;
LOPES, 2005). For this reason, the content of chlorophyll in the late vegetative stage has been
related to the N nutritional status of various crops (ARGENTA et al., 2001).
The traditional methods used to determine the amount of chlorophyll in the leaf
require the destruction of tissue samples and much work in the extraction and quantification
processes. The development of portable chlorophyll meter (SPAD), which allows
instantaneous measurements of the amount corresponding to its content in the leaf without
destroying it, is an alternative to estimate the relative content of these pigments in the leaf
(DWYER; TOLLENAAR; HOUWING, 1991; ARGENTA et al., 2001). There is a strong
positive relationship between the SPAD values with the N concentration in the leaves of the
plants, being more evident in the later growth stages (ARGENTA et al., 2001) and there is
high correlation with chlorophyll content (DWYER; TOLLENAAR; HOUWING, 1991;
CIAMPITTI et al., 2012).

139
The knowledge about the effective influence of the factors that determine the
performance of the plant can contribute decisively to minimize the stress caused by nitrogen
deficiency. Thus, it is extremely important to obtain more reviews related to the correlation
between the real content of chlorophyll and real carotenoids with the values obtained by
chlorophyll (SPAD) in the early development stages of the maize. The development of
research in relation to the maize crop response to the nitrogen fertilization at different
development stages is as well as important. Through these assessments it is possible to have a
greater knowledge about the plant relationship with the environment in which it is grown and
may have increases in the grain yield.
The primary objective of this study was to investigate the responses of maize due to
nitrogen [urea fertilizer (15N)] side-dress application at different development stages. The
secondary objective was verifying the correlation between the chlorophylls and carotenoids
with the SPAD index and these with, total biomass, harvest index (HI), grain yield (GY) and
grain N content in response to the nitrogen side-dress in different development stages.
4.2. Materials and Methods
The study was carried out at Tanquinho Farm, and at Centro de Energia Nuclear na
Agricultura, University of São Paulo (CENA / USP), in Piracicaba, SP. The experiment was
conducted under field conditions during the seasons of 2011/2012 and 2012/2013, and was
installed in December 2011 and completed in March 2012 and repeated from December 2012
to March 2013. The experimental design consisted of random blocks having four replications,
managed under conventional tillage, with corn as the preceding crop. The hybrid used in this
study was 30F35HR (PIONEER, 2014).
Prior to the implementation of the experiment, the chemical and physical
characterization of the field soil was performed for the 0-20 cm layer. Nitrogen (N)
fertilization was carried out in plots with urea, as source, corresponding to 30 kg N ha-1 at
planting and 140 kg N ha-1 as sidedress, without incorporation. These N doses are
recommended aiming for a high grain yield (10-12 t ha-1) as in areas with high response to N
application (CANTARELLA; RAIJ; CAMARGO, 1997). The treatments consisted of five
urea fertilizer application times as sidedressings, corresponding to the vegetative stages V4,
V6, V8, V10 and V12 as described by Ritchie, Hanway and Benson (2003). A control
treatment consisted of non-nitrogen side-dress fertilization was also utilized.
Plots had 10 rows of corn with 10 m length, spaced 0.5 m apart, thus totaling an area
of 50 m2, corresponding to a population of 60,000 plants per ha. In each of the plots, mini

140
plots (0.5 m wide and 1.5 m long) were delimited for 15N-urea application, at the same dose
and time of the commercial urea application to the rest of the plot, .
Before the planting, for both seasons, weed control was performed with the herbicide
glyphosate. Then the mechanical seeding was performed with approximately 3.3 seeds per
meter density (already accounted for 10% more due to losses) in order to obtain a final stand
of 60,000 plants per hectare. Along with seeding, planting fertilization was performed with
the application of full dose of P and K, recommended by Cantarella, Raij and Camargo
(1997), considering the values measured by the soil chemical analysis and expecting a high
productivity.
At the end of the crop cycle, grain yield (GY) and plant biomass (BM) were
determined. The GY was determined by weighing the grains harvested with moisture
correction to 13%. The BM was determined based on the wet weight of the residuals,
followed by the correction of the previously determined moisture.
The plant material from the shoot was separated into stem, leaves + tassel + ear husks,
cobs and grain. All the material was dried at 60 °C with forced air to a constant weight.
Subsequently, the dried plant material was ground in a Wiley grinder, homogenized and
subsampled. In all subsamples the nitrogen content (g kg-1) was determined by Kjeldahl
digestion - distillation and determining the sulfur content by the nitric perchloric digestion
methodology followed by the turbidity determination.
The plants from the mini plots were collected and separated in grains, cobs, stalks and
leaves, dried in an oven and finally ground for later determination (in grains) of total-N
content and 15N abundance in a mass spectrometer (BARRIE; PROSSER, 1996), only in the
2012/2013 season. Based on these values the grain nitrogen content derived from the fertilizer
(GNCF) as well as the nitrogen fertilizer use and efficiency (NFUE) were calculated
according to Gava et al. (2006).
4.2.1 Descriptions of the Analyzed Variables
4.2.1.1 Non-destructive Measures:
Indirect or SPAD chlorophyll content index (Soil Plant Analysis Development), was
obtained by using the SPAD-502 chlorophyll meter (Minolta, Japan) (MINOLTA, 1989;
PESTANA et al., 2001; MARKWELL; OSTERMAN; MITCHELL, 1995) on two uppermost
leaves per plant, fully developed, before getting into senescence and being photosynthetically

141
active. Six samples per leaf were performed in 4 plants per treatment, carried out at V14 to
V16 stages.
Plant height, evaluated on 4 plants per treatment at the flowering period (VT), variable
obtained with a measuring tape (in centimeters) placed from soil surface to the highest
insertion of the last uppermost leaves.
4.2.1.2 Destructive Measures:
Content of pigments in the leaves, evaluated in laboratory. The same leaves of SPAD
evaluation were collected and taken to the laboratory for the analysis of chlorophyll a, b, and
total and carotenoids. Following the methodology adapted from Moran and Porath (1980),
two leaves per plant were evaluated from a total of 4 plants per treatment at V14 and V16
stages.
4.2.2 Statistical Analysis
The data were tested regarding the normality of the errors, as well as the homogeneity
of variances, and then subjected to analysis of variance at 5% of significance. Having
significant effects of the treatments by the F test, comparisons were performed using the t test,
also at the level of 5% significance. The Pearson correlation test was also performed among
the variables in order to verify the existence of positive correlations.
Table 4.1 - Soil analysis in both maize growing seasons, 2011/2012 and 2012/2013,
(inorganic nitrogen [NO3- - N/NH 4
+-N], soil pH, potassium content [K], and
phosphorus Bray-P 1 [P]) in from 0 – 20 and 20 – 40 of the soil profile Profile pH P K Ca Mg H+Al Al T V OM1 Silt Clay
cm (CaCl2) mg dm-3 ------------- mmolc dm-3 -------------- % -------- g kg-1 --------
2011/12
0–20 4.9 27 1.9 30 13 42 1 87 52 29 151 529
20–40 4.5 32 0.6 19 8 58 5 86 32 22 102 548
2012/13
0–20 4.8 29 1.3 16 9 47 2 73 36 30 - -
20–40 4.6 21 0.6 10 7 52 3 70 25 24 - -
1 = Organic matter

142
4.3 Result and Discussion
4.3.1 Growing Season and Phenology
The weather conditions during both whole growing seasons can be seen in Figure 1.2.
The 2011/2012 season presented higher precipitation than 2012/2013, however in the
2012/2013 there was regular precipitation during the stages of N application (Figure 4.1).
4.3.2 Nitrogen uptake and partitioning, and Sulfur Uptake
In the 2011/2012 season (Table 4.2), treatments were significant for most variables,
but not for cob N content. For leaf N content there was only difference between the control
and all N applications, in all development stages. But for stem N content only the N
application in V4 and V6 were different than the control (V4 = V6 > control). Grain N content
and total plant N uptake were greater for V6 and V10 than the control. However the N
application at V8 resulted in similar values in relation to the control for both variables.
Nonetheless total plant sulfur uptake was similar for all treatments with nitrogen application.
We observed a higher amount of nitrogen in all parts of the plants in the 2011/2012 season as
compared to the 2012/2013 (Table 4.3). This was more consistent for total plant N uptake that
presented mean value of 50 kg ha-1 of N more than the second season (2012/2013).
Maize responded differentially between seasons, this could have happened because
after the stages that presented better variable means, a well distributed precipitation spell was
observed (very close to the nitrogen application in side-dress), while in other stages there was
a lack or small amount of precipitation that could have influenced the N uptake and
partitioning, through losses by volatilization or percolation in the soil, hindering the
hydrolysis of urea and its absorption. For urea application in dry soil conditions, 70% of the
applied nitrogen remains on the soil in the hydrolyzed form (SHERLOCK; SMITH, 1987).
Fertilizer N in grain content (GNCF) and nitrogen fertilizer use and efficiency (NFUE)
calculated from 15N data, were greater in the early applications (V4 = V6 > V8, V10, and
V12) p<0.0001.These variables presented lower values with the later N application, being the
V12 application lowest one for GNCF, presenting a mean of 20, respectively, for both GNCF
(kg ha-1) and NFUE (%), lower the N application at V4 stage. This could have happened
because the plants had a longer period to perform the process N of uptake from the soil,
nevertheless the weather conditions had a greater influence on this. Coelho (1987) reports that
the full implementation of N rates at planting provides higher maize biomass gain per kg of N
than the gains from the sidedressing N.
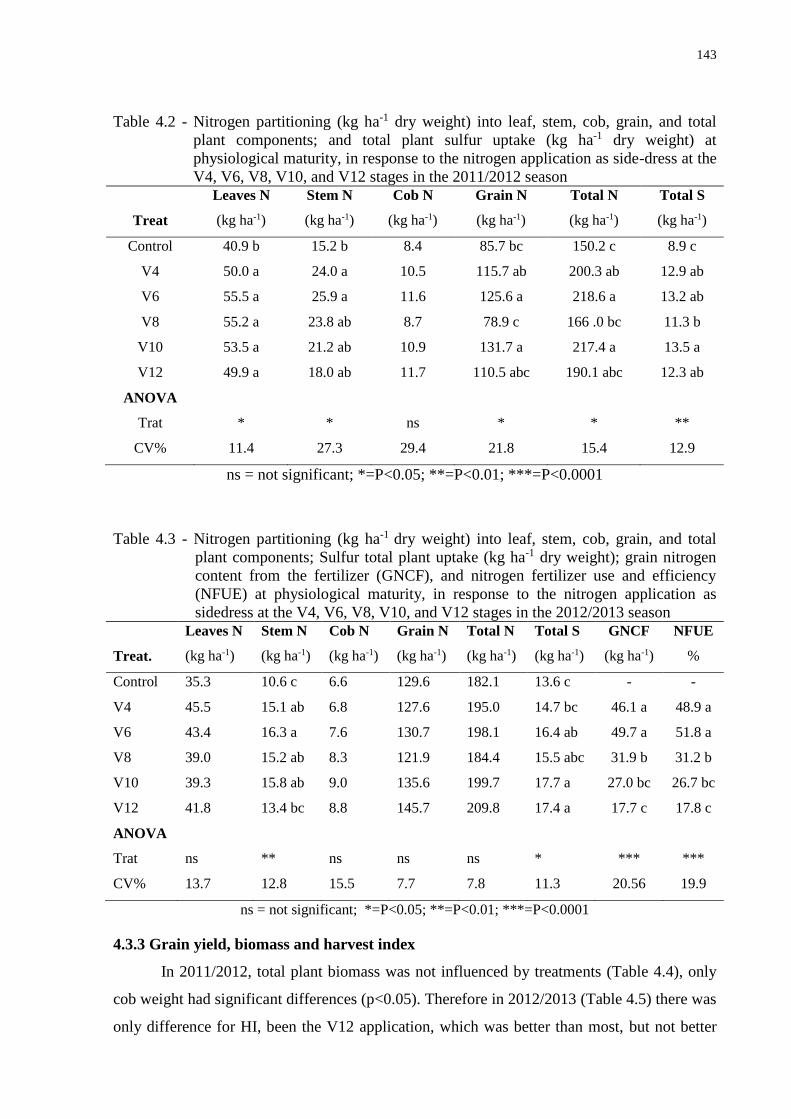
143
Table 4.2 - Nitrogen partitioning (kg ha-1 dry weight) into leaf, stem, cob, grain, and total
plant components; and total plant sulfur uptake (kg ha-1 dry weight) at
physiological maturity, in response to the nitrogen application as side-dress at the
V4, V6, V8, V10, and V12 stages in the 2011/2012 season
Treat
Leaves N
(kg ha-1)
Stem N
(kg ha-1)
Cob N
(kg ha-1)
Grain N
(kg ha-1)
Total N
(kg ha-1)
Total S
(kg ha-1)
Control 40.9 b 15.2 b 8.4 85.7 bc 150.2 c 8.9 c
V4 50.0 a 24.0 a 10.5 115.7 ab 200.3 ab 12.9 ab
V6 55.5 a 25.9 a 11.6 125.6 a 218.6 a 13.2 ab
V8 55.2 a 23.8 ab 8.7 78.9 c 166 .0 bc 11.3 b
V10 53.5 a 21.2 ab 10.9 131.7 a 217.4 a 13.5 a
V12 49.9 a 18.0 ab 11.7 110.5 abc 190.1 abc 12.3 ab
ANOVA
Trat * * ns * * **
CV% 11.4 27.3 29.4 21.8 15.4 12.9
ns = not significant; *=P<0.05; **=P<0.01; ***=P<0.0001
Table 4.3 - Nitrogen partitioning (kg ha-1 dry weight) into leaf, stem, cob, grain, and total
plant components; Sulfur total plant uptake (kg ha-1 dry weight); grain nitrogen
content from the fertilizer (GNCF), and nitrogen fertilizer use and efficiency
(NFUE) at physiological maturity, in response to the nitrogen application as
sidedress at the V4, V6, V8, V10, and V12 stages in the 2012/2013 season
Treat.
Leaves N
(kg ha-1)
Stem N
(kg ha-1)
Cob N
(kg ha-1)
Grain N
(kg ha-1)
Total N
(kg ha-1)
Total S
(kg ha-1)
GNCF
(kg ha-1)
NFUE
%
Control 35.3 10.6 c 6.6 129.6 182.1 13.6 c - -
V4 45.5 15.1 ab 6.8 127.6 195.0 14.7 bc 46.1 a 48.9 a
V6 43.4 16.3 a 7.6 130.7 198.1 16.4 ab 49.7 a 51.8 a
V8 39.0 15.2 ab 8.3 121.9 184.4 15.5 abc 31.9 b 31.2 b
V10 39.3 15.8 ab 9.0 135.6 199.7 17.7 a 27.0 bc 26.7 bc
V12 41.8 13.4 bc 8.8 145.7 209.8 17.4 a 17.7 c 17.8 c
ANOVA
Trat ns ** ns ns ns * *** ***
CV% 13.7 12.8 15.5 7.7 7.8 11.3 20.56 19.9
ns = not significant; *=P<0.05; **=P<0.01; ***=P<0.0001
4.3.3 Grain yield, biomass and harvest index
In 2011/2012, total plant biomass was not influenced by treatments (Table 4.4), only
cob weight had significant differences (p<0.05). Therefore in 2012/2013 (Table 4.5) there was
only difference for HI, been the V12 application, which was better than most, but not better

144
than V8. França et al. (1994) reported that the splittigs of N do not affect the efficiency of
nitrogen fertilizer or use of N from the soil and the results obtained were similar when they
applied up to 106 kg of N per ha in a single dose at the stage where the plant had 6 leaves or
subdivided twice, half at the 6-leaf stage and the other half at the stage where the plant had 10
leaves. These authors also observed that most of the N in the plant was accumulated until
flowering, reaching values of up to 93%. They concluded that the nitrogen sidedressing
should be made after seeding until the early flowering, a period during which the rate of
absorption is virtually linear. The N application efficiency prior to maize planting was studied
by many authors (SA, 1996; PAULETTI; COSTA, 2000; CERETTA et al., 2000). All of
them found little difference between the time of N application, but Ceretta et al. (2000)
warned that the early application can compromise yield in years of high rainfall, in the early
stage of crop development.
However, Jokela and Randall (1989) concluded that there was less response of maize
to N when it was applied at theV2 stage than at the V8 stage. Maize starts to take up N rapidly
at the middle vegetative growth period (V10) and the maximum rate of N uptake occur near to
silking (HANWAY, 1963; SETTIMI; MARANVILLE., 1998). Hence, application of N at V8
- V10 stage should be one of the best ways of supplying N to convene this high demand.

145
Table 4.4 - Plant biomass (t ha-1) of dry mass of leaf, stem, cob, grain, and total plant
components; grain yield (GY); and grain harvest index (HI) at physiological
maturity, in response to the nitrogen application as side-dress at the V4, V6, V8,
V10, and V12 stages in the 2011/2012 season
Treat.
Leaves
Weight
(t ha-1)
Stem
Weight
(t ha-1)
Cob
Weight
(t ha-1)
Total
Weight
(t ha-1)
GY
(t ha-1)
HI
%
Control 4.6 3.1 1.2 c 16.7 6.7 43.1
V4 5.3 4.1 1.5 ab 19.2 8.2 42.9
V6 5.3 4.2 1.6 ab 18.7 7.6 40.5
V8 4.8 3.6 1.3 bc 15.4 5.6 36.2
V10 5.1 3.8 1.6 a 20.0 9.4 47
V12 5.2 3.7 1.5 ab 18.9 8.4 44.1
ANOVA
Trat ns ns * ns ns ns
CV% 9.5 17.7 12.6 16 15.5 11.6
ns = not significant; *=P<0.05; **=P<0.01; ***=P<0.0001
Table 4.5 - Plant biomass (t ha-1) of dry mass of leaf, stem, cob, grain, and total plant
components; grain yield (GY); and grain harvest index (HI) at physiological
maturity, in response to the nitrogen application as side-dress at the V4, V6, V8,
V10, and V12 stages in the 2012/2013 season
Treat.
Leaves
Weight
(t ha-1)
Stem
Weight
(t ha-1)
Cob
Weight
(t ha-1)
Total
Weight
(t ha-1)
GY
(t ha-1)
HI
%
Control 4.6 3.2 1.5 19.9 11.1 53.1 b
V4 4.7 3.6 1.6 20.9 11.1 52.5 bc
V6 4.8 3.8 1.6 21.2 10.9 51.5 c
V8 4.4 3.2 1.6 20.0 10.1 53.9 ab
V10 4.6 3.4 1.6 20.9 10.6 53.4 b
V12 4.6 3.1 1.5 20.8 11.1 55.1 a
ANOVA
Trat ns ns ns ns ns **
CV% 8.2 10.7 7.2 6.9 5.8 2
ns = not significant; *=P<0.05; **=P<0.01; ***=P<0.0001.

146
4.3.4 Leaf pigments content, SPAD, and plant height
Early N application triggered the highest value for most variables in both seasons. In
2011/2012 (Table 4.6), lower values than in 2012/2013 (Table 4.7) were observed for all
variables. The differences were more expressive for the V14 stage than for V16 in most of
variables. However, SPAD had significant differences for these two stages in both seasons,
being greater from V4 to V10 than at theV14 stage and having only difference between N
fertilized treatments with control for V16 in 2011/2012. However in 2012/2013 differences
for SPAD were larger than in the first season. At the V14 sample stage, V6 was greater than
V8, V10, V12, and control. Similar results for V16 were found, however V6 presented higher
values for SPAD only in relation to V4, V12, and control. Plant high in 2011/2012 only was
different than the control, and in 2012/2013 only V4 presented differences in relation to the
control (V4 > Control). Chlorophyll a, b and total were also lower in the non-fertilized
treatment than in treatments with N. According Campostrini (1998) and Fancelli and
DouradoNeto (2004), chlorophyll a is the primary pigment composed of a magnesium ion in
the centralized ring porphyrin. This ring contains four nitrogen atoms. The molecule has one
hydrocarbon chain (hydrophobic), which has the maximum photon absorption in the blue
region corresponding to the wavelengths 428 to 660 nm. The chlorophyll b is an accessory
structure similar to the pigment chlorophyll, and in most plants, the ratio of chlorophyll is a /
b is around 3 to 1.14. Chlorophyll b has maximum absorption in the red region, from 452 and
641.8 nm.
4.3.5 Person correlations
SPAD, evaluated at V16, had a significant positive correlation with all pigments at
both stages evaluated in 2011/2012 (Table 4.8), this variable correlated positively and
significantly (both stages, V14 and V16) with the measured amount of total chlorophyll total,
evaluated in laboratory conditions. The strongest SPAD V16 correlation related to pigments
was with chlorophyll a in the V14 stage (0.61, p<0.05). In the same way SPAD at V14 sample
stage also presented strong correlation with other pigments, however this variable only had
correlation with the variables evaluated at the same stage. The strongest correlation for SPAD,
evaluated at V14, with pigments was with total chlorophyll (0.80, p<0.0001). Nevertheless, in
2012/2013 (Table 4.9) there were significant correlations for SPAD with pigments only
between SPAD/V14 with chlorophyll a and total (0.40, p<0.05, for both) at the same stage.

147
Even with less correlation between SPAD and pigments in the second season, we can consider
the efficiency of the SPAD measuring device to evaluate the actual amount of these pigments.
These results are in accordance with other studies. According to Piekielek et al. (1995) and
Dwyer et al., 1991, the indirect chlorophyll content in the leaf can be used to predict the
nutritional N level in plants, because the correlation with the amount of pigment was positive
in relation to N concentration. There is a strong positive relationship between the SPAD and
N concentration in the leaves of the plants, although this is more evident in the later growth
stages (ARGENTA et al., 2001), and there is a high correlation of SPAD with chlorophyll
content (DWYER et al., 1991; CIAMPITTI et al., 2012). A significant positive correlation
between SPAD/V16 and grain N content was found in the first season, but there was no
significant correlation between SPAD with gain yield, harvest index, and grain N content in
the second season (2012/2013). Chlorophyll b at V16 presented significant positive
correlation with Grain N content (0.61, p<0.05), GY (0.55, p<0.01), and total biomass (0.53,
p<0.05), also the chlorophyll total at V16 presented a positive correlation with GY (0.50,
p<0.05) and grain N content (0.48, p<0.05), however the chlorophylls a and total evaluated at
V14 presented a negative significant correlation with GY. Thus, the measurement of pigment
contents aiming to study nutritional crop conditions and predict grain production should be
performed after the V14 stage. There is a strong positive relationship between the SPAD
values with the N concentration in plant leaf, being more evident in the later growth stages
(ARGENTA et al., 2001).

148
Figure 4.1 - Days of development stages (moment of nitrogen application in side-dress) and
weather conditions (maximum air temperature and mean precipitation) for the
2011/2012 and 2012/2013 maize growing seasons at Tanquinho Farm,
Piracicaba, Sao Paulo, Brazil
4.4 Conclusions
There was a similar response to the treatments for grain yield, harvest index and total
plant biomass in both seasons. A higher amount of nitrogen was observed in all parts of the
plants in the 2011/2012 season in relation to the 2012/2013, influenced by the weather
conditions at the moment of nitrogen application.
Grain N content from the 15N fertilizer (GNCF) and nitrogen fertilizer use and
efficiency (NFUE) were greater in the early applications, at stages V4 and V6.

149
SPAD and leaf pigments were largely influenced by the evaluation stage. Evaluations
made at V14 presented more differences in treatments than at V16, and the N application in
the early stages caused higher values for most of the leaf variables (pigments and SPAD).
SPAD correlated positively and significantly with most pigment variables at V16, for
both seasons, mainly in the first season that this variable was correlated with all chlorophylls
and carotenoids, seeming to be an efficient instrument for the indirect evaluation of
chlorophylls and carotenoids in maize leaves at early growth stages. Also SPAD in V16
sample stage had a positive correlation with grain nitrogen content and total plant biomass.
Chlorophyll b at V16 (2012/2013) presented a significant and positive correlation with
grain N content, grain yield, and total biomass. Chlorophyll total at V16 also presented a
positive correlation with grain yield and grain N content, however the chlorophylls a and
total, evaluated at V14, presented a negative significant correlation with grain yield. So,
measurement of real pigment contents aiming to study the nutritional crop conditions and
predict grain production should be made after the V14 stage.

150
Table 4.6 - Leaf pigment contents (mg g-1 fresh leaf mass): chlorophyll a (CA), chlorophyll b (CB), chlorophyll total (CT), carotenoids (Carot),
SPAD, evaluated at V14 and V16 stages; and plant height (PH) at VT in response to the nitrogen application as side-dress at the V4,
V6, V8, V10, and V12 stages, in the 2011/2012 season
Treat.
CA
V14
(mg g-1)
CA
V16
(mg g-1)
CB
V14
(mg g-1)
CB
V16
(mg g-1)
CT
V14
(mg g-1)
CT
V16
(mg g-1)
Carot
V14
(mg g-1)
Carot
V16
(mg g-1)
SPAD
V14
SPAD
V16
PH
(cm)
Control 0.770 c 0.77 0.25 c 0.24 1.02 c 1.01 0.16 c 0.17 b 41.1 c 38.0 b 259.1 b
V4 1.130 a 0.88 0.46 a 0.32 1.59 a 1.20 0.23 a 0.21 ab 55.2 a 51.5 a 290.2 a
V6 1.050 ab 0.9 0.37 ab 0.30 1.42 ab 1.19 0.22 ab 0.19 ab 51.0 a 51.2 a 283.2 a
V8 1.04 ab 0.92 0.39 ab 0.31 1.43 ab 1.23 0.22 ab 0.22 a 52.1 a 50.1 a 282.0 a
V10 0.947 abc 0.9 0.31 bc 0.28 1.26 bc 1.19 0.20 abc 0.21 ab 50.2 ab 50.0 a 287.3 a
V12 0.880 bc 0.83 0.29 bc 0.26 1.17 bc 1.09 0.19 bc 0.20 ab 45.0 bc 48.5 a 281.0 a
ANOVA
Trat * ns ** ns * ns * * ** ** *
CV% 13.9 17.9 20.2 19.6 15.1 18.1 13.2 15.6 7.7 6.7 4.1 ns = not significant; *=P<0.05; **=P<0.01; ***=P<0.0001
Table 4.7 - Leaf pigment contents : chlorophyll a (CA), chlorophyll b (CB) , chlorophyll total (CT), carotenoids (Carot), SPAD, evaluated at the
V14 and V16 stages; and plant height (PH) at VT in response to the nitrogen application as side-dress at the V4, V6, V8, V10, and
V12 stages, in the 2012/2013 season
Treat.
CA
V14
(mg g-1)
CA
V16
(mg g-1)
CB
V14
(mg g-1)
CB
V16
(mg g-1)
CT
V14
(mg g-1)
CT
V16
(mg g-1)
Carot
V14
(mg g-1)
Carot
V16
(mg g-1)
SPAD
V14
SPAD
V16
PH
(cm)
Control 1.26 c 1.18 0.40 b 0.35 1.66 b 1.53 0.29 0.21 50.6 e 45.9 c 226.2 b
V4 1.44 ab 0.98 0.61 a 0.38 2.04 a 1.30 0.32 0.12 58.3 ab 51.8 bc 242.5 a
V6 1.43 ab 1.19 0.52 ab 0.39 1.95 a 1.58 0.32 0.23 58.8 a 61.5 a 236.9 ab
V8 1.53 a 0.98 0.51 ab 0.28 2.04 a 1.26 0.31 0.12 56.3 bc 55.5 ab 237.5 ab
V10 1.43 ab 1.11 0.52 ab 0.31 1.94 a 1.42 0.35 0.14 56.0 c 54.8 ab 231.9 ab
V12 1.36 bc 1.22 0.55 ab 0.36 1.91 a 1.58 0.31 0.23 53.0 d 53.8 b 236.2 ab
ANOVA
Trat ** ns * ns * ns ns ns *** ** ns
CV% 5 27.8 23.4 30.4 8.5 26.3 15.4 63.7 2.64 9.22 3.7
ns = not significant; *=P<0.05; **=P<0.01; ***=P<0.0001

151
Figure 4.2 - Weather conditions (maximum air temperature and mean precipitation) for the 2011/2012 and 2012/2013 maize growing seasons at
Tanquinho farm, Piracicaba, Sao Paulo, Brazil

152
Table 4.8 - Pearson correlation analysis for leaf pigment contents: chlorophyll a (CA), chlorophyll b (CB), chlorophyll total (CT), carotenoids
(Carot), SPAD, evaluated at V14 and V16 stages; total plant biomass (BM), grain harvest index (HI), grain yield (GY), and grain
nitrogen content (GNC) in response to the nitrogen application as side-dress at the V4, V6, V8, V10, and V12 stages, in the
2011/2012
GNC GY HI BM SPAD16 SPAD14 Carot16 Carot14 CT16 CT14 CB16 CB14 CA16 CA14
CA14 0.06 0.2 -0.30 0.44 0.61** 0.76*** 0.14 0.95*** 0.20 0.99*** 0.32 0.92*** 0.14 1.00
CA16 0.13 0.17 -0.20 0.11 0.42* 0.23 0.08 0.07 0.99*** 0.12 0.93*** 0.08 1.00
CB14 0.02 0.12 -0.22 0.05 0.52** 0.71*** 0.90*** 0.90*** 0.12 0.97*** 0.27 1.00
CB16 0.1 0.14 -0.19 0.07 0.50* 0.40 0.24 0.12 0.97*** 0.31 1.00
CT14 0.05 0.15 -0.25 0.05 0.59** 0.80*** 0.12 0.95*** 0.20 1.00
CT16 0.12 0.12 0.15 0.10 0.44* 0.23 0.84*** 0.13 1.00
Carot14 0.01 0.20 -0.30 0.04 0.60** 0.70*** 0.13 1.00
Carot16 0.01 0.05 -0.55 0.14 0.50** 0.4 1.00
SPAD14 0.33 0.34 -0.05 0.34 0.75*** 1.00
SPAD16 0.50* 0.30 -0 0.45* 1.00
BM 0.92*** 0.70*** 0.68 1.00
HI 0.80*** 0.50* 1.00
GY 0.60** 1.00
GNC 1.00
*=P<0.05; **=P<0.01; ***=P<0.0001

153
Table 4.9 - Pearson correlation analysis for leaf pigment contents: chlorophyll a (CA), chlorophyll b (CB), chlorophyll total (CT), carotenoids
(Carot), SPAD, evaluated at V14 and V16 stages; total plant biomass (BM), grain harvest index (HI), grain yield (GY), and grain
nitrogen content (GNC) in response to the nitrogen application as side-dress at the V4, V6, V8, V10, and V12 stages, in the
2012/2013
GNC GY HI BM SPAD16 SPAD14 Carot16 Carot14 CT16 CT14 CB16 CB14 CA16 CA14
CA14 -0.35 -0.61* -0.35 -0.22 0.23 0.40* -0.13 0.29 -0.18 0.83*** -0.22 0.41* -0.14 1.00
CA16 0.40 0.38 0.22 0.24 0.12 -0.10 0.85*** -0.004 0.97*** 0.23 0.59*** -0.25 1.00
CB14 0.06 -0.22 -0.16 0.13 0.05 0.3 -0.12 0.34 -0.12 0.84*** -0.11 1.00
CB16 0.61* 0.55** -0.01 0.53* 0.31 0.12 0.075*** 0.21 0.75*** -0.23 1.00
CT14 -0.16 -0.50* -0.30 -0.04 0.16 0.40* -0.15 0.34 -0.24 1.00
CT16 0.48* 0.50* 0.18 0.34 0.20 -0.05 0.90*** 0.05 1.00
Carot14 0.31 -0.14 -0.31 0.36 0.19 0.31 0.03 1.00
Carot16 0.50** 0.36 0.08 0.28 0.19 -0.05 1.00
SPAD14 -0.01 0.01 -0.38 0.34 0.47* 1.00
SPAD16 0.26 0.01 -0.06 0.36 1.00
BM 0.82*** 0.60* 0.00 1.00
HI 0.26 0.31 1.00
GY 0.60** 1.00
GNC 1.00
*=P<0.05; **=P<0.01; ***=P<0.0001

154
References
ANDRADE, F.H. Analysis of growth and yield of maize, sunflower and soybean grown at
Balcarce, Argentina. Field Crops Research, Amsterdam, v. 41, p. 1-12, 1995.
ARGENTA, G.; SILVA, P.R.F.; BORTOLINI, C.G.; FORSTHOFER, E.L.; STRIEDER,
M.L.; STEFANI, G.F. Relação entre teor de clorofila extraível e leitura do clorofilômetro na
folha de milho. In: CONGRESSO NACIONAL DE MILHO E SORGO, 23., 2000,
Uberlândia. Resumos... Uberlândia: ABMS, 2000. p. 197.
ARGENTA, G.; SILVA, P.R.F.; SANGOI, L. Arranjo de plantas em milho: análise do estado
da arte. Ciência Rural, Santa Maria, v. 31, n. 5, p. 1075-1084, 2001.
ARNON, I. Mineral nutrition of maize. Bern: International Potash Institute, 1975. 452 p.
BARBIE, A.; PROSSER, S.J. Automated analysis of light-element stable ispotope ratio mass
spectrometry. In: BOUTTON, T.W.; YAMASAKI, S. (Ed.). Mass spectrometry of soils.
New York: Marcel Decker, 1996. p. 1-46.
BASSO, C.J.; CERETTA, C.A. Manejo do nitrogênio no milho em sucessão a plantas de
cobertura de solo, sob plantio direto. Revista Brasileira de Ciência do Solo, Campinas,
v. 24, n. 4, p. 905-915, 2000.
CAMPOSTRINI, E. Fluorescência da clorofila a: considerações teóricas e aplicações
práticas. Campos dos Goytacazes: UENF, 1988. 34 p.
CANTARELLA, H. Calagem e adubação do milho. In: BÜLL, L.T.; CANTARELLA, H.
(Ed.). Cultura do milho: fatores que afetam a produtividade. Piracicaba: POTAFOS, 1993.
p. 148-196.
CANTARELLA, H.; RAIJ, B. van; CAMARGO, C.E.O. Cereais. In: RAIJ, B.van;
CANTARELLA, H.; QUAGGIO, J.A.; FURLANI, A.M.C. Recomendações de adubação e
calagem para o Estado de São Paulo. 2. ed. Campinas: IAC. 1997. p. 45-71 (Boletim
Técnico, 100).
CERETTA, C.A.; BASSO, C J.; FLECHA, A.M.T.; PAVINATO, P.S.; VIEIRA, F.C.B.;
MAI, M.E.M. Manejo da adubação nitrogenada na sucessão aveia preta/milho, no sistema
plantio direto. Revista Brasileira de Ciência do Solo, Vicosa, v. 26, n. 1, p. 163-171, 2002.
CIAMPITTI, I.A.; ZHANG, H.; FRIEDEMANN, P; VYN, T.J. Potential physiological
frameworks for mid-season field phenotyping of final plant nitrogen uptake, nitrogen use
efficiency, and grain yield in maize. Crop Sciense, Madison, v. 52, p. 2728-2742, 2012.
COELHO, A.M. Balanço de nitrogênio (15 N) na cultura do milho (Zea mays L.) em um
Latossolo Vermelho Escuro fase cerrado. 1987. 142 p. Dissertação (Mestrado em Solos e
Nutrição de Plantas) – Escola Superior de Agricultura de Lavras, Lavras, 1987.
DWYER, L.M.; TOLLENAAR, M.; HOUWING, L. A nondestructive method to monitor leaf
greenness in corn. Canadian Journal of Plant Science, Ottawa, v. 71, p. 505-509, 1991.

155
DWYER, L.M.; ANDERSON, A.M.; MA, B.L.; STEWART, D.W.; TOLLENAAR, M.;
GREGORICH, E. Quantifying the nonlinearity in chlorophyll meter response to corn leaf
nitrogen concentration. Canadian Journal of Plant Science, Ottawa, v. 75, p. 179-182, 1995.
FANCELLI, A.L. Nutrição e adubação do milho. Piracicaba: ESALQ, 2000. 43 p.
FANCELLI, A.L.; DOURADO NETO, D. Produção de milho. 2. ed. Guaíba: Agropecuária,
2004. 360 p.
FRANÇA, G.E.; COELHO, A.M.; RESENDE, M.; BAHIA FILHO, A.F.C. Parcelamento da
adubação nitrogenada em cobertura na cultura do milho irrigado. In: EMBRAPA. Centro
Nacional de Pesquisa de Milho e Sorgo. Relatório técnico anual do Centro Nacional de
Pesquisa de Milho e Sorgo: 1992-1993. Sete Lagoas, 1994. p. 28-29.
GAVA, G.J.C.; TRIVELIN, P.C.O.; OLIVEIRA, M.W.; HEINRICHS, R.; SILVA, M.A.
Balanço do nitrogênio da uréia (15N) no sistema solo-planta na implantação da semeadura
direta na cultura do milho. Bragantia, Campinas, v. 65, p. 477-486, 2006.
HANWAY, J.J. Growth stages of corn (Zea mays L.). Agronomy Journal, Madison, v. 55,
p. 487-492, 1963.
JOKELA, W.E.; RANDALL, G.W. Corn yield and residual soil nitrate as affected by time
and rate of nitrogen application. Agronomy Journal, Madison, v. 81, p. 720-726, 1989.
MARENCO, R.A.; LOPES, N.F. Fisiologia vegetal: fotossíntese, respiração, relações
hídricas e nutrição mineral. 2. ed. Viçosa: UFV, 2005. 439 p.
MARKWELL, J.; OSTERMAN, J.C.; MITCHELL, J.L. Calibration of the Minolta SPAD-
502 leaf chlorophyll meter. Photosynthesis Research, Dordrecht, v. 46, p. 467-472, 1995.
MINOLTA CAMERA. Manual for chlorophyll meter SPAD 502. Osaka: Radiometric
Instruments Divisions, 1989. 22 p.
MORAN, R.; PORATH, D. Chlorophyll determination in intact tissues using n,n
dimethylformamide. Plant Physiology, Rockville, v. 65, p. 478-479, 1980.
NEPTUNE, A.M.L.; CAMPANELLI, A. Efeitos de épocas e modo de aplicação do sulfato de
amônio - 15 N, fósforo - 32 P, na quantidade e teores de N, P e K na planta e na folha do
milho, na produção, na quantidade de proteína e eficiência do nitrogênio do fertilizante
convertido em proteína. Anais da Escola Superior de Agricultura “Luiz de Queiroz”,
Piracicaba, v. 37, n. 2, p. 1105-1143, 1980.
PAULETTI, V.; COSTA, L.C. Época de aplicação de nitrogênio no milho cultivado em
sucessão à aveia preta no sistema plantio direto. Ciência Rural, Santa Maria, v. 30, n. 4,
p. 599-603, 2000.
PESTANA, M.; DAVID, M.; VARENNES, A.; ABADIA, J.; FARIA, E.A. Responses of
“Newhall” oranges trees to iron deficiency in hidroponics: effects on leaf chlorophyll,
photosynthetic efficiency, and root ferric chelate reductase activity. Journal of Plant
Nutrition, New York, v. 24, p. 1609-1620, 2001.
156
PIEKIELEK, W.P.; FOX, R.H. Use of a chlorophyll meter to predict side dress nitrogen
requirements for maize. Agronomy Journal, Madison, v. 84, n. 1, p. 59-65, 1992.
PIEKIELEK, W.P.; FOX, R.H.; TOTH, J.D.; MACNEAL, K.E. Use of a chlorophyll meter at
the early dent stage of corn to evaluate N sufficiency. Agronomy Journal, Madison, v. 87,
n. 3, p. 403-408, 1995.
PIONNER. Hibridos de milho: 30F35HR. Santa Cruz do Sul, 2014. Disponivel em:
<http://www.pioneersementes.com.br/DownloadCenter/Catalogo-De-Produtos-Milho-
Safrinha-2014.pdf>. Acesso em: 20 jan. 2015.
RITCHIE, S.W.; HANWAY, J.J.; BENSON, G.O. Como a planta de milho se desenvolve.
Informações Agronômicas, Piracicaba, n. 103, p. 1-11, 2003.
SÁ, J.C.M. de. Manejo de nitrogênio na cultura do milho no sistema plantio direto. Passo
Fundo: Aldeia Norte, 1996. 23 p.
SAS INSTITUTE. SAS/STAT 9.1: user´s guide. Cary, 2004.
SETTIMI, J.R.; MARANVILLE, J.W. Carbon dioxide assimilation efficiency of maize leaves
under nitrogen stress at different stages of plant development. Soil Science and Plant
Analysis, Philadelphia, v. 29, p. 777-792, 1998.
SOUSA, D.M.G. de; LOBATO, E. Calagem e adubação para culturas anuais e semiperenes.
In: ______. (Ed.). Cerrado: correção do solo e adubação. Planaltina: Embrapa Cerrados,
2004. p. 283‐315.
TRIVELIN, P.C.O.; OLIVEIRA, M.W.; VITTI, A.C.; GAVA, G.J.C.; BENDASSOLLI, J.A.
Perdas do nitrogênio da uréia no sistema solo-planta em dois ciclos de cana-de-açúcar.
Pesquisa Agropecuária Brasileira, Brasília, v. 37, p. 193-201, 2002.

157
5 GENERAL DISCUSSION
Problems caused to agriculture by drought weather conditions are and will be always
present in the world, with more or less intensity. In addition to drought, the other
environmental biotic and, also, abiotic stresses together are significant factors that decrease
agricultural production. Therefore, studies on crop tolerance related to these stresses and on
higher efficiency in the use of environmental resources are extremely important to maintain
and increase food production for the growing world population.
5.1 Implications for Agriculture and Science
We can affirm that the drought is a constant problem in the agriculture with large
influence in the maize grain production. In this way, the silking antheses interval (ASI) or the
period of development of a genotype is very important to decide the best planting date aiming
to avoid drought weather conditions in the most sensitive plant development stages, such as
the flowering period.
Some maize genotypes present shorter or longer ASI than the other, so it is important
to know these periods for each genotype and to perform planting at the best time to avoid the
drought conditions.
In Chapter 2 we evaluated the possible traits that govern the nutrient uptake and
concentrations between drought and non-drought tolerant hybrids and their influence in grain
productivity under different management treatments. In this study we could observe that
shorter periods between anthesis and silking and accumulation of more macro-nutrients in the
stover, during the dry season, could be some of the mechanisms used by drought tolerant
hybrids in achieving greater plant biomass production and possible grain yield. However, all
hybrids responded similarly in grain yield to plant density and N rate treatments in the dry or
more normal weather year.
In Chapter 3 we investigated the physiological and yield responses of comparable-
maturity drought and non-drought tolerant hybrids to varied plant density and N rates. We
also evaluated the leaf photosynthesis and transpiration rates of hybrids across the growing
season in response to varied plant density and N rate treatments. We observed that there was
no evidence that the drought tolerant hybrids were any different than the non-drought tolerant
in their response to N fertilizer or to plant density. However, we observed that lower LAI and
158
higher photosynthesis and transpiration present in the drought tolerant hybrids could be a
drought tolerant mechanism used by these hybrids to improve their water use efficiency.
For the two Chapters (2 and 3) we hypothesized that the drought tolerant hybrids
could be any different in the nitrogen uptake and grain productivity related to their
counterparts with similar maturity. However, the drought tolerant did not show any merit in
comparison to the non-drought tolerant related to grain yield in the dry or more normal
weather condition seasons. In view of that, future drought tolerant hybrids, developed with
biotechnology or transgenic hybrids, could present more advantages in comparison to their
counterparts with less drought tolerance.
In Chapter 4 we evaluated methods for crop analysis, SPAD and chlorophyll and
carotenoid contents in the maize leaves aiming to verify maize crop conditions in response to
environmental factors, such nitrogen fertilization. We also studied the response of maize to
nitrogen fertilization in different stages for side-dress fertilizer applications. We concluded
that the SPAD device can be used as an efficient method to evaluate the maize nitrogen status
in the early growth stages with a strong correlation with chlorophylls, carotenoids and grain
yield, mainly after the V16 sample stage. In this study, there was no difference for grain yield
in response to the treatments with nitrogen application in different growth stages in side-dress.

159
APPENDICES

160

161
Table 5.1 - Plant heights, and stalk diameters for all hybrids (Hybrid 1 = AQUAmaxTM
P1151, Hybrid 2 = P1162, Hybrid 3 = AQUAmaxTM P1498, and Hybrid 4 =
33D49), both densities (PD1 = 79,000, PD2 = 104,000 pl ha−1), and all N rates
(Nr1 = 0 kg N ha-1, Nr2 = 134 kg N ha-1, Nr3 = 202 kg N ha-1, Nr4 = 269 kg N
ha-1) in 2012
Height (cm) Stalk Diameter (mm)
V5 V10 V15 R1 V10 V15 R1 R3 R4
Hybrid
Hyb 1 47 135 143 174 26.4 a 24.1 a 23.5 ab 22.6 a 22.2 a
Hyb 2 48 136 129 151 25.3 ab 22.6 b 21.4 b 21.0 b 20.4 b
Hyb 3 48 132 128 164 23.7 b 22.5 b 21.9 b 21.3 b 20.9 b
Hyb 4 45 131 127 178 24.3 b 23.5 ab 22.6 ab 21.6 ab 21.3 ab
PD
PD 1 47 135 136 a 171 a 26.0 a 24.2 a 23.4 a 22.5 a 22.1 a
PD 2 47 132 128 b 162 b 23.9 b 22.1 b 21.4 b 20.8 b 20.3 b
Nr
Nr 1 46 133 128 166 24.7 22.7 b 21.9 b 21.4 21
Nr 2 47 133 134 169 24.8 23.0 ab 22.3 ab 21.6 21
Nr 3 47 136 132 166 25.2 23.6 a 22.7 a 22 21.4
Nr 4 47 133 133 167 25 23.4 ab 22.6 ab 21.6 21.5
Anova
Hyb ns ns ns ns * * ** ** *
PD ns ns ** ** *** *** *** *** ***
Nr ns ns ns ns ns * * ns ns
Hyb x PD ns * * * ns ns * ns *
Hyb xNr ns ns ns ns ns ns ns ns ns
PD x Nr ns ns ns ns ns ns ns ns ns
Hyb x PD x Nr ns ns ns ns ns ns ns ns ns
ns = not significant; *=P<0.05; **=P<0.01; ***=P<0.0001

162
Table 5.2 - Plant heights, and stalk diameters for all hybrids (Hybrid 1 = AQUAmaxTM
P1151, Hybrid 2 = P1162, Hybrid 3 = AQUAmaxTM P1498, and Hybrid 4 =
33D49), both densities (PD1 = 78,000, PD2 = 99,000 pl ha−1), and all N rates
(Nr1 = 0 kg N ha-1, Nr2 = 134 kg N ha-1, Nr3 = 202 kg N ha-1, Nr4 = 269 kg N
ha-1) in 2013
Height (cm) Stalk Diameter (mm)
V5 V10 V15 V10 V12 V14
Hybrid
Hyb 1 64 b 133 a 222 b 24.7 a 24.0 a 25.6 a
Hyb 2 70 a 137 a 216 b 24.4 a 23.4 ab 25.7 a
Hyb 3 63 b 128 b 229 a 23.6 b 23.2 b 23.5 b
Hyb 4 62 b 126 b 227 a 24.3 a 23.8 ab 25.3 a
PD
PD 1 64 130 226 25.1 a 24.7 a 26.0 a
PD 2 65 132 222 23.4 b 22.5 b 24.2 b
Nr
Nr 1 63 119 b 196 b 22.7 b 21.1 c 23.2 c
Nr 2 65 133 a 230 a 24.5 a 24.0 b 25.2 b
Nr 3 65 135 a 234 a 25.0 a 25.0 a 25.1 b
Nr 4 65 136 a 235 a 25.0 a 25.0 a 26.7 a
Anova
Hyb ** ** * ** * **
PD ns ns ns ** ** **
Nr ns ** ** ** ** **
Hyb x PD ns ns ns * ns ns
Hyb xNr ns ns ns ns ns ns
PD x Nr ns ns ns ns ns ns
Hyb x PD
x Nr ns ns ns ns ns ns
ns = not significant; *=P<0.05; **=P<0.01; ***=P<0.0001

163
Table 5.3 - Mean separation test for plant height (cm) at V10, V15, and R1 growth stages, and stalk diameter (mm) at R1 and R4 growth stages,
for the factorial Hybrid x PD for all four hybrids (Hybrid 1 = AQUAmaxTM P1151, Hybrid 2 = P1162, Hybrid 3 =AQUAmaxTM
P1498, Hybrid 4 = 33D49) and each plant density level (PD1 = 79,000; and PD2 = 104,000 pl ha-1) in 2012
Height V10 (cm) Height V15 (cm) Height R1 (cm) Stalk R1 (mm) Stalk R4 (mm)
Hybrid PD1 PD2
PD1 PD2
PD1 PD2
PD1 PD2
PD1 PD2
Hyb 1 127.2 Ba 135.1 Aa
135.5 Aa 140.4 Aa
164.4 Ba 170.9 Aa
24.1 Aa 23.0 Ab
22.6 Aa 21.7 Ab
Hyb 2 145.4 Aa 131.7 Ab
141.6 Aa 125.7 Bb
165.3 Ba 145.8 Bb
22.7 Ba 20.0 Cb
21.5 Ba 19.2 Cb
Hyb 3 134.5 ABa 131.1 Aa
131.7 Aa 124.7 Ba
168.4 Ba 161.4 Aa
22.7 Ba 21.2 Bb
21.7 Ba 20.1 Bb
Hyb 4 133.2 Ba 131.0 Aa 135.2 Aa 119.8 Bb 187.0 Aa 170.8 Ab 24.0 Aa 21.3 Bb 22.6 Aa 20.3 Bb
Different lower case letter in the rows: the same hybrid differs in Plant densities. Different uppercase letter in the columns: the hybrids
differ in the same PD
Table 5.4 - Mean separation test for ZHI (Zink harvest index), for the factorial Hybrid x N rate, and Stalk V10 (Stalk diameter at V10 growth
stage), for the factorial Hybrid x Plant density (PD), for all four hybrids (Hybrid 1 = AQUAmaxTM P1151, Hybrid 2 = P1162, Hybrid
3 =AQUAmaxTM P1498, Hybrid 4 = 33D49), each plant density level (PD1 = 78,000; and PD2 = 99,000 pl ha-1), and four N rates
(Nr1 = 0, Nr2 = 134, Nr3 = 202, and Nr4 = 269 kg ha−1), respectively, in 2013
ZHI
Stalk V10 (mm)
Hybrid
Nr1 Nr2 Nr3 Nr4
PD1 PD2
Hyb 1
0.451 Ab 0.605 Aa 0.608 BCa 0.647 Aa
26.07 Aa 23.45 Ab
Hyb 2
0.523 Ab 0.605 Aab 0.534 Cb 0.620 Aa
25.49 Aa 23.36 Ab
Hyb 3
0.455 Ab 0.634 Aa 0.691 Aa 0.689 Aa
24.19 Ba 23.04 Ab
Hyb 4 0.371 Bb 0.560 Ab 0.644 ABa 0.616 Aab
24.83 Ba 23.41 Ab
Different lower case letter in the rows: the same Hybrid differs in the all N rates or Plant densities. Different uppercase letter in the
columns: hybrid treatments differ in the same N rate or PD

164
Table 5.5 - Mean SPAD for all hybrids (Hybrid 1 = AQUAmaxTM P1151, Hybrid 2 = P1162,
Hybrid 3 = AQUAmaxTM P1498, and Hybrid 4 = 33D49) at both densities (PD1 =
79,000 pl ha-1, PD2 = 104,000 pl ha-1) and at all N rates (Nr1 = 0 kg N ha-1, Nr2
= 134 kg N ha-1, Nr3 = 202 kg N ha-1, Nr4 = 269 kg N ha-1) in 2012
SPAD
V10 V12 V15 R1 R3 R4 R5
Hybrid
Hyb 1 55.3 53.9 50.8 48.4 49.7 b 47.9 ab 39.4
Hyb 2 51.9 49 48.2 45.9 48.4 b 45.2 b 37.6
Hyb 3 54.3 53.5 49.6 49.8 50.0 ab 47.2 ab 42.1
Hyb 4 56.4 53.4 50.1 49.4 53.5 a 51.3 a 45.5
PD
PD 1 55.0 a 53.6 a 50.7 a 49.3 a 51.8 a 49.1 a 41.7
PD 2 53.9 b 51.4 b 48.7 b 47.4 b 49.0 b 46.0 b 40.6
Nr
Nr 1 53.8 51.9 b 48.1 b 46.6 b 48.0 b 43.9 b 35.8 b
Nr 2 54.6 - 48.8 ab 48.8 a 50.8 a 48.7 a -
Nr 3 54.8 53.0 a 50.1 a 48.9 a 50.9 a 49.0 a 46.5 a
Nr 4 54.7 - 50.7 a 49.2 a 51.9 a 50.1 a -
Anova
Hyb ns ns ns ns * * ns
PD ** *** ** ** *** *** ns
Nr ns * ** ** *** *** ***
Hyb x PD ns ns ns ns ns ns ns
Hyb xNr * ns ns ns ns ns ns
PD x Nr ns ns ns ns ns ns ns
Hyb x PD x Nr ns ns ns ns ns ns ns
ns = not significant; *=P<0.05; **=P<0.01; ***=P<0.0001

165
Table 5.6 - Mean SPAD for all hybrids (Hybrid 1 = AQUAmaxTM P1151, Hybrid 2 = P1162,
Hybrid 3 = AQUAmaxTM P1498, and Hybrid 4 = 33D49) at both densities (PD1 =
78,000, PD2 = 99,000 pl ha−1) at all N rates (Nr1 = 0 kg N ha-1, Nr2 = 134 kg N
ha-1, Nr3 = 202 kg N ha-1, Nr4 = 269 kg N ha-1) in 2013
SPAD
V10 V12 V14
Hybrid
Hyb 1 55.0 b 46.3 a 51.7 a
Hyb 2 50.5 d 43.6 b 49.2 b
Hyb 3 53.4 c 47.5 a 51.8 a
Hyb 4 56.3 a 44.6 b 50.1 a
PD
PD 1 54.8 a 46.6 a 52.5 a
PD 2 52.8 b 44.4 b 49.0 b
Nr
Nr 1 46.5 b 37.9 b 39.2 c
Nr 2 55.8 a 47.3 a 54.4 ab
Nr 3 56.1 a 48.4 a 53.7 b
Nr 4 56.8 a 48.4 a 55.6 a
Anova
Hyb ** ** **
PD ** ** **
Nr ** ** **
Hyb x PD ns ns ns
Hyb xNr ns ns ns
PD x Nr ns ns ns
Hyb x PD x Nr ns ns ns
ns = not significant; *=P<0.05; **=P<0.01; ***=P<0.0001

166
Figure 5.1 - Anthesis-silking interval (ASI) (days) for the factorial Hybrid x PD at
physiological maturity for all maize hybrids (Hybrid 1 = AQUAmaxTM P1151,
Hybrid 2 = P1162, Hybrid 3 = AQUAmaxTM P1498, Hybrid 4 = 33D49, and
Hybrid 5 = P1184) grown at two plant densities (PD1=79,000, PD2=104,000
pl ha−1) and four N rates (Nr1 = 0, Nr2 = 134, Nr3 = 202, and Nr4 = 269 kg
ha−1) in 2012
Figure 5.2 - Total plant Mn (kg ha-1) for the factorial Hybrid x PD x N rate at physiological
maturity for all four hybrids (Hybrid 1 = AQUAmaxTM P1151, Hybrid 2 =
P1162, Hybrid 3 =AQUAmaxTM P1498, Hybrid 4 = 33D49), each plant density
level (PD1 = 78,000; and PD2 = 99,000 pl ha-1), and all four N rate levels (Nr1 =
0, Nr2 = 134, Nr3 = 202, and Nr4 = 269 kg N sidedress ha-1), in 2013

167
Table 5.7 - Zinc partitioning (kg ha-1 dry weight) into grain, cob, and stover components, and
zinc harvest index (ZnHI) at physiological maturity for all maize hybrids (Hybrid
1 = AQUAmaxTM P1151, Hybrid 2 = P1162, Hybrid 3 = AQUAmaxTM P1498,
Hybrid 4 = 33D49) grown at two plant densities (PD1 = 79,000, PD2 = 104,000
pl ha−1) and four N rates (Nr1 = 0, Nr2 = 134, Nr3 = 202, and Nr4 = 269 kg ha−1)
in 2012
Grain Zn Cob Zn Stover Zn Total Zn ZnHI
(kg ha-1) (kg ha-1) (kg ha-1) (kg ha-1)
Hybrid
Hyb 1 0.09 c 0.02 0.22 a 0.34 c 0.26 c
Hyb 2 0.11 c 0.04 0.19 b 0.35 c 0.33 b
Hyb 3 0.16 b 0.05 0.24 a 0.45 a 0.34 b
Hyb 4 0.19 a 0.03 0.18 b 0.40 b 0.48 a
PD
PD 1 0.13 0.03 0.21 0.38 0.34
PD 2 0.15 0.04 0.21 0.4 0.36
Nr
Nr 1 0.12 0.03 0.17 c 0.32 c 0.38
Nr 2 0.13 0.04 0.21 b 0.40 b 0.34
Nr 3 0.14 0.03 0.22 ab 0.40 b 0.34
Nr 4 0.16 0.04 0.24 a 0.44 a 0.34
Anova
Hyb ** na ** ** **
PD ns na ns ns ns
Nr ns na ** ** ns
Hyb x PD ** na * * **
Hyb xNr ns na ns * ns
PD x Nr ns na ns ns ns
Hyb x PD x Nr ** na ns ns **
ns = not significant; na = not available; *=P<0.05; **=P<0.01; ***=P<0.0001.
Cob nutrient concentration for the same treatment in reps 2 and 3 was estimated from rep 1
data but adjusted for each individual plot cob weight so statistical analysis was not possible

168
Table 5.8 - Zinc partitioning (kg ha-1 dry weight) into grain, cob, and stover components, and
zinc harvest index (ZnHI) at physiological maturity for all maize hybrids (Hybrid
1 = AQUAmaxTM P1151, Hybrid 2 = P1162, Hybrid 3 = AQUAmaxTM P1498,
Hybrid 4 = 33D49) grown at two plant densities (PD1 = 79,000, PD2 = 104,000 pl
ha−1) and four N rates (Nr1 = 0, Nr2 = 134, Nr3 = 202, and Nr4 = 269 kg ha−1) in
2013
Grain Zn Cob Zn Stover Zn Total Zn ZnHI
(kg ha-1) (kg ha-1) (kg ha-1) (kg ha-1)
Hybrid
Hyb 1 0.18 a 0.01 0.11 0.32 a 0.58 b
Hyb 2 0.19 a 0.03 0.12 0.34 a 0.57 b
Hyb 3 0.19 a 0.01 0.1 0.31 a 0.62 a
Hyb 4 0.15 b 0.01 0.1 0.27 b 0.55 b
PD
PD 1 0.18 0.02 0.11 0.31 0.58
PD 2 0.18 0.02 0.11 0.31 0.57
Nr
Nr 1 0.12 c 0.02 0.13 a 0.27 c 0.45 c
Nr 2 0.17 b 0.02 0.10 b 0.29 bc 0.60 b
Nr 3 0.19 b 0.02 0.11 b 0.32 ab 0.62 ab
Nr 4 0.23 a 0.02 0.11 b 0.36 a 0.64 a
Anova
Hyb * na ns ** **
PD ns na ns ns ns
Nr ** na ** ** **
Hyb x PD ns na ns ns ns
Hyb xNr ns na ns ns **
PD x Nr ns na ns ns ns
Hyb x PD x Nr ns na ns ns ns
ns = not significant; na = not available; *=P<0.05; **=P<0.01; ***=P<0.0001.
Cob nutrient concentration for the same treatment in reps 2 and 3 was estimated from rep 1
data but adjusted for each individual plot cob weight so statistical analysis was not possible

169
Table 5.9 - Iron partitioning (kg ha-1 dry weight) into grain, cob, and stover components, and
iron harvest index (FeHI) at physiological maturity for all maize hybrids (Hybrid
1 = AQUAmaxTM P1151, Hybrid 2 = P1162, Hybrid 3 = AQUAmaxTM P1498,
Hybrid 4 = 33D49) grown at two plant densities (PD1 = 79,000, PD2 = 104,000
pl ha−1) and four N rates (Nr1 = 0, Nr2 = 134, Nr3 = 202, and Nr4 = 269 kg ha−1)
in 2012
Grain Fe Cob Fe Stover Fe Total Fe FeHI
(kg ha-1) (kg ha-1) (kg ha-1) (kg ha-1)
Hybrid
Hyb 1 0.07 c 0.01 1.25 1.32 0.06 c
Hyb 2 0.08 c 0.01 1.25 1.35 0.05 c
Hyb 3 0.13 b 0.01 1.3 1.43 0.10 b
Hyb 4 0.16 a 0.01 1.17 1.34 0.13 a
PD
PD 1 0.11 0.01 1.2 1.31 0.08
PD 2 0.11 0.01 1.3 1.41 0.09
Nr
Nr 1 0.1 0.01 1.27 1.38 0.08
Nr 2 0.11 0.01 1.28 1.4 0.09
Nr 3 0.11 0.01 1.27 1.4 0.08
Nr 4 0.11 0.01 1.15 1.3 0.1
Anova
Hyb ** na ns ns **
PD ns na ns ns ns
Nr ns na ns ns ns
Hyb x PD ns na ns ns ns
Hyb xNr ns na ns ns ns
PD x Nr ** na ns ns ns
Hyb x PD x Nr ns na ns ns ns
ns = not significant; na = not available; *=P<0.05; **=P<0.01; ***=P<0.0001.
Cob nutrient concentration for the same treatment in reps 2 and 3 was estimated from rep 1
data but adjusted for each individual plot cob weight so statistical analysis was not possible

170
Table 5.10 - Iron partitioning (kg ha-1 dry weight) into grain, cob, and stover components, and
iron harvest index (FeHI) at physiological maturity for all maize hybrids (Hybrid
1 = AQUAmaxTM P1151, Hybrid 2 = P1162, Hybrid 3 = AQUAmaxTM P1498,
Hybrid 4 = 33D49) grown at two plant densities (PD1 = 79,000, PD2 = 104,000
pl ha−1) and four N rates (Nr1 = 0, Nr2 = 134, Nr3 = 202, and Nr4 = 269 kg ha−1)
in 2013
Grain Fe Cob Fe Stover Fe Total Fe FeHI
(kg ha-1) (kg ha-1) (kg ha-1) (kg ha-1)
Hybrid
Hyb 1 0.15 0.01 0.77 b 0.93 b 0.16 bc
Hyb 2 0.14 0.01 0.89 a 1.05 a 0.13 c
Hyb 3 0.16 0.01 0.55 c 0.72 c 0.23 a
Hyb 4 0.13 0.01 0.56 c 0.69 c 0.19 b
PD
PD 1 0.14 0.01 0.65 b 0.80 b 0.18
PD 2 0.15 0.01 0.74 a 0.90 a 0.17
Nr
Nr 1 0.07 c 0.01 0.67 0.76 b 0.09 c
Nr 2 0.15 b 0.01 0.73 0.89 a 0.18 b
Nr 3 0.17 ab 0.01 0.72 0.90 a 0.20 b
Nr 4 0.19 a 0.01 0.65 0.85 ab 0.24 a
Anova
Hyb ns na ** ** **
PD ns na * ** ns
Nr ** na ns * **
Hyb x PD ns na ns ns ns
Hyb xNr ns na ns ns ns
PD x Nr ns na ns ns ns
Hyb x PD x Nr ns na ns ns ns
ns = not significant; na = not available; *=P<0.05; **=P<0.01; ***=P<0.0001.
Cob nutrient concentration for the same treatment in reps 2 and 3 was estimated from rep 1
data but adjusted for each individual plot cob weight so statistical analysis was not possible

171
Table 5.11 - Manganese partitioning (kg ha-1 dry weight) into grain, cob, and stover
components, and manganese harvest index (MnHI) at physiological maturity
for all maize hybrids (Hybrid 1 = AQUAmaxTM P1151, Hybrid 2 = P1162,
Hybrid 3 = AQUAmaxTM P1498, Hybrid 4 = 33D49) grown at two plant
densities (PD1 = 79,000, PD2 = 104,000 pl ha−1) and four N rates (Nr1 = 0,
Nr2 = 134, Nr3 = 202, and Nr4 = 269 kg ha−1) in 2012
Grain Mn Cob Mn Stover Mn Total Mn MnHI
(kg ha-1) (kg ha-1) (kg ha-1) (kg ha-1)
Hybrid
Hyb 1 0.025 c 0.008 0.582 0.618 0.05 b
Hyb 2 0.029 c 0.013 0.599 0.638 0.04 b
Hyb 3 0.048 b 0.018 0.653 0.720 0.07 a
Hyb 4 0.056 a 0.012 0.647 0.715 0.08 a
PD
PD 1 0.038 0.011 0.615 0.665 0.06
PD 2 0.041 0.014 0.626 0.681 0.06
Nr
Nr 1 0.034 0.012 0.464 c 0.509 c 0.07
Nr 2 0.041 0.012 0.608 b 0.662 b 0.07
Nr 3 0.039 0.012 0.686 ab 0.738 ab 0.05
Nr 4 0.044 0.016 0.724 a 0.784 a 0.06
Anova
Hyb ** na ns ns **
PD ns na ns ns ns
Nr ns na ** ** ns
Hyb x PD ns na ns ns ns
Hyb xNr ns na ns ns ns
PD x Nr ns na ns ns ns
Hyb x PD x Nr * na ns ns ns
ns = not significant; na = not available; *=P<0.05; **=P<0.01; ***=P<0.0001.
Cob nutrient concentration for the same treatment in reps 2 and 3 was estimated from rep 1
data but adjusted for each individual plot cob weight so statistical analysis was not possible

172
Table 5.12 - Manganese partitioning (kg ha-1 dry weight) into grain, cob, and stover
components, and manganese harvest index (MnHI) at physiological maturity
for all maize hybrids (Hybrid 1 = AQUAmaxTM P1151, Hybrid 2 = P1162,
Hybrid 3 = AQUAmaxTM P1498, Hybrid 4 = 33D49) grown at two plant
densities (PD1 = 79,000, PD2 = 104,000 pl ha−1) and four N rates (Nr1 = 0,
Nr2 = 134, Nr3 = 202, and Nr4 = 269 kg ha−1) in 2013
Grain Mn Cob Mn Stover Mn Total Mn MnHI
(kg ha-1) (kg ha-1) (kg ha-1) (kg ha-1)
Hybrid
Hyb 1 0.038 0.004 0.342 b 0.383 b 0.09 a
Hyb 2 0.03 0.005 0.400 a 0.434 a 0.07b
Hyb 3 0.035 0.006 0.324 b 0.365 b 0.09 b
Hyb 4 0.03 0.004 0.345 b 0.378 b 0.07 b
PD
PD 1 0.033 0.004 0.333 b 0.370 b 0.09
PD 2 0.032 0.005 0.370 a 0.410 a 0.08
Nr
Nr 1 0.018 c 0.004 0.260 d 0.285 d 0.06 b
Nr 2 0.034 b 0.004 0.302 c 0.340 c 0.10 a
Nr 3 0.037 ab 0.005 0.392 b 0.434 b 0.08 a
Nr 4 0.046 a 0.005 0.453 a 0.501 a 0.08 a
Anova
Hyb ns na ** ** *
PD ns na * ** ns
Nr ** na ** ** **
Hyb x PD ns na ns ns ns
Hyb xNr ns na ns ns ns
PD x Nr ns na ns ns ns
Hyb x PD x Nr ns na ns * ns
ns = not significant; na = not available; *=P<0.05; **=P<0.01; ***=P<0.0001.
Cob nutrient concentration for the same treatment in reps 2 and 3 was estimated from rep 1
data but adjusted for each individual plot cob weight so statistical analysis was not possible

173
Table 5.13 - Copper partitioning (kg ha-1 dry weight) into grain, cob, and stover components,
and copper harvest index (CuHI) at physiological maturity for all maize hybrids
(Hybrid 1 = AQUAmaxTM P1151, Hybrid 2 = P1162, Hybrid 3 = AQUAmaxTM
P1498, Hybrid 4 = 33D49) grown at two plant densities (PD1 = 79,000, PD2 =
104,000 pl ha−1) and four N rates (Nr1 = 0, Nr2 = 134, Nr3 = 202, and Nr4 = 269
kg ha−1) in 2012
Grain Cu Cob Cu Stover Cu Total Cu CuHI
(kg ha-1) (kg ha-1) (kg ha-1) (kg ha-1)
Hybrid
Hyb 1 0.006 c 0.003 0.039 a 0.048 c 0.13 c
Hyb 2 0.009 b 0.002 0.029 b 0.041 d 0.25 a
Hyb 3 0.008 b 0.003 0.041 a 0.053 bc 0.16 c
Hyb 4 0.012 a 0.004 0.042 a 0.058 a 0.21 b
PD
PD 1 0.008 b 0.003 0.039 0.05 0.17 b
PD 2 0.010 a 0.003 0.037 0.05 0.20 a
Nr
Nr 1 0.008 0.002 0.029 b 0.040 b 0.22 a
Nr 2 0.009 0.003 0.040 a 0.053 a 0.18 ab
Nr 3 0.009 0.003 0.041 a 0.053 a 0.16 b
Nr 4 0.009 0.003 0.041 a 0.054 a 0.18 b
Anova
Hyb ** na ** ** **
PD ** na ns ns *
Nr ns na ** ** *
Hyb x PD * na ** ns *
Hyb xNr ns na ns ns ns
PD x Nr ns na ns ns ns
Hyb x PD x Nr ns na ns ns ns
ns = not significant; na = not available; *=P<0.05; **=P<0.01; ***=P<0.0001.
Cob nutrient concentration for the same treatment in reps 2 and 3 was estimated from rep 1
data but adjusted for each individual plot cob weight so statistical analysis was not possible

174
Table 5.14 - Copper partitioning (kg ha-1 dry weight) into grain, cob, and stover components,
and copper harvest index (CuHI) at physiological maturity for all maize hybrids
(Hybrid 1 = AQUAmaxTM P1151, Hybrid 2 = P1162, Hybrid 3 = AQUAmaxTM
P1498, Hybrid 4 = 33D49) grown at two plant densities (PD1 = 79,000, PD2 =
104,000 pl ha−1) and four N rates (Nr1 = 0, Nr2 = 134, Nr3 = 202, and Nr4 = 269
kg ha−1) in 2013
Grain Cu Cob Cu Stover Cu Total Cu CuHI
(kg ha-1) (kg ha-1) (kg ha-1) (kg ha-1)
Hybrid
Hyb 1 0.018 ab 0.003 0.032 a 0.052 ab 0.34 bc
Hyb 2 0.022 a 0.002 0.031 a 0.055 a 0.38 ab
Hyb 3 0.019 ab 0.002 0.025 b 0.046 c 0.40 a
Hyb 4 0.016 b 0.003 0.029 a 0.048 bc 0.33 c
PD
PD 1 0.017 0.003 0.03 0.049 0.35
PD 2 0.02 0.002 0.03 0.052 0.37
Nr
Nr 1 0.010 b 0.001 0.015 c 0.026 c 0.37
Nr 2 0.020 a 0.003 0.031 b 0.054 b 0.36
Nr 3 0.021 a 0.003 0.034 ab 0.058 ab 0.36
Nr 4 0.023 a 0.003 0.036 a 0.062 a 0.36
Anova
Hyb * na ** * *
PD ns na ns ns ns
Nr ** na ** ** ns
Hyb x PD ns na ns ns ns
Hyb xNr ns na ns ns ns
PD x Nr ns na ns ns ns
Hyb x PD x Nr ns na ns ns ns
ns = not significant; na = not available; *=P<0.05; **=P<0.01; ***=P<0.0001.
Cob nutrient concentration for the same treatment in reps 2 and 3 was estimated from rep 1
data but adjusted for each individual plot cob weight so statistical analysis was not possible

175
Table 5.15 - Grain Mn content for the factorial Hybrid x PD x N rate for all four hybrids (Hybrid 1 =
AQUAmaxTM P1151, Hybrid 2 = P1162, Hybrid 3 =AQUAmaxTM P1498, Hybrid 4 =
33D49), each plant density level (PD1 = 79,000; and PD2 = 104,000 pl ha-1), and four N
rates (Nr1 = 0, Nr2 = 134, Nr3 = 202, and Nr4 = 269 kg ha−1), respectively, in 2012
Grain Mn (kg ha-1)
Hybrid Nr1 Nr2 Nr3 Nr4
Hyb 1
PD1 0.023 0.014 0.025 0.03
PD2 0.035 0.027 0.02 0.03
Hyb 2
PD1 0.02 0.03 0.04 0.037
PD2 0.02 0.026 0.023 0.034
Hyb 3
PD1 0.046 0.053 0.031 0.042
PD2 0.0369 0.05 0.064 0.062
Hyb 4
PD1 0.063 0.06 0.047 0.055
PD2 0.031 0.07 0.064 0.062
Table 5.16 - Total Mn uptake for the factorial Hybrid x PD x N rate for all four hybrids (Hybrid 1 =
AQUAmaxTM P1151, Hybrid 2 = P1162, Hybrid 3 =AQUAmaxTM P1498, Hybrid 4 =
33D49), each plant density level (PD1 = 78,000; and PD2 = 99,000 pl ha-1), and four N
rates (Nr1 = 0, Nr2 = 134, Nr3 = 202, and Nr4 = 269 kg ha−1), respectively, in 2013
Total Mn uptake (kg ha-1)
Hybrid Nr1 Nr2 Nr3 Nr4
Hyb 1
PD1 0.280 0.313 0.434 0.483
PD2 0.290 0.303 0.447 0.516
Hyb 2
PD1 0.251 0.381 0.367 0.579
PD2 0.4311 0.445 0.53 0.485
Hyb 3
PD1 0.275 0.285 0.389 0.469
PD2 0.262 0.404 0.399 0.433
Hyb 4
PD1 0.22 0.302 0.439 0.46
PD2 0.2712 0.287 0.465 0.583

176
Figure 5.3 - Mean separation test for grain Fe content (kg ha-1) for the factorial PD x N rate at physiological maturity for each plant density level
(PD1 = 79,000; and PD2 = 104,000 pl ha-1), and all four N rate levels (Nr1 = 0, Nr2 = 134, Nr3 = 202, and Nr4 = 269 kg N
sidedress ha-1), when averaged across all 4 hybrids in 2012

177
Table 5.17. Total ZHI (Zinc harvest index), and grain Zn content (kg ha-1) for the factorial Hybrid x PD x N rate for all four hybrids (Hybrid 1 =
AQUAmaxTM P1151, Hybrid 2 = P1162, Hybrid 3 =AQUAmaxTM P1498, Hybrid 4 = 33D49), each plant density level (PD1 =
79,000; and PD2 = 104,000 pl ha-1), and four N rates (Nr1 = 0, Nr2 = 134, Nr3 = 202, and Nr4 = 269 kg ha−1), respectively, in 2012
2012 ZHI Grain Zn content (kg ha-1)
Hybrid Nr1 Nr2 Nr3 Nr4
Nr1 Nr2 Nr3 Nr4
Hyb 1
PD1 0.291 0.219 0.231 0.301
0.088 0.068 0.7 0.103
PD2 0.371 0.236 0.176 0.227
0.109 0.09 0.073 0.09
Hyb 2
PD1 0.334 0.358 0.373 0.366
0.09 0.095 0.149 0.157
PD2 0.337 0.301 0.319 0.2696
0.094 0.095 0.107 0.114
Hyb 3
PD1 0.392 0.31 0.198 0.221
0.14 0.138 0.078 0.113
PD2 0.338 0.349 0.485 0.447
0.121 0.157 0.242 0.304
Hyb 4
PD1 0.549 0.463 0.389 0.424
0.221 0.202 0.174 0.182
PD2 0.411 0.512 0.551 0.499 0.124 0.222 0.244 0.194

178
Table 5.18 - Mean separation test for stover Zn content (kg ha-1), grain Zn content (kg ha-1), grain Cu content (kg ha-1), stover Cu content (kg ha-
1), and CuHI (cupper harvest index) for the factorial Hybrid x PD, for all four hybrids (Hybrid 1 = AQUAmaxTM P1151, Hybrid 2
= P1162, Hybrid 3 =AQUAmaxTM P1498, Hybrid 4 = 33D49), and each plant density level (PD1 = 79,000; and PD2 = 104,000 pl
ha-1), when averaged across all 4 N rates in 2012
2012 Stover Zn Grain Zn Grain Cu Stover Cu CuHI
Hybrid PD1 PD2
PD1 PD2
PD1 PD2
PD1 PD2
PD1 PD2
Hyb 1 0.206 b 0.244 a
0.082 a 0.091 a
0.006 a 0.006 a
0.038 B a 0.040 A a
0.121 a 0.133 a
Hyb 2 0.198 a 0.193 a
0.123 a 0.101 a
0.010 a 0.009 a
0.029 C a 0.030 B a
0.264 a 0.240 a
Hyb 3 0.257 a 0.227 a
0.117 b 0.206 a
0.006 b 0.010 a
0.042 Ab a 0.041 A a
0.128 b 0.184 a
Hyb 4 0.199 a 0.163b 0.195 a 0.196 a 0.008 b 0.010 a 0.048 A a 0.037 A b 0.165 b 0.249 a
Different lower case letter in the rows: the same hybrid differs in plant densities. Different uppercase letter in the columns: hybrids differ
in the same plant density at p < 0.05