Embed Size (px)
Citation preview

University of PretoriaAnnual Financial Review

2011 Financial Review ii
Composition of the Council and Executive of the University of Pretoria as on 31 December 2011Council of the University of Pretoria
Members nominated by the MinisterMs B DibateDr PZ DubeMs NFT MpumlwanaDr B-A RibeiroMr AW Taylor
Members elected by the ConvocationMr AD BothaDr BP Botha (Deputy Chairperson)Dr EC BothaOne vacancy
Members elected by SenateProf I PikirayiProf RF SandenberghProf A Ströh
Members elected by the DonorsMr LL DippenaarProf DJ du Plessis
Members appointed by Council based on expertise/experienceDr SF BooysenProf RM LoubserMs D MagugumelaMs NT Mtoba (Chairperson)Mr IB SkosanaDr J van Zyl
Members appointed by the Tshwane local authorityMs PF Mashaba
Student representativesMr K MalatjiMr C Oberholzer
Employee representative (academic)Prof JH Potgieter
Employee representative (non-academic)Prof A van Aswegen
Principal and Vice-Principals (ex officio)Prof CM de la Rey (Vice-Chancellor and Principal)Prof RM Crewe (Vice-Principal)Prof SG Burton (Vice-Principal)Prof NA Ogude (Vice-Principal)Prof CR de Beer (Seconded as Administrator: University of Zululand as of 1 May 2011)
Executive of the University of Pretoria
Prof CM de la Rey (Vice-Chancellor and Principal)Prof RM Crewe (Vice-Principal)Prof SG Burton (Vice-Principal)Prof NA Ogude (Vice-Principal)Prof NJ Grové (Registrar)Prof AM de Klerk (Executive Director)Prof C Koornhof (Executive Director)Prof AP Melck (Executive Director)Prof CR de Beer (Seconded as Administrator: University of Zululand as of 1 May 2011)One vacancy
Addresses of the University
Physical addressUniversity of Pretoria Lynnwood Road Pretoria
Postal addressOffice of the RegistrarRoom 4-23Administration BuildingUniversity of Pretoria Pretoria0002
2011 Financial Review 1
ContentsScope of the summarised consolidated annual financial statements 2
Annual financial review for 2011 2
Report on internal administrative/operational structures and controls 5
Report on risk exposure assessment and the management thereof 6
Approval of the consolidated financial statements 6
Independent auditor’s report to the Council of the University of Pretoria 7
Summary of accounting policies 9
Consolidated statement of financial position 22
Consolidated income statement 24
Consolidated statement of comprehensive income 25
Consolidated statement of changes in equity 26
Consolidated statement of cash flows 27
Notes to the consolidated financial statements 28

2011 Financial Review 2
SCOPE OF THE SUMMARISED CONSOLIDATED ANNUAL FINANCIAL STATEMENTSThis report provides a financial profile of the University of Pretoria for the year ended 31 December 2011. The financial statements
includes revenues, expenses, assets and liabilities, as well as the transactions of all the operations and organisations under the
jurisdiction of the University.
ANNUAL FINANCIAL REVIEW FOR 2011INCOME AND EXPENDITURE
The University’s total income increased by R563 million to R4 811 million during the period under review.
The first main source of income remains the block grant received from the Department of Higher Education and Training, together
with earmarked grants to veterinary science, clinical training, foundation year programmes and teaching development initiatives.
The block grant of R1 476,26 million in 2011 represents an increase of 11,4% over 2010.
Tuition fees, the second main source of income, increased by 7%, despite an average increase of 8% in student fees raised for the
University’s programme offerings. The difference is primarily attributable to a decline in student numbers.
The following table provides a summary of the University’s sources of income:
Table 1: Total income of the University of Pretoria in 2011
Income2011 2010 Change
Rm Rm Rm %
Government grants 1 652 1 405 247 18
Tuition fees 1 000 931 69 7
Accommodation and meal fees 220 203 17 8
Investment income – profits on disposal 214 90 124 138
Interest / Dividend Income 197 229 (32) (14)
Expected return on plan assets 416 370 46 12
Income from contracts and other 475 489 (14) (2,9)
Service rendering 456 436 20 4,6
Donations and gifts 181 95 86 91
Total 4 811 4 248 563 13
Operating expenses were kept within the bounds of affordability by adopting measures to promote effectiveness and efficiency
and by maintaining stringent budget control. Operating expenses increased by 6,6% (2010: 13,7%) from R3 643 million in 2010
to R3 886 million in 2011.

2011 Financial Review 3
ASSETS AND LIABILITIES
The total assets increased by 8% (2010: 13%) to R8 878 million (2010: R8 191 million). The most significant categories of assets
are Property, Plant and Equipment, and Investments:
Property, Plant and Equipment
Property, Plant and Equipment increased from R2 200 million to R2 741 million, mainly due to the completion of the Engineering 3
Building and the Plant Sciences Building during the year. The University received infrastructure grants from the Department of
Higher Education and Training of R305,6 million for these and other infrastructure projects. The investment in these projects
supports the University’s objectives to increase the number of graduates in engineering and natural sciences.
Investments
At 31 December 2011, the market value of the University’s investment portfolio was R3 075 million (2010: R2 469 million). The
major portion of investments is categorised under specifically funded activities that are either restricted or designated by Council.
The University’s investment funds serve the following purposes:
(1) Meet part of the short-term requirements of the University – these liabilities have a maximum term of 24 months. The risk
profile emphasises the need for capital protection over short periods and a high degree of liquidity.
(2) Meet some of the medium-term liabilities (two to five years) of the University – the risk appetite for these liabilities is a
combination of a moderate return relative to inflation (3,5% p.a.) plus capital protection over a period of three years.
(3) Meet the long-term liabilities (five years and more) of the University – the main requirement is a good return relative to
inflation (6% p.a.). The liquidity requirement is lower than for the other liabilities.
(4) A special class of the long-term liabilities is the University’s obligation to post-retirement medical aid benefits.
Portfolio Primary performance target Actual returns
Long-term capital portfolio 6% p.a. (net of fees) outperformance of consumer
price inflation over any rolling eight-year period.
6,4% p.a. real
Stable portfolio 3,5% p.a. (net of fees) outperformance of
consumer price inflation over any rolling three-
year period.
2,9% p.a. real
Money Market portfolio Performance in line with the STEFI (composite)
index
2,3% real
Continuation Medical Aid portfolio 6% p.a. (net of fees) outperformance of consumer
price inflation over any rolling eight-year period.
7,2% p.a. real
2011 Financial Review 4
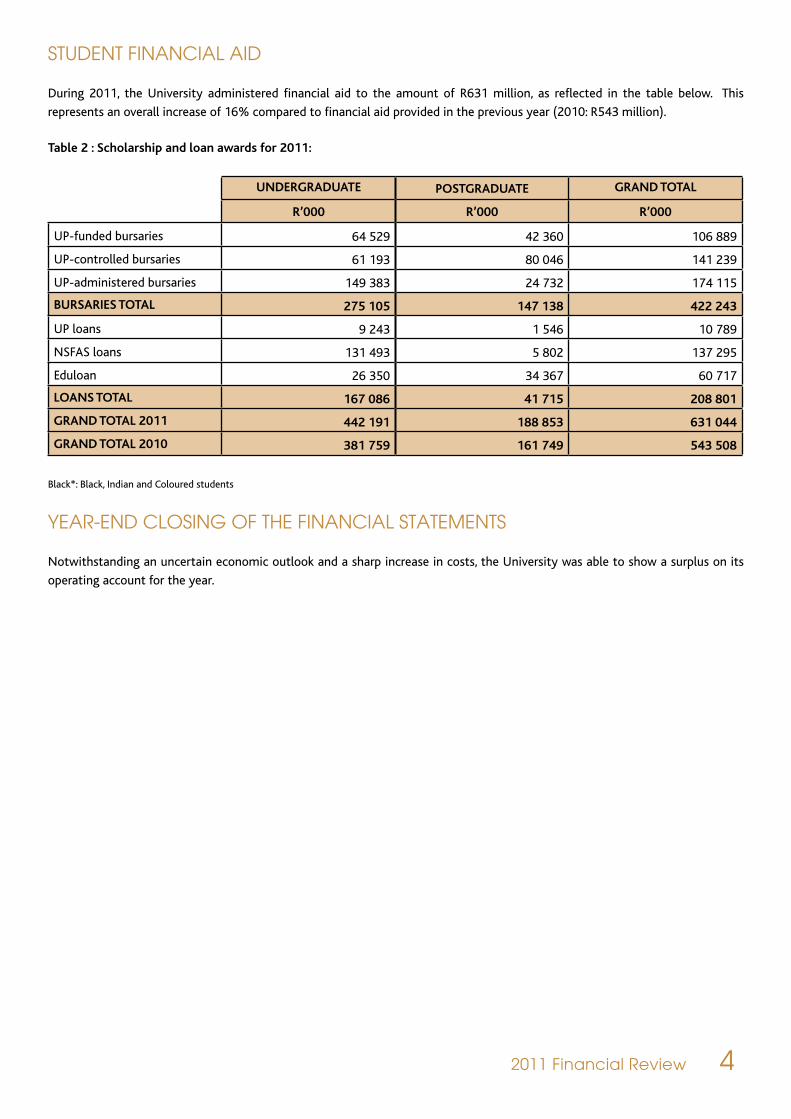
STUDENT FINANCIAL AID
During 2011, the University administered financial aid to the amount of R631 million, as reflected in the table below. This
represents an overall increase of 16% compared to financial aid provided in the previous year (2010: R543 million).
Table 2 : Scholarship and loan awards for 2011:
UNDERGRADUATE POSTGRADUATE GRAND TOTAL
R’000 R’000 R’000
UP-funded bursaries 64 529 42 360 106 889
UP-controlled bursaries 61 193 80 046 141 239
UP-administered bursaries 149 383 24 732 174 115
BURSARIES TOTAL 275 105 147 138 422 243
UP loans 9 243 1 546 10 789
NSFAS loans 131 493 5 802 137 295
Eduloan 26 350 34 367 60 717
LOANS TOTAL 167 086 41 715 208 801
GRAND TOTAL 2011 442 191 188 853 631 044
GRAND TOTAL 2010 381 759 161 749 543 508
Black*: Black, Indian and Coloured students
YEAR-END CLOSING OF THE FINANCIAL STATEMENTS
Notwithstanding an uncertain economic outlook and a sharp increase in costs, the University was able to show a surplus on its
operating account for the year.

2011 Financial Review 5
The University of Pretoria accepts that it has both an
obligation and a responsibility regarding the disclosure of
reliable financial information. To fulfil its responsibility in
this regard, the University maintains proper internal control
systems. These systems are designed to provide reasonable
assurance that the University’s assets are safeguarded
against unauthorised acquisition, use or disposal, and that the
accounting records provide a reliable basis for the preparation
of financial statements.
The internal control systems are based on an organisational
structure and the division of responsibilities. The University’s
established policies and procedures, including its Code of
Ethics, are communicated throughout the organisation to
foster a strong ethical climate. The University has also adopted
a Fraud Policy and Response Plan, as well as a Whistle Blowers
Policy to set the University’s stance on fraud and corruption
and to reinforce existing systems, policies and procedures
aimed at deterring, preventing, detecting, reacting to and
reducing the impact of fraud and corruption.
The University’s internal audit activities are performed by
the Department of Risk Management and Internal Audit,
while certain elements are co-sourced to an independent
firm of auditors. Internal control systems, in accordance with
the annual Internal Audit Plan, as approved by the Audit and
Risk Management Committee of Council, are appraised on a
continuous basis by either the Department of Risk Management
and Internal Audit, or the co-sourced independent internal
auditors. Such audit plan is largely based on the strategic risks
facing the University that emanated from the University’s risk
management process.
The internal audit function operates under the supervision
of the University Council. The Audit and Risk Management
Committee and the Standing Committee of Council exercise
the supervision on behalf of the Council. Weaknesses identified
in respect of the internal control systems are brought to the
attention of management and the Audit and Risk Management
Committee. Recommendations made to obviate weaknesses
are also submitted to management for appropriate action.
The effectiveness of any system of internal control is subject
to limitations. These limitations include the possibility
that human errors and the circumvention and overriding of
controls can occur. Effective internal control systems can only
provide reasonable assurance regarding the preparation of
financial statements and the safeguarding of assets. However,
the effectiveness of the systems can vary as circumstances
change.
REPORT ON INTERNAL ADMINISTRATIVE/ OPERATIONAL STRUCTURES AND CONTROLS

2011 Financial Review 6
REPORT ON RISK EXPOSURE ASSESSMENT AND THE MANAGEMENT THEREOF
The design, implementation and monitoring of the process of
risk management is the responsibility of the University. In this
regard, management is accountable to the University Council.
A Strategic Risk Management Committee, comprising members
of the Executive and a nominated Dean and Director, evaluates
and coordinates the management of identified strategic risks,
both financial and non-financial, faced by the University. Risk
management processes are reviewed regularly for continuing
relevance and effectiveness. The Strategic Risk Management
Committee reports to the Executive.
A report on the risk management process that is being
followed, as well as a summary of the risk register and
appropriate risk treatment plans, is presented to the Audit
and Risk Management Committee and to the Council of the
University on a regular basis.
APPROVAL OF THE CONSOLIDATED FINANCIAL STATEMENTS
The consolidated financial statements presented on pages
10 to 63 represent an extract of the full statements of
the University of Pretoria. These financial statements were
approved by the Council of the University of Pretoria at a
meeting held on 13 June 2012.
The full financial statements were prepared in accordance
with International Financial Reporting Standards and in the
manner required by the Minister of Higher Education and
Training in terms of section 41 of the Higher Education Act,
1997 (Act 101 of 1997), as amended.
The “going concern” approach has been adopted in the
preparing of the financial statements. Based on forecasts and
available cash resources, Council believes that the University
of Pretoria will remain a “going concern” for the foreseeable
future. The viability of the institution is borne out by the
content of the financial statements.
The financial statements have been audited by
PricewaterhouseCoopers Inc, who was given unrestricted access
to all financial records and related data, including the minutes
of meetings of Council and of all its committees. Council
believes that all representations made to the independent
auditors during their audit were valid and appropriate.
PROF CM DE LA REY PROF C KOORNHOFVice-Chancellor and Principal Executive Director
6 September 2012 6 September 2012

2011 Financial Review 7
INDEPENDENT AUDITOR’S REPORT TO THE COUNCIL OF THE UNIVERSITY OF PRETORIAREPORT ON THE CONSOLIDATED FINANCIAL STATEMENTS
IntroductionWe have audited the consolidated financial statements of the University of Pretoria and its subsidiaries as set out on pages
10 to 63, which comprise the consolidated statement of financial position as at 31 December 2011, the consolidated income
statement and the consolidated statement of comprehensive income, statement of changes in equity and statement of cash
flows for the year then ended, and the notes, comprising a summary of significant accounting policies and other explanatory
information.
Council’s responsibility for the financial statementsCouncil is responsible for the preparation and fair presentation of these consolidated financial statements in accordance with
International Financial Reporting Standards and the requirements of the Higher Education Act of South Africa, and for such
internal control as it determines is necessary to enable the preparation of consolidated financial statements that are free from
material misstatements, whether due to fraud or error.
Auditor’s responsibilityOur responsibility is to express an opinion on these consolidated financial statements based on our audit. We conducted our
audit in accordance with International Standards on Auditing. Those standards require that we comply with ethical requirements,
and plan and perform the audit to obtain reasonable assurance about whether the consolidated financial statements are free
from material misstatement.
An audit involves performing procedures to obtain audit evidence about the amounts and disclosures in the consolidated
financial statements. The procedures selected depend on the auditor’s judgement, including the assessment of the risks of
material misstatement of the consolidated financial statements, whether due to fraud or error. In making those risk assessments,
the auditor considers internal control relevant to the entity’s preparation and fair presentation of the consolidated financial
statements in order to design audit procedures that are appropriate in the circumstances, but not for the purpose of expressing
an opinion on the effectiveness of the entity’s internal control. An audit also includes evaluating the appropriateness of
accounting policies used and the reasonableness of accounting estimates made by management, as well as evaluating the
overall presentation of the consolidated financial statements.
We believe that the audit evidence we have obtained is sufficient and appropriate to provide a basis for our audit opinion.
PricewaterhouseCoopers Inc, 2 Eglin Road, Sunninghill 2157, Private Bag X36, Sunninghill 2157, South Africa
T: +27 (11) 797 4000, F: +27 (11) 797 5800, www.pwc.co.za
Executive: S P Kana (Chief Executive Officer) T P Blandin de Chalain D J Fölscher P J Mothibe S Subramoney F TonelliResident Director in Charge: E R MackeownThe company’s principal place of business is at 2 Eglin Road, Sunninghill where a list of directors’ names is available for inspection.Reg. no. 1998/012055/21, VAT reg.no. 4950174682

2011 Financial Review 8
OpinionIn our opinion, the consolidated financial statements present fairly, in all material respects, the financial position of the
University of Pretoria and its subsidiaries as at 31 December 2011, and their financial performance and cash flows for the year
then ended in accordance with International Financial Reporting Standards.
Other matterThe accompanying financial statements are not the statutory financial statements of the University and do not include all the
disclosures required by the Higher Education Act of South Africa. The statutory financial statements are available for inspection
at the Department of Higher Education and Training.
PricewaterhouseCoopers Inc.
Director: JFM Kotze
Registered Auditor
Johannesburg
6 September 2012

1 Summary of accounting policies
2011 Financial Review 9

2011 Financial Review 10
UNIVERSITY OF PRETORIA and its subsidiariesSUMMARY OF ACCOUNTING POLICIESFOR THE YEAR ENDED 31 DECEMBER 2011
1. General information
The consolidated financial statements were authorised for
issue by Council on 13 June 2012.
The University of Pretoria is a Higher Education Institution
governed by the Higher Education Act 101 of 1997 as amended
by Act 54 of 2000. The University of Pretoria is domiciled in
South Africa and the operations and principal activities of
the University relate to teaching, research and community
engagement. The presentation currency of the University of
Pretoria is South African Rands. All amounts are rounded to the
nearest thousand Rand.
2. Basis for preparation
The University prepared consolidated annual financial
statements in terms of International Financial Reporting
Standards (IFRS). The consolidated financial statements
are prepared in terms of the historical cost method and are
modified to accommodate the revaluation of available-for-
sale financial investments.
The preparation of financial statements in conformity with
IFRS requires the use of certain critical accounting estimates.
It also requires management to exercise its judgement in the
process of applying the University’s accounting policies. The
areas involving a higher degree of judgement or complexity,
or areas where assumptions and estimates are significant to
the University’s financial statements are disclosed in note 2.4.
The principal accounting policies adopted in the preparation
of these consolidated financial statements are set out below
and are consistent with those of the previous year, unless
otherwise stated.
2.1 Going concern
The University’s forecast and projections, taking account of
reasonably possible changes in operating circumstances, show
that the University should be able to operate within its current
financing. Council has a reasonable expectation that the
University has adequate resources to continue in operational
existence for the foreseeable future. The University therefore
continue to adopt the going concern basis in preparing its
annual financial statements.
2.2 New and amended standards adopted by the University
The accounting policies adopted are consistent with those of
the previous financial year, except for the following new or
amended standards and interpretations that were adopted
from the annual period beginning 1 January 2011:
• Amendment to IFRS 7, Financial Instruments: Disclosures –
This amendment clarifies certain of the disclosures relating
to credit risk.
• Amendment to IAS 1, Presentation of Financial Statements
– This amendment clarifies disclosures required for each
component of equity.
• Amendment to IAS 24, Related party disclosures – This
amendment clarifies and simplifies the definition of a
related party.
2.3 New standards, amendments and interpretations issued but not effective for the financial year beginning 1 January 2011 and not early adopted
IFRS 1 (Amendment): First-time Adoption of International
Financial Reporting Standards – Removal of Fixed Dates for
First-time Adopters (effective for financial periods beginning
on or after 1 July 2011). The amendment replaces references

2011 Financial Review 11
to a fixed date of ‘1 January 2004’ with ‘the date of transition
to IFRSs’, thus eliminating the need for companies adopting
IFRSs for the first time to restate derecognition transactions
that occurred before the date of transition to IFRSs.
IFRS 7 (Amendment): Financial Instruments: Disclosures –
Transfer of Financial Assets (effective for financial periods
beginning on or after 1 July 2011) – The amendment
will allow users of financial statements to improve their
understanding of transfer transactions of financial assets,
including understanding the possible effects of any risks that
may remain with the entity that transferred the assets. It
will also require additional disclosures if a disproportionate
amount of transfer transactions are undertaken around the
end of the reporting period.
IFRS 7 (Amendment): Financial instruments: Disclosures –
IFRS 9 Transitional Disclosures (effective for financial periods
beginning on or after 1 January 2015). The amendment
requires additional disclosures on the transition from IAS 39
to IFRS 9. This is only required where IFRS 9 is adopted for
financial periods beginning on or after 1 January 2013. If an
entity adopts IFRS 9 for financial period beginning on or after
1 January 2012 and before 1 January 2013, the entity can
either provide additional disclosure or restate prior periods.
IFRS 7 (Amendment): Financial instruments: Disclosures –
Offsetting of financial assets and financial liabilities (effective
for financial periods beginning on or after 1 January 2013). The
amended disclosures will require more extensive disclosures
than are currently required under IFRS. The disclosures focus
on quantitative information about recognised financial
instruments that are offset in the statement of financial
position as well as those recognised financial instruments
that are subject to master netting or similar arrangements
irrespective of whether they are offset.
IFRS 9, Financial instruments (effective for financial periods
beginning on or after 1 January 2015):
• IFRS 9 addresses classification and measurement of
financial assets. It uses a single approach to determine
whether a financial asset is measured at amortised
cost or at fair value;
• IFRS 9 was amended to incorporate financial
liabilities. The accounting and presentation for
financial liabilities and for derecognising financial
instruments has been relocated from IAS 39, ‘Financial
instruments: Recognition and measurement’,
without change, except for financial liabilities that
are designated at fair value through profit or loss.
The amendment introduces new requirements that
address the problem of volatility in profit or loss
(P&L) arising from an issuer choosing to measure its
own debt at fair value. With the new requirements,
an entity choosing to measure a liability at fair value
will present the portion of the change in its fair value
due to changes in the entity’s own credit risk in the
other comprehensive income (OCI) section of the
statement of comprehensive income, rather than
within P&L.
IFRS 10 Consolidated Financial Statements (effective for
financial periods beginning on or after 1 January 2013) – IFRS
10 establishes principles for the presentation and preparation
of consolidated financial statements when an entity controls
one or more other entities and supersedes IAS 27 Consolidated
and Separate Financial Statements. IFRS 10 changes the
definition of control so that the same criteria are applied to all
entities to determine control. The revised definition of control
focuses on the need to have both power and variable returns
before control is present. The standard provides additional
guidance to assist in determination of control where this is
difficult to assess.
IFRS 13 Fair Value Measurement (effective for financial periods
beginning on or after 1 January 2013) – IFRS 13 defines fair
value, sets out in a single IFRS a framework for measuring
fair value, and sets out disclosure requirements on fair value
measurements.
IAS 12 (Amendment): Income taxes – Deferred tax: Recovery
of underlying assets (effective for financial periods beginning
on or after 1 January 2012) – A limited scope amendment to
the recovery of underlying Basis of preparation continued
IAS 32 (Amendment): Financial instruments: Presentation
(effective for financial periods beginning on or after 1 February
2014) – Offsetting of financial assets and financial liabilities
has been amended to clarify that the right to offset must be
available today – that is it is not contingent on a future event.
It must also be legally enforceable for all counterparts in the
normal course of business, as well as in the event of default,
insolvency or bankruptcy. The amendments also clarify that
gross settlement mechanisms (such as through a clearing
house) with features that both (i) eliminate credit and liquidity
risk and (ii) process receivables and payables in a settlement
process are effectively equivalent to net settlement; they
would therefore satisfy the IAS 32 criterion in these instances.

2011 Financial Review 12
2.4 Critical accounting estimates and judgements
Some of the amounts included in the consolidated financial
statements involve the use of judgement and/or estimation.
These judgements and estimates are based on management’s
best knowledge of the relevant facts and circumstances,
having regard to prior experience, but actual results may
differ from the amounts included in the consolidated
financial statements. Information about such judgements and
estimations is contained in the accounting policies and/or the
notes to the consolidated financial statements, and the key
areas are summarised below.
Areas of judgement and key sources of estimation uncertainty
that have the most significant effect on the amounts
recognised in the consolidated financial statements are:
Impairment of receivables
The University tests whether trade receivables have suffered
any impairment in accordance with the accounting policy in
note 11. Assets that are individually significant are considered
separately for impairment. When these assets are impaired,
any impairment loss is recognised directly against the related
asset. Assets that are individually significant and that are not
impaired, and groups of smaller balances are considered for
impairment on a portfolio basis, based on similar credit risk.
Impairment losses are recognised in an “allowance account for
credit losses” until the impairment can be identified with an
individual asset, and, at that point, the allowance is written off
against the individual asset. Subsequent recoveries of amounts
previously written off are credited in the income statement.
Refer to note 7 for the carrying amount of receivables and the
impairment losses provided for in 2011.
Provisions
Provision for postretirement benefits has been recognised
in accordance with the accounting policy in note 20. The
cost of postemployment benefits is determined using
actuarial valuations. The actuarial valuation involves making
assumptions about discount rates, mortality rates and income
at retirement. Due to the long-term nature of these plans,
such estimates are subject to significant uncertainty. The main
assumptions and carrying amounts related to postretirement
benefits are summarised in note 10.
Deferred revenue
The University recognises private grants received, to
compensate for expenses incurred, as income. These grants are
subject to various requirements and therefore each grant is
recognised over a certain period (specific to each grant) under
the terms of the grant. In several instances, the contract’s
terms do not specifically determine that unspent amounts
are refundable but the nature of the grants and historic
experience necessitate the deferral of unspent amounts
to deferred income. Grants received are therefore limited
to the expenses incurred and the balance is recognised as
deferred income in the statement of financial position. Grants
obtained, to reimburse expenses incurred, are analysed on an
“individual contract” basis by grouping similar grants together.
The deferral of income therefore necessitates a degree of
judgement by management. Refer to note 14 for the carrying
amount of deferred income.
3. Reserve funds
3.1 Unrestricted operating fund
The unrestricted operating fund reflects the University’s
subsidised activities and also includes the tuition fees and
expenditure in respect of the formal courses of the Gordon
Institute of Business Science (GIBS). Additions to these funds
mainly comprise formula-subsidy, tuition fees and the sales
and services of educational activities (patient fees at the
Veterinary Academic Hospital) as well as transfers from other
funds to finance expenditure.
Expenditure mainly comprises direct expenses in academic
departments for teaching and learning, research and
community service as well as other support service expenses
such as academic administration, library facilities, bursaries
and loans. Institutional expenses, such as expenses incurred
for the Executive, student services, information technology
and operating costs regarding land and buildings, are also
recorded here.
3.2 Restricted funds
These funds may be used only for the purposes that have been
specified in legally binding terms by the provider of such funds
or by another legally empowered person.
3.3 Council designated funds
These funds fall under the absolute discretion/control of
Council, e.g. sales of goods and services; non-prescriptive

2011 Financial Review 13
donations and grants; income from investments that are
not held as cover for trust; specific purpose endowments or
administrated funds; etc.
3.4 Non-distributable reserves
These funds consist of the available-for-sale investment
revaluation reserve. Gains/losses on the fair value adjustments
of investments are recognised in a revaluation reserve until
such time as the investment is disposed, in which case the
gain/loss will be recognised in the income statement.
4. Revenue recognition
Revenue is generally recognised at the fair values of the
amounts of goods received or receivable. Revenue is shown
net of value-added tax, returns, rebates and discounts and
after eliminating sales within the group.
4.1 Government and other grants relating to income
Grants from the government are recognised at their fair value
where there is a reasonable assurance that the grant will be
received and the University will comply with all attached
conditions. The University follows the income approach
whereby the grant is taken to income (over one or more periods,
where relevant) and not the capital approach whereby the
grant is credited directly to shareholders’ interest. Government
grants relating to costs are deferred and recognised in the
income statement over the period necessary to match them
with the costs that they are intended to compensate. Private
gifts, grants and donations are recognised as income at the
fair value of the consideration received or receivable in the
period to which they relate. Any such income is recognised as
income in the financial period when the University is entitled
to use those funds. Therefore, funds that will not be used until
some specified future period or occurrence are recognised as
deferred income and released to the income statement as the
University becomes entitled to the funds. Grants received to
compensate for expenses to be incurred are often prescriptive
in nature and therefore it is recognised over a certain period
under the terms of the grant. Prescriptive grant income
is recognised with reference to the stage of completion
at the reporting date. If the stage of completion cannot be
measured reliably, the recognition of this income is limited to
the expenses incurred. The balance is recognised as deferred
income in the statement of financial position.
4.2 Government and other grants relating to assets
Government grants relating to property, plant and equipment
are included in non-current liabilities as deferred government
grants and are recognised in the income statement on a
straight-line basis over the expected lives of the related assets.
The portion of the grants that will be released to the income
statement during the next 12 months are included in current
liabilities.
4.3 Tuition fees and residence fees
Tuition fees and residence fees are recognised as income at
the fair value of the consideration received or receivable in
the period to which they relate. Revenue for tuition and
residence services is recognised with reference to the stage of
completion at the reporting date, based on services performed
to date as a percentage of total services to be performed.
Deposits provided by prospective students are treated as
current liabilities until the amount is billed as being due to the
University.
4.4 Restricted and earmarked funds
The University recognises grants received to compensate for
expenses incurred as income. These grants are often prescriptive
and therefore they are recognised over a certain period under
the terms of the grant. The recognition of this income is limited
to the expenses incurred. The balance is recognised as deferred
income in the statement of financial position.
4.5 Donations and gifts
Donations and gifts are recognised on receipt at fair value.
Donations in kind are recognised at the fair value thereof.
4.6 Investment income
Investment funds are pooled and the investment income is
apportioned to the various participating funds in proportion
to their balances.

2011 Financial Review 14
Interest income is recognised in profit or loss on a time-
proportion basis using the effective interest rate method.
Dividend income is recognised in profit or loss when the right
to receive payment is established.
When a receivable is impaired, the University and its
subsidiaries reduce the carrying amounts to its recoverable
amount, being the estimated future cash flow discounted
at the original effective interest rate of the instrument, and
continues unwinding discount as interest income. Interest
income on impaired loans is recognised using the original
effective interest rate.
4.7 Other income
Inter-departmental income and expenditure are eliminated.
Occasional sales and services are recognised in the period in
which they accrue.
5. Subsidiaries
Subsidiary entities are those entities over which the University
has the power, directly or indirectly, to exercise control.
Control is the power to govern the financial and operating
policies generally accompanying a shareholding of more than
one half of the voting rights. All subsidiaries are consolidated.
Subsidiaries are consolidated with effect from the date on
which effective control is transferred to the University and are
no longer consolidated with effect from the date of disposal
or when control ceases.
The acquisition method of accounting is used to account for
the acquisition of subsidiaries by the University. The cost of an
acquisition is measured as the fair value of the assets given,
equity instruments issued and liabilities incurred or assumed
at the date of exchange, plus costs directly attributable to
the acquisition. Identifiable assets acquired and liabilities and
contingent liabilities assumed in a business combination are
measured initially at their fair values at the acquisition date,
irrespective of the extent of any non-controlling interest.
The excess of the cost of acquisition over the fair value of
the University’s share of the identifiable net assets acquired
is recorded as goodwill. If the cost of acquisition is less than
the fair value of the net assets of the subsidiary acquired, the
difference is recognised directly in the income statement.
All inter-company transactions, balances as well as unrealised
gains and losses, are eliminated. Where it was found to be
necessary, accounting policies for subsidiary companies are
changed to ensure consistency with the policies adopted by
the University.
6. Non-controlling interest
The University and its subsidiaries apply a policy of treating
transactions with non-controlling interests as transactions
with parties external to the group. Disposals to non-controlling
interests result in gains and losses for the group and are
recorded in the income statement. Purchases from non-
controlling interests result in goodwill, being the difference
between any consideration paid and the relevant share
acquired of the carrying value of net assets of the subsidiary.
7. Associated companies
Associates are all entities over which the University and its
subsidiaries have significant influence but not control, generally
accompanying a shareholding of between 20% and 50% of
the voting rights. Investments in associates are accounted
for using the equity method of accounting and are initially
recognised at cost. The investment in associates includes
goodwill identified on acquisition, net of any accumulated
impairment loss.
The University and its subsidiaries’ share of its associates’
post-acquisition profits or losses is recognised in the income
statement, and its share of post-acquisition movements
in reserves is recognised in reserves. The cumulative post-
acquisition movements are adjusted against the carrying
amount of the investment. When the University and its
subsidiaries’ share of losses in an associate equals or exceeds
its interest in the associate, including any other unsecured
receivables, the University and its subsidiaries do not recognise
further losses, unless it has incurred obligations or made
payments on behalf of the associate.

2011 Financial Review 15
Unrealised gains on transactions between the University, its
subsidiaries and its associates are eliminated to the extent of
the group’s interest in the associates. Unrealised losses are
also eliminated unless the transaction provides evidence of
an impairment of the asset transferred. Accounting policies
of associates have been changed where necessary to ensure
consistency with the policies adopted by the University and
its subsidiaries.
Dilution gains and losses arising in investments in associates
are recognised in the income statement.
8. Foreign currencies
The consolidated annual financial statements are presented
in South African Rand, the functional and presentation
currency of the University. Foreign currency transactions are
accounted for at the exchange rates prevailing at the date
of the transactions. Monetary balances are translated at
the exchange rates prevailing at year end. Gains and losses
resulting from the settlement of such transactions and from
the translation of monetary assets and liabilities denominated
in foreign currencies are recognised in the income statement
in the year in which they arise.
9. Financial instruments
Financial instruments carried on the statement of financial
position include cash and bank balances, available-for-sale
investments, receivables, other receivables, trade payables and
borrowings. The particular recognition methods adopted are
disclosed in the individual policy statements associated with
each item.
The purchases and sale of financial assets that require delivery
are recognised on trade date, being the date on which the
University commits to purchase or sell the asset.
The University and subsidiary companies recognise a financial
asset or a financial liability on its statement of financial
position when, and only when, the group becomes a party to
the contractual provisions of the instrument.
Financial assets are derecognised when the rights to receive
cash flows from the financial asset have expired or have been
transferred and the group has transferred substantially all risks
and rewards of ownership. Financial liabilities (or a part of the
financial liability) is removed from the statement of financial
position when the obligation specified in the contract is
discharged or cancelled or expires.
10. Goodwill
Goodwill represents the excess of the cost of an acquisition
over the fair value of a subsidiary of the University’s share of
net assets of the acquired subsidiary undertaking at the date
of the acquisition. The carrying amount of goodwill is reviewed
annually and adjusted for impairment where it is considered
necessary.
11. Intangible assets
Computer software development costs
Costs incurred on development projects (relating to the design
and testing of new or improved products) are recognised as
intangible assets when the following criteria are fulfilled:
• it is technically feasible to complete the intangible
asset so that it will be available for use;
• management intends to complete the intangible
asset and use or sell it;
• there is an ability to use or sell the intangible asset;
• it can be demonstrated how the intangible asset will
generate probable future economic benefits;
• adequate technical, financial and other resources
to complete the development and to use or sell the
intangible asset are available; and
• the expenditure attributable to the intangible asset
during its development can be reliably measured.
Development costs include expenditure relating to the
implementation partner, additional staff employed specifically
for the Enterprise Resource Planning System, hardware and
software purchased specifically for the Enterprise Resource
Planning System. Capitalised development costs are amortised
from the point at which the asset is ready for use on a straight-
line basis over its estimated useful life of 10 years, however
the method of depreciation, useful live and residual value are
reviewed annually. Intangible assets are not revalued.

2011 Financial Review 16
Artwork
Artwork is recorded at cost or the estimated fair value at
the date of the donation. The fair value is deemed to be a
reasonable market value at the date of the donation or the
purchase price of the item. The market value at the date of the
donation is determined by an art appraiser. The useful life of
artwork is considered to be indefinite as artwork is not subject
to wear and tear. Intangible assets are not revalued. The
carrying amount is tested for impairment and whenever there
is an indication that the intangible asset may be impaired.
There was no indication that artwork should be impaired.
Vodacom league licence and franchise fee
Licences and franchise fees are shown at historical cost. Both
these categories have a definite useful life and are carried at
cost less accumulated amortisation. Amortisation is calculated
using the straight-line method to allocate cost of licences and
franchise fees over the estimated useful lives of 20 years for
licences and five years for franchise fees.
An intangible asset is regarded as having an indefinite useful life
when, based on all relevant factors, there is no foreseeable limit
to the period over which the asset is expected to generate net
cash inflows. Amortisation is not provided for these intangible
assets. For all other intangible assets amortisation is provided
on a straight line basis over their useful life. The amortisation
period and the amortisation method for intangible assets are
reviewed every period-end.
Reassessing the useful life of an intangible asset with a
definite useful life after it was classified as indefinite is an
indicator that the asset may be impaired. As a result the asset
is tested for impairment and the remaining carrying amount is
amortised over its useful life.
Internally generated brands, mastheads, publishing titles,
customer lists and items similar in substance are not
recognised as intangible assets.
12. Financial assets
Financial assets are classified in the following categories:
loans and receivables (student loans and loans to staff,
trade receivables) and available-for-sale financial assets.
The classifications depend on the purpose for which the
financial assets were acquired. Management determines the
classification of its investments at initial recognition.
All financial assets are accounted for at trade date.
Prepaid expenses comprise that portion of expenses that is
paid in the current year, but is applicable to the following
financial year. Prepaid expenses are not classified as a financial
asset and are included under non-financial assets.
12.1 Loans and receivables
Loans to students and staff are non-derivative financial assets
with fixed or determinable payments that are not quoted in
an active market. They are initially measured at fair value, plus
transaction costs and are included in current assets, except
for maturities greater than 12 months after the end of the
reporting period.
These are classified as non-current assets. The University’s
loans and receivables comprise “student and other loans”
and “cash and cash equivalents” in the statement of financial
position (notes 5, 7 & 8).
Subsequently, items included in this category are measured
at the amortised cost, calculated based on the effective
interest method, and interest income is included in profit or
loss for the period. Net gains or losses represent reversals of
impairment losses, impairment losses and gains and losses
on derecognition. Net gains or losses are included in “other
income” or “other expenses”.
Short-term receivables with no stated interest rate are
measured at the original invoice amount if the effect of
discounting is immaterial.
Trade receivables are non-derivative financial assets with fixed
or determined payments that are not quoted in an active
market. Financial assets classified as receivables are initially
recognised at fair value plus transaction costs. Subsequent to
recognition, receivables are carried at amortised cost using the
effective interest rate method, less provision for impairment.
Short term receivables which are due within 12 months, with
no stated interest are measured at the original invoice amount
if the effect of discounting is immaterial.
A provision for impairment for trade receivables is established
when there is objective evidence that the University will not
be able to collect all amounts due according to the original
terms of receivables. Significant financial difficulties of the
debtor and default or delinquency in payments are considered
indicators that the trade receivable is impaired. An impairment
loss is recognised in profit or loss when the carrying amount
of the asset exceeds its recoverable amount. The recoverable
amount is calculated as the present value of the estimated

2011 Financial Review 17
future cash flows discounted at the original effective interest
rate of the instrument.
Impairment losses are recognised on loans and receivables
when there is objective evidence of impairment. An impairment
loss is recognised in profit or loss when the carrying amount
of the asset exceeds its recoverable amount. The recoverable
amount is calculated as the present value of the estimated
future cash flows discounted at the original effective interest
rate of the instrument.
Assets that are individually significant are considered
separately for impairment. When these assets are impaired,
any impairment loss is recognised directly against the related
asset. Assets that are individually significant and that are not
impaired, and groups of small balances are considered for
impairment on a portfolio basis, based on similar credit risk.
Impairment losses are recognised in an “allowance account for
credit losses” until the impairment can be identified with an
individual asset, and, at that point, the allowance is written off
against the individual asset. Subsequent recoveries of amounts
previously written off are credited in the income statement.
12.2 Available-for-sale financial assets
Financial assets classified as available-for-sale are initially
recognised at fair value plus transaction costs. Subsequent to
initial recognition, available-for-sale financial assets are carried
at fair value. The fair value of financial instruments traded in
active markets is based on quoted market prices at year end.
The quoted market price used for financial assets is the current
bid price as per the Johannesburg Stock Exchange. If the market
value of an investment cannot be determined, the investment is
measured using an acceptable valuation method.
Unrealised gains and losses arising from the change in fair
value are recognised directly in equity until the asset is
derecognised or impaired, at which time the cumulative gain
or loss previously recognised in equity is recognised in the
income statement. However, interest income on these items,
calculated using the effective interest method, is recognised
in profit or loss. Dividend income is recognised when the
University’s right to payment has been established and it is
included in “other income”. Net foreign exchange gains or
losses on monetary available-for-sale financial assets are
recorded directly in profit or loss as part of “other income”
or “other expenses”. Cumulative gains or losses accumulated
in equity are recognised in profit or loss upon disposal or
impairment of the financial asset, as part of net gains or losses,
and are included in “other income” or “other expenses”.
The University and its subsidiaries assess at each year end
whether there is objective evidence that a financial asset
or group of assets is impaired. A financial asset is impaired if
its carrying amount is greater than its estimated recoverable
amount. Available-for-sale financial assets will become impaired
when a significant or prolonged decline in the fair value of the
investment below its cost price or amortised cost is noted.
If any objective evidence of impairment exists for available-
for-sale financial assets, the cumulative loss, measured as the
difference between the acquisition cost and current fair value,
less any impairment loss on the financial asset previously
recognised in profit or loss, is removed from equity and
recognised in the income statement. If, in a subsequent period,
the fair value of a debt instrument classified as available-for-
sale increases and the increase can be objectively related to
an event occurring after the impairment loss was recognised
in profit or loss, the impairment loss is reversed through the
income statement.
Investments exclude entities of which the operating results
are included in the consolidated financial statements of the
University.
13. Property, plant and equipment
Land and buildings mainly consist of lecture halls, laboratories,
hostels and administrative buildings. All property, plant and
equipment are recorded at cost less accumulated depreciation.
Cost includes expenditure that is directly attributable to
the acquisition of the items. Property, plant and equipment
acquired by means of donations are recorded at fair value at
the date of the donation.
Depreciation is calculated as follows, using the straight-line
method to write off the cost of each asset to its residual
values over its estimated useful life:
• Buildings 15–50years
• Vehicles 5years
• Computerequipment(average) 3–5years
• Furnitureandequipmentandlaboratory
equipment 5–10 years
• Library items are depreciated in full in the year of
acquisition.

2011 Financial Review 18
• Landisnotdepreciatedasitisdeemedtohaveanindefinite
life.
• The methods of depreciation, useful lives and residual
values are reviewed annually where the specific assets
differs from the norm.
• Depreciationischargedtotheincomestatement.
Routine maintenance costs are charged to income as they are
incurred. The costs of major maintenance or overhaul of an
item of property, plant or equipment are recognised in the
carrying amount of the item of property, plant and equipment
if it is probable that future economic benefits associated with
the item will flow to the University and the cost of the item
can be measured reliably. Expenditure incurred to replace
a component of an item is capitalised to the cost of the
item. Any remaining carrying amount of the replaced part is
derecognised.
Property, plant and equipment are assessed at each reporting
date to determine whether there is an indication that the
carrying amount of the asset may be impaired. If such an
indication exists, the recoverable amount of the asset is
determined. The recoverable amount of an asset is the
higher of its fair value less costs to sell and its value in use. In
determining the value in use, the estimated future cash flows
of the asset is discounted to their present value based on pre-
tax discount rates that reflects current market assessments
of the time value of money and the risks that are specific to
the asset. If the value in use of an individual asset for which
there is an indication of impairment cannot be determined,
the recoverable amount of the cash-generating unit to which
the asset belongs is determined. An asset’s cash-generating
unit is the smallest group of identifiable assets that includes
the asset and that generates cash inflows from continuing use
that are largely independent from cash inflows from other
assets.
An impairment loss is recognised in profit or loss when the
carrying amount of an individual asset or of a cash-generating
unit exceeds its recoverable amount. Impairment losses
recognised on cash-generating units are firstly allocated to
goodwill and secondly, on a pro rata basis, to the other assets
in the cash-generating unit.
Impairment losses recognised on goodwill are not reversed.
With regard to other assets, impairment losses are reversed if
there has been a change in the estimates used to determine
the recoverable amount of the asset or cash-generating unit.
Reversals of impairment losses on cash-generating units are
allocated on a pro rata basis to the assets in the unit, excluding
goodwill. Impairment losses are reversed only to the extent
that the carrying amount of the asset does not exceed the
carrying amount that would have been determined if no
impairment loss had been recognised in the past. Reversals of
impairment losses are recognised directly in profit or loss.
Gains and losses on the disposal of property, plant and
equipment are determined by reference to their carrying
amounts and are taken into account in determining operating
profit.
14. Accounting for leases
14.1 Finance lease
Leases of property, plant and equipment in respect of which
the University assumes the benefits and risks of ownership are
classified as finance leases. Finance leases are capitalised at
the estimated fair value of the leased assets, or, if lower, at
the present value of the underlying lease payments. Each lease
payment is allocated to the liability and finance charges so as
to achieve a constant rate on the outstanding finance balance.
The corresponding rental obligations, net of finance charges,
are included in other long-term payables. The interest element
of the finance charge is charged to the income statement over
the lease period. The property, plant and equipment acquired
under finance leasing contracts are depreciated over the
shorter of the useful life of the asset and the lease term.
14.2 Operating lease
Leases of assets, in terms of which all the risks and benefits of
ownership are effectively retained by the lessor, are classified
as operating leases. Payments made in terms of operating
leases are charged to the income statement on a straight-line
basis over the period of the lease.
When an operating lease is terminated before the lease period
has expired, any payment required to be made to the lessor
by way of penalty is recognised as an expense in the period in
which termination takes place.

2011 Financial Review 19
15. Inventories
Inventories are initially measured at cost and subsequently
valued at the lower of cost and net realisable value. Any write-
down to net realisable value is recognised in profit or loss. Cost
is determined on the weighted average-cost basis and when
a perpetual inventory system is not present it is determined
at the most recent purchase price. Net realisable value is an
estimate of the selling price in the ordinary course of business,
excluding the cost of completion and selling expenses.
16. Cash and cash equivalents
Cash and cash equivalents are initially recognised at fair
value and subsequently measured at amortised cost. For
the purposes of the cash-flow statement, cash and cash
equivalents comprise cash in hand, deposits held at call with
banks and investments in money market instruments, net of
bank overdrafts. In the statement of financial position, bank
overdrafts are included in borrowings under current liabilities.
Cash equivalents are short term highly liquid investments that
are readily convertible to known amounts of cash and which
are subject to insignificant changes in value.
17. Trade payables
Trade payables are obligations to pay for goods or services that
have been acquired in the ordinary course of business from
suppliers. Accounts payable are classified as current liabilities
if payment is due within one year or less (or in the normal
operating cycle of the business if longer). If not, they are
presented as non-current liabilities.
Trade payables are recognised initially at fair value and
subsequently measured at amortised cost using the effective
interest method.
18. Provisions
Provisions are recognised when the University has a present
legal or constructive obligation as a result of past events, it is
probable that an outflow of resources embodying economic
benefits will be required to settle the obligation, and a reliable
estimate of the amount of the obligation can be made.
Provisions are measured based on the best estimate of the
expenditure required to settle the present obligation at the
reporting date. Where the effect of the time value of money is
material, the amount of the provision is discounted to present
value using a pretax rate that reflects current assessments of
the time value of money. The increase in the amount of the
provision as a result of the passage of time is recorded in profit
or loss for the year.
19. Borrowings
Borrowings are recognised initially at fair value, net of
transaction costs incurred. Borrowings are subsequently stated
at amortised cost; any difference between the proceeds (net
of transaction costs) and the redemption value is recognised in
the income statement over the period of the borrowings using
the effective interest method.
Borrowings are classified as current liabilities unless the
University has an unconditional right to defer settlement of
the liability for at least 12 months after the year end.
20. Current and deferred income tax
The tax expense for the period comprises current and deferred
tax. Tax is recognised in the income statement, except to the
extent that it relates to items recognised directly in equity. In
this case, the tax is also recognised in equity.

2011 Financial Review 20
The current income tax charge is calculated on the basis
of the tax laws enacted or substantively enacted at year
end in South Africa where the University’s subsidiaries and
associates operate and generate taxable income. Management
periodically evaluates positions taken in tax returns with
respect to situations in which applicable tax regulations is
subject to interpretation and establishes provisions where
appropriate on the basis of amounts expected to be paid to
the tax authorities.
Deferred income tax is provided in full, using the liability
method, on temporary differences arising between the tax
bases of assets and liabilities and their carrying amounts in
the consolidated financial statements. However, the deferred
income tax is not accounted for if it arises from initial
recognition of an asset or liability in a transaction other than
a business combination that at the time of the transaction
affects neither the accounting, nor taxable profit or loss.
Deferred income tax is determined using tax rates (and laws)
that have been enacted or substantially enacted by year end
and are expected to apply when the related deferred income
tax asset is realised or the deferred income tax liability is
settled.
Deferred income tax assets are recognised to the extent that it
is probable that future taxable profit will be available against
which the temporary differences can be utilised.
Deferred income tax is provided on temporary differences
arising on investments in subsidiaries and associates, except
where the timing of the reversal of the temporary difference is
controlled by the group and it is probable that the temporary
difference will not reverse in the foreseeable future.
21. Postemployment benefits
21.1 Pension and provident fund contributions
The University contributes towards two pension schemes
namely the AIPF and the UP Pension Fund as well as towards
one provident fund known as the UP Provident Fund. The
AIPF is registered and managed in terms of the Pension Funds
Act for Associated Institutions. The UP Pension Fund and
the UP Provident Fund are managed by Boards of Trustees
and are registered in terms of the provisions of the Pension
Funds Act. The schemes are funded through payments to
trustee-administered funds, determined by periodic actuarial
calculations.
A defined contribution plan is a pension plan under which
the entity pays fixed contributions into a separate entity. The
entity has no legal or constructive obligations to pay further
contributions if the fund does not hold sufficient assets to
pay all employees the benefits relating to employee service
in the current and prior periods. A defined benefit plan is a
pension plan that is not a defined contribution plan. Following
the above-mentioned definitions, the University therefore
contributes towards one defined contribution plan (the AIPF
Fund) and two defined benefit plans (the UP Pension Fund and
the UP Provident Fund). The UP Provident Fund is a “defined
contribution” plan with regards to members’ retirement
benefits. However, the disability and death benefits stipulated
in the rules of the Provident Fund represent a “defined benefit”
component. As a result of the defined benefit component, the
UP Provident Fund is classified as a defined benefit plan.
The asset recognised in the statement of financial position
in respect of defined benefit plan is measured at the lower
of (1) the fair value of the plan assets less the present value
of the defined benefit obligation at year end together with
adjustments for unrecognised actuarial gains or losses and
past service costs; and (2) the sum of the present value of any
economic benefits in the form of refunds from the plan or
reductions in future contributions to the plan and any balance
of unrecognised actuarial losses or unrecognised past service
costs. The defined benefit obligation is calculated annually
by independent actuaries using the projected unit credit
method. The present value of the defined benefit obligation is
determined by discounting the estimated future cash outflows
using interest rates of high-quality corporate bonds that are
denominated in the currency in which the benefits will be paid
and that have terms to maturity approximating to the terms
of the related pension liability.
For defined contribution plans, the University pays
contributions to privately administered pension insurance
plans on a mandatory, contractual or voluntary basis.
The University has no further payment obligations once
the contributions have been paid. The contributions are
recognised as employee benefit expense when they are due.
Prepaid contributions are recognised as an asset to the extent
that a cash refund or a reduction in the future payments is
available.

2011 Financial Review 21
Actuarial gains and losses are recognised immediately in the
year in which they occur. Actuarial gains and losses arising
from experience adjustments are charged or credited to the
statement of comprehensive income.
Past-service costs are recognised immediately in income,
unless the changes to the pension plan are conditional on the
employees remaining in service for a specified period of time
(the vesting period). In this case, the past-service costs are
amortised on a straight-line basis over the vesting period.
21.2 Medical aid fund contributions
In accordance with the existing personnel practice, the Council
has undertaken to make certain medical aid fund contributions
on behalf of retired staff and certain future retirees.
The expected costs of these benefits are accrued over the period
of employment using the same accounting methodology as
used for defined benefit pension plans. Actuarial gains and
losses arising from experience adjustments are charged or
credited to income. These obligations are valued annually by
independent qualified actuaries.
Actuarial gains and losses are recognised immediately in the
year in which they occur in the statement of comprehensive
income.
22. Agency funds
There are funds administered on behalf of beneficiaries of
deceased employees and other third parties. These funds are
recognised at the fair value thereof and subsequently carried
at amortised cost.
These funds are held in available-for-sale investments or cash
and cash equivalents until payments are requested by the
beneficiaries of these funds.
23. Leave accrual
Members of staff with leave with gratuity value to their
credit at the end of 2006 had a choice of either disbursing
the accumulated leave (as at 31 December 2006) to them
at the end of March 2007, or to retain such leave credits in
the system at the value as determined above. Leave credits
retained will be disbursed to the relative staff member upon
termination of service or on request at any time after March
2007, at the value as at 31 December 2006.
24. Research costs
Research costs are written off in the year in which they arise,
since both these types of costs are inherent in the normal
operations of a university. Research costs are not recorded or
disclosed separately.
25. Borrowing costs
Borrowing costs incurred for the construction of any qualifying
asset are capitalised during the period of time that is required
to complete and prepare the asset for its intended use. Other
borrowing costs are expensed.

2 Consolidated statement of financial position
2011 Financial Review 22

2011 Financial Review 23
UNIVERSITY OF PRETORIA and its subsidiariesSUMMARISED CONSOLIDATED STATEMENT OF FINANCIAL POSITION AT 31 DECEMBER 2011
Notes 2011 2010
Rm Rm
ASSETS
Non-current assets 6 623 5 411
Property, plant and equipment 1 2 741 2 200
Intangible assets 2 268 164
Available-for-sale investments 3 3 075 2 469
Investment in associate companies 23 2 2
Defined benefit assets 9 445 481
Non-current loans and receivables 4 92 95
Current assets 2 255 2 780
Inventories 5 10 10
Defined benefit assets 9 6 64
Receivables and prepayments 6 341 299
Cash and cash equivalents 7 1 898 2 407
Total assets 8 878 8 191
EQUITY AND LIABILITIES
Total funds 7 428 6 774
Non-distributable reserves
Available-for-sale investment revaluation 352 472
Reserve funds
Restricted funds 4 238 3 870
Council designated funds 2 838 2 432
Non-controlling interest (6) 2
Non-current liabilities 374 285
Borrowings 8 18 15
Deferred income 12 311 237
Agency funds 24 45 33
Current liabilities 1 082 1 130
Trade payables, accruals and other liabilities 11 470 577
Deferred income 12 400 390
Student deposits 211 162
Provisions 10 1 1
Total funds and liabilities 8 878 8 191
2011 Financial Review 24
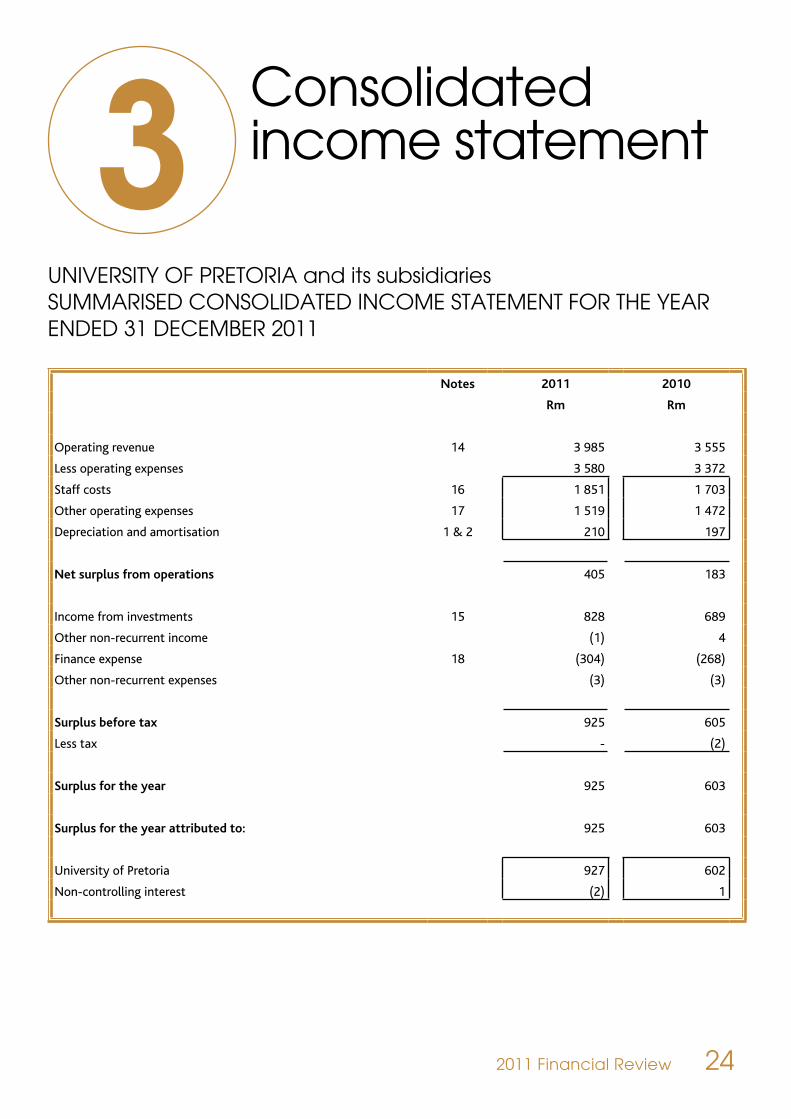
UNIVERSITY OF PRETORIA and its subsidiariesSUMMARISED CONSOLIDATED INCOME STATEMENT FOR THE YEAR ENDED 31 DECEMBER 2011
Notes 2011 2010
Rm Rm
Operating revenue 14 3 985 3 555
Less operating expenses 3 580 3 372
Staff costs 16 1 851 1 703
Other operating expenses 17 1 519 1 472
Depreciation and amortisation 1 & 2 210 197
Net surplus from operations 405 183
Income from investments 15 828 689
Other non-recurrent income (1) 4
Finance expense 18 (304) (268)
Other non-recurrent expenses (3) (3)
Surplus before tax 925 605
Less tax - (2)
Surplus for the year 925 603
Surplus for the year attributed to: 925 603
University of Pretoria 927 602
Non-controlling interest (2) 1
3 Consolidated income statement

2011 Financial Review 25
UNIVERSITY OF PRETORIA and its subsidiariesSUMMARISED CONSOLIDATED STATEMENT OF COMPREHENSIVE INCOME FOR THE YEAR ENDED 31 DECEMBER 2011
Notes 2011 2010
Rm Rm
Surplus for the year 925 603
Other comprehensive income for the year (273) 32
Actuarial gain/(loss) on defined benefit medical plan 9 (71) 23
Actuarial gain/(loss) on defined benefit pension plan 9 (60) (80)
Actuarial loss on defined benefit provident plan 9 (22) (58)
Fair value adjustment on available-for-sale investments 3 (120) 147
Total comprehensive income for the year 652 635
Total comprehensive income attributed to: 652 635
University of Pretoria 654 634
Non-controlling interest (2) 1
4 Consolidated statement of comprehensive income

2011 Financial Review 26
UNIVERSITY OF PRETORIA and its subsidiariesCONSOLIDATED STATEMENT OF CHANGES IN EQUITY FOR THE YEAR ENDED 31 DECEMBER 2011
Unrestricted operating
fund
Council designated
and restricted funds – other
Council designated
and restricted property, plant and equipment
funds
Restricted student
accommodation fund
Total
Rm Rm Rm Rm Rm Balance at 31-12-2009: credit 72 3 053 2 998 17 6 140
Net (decrease)/increase in funds 53 271 300 10 634
Net income – surplus 226 264 51 61 602
Other comprehensive income - 32 - - 32
Net transfers (to)/from other funds (173) (25) 249 (51) -
Balance at 31-12-2010: credit 125 3 325 3 297 27 6 774
Non-distributable reserves - 472 - - 472
Council designated 125 1 938 369 - 2 432
Restricted – other - 915 2 928 27 3 870
Balance at 31-12-2010: credit 125 3 325 3 297 27 6 774
Net (decrease)/increase in funds (54) 225 510 (27) 654
Net income – surplus 288 550 57 32 927
Other comprehensive income - (273) - - (273)
Net transfers (to)/from other funds (342) (52) 453 (59) -
Balance at 31-12-2011: credit 71 3 550 3 807 - 7 428
Non-distributable reserves - 352 - - 352
Council designated 71 2 239 528 - 2 838
Restricted – other - 959 3 279 - 4 238
5 Consolidated statement of changes in equity

2011 Financial Review 27
UNIVERSITY OF PRETORIA and its subsidiariesCONSOLIDATED STATEMENT OF CASH FLOWS FOR THE YEAR ENDED 31 DECEMBER 2011
Note 2011 2010
Rm Rm
CASH FLOW FROM OPERATING ACTIVITIES 865 830
Cash generated from operations 21 668 605
Interest and dividend income 15 198 229
Taxation (paid)/received (1) (4)
CASH FLOW FROM INVESTING ACTIVITIES (1 377) (803)
Purchase of property, plant and equipment 1 (737) (675)
Purchase of intangible assets 2 (122) (63)
Increase in available-for-sale investments 3 (1 917) (2 703)
Proceeds on disposal of property, plant and equipment 1 2
Proceeds on disposal of investments 1 398 2 637
CASH FLOW FROM FINANCING ACTIVITIES 3 4
Increase in interest-bearing borrowings 3 4
INCREASE IN CASH AND CASH EQUIVALENTS FOR THE YEAR (509) 30
CASH AND CASH EQUIVALENTS AT THE BEGINNING OF YEAR 2 407 2 377
CASH AND CASH EQUIVALENTS AT THE END OF YEAR 7 1 898 2 407
6 Consolidated statement of cash flows

2011 Financial Review 28
7Notes to the consolidated financial statements

2011 Financial Review 29
UNIVERSITY OF PRETORIA and its subsidiaries NOTES TO THE CONSOLIDATED FINANCIAL STATEMENTS FOR THE YEAR ENDED 31 DECEMBER 2011
1. Property, plant and equipment
Land and Buildings
Furniture, equipment and
vehicles
Library books and journals
Computer equipment
Total
Rm Rm Rm Rm Rm
Year ended 31 December 2010
Opening net carrying amount 1 394 197 - 126 1 717
Additions 487 111 51 27 676
Disposals/write-offs - (3) - (3) (6)
Depreciation charge (37) (42) (51) (57) (187)
Closing net carrying amount 1 844 263 - 93 2 200
At 31 December 2010
Cost 2 113 712 525 426 3 776
Accumulated depreciation (269) (449) (525) (333) (1 576)
Net carrying amount 1 844 263 - 93 2 200
Year ended 31 December 2011
Opening net carrying amount 1 844 263 - 93 2 200
Additions 518 116 50 53 737
Disposals/write-offs - (5) - (1) (6)
Depreciation charge (44) (47) (50) (49) (190)
Closing net carrying amount 2 318 327 - 96 2 741
At 31 December 2011
Cost 2 631 824 575 478 4 508
Accumulated depreciation (313) (497) (575) (382) (1 767)
Net carrying amount 2 318 327 - 96 2 741
A complete schedule of land and buildings is available at the administration building of the University of Pretoria. Buildings to the amount of R126,9 m (2010: R116,5 m) included above, were erected on land belonging to the Gauteng Administration. Included in land and buildings is expenditure of R61,9m (2010: R347,2 m) which relates to projects, that are still under construction.

2011 Financial Review 30
2. Intangible assets
Artwork
Enterprise resource planning system
Total
The University of Pretoria approved the phased replacement of a number of Legacy applications in various domains. The primary objective of the project is to provide the University of Pretoria with a fully integrated Enterprise Resource Planning system.
Amortisation of intangible assets are included in “depreciation and amortisation” in the income statement.
Rm Rm Rm
As at 31 December 2010
Opening carrying amount 14 96 110
Additions - 64 64
Amortisation charge - (10) (10)
Closing carrying amount at end of the year 14 150 164
Cost 18 160 178
Accumulated amortisation (4) (10) (14)
14 150 164
As at 31 December 2011
Opening carrying amount 14 150 164
Additions 1 121 122
Amortisation charge - (18) (18)
Closing carrying amount at end of the year 15 253 268
Cost 19 281 300
Accumulated amortisation (4) (28) (32)
Accumulated amortisation
15 253 268
Remaining amortisation period n/a 9 years
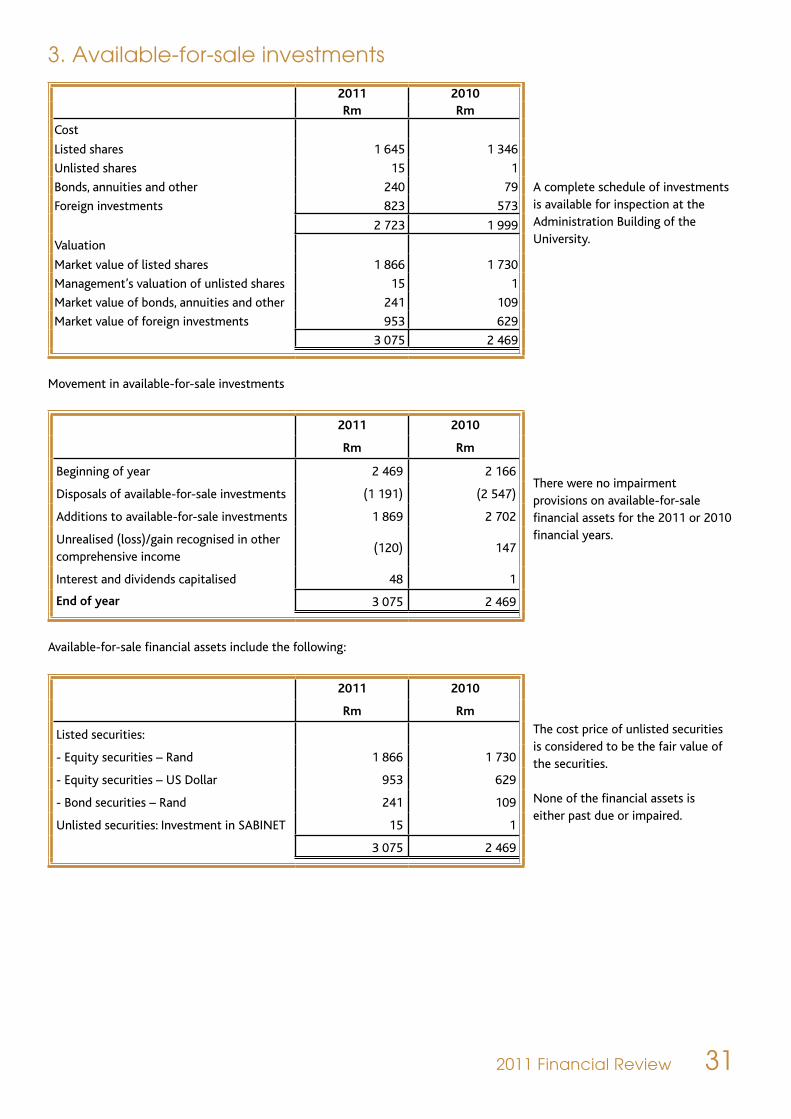
2011 Financial Review 31
3. Available-for-sale investments
2011 2010
A complete schedule of investments is available for inspection at the Administration Building of the University.
Rm Rm
Cost
Listed shares 1 645 1 346
Unlisted shares 15 1
Bonds, annuities and other 240 79
Foreign investments 823 573
2 723 1 999
Valuation
Market value of listed shares 1 866 1 730
Management’s valuation of unlisted shares 15 1
Market value of bonds, annuities and other 241 109
Market value of foreign investments 953 629
3 075 2 469
Movement in available-for-sale investments
2011 2010
There were no impairment provisions on available-for-sale financial assets for the 2011 or 2010 financial years.
Rm Rm
Beginning of year 2 469 2 166
Disposals of available-for-sale investments (1 191) (2 547)
Additions to available-for-sale investments 1 869 2 702
Unrealised (loss)/gain recognised in other comprehensive income
(120) 147
Interest and dividends capitalised 48 1
End of year 3 075 2 469
Available-for-sale financial assets include the following:
2011 2010
The cost price of unlisted securities is considered to be the fair value of the securities.
None of the financial assets is either past due or impaired.
Rm Rm
Listed securities:
- Equity securities – Rand 1 866 1 730
- Equity securities – US Dollar 953 629
- Bond securities – Rand 241 109
Unlisted securities: Investment in SABINET 15 1
3 075 2 469

2011 Financial Review 32
Available-for-sale financial assets are denominated in the following currencies:
2011 2010The maximum exposure to credit risk at reporting date is the fair value of bond securities available-for-sale.
The maximum exposure to equity price risk is the fair value of equity in available-for-sale investments.
Rm Rm
Rand 2 122 1 840
US Dollar 953 629
3 075 2 469
4. Non-current loans and receivables
2011 2010 The current University policy is that all student loans are due within five years from the end of the financial year in which they were granted. The weighted average interest rate applied was as follows:Student loans: 6,32% (2010: 6,80%)Loans to employees: 6,58% (2010: 7,75%)
The fair value of student loans amount to R39,7 m (2010: R 27,2 m) at year end, discounted at the prime rate of 9% over 5 years. The fair value of staff loans amount to R4,0 m (2010: R3,0 m) at year end, discounted at the rate of 7% over 4 years.
Rm Rm
Financial assets: 76 79
Student loans 34 35
General funds 14 13
University funds 37 36
Less: Impairment provision (17) (14)
Loans to employees 5 4
Provident fund receivable 37 40
Non-financial assets: 16 16
Loan to SERA venture fund 15 15
Purco Agreement 1 1
92 95
Credit risk of student loans
2011 2010 Student loans that are less than two years past due date are not considered impaired. As of 31 December 2011, student debtors of R34,2 m (2010: R34,9 m ) were past due date but not impaired.
Rm Rm
Student loans past due and not impaired 34 35
Student loans impaired 17 14
Other student loans 51 49
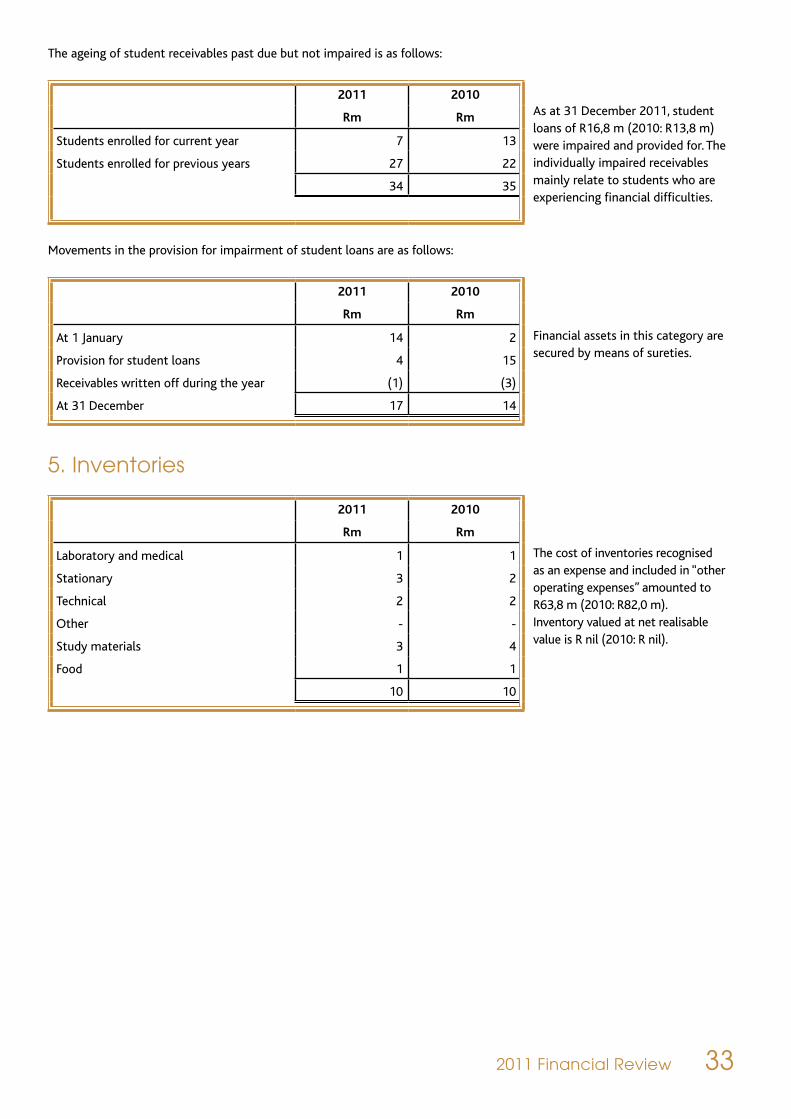
2011 Financial Review 33
The ageing of student receivables past due but not impaired is as follows:
2011 2010As at 31 December 2011, student loans of R16,8 m (2010: R13,8 m) were impaired and provided for. The individually impaired receivables mainly relate to students who are experiencing financial difficulties.
Rm Rm
Students enrolled for current year 7 13
Students enrolled for previous years 27 22
34 35
Movements in the provision for impairment of student loans are as follows:
2011 2010
Financial assets in this category are secured by means of sureties.
Rm Rm
At 1 January 14 2
Provision for student loans 4 15
Receivables written off during the year (1) (3)
At 31 December 17 14
5. Inventories
2011 2010
The cost of inventories recognised as an expense and included in “other operating expenses” amounted to R63,8 m (2010: R82,0 m). Inventory valued at net realisable value is R nil (2010: R nil).
Rm Rm
Laboratory and medical 1 1
Stationary 3 2
Technical 2 2
Other - -
Study materials 3 4
Food 1 1
10 10

2011 Financial Review 34
6. Receivables and prepayments
2011 2010
Rm Rm
Financial assets
Trade and other receivables 385 326
Student receivables 184 121
Other trade receivables 201 205
Less: Impairment provision (61) (46)
Student receivables (44) (34)
Other trade receivables (17) (12)
Non-financial assets
Prepayments 13 16
SARS 1 1
Payroll debtors 2 1
Other 1 1
17 19
Current portion 341 299
The fair values of trade and other receivables, which approximate their carrying values, are as follows:
2011 2010
Rm Rm
Trade receivables 324 280
Prepayments 13 16
SARS 1 1
Payroll debtors 2 1
Other 1 1
341 299
Credit risk of student receivables
2011 2010Student debtors less than two years past due date are not considered impaired.
As of 31 December 2011, student debtors of R139,9 m (2010: R86,5 m) were past due date but not impaired.
Rm Rm
Other trade receivables neither past due nor impaired - -
Other trade receivables past due and not impaired 140 87
Other trade receivables impaired 44 34
Other trade receivables 184 121
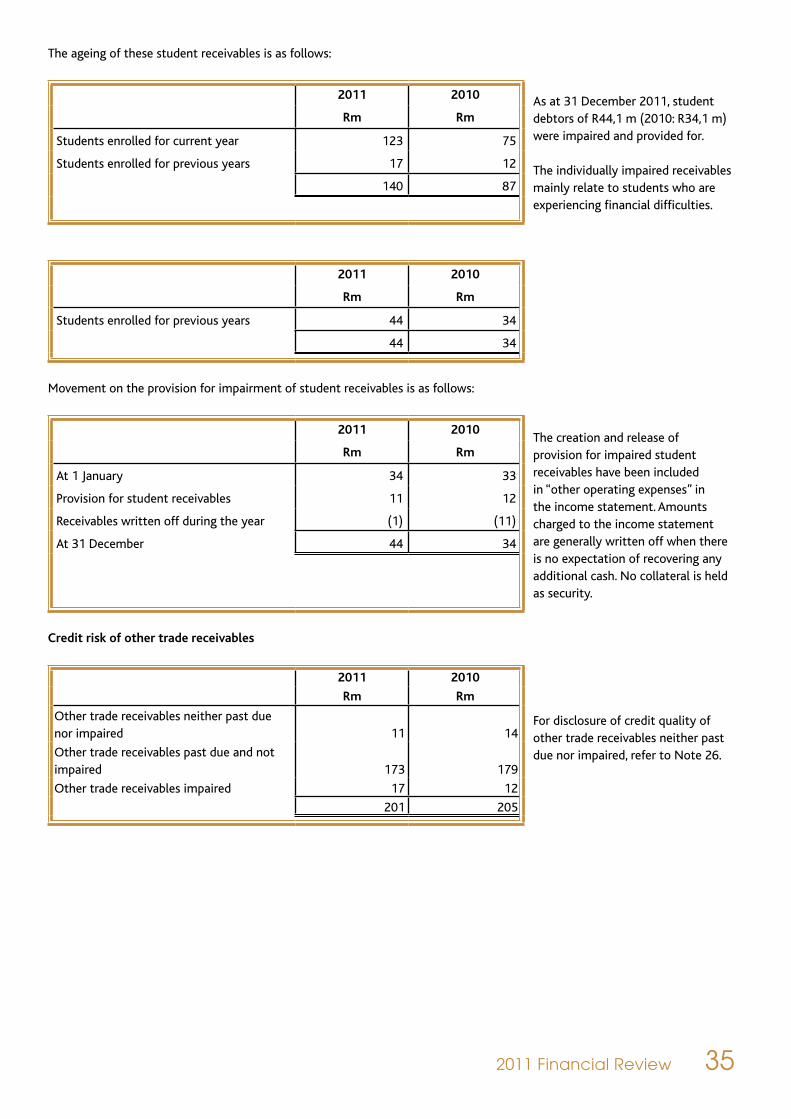
2011 Financial Review 35
The ageing of these student receivables is as follows:
2011 2010 As at 31 December 2011, student debtors of R44,1 m (2010: R34,1 m) were impaired and provided for.
The individually impaired receivables mainly relate to students who are experiencing financial difficulties.
Rm Rm
Students enrolled for current year 123 75
Students enrolled for previous years 17 12
140 87
2011 2010
Rm Rm
Students enrolled for previous years 44 34
44 34
Movement on the provision for impairment of student receivables is as follows:
2011 2010The creation and release of provision for impaired student receivables have been included in “other operating expenses” in the income statement. Amounts charged to the income statement are generally written off when there is no expectation of recovering any additional cash. No collateral is held as security.
Rm Rm
At 1 January 34 33
Provision for student receivables 11 12
Receivables written off during the year (1) (11)
At 31 December 44 34
Credit risk of other trade receivables
2011 2010
For disclosure of credit quality of other trade receivables neither past due nor impaired, refer to Note 26.
Rm Rm
Other trade receivables neither past due nor impaired 11 14
Other trade receivables past due and not impaired 173 179
Other trade receivables impaired 17 12
201 205

2011 Financial Review 36
2011 2010
Rm Rm
Amount of other receivables that were past due but not impaired
173 179
The ageing of these receivables is as fol-lows:
1 to 3 months past due 68 121
3 months + past due 105 58
173 179
As at 31 December, the following other trade receivables were impaired and pro-vided for
17 12
Movement on the provision for impairment of other receivables is as follows:
2011 2010 The creation and release of provision for impaired receivables are in “other operating expenses” in the income statement. Amounts charged to the income statement are generally written off, when there is no expectation of recovering any additional cash. The maximum exposure to credit risk at the reporting date is the fair value of the receivables. No collateral is held as security.
Rm Rm
At 1 January 12 10
Provision for other receivables 6 11
Receivables written off during the year (1) (9)
At 31 December 17 12
7. Cash and cash equivalents
2011 2010 The weighted average effective interest rate on short-term bank deposits was 5,75% (2010: 7%).Cash balances held by the University of R45,7 m (2010: R51,5 m) is not available for general use.
The carrying amounts of cash and cash equivalents approximate their fair value.
Rm Rm
Net cash on hand 234 260
Short-term investments 1 664 2 147
Cash at bank and with fund managers 1 593 2 090
Short-term deposits 71 57
1 898 2 407
8. Borrowings
2011 2010The bank borrowings and other current borrowings are unsecured. Redemption loans are guaranteed by Government.
Rm Rm
Non-current 18 15
Loans from related parties (note 24) 18 15
Total borrowings 18 15

2011 Financial Review 37
The interest rate exposure of the borrowings of the University was as follows:
2011
Rm
2010
Rm
At no interest 18 15
Total borrowings 18 15
Effective interest rates:
Redemption loans – weighted average rates 9,76% 9,69%
The carrying amounts and fair values of borrowings are as follows:
2011 2010
The fair value of redemption loans is based on undiscounted cash flows. The carrying amounts of borrowings, other than redemption loans approximate their fair value.
Rm Rm
Carrying amounts
Borrowings
Other loans 18 15
18 15
Fair values
Non-current borrowings
Other loans 18 15
18 15
Discount rate – redemption loans 7,5% 7,5%
2011 2010
Rm Rm
Maturity of borrowings:
Between 1 and 5 years 18 15
18 15
9. Post employment benefits
9.1 Pension scheme
In terms of section 1 of the Income Tax Act of 1962 and registration in terms of the Financial Services Board, the Fund is classified as a pension fund. The Fund provides defined benefits payable in a combination of lump sums and pensions on disability, death or retirement. A lump sum is payable on withdrawal. The assets of the UP Pension Fund are held independently of the University’s assets in a separate trustee-administered fund. The UP Pension Fund is wholly funded. The UP Pension Fund is valued by an independent actuary at least every three years. The latest actuarial valuation was carried out at 31 December 2009.
The University accounts for postemployment benefits according to its accounting policy note 21.

2011 Financial Review 38
The information for IAS 19 purposes for the period is as follows:
2011 2010
Rm Rm
Balance at the end of the year
Present value of funded obligations ( 1 340) (1 209)
Fair value of plan assets 1 393 1 325
Defined benefit asset recognised 53 116
The amounts recognised on the statement of financial position are as follows:
2011 2010
Rm Rm
Defined benefit pension asset – Non- current portion
47 81
Defined benefit pension asset – Current portion
6 35
53 116
The movement in the defined benefit obligation over the year is as follows:
2011 2010
Rm Rm
Present value of obligation at the beginning of the period
1 209 1 028
Interest cost 106 88
Current service cost 44 36
Benefits paid ( 58) ( 49)
Actuarial (gain)/loss on obligation 39 106
Present value of obligation at the end of the period
1 340 1 209
The movement in the fair value of plan assets over the year is as follows:
2011 2010
Rm Rm
Fair value of plan assets at the beginning of the period
1 324 1 210
Expected return on plan assets 130 120
Contributions – employee 18 17
Benefits paid ( 57) (49)
Actuarial gain/(loss) on plan assets (22) 27
Fair value of plan assets at the end of the period
1 393 1 325
The actual return on plan assets 109 146

2011 Financial Review 39
The amounts recognised in the income statement and statement of comprehensive income is as follows:
2011 2010
Rm Rm
Current service cost 44 37
Interest cost 106 88
Expected return on plan assets (130) (120)
Actuarial (gain)/loss on obligation 38 106
Actuarial (gain)/loss on plan assets 22 (26)
Included in: 80 85
Actuarial (gain)/loss on defined benefit pen-sion plans – other comprehensive income
60 80
Interest cost on defined benefit pension plans
106 88
Expected return on defined benefit pension plans
(130) (120)
Personnel costs 44 37
Expected return on plan assets
The expected return on plan assets is calculated using the adjusted return as follows:
% invested 2011 2010
Combined return estimated 10,00% 10,08%
Bonds 40% 3,65% 3,31%
Equities (Bonds + 3%) 60% 6,35% 6,77%
The expected return on plan assets is calculated using the discount rate plus an equity premium.

2011 Financial Review 40
The principal actuarial assumptions used were as follows:
2011 2010
Surplus as a % of liabilities 3,96% 9,56%
Surplus as a % of assets 3,81% 8,73%
Expected rate of return on plan assets 10,00% 10,08%
Discount rate: preretirement
Gross discount rate 8,83% 8,28%
Pension increases (general inflation) 6,35% 5,48%
Salary inflation at age 35 8,44% 8,44%
Salary inflation at age 40 7,92% 7,92%
Salary inflation at age 45 7,44% 7,44%
Salary inflation at age 65 6,35% 5,94%
Number of employees who are members of the UP Pension Fund
451 499
Number of pensioners of the UP Pension Fund
561 543
Postretirement mortality – tables PA(90) PA(90)
The major categories of plan assets as a percentage of total plan assets are as follows:
2011 2010
SA equities 38,4% 45,0%
SA bonds 9,2% 8,1%
Cash and cash equivalents 34,1% 30,1%
International equities 15,0% 14,3%
International bonds 3,3% 2,7%
Amounts for the latest actuarial valuation and previous four periods are as follows:
2008 2009 2010 2011
Estimated employer contributions to be paid for the financial year ending 31 December 2012 is expected to be R34,7 m
Rm Rm Rm Rm
Defined benefit obligation (781) (1 028) (1 209) (1 340)
Fair value of plan assets 1 160 1 210 1 325 1 393
Accounting surplus 379 182 116 53
Experience adjustments on plan liabilities 9 (19) 106 39
Experience adjustments on plan assets 27 (51) (26) 22
During 2011, the University’s contributions to the pension fund were financed from the employer surplus account in the fund. This position will be maintained for 2012. At 31 December 2011, the balance of the employer surplus account amounted to R5,5 m (2010: R31,4 m).
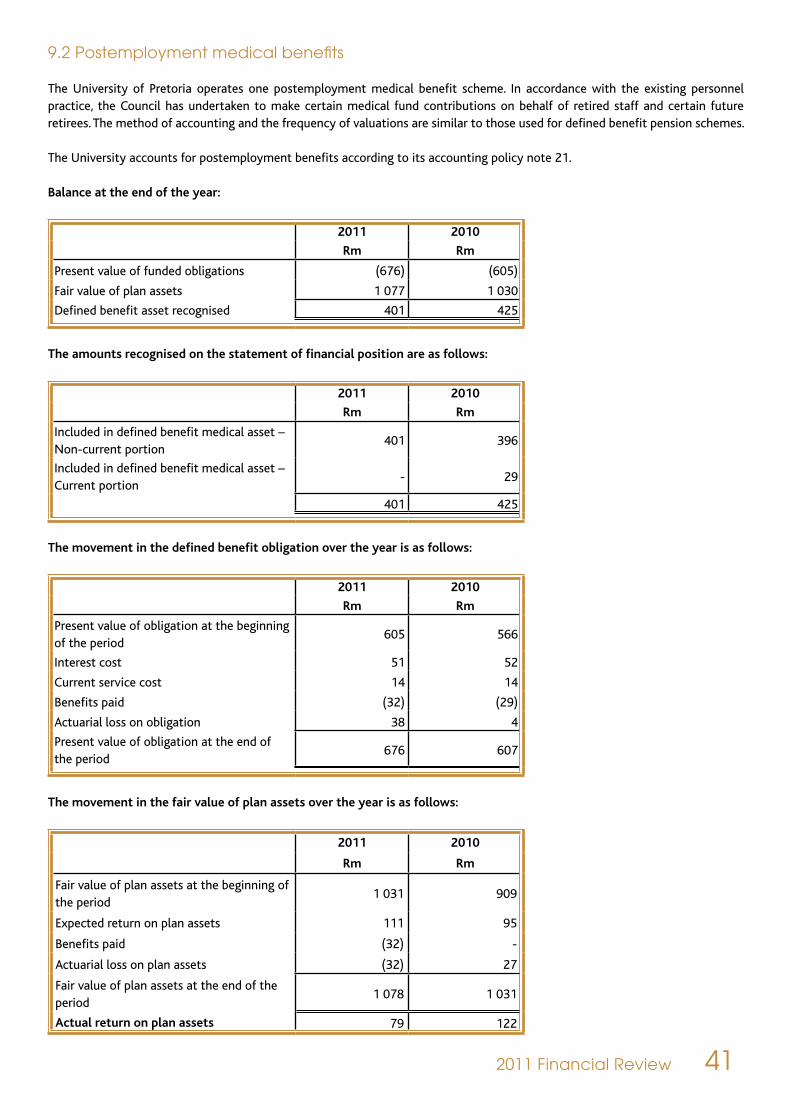
2011 Financial Review 41
9.2 Postemployment medical benefits
The University of Pretoria operates one postemployment medical benefit scheme. In accordance with the existing personnel practice, the Council has undertaken to make certain medical fund contributions on behalf of retired staff and certain future retirees. The method of accounting and the frequency of valuations are similar to those used for defined benefit pension schemes.
The University accounts for postemployment benefits according to its accounting policy note 21.
Balance at the end of the year:
2011 2010
Rm Rm
Present value of funded obligations (676) (605)
Fair value of plan assets 1 077 1 030
Defined benefit asset recognised 401 425
The amounts recognised on the statement of financial position are as follows:
2011 2010
Rm Rm
Included in defined benefit medical asset – Non-current portion
401 396
Included in defined benefit medical asset – Current portion
- 29
401 425
The movement in the defined benefit obligation over the year is as follows:
2011 2010
Rm Rm
Present value of obligation at the beginning of the period
605 566
Interest cost 51 52
Current service cost 14 14
Benefits paid (32) (29)
Actuarial loss on obligation 38 4
Present value of obligation at the end of the period
676 607
The movement in the fair value of plan assets over the year is as follows:
2011 2010
Rm Rm
Fair value of plan assets at the beginning of the period
1 031 909
Expected return on plan assets 111 95
Benefits paid (32) -
Actuarial loss on plan assets (32) 27
Fair value of plan assets at the end of the period
1 078 1 031
Actual return on plan assets 79 122

2011 Financial Review 42
The amounts recognised in the income statement and statement of comprehensive income is as follows:
2011 2010
Rm Rm
Current service cost 14 14
Interest cost 51 52
Expected return on plan assets (111) (95)
Actuarial loss on obligation 39 4
Actuarial loss on plan assets 32 (27)
Included in: 25 (52)
Actuarial loss on postemployment medical plan – other comprehensive income
71 (23)
Interest cost on defined benefit plans 51 52
Expected return on defined benefit plans (111) (95)
Personnel costs 14 14
The principal actuarial assumptions used were as follows:
2011 2010
Medical cost inflation 7,10% 7,10%
Gross discount rate 8,50% 8,50%
Expected return on plan assets 10,80% 10,40%
Members - active 1 057 1 046
Members - pensioner 1 028 1 002
Retirement age 65 years 65 years
Mortality rate
Preretirement mortality
2011 2010
Table Table
Males SA 72–77 SA 72–77
Females (The rates in the table for a person 3 years younger)
SA 72–77 SA 72–77
Postretirement mortality
2011 2010
Males (The rates for a person 1 year younger)
PA (90) PA (90)
Females (The rates for a person 1 year younger)
PA (90) PA (90)
Rate of ill-health early retirement
2011 2010
Rate of ill-health early retirement 40% (SA 56–62) 40% (SA 56–62)
The mortality for ill-health retirements refers to a normal pensioner 10 years older

2011 Financial Review 43
Expected return on plan assets
The expected return on plan assets is determined by considering the expected returns available on the assets underlying the current investment policy. Expected yield on fixed interest investments are based on gross redemption yields as at year end. Expected returns on equity and property investments reflect long-term rates of return experienced in the respective markets.
The expected return on plan assets is calculated using the adjusted return as follows:
% invested 2011 2010
Combined return estimated 10,57% 10,42%
Equities (bonds + 3%) 50,5% 5,68% 5,96%
Bonds 29,5% 2,43% 2,69%
International equities (R186 + 4%) 20,0% 2,45% 1,76%
The expected return on plan assets is calculated using the discount rate plus an equity premium.
The major categories of plan assets as a percentage of total plan assets are as follows:
2011 2010
SA equities 50,5% 53,0%
SA bonds 29,5% 32,6%
International equities 20,0% 14,4%
Assumed healthcare fund cost trend rates have a significant effect on the amounts recognised in the income statement. A one percentage point change in assumed healthcare fund cost trend rates would have the following effects:
One percentage point increase
One percentage point decrease
2011 2010
Rm Rm
Effect on the aggregate of the service cost and interest cost
Nil Nil
Effect on defined benefit obligation 95 85
Expected employer contributions to postemployment benefits plans for the year ending 31 December 2012 is R14,8 m.
Amounts for the current and previous four periods are as follows:
2008 2009 2010 2011
Rm Rm Rm Rm
Defined benefit obligation 435 566 605 676
Fair value of the plan assets 809 909 1,030 1,077
Accounting surplus 374 343 425 401
Experience adjustments on plan liabilities 14 49 4 39
Experience adjustments on plan assets 7 - (27) 32

2011 Financial Review 44
9.3 Provident scheme
In terms of section 1 of the Income Tax Act of 1962 and registration in terms of the Financial Services Board, the Fund is classified as a provident fund. The Fund provides lump sum payments to members on retirement, retrenchment and withdrawal. The benefits payable on retirement, retrenchment and withdrawal are defined contribution benefits. The Fund also provides lump sum benefits payable as lifelong pensions on death and recognised disability. The benefits payable on death and on recognised disability are defined benefits. The University of Pretoria Provident Fund is a defined contribution plan but it also contains a defined benefit component. With regards to members’ retirement benefits, the Fund is a “defined contribution” plan. However, the disability and death benefits stipulated in the rules of the Provident Fund represent a “defined benefit” element.
The assets of the UP Provident Fund are held independently of the University’s assets in a separate trustee-administered fund. The UP Provident Fund is wholly funded. The UP Provident Fund is valued by an independent actuary at least every three years. The latest actuarial valuation was carried out at 31 December 2009.
The University accounts for postemployment benefits according to its accounting policy note 21.
The information for IAS 19 purposes for the period is as follows:
Balance at the end of the year:
2011 2010
Rm Rm
Present value of funded obligations (1,846) (1,669)
Fair value of plan assets 1,843 1,673
Defined benefit asset recognised (3) 4
The amounts recognised on the statement of financial position are as follows:
2011 2010
Rm Rm
Defined benefit provident asset – Non-current portion
(3) 4
Defined benefit provident asset – Current portion
- -
(3) 4
The movement in the defined benefit obligation over the year is as follows:
2011 2010
Rm Rm
Present value of obligation at the beginning of the period
1 670 1 509
Interest cost 147 128
Current service cost 150 129
Benefits paid (210) (136)
Actuarial loss/(gain) on obligation 90 40
Present value of obligation at the end of the period
1 847 1 670

2011 Financial Review 45
The movement in the fair value of plan assets over the year is as follows:
2011 2010
Rm Rm
Fair value of plan assets at the beginning of the period
1 673 1 549
Expected return on plan assets 174 156
Contributions – employer 138 122
Benefits paid (210) (136)
Actuarial (loss)/gain on plan assets 69 (18)
Fair value of plan assets at the end of the period
1 844 1 673
Actual return/(loss) on plan assets 243 138
The amounts recognised in the income statement and statement of comprehensive income is as follows:
2011 2010
Rm Rm
Current service cost 150 129
Interest cost 147 128
Expected return on plan assets (174) (156)
Actuarial (gain)/loss on obligation 91 40
Actuarial (loss)/gain on plan assets (69) 18
Included in: 145 159
Actuarial loss on defined benefit provident plan – other comprehensive income
22 58
Interest cost on defined benefit plans 147 128
Expected return on defined benefit plans (174) (156)
Personnel costs 150 129
Expected return on plan assets
The return on plan assets is calculated using the adjusted return as follows:
% invested 2011 2010
Combined return estimated 20,66% 10,08%
Bonds 40% 8,83% 3,31%
Equities (bonds + 3%) 60% 11,83% 6,77%
The expected return on plan assets is calculated using the discount rate plus an equity premium.

2011 Financial Review 46
The principal actuarial assumptions used were as follows:
2011 2010
Surplus as a % of liabilities (0,16)% 0,24%
Surplus as a % of assets (0,16)% 0,21%
Expected rate of return on plan assets 20,66% 10,08%
Gross discount rate 8,83% 8,28%
Pension increases (general inflation) 6,35% 6,77%
Salary inflation at age 35 8,85% 8,41%
Salary inflation at age 40 8,35% 7,92%
Salary inflation at age 45 7,85% 7,42%
Salary inflation at age 65 6,35% 5,94%
Number of employees who are members of the UP Provident Fund
2 813 2 657
Number of pensioners of the UP Provident Fund
209 196
Postretirement mortality tables PA (90) PA (90)
The major categories of plan assets as a percentage of total plan assets are as follows:
2011 2010
SA Equities 61,5% 61,0%
SA Bonds 14,9% 16,4%
Cash & Cash Equivalents 6,7% 6,6%
International Equities 13,3% 13,0%
International Bonds 3,6% 3,0%
Amounts for the latest actuarial valuation and the previous two periods are as follows:
2008 2009 2010 2011
Rm Rm Rm Rm
Defined benefit obligation (1 335) (1 509) (1 670) (1 846)
Plan assets 1 361 1 549 1 673 1 843
Surplus/(deficit) 26 40 3 (3)
Experience adjustments on plan liabilities 138 63 40 90
Experience adjustments on plan assets (180) (42) 18 (69)
Estimated employer contributions to be paid for the financial year ending 31 December 2012 is R82,4 m.

2011 Financial Review 47
10. Provisions
ProvisionsLegalfees
provision A provision of R0,9 m (2010: R1,0 m) has been recognised for the possible legal fees and settlement to be paid for a claim of unfair dismissal brought forward by a former employee. It is expected that this expenditure will be incurred in the next financial year. The former employee seeks compensation in the amount of two years remuneration.
Rm
At 1 January 1
As at 31 December 1
Analysed as:
Current 1
1
11. Trade payables, accruals & other liabilities2011 2010
The fair value approximates the carrying amounts.
Rm Rm
Financial liabilities 322 416
Trade payables 228 199
Supplementation of transfer values from AIPF to UP provident fund
11 111
Advance – NRF 2 11
Accrued expenses 81 95
Non-financial liabilities 148 161
Leave with gratuity value 10 10
Non-accumulative leave 110 117
Bonus accrual 5 4
Receiver of Revenue – VAT 1 1
Department of Health: Joint appointments 16 15
Deposits held in custody for others 6 14
Total 470 577
Leave accrual
Staff with leave with gratuity value to their credit at the end of 2006 had a choice of disbursing the accumulated leave (as at 31 December 2006) to them at the end of March 2007 or to retain such leave credits in the system at the value as determined above.
Leave credits retained will be disbursed to the relative staff member upon termination of service or on request at any time after March 2007, at the value as at 31 December 2006. As it is difficult to predict which portion of the liability will be disbursed to staff in 2011, the total accrual is treated as current.
The portion of non-accumulative leave that is not used within a period of twelve months expires at the end of the period. For this reason the non-accumulative leave is treated as current.

2011 Financial Review 48
12. Deferred income
2011 2010 Contract work is invoiced in advance. During the contract term claims are received for work done. Recognition of this income is limited to expenses incurred. The balance is recognised as deferred income in the statement of financial position. Claims received in advance for future contracts are also recorded as provisions against the income.
The University recognises grants received, to compensate for expenses incurred, as income. These grants are subject to various requirements and therefore they are recognised over a certain period (specific to each grant) under the terms of the grant. The recognition of this income is limited to the expenses incurred. The balance is recognised as deferred income in the statement of financial position.
Rm Rm
At 1 January 627 497
Charged to the income statement
Received during the year 607 476
Recognised during the year (523) (346)
As at 31 December 711 627
Analysed as:
Current 400 390
Non-current 311 237
711 627
13. State appropriations – subsidies and grants
2011 2010State appropriations – subsidies and grants received are accounted for as grants related to income.Refer accounting policies note 3 and 4 for more detail.
Rm Rm
Subsidy for general purpose 1 652 1 405
1 652 1 405
14. Operating revenue
2011 2010
Rm Rm
State appropriations – subsidies and grants (refer to note 13)
1 652 1 405
Tuition and other fee income 1 220 1 134
Income from contracts
For research 112 105
For other activities 363 328
Rendering of services 456 488
Donations and gifts 182 95
3 985 3 555

2011 Financial Review 49
15. Income from investments
2011 2010
Rm Rm
Available-for-sale investments 214 90
Gains on sales on available-for-sale investments 214 90
Interest and dividends 198 229
Interest income 163 216
Dividend income 35 13
Expected return on defined benefit plans (note 9) 416 370
828 689
16. Staff costs
2011 2010
Rm Rm
Salaries and wages 1 643 1 524
UP Pension fund: Postemployment benefits (note 9.1)
44 36
Postemployment medical benefits (note 9.2)
14 14
UP Provident fund: Postemployment ben-efits (note 9.3)
150 129
1 851 1 703
Academic professional 913 823
Other personnel 945 867
Non-accumulative leave accrual (7) 13
The number of persons employed by the University on 31 December is:
2011 2010
Full-time 4 371 4 434
Part-time (more than 15 hours per week) 426 612
Joint appointments – Full-time 470 511
Joint appointments – Part-time (more than 15 hours per week)
12 18
5 279 5 575

2011 Financial Review 50
17. Other operating expenses
The following items have been included in other operating expenses:
2011 2010
Rm Rm
Repairs and maintenance 115 98
Expenditure on computer equipment 47 31
Operating lease rentals 21 17
Plant and machinery 11 9
Property 10 8
Auditor’s remuneration 5 4
- as auditor 3 2
- other
Bad debts 21 39
Bursaries 347 294
Management fees in relation to available-for-sale investments
20 11
Operating leases – group company is lessee
The future minimum lease payments under non-cancellable operating leases are as follows:
2011 2010 The University leases photocopiers and fax machines under various agreements which terminate between 2011 and 2013. The agreements do not include an extension option.
Rm Rm
No later than 1 year 3 6
Later than 1 year and no later than 5 years 5 4
8 10
18. Finance expense
2011 2010
Rm Rm
Interest cost on defined benefit plans (note 9)
304 268
304 268

2011 Financial Review 51
19. Contingencies
Contingent liabilities
19.1 Housing and loan scheme
At 31 December 2011, the University had contingent liabilities in respect of bank and other guarantees and other matters arising in the ordinary course of business from which it is anticipated that no material liabilities could arise. In the ordinary course of business, the University has given guarantees amounting to R0,1 m (2010: R0,1 m) to third parties in respect of housing loans granted to employees. The instalments on these loans are paid directly from the employees’ remuneration to the bank. In the event of resignation, the bond is increased with the growth in market value, thereby releasing the University of its Guarantee. Employees are expected to honour their obligations in respect of their housing loans and therefore no future cash flows from the University are expected.
19.2 Legal actions
Management are not aware of any ongoing significant legal matters.
19.3 Bank guarantees
Bank guarantees to creditors was issued to the amount of R2,9 m (2010: R4,9 m), during the normal course of business (such as the placing of orders and services to be rendered). Funds are available from existing sources.
20. Contractual obligations in respect of expenses
The following commitments existed on 31 December in respect of contracts concluded and orders placed:
2011 2010
Rm Rm
Buildings 274 826
Intangible assets: Systems renewal project - 1
Operating expenditure, including movable assets
180 134

2011 Financial Review 52
21. Cash generated from operations
2011 2010
Rm Rm
Reconciliation of surplus to cash generated from operations:
Surplus before tax 925 605
Adjustments for:
Non-cash items
- Depreciation 192 187
- Amortisation 18 10
- Expected return on defined benefit plans (416) (370)
- Interest cost on defined benefit plans 304 268
- Current service cost on defined benefit plans
207 179
Contributions on defined benefit plans (155) (140)
Medical fund benefits paid by the Univer-sity
- (29)
Loss/(Profit) on sale of property, plant and equipment
4 3
Dividend income (35) (13)
Interest income (163) (216)
Profit on sale of investments (214) (90)
Increase in agency funds 13 (9)
Changes in working capital (12) 220
(Increase)/Decrease in trade and other receivables
(42) (84)
Increase in interest-bearing non-current receivables
3 (29)
(Increase)/Decrease in inventories 1 (3)
Increase in trade and other payables 26 336
Cash generated from operations 668 605
22. Related party transactions
22.1 Key management personnel
The following are considered to be related parties to the University:• University Council members• Management comprises the Executive, Deans of faculties, Directors of support service departments and Directors of subsidiaries
Compensation paid to key management and members of Council
Members of Council
Manage-ment
2011 2010
The motor vehicle loans are unsecured, interest bearing and repayable over 48 months. Refer to note 4 for applicable rates.
R’000 R’000 R’000 R’000
Salaries and other short-term employee benefits
394 67 388 67 782 67 404
Postemployment benefits - - - -
Other long-term benefits - - - -
Loans to Management
Motor vehicle loans - 4 990 4 990 3 754

2011 Financial Review 53
22.2 Subsidiaries
The University of Pretoria controls and owns 100% of the shares of the following companies and trust:- TuksSport (Pty) Ltd - Enterprises at University of Pretoria (Pty) Ltd (dormant)- Research Enterprises at University of Pretoria (Pty) Ltd (dormant)- Health Enterprises at University of Pretoria (Pty) Ltd (dormant)- TuksFM Trust
The University of Pretoria is the sole beneficiary of Enterprises at University of Pretoria Trust. The Trust owns the following shareholding:- 100% in Business Enterprises at University of Pretoria (Pty) Ltd- 100% in Continuing Education at University of Pretoria Trust- 67,5% in InSiAva (Pty) Ltd- 75% in Vicva Investments (Pty) Ltd (dormant)- 50% in BALSS (Pty) Ltd (dormant)- 30% in Bookmark at UP (Pty) Ltd
The University of Pretoria is the sole beneficiary of TuksFM Trust.
Business Enterprises at University of Pretoria (Pty) Ltd owns 33% of the shares of Consulta Management Consulting (Pty) Ltd, 60% of the shares of Izandla Zethu Consulting (Pty) Ltd (deregistered 1 November 2011) and 100% of the shares of StratoScience (Pty) Ltd. StratoScience is currently dormant.
TuksSport (Pty) Ltd owns 100% of the shares of TS Soccer (Pty) Ltd.
22.3 Postretirement benefit plans
UP Provident FundUP Pension Fund
22.4 Transactions with related parties
No transactions other than loans, lease of office and administration fees have taken place between the University of Pretoria and its subsidiaries. All inter-group transactions were eliminated on consolidation.

2011 Financial Review 54
The following transactions were carried out with related parties:
2011 2010
The loans are unsecured and bear no interest. There is no bad debt written off during the year that relates to related parties.
R’000 R’000
Income from subsidiaries/trusts:
Consultation 15 191 11 725
Rental 4 633 5 056
Interest 59 59
Expenses to subsidiaries/trusts:
Subcontractor fees 5 573 6 908
Employer contributions paid to:
UP Provident Fund 137 800 122 200
UP Pension Fund - -
Amounts payable at year end to:
TuksSport (Pty) Ltd (Subsidiary) 3 257 1 910
Amounts receivable/(payable) at year end:
Associates
Consulta Management Consultants (Pty) Ltd
- 289
Subsidiaries
TuksSport (Pty) Ltd 1 065 695
Enterprises at University of Pretoria Trust 93 103 87 314
Loans to:
SERA (Pty) Ltd (Associate) 9 116 9 116
TuksSport (Pty) Ltd (Subsidiary) 12 035 11 379
Loans from:
SAIP Fund (Pty) Ltd (17 500) (15 018)
Provision for impairment:
SERA (Pty) Ltd (Associate) 9 116 9 116
TuksSport (Pty) Ltd (Subsidiary) 1 935 1 769

2011 Financial Review 55
2011 2010
R’000 R’000
Directors’ remuneration
- As director 567 530
- Other 548 477
2011 2010
R’000 R’000
Trustees’ remuneration
- As trustee 3 290 2 987
23. Investment in associate companies
2011 2010
R R
Shares at cost
SERA (Pty) Ltd – Unlisted 50 50
Bookmark at UP (Pty) Ltd – Unlisted 429 429
Consulta Management Consultants (Pty) Ltd – Unlisted
660 660
Change in control – Consulta Management Consultants (Pty) Ltd – Unlisted
228 785 228 785
Share of accumulated profit/(loss) since acquisition
SERA (Pty) Ltd – Unlisted (50) (50)
Bookmark at UP (Pty) Ltd – Unlisted (171 252) (58 932)
Consulta Management Consultants (Pty) Ltd – Unlisted
1 464 604 1 409 306
1 523 226 1 580 248
Percentage Holding
Number of shares held
2011 2010 2011 2010
SERA (Pty) Ltd – Unlisted 50% 50% 50 50
Bookmark at UP (Pty) Ltd – Unlisted 30% 30% 429 429
Consulta Management Consultants (Pty) Ltd – Unlisted
33% 33% 660 660
As of 1 January 2008, the 40% interest in Consulta Management Consultants (Pty) Ltd was diluted to a 33% holding due to a change in shareholding. Consulta Management Consultants (Pty) Ltd is included as an associate for 2011 and 2010. The University’s interest in Bookmark at UP (Pty) Ltd and Consulta Management Consultants (Pty) Ltd are accounted for using the equity method.

2011 Financial Review 56
The aggregate assets, liabilities and results of operations of associate companies for the financial year ended 31 December 2011 are summarised as follows:
SERA (Pty) Ltd*
Bookmark at UP (Pty) Ltd
Consulta Manage-ment Consultants
(Pty) LtdTotal 2011
R R R R
Total assets 52 765 307 3 799 646 5 726 647 62 291 600
Total liabilities
48 546 791 3 828 587 3 462 200 55 837 578
Revenue - 2 173 004 16 752 615 18 925 619
Profit or (loss)
(3 060 921) (374 451) 1 057 123 (2 378 249)
The aggregate assets, liabilities and results of operations of associate companies for the financial year ended 31 December 2010 are summarised as follows:
SERA (Pty) Ltd*
Bookmark at UP (Pty) Ltd
Consulta Manage-ment Consultants
(Pty) LtdTotal 2010
R R R R
Total assets 52 510 154 4 134 300 4 127 931 60 772 385
Total liabilities
48 561 221 4 192 800 2 109 222 54 863 243
Revenue - 4 586 760 14 520 853 19 107 613
Profit or loss 11 297 658 28 841 1 006 617 12 333 116
*The financial year-end of SERA (Pty) Ltd is 31 March. Results indicated above are based on unaudited financial statements for the year ended 31 December. The University has significant influence but not control over the company and therefore is included as an associate at cost and not as a subsidiary.
24. Agency funds
2011 2010
Rm Rm
Estate funds 19 21
SRC Club Assets 7 6
External bursaries 18 5
Other 1 1
45 33

2011 Financial Review 57
25. Financial instruments by category
Loans andreceiv-ables
Available-for-sale
investments
Total
Rm Rm Rm
31 December 2011
Assets as per statement of financial position
Available-for-sale financial investments (refer note 3)
- 3 075 3 075
Non-current loans and receivables (refer note 4)
76 - 76
Trade and other receivables (refer note 6) 324 - 324
Cash and cash equivalents (refer note 7) 1 898 - 1 898
Total 2 298 3 075 5 373
Other financialliabilities
Rm
TotalRm
Liabilities as per statement of financial position
Borrowings (refer note 8) 18 18
Trade payables, accruals and other liabili-ties (refer note11)
322 322
Total 340 340
Loans and receivables
Available-for-sale
investmentsTotal
Rm Rm Rm
31 December 2010Assets as per statement of financial posi-tion
Available-for-sale financial investments (refer note 3)
- 2 469 2 469
Non-current loans and receivables (refer note 4)
79 - 79
Trade and other receivables (refer note 6) 280 - 280
Cash and cash equivalents (refer note 7) 2 407 - 2 407Total 2 766 2 469 5 235

2011 Financial Review 58
Other financialliabilities
Total
R’000 R’000
Liabilities as per statement of financial position
Borrowings (refer note 8) 15 15
Trade payables, accruals and other liabili-ties (refer note11)
416 416
Total 431 431
26. Credit quality of financial assets
The credit quality of financial assets that are neither past due nor impaired can be assessed by reference to historical information about counterparty default rates:
2011 2010
Group 1 – existing trade receivables with some defaults in the past.
Group 2 – trade receivables outstanding less than 30 days with no/limited defaults in the past.
Rm Rm
Other trade receivables
Counterparties without external credit rating:
Group 2 11 14
Total other trade receivables (refer note 6)
11 14
2011 2010
Rm Rm
Cash at bank and short-term deposits
Fitch Ratings, Ltd F1+ 1 898 2 407
Total cash and cash equivalents (refer note 7)
1 898 2 407

2011 Financial Review 59
There are no student loans or student receivables that are neither past due nor impaired
2011 2010
R’000 R’000
Available-for-sale investments
AAA (Non-Government) 8 412 4 345
AA 34 136 2 172
A 52 573 26 069
BBB 52 573 28 242
BB 39 955 21 724
B 46 264 21 724
Unrated 6 572 4 604 Total Bonds, annuities and other (refer note 3) 240 485 108 880
Bonds are placed with Investec Asset Managers and Coronation Fund Managers and consist of South African corporate bonds.
27. Risk management
The University and its subsidiaries are exposed to a variety of financial risks: market risk (including foreign currency risk, interest rate risk and price risk), capital risk, credit risk and liquidity risk.
A Risk Management Committee comprising members of the Executive Committee, identifies, evaluates and co-ordinates the management of strategic risks faced by the University. Risk management processes are reviewed regularly for continuing relevance and effectiveness. The Risk Management Committee reports to the Executive Committee and to the Audit and Risk Management Committee of Council. A report on the risk management process that is being followed, as well as a summary of the risk register, are presented to the Audit and Risk Management Committee and to the Council of the University on a regular basis.
The University varies its investment philosophy by the term of the liabilities and the risk profile. To this end three portfolios have been established, namely:
• Long Term Capital (LTC) Portfolio – Long-term investing (at least 5 years) where the investment objective and risk constraint is set relative to consumer price inflation;
• Stable Portfolio – Medium-term investing (2 to 5 years) where the investment objective and risk constraint is set relative to inflation and a low risk of capital loss over the medium term;
• Money Market Portfolio – Short-term investing (2 years and less) where the investment objective and risk constraint is set relative to short term interest rates and a high degree of capital security.
The University’s investment channels have strong investment characteristics and no portfolios that have speculative characteristics are utilised.

2011 Financial Review 60
27.1 Financial risk factors
A. Market risk
(i) Foreign currency risk
The University and its subsidiaries have limited foreign exchange exposure in respect of normal operating activities. Foreign investments and foreign bank balances are subject to exchange rate fluctuations. The carrying amounts of financial instruments that are exposed to foreign currency risk are as follows:
2011 2010
Rm Rm
Foreign investments (USD) 953 630
CFC bank account 4 4
Total 957 634
Foreign currency sensitivity analysis ± 10% ± 10%
Foreign investments (USD) 96 63
Total 96 63
At 31 December 2011, if the USD had strengthened by 10% against the Rand with all other variables held constant, the surplus for the year would have been R95,7 m (2010: R63,4 m) higher, mainly as a result of a Rand increase in the fair value of USD denominated investments. If the USD had weakened by 10% against Rand with all other variables held constant, the surplus for the year would have been R95,7 m (2010: R63,4 m) lower, mainly as a result of a Rand decrease in the fair value of USD denominated investments. The 10% variation in the exchange rate is based on the average forward rate for 12 months in respect of the underlying currencies.
(ii) Price risk
The University and its subsidiaries are exposed to equity securities price risk because of investments held by the University and classified as available-for-sale investments. The University and its subsidiaries are not exposed to commodity price risk. To manage its price risk arising from investments in equity securities, the University and its subsidiaries diversify its portfolio. Diversification of the portfolio is done in accordance with the limits set by the Investment Committee.
Price sensitivity analysis
2011 2010
Rm Rm
± 10% ± 10%
Listed equities 282 236
At 31 December 2011, if the FTSE/JSE CAPI index increased/decreased by 10% with all other variables held constant and all the University’s equity instruments moved according to the historical correlation with the index, the other comprehensive income for the year would have been R281,9 m (2010: R236,0 m) higher/lower. Due to the unpredictability of equity market returns, a general indicative percentage of 10% is used to highlight the changes in market value on equity investments.

2011 Financial Review 61
(iii) Interest rate risk
The University and its subsidiaries have no significant interest-bearing liabilities and the University’s income and operating cash flows are substantially independent of changes in market interest rates and therefore no formal interest rate risk management policy exists.
Interest rate sensitivity analysis
2011 2010
Rm Rm
± 50 basis points ± 50 basis points
Cash, bank and cash equivalents 9 12
At 31 December 2011, if the interest rate had been 50 basis points higher/lower, the surplus would have been R9,5 m (2010: R12,0 m) higher/lower. The increase/decrease of 50 basis points in the interest rate is based on the assumption that interest rates on average may increase/decrease in increments of 50 basis points at a time.
B. Credit risk
Potential concentrations of credit risk consist mainly of short-term cash, cash equivalent investments, trade receivables, debt securities classified as available-for-sale financial assets and other receivables. The maximum exposure to credit risk is represented by the carrying amount of all financial assets subject to credit risk.
The University places cash and cash equivalents with reputable financial institutions and a multi-manager approach to the management of investments is followed in order to limit investment risk. Funds are invested in ten divergent portfolio managers (six local and four foreign), with specialist mandates developed to contain risk within set parameters. In order to hedge investment funds against fluctuations, the portfolio managers strive to invest some of the available funds abroad. Adjustments to the fair value of investments are recognised in a revaluation reserve until such time as the investment is sold, in which case the adjustment will be recognised in the income statement.
For detail regarding the nature of credit risk associated with individual assets, refer to notes 3, 4, 6 and 7.
Receivables comprise outstanding student fees, student loans and a number of customers, dispersed across different industries and geographical areas. The University is exposed to credit risk arising from student receivables related to outstanding fees. This risk is mitigated by requiring students to pay an initial instalment in respect of tuition and accommodation fees at registration, the regular monitoring of outstanding fees, the institution of debt collection action in cases of long outstanding amounts. In addition, students with outstanding balances from previous years of study are only permitted to renew their registration after either the settling of the outstanding amount or the conclusion of a formal payment arrangement. The University assists a limited number of financially needy students with loans. Although this represents a credit risk, the risk is mitigated in view thereof that the loans are secured by means of requesting two sureties per agreement. Credit valuations are performed on the financial condition of customers other than students.
C. Liquidity risk
The University and its subsidiaries have minimised risk of liquidity as shown by its substantial cash and cash equivalents. The University manages a cash budget which is continually updated and reported to the Investment Committee. Liquidity is also enhanced by investing in listed security instruments.

2011 Financial Review 62
The table below analyses the University’s financial liabilities into relevant maturity groupings based on the remaining period at the balance sheet date to the contractual maturity date. The amounts disclosed in the table are the undiscounted cash flows. Balances due within a year equal their carrying amount as the impact of discounting is not significant.
at 31 December 2011 Less than Between Between More than
1 year 2-3 years 4-5 years 5 years
R’000 R’000 R’000 R’000
Borrowings 93 17 500 - -
Trade payables, accruals and other liabilities 469 473 - - -
469 566 17 500 - -
at 31 December 2010 Less than Between Between More than
1 year 2-3 years 4-5 years 5 years
R’000 R’000 R’000 R’000
Borrowings 118 15 111 - -
Trade payables, accruals and other liabilities 577 425 - -
577 543 15 111 - -
D. Capital risk management
The University of Pretoria and its subsidiaries’ objectives when managing capital (which includes all items of capital and funds as presented on the Statement of Financial Position) are to safeguard the ability of the University of Pretoria and its subsidiaries to continue as a going concern and to maintain an optimal structure to reduce the cost of capital.
In order to maintain the capital structure, the University and its subsidiaries have ensured a sound financial position by limiting exposure to debt and increasing investment and cash balances. This objective is met by a well-planned budget process each year in which the critical strategic objectives of the University of Pretoria and its subsidiaries are addressed.
E. Fair value estimation
Financial instruments that are measured at fair value require disclosure of fair value measurements by level of the following fair value measurement hierarchy:
Level 1 – Quoted prices (unadjusted) in active markets for identical assets or liabilities.
Level 2 – Inputs other than quoted prices included within level 1 that are observable for the asset or liability, either directly (that is, as prices) or indirectly (that is, derived from prices).
Level 3 – Inputs for the assets or liabilities that are not based on observable market date (that is, unobservable inputs).
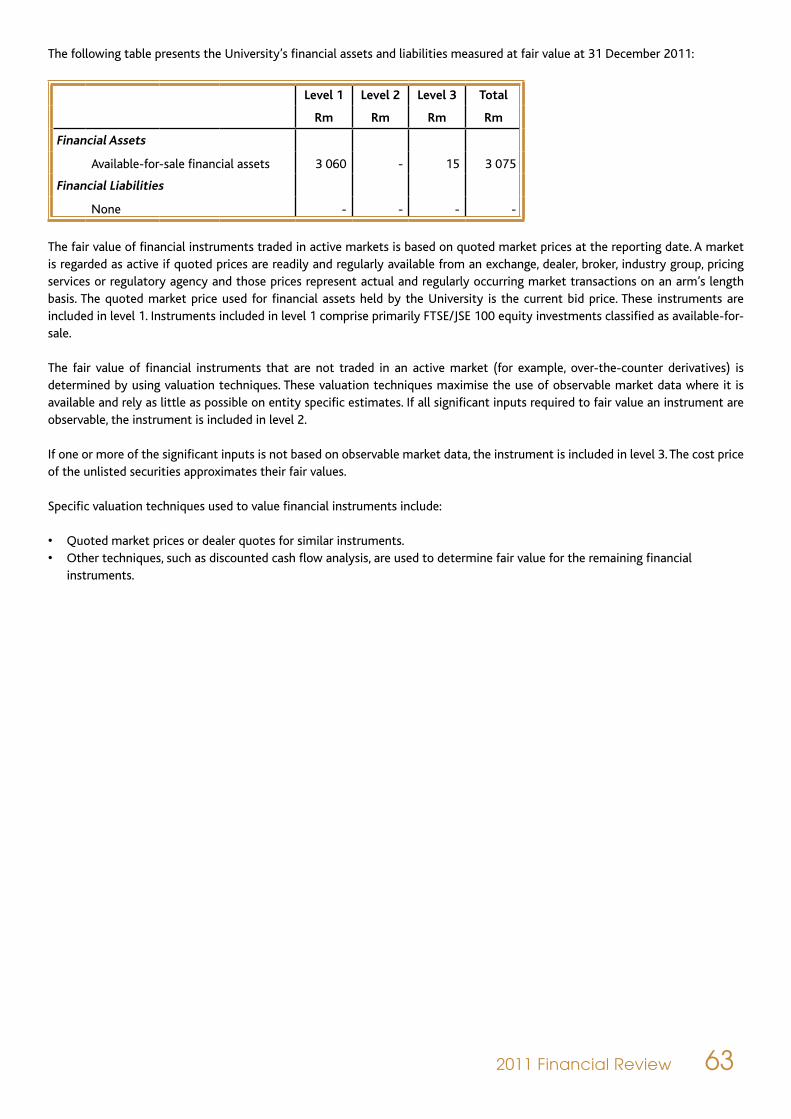
2011 Financial Review 63
The following table presents the University’s financial assets and liabilities measured at fair value at 31 December 2011:
Level 1 Level 2 Level 3 Total
Rm Rm Rm Rm
Financial Assets
Available-for-sale financial assets 3 060 - 15 3 075
Financial Liabilities
None - - - -
The fair value of financial instruments traded in active markets is based on quoted market prices at the reporting date. A market is regarded as active if quoted prices are readily and regularly available from an exchange, dealer, broker, industry group, pricing services or regulatory agency and those prices represent actual and regularly occurring market transactions on an arm’s length basis. The quoted market price used for financial assets held by the University is the current bid price. These instruments are included in level 1. Instruments included in level 1 comprise primarily FTSE/JSE 100 equity investments classified as available-for-sale.
The fair value of financial instruments that are not traded in an active market (for example, over-the-counter derivatives) is determined by using valuation techniques. These valuation techniques maximise the use of observable market data where it is available and rely as little as possible on entity specific estimates. If all significant inputs required to fair value an instrument are observable, the instrument is included in level 2.
If one or more of the significant inputs is not based on observable market data, the instrument is included in level 3. The cost price of the unlisted securities approximates their fair values.
Specific valuation techniques used to value financial instruments include:
• Quoted market prices or dealer quotes for similar instruments.• Other techniques, such as discounted cash flow analysis, are used to determine fair value for the remaining financial
instruments.

2011 Financial Review 64