Embed Size (px)
Citation preview
UNIVERSITY OF MINNESOTA
ST. ANTHONY TALffi HYDRAUTIC LABORATORYTORENZ G. STRAUB, Director
Technical Paper No. 18, Series B
Hydraulics of Closed Conduit Spillways
Parts II through VIIResults of Tests on Several Forms of the Spillway
by
Fred W. Blcisdell, Hydrculic EngineerUSDA, ANS
March 1958
Study conducted by
UNITED STATES DEPARTMENT OF AGRICUTTUREAGRICT'ITURAL RESEARCH SERVICE
SOII AND WATER CONSERVATION RESEARCH DIVISION
in cooperction with the
Minnesotq Agriculturcl Experiment Stqtioncnd the
St. Anthony Fclls Hydrculic Laborctory
Minnecpolis, Minnesolcr
UNIVERSITY OF MINNESOTA
ST. ANTHONY FALLS HYDRAULIC LABORATORY LORENZ G. STRAUB, Director
Technical Paper No. 18, Series B
Hydraulics of Closed Conduit Spillways
Parts II through VII Results of Tests on Several Forms of the Spillway
by
Fred W. Blaisdell, Hydraulic Engineer USDA, ARS
March 1958
Study conducted by
UNITED STATES DEPARTMENT OF AGRICULTURE AGRICULTURAL RESEARCH SERVICE
SOIL AND WATER CONSERVATION RESEARCH DMSION
in cooperation with the
Minnesota Agricultural Experiment Station and the
St. Anthony Falls Hydraulic Laboratory
Minneapolis, Minnesota
UNIVERSITY OF MINNESOTA
ST. ANTHONY FALLS HYDRAULIC LABORATORY
TORENZ G. STRAIE, Director
Techniccrl Pcper No. 18, Series B
Hydraulics of Closed Conduit Spillways
Parts II through VIIResults of Tests on Several Forms of the Spillway
by
Fred W. Blaisdell, Hydrculic Engineer
USDA, ARS
Mcnch 1958
Study conducted by
UNITED STATES DEPARTMENT OF AGBICUIfl'NE
AGRICI'ITURAL RESEARCH SERVICE
SOII AND WATER CONSERVATION NESEANCH DIVISION
in coopercrtion with the
Minnesoto Agriculturcl Experiment Stcrtionqnd the
St. Anthony Fclls Hydrcrulic tcborctory
Minnecpolis, Minnesotc
UNNERSITY OF MINNESOTA
ST. ANTHONY FALLS HYDRAULIC LABORATORY
LORENZ G. STRAUB, Director
Technical Paper No. 18, Series B
Hydraulics of Closed Conduit Spillways
Parts II through VII Results of Tests on Several Forms of the Spillway
by
Fred W. Blaisdell, Hydraulic Engineer USDA, ARS
March 1958
Study conducted by
...
UNITED STATES DEPARTMENT OF AGRICULTURE AGRICULTURAL RESEARCH SERVICE
SOIL AND WATER CONSERVATION RESEARCH DNISION
in cooperation with the
Minnesota Agricultural Experiment Station and the
St. Anthony Falls Hydraulic Laboratory
Minneapolis, Minnesota
A B S T R A q T
The theoryo f the hydrau l i cs o f c losed condu i t sp i l lways has been presented prev ious lyas Par t I o f th is repor t ser ies . Par ts I I to V I descr ibe the labora tory tes ts , record the ob-served f low phenomena, and g ive the d ischarge and pressure coef f i c len ts necessary fo r theapp l ica t i .onof the theory . Th is in fo rmat ion is g iven fo r f i ved i f fe ren t fo rmsof the c losed con-du i t sp i l lway , four o f wh ich arerecommended. The drop in le tdescr ibed in Par t I I i s no t rec-ommended because o f i t s poor hvdrau l i c per fo rmance.
The la rge reduc t ion in d ischarge caused by s t rong vor t i ces is p resented in Par t V I I .
1 1 r
ABSTRACT
The theory of the hydraulics of closed conduit spillways has been presented previously as Part I of this report series. Parts II to VI describe the laboratory tests, record the observed flow phenomena, and give the discharge and pressure coefficients necessary for the application of the theory. This information is given for five different forms of the closed conduit spillway, four of which are recommended. The drop inlet described in Part II is not rec-0mmended because of its poor hydraulic performance.
The large reduction in discharge caused by strong vortices is presented in Part VII.
iii
C O N T E N T S
AbstractList of FiguresList of Tables
FORWARD
PART II. CIRCULARDROP INLET WITH BELL CREST AND ELBOW BARRELENTRANCE
DESCRIPTION OF SPILLWAY
APPARATUS AND PROCEDURE. . .
DESCRIPTION OF FLOW
DISCHARGE COEFFICIENTS
Weir Coefficient
Orif ice Coefficient
Short Tube Coefficient
Entrance Loss Coefficient
PRESSURE COEFFICIENTS. .
CONCLUSIONS AND RECOMMENDATIONS
PART III. ENLARGED CIRCULAR DROPAND VITRIFIED CLAY TILE REDUCER
INLET WITH PIPE ELBOW AT BASEBARREL ENTRANCE
DESCRIPTION OF SPILLWAY
APPARATUS AND PROCEDURE. . .
DESCRIPTION OF FLOW
DISCHARGE COEFFICIENTS
Weir Coefficient
Entrance Loss Coefficient
PRESSURE COEFFICIENTS. .
CONCLUSIONS AND RECOMMENDATIONS
PART IV. SQUARE DROP INLET WITH SQUARE.EDGED CREST AND BELLBARREL ENTRANCE
DESCRIPTION OF SPILLWAY
APPARATUS AND PROCEDURE. . . .
DESCRIPTION OF FLOW
DISCHARGE COEFFICIENTS
Weir Coeff icient
Orif ice Coeff icient
Entrance Loss Coeff icient
PRESSURE COEFFICIENTS . .
CONCLUSIONS AND RECOMMENDATIONS
Page
ii ivi
vi i i
I
o
6
1 0
1 0
1
I
3
4
1 0
1 1
1 1
t 2
1 3
1 5
232 3
2 3
l 2
1 6
1 6
1 6
1 6
I 7
1 8
1 8
20
20
20
2 2
23
1V
CONTENTS
Page
Abstract. • . . • • • • • • . . . . . . • . . . . . • • • • • • • • • • • • • • • • • • • • • • . . • • • iii List of Figures • • • . . . • • • • • • • • • • • • • • • • . • . . . • • • • • • • • • • • . • • • • • vi List of Tables. . . • • • • • • • . • . • . • . • • • • • . . • . • • . • • . • • • • • . • . . • • . • viii
FORWARD. . • . . . . . • . • . . • . . . . . . . • . . • • • • . • • • • • • • • • • • • • • • • • • 1
P ART II. CIRCULAR DROP INLET WITH BELL CREST AND ELBOW BARREL ENTRANCE. . . . . . . . • • • • • • • • • • • • • • • • • • • • . • • . • • . • • . • • • . • . . 1
DESCRIPTION OF SPILLWAY • . • . . . . • . . • • • • • • • • • • . • • . • . • • . • 1
APPARATUS AND PROCEDURE. ••..••.••.• • •••.•. • • .••.•••• 3
DESCRIPTION OF FLOW •....•..•.•. • •••.••••. • .•.•••.•.. 4
DISCHARGE COEFFICIENTS. . . . . . . . . . • . . . . • . • • • • • • . • • • • • • • 6
Weir Coefficient .•..•..•••..••.••..•..•.•.•...•...• 6
Orifice Coefficient. . . . • . . • • . • . • • • . • • • • • . • . . . . • . • • • • • 10
Short Tube Coefficient .....••.•......•.•......••.•.•. 10
Entrance Loss Coefficient. . • . . • . • . . • • • . . • • • • • • • • . • • • • • 10
PRESSURE COEFFICIENTS. • . . • • • . . . . . . • • • • • • • . . • • • . . . • • . . 11
CONCLUSIONS AND RECOMMENDATIONS. . . . • . • . • • . • • • • • • • • • • • 11
PAR T III. ENLARGED CIRCULAR DROP INLET WITH PIPE ELBOW AT BASE AND VITRIFIED CLAY TILE REDUCER BARREL ENTRANCE •••........ 12
DESCRIPTION OF SPILLWAY. . . . . • . • . • . • • • • • • • • • . . • . • . • . . • 12
APPARATUS AND PROCEDURE. . • • . • . • • • • • • • • • . • . . • . . . • • . • • 13
DESCRIPTION OF FLOW •••.•..•.............••••.•...... 15 ".
DISCHARGE COEFFICIENTS. • . . . • . . . . . . . . • • . . . . • • • • • • . • . . . 16
Weir Coefficient .••.•.•...•..•.••..•••.•..•........ 16
Entrance Loss Coefficient. . . . . . . . . . • • . . . . . . • • . • . . • . . . . 16
PRESSURE COEFFICIENTS. . . . . . . • . • . . . . . . • • . . . • • • . • • • . . • . 16
CONCLUSIONS AND RECOMMENDATIONS. . . . . . . . • • • • • . . . . . . . . . 17
PART IV. SQUARE DROP INLET WITH SQUARE-EDGED CREST AND BELL BARREL ENTRANCE. . . . . . . • . . • . • . . • • . • • . • . • . • • . • . . . . . • • . • . 18
DESCRIPTION OF SPILLWAY. . . . . . . • . . • . • . . . . . . . . . . . . . . . . . 18
APP ARA TUS AND PROCEDURE. • • . • • • • • • . . • • • • . . . • • . . • . . . • . 20
DESCRIPTION OF FLOW .............•..•..••.•••.•....•. 20
DISCHARGE COEFFICIENTS. . . . . . . • . • . • • • • • • • • . . . . . . . . • . . . 20
Weir Coefficient ....•••••••.•.•.•.••••••••••••••.•• 22
Orifice Coefficient . . . . . . . • . . . . . . • . . • . . . . • • . • • . . . • . . . 23
Entrance Loss Coefficient • . • . . • • • • • • • • • • • • • . • • . • • • • . • • 23
PRESSURE COEFFICIENTS. . . . . . . . . . . . . • • . . • • • • . . . . • • • . . . . 23
CONCLUSIONS AND RECOMMENDATIONS. . . . . . . . • • . • . • • • • • • • • . 23
iv
Page
PART V. SQUARE DROP INLET WITH SQUARE.EDGED CREST AND SQUARE-EDGED BARREL ENTRANCE
DESCRIPTION OF SPILLWAY
APPARATUS AND PROCEDURE. . .
DESCRIPTION OF FLOW
DISCHARGE COEFFICIENTS
Weir Coefficient
Orif ice Coefficient
Entrance Loss Coefficient
PRESSURE COEFFICIENTS. .
CIRCULATION AROUND ANTI.VORTEX WALL
CONCLUSIONS AND RECOMMENDATIONS .
PART VI.CIRCULAR DR,OP INLET WITH SQUARE.EDGED AND ROUNDED CRESTSAND CONCRETE.PIPE.GROOVE BARREL ENTRANCE
DESCRIPTION OF SPILLWAY
APPARATUS AND PROCEDURE. . . .
DESCRIPTION OF.FLOW
DISCHARGE COEFFICIENTS
Weir Coefficient
E n t r a n c e L o s s C o e f f i c i e n t : . . . . . . . .P R E S S U R E C O E F F I C I E N T S . . . . . ? .
CONCLUSIONS AND RECOMMENDATIONS
PART VI I . EFFECT OF
INTRODUCTION
VORTEX AT INLET ON SPILLWAY DISCHARGE
CLOSED CONDUIT SPILLWAY SERIES L.?, L-B AND L.9
CLOSED CONDUIT SPILLWAY SERIES L.26
EFFECT OF VORTEX ON ORIFICE DiSCHARGE
EFFECT OF VORTEX ON DISCHARGE OF VERTICAL PIPESBinnie and Hookings
Rahm
SIMILITUDE OF VORTICES.o
HARSPRANGET DIVERSION TUNNEL
CONCLUSIONS AND RECOMMENDATIONS
24
24
2 7
2 9
2 9
2 9
3 2
3 2
3 3
3 3
3 5
t 1= a
A 1a r
3 6
J O
3 8
3 8
a t
A I
4 l
4 2
4 2
43
+ J
43
A A
44
+ o
1 i o
4 8
5 0
50ACKNOWLEDGEMENTS
Page
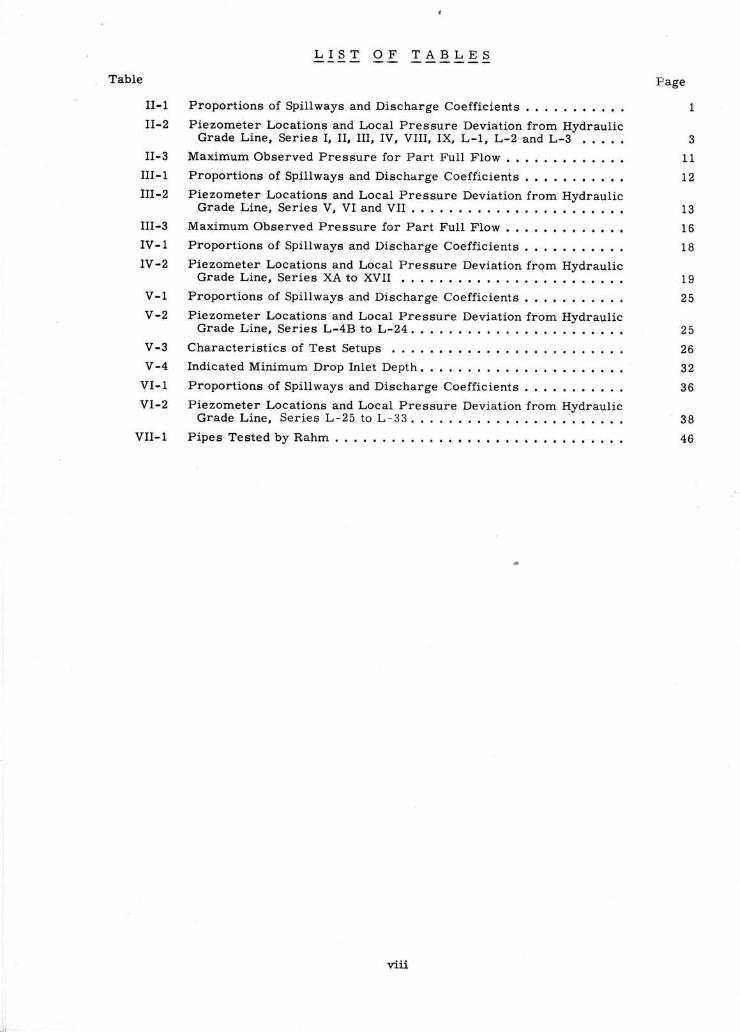
PART V. SQUARE DROP INLET WITH SQUARE-EDGED CREST AND SQUARE-E DGED BARREL ENTRANCE .....•....•........•..........•.. 24
DESCRIPTION OF SPILLWAY . . . . . . . . . . . . . . . . • . • . . . . . . . . . . . 24
AP PARA TUS AND PROCEDURE. . . . . . . • . • • • . . . . . . . . . . . . • . . . . 27
DESCRIPTION OF FLOW •...............••..•..•.••••.... 29
DISCHARGE COEFFICIENTS. . . . . . . . • . • • • • . . . . • • . . . . • . . . . . . 29
Weir Coefficient ....•....•.•..•..•.....••..•......• 29
Orifice Coefficient . . . . • • . . . . • . . . . . . . . • . . . . . . . . . . .. . . . 32
Entrance Loss Coefficient. . . . . • . . • . . . . . . . . . . . . . . . • . . • . 32
PRESSURE COEFFICIENTS. . . . . . . . . . • . . . . . . . . . . . . . . . . . . . • • 33
CIRCULATION AROUND ANTI-VORTEX WALL. • . . . • • . . • • . . . . . • . 33
CONCLUSIONS AND RECOMMENDATIONS. • . . . . . . . . . . . • . • . • • . . . 35
PART VI.CIRCULAR DROP INLET WITH SQUARE-EDGED AND ROUNDED CRESTS AND CONCRETE-PIPE-GROOVE BARREL ENTRANCE. . • • . • . . . • • . . . . . 36
DESCRIPTION OF SPILLWAY. • . • . . . . . . . . . . . . • • . . . . . • . . . . . . 36
APPARATUS AND PROCEDURE. . . . . . . . . • . . . . . . . . . . . . . . . . . . . 38
DESCRIPTION OF ·FLOW .............................•.•. 38
DISCHARGE COEFFICIENTS. . . . . . . . . . . . . . . . . . . • . . . . . • . . • . . 41
Weir Coefficient ............. • ..................... 41
Entrance Loss Coefficient. • . . . . . . . . . . . . • . . . . . . . . . . . . . . 41
PRESSURE COEFFICIENTS ...•.............•....... -1 • • • • • • 41
CONCLUSIONS AND RECOMMENDATIONS . . . . . . . . . . . . . . . . . . . . . . 41
P ART VII. EFFECT OF VORTEX AT INLET ON SPILLWAY DISCHARGE. • . . . 42
INTRODUCTION . • . . . • . . . . . . . . . . . . . . . . . . . • . . . . . . . . . . . . . 42
CLOSED CONDUIT SPILLWAY SERIES L-7, L-8 AND L-9 . . . . . . . . . . . 43
CLOSED CONDUIT SPILLWAY SERIES L-26 ••.. ................ 43
EFFECT OF VORTEX ON ORIFICE DISCHARGE. . . . . . . . . . . . . . . • • . 43
EFFECT OF VORTEX ON DISCHARGE OF VERTICAL PIPES. . . . . . . . . 44
Binnie and Hookings . . . . . . . . . • • . . • . . . • • . • • . • . . . . • • . . . 44
Rahm. . . . • . . . • • . . . . . . . . . . . . . • • . . . . . . • . • • . . . • . . . . 46
SIMILITUDE OF VORTICES. . . • . . . . . . . • . . • • • . . . • . . . . . . . . • • . 46 o
HARSPRANGET DIVERSION TUNNEL. . • . • . • • . . . . . . . . . . . . . . . . . 48
CONCL USIONS AND RECOMMENDATIONS. . . • . . • . . . . . . . . . . . . . . . 50
ACKNOWLEDGEMENTS. • . . . • . . . . . . . . . . • . . . . . . . . . . . . . . . . . 50
v
Figure
I I - 1
tr-2I I -3
rr-4I I .5
I I .6
II.7
I I .B
I I .9
I I - 1 0
I I -1 1
tr-12
I I . 1 3
III-1
III.2
III.3
III.4
I I I .5
III.6
I I I .?
IV -1
IV-2
IV .3
IV-4
ry-5rv-6
IV-7
IV.8
v -1
v-2v-3v-4v -5
v-6
v-7
a
L I S T O F F I G U R E S
Test Setups and Drop Inlet SpillwaysSurface of 6-in. Vitrif ied Clay Tile Pipe .
Head-Discharge Curves for Ser ies L-3. .
Weir Flow Conditions
Orifice Flow Conditions .
Weir Flow Conditions
Short T\rbe Flow .
Hydraulic Jump in Barrel Over Piezometer 7. . . .
Weir Flow Conditions
Pipe Flow Conditions
Head-Discharge and Head-Coefficient Curves for Weir Flow, Series I
Head-Discharge and Head-Coefficient Curves for Weir Flow, SeriesII, UI, IV, VUI and IX
Head-Discharge and Head-Coefficient Curves for Weir FIow, SeriesL-L, L-2 and L-3
Drop Inlet, Series V, VI and VII . .
Surface of B-in. Vitrif ied Clay Tile Pipe .
Head-Discharge Curve, Series VII . .
Weir Flow at Crest of Drop Inlet, Barrel Partly FuIl, Hf O . 0.36. .
Weir Flow at Crestof Drop Inlet, Slugs in Barrel, CirculationAroundH e a d w a l l , I J . f o = 0 . 9 4 . . . . . .
Conduit Completely FuII, Circulation Around Headwall, Hf D - t.4O .
Head-Discharge and Head-Coefficient Curves for Weir FIow, SeriesV, VI and YII . .
Drop Inlet, Series X-A to XVII, Inclusive
Drop Inlet and Barrel Entrance Except for Series XIVTFA
Drop Inlet and Barrel Entrance for Series XIV-A
Weir Flow at Crest of Drop Inlet .
Weir Flow at Crest of Drop Inlet .
Either the Weir or the Pipe Equation May be Used to Compute theFIow for These Conditions
Pipe Equation Determines Discharge . .
Inlet is Completely Submerged
Spillway Proportions and Piezometer Locations, Series L-48 to L-19,Inclusive
Test Setup for Series L-48.
Test Setup for Series L-5A to L-l3, lnclusive .
Test Setup for Ser ies L-18 and L-19
Weir Flow at Crest of Drop Inlet. Clinging Nappe Barrel Partly Full.No Air Flow. H/D = 0.33
Weir Flow at Crestof Drop Inlet. Napges Intersect in Drop Inlet En-training Air. Barrel Partly FuIf . H/D = 0.3?
Weir Flow at Crest of Drop Inlet. Clinging Nappes and Air Pocket inDrop Inlet. Barrel Partly{'u11 Excerel Near I ts Entrance. H/D = 0.60
Page
I
t 2
t 2
1 3
L 4
L 4
L 4
1 5
1 81 0
1 0
2 L
z t
2 L
2 2
2 2
24
2 6
2 7
2 8
3 0
3 0
3 0
vi
pt Air-Water Mixture Fil ls Bar-
LIST OF FIGURES
Figure
II-I Test Setups and Drop Inlet Spillways ...
11-2 Surface of 6-in. Vitrified Clay Tile Pipe
11-3 Head-Discharge Curves for Series L-3 .
11-4 Weir Flow Conditions .
11-5 Orifice Flow Conditions
11-6 Weir Flow Conditions
11-7 Short Tube Flow ....
II-B Hydraulic Jump in Barrel Over Piezometer 7.
11-9 Weir Flow Conditions
11-10 Pipe Flow Conditions.
II-II Head-Discharge and Head-Coefficient Curves for Weir Flow,Series I
11-12 Head-Discharge and Head-Coefficient Curves for Weir Flow, Series II, III, IV, VIII and IX .•........•......•..•.•..
11-13 Head-Discharge and Head-Coefficient Curves for Weir Flow, Series L-l, L-2 and L-3 ....•.........
111-1 Drop Inlet, Series V, VI and VII •.....
1II-2 Surface of B-in. Vitrified Clay Tile Pipe
III-3 Head-Discharge Curve, Series VII ....
111-4 Weir Flow at Crest of Drop Inlet, Barrel Partly Full, HID = 0.36.
111-5 Weir Flow at Crest of Drop Inlet, Slugs in Barrel, Circulation Around Headwall, HID = 0.94 ........•.•........•.•........
111-6 Conduit Completely Full, Circulation Around Headwall, HID = 1.40.
111-7
IV-l
IV-2
IV-3
IV-4
IV-5
IV-6
IV-7
IV-B
V-I
V-2
V-3
V-4
V-5
V-6
V-7
Head-Discharge and Head-Coefficient Curves for Weir Flow. Series V, VI and VII ..............•........••...•
Drop Inlet, Series X-A to XVII, Inclusive ...... " .... .
Drop Inlet and Barrel Entrance Except for Series XlV ... -A .
Drop Inlet and Barrel Entrance for Series XIV -A .
Weir Flow at Crest of Drop Inlet ........... .
Weir Flow at Crest of Drop Inlet ..........••
Either the Weir or the Pipe Equation May be Used to Compute the Flow for These Conditions ..... .
Pipe Equation Determines Discharge ...........•.........
Inlet is Completely Submerged ........................ .
Spillway Proportions and Piezometer Locations, Series L-4B to L-19. Inclusive ........... .
Test Setup for Series L-4B ............ .
Test Setup for Series L-5A to L-13. Inclusive
Test Setup for Series L-IB and L-19 .•...•.
Weir Flow at Crest of Drop Inlet. Clinging Nappe Barrel Partly Full. No Air Flow. HID = 0.33 ........................... .
Weir Flow at Crest of Drop Inlet. Nappes Intersect in Drop Inlet Entraining Air. Barrel Partly Full. HID = 0.37 ..........•..•.
Weir Flow at Crest of Drop Inlet. Clinging Nappes and Air Pocket in Drop Inlet. Barrel Partly Full Except Air-Water Mixture Fills Bar-rel Near Its Entrance. HID = 0.60 ..•.........•...•.....
vi
Fage
2
3
4
5
5
5
6
6
7
7
7
B
B
12
12
13
14
14
14
15
IB
19
19
21
21
21
22
22
24
26
27
2B
30
30
30
Fi.gure
v - 8
v - 9
v - 1 0
v - l 1
v-12v - 1 3v-14v - 1 5
v - 1 6v I -1
vl-2vI-3v1-4
VII-1vtr-2VII-3VII-4
vII-5
VII .6VII-7
VII-B
Page
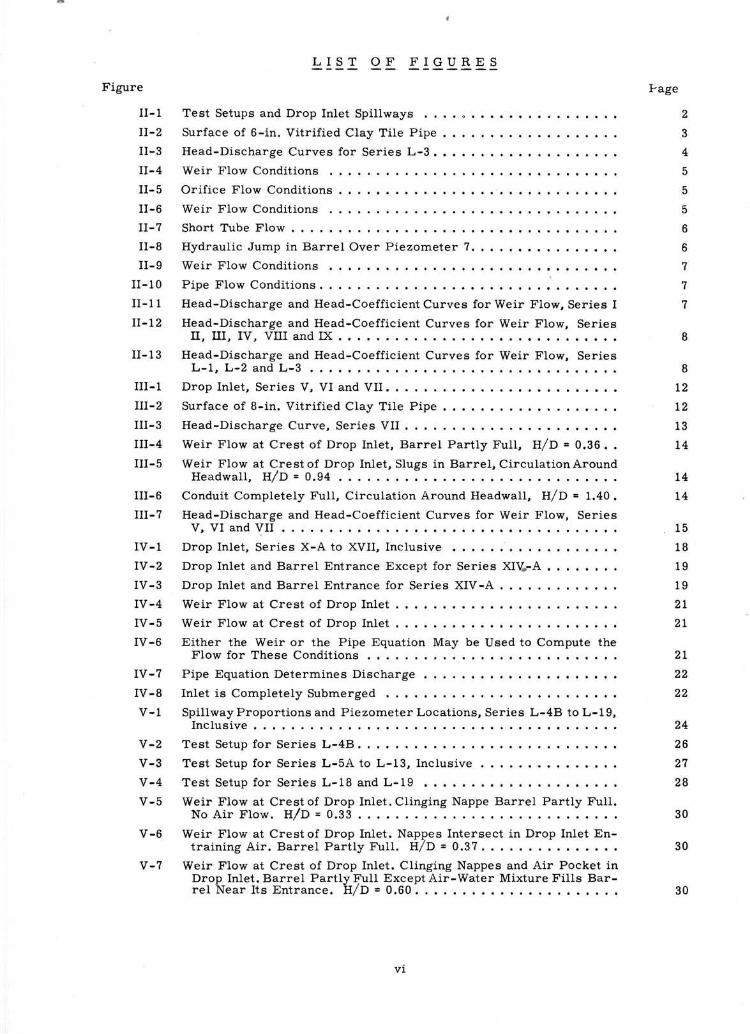
Weir Flow at Drop Inlet Crest. Free Nappes. Slugs Form and Breakin Upper End of Farrel. Air Carried Through Spil lway When Slugsare Present . H/D = 0.66
ProbablyMomentaryOrifice Flow at Crest of Drop Inlet. Free Nappes.Barrel Partly FulI. No Air Flow. H/D = 0.72
Weir Flow at Crest of Drop Inlet. Clinging Nappes. Barrel Continu-ously Full of Water-Air Mixture. Continuous Air Flow. H/D = t, l2
Orif ice Flow at Barrel Entrance. Barrel Partly FulI. No Air Flow.H / D = 0 . 6 6 . .
Effect of Barrel Slope on Entrance Loss Coeff icient
Head-Discharge Curves for Series L-?, L-8 and L-9
No Headwall was Used for Series L-7 . .
A Headwall But No Dlke was Used for Series L-8 . .
Use of Dike Plus a HeadwalL for Series L-9 El iminates Circulat ion .
Drop Inlet Dimensions, Anti-Vortex Walls, and Piezometer Locations
Effect of Vortex on Capacity When No Aati-Vortex Device is Used. .
Effect of Height of Spl i t ter on Vortex Formation
Head-Coeff icient Curve for Circular Drop Inlets
Effect of Vort ices on Head-Discharge Curve for Series L-26 . . . . .
Effect of Vortex on Orif ice Discharge
Vertical Pipe Entrances Tested by Bi.nnie and Hookings
Head-Discharge Curves for RadiaL and Tangential Flow as Determinedby Binnie and Hookings
Comparison of Head-Discharge Relat ionships with Vortex ae Deter-mined by Camichel, Escande and Sabathe
Harspr8nget Diversion Tunnel
View of the Flow at HarsprSnget when Water was Discharged ThroughBoth the T\rnnel Inlet and the Gate Shaft
Viewof Tunnel Intake at Harsprlnget onAugust 15, 194Q,as SeenFtomthe Dam
3 0
3 0
3 3
3 4
3 5
3 5
3 5
3 7
3 9
40
4 L
42
44
44
45
4 7
4 8
4 9
4 9
Figure
V-8
V - 9
V- 10
V-ll
V-12
V-13
V-14
V-15
V-16
VI-1
VI-2
VI-3
VI-4
VII-1
VII-2
VII-3
VII-4
VII-5
VII-6
VII-7
VII-8
Weir Flow at Drop Inlet Crest. Free Nappes. Slugs Form and Break in Upper End of Barrel. Air Carried Through Spillway When Slugs are Present. HI D = 0.66 ••••••. .•••••••••••••••••••••
Probably Momentary Orifice Flow at Crest of Drop Inlet. Free Nappes. Barrel Partly Full. No Air Flow. HID = 0.72 ••••••••••••••
Weir Flow at Crest of Drop Inlet. Clinging Nappes. Barrel Continuously Full of Water-Air Mixture. Continuous Air Flow. HID = 1.12
Orifice Flow at Barrel Entrance. Barrel Partly Full. No Air Flow. HI D = 0.66. • • • . • • • • . . . • • . . • • • • . • • . • • •• • •••••••.
Effect of Barrel Slope on Entrance Loss Coefficient •
Head-Discharge Curves for Series L-7, L-8 and L-9
No Headwall was Used for Series L-7 ••••.•. •
A Headwall But No Dike was Used for Series L-8
Use of Dike Plus a Headwall for Series L-9 Eliminates Circulation.
Drop Inlet Dimensions, Anti-Vortex Walls, and Piezometer Locations
Effect of Vortex on CapaCity When No Anti - Vortex Device is Used.
Effect of Height of Splitter on Vortex Formation •.•.•••••
Head-Coefficient Curve for Circular Drop Inlets ..•..•..
Effect of Vortices on Head-Discharge Curve for Series L-26
Effect of Vortex on Orifice Discharge .•.••.•• • •......
Vertical Pipe Entrances Tested by Binnie and Hookings
Head-Discharge Curves for Radial and Tangential Flow as Determined by Binnie and Hookings •••• • •.•..••••. • •......•.•.••
Comparison of Head-Discharge Relationships with Vortex as Determined by Camichel, Escande and Sabathe ••.• • .••.•.•..•••
Harspr~nget Diversion Tunnel •..••.•••... •• ..•••••••••.
View of the Flow at Harspra nget when Water wa s Discharged Through Both the Tunnel Inlet and the Gate Shaft ..•• • ••••••••••. • •
View of Tunnel Intake at Harspr~nget on August 15, 1949,as Seen F'!'om the Dam .......•••• • ••.••• • ••.•... • ..•••••••.••
vii
Page
30
30
30
30
33
34
35
35
35
37
39
40
41
42
44
44
45
47
48
49
49
L I S T O F T
a
A B L E S
TabIe
I I .1
TI.2
I I .3
uI-1TIT.2
III.3
ry-1IV-2
v -Lv-2
v-3v-4
vI-1vr-2
vu-1
Page
1
3
I I
L 2
1 3
1 6
1 B
1 0
2 5
2 5
2 6
3 2
3 6
3 8
46
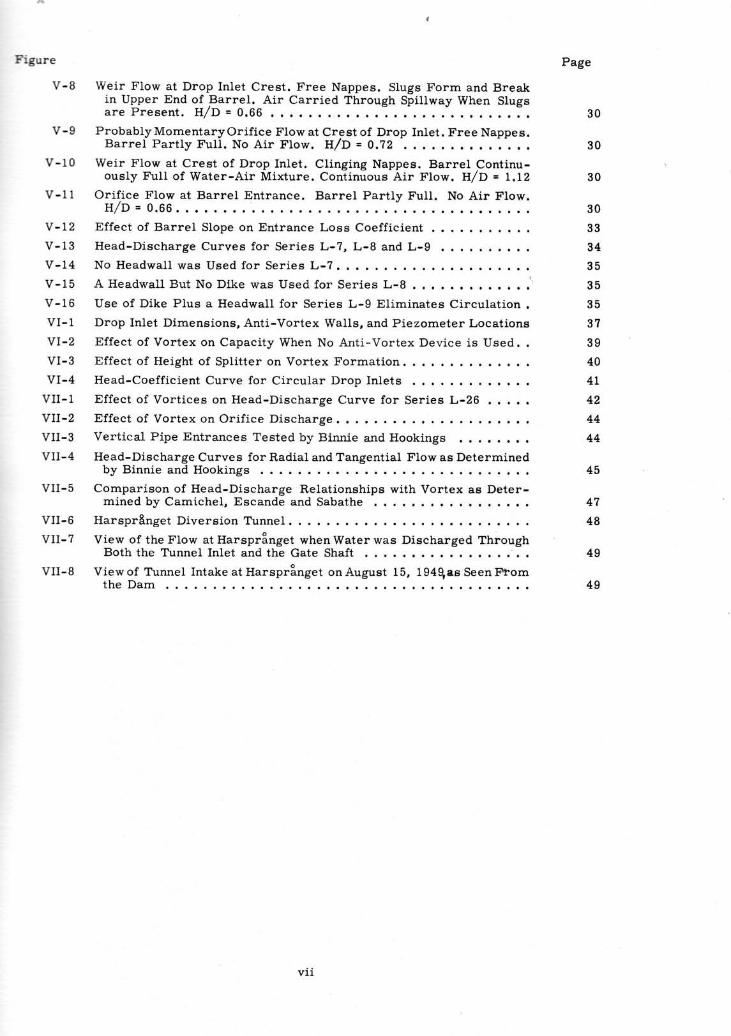
Proportions of Spillways and Discharge Coefficients . . . .Piezometer Locations and Local Pressure Deviation from Hydraulic
Grade Line, Series I, II, III, IV, VIII, IX, L-t, L-Z and L-3
Maximum Observed Pressure for Part FulI Flow
Proportions of Spillways and Discharge Coefficients . . .Piezometer Locations and Local Pressure Deviation from Hydraulic
Grade Line, Series V, VI and VII
Maximum Observed Pressure for Part FulI Flow
Proportions of Spillways and Discharge Coefficients . . .Piezometer Locations and Local Pressure Deviation frqm Hydrautic
Grade Line, Series XA to XVII .
Proportions of Spil lways and Discharge Coefficients . . .Piezometer Locations and Local Pressure Deviation from Hydraulic
G r a d e L i n e , s e r i e s L - 4 B t o L - 2 4 . . : . . . . .
Characteristics of Test Setups
Indicated Minimum Drop Inlet Depth
Proportions of Spillways and Discharge Coefficients . . . .Piezometer Locations and Local Pressure Deviation from Hvdraulic
G r a d e L i n e , S e r i e s L - 2 5 t o L - 3 3 . . : . . . . .Pipes Tested by Rahm
vl11
Table
II-I
11-2
11-3
III-I
1II-2
III-3
IV-l
IV-2
V-1
V-2
V-3
V-4
VI-1
VI-2
VII-1
LIST OF TABLES
Proportions of Spillways . and Discharge Coefficients ......•..•.
Piezometer Locations and Local Pressure Deviation from Hydraulic Grade Line, Series I, II, III, IV, VIII, IX, L-1, L-2 and L-3
Maximum Observed Pressure for Part Full Flow ..
Proportions of Spillways and Discharge Coefficients
Piezometer Locations and Local Pressure Deviation from Hydraulic Grade Line, Series V, VI and VII .....•.......
Maximum Observed Pressure for Part Full Flow •..
Proportions of Spillways and Discharge Coefficients.
Piezometer Locations and Local Pressure Deviation frqm Hydraulic Grade Line, Series XA to XVII ..........•.......•.....
Proportions of Spillways and Discharge Coefficients •..........
Piezometer Locations and Local Pressure Deviation from Hydraulic Grade Line, Series L-4B to L-24 ..
Characteristics of Test Setups ......•.•..•...
Indicated Minimum Drop Inlet Depth ........... .
Proportions of Spillways and Discharge Coefficients.
Piezometer Locations and Local Pressure Deviation from Hydraulic Grade Line, Series L-25 to L-33 .
Pipes Tested by Rahm ...........•.•.....•...........
•
viii
Page
1
3
11
12
13
16
18
19
25
25
26
32
36
38
46
HYDRAULICS OF CLOSED CONDUIT SPILLWAYS
Results of Tests on Several Forms of the Spil lway*
FORWARD
The theory of and the symbols for the hydraullcs of closed condult spillways have beengiven in Part 1** of this report series. Parts I I to VI inclusive, which are included in thispaper, give the results of laboratory tests on a number of dif ferent forms of the closed con-duit spi l lway inlet; each spi l lway is described, the experimental setup and methods are ex-plarined, the characterist ics of f low through the spi l lway are described, data that may be usedfor a determination of the f low through the spi l lway are presented, and coeff icients for thedetermi.nation of cr i t ical pressures within the spi. I lway are summarized. When used ir i con-junction with the principles given in Part I , the information contained in this paper may beused to des ignc losed condu i tsp i . l lways hav ing fo rms s imi la r to thoserepor ted here .Par t V I Ii s devoted to a d iscuss ion o f vor t i ces and the i r e f fec t on the d ischarge.
Part I I
Circular Drop Inlet with BelI Crest and Elbow Barrel Entrance
DESCRIPTION OF SPILLWAY
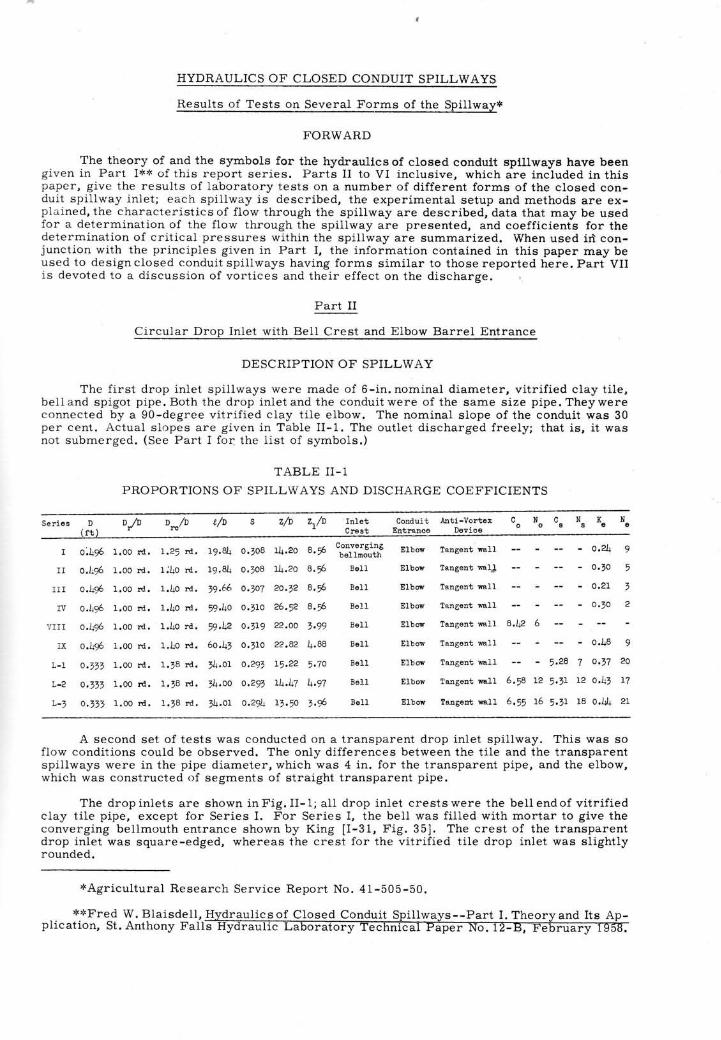
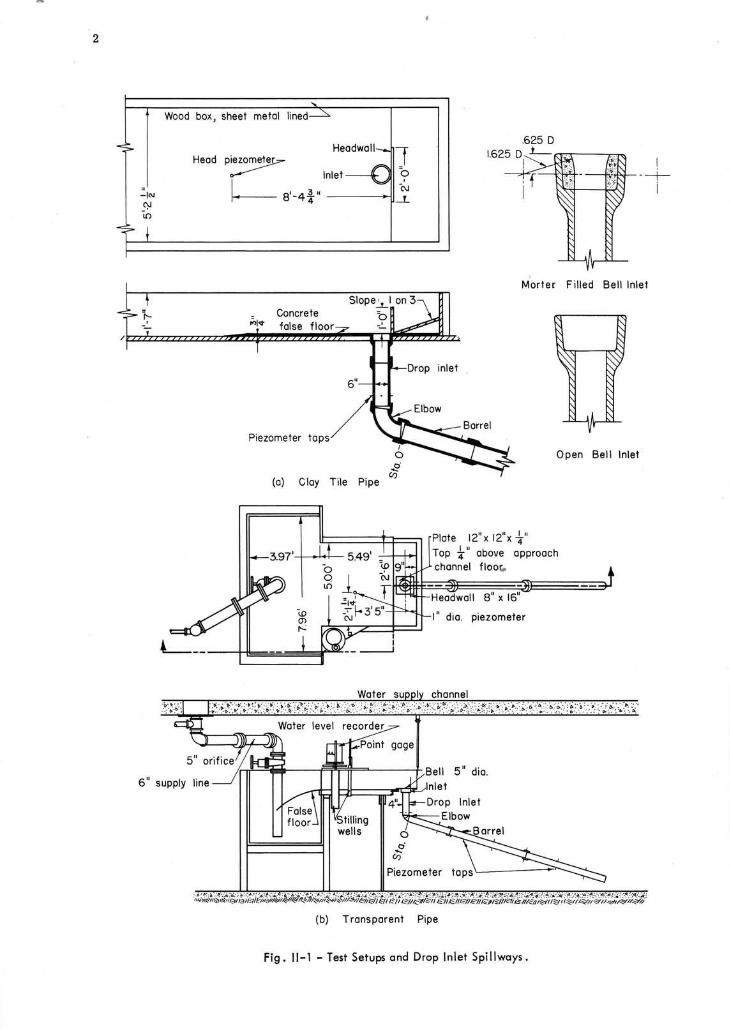
The f irst drop inlet spi l lways were made of 6-in.nominal diameter, vi tr i f ied clay t i le,be l land sp igo t p ipe .Both the drop in le tand the condu i twere o f the same s ize p ipe .Theywereconnected by a 90-degree vitr i f ied clay t i le elbow. The nominal slope of the conduit was 30per cent . Ac tua l s lopes are g lven in Tab le I I -1 . The ou t le t d ischarged f ree ly ; tha t i s , i t wasnot submerged. (See Part I for: the I ist of symbols.)
TABLE I I -1
PROPORTIONS OF SPILLWAYS AND DISCHARGE COEFFICIENTS
Seri€s D / D?
o / orc'
1,25 rd. 19.81+ o.7oB
l j l+o rd. 19,811 0.108
1.1+o rd, 19.66 o,1o7
1.]+o d. 59Ao o.To
1.Io rd. 59,142 o.1I9
1.lro rd. 60.l$ o,17O
l. . rB rd. t l r .oI O.29t
1.rB rd. 314.oo o,29i
r .JB rd. 1\ .or 0.2911
z/D z{D InletCres t
llti-vort€tDevic€
Talgent Ell
Tang€nt ml]
?angent mll
Tang€nt mIl
?angent mfl
langent ml1
Tangent mIl
Tangent rel1
Tangert re1.1
ConduitEntrance
Ne
I
I I
l I I
w
Y I I I
tx
L-1
L-2
L-t
0. l+96 1,oo rd,
0.L96 1.0o rd.
o. l+* 1.oo !d.
o. ] i96 I .oo d.
0.l+96 1.oo rd.
0.1196 1.00 rd.
o. t t t I .oo rd. ,
o. t l t r .oo f i . .
o. rv) 7.oo rd, .
1l+.20
14.20
20.12
26.r2
22.OO
22.82
1 E ) '
L4JiZ
1 Z E n
8 , f
8 . *
O , P
8.f i
1.99
l+.88
5.70
t . w
6 ,58
6 . r5
- 5 , 28
L2 ' , t r
ConverEinP !!oovoerlmoutn
Bell Elbow
Bel1 E1btr
B€ll E]bow
Bel1 Elbov
Bell Elbow
Be1l Elbw
Bell Elbow
B€11 Elbtr
8,12 6
- o,zL 9- o. r0 ,
- o , 10 2
- o.,l+8 9
7 o. t7 20
1 ) ^ L Z 1 a
16 5,3r L8 o.1A 2r
A second set of tests was conducted on a transparent drop inlet spi l lway. This was soflow condit ions could be observed. The only dif ferences between the t i le and the transparentspi i lways were in the pipe diameter, which was 4 in. for the transparent pipe, and the elbow,which was constructed of segments of straight transparent pipe.
The drop inlets are shown in Fig. I I- 1; aI1 drop inlet crests were the bel l end of vi tr i f iedclay t i le pipe, except for Series I. For Series I, the beII was f i l led with mortar to give theconverg ing be l lmouth en t rance shown by K ing I I -31 , F ig . 35 ] , The c res t o f the t ransparentdrop inlet was square-edged, whereas the crest for the vitr i f ied t i le drop i .nlet was sl ightlyrounded.
*Agr icu l tu ra l Research Serv ice Repor t No. 41-505-50.
* *Fred W. B la isde l l , Hydrau l i cs o f C losed Condu i t Sp i l lways- -Par t I . Theory and I ts Ap-pl icat ion, St. Anthony FalI
c
HYDRAULICS OF CLOSED CONDUIT SPILLWAYS
Results of Tests on Several Forms of the Spillway*
FORWARD
The theory of and the symbols for the hydraulics of closed conduit spillways have been given in Part I** of this report series. Parts II to VI inclusive, which are included in this pape r, give the results of laboratory tests on a number of different forms of the closed conduit spillway inlet; each spillway is described, the experimental setup and methods are expl;.lined, the characteristics of flow through the spillway are described, data that may be used fo r a determination of the flow through the spillway are presented, and coefficients for the determination of critical pressures within the spillway are summarized. When used in conjunction with the principles given in Part I, the information contained in this paper may be u sed to design closed conduit spillways having forms similar to those reported here. Part VII is devoted to a discussion of vortices and their effect on the discharge.
Part II
Circular Drop Inlet with Bell Crest and Elbow Barrel Entrance
DESCRIPTION OF SPILLWAY
The first drop inlet spillways were made of 6-in. nominal diameter, vitrified clay tile, bell and spigot pipe. Both the drop inlet and the conduit were of the same size pipe. They were connected by a gO-degree vitrified clay tile elbow. The nominal slope of the conduit was 30 per cent. Actual slopes are given in Table II-l. The outlet discharged freely; that is, it was not submerged. (See Part I for the list of symbols.)
TABLE II-1
PROPORTIONS OF SPILLWAYS AND DISCHARGE COEFFICIENTS
Series D DjD Dro/D t/D S Z/D Z/D Inlet Conduit Anti-Vortex C N C N K N 0 0 s s e e
(ft) Crest Entrance Device
o ~4')6 1.00 rd. 1.25 rd. 19.84 0.308 14.20 8.56 Converging Elbow Tangent wan - 0.24 9 bellmouth
II 0.4')6 1.00 rd. 1 ;40 rd. 19. 84 0.308 14.20 8.56 Sen Elbow Tangent walJ - 0.30 5
II I 0.4')6 1.00 rd. 1.40 rd. 39.66 0.307 20.32 8.56 Ben Elbow Tangent wall - 0.21 3
IV 0.1,')6 1.00 rd. 1.40 rd. 59.40 0.310 26.52 8.56 Bell Elbow Tangent "''all - 0·30 2
VIII 0.4')6 1.00 rd. 1.40 rd. 59.42 0.319 22.00 3.99 Ben Elbow Tangent wall 8.42 6
IX 0 .4')6 1.00 rd. 1.40 rd. 60.43 0.310 22.82 4.88 Bell Elbow Tangent wall - 0.48 9
L-l 0.333 1.00 rd. 1.38 rd. 34.01 0.293 15.22 5.70 Ben Elbow Tangent wall - 5.28 7 0.37 20
L-2 0.333 1.00 rd. 1.38 rd. 34.00 0.293 14.47 4.97 Ben Elbow Tangent wall 6.58 12 5.31 12 0.43 17
L- 3 0.333 1.00 rd. 1.38 rd. 34.01 0.294 13.50 3.')6 Bell Elbow Tangent wall 6.55 16 5·31 18 0.44 21
A second set of tests was conducted on a transparent drop inlet spillway. This was so flow conditions could be observed. The only differences between the tile and the transparent spillways were in the pipe diameter, which was 4 in. for the transparent pipe, and the elbow, which was constructed of segments of straight transparent pipe.
The drop inlets are shown in Fig. II-1 ; all drop inlet crests were the bell end of vitrified c lay tile pipe, except for Series 1. For Series I, the bell was filled with mortar to give the converging bellmouth entrance shown by King [1-31, Fig. 35]. The crest of the transparent drop inlet was square-edged, whereas the crest for the vitrified tile drop inlet was slightly rounded.
*Agricultural Research Service Report No. 41-505-50.
Wood box, sheet metol
Heod ptygr,
Slope;-l on 3
i- = Concreie =o-i- tlo folse floor: -l
F i l led Be l l ln le t
Ooen Be l l ln le t
Ti le Pipe
e 12"x 12"xL+"Top +" obove opproochchonnel f loo6,
Heodwoll 8" x 16"
l" dio. piezometer
e l l 5 " d io .t
Drop ln le lElbow
Piezometer tops
- 5.49'
IJs-: lq-dl ' -
(b) Tronsporeni Pipe
Fig. l l - l - Test Setup ond Drop ln let Spi l lwoys.
2
... Wood box, sheet metal lined-----=::'"
"<;;- Headwall_ Head p~
Inlet--o
I-- 8'-4i" ':1'" C)J -10
~?- I
1 0 -N
-1..
I --+
i
Morter Filled Bell Inlet
Concrete false floor
/~==~~~mm~~~~ B\
6"
~ y
6"
~A V
Piezometer taps
Open Bell Inlet
(a) Clay Tile Pipe
Water su
gage
Plate 12")< 12"x-t"
Top t" above approach channel floo t.
Headwall 8" x 16"
I" dia. piezometer
channel
/n~:!ES----F'iIf~=~---+ Bell 5" dia.
1=il:==::::;;;;;:J"'1ri""'-./1 n let
.:2. Cf)
Piezometer
(b) Transparent Pipe
Fig. 11-1 - Test Setups and Drop Inlet Spi IIways .
The 6-in. pipe was very rough for vi tr i f ied t i ie. Instead of having a smooth glazed sur-face,therewere burnt grains scattered over.the surface, as wellas occasional small surfaceswell ings. A photograph of this surface is shown in Fig. I I-2. In spite of this rough surface,the average value of Manningrs n was foundto be about 0.0080 wi.th a maximumof about0.0092. The Darcy-Weisbach fr ict ion factorwas assumed to be constant at 0.015 whenmaking the fr ict ion head loss calculat ions.The transparent pipe was considered to behydraulically smooth for the fricti.on headlos s calculat ions,this assumption being basedon tests by others and later tests on closedconduit spillways.
A number of piezometers were used todeterminethe pressures within the spi l lway.The piezometer locations are shown schema-t ical ly in Fig. I1-1. The piezometers wereformed by dri l l ing theti le pipefrom theout-side. This ordinari ly chipped the wall of thepipe. The chip was overf i l led with paraff inand the paraff in scraped even with the pipesurface.Pi.ezomete rs for the transparent pipewere easi ly formed by dri l l ing through thepipe from the outside. The locations of al lpiezometers are given i .n Table II-2. Unlessotherwise designated, al l piezometers werelocated onthe conduit invert. Pressures weremeasured in open manometer columns.
Fig. l l -2 - Sur foce of 6- in . Vi r r i f ied Cloy Ti le PipeVariables included in the testprogram
were lengthof conduit, which also caused thetotal drop Z through the spi l lway to vary, and the helght of the drop inlet Zr. The magni-tudes of these variables are given in Table II-1
TABLE II.2
PIEZOMETER LOCATIONS AND LOCAL PRESSURE DE\'IATION
FROM HYDRAULIC GRADE LINE SERIES I, II, III, IV, VIII, IX, L.L, L-2 AND L-3
A . l G b r :'
t d rEzro ! sbtio! h/be sbuoa hi^w sbtiod hd/hE sbtioE , statioE ha^w
rft ' . +.oBD n,ztttuu -L.@D +0,2Ir!:rt' . -4.o60 .0.r9- f r .hu -A .o{D +0.16
fi,25
+0.21+o. l8
+o,Ot+0.16+0.08
{.ol
:E t .yD &.o7=!f t t . \ f l 4.1,:n* 11,?/rD {,06
:rd I9.4D +O,Oz
-l+.08D-lr.o9D-lr.o6D-4.0!)
-1r.08D +0.19-rr,09D +0.16-!.06D +0,I8-t).UD +a.1t
, .15D {.10rr. l lp { ,04
r9.4D q.d!27,2OD -O.@tr. I \D +o.ao)1t.6D
-l+.08D +0,28 -1.95D-4.6D {,27 -1. D-lr.ort -- -1.95D-\.do a.15 -t .qlD
t.otDI. I 'D
).57D +o.o7 \ .62DtA5D +o,19 ]r ,5lrn
rr.rtP +o,o7 It,l)D
r9.27D +o.o? r9.t2D27.2OD 4.OO 27.22D,5.1!D +o.oo t5,12D!r.dD +0.12 )! t .a2D50.99D +o.dr 51,ooD58.89D {.0} 58.9oD
-)r.O1D +o,57 -1.60D +0.20-!.05D +0.51 -1.62D +o,a/2-L.o7D 4.9 - I .62D +o.2I-4.05D '0.61 -1.6oD +0.01
1,0rD -0,12 o.75D -o,29r. l lD +o.oe 0.75D {.1Ilr.62D -o.oLlr .5lrD .0.m 5.75D +0.@.
1r.r6D -0.02 1o.76D -0.0I
r9.t2D -a,& 15.?6D -o,oo27,nD -o,6 2o,77D -o,o3t5,rm A.oa 25,76D -o,ozl!a,O2D -O.A5 Jo.76D -0,0151,00D {.015E,90D +0.07
-I.r9D +o.2o-I.59, ro.iz-1.62D {.21-1.60D €.01
o.75D -O,r20.?tD -0.11
5.7rD 4,&1o.Z6D -o,oo
15.26D -o.oo2o,77D -O.Ot25.76D -o.e.to.76D -o,a2
-1.59D +0.20-1.60D rc.r l-1.60D {,20-t .6oD 4.oo
o.79 -o.t50.75D {.11
5 , 7 P 4 . 0 210,76D o,m
15.88D -0.002o.76D -O.Ot25.76D 4.&1A,76D -O.O2
t .nD
1r,r,lp19.4D
l!C. ol dry iulot.
APPARATUS AND PROCEDURE
The channels in which the spi l lways were tested are shown in Fig. I I-1. The channelsrere wide enough so there were probably no sidewall effects, but greater channel sidewallbeights would have permitted the use of higher heads over the drop inlet crest. The approachto the drop inlet was essential ly level for each setup. The dif ferences between the two setupscan be seen in Fig. I I-1.
For the t i le pipe setup shown in Fig. I I-1 the discharge was measured, depending uponthe rate of f low, by means of the dif ferential pressure at two points in a 12-in. tee (used as anelbow) or by a 3-L/2-in, ori f ice in a 4-j .n. l ine which by-passed the 12-in. regulat ing valve.Both of the measuring devices .had been previously cal ibrated.
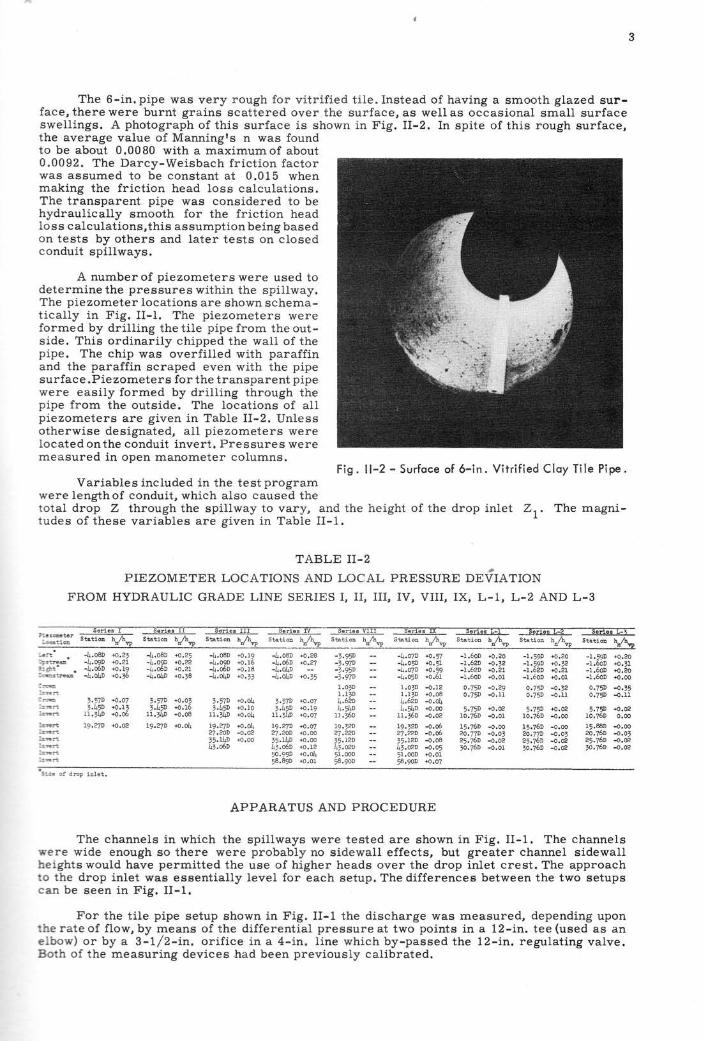
The 6-in. pipe was very rough for vitrified tile. Instead of having a smooth glazed surface, there were burnt grains scattered over the surface, as well as occasional small surface swellings. A photograph of this surface is shown in Fig. II-2. In spite of this rough surface, the average value of Manning's n was found to be about 0.0080 with a maximum of about 0.0092. The Darcy-Weisbach friction factor was assumed to be constant at 0.015 when making the friction head loss calculations. The transparent pipe was considered to be hydraulically smooth for the friction head loss calculations, this assumption being based on tests by others and later tests on closed conduit spillways.
A number of piezometers were used to determine the pressures within the spillway. The piezometer locations are shown schematically in Fig. II-l. The piezometers were forme d by drilling the tile pipe from the outside. This ordinarily chipped the wall of the pipe. The chip was overfilled with paraffin and the paraffin scraped even with the pipe surface .Piezometers for the transparent pipe were easily formed by drilling through the pipe from the outside. The locations of all piezometers are given in Table II-2. Unless otherwise designated, all piezometers were located on the conduit invert. Pressures were measured in open manometer columns.
Fig. 11-2 - Surface of 6-in. Vitrified Clay Tile Pipe. Variables included in the test program
were length of conduit, which also caused the total drop Z through the spillway to vary, and the height of the drop inlet Z1' The magnitudes of these variables are given in Table II-I.
TABLE II-2 ".
PIEZOMETER LOCATIONS AND LOCAL PRESSURE DEVIATION
FROM HYDRAULIC GRADE LINE SERIES I, II, III, IV, VIII, IX, L-l, L-2 AND L-3
Series I Series II Series III Series IV Series VIII Series iX Series L-l Series L- Serles L-3:
3
?1e ta.:ete r Station hni'h"J' Station h,/h"J' Station hnlh"J' Station hn/hvp Station hjhvp Station h,/h"J' Station h,/h"J' Station hih"J' Station hn/hvp Location
:..rt . -4 .080 +0.23 -4.080 +0.25 -4.080 +0.19 -4.080 +0.28 -3.950 -4.070 +0. 57 -1.600 +0 ,20 -1.590 +0, 20 -1.590 +0.20
~r~e -4.090 +0.21 -4.090 +0.22 :t:~~ +0.16 -4.060 +0.27 -3.97D -4.050 +0.51 -1.62D +0.32 -1.590 +0.32 .. 1.600 +0.31 -4.060 +0.19 -4.060 +0,21 +0.18 -4.040 -) .95D -4.070 +0·59 -1.62D +0 .21 -1.62D +0.21 -1.60D +0.20
,""'am -4.040 +0.36 -4.040 +0.38 -4.040 +0.33 -4.040 +0.35 -3.97D -4.050 +0 .61 -1.600 +0.01 -1.600 +0.01 -1.600 +0.00
-:-~ 1.03D 1.030 -0 . 12 0.750 - 0 .29 0.750 -0 . 32 0.750 -0.35 ==n r-t 1.13D 1.130 +0.08 0.750 -0.11 0.750 -0,11 0.750 -0.11 :,..,." ,.570 +0. 07 3.570 +0.03 3.570 +0.04 3·57D +0.07 4.620 4.620 -0.04 ::r.n lU~ +0.13 3.450 +0.16 3.~ +0.10 3.450 +0.19 4.540 4 ·540 +0 .00 5.750 +0.02 5.750 +0.02 5.750 +0.02 =.r..rt +0.06 11.340 +0.08 11. +0.04 11.31$ +0.07 1l.36D 11.360 -0.02 10.760 -0 . 01 10.760 +0.00 10.760 0. 00
~ 19.270 +0 .02 19.270 +0.04 19.270 «>.04 19.270 +0.07 19.~0 19.,20 -0.06 15.760 -0.00 15.760 -0.00 15.880 -0.00 :..or< 27 . 200 -0.02 27.200 +0.00 27 .220 27.220 - 0.06 20 . 770 -0.03 20.770 -0.03 20.760 -0.03 =.:wrt 35.140 +0.00 35.140 +0.00 35.120 35.120 -0.08 25.760 -0.02 25.76D -0.02 25.760 +0.02 ~"'M: ", .060 "3.060 +0 .12 43.020 43.020 -0.05 30.760 -0.01 30.760 -0.02 30.760 -0.02 :.:...~ 50.990 +0.04 51.000 51.000 +0.01 ==-rt 58.890 +0.01 58.900 58.9<)0 +0.07
S!..!. of drop inlet.
APPARATUS AND PROCEDURE
The channels in which the spillways were tested are shown in Fig. II-I. The channels we re wide enough so there were probably no sidewall effects, but greater channel sidewall beights would have permitted the use of higher heads over the drop inlet crest. The approach o the drop inlet was essentially level for each setup. The differences between the two setups
c an be seen in Fig. II-I.
For the tile pipe setup shown in Fig. II-l the discharge was measured, depending upon he rate of flow, by means of the differential pressure at two points in a 12-in. tee (used as an
e bow) or by a 3-1/2-in. orifice in a 4-in. line which by-passed the 12-in. regulating valve. Both of the measuring devices had been previously calibrated.
For the transparent pipe setup shown in Fig. II-1,the discharge was meas-ured by a 5-in. orif ice in the 6-in. supply l ine. This orif ice was calibrated before it was placed inuse.
The test procedure consisted of setting a flow, waiting unti l the water level in the head-pool became constant, then determining the rate of flow, the head on the drop inlet crest, andihe pressures within the spil lway. For the transparent pipe tests pressures were sometimesrecorded photographically when'they fluctuated. This was done by placing dye. in the mano-meter columnsind-taking-double exposure photographs of the manometer board at the maxi-mum and minimum press-ures. Noteson the flow conditions were also recorded. This procedurewas repeated unti l lhe complete range of heads and discharges had been covered.
Periodic fluctuations in the headpool water level due to alternating control sections inthe spil lway were frequently observed, so a water-level recorder was installed to measurethese fluctriations during the transparent pipe tests. The rate of change of headpool level,determined from the water-level recorder chart, was multiplied by the headpool area to givethe flow rate going into storage or being subtracted from storage. The steady inflow ratethrough the suppli line into the headpool was corrected by the quantity going into or beingsubtricted from siorage to determine the actual rate of flow through the spillway: A -w!t_ter-level recorder was also used for the ti le pipe tests after Series IV had been completed. How-ever, its purpose was to insure that the water level was approximately steady prior to takingreadings, and the records were not used to correct for storage.
DESCRIPTION OF FLOW
The ti lepipe testswere the first laboratory tests made with a steep pipe slope. There-fore the perfoimance of the spil lway was not clearly understood and the descriptions of theflow may be deficient in some respects. However, indications are that the control changedfrom the weir at the drop inlet crest to the pipe without going through orif ice or short tubecontrols. This is true except for Series VIII, where the control apparentlychanged from weirto orif ice. The water-level recorder records and the notes taken during the experiments in-dicate that pipe flow may have occurred for short periods during one test. However, no datawere obtained for the full pipe condition. Apparently the riser height for Series VIII is tooshort to insurethat orif ice flow wil l not occur.The other riser heights tested are apparently
0.30 0.40 0.50 0.60 0.80 Loo
Q (c.f.s.)Fig. l l-3 - Heod-Dischorge Curv€s for Series L-3.
I
r.oo( d ) S h o r t t u b e f l o w , i n l e t o n d r i s e r f u l l ,
b o r r e l p o r t l y f u l l , n o o i r f l o w( r ) P l p e f l o w , i n l e t ,
r i ser ond bor re l fu l I(o ) Or i f i ce f low, o r i f i ce o l
in le t , r i ser ond bor re l
por t l y f u l l , no o i r f low
Ai r sucked th ru bor re i
(e ) Wei r f low, in le t por t l y f u l l ,r i s e r o n d b o r r e l f u l l o f
o i r -woter mix tu re
(c ) Wei r f low, r i ser fu l l o f o i r -wc ter
mix tu re , in le t ond bor re l por t l y f u l l
(o ) Wei r f low, in le t , r i ser
ond bor re l por t l y fu l l
o.roo.20 3.OO 4.OO
..
For the transparent pipe setup shown in Fig. 11-1, the discharge was measured by a 5-in. orifice in the 6-in. supply line. This orifice was calibrated before it was placed in use.
The test procedure consisted of setting a flow, waiting until the water level in the headpool became constant, then determining the rate of flow, the head on the drop inlet crest, and the pressures within the spillway. For the transparent pipe tests pressures were sometimes recorded photographically when they fluctuated. This was done by placing dye in the manometer columns and taking double exposure photographs of the manometer board at the maximum and minimum pressures. Notes on the flow conditions were also recorded. This procedure was repeated until the complete range of heads and discharges had been covered.
Periodic fluctuations in the headpool water level due to alternating control sections in the spillway were frequently observed, so a water-level recorder was installed to measure these fluctuations during the transparent pipe tests. The rate of change of headpool level, determined from the water-level recorder chart, was multiplied by the headpool area to give the flow rate going into storage or being subtracted from storage. The steady inflow rate through the supply line into the headpool was corrected by the quantity going into or being subtracted from storage to determine the actual rate of flow through the spillway. A waterlevel recorder was also used for the tile pipe tests after Series IV had been completed. However, its purpose was to insure that the water level was approximately steady prior to taking readings, and the records were not used to correct for storage.
DESCRIPTION OF FLOW
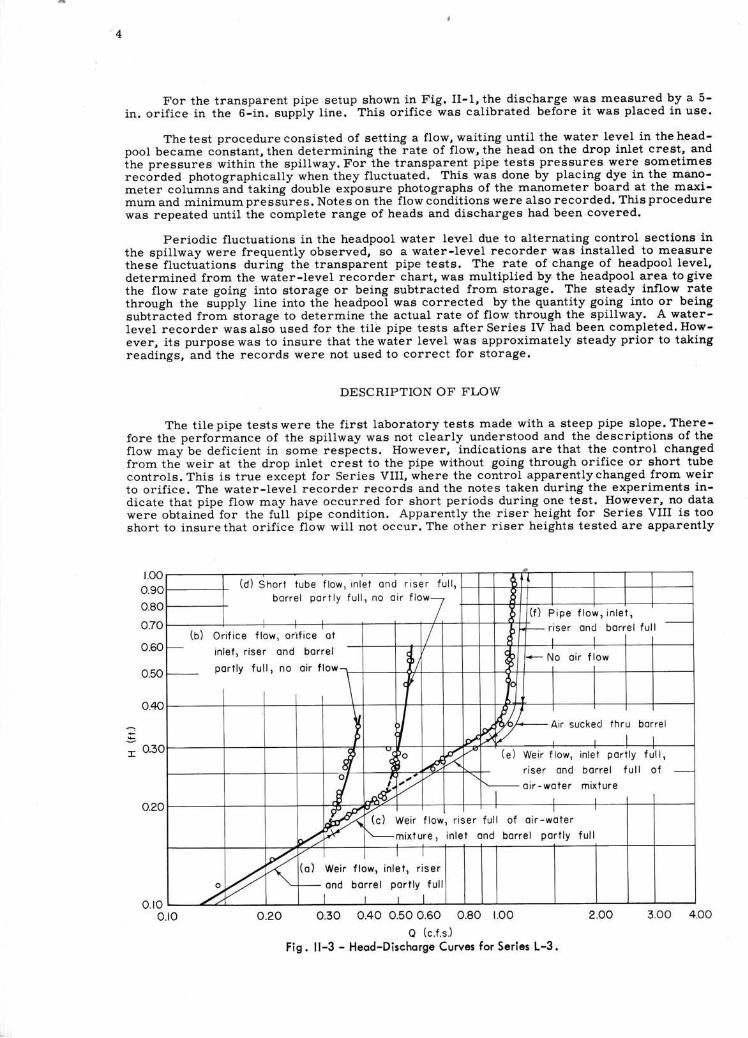
The tile pipe tests were the first laboratory tests made with a steep pipe slope. Therefore the performance of the spillway was not clearly understood and the descriptions of the flow may be deficient in some respects. However, indications are that the control changed from the weir at the drop inlet crest to the pipe without going through orifice or short tube controls. This is true except for Series VIII, where the control apparently changed from weir to orifice. The water-level recorder records and the notes taken during the experiments indicate that pipe flow may have occurred for short periods during one test. However, no data were obtained for the full pipe condition. Apparently the riser height for Series VIII is too short to insure that orifice flow will not occur. The other riser heights tested are apparently
-I
1.00 0.90 (d) Short tube f low, inlet and r iser full, I-+--+-~~H-,f---+-----I--+--+--__I
0.80
0 .70 (b)
0 .60 r--
barrel partly full, no air flaw! )
I. (f) Pipe flaw, inlet, I-------+---+---+--+-----t---t--r-/-+-t---+-+---II---Y-t+_ ri ser and barre I full -
Orif ice flow, or'lfice at I I --t_-_+~-w-t__+--+___I~+++_-+_----_+_--+---+---~
0.50 r--~ -- No air flow ~/
0.40
0.30
~ t ~~t'I'~<v'1u.r--Air sucked thr~ ba~ re l (e) Weir flow, inlet partly full,
r ... -:; / , barrel full of -
1 '- riser and
1r.r:;..rZ'// l air-w~ter mi~ture 0.20~----~----~--~-+~~~~~v:~~--~~--~~~-----+-1--~--~--~----I
(c) Weir flow, riser full of air-water
~ i"---mixture, inlet and barrel partly full
~v I I /~ (a) Weir flow, inlet, riser
';,~..- ~I-- and barrel partly full
./>/ I I I I 0 .10 '--_...:;...""'-'-__ -'-_-'-_-'--_--' __ '----'-_.L--'--'--'-___ ...l..-___ '---_~__L __ ...J
0 .10 0 .20 0.30 0.40 0.50 0.60 0.80 1.00 2.00 3.00 4.00
Q (c.t.s .)
Fig. 11-3 - Head-Discharge Curves for Series L-3.
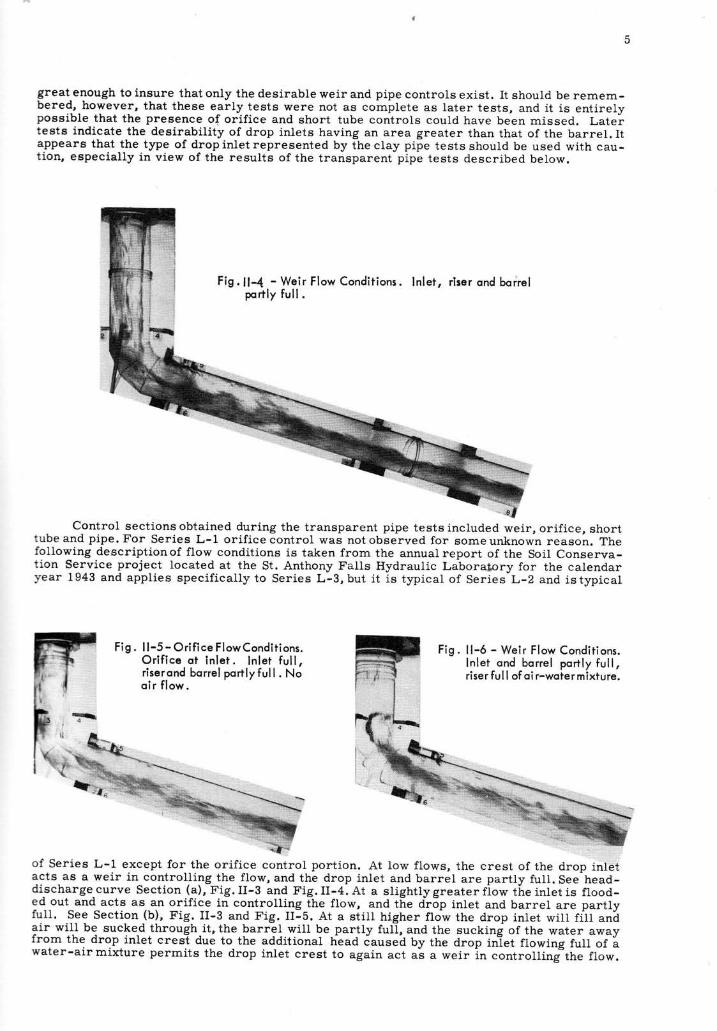
great enough to insure that only the desirabLe weir and pipe controls exist. I t should be remem-bered, however, that these early tests were not as complete as later tests, and i t is entirelypossible that the presence of ori f ice and short tube controls could have been missed. Lateitests indicate the desirabi l i ty of drop inlets having an area greater than that of the barrel. I taPpears that the type of drop inlet represented by the ctay pipe tests should be used with cau-t ion, especial ly in view of the results of the transparent pipe tests described beLow.
Control sections obtained during the transparent pipe tests included weir, ori f ice, shorttubeand pipe.For Series L-1 ori f icecontrol was notobserved for sorneunknown reason. ThefoLlowing descript ionof f low condit ions is taken from the annualreport of the Soil Conserva-tion Se_rvice project located at the St. Anthony Falls Hydraulic Laboralory for the calendaryear 1943 and app l ies spec i f i ca l l y to Ser ies L -3 ,bu t i t i s typ ica l o f Ser ies-L-2 and is typ ica l
Fig . I l -5 - Or i f ice FlowCondi t ions.Or i f i ce q t i n l e t . I n l e t f u l l ,r iserond borre l por t ly fu l l . Noo i r f l ow .
of Series L-1 except for the orif ice control portion. At low flows, the crest of the drop inletacts as a weir in controll i lg the f1ow, and the drop inlet and barrel are partly full. See head-discharge-curve Section (a), Fig. II-3 and Fig. II-4. At a slightlygreater f iow tle inlet is f lood-ed out and acts as an orifice in controlling ihe flow, and t[e arop inlet and barrel are partlyfull. See Section (b), Fig. II-3 and Fig. II-5. At a sti l i higher ftow the drop inlet wilt f i l l anitair wiLl be sucked through.it, the barrel will be partly full, and the sucking of the water awayfrorn the drop inlet crest due to the additional head 6auseb Uy ttre drop inTet flowing full of
"a
water-airmixture permits the drop inlet crest to again act ai a weir in controll ing"the flo*.
F iS. l l -4 - Weir F low Condi t ions.porr ly fu l l .
F ig. l l -6 - Weir F low Condi t ions.ln le i ond borre l por t ly fu l l ,r iser ful I of oi r-woter mixture.
5
great enough to insure that only the desirable weir and pipe controls exist. It should be remembered, however, that these early tests were not as complete as later tests, and it is entirely possible that the presence of orifice and short tube controls could have been missed. Later t ests indicate the desirability of drop inlets having an area greater than that of the barrel. It appears that the type of drop inlet represented by the clay pipe tests should be used with caution, especially in view of the results of the transparent pipe tests described below.
Fig. 11-4 - Wei r Flow Conditions. Inlet I riser and ba rrel partly full .
Control sections obtained during the transparent pipe tests included weir, orifice, short tube and pipe. For Series L-1 orifice control was not observed for some unknown reason. The following description of flow conditions is taken from the annual report of the Soil Conservation Service project located at the St. Anthony Falls Hydraulic Laborai>Ory for the calendar year 1943 and applies specifically to Series L-3, but it is typical of Series L-2 and is typical
Fig. 11-5 - Orifice FlowConditions. Orifice at inlet. Inlet full, riser and barrel partly full. No airflow.
Fig. 11-6 - Weir Flow Conditions. Inlet and barrel partly full, riserfullofair-watermixture.
of Series L-l except for the orifice control portion. At low flows, the crest of the drop inlet acts as a weir in controlling the flow, and the drop inlet and barrel are partly full. See headdischarge curve Section (a), Fig. II-3 and Fig. II-4. At a slightly greater flow the inlet is flooded out and acts as an orifice in controlling the flow, and the drop inlet and barrel are partly full. See Section (b), Fig. II-3 and Fig. II-5. At a still higher flow the drop inlet will fill and air will be sucked through it, the barrel will be partly full, and the sucking of the water away from the drop inlet crest due to the additional head caused by the drop inlet flowing full of a water-air mixture permits the drop inlet crest to again act as a weir in controlling the flow.
See Section (c), Fig.II-3 and Fig. II-6.As the flow increases sti l l further the dropinlet c_re-stwill again be drow"ned out, air ilow through the drop illet will stop, the barrel will still be
f".ity-fntt, and the drop inlet, acting as a s-hort tube, will control the flow. See Section (d), Fig.II-3 and Fig. II-?. The next thing that happensas the flowincreases is the formationof a hy-draulic jump at the entrance to the barrel. Thehydraulic jump travele through the conduitsucking aniir-water mixture through the dropinlet as it does so. See Fig.II-8. As the travel-i.ng hydraulic jump Passes out of the barqel atits lower end the flow conditions may revert toeither orifice or shobt tube flow, or the pipemay continue to flow fullof an air-water mix-tur-e. In this latter case, the additional headcaused by the spillway flowing full of mixturewill suck water away from the drop inlet and
will gradually decrease unti l the spil lway fLowscompletely full of water. See Fig. II-10. Forthis case, pipe flow controls the discharge. See
F iq . l l - 7 -Sho r tTube F low . I n l e t- ond r iser fu l l , borre l por t lyfu l l . No o i r f l ow .
Sect ion ( f ) , F ig . I I -3 . I t i s a lsoposs ib le fo r the
flow to alternate between weir, ori f ice, short tube and pipe while the rate of f low to the head-
pool is steady and constant, the control section at any given t ime being indeterminate.
Fis . f f -8 - Hydroulic Jump In Borrel Over ?iez. 7 .Jump wiil trovel through borrel sucking oir inthrough the inlet ond riser. Borrel portly fullbefore ond ofter iump. Consideroble oir f low.
DISCHARGE COEFFICIENTS
The determinationof the flow through anyclosed conduit spil lwayrequires a knowledge
of the Jischarge coefficients. The determinations of these coefficients for the drop inlet crest
acting." " *""i",ttt. i .opinfetcrest a-cting as an orif ice,.thedrop inletacting as a short tube,
and the entrance toss coefficient for full fiipe flow are given in the following paragraphs.
Weir Coefficient
The value of the discharge coefficient c in Eqs.I-1. and I-2 is given by the solid curves
ot f igs. U-irUlf-fZl ""4 fi-f$U, for the three diffeient drop inlet crest types covered by this
"upot-t.It wil l Le noticed that the data points scatter somewhat--l ines parallel to the r€corn-
mended curve for C are drawn 5 per cent above and below the C curves to indicate the pre-
cision represented.Just why the coefficients of Series VIII and IX in Fig.II-12b are so much
higher than those for the other series is not known.
.c
6
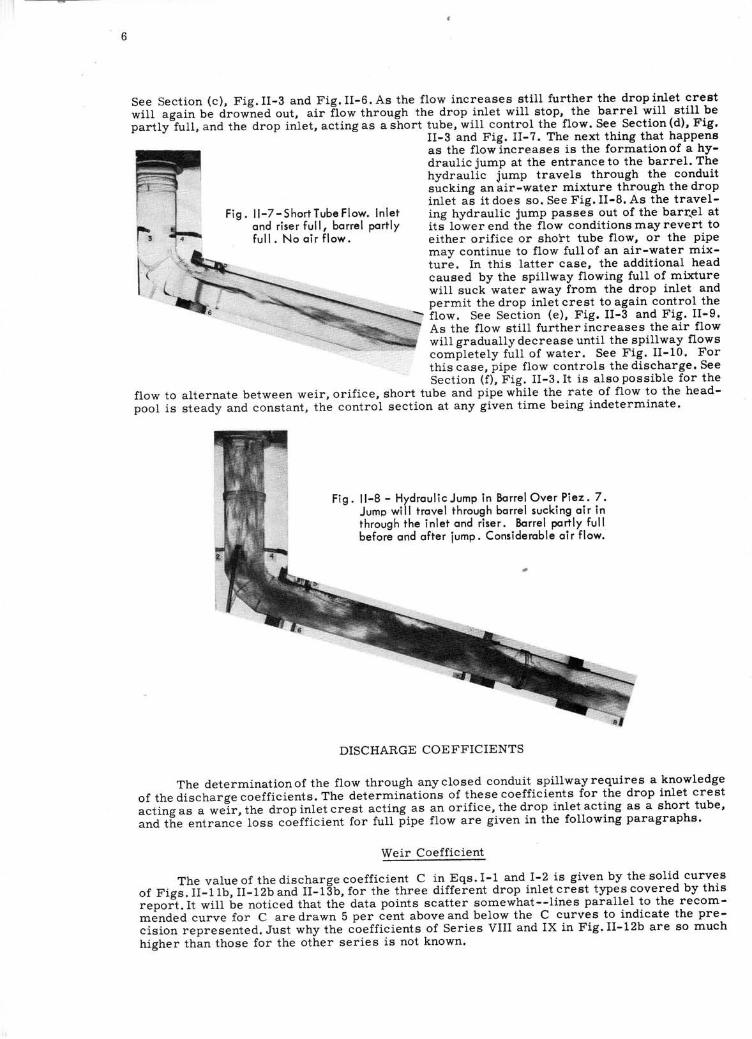
See Section (c), Fig. II-3 and Fig. II-6 . As the flow increases still further the drop inlet crest will again be drowned out, air flow through the drop inlet will stop, the barrel will still be partly full, and the drop inlet, acting as a short tube, will control the flow. See Section (d), Fig.
Fig. 11-7-ShortTubeFlow. Inlet and riser full, barrel partly full. No air flow.
II-3 and Fig. II-7. The next thing that happens as the flow increases is the formation of a hydraulic jump at the entrance to the barrel. The hydraulic jump travels through the conduit sucking an air-water mixture through the drop inlet as it does so. See Fig. II-S. As the traveling hydraulic jump passes out of the barr..el at its lower end the flow conditions may revert to either orifice or short tube flow, or the pipe may continue to flow full of an air-water mixture. In this latter case, the additional head caused by the spillway flowing full of mixture will suck water away from the drop inlet and permit the drop inlet crest to again control the flow. See Section (e), Fig. II-3 and Fig. II-9. As the flow still further increases the air flow will gradually decrease until the spillway flows completely full of water. See Fig. II-10. For this case, pipe flow controls the discharge. See Section (f), Fig. II-3. It is also possible for the
flow to alternate between weir, orifice, short tube and pipe while the rate of flow to the headpool is steady and constant, the control section at any given time being indeterminate.
Fig. II-S - Hydraulic Jump In Barrel Over Piez. 7. Jump will travel through barrel sucking air in through the inlet and riser. Barrel partly full before and after jump. Considerable air flow.
DISCHARGE COEFFICIENTS
The determination of the flow through any closed conduit spillway requires a knowledge of the discharge coefficients . The determinations of these coefficients for the drop inlet crest acting as a weir, the drop inlet crest acting as an orifice, the drop inlet acting as a short tube, and the entrance loss coefficient for full pipe flow are given in the following paragraphs.
Weir Coefficient
The value of the discharge coefficient C in Eqs . 1-1 and 1-2 is given by the solid curves of Figs . II-11b, II-12b and II-13b, for the three different drop inlet crest types covered by this report. It will be noticed that the data points scatter somewhat--lines parallel to the recommended curve for C are drawn 5 per cent above and below the C curves to indicate the precision represented. Just why the coefficients of Series VIII and IX in Fig. II-12b are so much higher than those for the other series is not known.
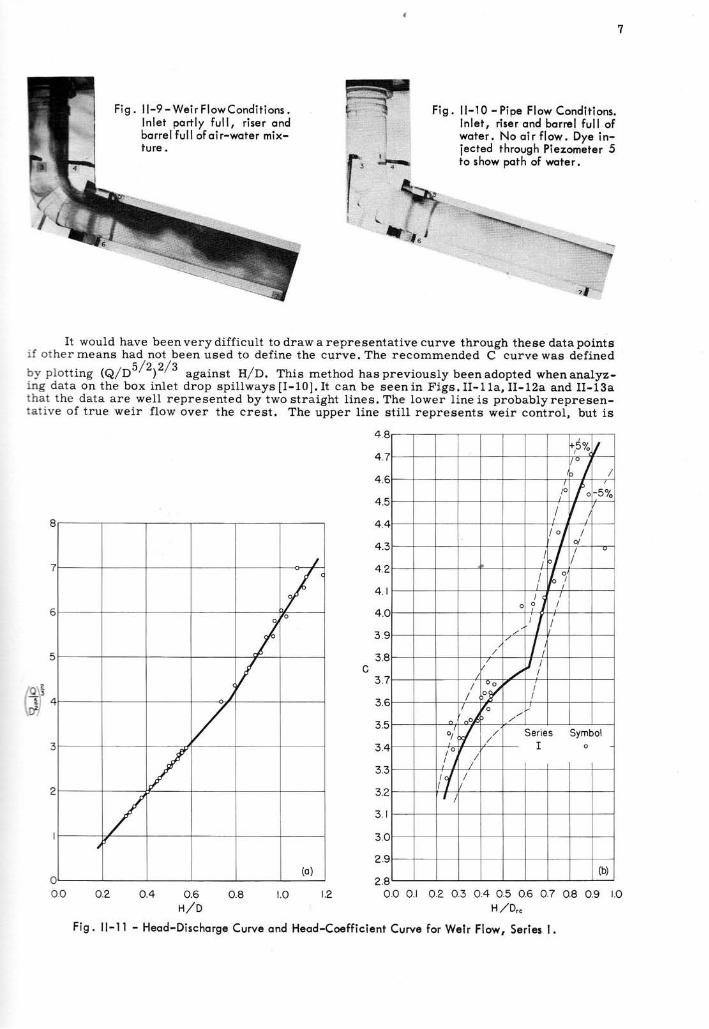
Fig. l l -9- Weir F lowCondi t ions.In let por t ly fu l l , r iser ondborrel fullof oir-woter mix-ture.
Fig. l l -10 -Pipe Flow Condi t ions.lnlet, riser ond borrel full ofwoter . No o i r f low. Dye in-iecled through Piezometer 5fo show poth of wuter.
It would have beenverydiff icult todrawarepresentativecurve through thesedatapointsi f o thermeans had not beenusedto def ine the curve.The recommended C curvewas def ined
. q / t t / 2 .byplot t ing (q/D" ' - ) " ' "
against H/D. Thi .smethodhaspreviousl -ybeenadoptedwhenanalyz-ing data on the box inlet drop spil lways [I-10]. It can be seen in Figs. II-1 1a, II-12a and II-i3athat the data are weJ.l represented by two straight l ines. The lower l i.ne is probablyrepresen-tative of true weir f low over the crest. The upper l ine sti l l represents weir control, but is
4
4
4
4
4
4
?
z
o.2 0.4 0.6 0.8 t.oH /D
Fig. l l - l I - Heod-Dischorge Curve ond
t.2 0.o o.r o.2 0.3 0.4 0.5 0.6 0.7 o.8H/D,"
Heod-Coefficient Curve for Welr Flow, Serier l.
o o
Fig.II-9-WeirFlowConditions. Inlet partly full, riser and barrel full of ai r-water mixture.
Fig. 11-10 - Pipe Flow Conditions. Inlet, riser and barrel full of water . No air flow. Dye injected through Piezometer 5 to show path of water.
It would have been ve ry difficult to draw a representative curve through these data pOints if othe r m eans had not be e n used to define the curve. The recommended C curve was defined
by plotting (Q/ D5/ 2)2/ 3 against H/ D. This method has previously been adopted when analyzing data on the box inlet drop spillwa ys [1-10). It can be seen in Figs. II-lla, II-12a and II-13a hat the data a re well represented by two straight lines. The lower line is probably represenative of t rue weir flow over the crest . The upper line still represents weir control, but i s
8
1
I 0
7
6
J I
5 C
j
/ i 4
/ I /
3
2
;
(a) 0
4 .8
4 .7
4 .6
4.5
4.4
4 .3
4.2
4 .
4 .0
I
3 .9
3 .8
3 .7
3.6
3.5
3 .4
3.3
3.2
3 I
30
29
28
I /
I
oj, 0/1 I U
/ I /
/7 I I /
50/. ' 0 !L ~01 /
/6 / 0 I
-5%
/ 1/ 1 10J /
0/
Ikl I _L /
/ 0
o / I
oj ) / /'
I I I V I /
L J I
I
~ I I '10
/' /'
/ Series Symbol /
I 0
(b)
I
7
0 .0 02 0.4 0 .6 HI D
0.8 LO 1.2 0 .0 0 .1 0 .2 0.3 04 0 5 0 6 0 7 0.8 0 .9 1.0 H/ Dre
Fig. 11-11 - Head-Discharge Curve and Head-Coefficient Curve for Weir Flow, Series I.
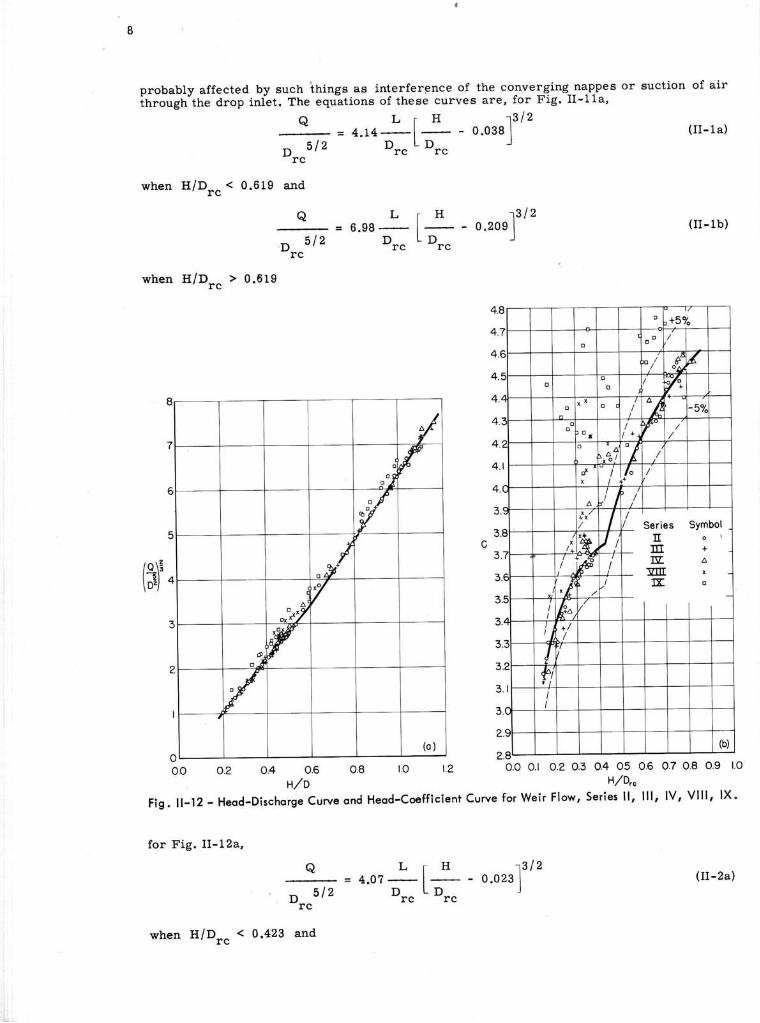
probably affected by such itrings as int-erfergnce of the converging_lappes or suction of air
ihrough-the drop iniet. The equations of these curves are, for Fig. II-1la,
a L ; H - 1 3 1 2
ot.u/z Dt" t Dt" r
when H/Dr" < 0.619 and
a L= 6 .98 -
. D 5 1 2 D r "rc
when II/D". > 0.619
i l 2o.2o e _l
o.o o.t o.2 0.3 0.4 05H/D,"
( I I -1a)
( r r -1b)
0.6 0.7 0.8 0.9 l.o
l l l , l v , v l l l , l x "
4
4
4
4
A
4
?
A I
4.
3
?
?
?
? l
3
a -
a
o.o o.2 0.4 06 0.8 l.o t.2H/D
Fig. l l -12 - Heod-Dischorge Curve ond Heod-Coeff icient Curve for Weir Flow, Series l l ,
for Fig. ll-L?a,
a L l H f l z= 4 .07 _ | 0 .023 I
D 512 Dr " L D r " Jrc
when H/Dr" < 0.423 and
I HL D
rc
Series Symbolt r o rI t r +E ' A
g t r xD C o
( I I -2a)
8
probably affected by such t hings as int erfe r~nc e of the converging nappe s or suction through the drop inlet . T he equations of the se curve s a r e , for F ig. II-lla,
of air
Q
when H/D < 0.619 and rc
Q
D rc 5/2
when H/D > 0.619 rc
8
7
6
5
0~1 ox) 11
Ox XX
o ~
, I
/
( Q \~ oil 4
3
2
L r H J3 /2
4 .14-;-L -;- - 0.038 rc rc
L r H J3 /2
6.98 -;- L -;- - 0 .209 rc rc
A/ 1
0 ~ 0")
If!
(0)
4.
4 .
4.
4.
4.
8
7
6
5
4. 3
. ~ 4
4. I
4
3
3 C
3
3
3
3
3
3
3
3
2
. \.
.8 ·
.7
.6
.5
.3
2
. 1
. ~
.9
o 2 .8
0
0
' x 0
--<l 0 0
0" 0
rl' x
A lx/ /
:li I.
/ ~ --'" 1 /
/ Ih.~A / ,,/ j /
1 11 t I I
(ll-la)
(II-lb)
0 +5%
0 0 I
o / /
tl o~ ~
0 / W'a. 0
0
J AA+ -5%
/ ~+ /
/ • 1 /
AA -,,-0 1 "1 /
/ I/ o / I .+
'p-i l j
/ / Ser ies Symbol
~/ II 0 ,
m +
I TIl: A :iZIII x
I IX: 0
-
(b)
0.0 0 .2 0.4 0 .6 08 10 12 0.0 0.1 0.2 0.3 0.4 05 06 07 0.8 0 .9 1.0 HID H/Orc
Fig. 11-12 - Head-Discharge Curve and Head-Coeffic ient Curve for Weir Flow, Series II, III, IV, VIII, IX .
for Fig. 1I-12a,
Q L r H J3 / 2 = 4 .07 -;- L -;- - 0 .023 (II - 2a)
rc r c
when H/Drc < 0.423 and
a
D 5 1 2rc
when H/D > 0.423- r c
L r H5.50 _ | __
D L Drc rc
(rr-2b)
4.8
4.7
4.6
4.5
4
o.o o.2 0.4 0.6 0.8 t.o t.2 0.0 o.r o.2 0.3 0.4 0.5 0.6 0.7 0.8 0.9 t.oH/D Hy'D,.
Fig. l l-13 - Heod-Dischorge Curve ond Heod-Coefficient Curve forWeir Flow, Series L-l , L-2, L-3.
and for Fig. II-13a,
( I I -3a)
when H/Dr"
(u-3b)
$ 1 2- o.oe6l
/o tt| 5 lt n2/
a L 1 H ] 3 l z= 4 .2Q - I 0 -033 |s l z D L p J
D r c r crc
< 0 .521 and
a L [ H : , 3 l z= 5 .L2 - | - } 0 .094 I
5 1 2 D L D Il J r c r crc
when H/D"c > 0.521.
The curves of F igs. I I -11a, I I -12a and I I -13a were. t ransferred to F igs. I I -11b, I I -12band Il- l3b respectively, after correcting for the change from condui.t diameter D to drop
4.
4,
4.
3 .
3.
3.
3.1
a
2.
2)
.5
.4
.2
.(,
.9
a
when HID > 0.423 rc
8
7
6
5
if ~p
JJ/ 3
2
I~
o
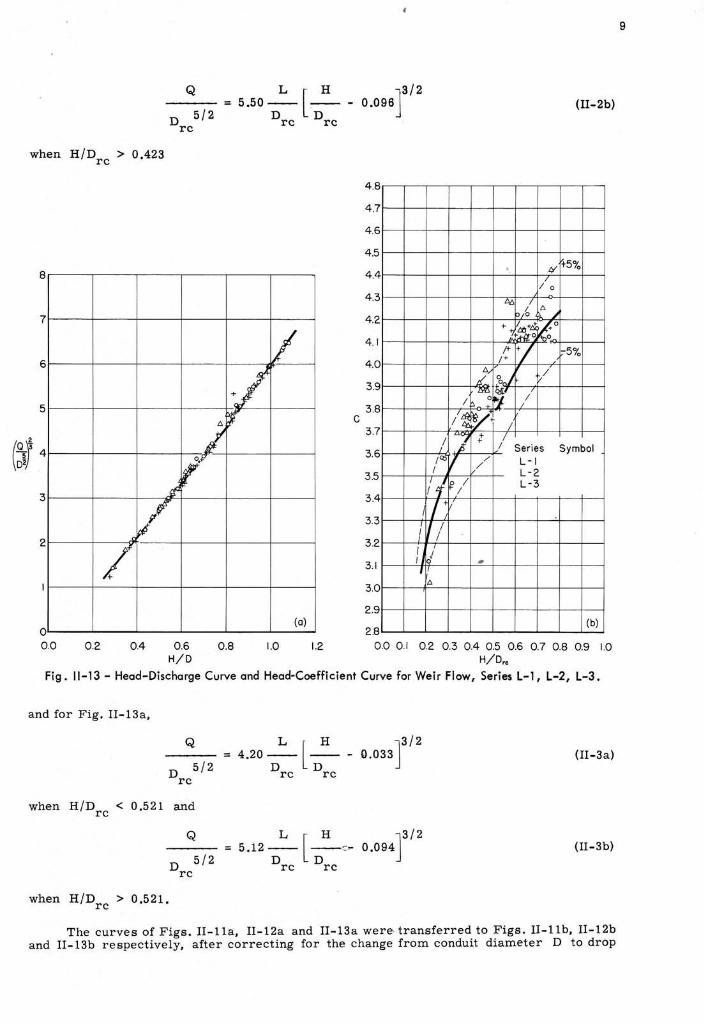
Q L [ H J3/2 = 5.50 D D - 0.096
rc rc
I --:;~
!'. 1 ~I
I C
(a)
4.8
4.7
4 .6
4.5
4.4
4.3
4.2
4. I
4.0
3.9
3.8
3.7
3.6
3.5
3.4
3.3
3.2
3.1
3.0
2.9
2.8
/ leo I
I/ { /+
/ 1/ 110' ,
!'.
(II-2b)
. if +5"10
//0
!'.t:, /
o/b !'. ~
+z~+~,o ~o 0
/+ +/ -5% /+ }/ / /
'bnl .~
~' / / 0
/~/: / Wj .t / / Series Symbol
I / L-I / L-2
f / /
L-3
".
(b)
0.0 0 .2 0.4 0.6 0.8 1.0 1.2 0.0 0.1 0.2 0.3 0.4 0.5 0.6 0.7 0.8 0.9 10 HID H/D,c
Fig. 11-13 - Head-Discharge Curve and Head-Coefficient Curve for Weir Flow, Series L-1, L-2, L-3.
and for Fig. II-13a,
Q L l H J3/ 2 = 4.20 D D - 0.033
rc rc
(II-3a)
when HID < 0.521 and rc
Q 5.12 D L [D
H :::- 0.094 r/2
(II-3b)
rc rc
when HID > 0.521. rc
The curves of Figs. II-lla, II-l2a and II-l3a were transferred to Figs. II-l1b, II-12b and II-l3b respectively, after correcting for the change from conduit diameter D to drop
9
l 0
inlet crest diameter Dr" which is taken as the inside diameter of the bell for the bell en-
trance. This was done so as to facil i tate the extrapolation to other ratios of D"",/D, since it
is Dr" that determines the crest length rather than D. It should be remembered that the
crest of Fig. II-12 is representative of bell ended ti le and is somewhat rounded, whereas the
crest of FiE. U-11 is a iquare-edged bellmouth inlet and the crest of Fig. II-13 is a square-edged pipe beII entrance.
Especially to be noted is the variation of discharge coefficient with relative head. Themethod of analysis presented here suggests that this variation is a result of the fact that thehead-discharge curve does not pass through the origin of coordinates as one would expect.The reason for this remains for future explanation.
Orif ice Coeff icient
Strangely, evidence of ori f ice control at the drop inlet crest was not obtained for al ldrop inlets included in the similar series reported here. The reason for this inconsistencyis not known. I t seems l ikely that the designer should plan as i f or i f ice control would exist,because, i f the assumptionwere in error, he would be on the safe side in planning for a lowercapacity that he would actual ly have.
Orif ice control was in evidence for Series VIII , and was known to exist for Series L-2and L-3 . I t shou ld beremembered tha t thesewere the ear l ies t tes tseonducted onc losed con-duit spi l lways and that the presence of ori f ice f low could have been easi ly overlooked for otherseries. Values of the ori f ice discharge coeff icients Co in Eq. I-6 are given in Table II-1 for
those series where ori f ice f low was observed. The head was measured from the water surfaceto the bottom of the bel l entrance, since the ori f ice control was observed to be at that point.
Orif ice f low extended to a head of l ,2B Ho/D for Series L-2, to a head of. l .4L Ho/D
for Series L-3, and to a head of. 2.55 t lo/O for Series VIII . The maximum head which is ob-
tained for ori f ice f low is apparently fortuitous, and heads greater than those observed are by
no means out of the range of possibi l i ty.
Short Tube Coefficient
Short tube f low--when the drop inlet is ful l of water and the barrel is part ly ful l--wasobserved only for Series L-1, L-2 and L-3. I t could have been present for some of the t i lepipe tests, but i f so i t couid not be observed visual ly and the head-discharge data shows no
Lvidence of the existence of short tube f low. Values of the short tube discharge coeff icient C"in Eq. I-? are given in Table II-1 for those instances where i t was observed.
Shor t tube f low was observed a t max imum heads o f 6 .18H" /O fo r Ser ies L -1 , 5 .10
H /O for Series L-2, and 4,27lH^/D for Series L-3. As for ori f ice f low,the maximum heads D
for short tube f low is apparently fortuitous.
Entrance Loss Coeff icient
Entrance loss coeff icients Ku for use in Eq. I-5 are given in Table II-1, except for
Series VIII. The spil lway never ran completely full for Series VIII and it was therefore im-possible to evaluate Ku. The tabulated values of K" for the ti le pipe series are the averages
for a very small number of tests, and they are of low precision. Also the pipe friction factorfor the ti le pipe was of Iow precision, and this enters directly into the determination of K".
Valuesof K" for the t ransparent p ipeare based onmore tests,are of much h igherprecis ion,
and can be used with some confidence. The loss caused by the elbow is also included in K"
and would undoubtedly increase if f latter slopes (greater angular change at the elbow) wereused. The tests reported here were made using only one slope and no indication of the effectof pipe slope on Ku is forthcoming from them'
10
inlet crest diameter D which is taken as the inside diameter of the bell for the bell en-rc
trance. This was done so as to facilitate the extrapolation to other ratios of Drc / D, since it
is D that determines the crest length rather than D. It should be remembered that the rc
crest of Fig. 11-12 is representative of bell ended tile and is somewhat rounded, whereas the crest of Fig. 11-11 is a square-edged bellmouth inlet and the crest of Fig . II-13 is a squareedged pipe bell entrance.
Especially to be noted is the variation of discharge coefficient with relativ.e head. The method of analysis presented here suggests that this variation is a result of the fact that the head-discharge curve does not pass through the origin of coordinates as one would expect. The reason for this remains for future explanation.
Orifice Coefficient
Strangely, evidence of orifice control at the drop inlet crest was not obtained for all drop inlets included in the similar series reported here. The reason for this inconsistency is not known. It seems likely that the designer should plan as if orifice control would exist, because, if the assumption were in error, he would be on the safe side in planning for a lower capacity that he would actually have.
Orifice control was in evidence for Series VIII, and was known to exist for Series L-2 and L-3. It should be remembered that these were the earliest tests conducted on closed conduit spillways and that the presence of orifice flow could have been easily overlooked for other series. Values of the orifice discharge coefficients C in Eq. 1-6 are given in Table 11-1 for
o those series where orifice flow was observed. The head was measured from the water surface to the bottom of the bell entrance, since the orifice control was observed to be at that point.
Orifice flow extended to a head of 1.28 H / D for Series L-2, to a head of 1.41 H / D o 0
for Series L-3, and to a head of 2.5 5 H / D fo r Se ries VIII. The maximum head which is obo tained for orifice flow i s a pparently fortuitou s , and he ads greater than those observed are by no means out of the range of possibility .
• Short Tube Coefficient
Short tube flow--when the drop inlet is full of water and the barrel is partly full--was observed only for Series L-l, L-2 and L-3. It could have been present for some of the tile pipe tests, but if so it could not be observed visually and the head-discharge data shows no evidence of the existence of short tube flow. Values of the short tube discharge coefficient C in Eq. 1-7 are given in Table 11-1 for those instances where it was observed. s
Short tube flow was observed at maximum heads of 6.18 H / D for Series L-l, 5.10 s H / D for Series L-2, and 4.27 H / D for Series L-3 . As for orifice flow, the maximum head
s s for short tube flow is apparently fortuit ous.
Ent r ance Loss Coe fficient
Entrance loss coefficients Ke for use in E q. 1-5 are given in T able 11-1, except for
Series VIII. The spillway never ran c ompletely full for Series VIII and it was therefore impossible to evaluate Ke' The tabulated values of Ke for the tile pipe series are the averages
for a very small number of tests, and they are of low precision. Also the pipe friction factor for the tile pipe was of low preCision, and t his ente rs directly into the determination of Ke'
Values of K for the transparent pipe are based on more tests, are of much higher precision, e
and can be us.ed with some confidence. The loss caused by the elbow is also included in Ke
and would undoubtedly increase if flatter slopes (greater angular change at the elbow) were used. The tests reported here were made using only one slope and no indication of the effect of pipe slope on K is forthcoming from them . e
1 1
PRESSURE COEFFICIENTS
Average values of the local pressure deviat ior" hrr/hrrp computed for ful l f low in a hor-
izontal fr ict ionless conduit are given in Table II-2. These pressures should be zero along thebarel beyond the inf luence of the drop i .nlet and elbow. The dif ferences between the obselvedaverages and zero are small . This could be due to small imperfections in the piezometers,to errors in determining the conduit fr ict ion factor, or because the hydraul i .c grade l ine wasassumed to pass through the center of theconduit exit which is not necessari ly acorect as-sumption. This assumpiionalsomeans that the tabulated values of h.r/hrrp".are not necessar-
i ly exactly correct. In any case, the dif ferences are small and can safely be neglected.
The tabutated values of hrr/hrrp for the drop inlet are always posit ive. However, the
fr ict ion grade l ine is so low that the pressures computed from Eq. I-14 wil l be negative andthe hydraul ic grade l ine wil l be below the conduit. This is because the barrel is on a slopethat is much steeper than the fr ict ion slope.
Maximum pressures for part ful l f low hO/D were observed at the f irst invert piezo-
meter in the bar re l . The max imumpressures observed dur ing each ser iesareg iven in Tab le
TABLE II.3
MAXIMUM OBSERVED PRESSURE FOR PART FULL FLOW
S€ries
P iez ,
n h
t.t$D j.Lfl t.l:jD
o .BB 0 .78 1 .05
IY VIII i l
z l , m I l z n 1 1 z n
1 . O 5 1 . 1 1 L , n
! - r L -1 L_5
o.7w o.7p o.75D
o,99 '0 .81+ 0 .78
I I
a
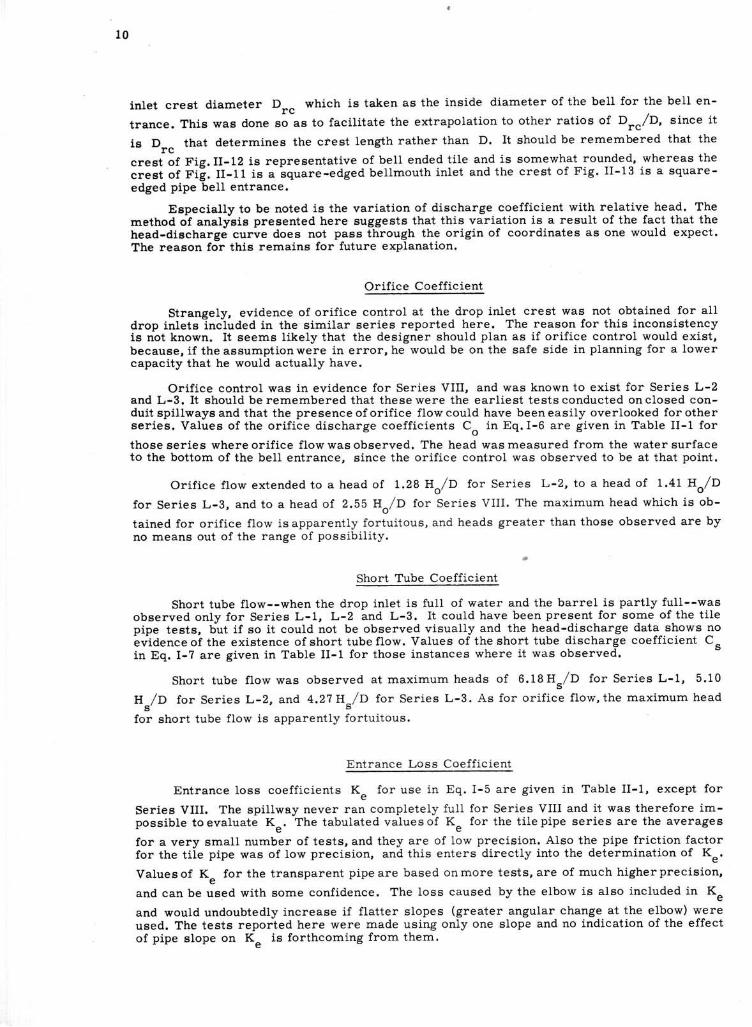
I I-3 together with the location of the piezometer. In most instances this piezometer was sofar downstream that i t probably did not record the actual maximum impact pressures causedbywater fal l ing down the drop inlet. I t is apparent from Table II-3 ihat the maximum recordedPressures are approximately equal to the pipe diameter and are so low as to cause the de-signer no concern.
CONCLUSIONS AND RECOMMENDATIONS
The preceding discussion has shown that the f low through closed conduit spi l lways havinga drop inlet of the same diameter as that of the barrel is determined by wei.r, ori f ice, shorttube, and pipe controL sections. The only safe way to determine the maxi.mum assured capa-city is to assume weir and ori f ice controls. This wil lgive theminimum capacity atany givenhead. I t should be real ized that the possibi l i ty of short tube and pipe f low is real and that thespi l lway capacity at t imes may be considerably greater than the ori f ice f low for which thespi l lway should be designed.
AII things considered, the proport ions of the closed conduit spi l lwoy described in this porf of therrport ore not recommended for use under field conditions.
If , in spite of the preceding, this spi l lway design is adopted, the proport ions for the dropinlet maybe takenfrom Fig. I I-1 and TabieII-1;the weir discharge coeff icients may be takenfrom Figs. I I-11, I I-12 and II-13; the ori f ice, short tube and entrance coeff icients may betaken from Table II-1; and the local pressure constants may be taken from Table II-2.
11
PRESSURE COEFFICIENTS
Average values of the local pressure deviations h / h computed for full flow in a hor-n vp izontal frictionless conduit are given in Table II-2. These pressures should be zero along the barrel beyond the influence of the drop inlet and elbow. The differences between the observed averages and zero are small. This could be due to small imperfections in the piezometers, to errors in determining the conduit friction factor, or because the hydraulic grade line was assumed to pass through the center of the conduit exit which is not necessarily a correct assumption. This assumption also means that the tabulated values of h / h -are not necessar-
n vp i ly exactly correct. In any case, the differences are small and can safely be neglected.
The tabulated values of h /h for the drop inlet are always positive. However, the n vp friction grade line is so low that the pressures computed from Eq. 1-14 will be negative and the hydraulic grade line will be below the conduit. This is because the barrel is on a slope that is much steeper than the friction slope.
Maximum pressures for part full flow h / D were observed at the first invert piezop
meter in the barrel. The maximum pressures observed during each series are given in Table
TABLE II-3
MAXIMUM OBSERVED PRESSURE FOR PART FULL FLOW
Series II III IV VIII IX L-1 L-2 L-3
Piez. 3.45D 3·450 3.450 3.45D 1.13D 1.13D 0.750 0.750 0.750
hiD 0.88 0.78 1.05 1.05 1.11 1.47 0.99 . 0.84 0.78
-------- ---'"
1I -3 together with the location of the piezometer. In most instances this piezometer was so far downstream that it probably did not record the actual maximum impact pressures caused by water falling down the drop inlet. It is apparent from Table II-3 that the maximum recorded pressures are approximately equal to the pipe diameter and are so low as to cause the des igner no concern.
CONCLUSIONS AND RECOMMENDATIONS
The preceding discussion has shown that the flow through closed conduit spillways having a drop inlet of the same diameter as that of the barrel is determined by weir, orifice, short tube, and pipe control sections. The only safe way to determine the maximum assured capacity is to assume weir and orifice controls. This will give the mInimum capacity at any given head. It should be realized that the possibility of short tube and pipe flow is real and that the spillway capacity at times may be considerably greater than the orifice flow for which the spillway should be designed.
All things considered, the proportions of the closed conduit spillway described in this part of the report are not recommended for use under field conditions.
If, in spite of the preceding, this spillway design is adopted, the proportions for the drop inlet may be taken from Fig. II-1 and Table II-1; the weir discharge coefficients may be taken from Figs. II-ll, II-12 and II-13; the orifice, short tube and entrance coefficients may be t aken from Table II-1; and the local pressure constants may be taken from Table II-2.
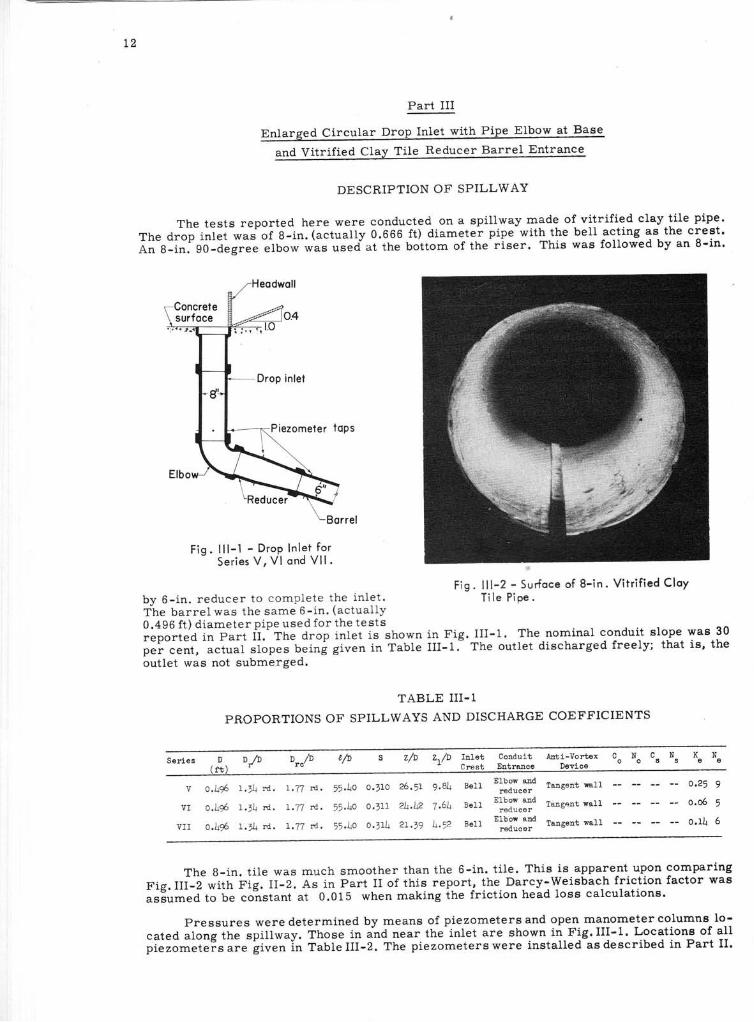
t 2
Part III
Enlarged Circular Drop Inlet with Pipe Elbow at Base
and Vitrif ied Clay Tile Reducer Barrel Entrance
DESCRIPTION OF SPILLWAY
The tests reported here were conducted on a spil lway rnade of vitrif ied clay ti le pipe'
The drop inlet was ot a-in. (actually 0.666 ft) diameter pipe with the bell acting as the crest.
An B-in. g0-degree "lbo* "n"" rrs"dat the bottom of the-riser. This was followed by an 8-in'
F i g . l l l - l - D r o P I n l e t f o rS e r i e s V , V l o n d V l l .
by 6 - in . reducer to comple te the in le t .The bar re l was the same 6- in . (ac tua l l y
0 .496 f t ) d iameter p ipe used fo r the tes tsreported in Part I I . The drop inlet is shownpei cent, actual slopes being given in Tableoutlet was not submerged.
Fig. l l l -2 - Sur foce of 8- in . Vi t r i f ied CloyT i l e P i p e .
in Fig. III-1. The nominal conduit slope was 30III-f. The outlet discharged freely; that is, the
TABLE III-1
PROPORTIONS OF SPILLWAYS AND DISCHARGE COEFFICIENTS
o l of
D / DrdZ/D z,/D Tntet
U r e S t
r,Tl fi. ,r.Lo oJro 26.11 9.BI+ 8611
L .77 ,n . ,, ).to o.t\l 4.\2 7 .611 Bell
I.77 m. ,r.l:o o.T)1 2I.)9 )r.tz Boll
hti-Vortox Co No C" N"Coldu itEntmnc€
v o.l+96 1.r]+ "d.
vI 0.l+96 1.rlr rd.
vrr 0.l+96 r.t+ rd.
Elbow ualreduc€r
Elbow androducer
Elbor aDdreducer
langent nll -- o.25 9
Tugent wall - ' 0.06 ,
Tugent reI1 -- o.1l+ 5
The B-in. t i le was much smoother than the 6-in. t i le. This is apparent upon comparing
Fig. III-2 with Fig. II-2. As in Part II of this report, the Darcy-weisbach friction factor was
asEumed to be constant at 0.015 when making the friction head loss calculations.
pressures were determined by means of piezometers and open manometer columns lo-
cated along the spil lway. Those in an{near the inlet are shown in Fig. III-1. Locations of allp iezometeFs. .e g i r r "n in TableI I I -2. The p iezometerswere insta l led asdescr ibed in Part I I .
12
Part III
Enlarged Circular Drop Inlet with Pipe Elbow at Base
and Vitrified Clay Tile Reducer Barrel Entrance
DESCRIPTION OF SPILLWAY
The tests reported here were conducted on a spill way made of vitrified clay tile pipe. The drop inlet was of 8-in. (actually 0.666 ft) diameter pipe with the bell acting as the crest. An 8-in. 90-degree elbow was used at the bottom of the riser. This was followed by an 8-in.
Headwall
Drop inlet
Elbo
Barrel
Fig. 111-1 - Drop Inlet for Series V I VI and VII.
by 6-in . redu ce r to complete the inlet. The barrel was the same 6 - in. (actually 0.496 ft) diameter pipe used for the tests
Fig. 111-2 - Surface of 8-in. Vitrified Clay Tile Pipe.
reported in Part II. The drop inlet is shown in Fig. III-lo The nominal conduit slope was 30 per cent, actual slopes being given in Table III-lo The outlet discharged freely; that is, the outlet was not submerged.
TABLE III-I
PROPORTIONS OF SPILLWAYS AND DISCHARGE COEFFICIENTS
Series D D,/D Dr/D liD S z/D Z/D Inlet Conduit Anti-Vortex C N C N K N ( ft) Crest Entra.nce Device 0 0 s s e e
V 0.496 1.34 rd. 1.77 rd. 55 .~0 0.310 26.51 9. 84 Sell Elbow and Tangent .... 11 0.25 9 reducer
VI 0.496 1. 34 rd. 1.77 rd. 55.40 0.311 24.42 7.64 Sell Elbow and
Tang~nt wall 0.06 5 reducer
VII 0.496 1. 34 rd. 1. 77 rd . 55 .Lo 0. 314 21.39 ~ · 52 Sell Elbow and
Tangent wall 0.14 6 reducer
The 8-in. tile was much smoother than the 6-in. tile. This is apparent upon comparing Fig. III-2 with Fig. II-2. As in Part II of this report, the Darcy-Weisbach friction factor was assumed to be constant at 0.015 when making the friction head loss calculations.
Pressures were determined by means of piezometers and open manometer columns located along the spillway. Those in and near the inlet are shown in Fig. III-I. Locations of all piezometers are given in Table III-2. The piezometers were installed as described in Part II.
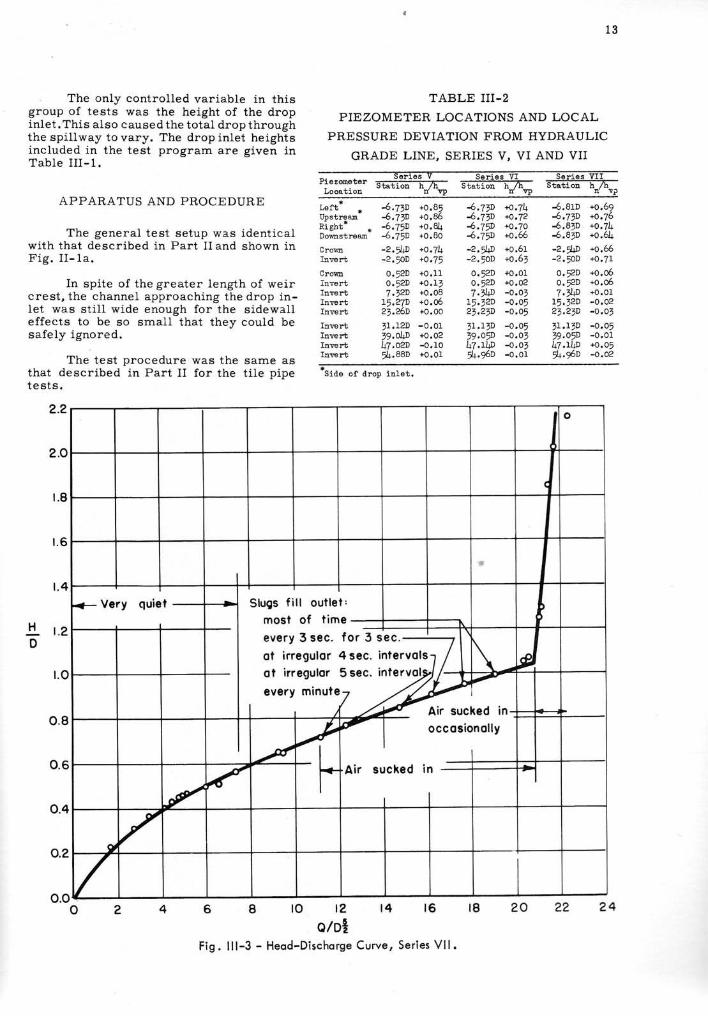
1 3
. The only control led variable in thisgroup of tests was the height of the dropinlet.This aLso causedthe total drop throughthe spi. l lway to vary. The drop inlet heightsincluded in the test program are given inTab le I I I - 1 .
APPARATUS AND PROCEDURE
The general test setup was identicalwith that described in Part I I and shown inF ig . I I - la .
In spite of the greater Iength of weircrest, the channel approachi.ng the drop in-let was st i l l wide enough for the sidewalleffects to be so small that thev could besafely ignored.
The test procedure was the same asthat described in Part I I for the t i le pipet e a t s .
2.2
2.O
t . 8
r . 6
1 . 4
r .o
o.8
o.6
o.4
o.2
TABLE III.2
PIEZOMETER LOCATIONS AND LOCAL
PRESSURE DEVIATION FROM HYDRAULIC
GRADE LINE, SERIES V, VI AND VII
Fiezonerer 55itr-7;- E,iffi=?Z- S*iiA=-E-EL o @ t i o n n r p t r v p s ! ?
tupstreu- 4,73o *o.* 4.71D +o,72 4,7rD +0,76Right' * -6.75D +o.U .'4,75o +9.7q .-6.81D +0,711Dorostreu- -6.75D +o.8o 4.75n *o.6 4.81D +0.6ll
crom -2.9+D +o.71+ -2.9$ +o,6t -2.9$ +o.66I lErb -2,FD +O,7, -2. jOD +O.6J -2.5OD +0.71
crm 0.52D +O.r l o.?D +o.01 o. fD +9.96IaErt O,52D +O.r t O,52D +o.OA O.52D +o,O6lnwrr 7.12D +o.O8 7.71D -O.O1 7.Jl+,D +0.01rnwrr 75,27D +0.6 r5.32D -O.O5 I5,t2D -O.O2rnwrr 21.26D +o.oo 23.21D -O.O5 21.2tD -O.Ot
Inrert 71.1.2D -0.01 1r,IrD -o.o5 1L.I1D -o.o5Iurert 19,OltD +O,O2 t9.05D -O.O1 t9.O5D -O.01Inrerb .l+7,o2D -0.1o l+7.1D -0.o, l+7.rlp +0.05lnwrt 5&.88D +o.o1 5[.95D -o.or 91.*D -o,o2
H t . zD
Side of alrop inlot.
6 8 t O t 2 t 4 1 6 1 8e/o'z
Fig. l l l -3 - Heod-Dischorge Curve, Ser ies Vl l .
4o.or
o
o
* f<- Very quiet
' l
Slugs f i l l out le i , Leveryot irt
3 sec .egulor
f 9 1 J s s s . J
4 sec. intervols Jv r r r r r v s r s l
every minut€
Air suc(ed in-,nOl ly
A i r s r
)ccoStc
/
r cked i n - -1
g./
/2 0 22 2 4
13
TABLE III-2 The only controlled variable in this group of tests was the height of the drop inlet. This also cause d the total drop through the spill way to vary. The drop inlet heights included in the test program are given in Table III-lo
PIEZOMETER LOCATIONS AND LOCAL
PRESSURE DEVIATION FROM HYDRAULIC
GRADE LINE, SERIES V, VI AND VII
Piezometer Series V Series VI
APPARATUS AND PROCEDURE
The general test setup was identical with that described in Part II and shown in Fig. II-1a.
In spite of the greater length of weir crest, the channel approaching the drop inlet was still wide enough for the sidewall effects to be so small that they could be safely ignored.
Location
• Left • Upstream Right· Downstream
Cro .... :n Invert
Cr own Invert Invert Invert Invert
Invert Invert Invert Invert
Station
-6 .730 -6.730 . -6.750 -6 .750
-2.540 -2 . 500
0.520 0.520 7.320
15.270 23.260
31.120 39.040 47.020 54·880 The test procedure was the same as
that described in Part II for the tile pipe tests.
·Side of drop inlet.
2.2
2.0
1.8
1.6
1.4 ~Very quiet SIU9S fill outlet :
H 1.2 -most of time
h/\p Station
+0.85 -6.730 +0.86 -6.730 +0.84 -6.750 +0.80 -6.750
+0.74 - 2.540 +0.75 -2.500
+O.ll 0.520 +0.13 0 . 520 +0.08 7.34D +0.06 15.320 +0.00 23. 230
- 0.01 31.130 +0.02 39.050 -0.10 47.140 +0.01 54.960
D
1.0
every 3 sec. for 3 sec.
at irregular 4 sec. intervals / 1\ every minute ~i
hni'iivp
+0.74 +0.72 +0.70 +0.66 +0.61 +0.63
+0.01 +0 . 02 -0.03 -0.05 -0.05
-0.05 -0.03 -0.03 -0.01
~
0 .8
., ;''"9''.' 5S~ ~
~ Air sucked in
0.6 V. ~ occaSionally
~ r--- Air sucked in
0.4
V ./
0.2 QlI /
V 0.0 o 2 4 6 8 10 12 14 16 18
Q/Di Fig. 111-3 - Head-Discharge Curve, Series VII.
1 20
Series VII Station h/hV?
-6.810 +0.69 -6.730 +0.76 -6.830 +0 .74 -6.830 +0. 64
-2·540 +0.66 -2.500 +0.71
0.520 +0.06 0.520 +0.06 7.34D +0.01
15.320 -0.02 23·23D -0.03
31.130 -0.05 39.050 -0.01 47.140 +0.05 54.96D -0.02
0
(
22 24
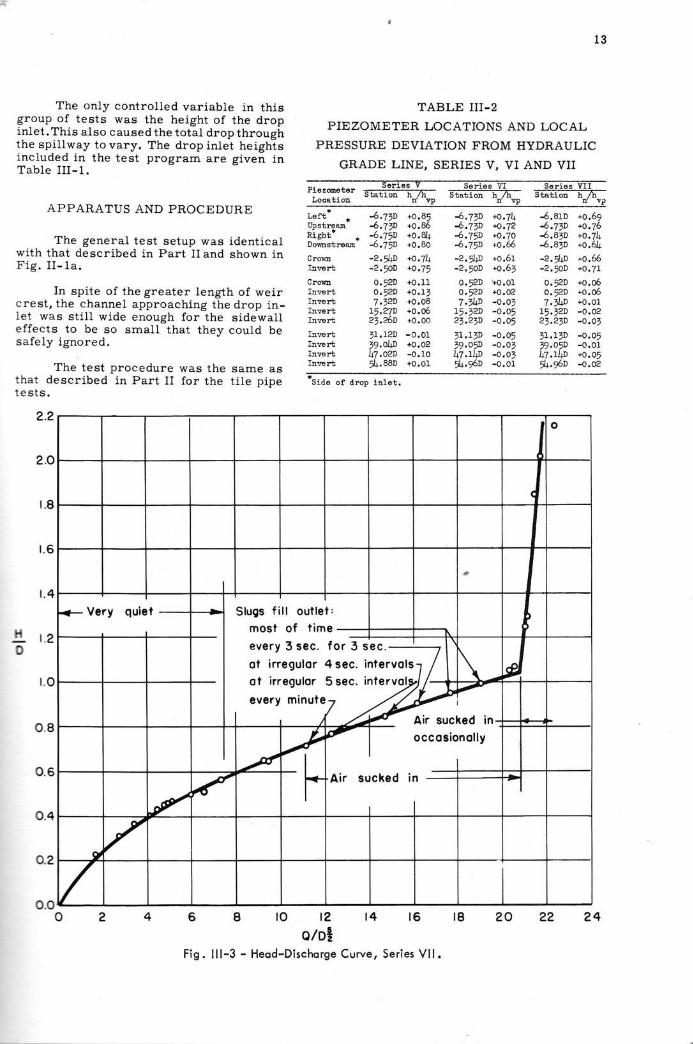
1 3
The only control led variable in thisgroup of tests was the height of the dropinlet.This also caused the total drop throughthe spi l lway to vary. The drop inlet heightsincluded in the test program are given inTab le I I I - 1 .
APPARATUS AND PROCEDURE
The general test setup was identicalwith that described in Part I I and shown inF i g . I I - l a .
In spite of the greater length of weircrest, the channel approaching the drop in-let was st i l l wide enough for the sidewalleffects to be so small that they could besafely ignored.
The test procedure was the same asthat described in Part I I for the t i le pipete6 ts .
o.6
o.4
o.o
TABLE III.2
PIEZOMETER LOCATIONS AND LOCAL
PRESSURE DEVIATION FROM HYDRAULIC
GRADE LINE, SERIES V, VI AND VII
Piez@6t6rLoqtLon
Lsft *UpstremTA ENI
Domstree
CromI!rert
CrmIn@rtI!@rtInErtInrert
IlwrtInwrbInrerblnrerb
-6.71D +o.85'6,7P *o.6-6.75D +o.81+-6.75D +O.80-2.5LD +o.74-2.rOD +O.75
0.52D +0.11O,52D +O.! t7. t2D +o,o8
75,27D +0.6Z3.Z6a +o.oo
,1 . r 2D -0 .0119,d$ +o.oai-+7.02D -0.105l+.88D +o.ot
4.71D +o.TlJ4,TtD +o,724.75D +o.7o4.75D +0.66-2.W +o.67-z.rOD +0.65
0.52D "+O.01O.?D +O.O2l . ) 4 ! - v . v )
r5.r2D -0.o521.21D -o.o5
3r.LtD -o.o5t9.o'D -o.ot47.rLt -o.o,54.96D -o.ol
4.81D +o.594,71D +0.764.81D +o.7b-5.8rD +0,61+-2.9+n +o.66-2.5OD +0.71
O.9D +O,O6O.)2D +s.06? : l , n - n ^ 1
L ) . ) . u - v . u z
c t , e ) D - v . v t
tL,r7D -o.o519.Ofl -o.orl17,l l jD +O.O591.*D -o,o2
2.O
2.2
1.8
r . 6
t . 4
*Side of alrop inlot.
8 r o t 2 t 4 1 6 1 8e/otz
l l l -3 - Heqd-Dischorge Curve, Ser ies Vl l .
H t . zD
t .o
o.2
2 0
o
J
+ Very quiet Slugs fimosteveryot i r
I outlef ,
o f t ime I3 sec .
egulorf o r 3 s e c . '
4 sec. intervols Tevery minuf
Air sucl(ed in-nol ly
Ai r s r
occostc
gcked i n - 1
q,/
/
o
F i s .
2 4
13
TABLE III-2 The only controlled variable in this group of tests was the height of the drop inlet. This a lso caused the total drop through the spill way to vary. The drop inlet heights included in the test program are given in Table III-lo
PIEZOMETER LOCATIONS AND LOCAL
PRESSURE DEVIATION FROM HYDRAULIC
GRADE LINE, SERIES V, VI AND VII
Piezometer Series V
APPARATUS AND PROCEDURE
The general test setup was identical with that described in Part II and shown in Fig. II-la.
In spite of the greater length of weir c rest, the channel approaching the drop inlet was still wide enough for the sidewall effect s to be so small that they could be safely ignored.
Loce.tion
Left • • UpstreBJJ\ Right· Downstream
Cro"/n Invert
Crown Invert Invert Invert Invert
Invert Invert Invert Invert
Station
-6.730 -6.730
• -6 .750 -6 .750
-2 .540 -2·500
0·520 0.520 7.320
15.270 23.260
31.120 39.040 47.020 54.880 The test procedure was the same as
t hat described in Part II for the tile pipe t est s.
·Side of drop inlet.
2.2
2.0
1.8
1. 6
1. 4 ~Very quiet Slu(1S fill outlet :
most of time
every 3 sec. for 3 sec . 1.2
0
hlhvp
+0.85 +0.86 +0.84 +0.80
+0.74 +0.75
+0.11 +0 .13 +0.08 +0.06 +0.00
-0.01 +0.02 -0.10 +0.01
Series VI Station hni'hvp
-6.730 +0.74 -6.730 +0.72 -6.750 +0.70 -6.750 +0.66
-2.540 +0.61 -2·.500 +0.63
0.520 '+0.01 0.520 +0.02 7·340 -0.03
15.320 -0.05 23. 230 -0.05
31.130 -0.05 39.050 -0.03 47.140 -0.03 54.960 -0.01
...
at ;".9,'or 4 •• c. ~ \ ~ at irregular 5 sec. interval ~ ,.
every minute ~ i 1. 0
~ Air sucked in
~ ~ occasionally
~ r+ Air sucked in
0 .8
0.6
V / 0.4
~ V
0.2
V 0 .0 o 2 4 6 8 10 12 14 16 18
o/oJ Fig. 111-3 - Head-Discharge Curve, Series VII.
I 20
Series VII Station hlh~p
-6.810 +0.69 -6.730 +0.76 -6.830 +0.74 -6.830 +0.64
-2.540 +0.66 -2.500 +0.71
0·520 +0.06 0·520 +0.06 7.340 +0.01
15. 320 -0.02 23.230 -0 .03
31.130 -0.05 39.050 -0.01 47.140 +0.05 54.960 -0.02
0
c
22 24
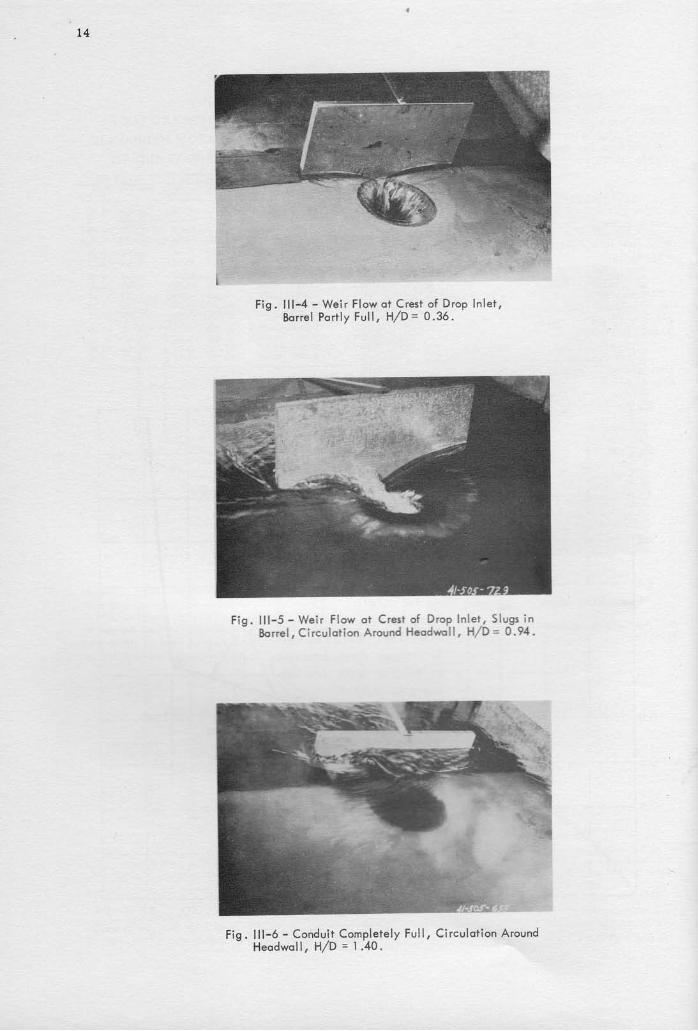
L 4
Fig. l l l -4 - Weir F low ot Crest of Drop ln let ,Borre l Por t ly tu l l , H/D = 0.36.
F i g . l l l - 5 - W e i r F l o w o t C r e s i o f D r o p I n l e t , S l u g s i nBor re l , C i rcu lo t ion Around Heodwol l , H /D = 0 .94 .
F ig . l l l - 6 - Condu i t Comp le te l y Fu l l , C i r cu lo t i on A roundH e o d w o l l , H / D = 1 . 4 0 -
14
Fig. 111-4 - Weir Flow ot Crest of Drop In le t, Barrel Partly Full, HID = 0 .36 .
Fig. 111-5 - We ir Flow at Crest of Drop Inlet, Slugs in Ba rre l, CirculationAround Headwa ll , HI D = 0.94.
Fig. 111-6 - Conduit Completely Full, Circulation Around Headwall, HID = 1.40.
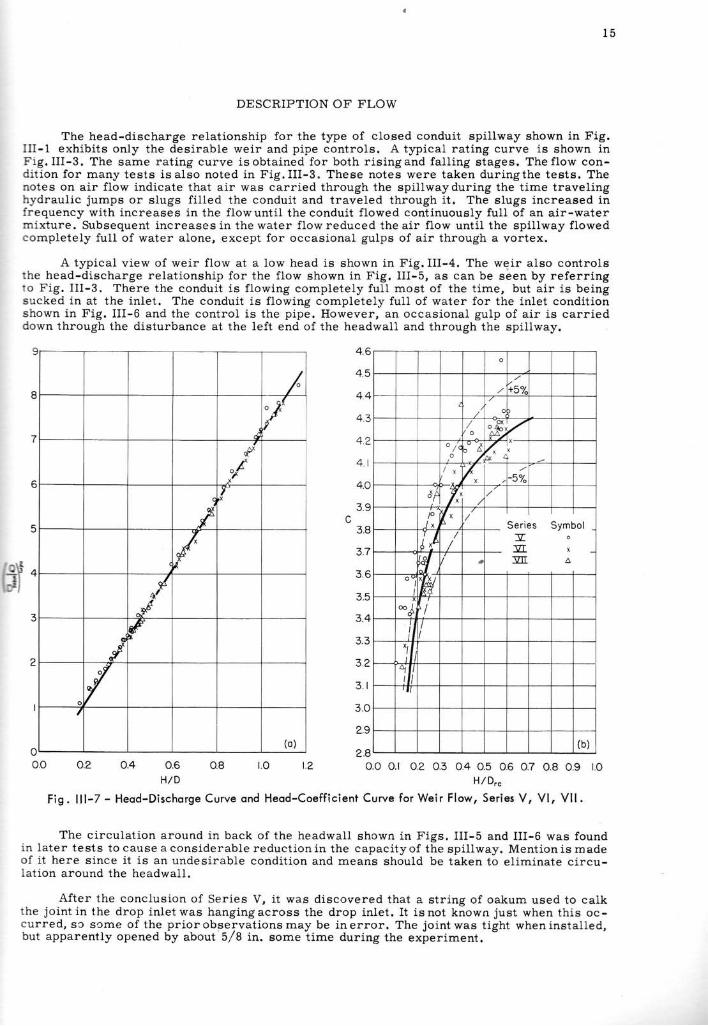
DESCRIPTION OF FLOW
The head-discharge relat ionshi.p for the type of closed conduit spi l lway shown in Fig.Itr-1 exhibits only the desirable weir and pipe controls. A typical rat ing curve is shown inFig. I I I-3. The same rat ing curve isobtained for both r isingand fal l ing stages. Theflow con-d i t ion fo r many tes ts i sa lso no ted in F ig . I I I -3 . These no tes were taken dur ing the tes ts . Thenotes on air f low indicate that air was carr ied through the spi l lwayduring the t ime travel inghydraul ic jumps or slugs f i l led the conduit and traveled through i t . The slugs increased infrequency with i .ncreases in the f lowunti l theconduit f lowed continuously ful l of an air-watermixture. Subsequent increasesin thewater f lowreduced theair f low unti . I the spi l lway f lowedcompletely ful l of water alone, except for occasional gulps of air through a vortex.
A typical view of weir f low at a low head is shown in Fig. I I I-4. The weir also controlsthe head-discharge relat ionship for the f low shown in Fig. I I I-5, as can be sben by referr ingto Fig. I I I-3. There the conduit is f lowing completely ful l most of the t ime, but ai.r is beingsucked in at the inlet. The conduit is f lowing completeLy fuI l of water for the inlet condit ionshown in Fig. I I I-6 and the control is the pipe. However, an occasional gulp of air is carr ieddown through the disturbance at the left end of the headwall and through the spi l lway.
oo o.2 0.4 0.6 0.8 t.o t.2H,/D
o
r5"/,
o
o /
o 1&r -qol
A I/r
nr _ Ser ies Symboly o
- U . xv n a
I tIV4
6 , {
II
1qI' a l
(b)
o.o o.r o.2 0.3 0.4 0.5 0.6 0.7 0.8 0.9 LOH / D r c
4.6
4.5
4.4
4.3
4 2
4 . 1
4.O
3.9
3.8
3.7
3.6
3.4
3.3
3.2
3. 1
? n
2.9
2.4
Fig . l l l -7 - Heod-Dischorge Curve qnd Heod-Coef f i c ien t Curve fo r Wei r F low, Ser ies V , V l , V l l .
The circulat ion around in back of the headwall shown in Figs. I I I-5 and II I-6 was foundin later tests to cause a considerable reduction in the capacity of the spi l lway. Mention is madeof i t here since i t is an undesirable condit ion and means should be taken to el iminate circu-lat ion around the headwall .
After the conclusion of Series V, i t was discovered that a str ing of oakum used to calkthe jo in t in the drop in le twas hang ingacross the drop in le t . I t i sno t knownjus t whenth is oc-curued, sc some o f the pr io robserva t ionsmay be iner ro r . The jo in twas t igh t when ins ta l led ,but apparently opened by about 5/8 in. some t ime during the experiment.
15
DESCRIPTION OF FLOW
The head-discharge relationship for the type of closed conduit spillway shown in Fig. III -l exhibits only the desirable weir and pipe controls. A typical rating curve is shown in Fig . lII-3. The same rating curve is obtained for both rising and falling stages. The flow condition for many tests is also noted in Fig. III-3. These notes were taken during the tests. The notes on air flow indicate that air was carried through the spillway during the time traveling hydraulic jumps or slugs filled the conduit and traveled through it. The slugs increased in requency with increases in the flow until the conduit flowed continuously full of an air-water
mixture. Subsequent increases in the water flow reduced the air flow until the spillway flowed c ompletely full of water alone, except for occasional gulps of air through a vortex.
A typical view of weir flow at a low head is shown in Fig. IlI-4. The w~ir also controls he head-discharge relationship for the flow shown in Fig. III-5, as can be seen by referring o Fig. 1II-3. There the conduit is flowing completely full most of the time, but air is being
sucked in at the inlet. The conduit is flowing completely full of water for the inlet condition shown in Fig. lII-6 and the control is the pipe. However, an occasional gulp of air is carried down through the disturbance at the left end of the headwall and through the spillway.
9
8
7
6
5
4
3
2
o 00
;: 0)(
& ~.
q.¢l-
pX )(c,.
,IT ;;" C
I tof
Ot.rI
I ~
oV , (a)
0 .2 0.4 0.6 0.8 1.0 1.2
4.6
4.5
4.4
4 .3
4.2
4 .1
4.0
3.9
3.8
3.7
3.6
3.5
3.4
3.3
3.2
3.1
3.0
2.9
2 .8
0/
0
/ x
6/6 T: /0 l x Jx
Ilxl / /
~1 / 0:1#
oeJ / 1 /
I x, I
'1 I I "
0
,/
/' +5"10 /
/ 0
/ o~ o f'L' i/x : xf'l:: ~
/"
x / -5% /'
/
/ Series Symbol
J[ 0
3lI , .. 3ZIl f::,
(b)
0.0 0.1 0.2 0.3 0.4 0.5 0.6 0.7 0.8 0 .9 1.0 HID H/Drc
Fig. 111-7 - Head-Discharge Curve and Head-Coefficient Curve for Weir Flow, Series V, VI, VII.
The circulation around in back of the headwall shown in Figs. 1II-5 and 1II-6 was found in later tests to cause a considerable reduction in the capacity of the spillway. Mention is made of it here since it is an undesira ble condition and means should be taken to eliminate circulation around the headwall.
After the conclusion of Series V, it was discovered that a string of oakum used to calk the joint in the drop inlet was hanging across the drop inlet. It is not known just when this occurred' s::> s ome of the prior observations may be in error. The joint was tight when installe d, but apparently opened by about 5/ 8 in. some time during the experiment.
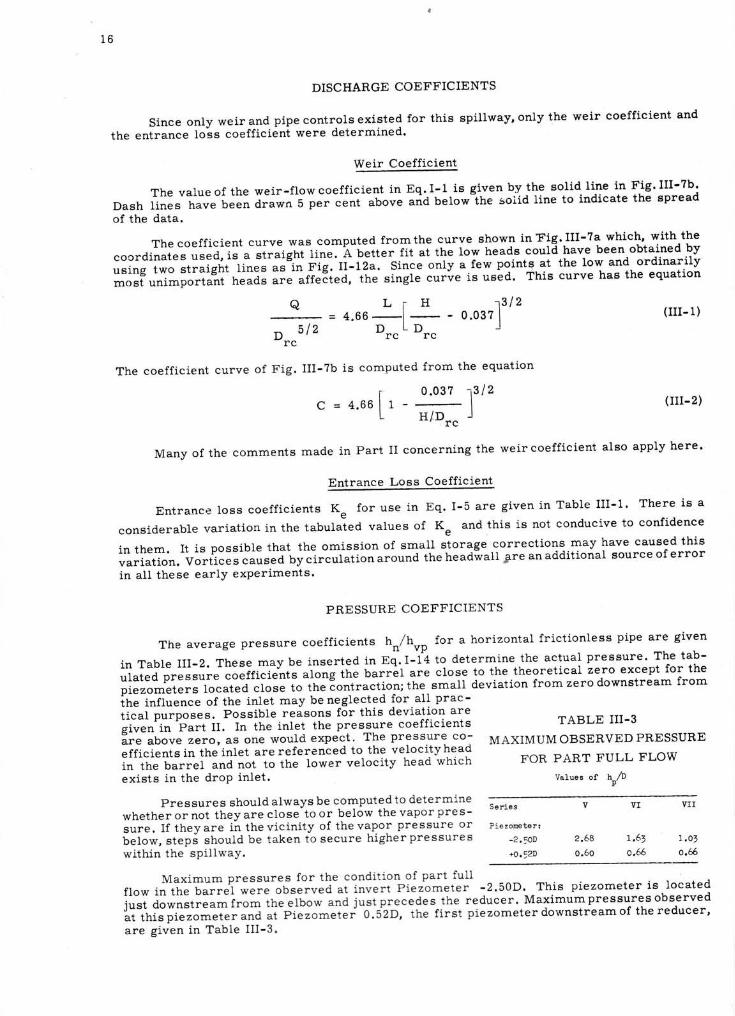
1 6
DISCHARGE COEFFICIENTS
Since only weir and pipe controls existed for this spi l lway, only the weir coeff icient and
the entrance lois coeff icient were determined'
WglL-Coefficlent
The value of the weir-f low coeff icient in Eq.I-1, is given bv the sol id l i le i1 Fig' I I I-?b'
Dash l ines have been drawn b per cent "uo\ru and below-the soi id l ine to indicate the spread
of the data.
Thecoeff icient curve was computed fromthe curve shown inFig'I I I-?a which' with the
coordinates used,is-a si"" lgtt l ine. A Ueiter f i t at the low heads could have been obtained by
using two straight i l ; ;- ; ; ; r ig. rr-t2..- sl""u only a,few points at the low and ordinari ly
most unimportant h;;d; are af ieEted, the single crrrve is us-ed' This curve has the equation
a L p H 1 3 1 2= 4 . 6 6 - i - - 0 . 0 3 ?
lD 5 1 2 o r " L o r "
rc
T h e c o e f f i c i e n t c u r v e o f F i g . I l l . ? b i s c o m p u t e d f r o m t h e e q u a t i o n
r 0 .03? 1312C = 4 . 6 6 1 1 - - l
,_ HlD". r
(uI-1)
(III- 2)
Many of the comments made in Part I I concerning the weircoeff icient also apply here'
Entrance Loss Coeff icient
Entrance loss coeff icients K" for use in Eq. I-5 are given in Table II I-1' There is a
considerable variat ion in the tabulated values of Ku and this is not conducive to confidence
in them. It is possible that the omission of small storage -corrections may have caused this
variat ion. Vort ices ;;*d iy circutat ion around the headivalt *re an addit ional source of error
in al l these earlY exPeriments.
PRESSURE COEFFICIENTS
The average pressure coeff icients hrr/hrrp for a horizontal fr ict ionless pipe are given
in Table uI-2. These may be inserted in rq.t-ta to determ.ine the actual pres6ure' The tab-
ulated pressure "." ir i" i?"" i" J;; ; ; ; ; U."t ir are close to the theoretical zero except for the
piezometers located close to the contraction; the small deviat ion from zero downstream from
ihe inf luence of the inlet may be neglected for al l prac-
i ic"t ptt .poses. Possible reasons for this deviat ion are
given in Part I I . In the inlet the pressure coeff icients TABLE II I-3
ire above zero, as one would expect. The pressure co- MAXIMUMOBSERVEDPRESSUREeff icients in the inlet are referenced to the velocity heao
in the barrel and not to the lower,retocity tr""a"*rt i" t t FOR PART FULL FLow
exists in the drop inlet. Values or ho,/D
Pressures should always be computed to determlne
whether or not they are close to or below the vapor pres-
sure . I f theyare in thev ic in i ty o f thevapor p ressure or
be low, s tep i shou ld be taken to secure h igher p ressures
within the spi l lwaY.
Maximum pressures for the condit ion of part ful l
f low in the bar re l were observed a t inver t P iezometer -2 .50D' Th is p iezometer i s loca ted
jus t downst reamfrom thee lbow and jus tp recedes- the reducer . Max imumpressuresobserved
at this piezometer and at Piezometei 0.S2O, the f irst piezometer downstream of the reducer,
are given in Table II I-3.
Se r ie s
P i o z o r e t € r !
-2. 5OD$.r2D
2 .6A 7 .61
0.60 0,66
Y] vrr
o.6
16
DISCHARGE COEFFICIENTS
Since only weir and pipe controls existed for this spillway, only the weir coefficient and the entrance loss coefficient were determined.
Weir Coefficient
The value of the weir-flow coefficient in Eq. 1-1 is given by the solid line in Fig. 1II-7b. Dash lines have been drawn 5 per cent above and below the :solid line to indicate the spread of the data.
The coefficient curve was computed from the curve shown in Fig. III-7a which, with the coordinates used, is a straight line. A better fit at the low heads could have been obtained by using two straight lines as in Fig. II-12a. Since only a few points at the low and ordinarily most unimportant heads are affected, the single curve is used. This curve has the equation
Q
D rc 5/2
L [ H J3/2 4 . 66 D D - 0.037
rc rc
The coefficient curve of Fig. 1II-7b is computed from the equation
[ _0_._03_7_ J3 / 2
C = 4.66 1-HiD rc
(III-1)
(III-2)
Many of the comments made in Part II concerning the weir coefficient also apply here.
Entrance Loss Coefficient
Entranc.; loss coefficients Ke for use in Eq. 1-5 are given in Table III-I. There is a
considerable variation in the tabulated values of K and this is not conducive to confidence e in them. It is possible that the omission of small storage corrections may have caused this variation. Vortices caused by circulation around the headwall j.re an additional source of error in all these early experiments.
PRESSURE COEFFICIENTS
The average pressure coefficients h / h for a horizontal frictionless pipe are given n vp
in Table III-2. These may be inserted in Eq. 1-14 to determine the actual pressure. The tabulated pressure coefficients along the barrel are close to the theoretical zero except for the piezometers located close to the contraction; the small deviation from zero downstream from the influence of the inlet may be neglected for all prac-tical purposes. Possible reasons for this deviation are given in Part II. In the inlet the pressure coefficients are above zero, as one would expect. The pressure coefficients in the inlet are referenced to the velocity head in the barrel and not to the lower velocity head which exists in the drop inlet.
Pressures should always be computed to determine whether or not they are close to or below the vapor pre ssure. If theyare in the vicinity of the vapor pressure or below, steps should be taken to secure higher pressures within the spillway.
Maximum pressures for the condition of part full
TABLE III-3
MAXIMUM OBSERVED PRESSURE
FOR PART FULL FLOW
Serie s
Piezomete r:
-2.70D
+O.52D
Values of
v
2.68
0.60
VI
1.63 0.66
VII
1.03 0.66
flow in the barrel were observed at invert Piezometer -2.50D. This piezometer is located just downstream from the elbow and just precede s the reducer. Maximum pressures observed at this piezometer and at Piezometer O.52D, the first pie zometer downstream of the reducer, are given in Table III-3.
L 7
CONCLUSIONS AND RECOMMENDATIONS
Froma hydrau l i c po in t o f v iew, the sp i l lway shown in F ig . I I I -1 i s en t i re ly sa t is fac to ryand is recommended for use under f ield condit ions. The spi l lway proport ions may be takenf rom F ig . I I I -1 and TabJ .e I I I -1 ; we i rd ischarge coef f i c ien ts may be taken f rom F ig . I I I -? ; theentrance coeff icient may be taken from Table II I-1; and the Local pressure constants may betaken from Table II I-2.
I t is recommended that some means be employed to el iminate circulat ion around theheadwall . This circulat ion reduces the capacity of tnL spi l lway.
17
CONCLUSIONS AND RECOMMENDATIONS
From a hydraulic point of view, the spillway shown in Fig. III-l is entirely satisfactory and is recommended for use under field conditions. The spillway proportions may be taken from Fig. III-I and Table III-I; weir discharge coefficients may be taken from Fig. III-7; the entrance coefficient may be taken from Table III-I; and the local pressure constants may be taken from Table III-2.
It is recommended that some means be employed to eliminate circulation around the headwall. This circulation reduces the capacity of the spillway.
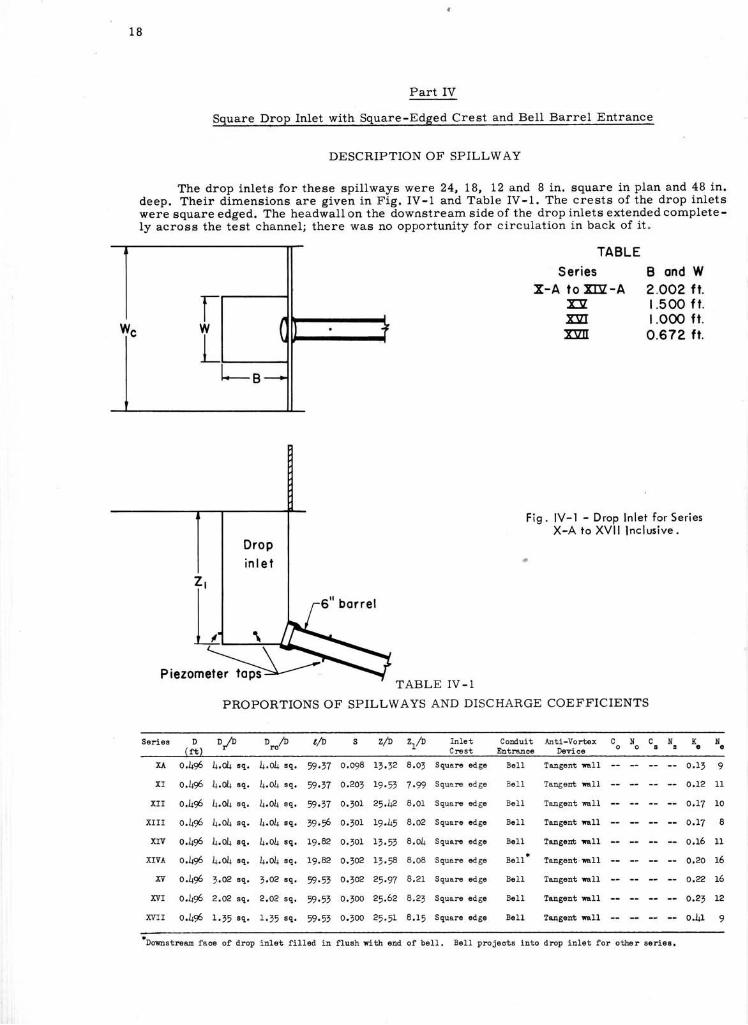
1 8
Part IV
Square Drop lnlet with Square-Edged Crest and Bell Barrel Entrance
DESCRIPTION OF SPILLWAY
The drop inlets for these spil lways were 24, 18, 12 and I in. square in plan and 48 in.deep. Their dimensions are given in Fig. IV-l and Table IV-1. The crests of the drop inletswere square edged. The headwallon the downstream side of the drop inlets extendedcomplete-Iy across the test channel; there wag no opportunity for circulation in back of it.
TABLESeries B ond W
X-A to Yr!il-A 2.OO2 fl.Y\7 1.500 f f .nrT t.ooo ff.w�wi�������������r 0.672 tt.
Fig. lV- l - Drop In let for Ser iesX-A to XVI I lnc lus ive .
TABLE IV- l
PROPORTIONS OF SPILLWAYS AND DISCHARGE COEFFICIENTS
Dropi n l e t
Sorlos o o r b o t b( fr)
tt'o s z/D zth I n l e t C o D d u l t h t l - V o r t € x C N C NC F s t h t r o c G D e r i c e o o s s
K Ne €
x.l 0.4* l+.ol+ sq. !.o,ia sq.
xI o.J+S6 l+.01+ cq. la.ol+ sq.
III o.l+g6 l+.ot+ sq. l+.o4 sq.
xIlI o.l+* l+.ol+ sq. ,[.0! eq.
ilv 0.l+96 l+.01+ sq. lr.olr sq.
xM 0.1+96 1+.01+ sq. L1.ol.r sq.
xY O.L+* t ,O2 Eq. , .02 sq.
xVI O.l+rS 2.e sq. 2.o2 sq.
xr f i r o. l+* r , t , sq. 1.r5 sq.
,9,17 o.W8 rt. t2
59.17 o.zot r9.r1
D.77 o.tol 2r.U2
59.* o.tor 8)+5
Lg.a2 o,TL rt,5t
19.82 O.roz lr.r8
9.55 o.to2 25.97
w,5t o.roo 25.62
59.51 o.loo 25.11
8.0, SquaF edgo 8oI1
7.99 SquaF edge 8611
8.0I squar odge Be1l
8.02 Square cdge B€11
I,Ol+ SquaF edge B€11
8.o8 Square cdge Bellr
8.21 Square edge Bsll
8,2, Square edge Eelt
8.15 Squaro edge BolI
Tutort EII
Tangerb nll
Tugent ml1
Tugcnt n11
lug€ft nu
?egent mll
Tugoat nll
TaEgent nl1
tugent nll
o , I , 9
0.12 11
o .17 10
o ,L7 I
0.15 11
0,20 16
o.4 L6
A D Z 1 D
o.l+r 9
Dmstree face of i lrop inlet f lu6at i! f lush rlth ead of bel1. Bel1 prcJoots irto drop inl6t for otlEr E6riea.
18
We
Part IV
Square Drop Inlet with Square-Edged Crest and Bell Barrel Entrance
DESCRIPTION OF SPILLWAY
The drop inlets for these spillways were 24, 18, 12 and 8 in. square in plan and 48 in. deep. Their dimensions are given in Fig. IV-1 and Table IV-I. The crests of the drop inlets were square edged. The headwall on the downstream side of the drop inlets extended completely across the test channel; there was no opportunity for circulation in back of iL
Series
XA
XI
XII
XIII
XIV
XIVA
XV
XVI
XVII
r W
L ~ L B-
Drop
inlet
. 1
TABLE IV-l
TABLE Series
X-A to xnl-A :Dr x:m :DZII
Band W 2.002 ft. 1.500 ft. 1.000 ft. 0.672 ft.
Fig. IV-l - Drop Inlet for Series X-A to XVII Inclusive.
•
PROPORTIONS OF SPILLWAYS AND DISCHARGE COEFFICIENTS
D DjD Dro/D lID S Z/D Z/D Inlet Conduit Anti-Vortex C N C N K
(ftl Crest Entranee Device 0 0 • • e
0.496 4.04 sq. 4.04 sq. 59.37 0.098 13.32 8.03 Square edge Bell Tangent ..... 11 0.13
0.496 4.04 sq. 4.04 sq. 59.37 0.203 19·53 7.99 Square edge Be ll Tangent wall 0.12
0.496 4.04 sq. 4.04 sq. 59.37 0.301 25.42 8.01 Square edge Bell Tangent wall 0.17
0.496 4.04 sq. 4.04 sq. 39.56 0.301 19.45 8.02 Square edge Bell Tangent wall 0.17
0.496 4.04 sq. 4.04 sq. 19.82 0.301 13.53 8.04 Square edge Bell Tangent wall 0.16
0.496 4.04 sq. 4.04 sq. 19.82 0.302 13.58 8.08 Square edge Bell • Tangent · wall 0.20
0.496 3.02 sq. 3·02 sq. 59·53 0.302 25·97 8.21 Square edge Bell Tangent wall 0.22
0.496 2.02 sq. 2.02 sq. 59.53 0.300 25.62 8.23 Square edge Bell Tangent wall 0.23
0.496 1.35 sq. 1.35 sq. 59.53 0.300 25.51 8.15 Square edge Bell Tangent wall 0.41
·Downstream faoe of drop inlet filled in flush with end of bell. Bell projects into drop inlet for other series.
N e
9
11
10
8
11
16
16
12
9
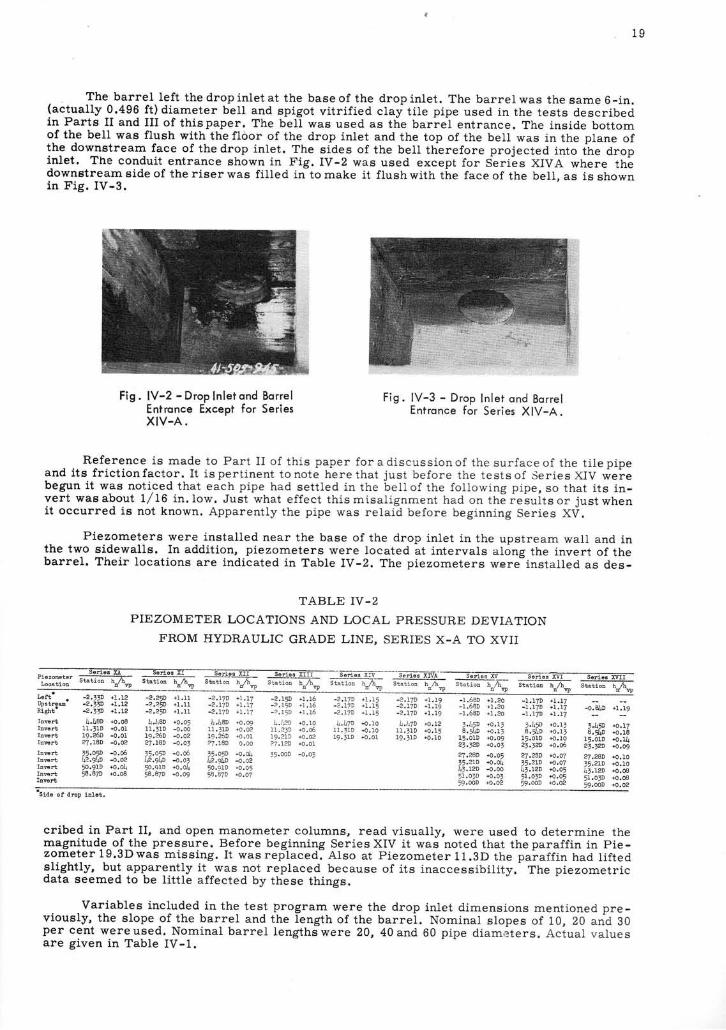
l v
The bar re l le f t thedrop in le ta t the baseof the drop in le t . The bar re lwas the same 6- in .(actuai ly 0.496 ft) diameter bel l and spigot vi tr i f ied clay t i le pipe used in the tests describedin Parts I I and II I of thispaper. The bel l was used as the bariel entrance. The inside bottomof the beLl was flush with the floor of the drop inlet and the top of the bell was in the plane ofthe downstream face of the drop inlet. The sides of the bel l therefore projected into the dropinlet. The conduit entrance shown in Fig. IV-2 was used except for SleriLs XIVA where thedownet reamsideof ther iserwas f i l l ed in tomake i t f lushwi th the faceof the be l l , as i sshownin F ig . IV-3 .
Fig . lV-2 - Drop Inlet ond BorrelEntronce Except for SeriesXIV.A.
Fig . lV-3 - Drop In le t ond Bor re lEnt ronce fo r Ser ies X IV-A.
Reference is made to Par t I I o f th is paper fo rad iscuss ionof the sur faceof the t iLep ipeand i t s f r i c t ion fac tor . I t i sper t inent tonote here tha t jus t be fore the tes tso f Ser iesXIV werebegun i t w-as noticed that each pipe had sett led in the beII of the foLIowing pipe, so that i ts in-ver t wasabout 1 , /16 in . Iow. Jus t what e f fec t th ismisa l ignment had on the ie iu i tsor jus twhenit occurred is not known. Apparently the pipe was relaid before beginning Series XV.
Piezometers were instaLled near the base of the drop inlet in the upstream wall and inthe two sidewalls. In addit ion, piezometers were located at intervals along the invert of thebarrel. Their locations are indicated in Table IV-2. The piezometers w.re instal led as des-
TABLE IV.z
PIEZOMETER LOCATIONS AND LOCAL PRESSURE DEVIATIONFROM HYDRAULIC GRADE LINE, SERIES X-A TO XVII
;;;;,"--u$!
Sbtion
-2, I7D +I.r5 -2.r7D +1.I9- 2 . I 7 D + r . r 5 - 2 . 1 7 D + 1 . 1 9-2.r7D +t. t5 -2.UD +1.19
4. lr7D 4.10 L,) !7D +o.I21 l . r I D { . 1 0 t 1 . r } D { . 1 519,11D +0.01 t9. l1D +0.10
s€dos I ryA Sed6s WSta t io i h ,4 l S ta t ion h ,4
r w d Q
lr,l8D1 1 . r 1 D19.26D22.18D
55.oPE.9ltDN'9ID,8,8m
+1.12
+0.08+0.01-0.01{,02-0.6-o,02+0. o!{ .08
-2.29-2.2W-2.25D
! JrSD1 1 , J l D19,?AD27.tAD
12.9\D50,9rD58.87D
+ t . U+ 1 . 1 1+ 1 . U
+0.05-o,m-o.o2-o,o1
-0. 06
+0,04+0.09
!. !D11, r lD19,26D27.taD
15.ofr112.91]D50.9rD,8.87D
' \ , f 7 - 2 . 1 5 D + 1 . 1 6+ 1 . 1 ? - 2 . 1 5 D + ) . 1 5+ 1 . U - 2 . 1 5 D + 1 . 1 6
+o,@ lr . / r2D +o.ro+a.az 11,2fD +0.(6{.o1 19.2ID +a.O20.00 ?' l . l?D 4.al
-o.d+ J5,aoD -o.ot4.O2+0.05{ . 0 7
-1.68D +I.20-1.68D +1.20-1.68D +1.20
8.tr t +o,1315.01D {.0923.12D +o.Ot
27.28D +0.a5,5'2\D fi.o14!r.12D {.OO51.o1D +o.at59,00D +0.02
-1.!7D +1.17- r . 1 7 D + 1 . 1 7-1.UD +1.17
8. ' l rD +0.111 5 . 0 1 D { , r 0zt.JzD +0.6
27.23D +a.o7,5,?LD f i ,O7Lt.tzD +o.o,51,orD €,0559.00D 10.02
-0.81r! d.19
8.9+D +o.1815.01D +0.142t. t2D +o.tE
27,24D +O.rO15.2ID +O.7O4r.l?D +0.0851.orD {.0859.ooD +0.02
'S id6 o f d rop in ] . t ,
cribed in Part I I , and open manometer columns, read visual ly, were used to determine themagniturt-e^o{ the pressure. Eefore beginning Series XIV i t was noted that the paraff in in Pie-zometer l9 .3Dwas miss ing . I t wasrep laced. A lso a t P iezometer l l .3D the para f f in had l i f tedsl ightly, but apparently i t--was not replaced because of i ts inaccessibi l i ty. The piezometricdata seemed to be l i t t le affected by these things.
Variables included in the test program were the drop inlet dimensions mentioned pre-viously, the slope of the barrel and the length of the barrel. Nominal slopes of 10, 20 and 30per cent wereused. Nomina l bar re l leng thswere 20 , 40and 60 p ipe d iameters" Ac tua l va luesare given in Table IV-1.
19
The barrel left the drop inlet at the base of the drop inlet. The barrel was the same 6-in. (actually 0.496 ft) diameter bell and spigot vitrified clay tile pipe used in the tests described in Parts II and III of this paper . The bell was used as the barrel entrance . The inside bottom of the bell was flush with the floor of the drop inlet and the top of the bell was in the plane of the downstream face of the drop inlet. The sides of the bell therefore projected into the drop inlet. The conduit entrance shown in Fig. IV -2 was used except for Series XIV A where the downstream side of the riser was filled in to make it flush with the face of the bell, as is shown in Fig. IV - 3 •
Fig. IV-2 - Drop Inlet and Barrel Entrance Except for Series XIV-A .
Fig. IV-3 - Drop Inlet and Barrel Ent rance for Series XIV-A.
Reference is made to Part II of this paper for a discussion of the surface of the t ile pipe and its friction factor. It is per tinent to not e here that just before the te sts of Serie s XIV were begun it was noticed that each pipe ha d settled in t he bell of the followi ng pipe, so that its invert was about 1/ 16 in. low. Just what effect this mi.salignment had on the results or just when it occurred is not known. Apparently the pipe was relaid before beginning Serie s XV.
Piezometers were installed near the base of the drop inlet in the upstream wall and in the two sidewalls. In addition, piezometers were located at intervals along the invert of the barrel. Their locations are indicated in Table IV -2. The piezometers w~re installed as des-
Series XA
TABLE IV-2
PIEZOMETER LOCATIONS AND LOCAL PRESSURE DEVIATION
FROM HYDRAULIC GRADE LINE, SERIES X-A TO XVII
Series XI Series XII Seri es XIII Series XIV Se ries XIVA-- Series XV Series XVI Piel'.ometer Station h,/hvp Station Laeation hn/hvp Station h,/hvp Station hn/hvp Station hn,ihvp Statio:!. hn/hvp Station hn/hvp Station hn/ hvp
Left ' 0
_2. ,,0 +1.12 -2.250 +1.11 -2.17° +1.17 - 2.150 +1.16 - 2 . 170 +1.15 - 2 .17D +1.19 - 1.680 +1.20 -1 . 170 +1.17 Up stree.m -2.,,0 +1.12 -2.250 +1.11 -2.17D +1.17 - 2.150 "'1.16 - 2 . 17D -1-1.15 - 2.170 +1.19 - 1.680 +1.20 -1.17° +1.17 Right- -2.3)ll +1.12 - 2 .250 +1 .11 - 2 . 17D +1.17 - 2.150 . 1.16 -2 .170 .1 .15 - 2. 170 +1.19 - 1.680 +1 .20 - 1.170 +1.17
Invert 4.480 +0.08 L.118D +0.05 4 .480 +0·09 1: . 1.20 +0 .10 4.470 ...0 . 10 4.1.70 ...0.12 ,.~ +0.13 3.450 +0 .13 Invert 11. 310 +0.01 11 . 310 ..0.00 11 . 310 +0 . 02 11 .23D 00.06 11.310 +0 . 10 11.310 +0 . 15 8. +0.13 8·54D +0.13 Invert 19 .26D - 0 . 01 19.260 -0 .02 19 . 26D +0 . 01 19. 210 +0.02 19.,10 +0.01 19· 310 +0.10 15.010 +0.09 15.010 +0.10 Invert 2'/.180 -0 . 02 27 .180 -0.0, '77 .180 0.00 71 . 120 +0.01 23·,20 +0,03 23.320 00 . 06 Invert tt~~ -0.06 ~.050 -0.06 ,5.050 -0.04 35 . OOD - 0 . 03 27 . 280 +0. 05 27 . 280 +0 . 07 Invert -0,02 .940 -0 . 03 42.941> -0, 02 l5.21O 00.04 £5 .210 +0 .07 Invert 50 .910 +0.04 5O.~no +0. 04 50.910 +0 . 05 3.120 -0 . 00 3 . 120 +0.05 InVl!lrt 58 .871> 00 . 08 58.R70 +0.09 58 .870 +0.07 51.0,0 +0.03 51.0,0 +-D,05 Invert 59 · 000 +0.02 59.000 +0.02
·Side of drop inlet .
Seriea XVII Station h,/hvp
-O. eI,D +1.19
3.450 00.17 8.541> +0. 18
15.010 +O .~ 2,.,20 00.0<)
27,28D +0, 10 35.210 +0.10 43.120 +0.08 51.0)ll 00.08 59.00D 1'0.02
cribed in Part II, and open manometer columns, read visually, were used to determine the magnitude of the pressure. Before beginning Series XIV it was noted that the paraffin in Piezometer 19.3Dwas missing. It was replaced. Also at Piezometer 11.3D the paraffin had lifted slightly, but apparently it was not replaced because of its inaccessibility. The piezometric data seemed to be little affected by these things.
Variables included in the test program were the drop inlet dimensions mentioned previously' the slope of the barrel and the length of the barrel. Nominal slopes of 10, 20 and 30 per cent were used. Nominal barrel lengths were 20, 40 and 60 pipe diam,;ters. Actual value s are given in Table IV-1.
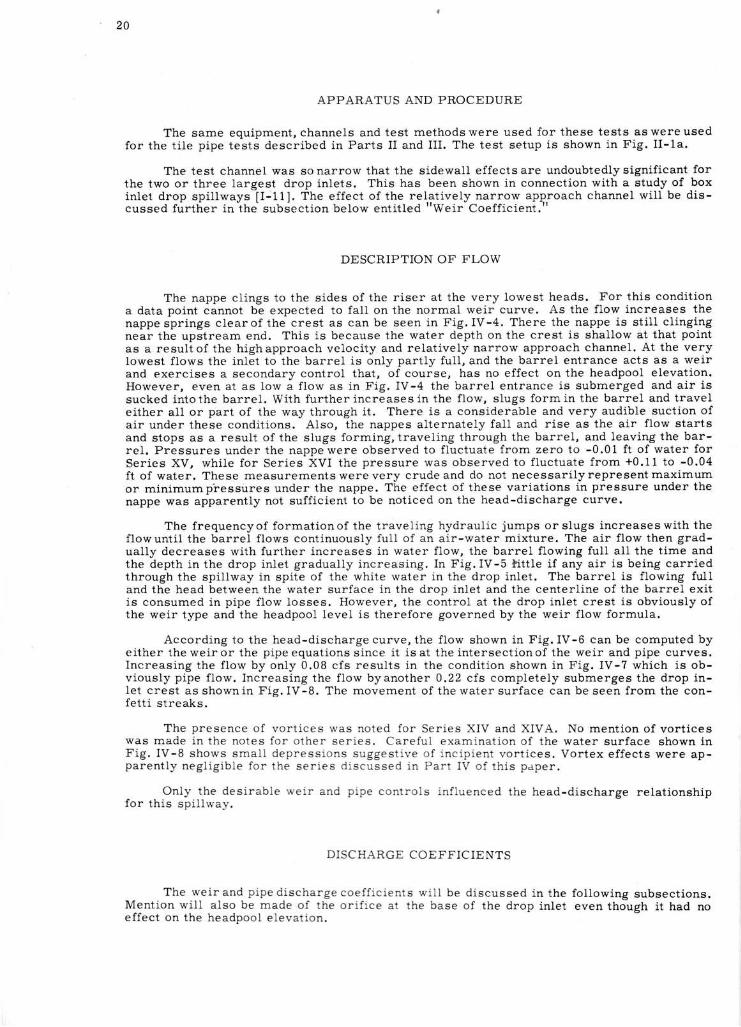
20
APPARATUS AND PROCEDURE
The same equ ipment , channe ls and tes t methodswere used fo r these tes ts aswereusedfor the t i le pipe tests described in Parts I I and II I . The test setup is shown in Fig. I I-1a.
The test channel was sonarrow that the si.dewall effectsare undoubtedlysignif icant forthe two or three largest drop inlets. This has been shown in connection with a study of boxinlet drop spi l lways II-11]. The effect of the relat i .vely narrow approach channel wi i l be dis-cussed fu r ther in iho subsec t ion be low ent i t led "we i . r "Coef f i c ien i . t '
DESCRIPTION OF FLOW
The nappe cl. ings to the sides of the r iser at the very lowest heads. For this condit iona data point cannot be expected to fal l on the normal weir curve. As the f low increases thenappespr ings c learo f the c res t as canbe seen in F ig . IV-4 . There the nappe is s t i l l c i ing ingnear the upstream end. This is because the water depth on the crest is shal low at that pointas a resultof the highapproach velocity. and relat ively narrow approach channel. At the veryIowest f lows the inlet to the barrel is only part ly fu1l, and the barrel entrance acts as a weirand exerc ises a secondary cont ro l tha t , o f course , has no e f fec t on the headpoo l e leva t ion .However, even at as low a f low as in Fig. IV-4 the barrel entrance is submerged and air issucked in to the bar re l . Wi th fu r ther increases in the f l .ow, s lugs fo rmin the bar re l and t rave leither a1l or part of the way through i t . There is a considerable and very audible suction ofair under these condit ions. Also, the nappes alternately fal l and r ise as the air f low startsand stops as a result of the siugs forming, travel ing through the barrel, and leaving the bar-re l . Pressures under the nappewere observed to f luc tua te f rom zero to -0 .01 f t o f water fo rSer i .es XV, wh i le fo r Ser ies XVI the pressure was observed to f luc tua te f rom +0.11 to -0 .04
f t o f water . These measurementswerevery c rudeand do no t necessar i l y representmax imumor minimumpressures under the nappe. The effect of these variat ions in pressure under thenappe was apparently not suff icient to be noticed on the head-discharge curve.
The f requencyof fo rmat ionof the t rave l ing hydrau l i c jumps or s lugs inc reases w i th theflowunti l the barrel f lows continuously fut l of an air-water mixture. The air f low then grad-ual ly decreases with further increases in water f1ow, the barrel f lowing ful l al l the t ime andthe depth in the drop inlet gradually increasing. In Fig. IV-5 i i t t le i f any air is being carr iedthrough the spi l lway in spite of the white water in the drop inlet. The barrel is f lowing ful land the head between the water surface in the drop inlet and the centerl ine of the barrel exiti s consumed in p ipe f low losses , However , the cont ro l a t the drop in le t c res t i s obv ious ly o fthe weir type and the headpool level is therefore governed by the weir f low formula.
Accord ing to the head-d ischarge curve , the f low shown in F ig . IV-6 can be computed byeither the weir or the pipe equations since i t is at the intersection of the weir and pipe curves.Increas ing the f low by on ly 0 .08 c fs resu l ts in the cond i t ion shown in F ig . IV-7 wh ich is ob-viously pipe f low. lncreasing the f low byanother 0.22 cf.s completely submerges the drop in-le t c res t as shownin F ig . IV-8 . The movement o f the water sur face can be seen f rom the con-fe t t i s t reaks .
The presence o f vor t i ces was no ted fo r Ser ies X IV and XIVA. No ment ion o f vor t i ceswas made in the no tes fo r o ther ser ies , Care fu l examinat ion o f the water sur face shown inF ig . IV-B shows smal l depress ions suggest ive o f inc ip ien t vor t i ces . Vor tex e f fec ts were ap-parent ly neg l ig ib le fo r the ser ies d iscussed in Par t IV o f th is paper .
Only the desirable weir and pipe controls inf luenced the head-discharge relat ionshipfor this spi l lway.
DISCHARGE COEFFICIENTS
The we i r and p ipe d ischarge coef f i c ien ts w i l l be d iscussed in the fo lLowing subsec t ions .Mention wiII aLso be made of the ori f ice at the base of the drop inlet even though i t had noeffect on the headpool elevation.
20
APP ARATUS AND PROCEDURE
The same equipment, channels and test methods were used for these tests as were used for the tile pipe tests described in Parts II and III. The test setup is shown in Fig. II-1a.
The test channel was so narrow that the sidewall effects are undoubtedly significant for the two or three largest drop inlets. This has been shown in connection with a study of box inlet drop spillways [1-11]. The effect of the relatively narrow approach channel will be discussed further in the subsection below entitled "Weir Coefficient."
DESCRIPTION OF FLOW
The nappe clings to the sides of the rise r at the very lowest heads. For this condition a data point cannot be expected to fall on the normal weir curve. As the flow increases the nappe springs clear of the crest as can be seen in Fig. IV -4. There the nappe is still clinging near the upstre am end. This is because the water depth on the crest is shallow at that pOint as a result of the high approach velocity and relatively narrow approach channel. At the very lowest flows the inlet to the barrel is only partly full, and the barrel entrance acts as a weir and exercises a secondary control that, of course , has no effect on the headpool elevation. However, even at as low a flow as in Fig. IV -4 the barrel entrance is submerged and air is sucked into the barrel. With further incre ases in the flow, slugs form in the barrel and travel either all or part of the way through it. There is a considerable and very audible suction of air under these c onditions. Also, the nappes alternately fall and rise as the air flow starts and stops as a result of the slugs forming, traveling through the barrel, and leaving the barrel. Pressures under the nappe were observed to fluctuate from zero to -0.01 ft of water for Series XV, while for Series XVI the pressure was observed to fluctuate from +0.11 to -0.04 ft of water. These measurements were very crude and do not necessarily represent maximum or minimum pressures under the nappe. The effect of these variations in pressure under the nappe was apparently not sufficient to be notic e d on the head-discharge curve.
The frequency of formation of the tra veling hydraulic jumps or slugs increases with the flow until the barrel flows continuously full of an air-water mixture. The air flow then gradually decreases with further increases in wate r flow, the barrel flowing full all the time and the depth in the drop inlet gradually inc reasing . In Fig. IV-5 h ttle if any air is being carried through the spillway in spite of the white wat e r in the drop inlet. The barrel is flowing full and the head between the water surface in the drop inlet and the centerline of the barrel exit is consumed in pipe flow l o sses. Ho weve r, the control at the drop inlet crest is obviously of the weir type and the headpool level is therefore governed by the weir flow formula.
According to the head-discharge curve, the flow shown in Fig. IV -6 can be computed by either the weir or the pipe equations since it is at the intersection of the weir and pipe curves. Increasing the flow by only O.OS cfs results in the condition shown in Fig. IV -7 which is obviously pipe flow. Increasing the flow by another 0.22 cfs completely submerges the drop inlet crest as shown in Fig . IV -S. The movement of the water surface can be seen from the confetti streaks.
The prese nce of vo r tice s was noted for Se r ie s XIV and XIV A . No mention of vortices was made in t he notes for other se r ies . Careful examinatio n o f t he water surface shown in Fig. IV -S show s s mall depre s sions sugge s tive o f incipie nt vo r tic es. Vortex effects were apparently ne g ligib le for the se r ies discussed in Part IV of thi s pdpe r.
Only the de s i r able weir and pipe controls i nfluence d the head-discharge relationship for this s pill way.
DISC HARGE COE F F ICIENTS
The wei r and pipe discha r ge coefficient s will be di scussed in the following subsections. Mention will a lso be m a de of the orifice at the bas e o f the drop inlet even though it had no effect on the headpool elevation .
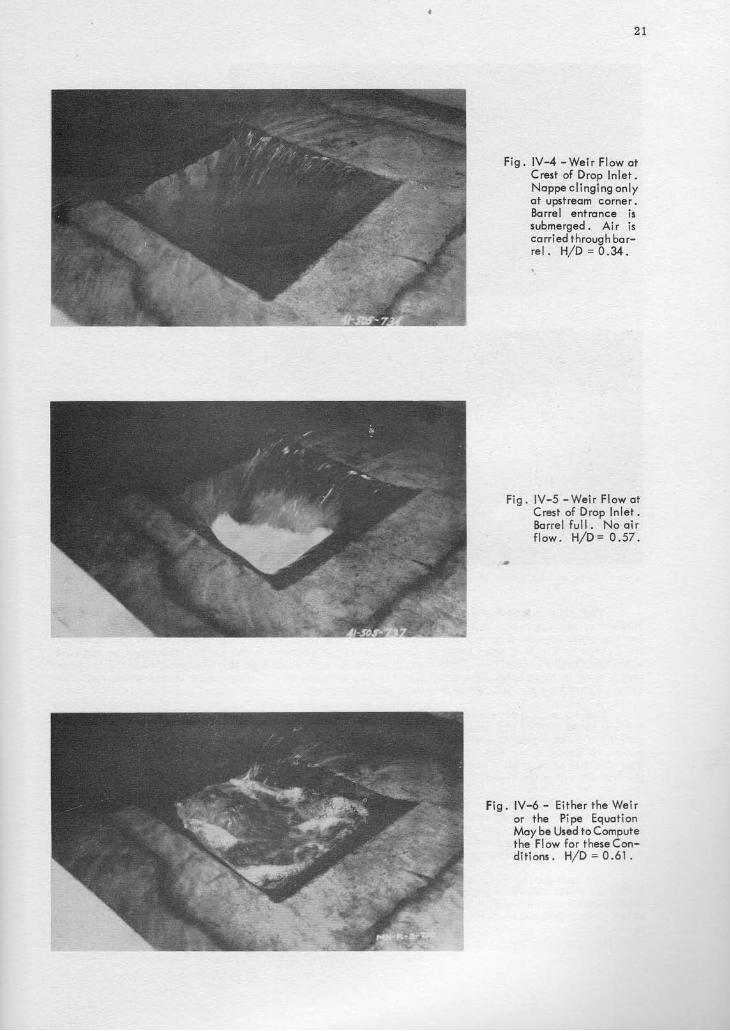
2 t
Fig. lV-4 -Weir F low otCrest of Drop lnlet.Noppe c l ing lng onlyot upctreom corner.Borrel enfronce issubmerged. A,ir iscorried through bor-re l . H /D =0 .34 .
Fig. lV-5 -Weir F low otCrest of Drop In let .Borre l fu l l . No o i rf low. H/D = 0.57 .
F ig. lV-6 - Ei ther the Weiror the Pipe EquoiionMoy be Used fo Computethe Flow for theseCon-ditions . H/D = 0.51 .
21
Fig. IV-4 - Weir Flow at Crest of Drop Inlet. Nappe clinging only at upstream corner. Barrel entrance is submerged. Ai r is carried through barrel. HID = 0.34.
'.
Fig. IV-5 - Weir Flow at Crest of Drop Inlet. Barrel full. No ai r flow. HID = 0.57.
Fig. IV-6 - Either the Weir or the Pipe Equation May be Used to Compute the Flow for these Conditions . HID = 0.61 .
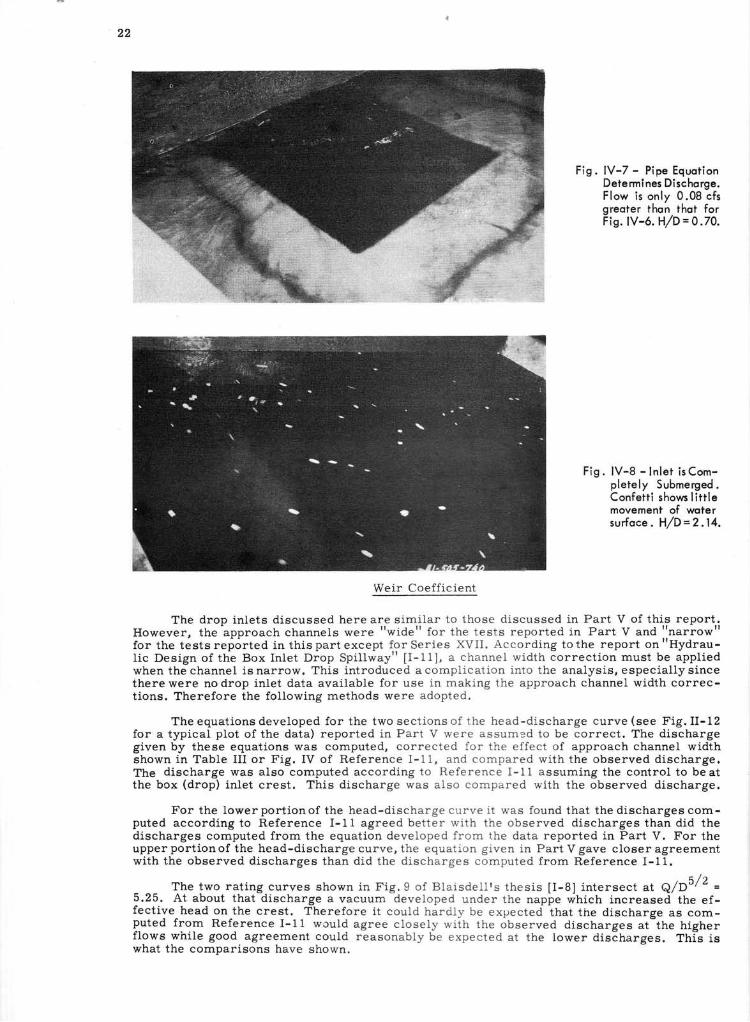
22
Fig. lV-7 - Pipe Equot ionDetermines Dischorge.Flow is only 0.08 cfsgreoter thon_ thot forFig. lV-6. H/D = 0 .70.
! ilri: !:
F ig . lV -8 - l n l e t i sCom-plete ly Submerged.Confetti shows litt lemovement of wqiersur foce . H/D=2.14,
Weir Coeff icienl
The drop inlets discussed here are similar to those discussed in Part V of thi.s report^.However , the approach channe ls were t tw ide t ' fo r the tes ts repor ted in Par t V and "nar rowt t
for the tests reported in this part except for Series XVII. According to the report on "Hydrau-
l i c Des ign o f the Box In le t Drop Sp i l lway" 1 I -111, a channe l w id th cor rec t ion must be app l iedwhen the channel isnarrow. This introduced acompli .cat ion into the analysis, especial lysincethere were no drop inlet data avai lable for use in making the approach channel width coruec-t ions. Therefore the fol lowing methods were adopted.
The equations developed for the two sections of the head-discharge curve (see Fig. I I-12for a typical plot of the data) reported i .n Part V were assumed to be correct. The dischargegiven by these equations was computed, corrected for the effect of approach channel widthshown in Tab le I I I o r F ig . IV o f Reference I -11 , and compared w i th the observed d ischarge.The discharge was also computed according to Reference I-11 assuming the control to beatthe box (drop) inlet crest. This discharge was also compared wlth the observed discharge.
For the lowerport ionof the head-discharge curve j . t was found that the discharges com-puted accord ing to Reference I -11 agreed be t te r w i th the observed d ischarges than d id thedischarges computed from the equation developed from the data reported in Part V. For theupper port ionof the head-discharge curve, the equation given in Part V gave clo6er agreementw i th the observed d iseharges than d id the d ischarges computed f rom Reference I -11 .
The two ra t ing curves shown in F ig .9 o f B la isde I I rs thes is I I -B ] in te rsec t a t Q/D1/2 =5.25. At about that-discharge a vacuum*developed under the nappe #tr lctt increased the ef-fect ive head on the crest. Therefore i t could hardly be expected that the discharge as com-puted f rom Reference I -11 wcu ld agree c lose ly w i th the observed d ischarges a t the h igherf lows while good agreement could reasonably be expected at the lower disiharges. This iswhat the comparisons have shown.
22
Weir Coefficient
Fig . IV-7 - Pipe Equation Determines Discharge. Flow is only 0.08 cfs greater than that for Fig.IV-6. H/D=0.70.
Fig. IV-8 -Inlet isCompletely Submerged. Confetti shows little movement of water surface. H/D = 2 . 14.
The drop inlets discussed here are s imilar to those discussed in Part V of this report. However, the approach channels were "wide" for the tests reported in Part V and "narrow" for the tests reported in this part except for Series XVII. According to the report on "Hydraulic Design of the Box Inlet Drop Spillway" [1-11]. a channel width correction must be applied when the channel is narrow. This int r oduc ed a complication into the analysis. especially since there were no drop inlet data available fo r use in making the approac h channel width corrections. Therefore the following methods were adopted .
The equations developed for the t wo sections of the head-discharge curve (see Fig. II-12 for a typical plot of the data) reported in Part V were assumed to be co rrect. The discharge given by these equations was compute d. corrected for the effect o f approach channel width shown in Table III or Fig . IV of Refe r e nce 1-11. and compared wit h t he observed discharge. The discharge was also computed ac cording to Reference 1-11 assuming the control to be at the box (drop) inlet crest. Thi s discharge was also compared with t he observed discharge.
For the lower portion of the head-discharge curve it was fou nd that the discharges computed according to Reference 1- 1 1 a greed better with the observed discharges than did the discharges computed from the equatio n developed from the data r eported in Part V. For the upper portion of the head-di schar ge curve, the equation given in Part V gave closer agreement with the observed discharges than did the discharges computed from Reference 1-11.
The two rating curves shown in Fig. 9 of Blaisdell's thesis [1- 8] intersect at Q/D5/ 2 = 5.25 . At about that discharge a vacuum developed under the nappe which increased the effective head on the crest . There fore it could hardly be expected that the discharge as computed from Reference 1-11 would agree closely with the observed disc harges at the higher flows while good agreement could reasonably be expected at the lower discharges. This is what the comparisons have sho wn.
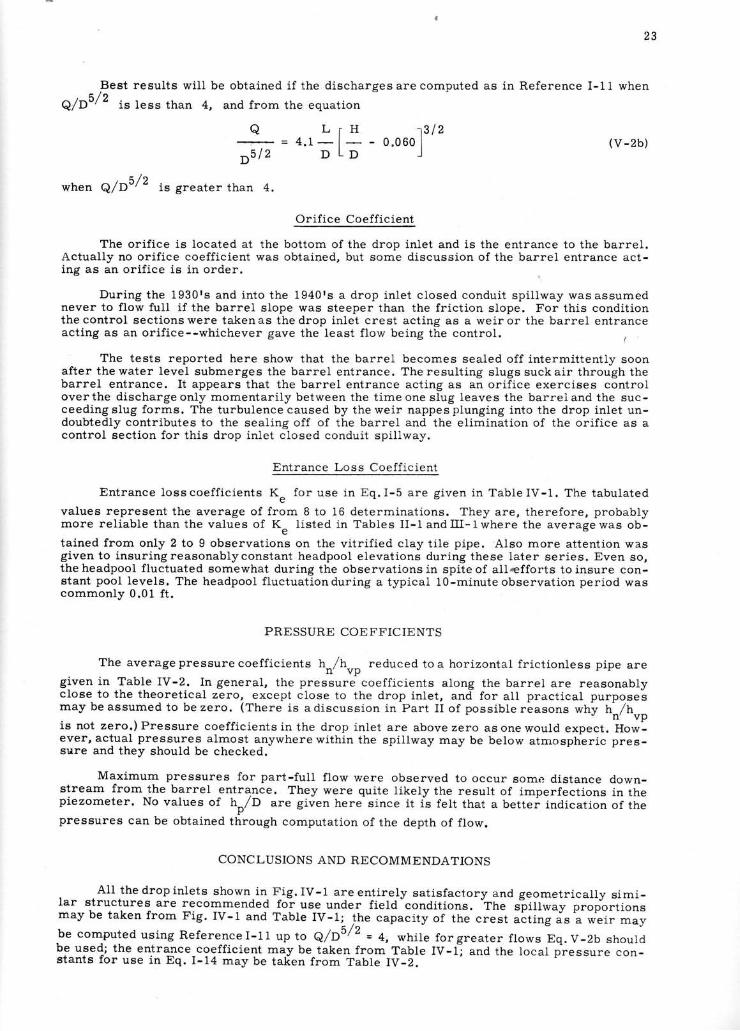
2 3
Best resul ts wi l l be obta ined i f the d ischargesarecomputed as in Reference I -11when. a /.,
Q/D"' ' is less than 4, and from the equation
a L r H f i 1 2- = 4 . r - l - - 0 . 0 6 0 I ( v - 2 b )D 5 l 2 D L D - l
, E a / t
when Q/D" / "
i s g rea ter than 4 .
Or i f i ce Coef f i c ien t
The ori f ice is located at the bottom of the drop inlet and is the entrance to the barrel.Actual ly no ori f ice coeff i .cient was obtained, but some discussion of the barrel entrance act-ing as an ori f ice is in order.
Dur ing the 1930ts and in to the 1940rs a d rop in le t c losed condu i t sp i l lway wasassumednever to f low ful l i f the barrel slope was steeper than the fr ict ion slope. For this condit ionthecont ro l sec t ionswere takenas thedrop in le t c res t ac t ing as a we i ro r the bar re l en t ranceacting as an ori f ice--whichever gave the least f low being the control. I
The tests reported here show that the barrel becomes sealed off intermittently soonafter thewater level submerges the barrel entrance. Theresult ing slugssuckair through thebarrel entrance. I t appears that the barrel entrance acting as an ori f ice exercises controlover the d ischargeon ly momentar i l y be tween the t imeone s lug leaves the bar re iand the suc-ceedingslug forms. The turbulencecaused by theweir nappesplunging into the drop inlet un-doubtedly contr ibutes to the seal ing off of the barrel and the el imination of the ori f ice as acontrol section for this drop inlet closed conduit spi l lway.
Entrance Loss Coeff icient
Ent rance losscoef f i c ien ts K" fo r use in Eq. I -5 a re g iven in Tab le IV-1 . The tabu la ted
values represent the average of from B to 16 determinations. They are, therefore, probablymore re l iab le than the va lues o f Ke l i s ted in Tab les I I -1 and l l [ - lwhere the averagewas ob-
tained from only 2 to 9 observations on the vitr i f ied clay t i le pipe. Also more attention wasgiven to insuringreasonablyconstant headpool elevations during these later series. Even so,the headpool f luctuated somewhat during the observations in spite of alkfforts to insure con-6tant pool levels. The headpool f luctuationduring a typical 10-minuteobservation period wascommonly 0 .01 f t .
PRESSURE COEFFICIENTS
The average pressure coeff icients hn/huo reduced to a horizontal fr iet ionless pipe are
given in Table IV-2. In general, the pressure coeff icients along the barrel are reasonablyclose to the theoretical zero, except close to the drop inlet, and for al l practical purposelmay be assumed to be zero. (There is adiscussion in Part I I of possi.ble reasons wfry n /nrr 'i s no t zero . ) Pressure coef f i c ien ts in the drop in le t a re abovezero asonewou ld expec t . How-ever,actual pressures almost anywherewithin the spi l lway may be below atmospheric pres-sure and they should be checked.
Maximum pressures for part ' ful l f low were observed to occur somtr distance down-stream from the barrel entrance. They were quite l ikely the result of imperfections in thepiezometer. No values of ho/D are given here since i t is felt that a better indication of thepressures can be obtained through computation of the depth of f low.
CONCLUSIONS AND RECOMMENDATIONS
- AII the drop inlets shown.in Fig. IV-1 are entirely satisfactory and geometrical ly simi-Iar struetures are recommended foi use under f ield-condit ions. t fre slpit t*ay proport ionsm a y b e t a k e n f r o m F i g . I V - 1 a n d T a b l e I V - 1 ; t h e c a p a c i t y o f t h e " r " s t . i i i " g ; " ; w e i r m a ybe computed us ing Reference l -11 up to q /95 /2 = 4 , wh i le fo rgrea ter fLows Eq.V-2b shou ldbe used; the entrance-coeff icient mqy be taken from Table IV-I and the local pressur€ con-stants for use in Eq. I-14 may be tal ien from Table IV-Z.
.. 23
Best results will be obtained if the discharges are computed as in Reference 1-11 when
Q/ D5/ 2 is less than 4, and from the equation
Q L [ H J 3/2 D
5/
2 = 4.1;- ;- - 0.060 (V -2b)
when Q / D5/ 2 is greater than 4.
Orifice Coefficient
The orifice is located at the bottom of the drop inlet and is the entrance to the barrel. Actually no orifice coefficient was obtained, but some discussion of the barrel entrance acting as an orifice is in order.
During the 1930's and into the 1940's a drop inlet closed conduit spillway was assumed never to flow full if the barrel slope was steeper than the friction slope. For this condition the control sections were taken as the drop inlet crest acting as a weir or the barrel entrance acting as an orifice--whichever gave the least flow being the control.
The tests reported here show that the barrel becomes sealed off intermittently soon after the water level submerges the barrel entrance. The resulting slugs suck air through the barrel entrance. It appears that the barrel entrance acting as an orifice exercises control overthe discharge only momentarily between the time one slug leaves the barrel and the succeeding slug forms. The turbulence caused by the weir nappes plunging into the drop inlet undoubtedly contributes to the sealing off of the barrel and the elimination of the orifice as a control section for this drop inle t clo sed conduit spillway .
Entrance Loss Coeffic ient
Entrance loss coefficients K for use in Eq. 1-5 are given in Table IV -1. The tabulated e values represent the average of from 8 to 16 determinations. They are, therefore, probably more reliable than the values of K listed in Tables II-I and 1II-1 where the average was ob-
e tained from only 2 to 9 observations on the vitrified clay tile pipe. Also more attention was given to insuring reasonably constant headpool elevations during these later series. Even so, the headpool fluctuated somewhat during the observations in spite of all .oefforts to insure constant pool levels. The headpool fluctuation during a typical 10-minute observation period was commonly 0.01 ft.
PRESSURE COEFFICIENTS
The average pressure coefficients h / h reduced to a horizontal frictionless pipe are n vp
given in Table IV -2. In general, the pressure coefficients along the barrel are reasonably close to the theoretical zero, except close to the drop inlet, and for all practical purposes may be assumed to be zero. (There is a discussion in Part II of possible reasons why h / h
n vp is not zero.) Pressure coefficients in the drop inlet are above zero as one would expect. However, actual pressures almost anywhere within the spillway may be below atmospheric presSlire and they should be checked.
Maximum pressures for part-full flow were observed to occur somt~ distance downstream from the barrel entrance. They were quite likely the result of imperfections in the piezometer. No values of hp/ D are given here since it is felt that a better indication of the
pressures can be obtained through computation of the depth of flow.
CONCLUSIONS AND RECOMMENDATIONS
All the drop inlets shown in Fig. IV -1 are entirely satisfactory and geometrically si m i lar structures are recommended for use under field conditions. The spillway proportions may be taken from Fig. IV-l and Table IV-I; the capacity of the crest acting as a we i r may
be computed using Reference 1-11 up to Q/ D5/ 2 = 4, while for greater flows Eq . V -2b should be used; the entrance coefficient may be taken from Table IV-I; and the local pressure c on stants for use in Eq. 1-14 may be taken from Table IV-2.
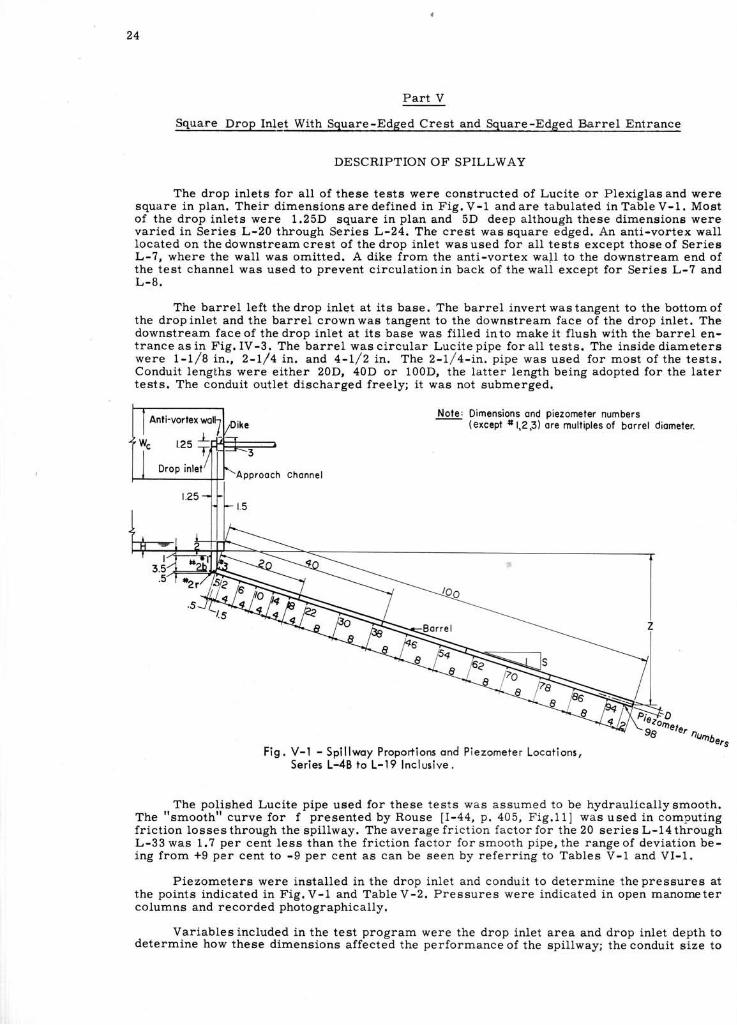
24
Part V
Square Drop Inlgt With Square-Edged Crest and Square-Edged Barrel Entrance
DESCRIPTION OF SPILLWAY
The drop inlets for all. of these tests were constructed of Lucite or Plexiglas and weresquare in p lan. Their d imensionsaredef ined in F ig.V- l andare tabulated i .nTableV- l . Mostof the drop inlets were 1.25D square in plan and 5D deep although these dimensions werevaried in Series L-20 through Series L-24. The crest was square edged. An anti-vortex wallIocated on the downstream crest of the drop inlet was used for all tests except those of SerieeL'7, where the rvall was omitted. A dike from the anti-vortex wafl to the downstream end ofthe test channel was usedto prevent c i rcu lat ioninback of thewal l except for Ser ies L-7 andL - 8 .
The barrel left thedrop inlet at its base. The barrel invertwastangent to the bottomofthe dropinlet and the barrel crownwaa tangent to the downstream face of the drop inlet. Thedownstream faceof thedrop inlet at its base was fi l led into makeit f lush with the barel en-trance as in Fig. IV-3. The barrel was circuLar Lucite pipe for all tests. The inside diameterswere 1-1/8 in . , 2-L/4 in . and 4- l /2 in . The 2-L/4- in. p ipe was used for most of the tests.Conduit lenglhs were either 20D, 40D or 100D, the latter length being adopted for the latertests. The conduit outlet diseharged freely; it was not submerged.
Note: Dimensions ond piezometer numbers(excepl * 1,2.3) ore rnult iples of borrel diomeler
chonnel
Fig. V-l - Spi l lwoy Proport ions ond Piezometer Locotions,Ser ies L -48 io L -19 lnc lus ive .
The polished Lucite pipe used for these tests was assumed to be hydraulicallysmooth.The t 'smooih" curve for f presented by Rouse l I -44, p.405, F ig. l11 wai used in comput ingfriction losses through the spil lway. The average friction factor for the 20 series L-14 throughL-33was 1.? per cent less than the f r ic t ion factor forsmooth p ipe, the rangeof deviat ion be-ing from +9 per cent to -9 per cent as can be seen by referring to Tables V-l and VI-l.
Piezometers were installed in the drop inlet and conduit to determine thepressures atthe points indicated in F ig.V-1 and TableV-2. Pressures were indicated in open manornetercolumns and recorded photographically.
Variables included in the test program were the drop inlet area and drop inlet depth todetermine how these dimensions affected the performance of the spil lway; the conduit size to
24
Part V
Square Drop Inl~t With Square-Edged Crest and Square-Edged Barrel Entrance
DESCRIPTION OF SPILLWAY
The drop inlets for all of these tests were constructed of Lucite or Plexiglas and were square in plan. Their dimensions are defined in Fig. V -1 and are tabulated in Table V -1. Most of the drop inlets were 1.25D square in plan and 5D deep although these dimensions were varied in Series L-20 through Series L-24. The crest was square edged. An anti-vortex wall located on the downstream crest of the drop inlet was used for all tests except those of Series L-7, where the wall was omitted. A dike from the anti-vortex wall to the downstream end of the test channel was used to prevent circulation in back of the wali except for Series L-7 and L-8.
The barrel left the drop inlet at its base. The barrel invert was tangent to the bottom of the drop inlet and the barrel crown was tangent to the downstream face of the drop inlet. The downstream face of the drop inlet at its base was filled in to make it flush with the barrel entrance as in Fig. IV -3. The barrel was circular Lucite pipe for all tests. The inside diameters were 1-1/8 in., 2-1/4 in. and 4-1/2 in. The 2-1/4-in. pipe was used for most of the tests. Conduit lengths were either 20D, 40D or 100D, the latter length being adopted for the later tests. The conduit outlet discharged freely; it was not submerged.
Note: Dimensions and piezometer numbers Dike (except # 1,2,3) are multiples of barrel diameter.
3
Approach Channel
rrlS
Fig. V-l - Spillway Proportions and Piezometer Locations, Series L-4B to L-19 Inclusive.
z
The polished Lucite pipe used for these tests was assumed to be hydraulically smooth. The "smooth" curve for f presented by Rouse [1-44, p. 405, Fig.ll] was used in computing friction losses through the spillway. The average friction factor for the 20 series L-14 through L-33 was 1.7 per cent less than the friction factor for smooth pipe, the range of deviation being from +9 per cent to -9 per cent as can be seen by referring to Tables V -1 and VI-1.
Piezometers were installed in the drop inlet and conduit to determine the pressures at the points indicated in Fig. V-l and Table V-2. Pressures were indicated in open manometer columns and recorded photographically.
Variables included in the test program were the drop inlet area and drop inlet depth to determine how these dimensions affected the performance of the spillway; the conduit size to
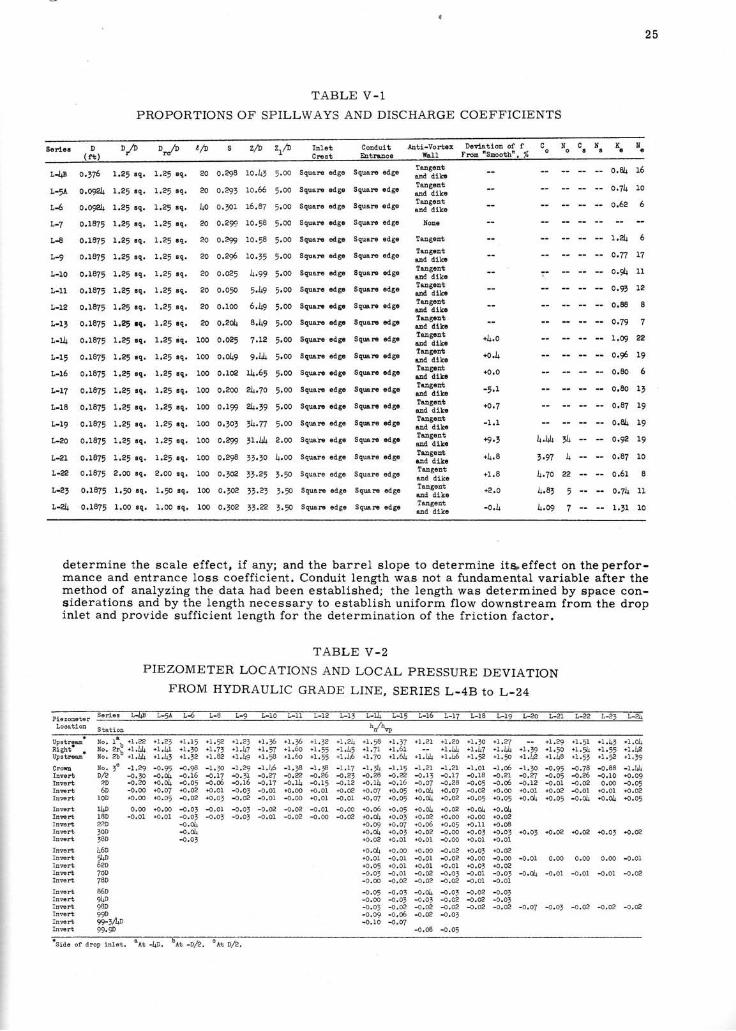
2 5
TABLE V. l
PROPORTIONS OF SPILLWAYS AND DISCHARGE COEFFICIENTS
S6r,l.ar , l. Dlh Drf l/b S Z/b Zrh I!16t Conduit Anti-Vorlor D€Ylatiob of f C- l{ C N ( N
( f t ) - . - " - / " e p l e ' 1 , "
c F s t h t r o c a n . r l - - 4
L-tir 0.176 I.25 tq. L25 .q, 20 0.298 10.4, 5.oo squaft edg€ squaF sds€ ffl"tt
L-lL o.W4 ]2, !q. 1.25 !q. 29 o'zgt Lo'66 5'oo square .dge squaF cdgc fft"i;
L4 o.o*)+ r.25.q. 1.25 !q. l+0 o.tol !6,87 5.oo squaro odte squarc eds€ ]trTftl
L-7 0,:-875 1,25 !q. 1.29 !q. 20 o,29 10.58 5.00 square edgo squaF €dge lloEe
L-8 O.I875 1.25 !q. 1,25 !q. 20 O.ry 10'58 5'00 SquaF odge Squate edge Tagest
L-g o,r87, I,2, rq. 1.25 sq. 20 0,296 1o'r, 5.oO Square edge gquare €dge ffTit
L-lo o,L87, t,25 !q. 1.25 rq, 29 0.025 L,gg 5.oo squarc edsc squaF cdgo ltr-a"ill
L-11 o,LB7, 1,25 !q. 1.25 !q. 20 o.o5o 5.1$ ,.oo square odss squarc edse lfTi*
L-Lz 0.L875 1,2, !q, 1.25 Bq. 20 o.loo 6,119 ,.Oo squaF cdgr sgwre edgc HTi*t
L-lt 9,1875 L,zr.q. 1.25 !q. 20 O.2ol+ 8.1+9 5.00 sguBF .ds. SErEF cds€ tr'at*
r-r[ 0.18?5 1.25 .q, ),,25 !q. lOO 0,025 7.X2 5,OO Squar ed8c squE odsc ffTiat
l-15 o.LI?, 1,25 cq, f,Zj sq. 1oo o.o,l+9 g,1l+ 5,oo sqsr 6dg. sqEr edgo 3il"ttt
L-r6 0.187, t,25 !q. I.25 sq. loo o.loA rl+.59 5.oo sqsF cdgc sqEs .dgc trtatfl
L-Ll 0,1875 I,2, sq. r.25 .q. 1oo 0.200 4,?o 5,oo squaF 6d8c sqEr. od8€ IITTA
r-18 0,7875 r,25 r7. t.29 rq. 1oo 0.199 d:,rg 5,oo squrF cdgc sqEF cdgr fftatt1:L-19 0.1875 r,2, !q. 1.25 !q. 1oo o.ro, ,),77 ,,oo squre .dto squr€ sdsc JrTt"iJ"
L-20 0.1S75 1,25 Bq. 1.25 !q. 1oo 0.29 ,r./rl+ 2,oo sqar edse squF cdga trX"tt
L-et 0,L875 l.zt sq' 1.25 rq' 1oo 0.298 lt,ro \.oo squato €dgc squar€ odge fft;*"L-Q 0.1875 2,OO !q. 2.OO sq, 100 O.rO2 ,r.2, 1.rO Square edg. Squar€ sdgc ]trT#"L-e, 0.1875 1,50 !q. 1.50 !q. 1oo o.roA 1r,2, t,m squaF cds6 sqsF odgr fft1";t-24 0.1875 1.00 sq. 1.oo rq, 1oo o.ro2 ,r.22 ,,n squaF .d!i€ squF .dgr ffTff.
r!.0
+0.1+
+0,0
- 2 . L
+o,7
- t . l
+9, '
+,1.8
+ 1 . 8
+2.0
-0 . !
determine the scale effect, if any; and the barrel slope to determine it*effect on theperfor-mance and entrance loss coefficient. Conduit length was not a fundamental variable after themethod of analyzing the data had been established; the length was determined by apace con-siderations and by the length necessary to establish uniform flow downstream from the dropj.nlet and provide sufficient length for the determination of the friction factor.
TABLE V.2PIEZOMETER LOCATIONS AND LOCAL PRESSURE DEVIATION
FROM HYDRAULIC GRADE LINE, SERIES L_48 to L_24
Locatio! stetion holhop
Upstrgm r". t J**rzt -Risht ' . No.2r; +1,1+l+ +1.4I +1,r0 +r.7t +I) t +I .n +r.60 +L55 +\,1$ +1,71 +L61 -: +1. l r l+ +1,117 +t)A +!,19 +1.50 +1,5! +r.55 +I,r2Upstrou- i lo. 2t" +1, l r l r +Ll+1 +r,r2 +1.82 +1.119 +1.58 +1.60 +r,55 +1.)!6 +I.7o +r.6la +1.1r! +1.!6 +r,52 +1.5o +1.12 +1,48 +1.5t +I.52 +r, t9
crm No, ra - ! ,29 -0.95 -0.9s 4., to -r ,29 -1.!6 -1.r8 -r ,F -LI7 -r3,+ -L.ry -1.21 -1.2r. -1.or -1,06 -r , to -o.95 -o.78 -o.88 -r , l r !rDr€rt D/2 -o,ro -o.ol+ -0.r5 -0.17 -o.1r -o.27 -o.2 -0.26 -o,21 4.2a -o.n -a.rt -0.r7 -o.18 -o.21 -o.4 -0.05 -0.26 -o.lo +o.o9In@rt 2D 4.20 {.ol+ -o.05 4.06 -o.15 -0.}7 -o, l l r -o,15 -0.I2 -o,U -0.76 -a,07 -0,28 -0.05 -0.05 {.r2 -o.ol -0,o2 o,m -0.05InErt 6D -0,00 +0.07 +0.02 +0,01 -o.0, -0,0I +0.00 €.ol +0.o2 +o.o7 {.05 +0.01+ +0.07 -0.02 +0.00 +O,01 +o.02 -o.o1 {.01 +0.o2Inwrt lOD +0.0O +O.05 -0.02 +0.o, -0.o2 -o,ol -o,oo +0,o1 -0,01 +O.07 +0.05 +O,ol+ +o.02 +o.05 +0.05 +O,ol+ +0.05 -o,oL +o,o/r +0.05
I!v6.t i lp o.oo +o,oo -0.0, -0.o1 -o.ol -0,02 -o,02 -0,o1 -o.oo +0.06 +o,ot +o.olr +o,02 +o.ol+ +o.ctIn@rt r8D -o,01 +o,o1 -o.ot -o,ot -0.0, -o.01 -o.02 -o.oo -0.o2 {.oi+ +0.0, +0.o2 {,oo { .oo +0.o2Inre* 22-D -o.Ol+ { .09 +0.o7 +0.06 +0.o5 +0,1I { .o8InGft tAD -O,O.lr +O.Ol+ +0.0, { .OA -o.oo +O,0, +0.o, +0.0,In@* ,8D -0.o1 +0.02 +o.01 +0.01 -0.oo +0.o1 +0.01
rnveft 4ouIn@t ,JD
In€!'t 1ODlnwrt 78D
lnreft 86DIlmrt 91rtIn@rt 98D1nv6rt 99DI!@ft 99-tAtIn@rt 99.9
{.o2 +0.o2 {.ol +0.02
0.o0 0,oo 0.00 -0.01
-0.01 -0.01 -0.01 -o.02
+o.0. l r { .00 +0.00 -o.02 {.0, +0.02+o.0I -0.o1 -o.o1 -o,o2 {.oo -0.00 -o.ol+0,05 +0.0I +O.01 +0.01 +0,0, +0.02-o.0, -0,o1 -o,o2 -o.o1 -o.or -0.o, -o,ol+-0.00 -0,o2 -0.02 -0.02 -0,01 -0,01
-o.o5 -0.01 -o.ol . -0.0, { ,02 -0.o,-o,oo -0,o1 -a.ot -a,oz -o.e -o.ot-o.0J -0.02 -o.o2 -0.o2 -0.02 -o,02 -0.07 -0.0, -0.02 -o.o2 -0.02-o.09 -0,06 -o.@ -o.ot-0,10 {.07
-0.03 -0,o5
25
TABLE V-l
PROPORTIONS OF SPILLWAYS AND DISCHARGE COEFFICIENTS
Series D (rt)
D,/D z/D Inlet Crest
Conduit Entranoe
L-4B 0.376 1.25 sq. 1.25 sq. 20 0.2<)8 10.43 5.00 Square edge Square edge
L-5A 0.0924 1.25 sq. 1.25 sq. 20 0.293 10.66 5.00 Square edge Square edge
1-6 0.0924 1.25 sq. 1.25 sq. 40 0.301 16.87 5.00 Square edge Square edge
1-7
1-8
L-9
0.1875 1.25 sq. 1.25 sq. 20 0.299 10.58 5.00 Square edge Square edge
0.1875 1.25 sq. 1.25 sq. 20 0.299 10.58 5.00 Square edge Square edge
0.1875 1.25 sq. 1.25 sq. 20 0 .296 10.35 5.00 Square edge Square edge
1-10 0.1875 1.25 sq. 1.25 sq. 20 0.025 4.99 5.00 Square edge Square edge
1-11 0.1875 1.25 sq. 1.25 sq. 20 0.050 5.49 5.00 Square edge Square edge
1-12 0.1875 1.25 sq. 1.25 sq. 20 0.100 6.49 5.00 Square edge Square edge
L-13 0.1875 1.25 "'1. 1.25 1'1. 20 0.204 8.49 5.00 Square edge Square edge
1-llI 0.1875 1.251'1. 1.25 sq. 100 0.025 7.12 5.00 Square edge Squa"" edge
1-15 0.1875 1.25 "'1. 1.25 sq. 100 0.049 9.44 5.00 Square edge Square edge
L-16 0.1875 1.25 sq. 1.25 sq. 100 0.102 14.65 5.00 Square edge Square edge
1-17 0.1875 1.25 sq. 1.25 sq. 100 0.200 24.70 5.00 Square edge Square edge
L-18 0.1875 1.25 sq. 1.25 sq. 100 0.199 24.39 5.00 Square edge Square edge
1-19 0.1875 1.25 sq. 1.251'1. 100 0.303 34.77 5.00 Square edge Square edge
1-20 0.1875 1.25 sq. 1.25 sq. 100 0.299 31.44 2.00 Square edge Square edge
L-21 0.1875 1.25 sq. 1.25 1'1. 100 0.298 33.30 4.00 Square edge Square edge
L-22 0.1875 2.00 sq. 2.00 sq. 100 0.302 33.25 3.50 Square edge Square edge
L-23 0.1875 1.,0 0'1. 1.50 sq. 100 0.302 33.23 3.50 Square edge Square edge
L-24 0.1875 1.00 sq. 1.00 0'1. 100 0.302 33.22 3.50 Square edge Square edge
Anti-Vortex Devia tion of f Wall From "Smooth". %
Tangent and dike Tangent and dike Tangent and dike
None
Tangent
Tangent and dike Tangent and dike Tangent end dike Tangent and dike Tangent and dike Tangent and dike Tangent and dike Tangent end dike Tangent and dike Tangent and dike Tangent and dike Tangent end dike Tangent and dike Tangent I!lnd dike Tangent and dike Tangent and dike
+4.0
+0.4
+0.0
-1.1
+4.8
+1.8
+2.0
-0.4
c o
N C N o • •
4.44 34
3.97 4
4.70 22
4.83
4.09 7
K e
N e
0.84 16
0.74 10
0.62 6
1.24 6
0.77 17
0.94 11
0.93 12
0.88 8
0·79 7
1.09 22
0.96 19
0.80 6
0.80 13
0.87 19
0.84 19
0.92 19
0.87 10
0.61
0.74 11
1.31 10
determine the scale effect, if any; and the barrel slope to determine itEio effect on the performance and entrance loss coefficient. Conduit length was not a fundamental variable after the method of analyzing the data had been established; the length was determined by space considerations and by the length necessary to establish uniform flow downstream from the drop inlet and provide sufficient length for the determination of the friction factor.
Piezometer Location .
Upstr~am
Right • Upstream
Crown Invert Invert Invert Invert
Invert Invert Invert Invert Invert
Invert Invert Invert Invert Invert
Invert Invert Invert Invert Invert Invert
TABLE V-2
PIEZOMETER LOCATIONS AND LOCAL PRESSURE DEVIATION
FROM HYDRAULIC GRADE LINE, SERIES L-4B to L-24
Series L4 Station
No. 1\ +1.22
~~: ~~b :i:tt No. 3c -1.29 0/2 -0.30 20 -0.20 60 -0.00
100 +0.00
l4D 0.00 HID -0.01 22D 30D 380
46D 54D 62D 700 780
860 94D 9BO 990 99-3fi,D 99.90
L-SA
+1.23 +1.41 +1.43
-0.95 -0.04 +0.04 +0.07 +0.05
+0.00 +0.01
LOO6
+1.15 +1 .30 +1.32
-0.98 -0.16 -0 .05 +0.02 -0.02
-0.03 -0.03 -0.04 -0.04 -0.03
L-8 L-9 L-10 L-11 L-12 L- 13 L -14 L-15
+1.52 +1.23 +1.36 +1.36 +1.32 +1.24 +1.58 +1.37 +1.73 +1.47 +1.57 +1.60 +1.55 +1.45 +1.71 +1.61 +1.82 +1.49 +1. 58 +1.60 +1.55 +1.46 +1.70 +1.64
-1.30 -1.29 -1.46 -1.38 -1.38 -1.17 -1.34 -1.15 -0.17 "0.31 -0.27 -0.22 -0.26 -0.23 -0.28 -0.22 -0.06 -0.16 -0.17 -0.14 -0.15 -0.12 -0.14 -0.16 ~.01 - 0.03 ~.01 ~.OO ~.01 ~.02 +0.07 ~.05
+0.03 ~.~ -0 .01 ~.OO ~.01 -0.00 ~.07 +0.05
-0.01 -0.03 -0.02 - 0.02 -0 .01 -0.00 +0.06 +0.05 -0.03 -0.03 -0.01 -0.02 -0.00 -0.02 +0.04 +0.03
+0.09 +0.07 +0.04 +0.03 +0.02 +0.01
+0.04 +0.00 +0 . 01 -0.01 ~.05 +0.01 -0.03 -0.01 -0.00 -0.02
-0.05 -0.03 -0.00 -0.03 -0.03 -0.02 -0.09 -0.06 -0.10 -0.07
L-16 L-17 L-18 L-19 L-20 L-21 L-22 L-23 L-24
+1.21 +1.20 +1.30 +1.27 +1.29 +1.51 +1.44 +1.47 +1.44 +1.39 +1.50 +1.54
+1.44 +1.46 +1.52 +1.50 +1.42 +1.48 +1.53
-1.21 -1.21 -1.01 -1.06 -1.30 -0.95 -0.78 -0.13 -0.17 -0.18 -0.21 -0.27 -0.05 -0.26 -0.07 -0.28 -0.05 -0.06 -0.12 -o.m -0.02 +0.04 +o.~ ~.02 +0.00 +0.01 +0.02 -0.01 +0.04 +0.02 +0.05 +0.05 +D.Q4 +0.05 -0.04
+0.04 ~.02 +0.04 +0.04 +O.~ +0.00 +0.00 +0.02 +0.06 +0.05 +O.ll +0.08 +0.02 -0.00 +0.03 +0.03 +0.03 +0.02 +0.02 +0.01 -0.00 +0.01 +0.01
+0.00 -0.02 ~.03 +O.~
+1.43 +1.04 +1.55 +1.42 +1.52 +1.39
-0.88 -1.1.,4 -0.10 +0.09 0.00 -0 . 05
+0.01 +0.02 +0.04 +0.05
+0.03 +0.02
-0.01 -0.02 +0.00 -0.00 -0.01 0.00 0.00 0.00 -0.01 +0.01 +0.01 +0.03 +0.02 -0.02 -0.03 -0.01 -0.03 -0.04 -0.01 -0.01 -0.01 -0.02 -0.02 -0.02 -0.00 -0.01
-~04 -0.03 -0.02 -o.~ -0.03 -0.02 -o.~ -0.03 -0.02 -0.02 -0.02 -0.02 -o.~ -0.03 -o.~ -0.02 -O .~ -0.02 -0.03
-0 .08 -0.05
·Side of drop inlet. a At -4D. bAt -0/2. OAt 0/2.
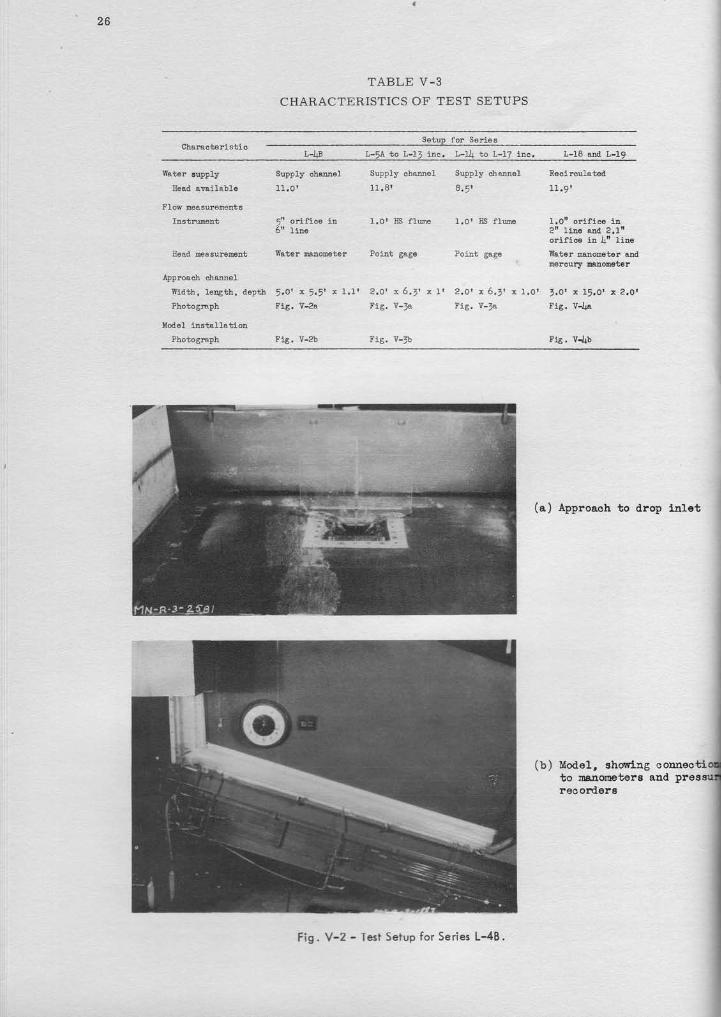
2 6
TABLE V-3
CHARACTERISTICS OF TEST SETUPS
Setup for SoriesCharacteri stlc
L-Ur L-5A to L-13 inc. L-1,1+ to L-17 i!s. l,-18 and L-19
Water supply
Head a@ilabfe
Flow measuronenta
InstMent
I{ead. me6sur€ment
Approaoh chenel
lYidth, lergth, depth
P h - + ^ d E h h
Mod€l installation
Ph^+^ r r rnh
Supply chaool
1 1 . 0 '
c r l ^ # f i ^ a i r
5" l ine
water mnoneter
5 . o t x 5 . 5 r x l . 1 r
Fig. T-2a
Flg. V-2b
Supply chamel
r r R t
1 . 0 r H S f l m e
2 . 0 , x 5 . J ' r 1 '
Fig. i I -Ja
Fig. v-rb
Supply chanel
R c l
1.Or i IS f1@e
Z . O t x 6 , j t x l . O l
Fi6. V-Ja
Recl roulated
1 1 . 9 '
l . O r r o r i f i c e i nc - l l n e a t c z . r -o r l r l c g 1 ! 4 - r 1 n 9'l[ater
nanon€ter and
nercury unometer
, . 0 r r l 5 . 0 r x 2 , O r
! rg, Y-4a
! rg . vq.lD
ii' ' :
(a) Approach to drop ialet
(b) Model, ehowlagto rnanornetergreoord6r€
connecaad
Fig . V-2 ' Test Setup for Series L-48.
26
Characteristic
Water supply
Head available
Flow measurements
Instrument
Head measurement
Approach channel
TABLE V-3
CHARACTERISTICS OF TEST SETUPS
L-4Jl
Supply channel
11.0'
sit orifioe in 6" line
Water manometer
Setup for Sarie s
L-5A to L-l3 inc. L-14 to L-17 inc.
Supply channel
11.8'
1.0' HS flume
Point gage
Supply ch annel
8.5'
1.0' HS flume
Point ga ge
L-18 and L-19
Reci reule. ted
1.0" orifice in 2" line and 2.1" orifice in 4" line
Water manometer and mercury manometer
Width, length, depth 5.0' x 5.5' x 1.1' 2.0'" 6. 3' xl ' 2. 0' x 6 . 3' x 1.0' 3.0' x 15.0' X 2.0'
Photograph Fig. V-2a Fig. V- 3a Fig. V- 3a Fig. V-4a
Model installation
Photograph Fig . V-2h Fig. V- 3b
Fig. V-2 - Test Setup for Series L-4B.
Fig . V-4b
(a) Approach to drop inlet
(b) Model. showing connectio to manometers and pressu recorders
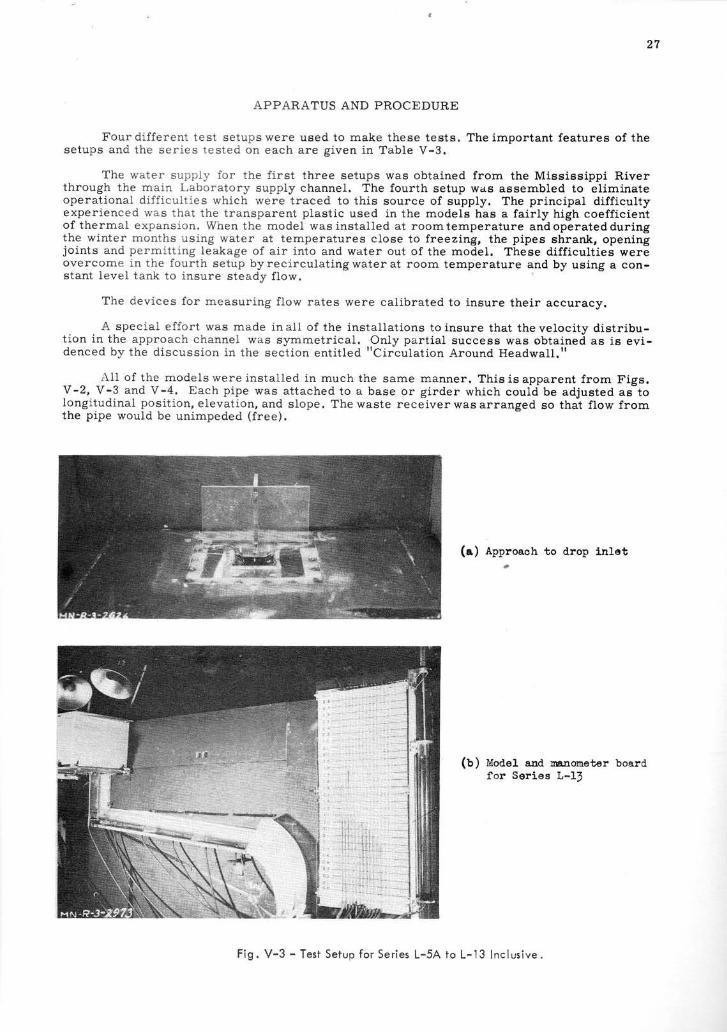
2 7
APPARATUS AND PROCEDURE
Fourd i f fe ren t tes t se tupswere used to make these tes ts . The impor tan t fea tures o f thesetups and the ser ies tes ted on each are g iven in Tab le V-3 .
The water supply for the f irst three setups was obtained from the Mississippi Riverthrough the main Laboratory supply channel. The fourth setup was assembled to el iminateoperational dif f icult ies whi.ch were traced to this source of supply. The principal dif f icultyexperienced was that the transparent plast ic used in the models has a fair ly high coeff iciento f thermal expans ion . When the mode l was ins ta l led a t roomtempera ture andopera teddur ingthe winter months using water at temperatures close to freezing, the pipes shrank, openingjoints and permitt ing Ieakage of air into and water out of the model. These dif f icult ies wereovercome i .n the four th se tup byrec i rcu la t ingwatera t room tempera ture and by us ing a con-stant level tank to insure steady f low.
The devices for measuring f low rates were cal ibrated to insure their accuracy.
A special effort was made in al l of the instal lat ions to insure that the velocity distr ibu-t ion in the approach channe l was symmet r ica l . OnIy par t ia l success was ob ta ined as is ev i -denced by the d iscuss ion in the sec t ion en t i t led "C i rcu la t ion Around Headwal l . t r
AII of the models were instal led in much the same manner. This is apparent from Figs.V-2 , V-3 and V-4 . Each p ipe was a t tached to a base or g i rder wh ich cou ld be ad jus ted aJ tolongi.tudinal posi. t i .on, elevation, and slope. The waste receiver was arranged so that f low fromthe pipe would be unimpeded (free).
(a) Approaoh to clrop inlet
(U) uoaet aad manometsrfor Series L-lJ
Fig. V-3 - Test Setuo for Ser ies L-5A to L- ' l3 Inc lus ive.
27
APPARATUS AND PROCEDURE
Four different test setups were used to make these test s . The important features of the s etups and the serie s te sted on each are given in Table V -3.
The water supply for the first three setups was obtained from the Mississippi River thr ou gh the main Laboratory supply channel. The fourth setup was assembled to eliminate ope rational difficu ltie s which were traced to this source of supply. The principal difficulty experienced was that the transparent plastic used in the models has a fairly high coefficient of thermal expansion. When the model was installed at room temperature and operated during the winter months using water at temperatures close to fr e e z ing, the pipes shrank, opening joints and permitting leakage of air into and water out of the model. These difficulties were overcome in the fourth setup by recirculating water at room temperature and by using a constant level tank to insure steady flow.
The devices for measuring flow rates were calibrated t o insure t heir accuracy.
A special effort was made in all of t he installations to insure that the velocity distribution in the approach channel was symmetrical. Only partial suc cess wa s obtained as is evidenced by the discussion in the section entitled "Circul ation Around Headwall."
All of the models were installed in much the same manner . This is apparent from Figs. V - 2, V -3 and V -4. Each pipe was attached to a b a se o r girder which could be adjusted as to longitudinal position, elevation, and slope. The waste rece iver wa s arranged so that flow from the pipe would be unimpeded (free).
(a) Approach to drop inlet
(b) Model and manometer board f or Series L- 13
Fig. V-3 - Test Setup for Series L-5A to L-13 Inc I usive .
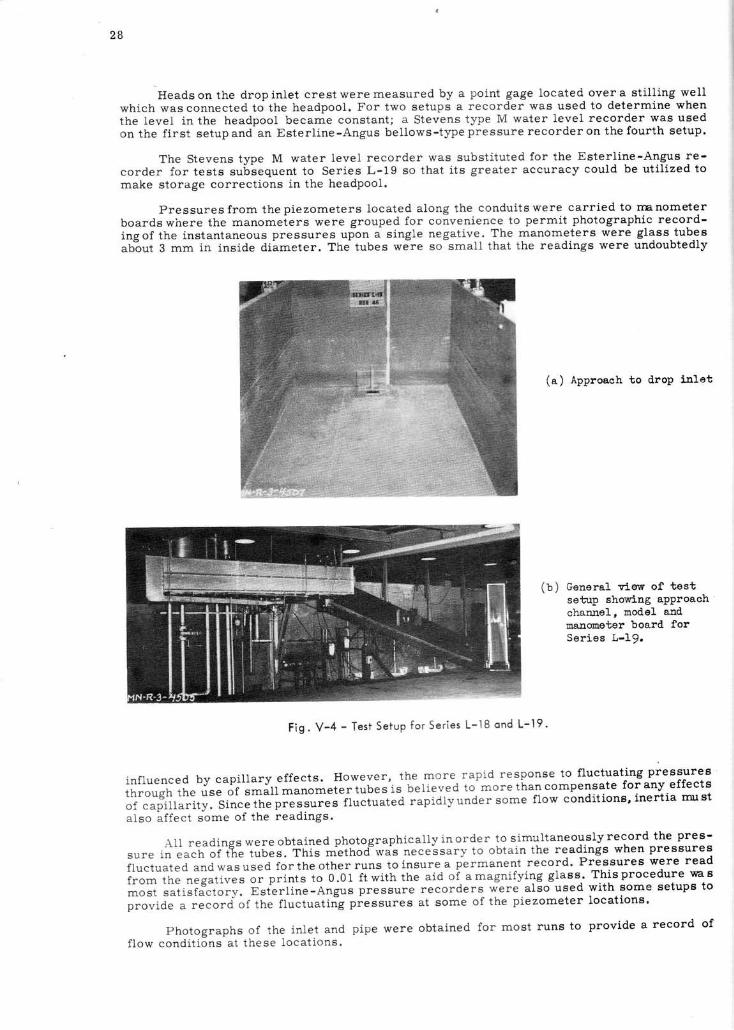
2 B
Heads on the drop inlet crest were measured by a point gage located over a st i l l ing well
wh ich was connected to the headpoo l . For two se tups a recorder was used to de ter rn ine when
the leve l in the headpoo l became cons tan t ; a S tevens type M water leve l recorder was used
on the f irst setup and an Esterl ine-Angus bel lows-type pressure recorder on the fourth setup.
The Stevens type M water level recorder was substi tuted for the Esterl ine-Angus re-
corder fo r tes ts sub iequent to Ser ies L '19 so tha t i t s g rea ter accuracy cou ld be u t i l i zed to
make storage corrections in the headpool.
Pressures f rom thep iezometers loca ted a long the condu i tswere car r ied to r r ranometer
boards where the manometers lvere grouped for convenience to permit photographic record-
ingof the instantaneous pressures upon a single negative-. The manometers were glass-tub-e8
ab"out 3 mm i.n 1nside di imeter. The tubes were so small that the readings were undoubtedly
(a) Approach to ilrop inlet
(b) Genoral wlslr of testsetup showing aPProachchannel, arodel andmanorneter boarcl forSerios L-19.
F i g . V - 4 - T e s t S e t u p f o r S e r i e s L - 1 8 o n d L - 1 9 '
inf luenced by capi l lary effects. However, the more. rapid response to f luctuating pressures
through the use " i "* ir i* i i .*" i"" i"ues is bel ieved to more than compensate for any effects
of capi l lar i ty. Since ihe p."".rr."" f luctualed rapidlyunder some f low condit ions' inert ia rurst
a lso a f fec t some o f the read ings .
AII readings were obtained photographical ly j ,n org:r- l : simultaneously record the pres-
srrre in eacrr of tTre t; ; ;" . f l i i ; *uirrod*"s nece-ssary to obtain the readings when pressures
f luc tua ted and was used fo r the o ther runs to insure a permanent record ' Pressures were read
f rom the negat rves ; ; ; ;1 ; ; i " o .o t t tw i th the a id o i amagn i fy ing g lass . ' Th isprocedure was
most sa t is fac to ry . Es ter l ine-Angus pressure recorders were a lso used w i th some se tups to
p"o , r ia " " . " "o"d"o f the f luc tua t ing pressures a t some o f the p iezometer loca t ionS '
Photographs of the inlet and pipe were obtained for most runs to provide a record of
f low cond i t ions a t these loca t ions .
28
Heads on the drop inlet crest were measured by a point gage located over a stilling well which was connected to the headpool. F or two setups a recorder was used to determine when the level in the headpool became constant; a Stevens type M water level recorder was used on the first setup and an Esterline-Angus bellows-type pressure recorde r on the fourth setup.
The Stevens type M water level recorder was substituted for the Esterline-Angus recorder for tests subsequent to Series L-19 so that its greater accuracy could be utilized to make storage corrections in the headpool.
Pressures from the piezometers located along the conduits were carried to rna nometer boards where the manometers were grouped for convenience to permit photographic recording of the instantaneous pressures upon a single negative. The manometers were glass tubes about 3 mm in inside diameter. The tubes were so small that the readings were undoubtedly
(a) Approach to drop inlet
(b ) General vi~ of test setup showing approach channel, model and manometer board for Series L-19.
Fig . V-4 - Test Setup for Series L-18 and L-19.
influenced by capillary effects. However , the more rapid response to fluctuating pressures through the use of small manometer tubes is believed to more t han compen~~te fo: any . effects of capillarity. Since the pr es sures fluctuated rapidly under s ome flow condltlons, mertla IIUl 8t also affect some of the readings.
A.ll readings were obtained photographically in order to simultaneou.sly record the pressure in each of the tube s . Thls method was necessary to obtam the readmgs when pressures fluctuated and was used for the other runs to insure a permanent record. Pressures were read from the negatives or prints to 0.01 ft with the aid of a magnifying glass . This procedure wa s most satisfactory . Esterline-Angus pressure recorders were also used with some setups to provide a record of the fluctuating pressures at some of the piezometer locations.
Photogr aphs of the inlet and pipe were obtained for most runs to provide a record of flow conditions at these locations.
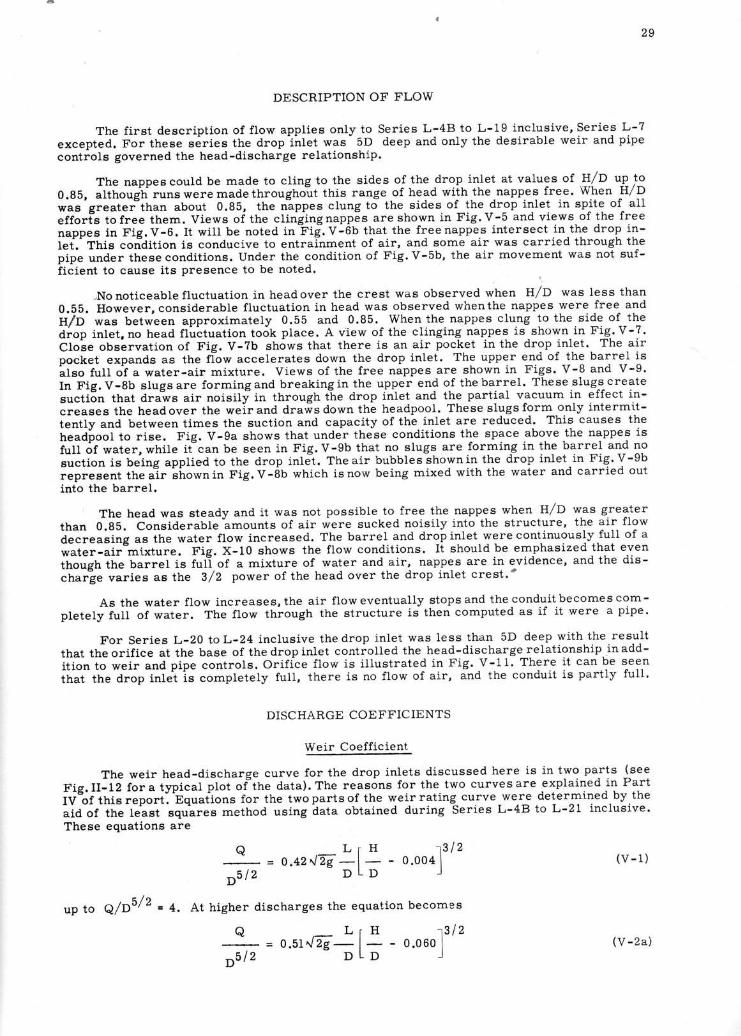
2 9
DESCRIPTION OF FLOW
The f irst descript ion of f low applies only to Series L-48 to L-19 inclusive, Series L-?
excepted. For these series the drop inlet was 5D deep and only the desirable weir and pipe
controls governed the head-discharge relat ionship.
The nappes could be made to cl ing to the sides of the drop inlet at values of g/D up to
0.85, although rnnsweremadethroughoirt this range of head wi.th the nappes free. When H/D
was'greate.-th.r, about 0.85, the nlppes clungto the-sides of the drop inlet in spite of al l
efforis tofree them. Views oi the cl inglngnappes are shown in Fig.V-5 and views of the free
nappes in F ig .V-6 . I t w i l l be no ted inF ig .V-0U t la i the f r :eenappes in te rsec t in - the drop in -
tei.- thls condit ion is conducive to entrainment of air, and some air was carr ied through the
pipe under these condit iong. Under the condit ion of Fig. V-5b, the air movement was not suf-
f icient to cause i ts presence to be noted.
.Nonoticeablef luctuation in headover the crest was observed when H/D was less than
0,bb. However, considerable f luctuation in head was observed whenthe nappes were free and
H/D was between approximately 0.55 and 0.85. When the nappes clung to the side of the
drop in le t ,no head f lu t tua t ion took p lace . A v iew o f the e l ing ing nappes is -shown in F iq .V-7 .
Cloie observation of Fig. V-?b shows that there is an air pocket in the drop inlet. The air
pocket expands as the f i-ow accelerates down the drop inlet. The upper end of the barrel is
also ful l o1 a water-air mixture. Views of the free nappes are shown in Figs. V-B and V-9.
In F ig .V-8b s lugsare fo rmingand break ing in the upper end o f thebar re l . These s lugscrea te
suction that draws air noisi l / in through the drop inlet and the part ial vacuum in effect in-
"r"."u" the headover the weirand drawsdown the headpool. These slugsform only intermit-
tently and between t imes the suction and capacity of the-. inlet are reduced. This causes the
headpool to r ise. Fig. V-9a shows that under these condit ions the space above,the nappes is
fuU of water, while i t-can be seen in Fig. V-9b that no slugs are forming in the barrel and no
suction is being applied to the drop inle1. Theair bubblesshownin the drop inlet in Fig.V-9b
represent thealr slo*., in Fig.V-8b which isnow being mixed wi.th the water and carr ied out
into the barrel.
The head was steady and i t was not possible to free the nappes when H/D was greater
than 0.8b. Considerable-amounts of air were sucked noisi ly into the structure, the air f low
decreasing as the water f low increased. The barrel and dropinlet werecontinuously-ful l of a
water-air mixture. Fig. X-10 shows the f low condit ions. I t should be emphasized that even
though the barrel is ful i of a mixture of water and air, nappes are in evidence, and the dis-
cnafge varies as the 3f2 power of the head over the drop lnlet crest. '
As the water f low increases , the a i r f loweventua l l y s topsand thecondu- i tbecomescom-
pletely ful l of water. The f low through the structure is then computed as i f i t were a pipe.
For Series L-20 to L-24 inclusive the drop inlet was less than 5D deep with the result
that the ori f ice at the base of the drop inlet contiol led the head-discharge relat ionship. inadd-
i i ion to weir and pipe controls. Orif ice f low is i l lustrated in Fig..V-11. Th9r.9 i t can be seen
that the drop inlei is completely ful l , there is no f low of air, and the conduit is part ly ful l '
DISCHARGE COEFFICIENTS
Weir Coefficient
The weir head-discharge curve for the drop inlets discussed here is in two parts (see
Fig. I I-12 for a typical plot of"the data). The reasons for the two curves are explained in Part
tVtf tnis report. -Equafions
for the two parts of the weir rat ing curve_we.re determined by the
aid of the least squlres method using bata obtained during Series L-4B to L-21 inclusive.
These equations are
o L t H $ 1 2
D 5 l 2 D L D )
up to Q/D5/2 . 4. At higher discharges the equation becomes
a L i H f t 2= 0 . 5 1 { 2 9 - l - - 0 . 0 6 0 ID 5 l 2
D L D - r
( v - 1 )
( V - 2 a )
29
DESCRIPTION OF FLOW
The first description of flow applies only to Series L-4B to L-19 inclusive, Series L-7 excepted. For these series the drop inlet was 5D deep and only the desirable weir and pipe controls governed the head-discharge relationship.
The nappes could be made to cling to the sides of the drop inlet at values of HI D up to 0.85, although runs were made throughout this range of head with the nappes free. When HI D was greater than about 0.85, the nappes clung to the sides of the drop inlet in spite of all efforts to free them. Views of the clinging nappes are shown in Fig. V -5 and views of the free nappes in Fig. V -6. It will be noted in Fig. V -6b that the free nappes intersect in the drop inlet. This condition is conducive to entrainment of air, and some air was carried through the pipe under these conditions. Under the condition of Fig. V -5b, the air movement was not sufficient to cause its presence to be noted.
,No noticeable fluctuation in head over the crest was observed when HI D was less than 0.55. However, considerable fluctuation in head was observed when the nappes were free and HI D was between approximately 0.55 and 0.85. When the nappes clung to the side of the drop inlet, no head fluctuation took place. A vIew of the clinging nappes is shown in Fig. V -7. Close observation of Fig. V -7b shows that there is an air pocket in the drop inlet. The air pocket expands as the flow accelerates down the drop inlet. The upper end of the barrel is also full of a water-air mixture. Views of the free nappes are shown in Figs. v-a and V-9. In Fig. V -8b slugs are forming and breaking in the upper end of the barrel. These slugs create suction that draws air noisily in through the drop inlet and the partial vacuum in effect increases the head over the weir and draws down the headpool. These slugs form only intermi.ttently and between times the suction and capacity of the inlet are reduced. This causes the headpool to rise. Fig. V-9a shows that under these conditions the space above the nappes is full of water, while it can be seen in Fig. V -9b that no slugs are forming in the barrel and no suction is being applied to the drop inlet. The air bubbles shown in the drop inlet in Fig. V -9b represent the air shown in Fig. V -8b which is now being mixed with the water and carried out into the barrel.
The head was steady and it was not possible to free the nappes when HI D was greater than 0.85. Considerable amounts of air were sucked noisily into the structure, the air flow decreasing as the water flow increased. The barrel and drop inlet were continuously full of a water-air mixture. Fig. X-10 shows the flow conditions. It should be emphasized that even though the barrel is full of a mixture of water and air, nappes are in evidence, and the discharge varies as the 3/ 2 power of the head over the drop inlet crest. ·
As the water flow increases, the air flow eventually stops and the conduit becomes completely full of water. The flow through the structure is then computed as if it were a pipe.
For Series L-20 to L-24 inclusive the drop inlet was less than 5D deep with the result that the orifice at the base of the drop inlet controlled the head-discharge relationship in addition to weir and pipe controls. Orifice flow is illustrated in Fig . V -11. There it can tie seen that the drop inlet is completely full, there is no flo w of air, and the conduit is partly full.
DISCHARGE COEFFICIENTS
Weir Coefficient
The weir head-discharge curve for the drop inlets discussed here is in two parts (see Fig. 11-12 for a typical plot of the data). The reasons for the two curves are explained in Part IV of this report. Equations for the two parts of the weir rating curve were determined by the aid of the least squares method using data obtained during Series L-4B to L-2l inclusive. These equations are
Q L r H J3 / 2 -- = 0.42..j2g-L- - 0 .004 D5/2 D D
(V-l)
up to Q/ D5/ 2 = 4. At higher discharges the equation becomes
L l H J3/
2 = 0.51.f2g -D -D - 0.060
D5 / 2
Q (V-2a)
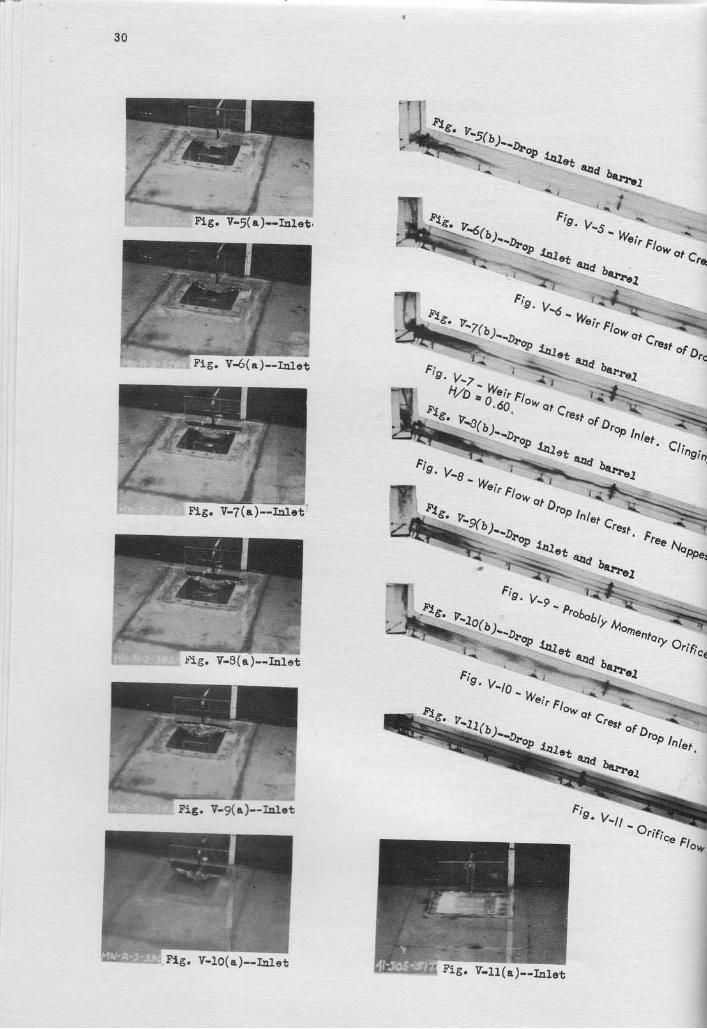
3 0
v-l(a)--Ialet
Cl ing in
Fr"" rv"o;
.-
r_,ri4ce F/or
v-I1(a)--Iarot
t ' i .g. V-8(a)--Ialet
Ffg. V-P(a)--rn1et
V-10(e)--Ialet
30

3 1
;*; r *=&a=-
ff;*:-*,.nt ff*&t ' - *-"-
'v'n"''"*"7)'*fit
Drop hlet
Ent, .
cDf rq
Nooou, ""oo,ffsl * *.. roc&ef in Drop
t,
l
Flow or n
o #*"",
oaz
-::'"""%dr" *.;ffiP*.,fu,'r'qter
lvlixh,re;, ry
llllllllffi\...*_'_u'A''corrred%oro,
,n,ur.-' .. .ruu Noppur.
lwoy when"'{ry
-rugs Are
t u ,* r**, lJ^
No ai, rbl,
nuousAir""",.,ffi
,ning Ai
tr*^"*,"ffi
fnfrqnce.
n O " O - j
31
Flo". ry Ot C
rest f o Dr,
op Inlet
Borrel P. Ortly Full
fVD _I./~.
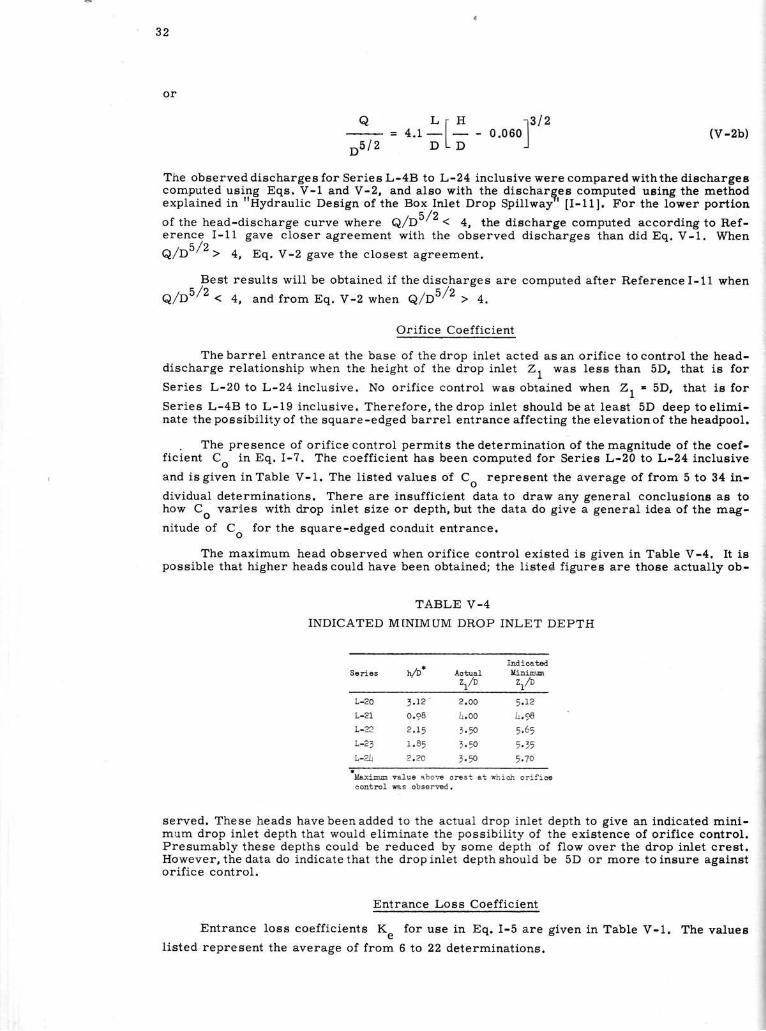
3 2
(v-2b)
Orif ice Coeff icient
The barrel entrance at the base of the drop inlet acted as an orif iee to control the head-discharge relationship when the height of the drop inlet Z, was lese than 5D, that is for
Series L-20 to L-24 inclusive. No orif ice control was obtained when Zro 5D, that is for
Ser ies L-48 to L-19 inc lus ive. Therefore, thedrop in let should beat least 5D deep toel imi-nate the possibil i tyof the square-edged barrel entrance affecting the elevationof the headpool.
. The presence of orif ice control permits the determination of the magnitude of the coef-ficient Cu in Eq. I-?. The coefficient has been computed for Series L-ZQ to L-24 inclusi.ve
and isgiven inTable V-1. The listed values of Co represent the average of from 5 to 34 in-
dividual determinations. There are insufficient data to draw any general conclusions aa tohow Co varies with drop inlet size or depth, but the data do give a general idea of the mag-
nitude of C^ for the square-edged conduit entrance.o
The maximum head observed when orif ice control exieted is given in Table V-4. It iepossible that higher heads could have been obtained; the l isteC figuree are those actually ob-
TABLE V-4
INDICATED MINIMUM DROP INLET DEPTH
36 ri€ s h/D ,{ctual" l t -
Indietedf,iri@,rk
a L r H f i 1 2-- - = 4.1- l - - 0 .060 |D 5 l 2 D L D J
The observed discharges for Series L-48 to L-24 incluslve were compared withthe dischargescomputed usi.ng Eqs. V-1 and V-2, and also with the discharg^es computed ueing the methodexplained in "Hydraulic Deeign of the Boxfnlet Drop Spil lway" [I-11]. For the lower portion
ofthe head-discharge curve where q/O5/2 < 4, the discharge computed accordingto Ref-erence I-11 gave closer agreement with the observed discharges than did Eq. V-1. Whenq/o ' /2 , 4, Eq. V-2 gave the c losest agreement .
Best results wil l be obtained if thedischarges are computed after Referencel-11 when. q , / q
q/D- ' ' I 4 , and f rom Eq. V-2 wnen e/D5/2 , +,
L-2!
L-??
0.98
r . 85
2.20
2.oo
!.oo1.50
1.50
1.98
5 . t, ,70
) t raxl@ Elu€ abo@ crest at r i ich or i f i€contrcl ns obsorEd.
served. These heads havebeenadded to the actual drop inlet depth to give an indicated mini-mum drop inlet depth that would el iminate the possibi l i ty of the existence of ori f ice control.Presumably these deplhs could be reduced by some depth of f low over the drop inlet crest.However, the data do indicate that the drop inlet depth should be 5D or more to insure againstori f ice control.
Entrance Loss Coefficient
Entrance loss
Iisted represent the
coefficients K eaverage of from
for use in Eq. I-5 are given in Table V-1. The values
6 to 22 determinations.
32
or
_Q- = 4 .1 ~[~ - 0.060J3/2
D5/2 D D (V -2b)
The observed discharges for Series L-4B to L-24 inclusive were compared with the discharges computed using Eqs. V -1 and V -2, and also with the dischar~es compute d using the method explained in "Hydraulic Design of the Box Inlet Drop Spill way I [1-11]. For the lower portion
of the head-discharge curve where Q / D5/ 2 < 4, the discharge computed according to Reference 1-11 gave closer agreement with the observed discharges than did Eq. V -1. When
Q / D5/ 2 > 4, Eq. V -2 gave the closest agreement.
Best results will be obtained if the discharges are computed after Refe r ence 1-11 when
Q / D5/ 2 < 4, and from Eq. V -2 when Q / D5/ 2 > 4 .
Orifice Coefficient
The barrel entrance at the base of the drop inlet acted as an orifice to cont r ol the headdischarge relationship when the height of the drop inlet Z1 was less than 5D, that is for
Series L-20 to L-24 inclusive. No orifice control was obtained when Z1 • 5D, that is for
Series L-4B to L-19 inclusive. Therefore, the drop inlet should be at least 5D deep to eliminate the possibility of the square -edged barrel entrance affecting the elevation of the headpool.
. The presence of orifice control permits the determination of the magnitude of the coefficient C in Eq. 1-7. The coefficient has been computed for Series L-20 to L-24 inclusive o and is given in Table V -1. The listed values of C represent the average of from 5 to 34 in-o dividual determinations. There are insufficient data to draw any general conclusions as to how Co varies with drop inlet size or depth, but the data do give a general idea of the mag-
nitude of C for the square-edged conduit entrance. o
The maximum head observed when orifice control existed is given in Table V -4. It is possible that higher heads could have been obtained; the liste r,;! figures are those actually ob-
TABLE V-4
INDICATED MINIMUM DROP INLET DEPTH
hID· Indicated
Series Actual YinimUIn
Z/D z l /D
L- 20 3.12 . 2. 00 5.12
L- 21 0.98 1t . 00 1t . 98 L- 22 2. 15 3. 50 5.65 L- 23 1.85 3. 50 5. 35 L- 2It 2. 20 3. 50 5.70 . Maximum value qbove crest at which o r i fice control was observed.
served. These heads have been added t o t he actual drop inlet depth to g ive an indicated minimum drop inlet depth that would eliminat e the poss ibility of the e xistence of orifice control. Presumably these depths could be reduced by some depth of flow over the drop inlet crest. However, the data do indicate that the drop inlet depth should be 5D or more to insure against orifice control.
Entrance Loss Coefficient
Entrance loss coefficients K for use in Eq. 1-5 are given in Table V -1. The values e listed represent the average of from 6 to 22 determinations.
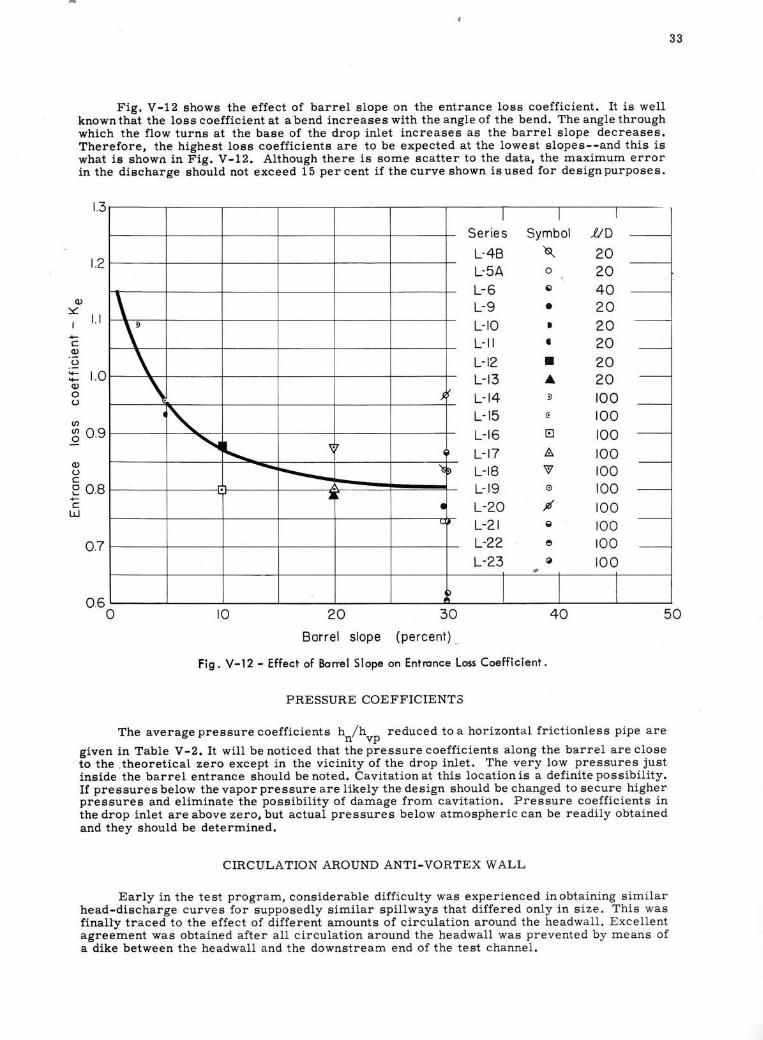
3 3
Fig. V-12 shows the effect of bamel slope on the entrance Ioss coeff icient. I t is wellknownthat the loss coeff icient at abend increases with the angle of the bend. The angle throughwhich the f low turns at the base of the drop inlet increases as the barrel slope decreasee.Therefore, the highest loss coeff icients are to be expected at the lowest Elopes--and this iswhat ie shown in Fig. V-L2. Although there is some scatter to the data, the maximum errorin the diecharge should not exceed 15 per cent i f the curve shown isused for designpurposes.
(l)
YI
+
o):0ooo
oao
o()
t!
l . l
n a
o 8
Se r ie sL-48L-5AL-6L-9L-toL-l IL-t2L-r3L-14L-15L-16L- t7L-r8L-19L-aw
L-21L-22L-23
Symbol
\o
o
a
,a
I
At
EI
A
vo
/
c
o
AD2020402 020202020rootootoorootoorootootootootoo
ro 20Borrel slope
Fig. V-I2 - Effect of Borrel Slope
30 40(percent) -
on Entronce Loas Coeff icient.
PRESSURE COEFFICIENTS
The average pressure coeffieients hrr/h.rp reduced to a horizontal frictionless pipe are
given in Table y-2,It wil l benoticed that thepressurecoefficients along the barrel areclosetb the ,theoretical zero except in the vicinity of the drop inlet. The very low pressures justineide the barrel entrance should benoted. Cavitationat this locationis a defini.tepossibil i ty.If pressures below the vapor pressure are l ikely the design should be changed to secure higherpre6sure6 and eliminate the possibil i ty of damage from cavitation. Pressure coefficients inthe drop inlet are above zero, but actual pressures below atmospheric can be readily obtainedand they should be determined.
CIRCULATION AROUND ANTI-VORTEX WALL
Early in the test program, considerable diff iculty was experienced inobtaining similarhead-discharge curves for supposedly similar spil lways that differed only in size. Thie wasfinally traced to the effect of different amounts of circulation around the headwall. Excellentagreement was obtained after all circulation around the headwall was prevented by means ofa dike between the headwall and the downstream end of the test channel.
33
Fig. V-12 shows the effect of barrel slope on the entrance loss coefficient. It is well known that the loss coefficient at a bend increases with the angle of the bend. The angle through which the flow turns at the base of the drop inlet increases as the barrel slope decreases. Therefore, the highest loss coefficients are to be expected at the lowest slopes--and this is what is shown in Fig. V-12. Although there is some scatter to the data, the maximum error in the discharge should not exceed 15 per cent if the curve shown is used for design purposes.
1.3 I I I Series Symbol liD L-4B ~ 20 L-5A 0 20
1.2 . L-6 ~ 40
Q) \ L-9 • 20
\ L-IO I 20 -
L-II • 20
\ -
L-12 • 20
\ L-13 .A 20 -
; L-14 ;) 100 -
y: 1.1
..... c Q)
t)
..... 1.0 ..... Q)
0 t)
(/) L-15 (! 100 ~
~ L-16 ~ 100 -
"-~ 0.9
Q) t)
c ........
~.
-----L-17
'\s~ L-18 8. 100 -w 100
. L-19 0 100 -J ~ 08 .....
c W
0.7
0.6 o
• L-20 % 100 -<.; L-21 g 100
L-22 e 100 -
L-23 ~ 100 .. I I T
10 20 30 40 50
Barrel slope (percent) _
Fig. V-12 - Effect of Barrel Slope on Entrance Loss Coefficient .
PRESSURE COEFFICIENTS
The average pressure coefficients h /h reduced to a horizontal frictionless pipe are n vp given in Table V -2. It will be noticed that the pressure coefficients along the barrel are close to the .theoretical zero except in the vicinity of the drop inlet. The very low pressures just inside the barrel entrance should be noted. Cavitation at this location is a definite possibility. If pressures below the vapor pressure are likely the design should be changed to secure higher pressures and eliminate the possibility of damage from cavitation. Pressure coefficients in the drop inlet are above zero, but actual pressures below atmospheric can be readily obtained and they should be determined.
CIRCULATION AROUND ANTI-VORTEX WALL
Early in the test program, considerable difficulty was experienced in obtaining similar head-discharge curves for supposedly similar spillways that differed only in size . This was finally traced to the effect of different amounts of circulation around the headwall. Excellent agreement was obtained after all circulation around the headwall was prevented by means of a dike between the headwall and the downstream end of the test channel.
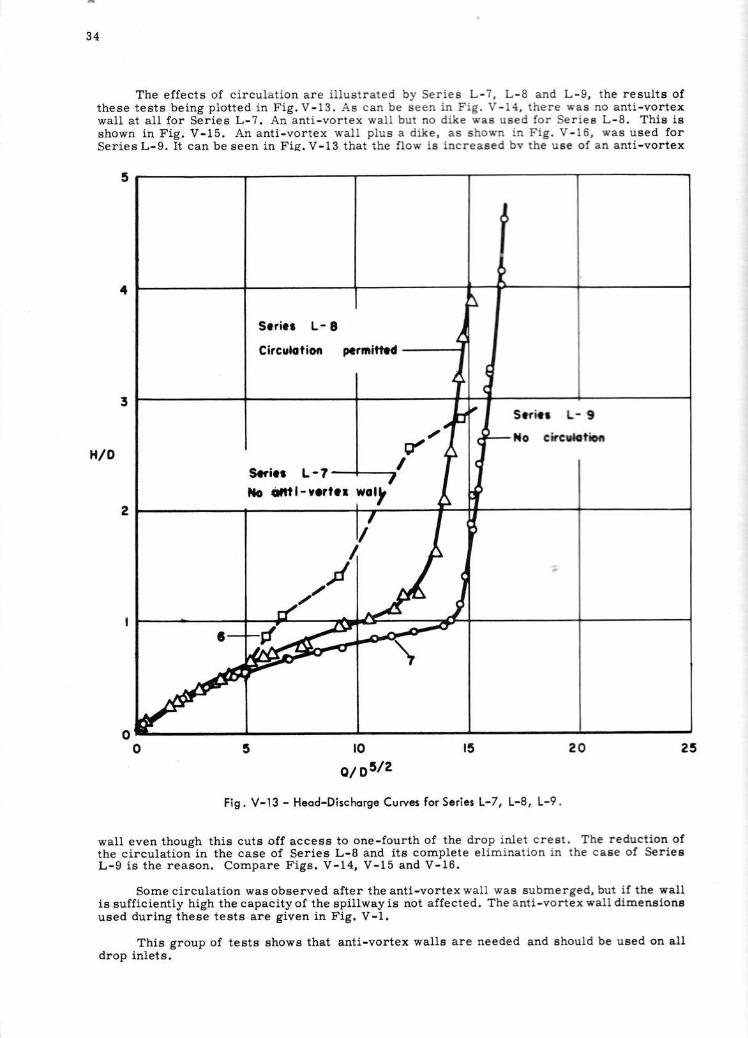
3 4
The effects of circulation are i ltustrated by Seriee L-7, L-B and L-9, the results ofthese tests being plotted in Fig.V-13. As can be seen in Fig. V-14, there was no anti-vortexwall at all for Series L-?. An anti-vortex wdl but no dike sae used for Seriea L-8. Thie isshown in Fig. V-15. An anti-vortex wall plus a dike, as shown in Fig. V-16, was used forSeries L-9. It can be seen in Fis. V-13 that the flow ie increased bv the uae of an anti-vortex
t|/o
ISoricr L- 8
)Circulotioo p.rnitLd-J
t f
'J
Srr io L-7-
llo dttl-Y.?lar ,toll�
,+,rf
)
6 -
Fo
23?or5rooU s5/2
Fig. V-13 - Heod-Dischorge Curves for Series L'7, L'8, L-9.
wall even though this cuts off access to one-fourth of the drop inlet creat. The reduction ofthe circulatiori in the case of Series L-8 and its complete elimination in the caae of SeriegL-9 is the reason. Compare Figs. V-14, V-15 and V-16.
Some circulation was observed after the anti-vortex wall was gubmerged, but if the wallis sufficiently high the capacity of the spillway is not affected. The anti-vortex wall dimenaionsused during these tests are given in Fig. V-1.
This group of tests shows that anti-vortex walls are needed and should be uged on alldrop inlets.
34
The effects of circula tion are i llus t r ated by Series L - 7, L - B and L-9, the results of these tests being plotted in Fig. V-l3. As can be seen in Fig. V - l4, there was no anti -vortex wall at all for Series L- 7. An a nti-vort e x wall but no dike was u sed for Series L - B. This is shown in Fig. V-l5. An anti-vorte x wa ll plu s a dike, as s hown in Fig. V- IS, was u sed for Series L-9. It can be seen in Fig. V-l3 that the fl ow i s increased bv the u se of an anti-vortex
H/D
5r---------~r---------_.------------._--------_.----------~
4
3
S.ries L- 8
Circulation permitted ----f
Serl.. L -7 --+---.." No Qftt 1- wert ..
S.ries L- 9
No c ire tioft
2 ~--------~~----------~~----~--~--------~~--------~
I
10
0/D 5/ 2 15
Fig. V-13 - Head-Discharge Curves for Series L-7, L-8 , L-9 .
20 25
wall even though this cuts off access to one-fourth of the drop inlet crest. The reduction of the circulation in the case of Series L-8 and its compl~te elimination in the case of Series L-9 is the reason. Compare Figs. V-14, V-l5 and V-lS.
Some circulation was observed after the anti-vortex wall was subm erged, but if t he wall is sufficiently high the capacity of the spillway is not affected. The anti -vortex wall dimensions used during these tests are given in Fig. V-1.
This group of tests shows that anti-vortex walls are needed and shoul d be u sed on all drop inlets.
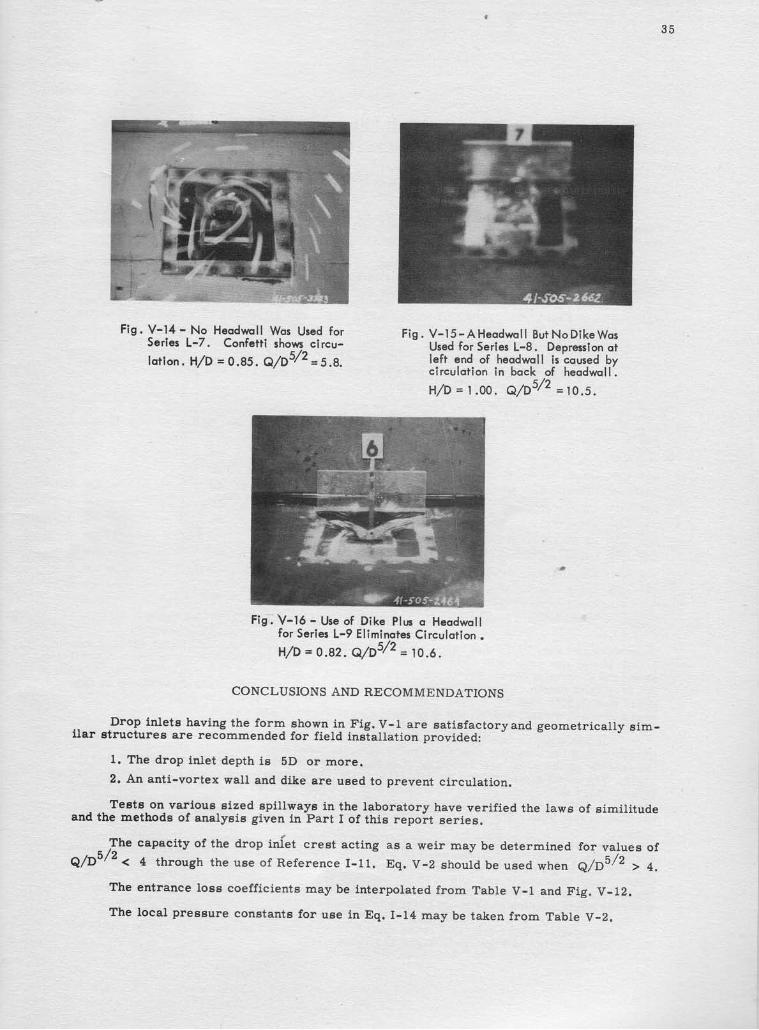
3 5
Fig. V-14 - No Heodwull Wos Used forSerles L-7. Confe?ti shorvs circu-
lot ion. H/D = O.AS, A/O5/2 = S.a.
Fig. V-15-AHecdwol l But NoDikeWosUsed for Serles L-8. Deoresslon otleft end of heodwoll is coused bycirculotion in bock of heodwoll ' .
H/D = | .OO. A/D5/2 = 10.5.
Fig; V-16 - Use of Dike plus o Heodwollfor Scrles L-9 Eliminotes Circulotion .H/D = 0.82. a1p5/2 = 10.6.
CONCLUSIONS AND RECOMMENDATIONS
., Drop inlets having ttre form shown_rl Fig.V-1 are satisfactoryand geometrically eim-ilar structureE are recommended for field inefallation provided:
1. The drop inlet depth is bD or more.2. An anti-vortex wall and dike are used to prevent circulation.
Teets on various_sized epil lways in the laboratory have verif ied the laws of simil itudeand the methods of analysis given in part I of this "epoit series.
- The capacity of the drop infet crest acting as a weir may be determined for values ofq/o'/z < 4 through the use of Reference I-11. Eq. V-2 should be used wrren q/o5/2 , +.
The entrance loss coefficients maybe interpolated from Table V-1 and Fig. V-12.
The local Pressure constants for use in Eq. I-14 may be taken from Table V-2.
Fig. V-14 - No Headwall Was Used for Series L-7. Confetti shows circu-
lation. H/D = 0 .S5. Q/D5/ 2 = 5.S.
Fig. V-15-AHeadwall But NoDikeWas Used for Series L-S. Depression at left end of headwall is caused by circulation in back of headwall.
5/2 H/D = 1.00. Q/D = 10.5.
Fig-:V-16 - Use of Dike Plus a Headwall for Series L-9 Eliminates Circulation.
H/D = 0.S2. Q/D5/ 2 = 10.6.
CONCLUSIONS AND RECOMMENDATIONS
35
Drop inlets having the form shown in Fig. V -1 are satisfactory and geometrically similar structures are recommended for field installation provided:
1. The drop inlet depth is 5D or more.
2. An anti-vortex wall and dike are used to prevent circulation.
Tests on various sized spillways in the laboratory have verified the laws of similitude and the methods of analysis given in Part I of this report series.
The capacity of the drop inlet crest acting as a weir may be determined for values of
Q/D5/ 2 < 4 through the use of Reference 1-11. Eq. V -2 should be used when Q/D5/ 2 > 4.
The entrance loss coefficients may be interpolated from Table V -1 and Fig. V -12.
The local pressure constants for use in Eq. 1-14 may be taken from Table V-2.
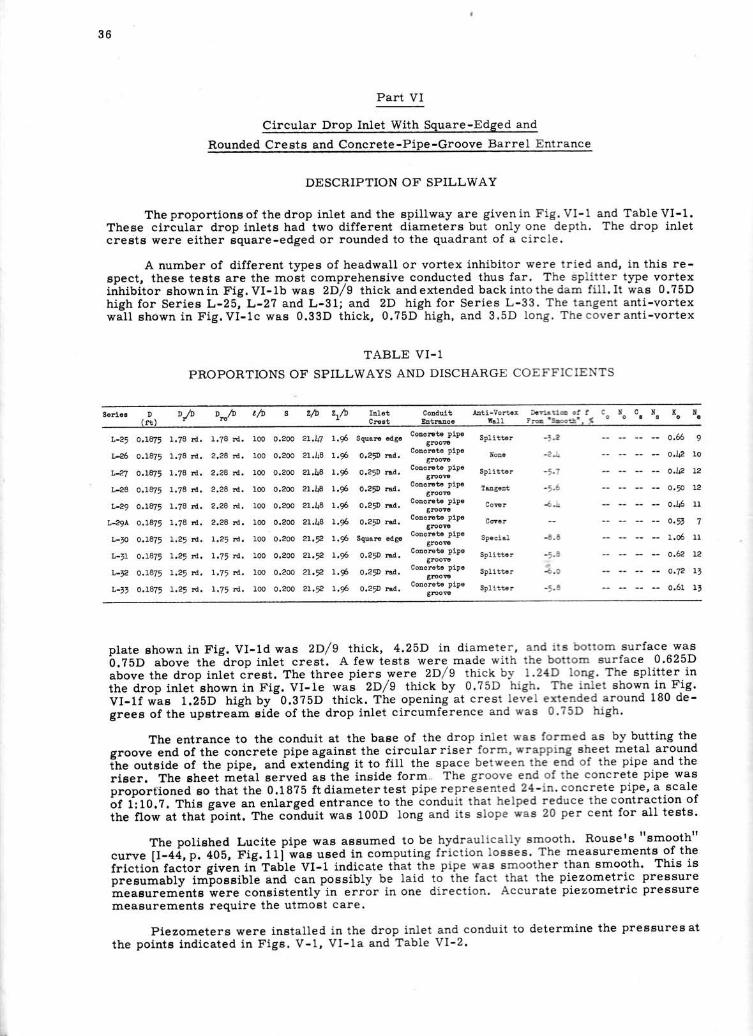
3 6
Part VI
Circular Drop Inlet With Square-Edged and
Rounded Crests and Concrete-Pipe-Groove Barrel Entrance
DESCRIPTION OF SPILLWAY
The proportions of the drop inlet and the spil lway are givenin Fig. VI-1 and Table VI-1.These circular drop inlets had two different diameters but only one depth. The drop inletcreBts were either square-edged or rounded to the quadrant of a circle.
A number of different types of headwall or vortex inhibitor were tried and, in this re-spect, these tests are the most comprehensive conducted thus far. The splitter type vortexinhibitor shownin Fig.VI-lb was 2D/9 thick andextended backintothedam fi l l . It was 0.75Dhigh for Series L-25, L-27 and L-31; and 2D high for Series L-33. The tangent anti-vortexwal l shown in F ig.Vi - lc wae 0.33D th ick, 0.?5D high, and 3.5D long. Thecoverant i -vor tex
TABLE VI .1
PROPORTIONS OF SPILLWAYS AND DISCHARGE COEFFICIENTS
gertos ,^?, D/lD o*k t/b s zlb zth rEl€t coldult lEti-Yortr D.rirtaGctt c^ t c f, r $
rnj cregt Eutroco f,all Frc'bot!"i o o I I e I
L-25 0.1875 1.78 !d. 1.78 rd.
L-26 o.LSl, 1.78 rd. 2.28 trt.
LAI o.r875 1.78 rd. 2.28 rd.
L-28 O.t875 1.78 d, 2.28 rd.
L-29 o.r875 1.78 d. 2.28 !d.
L-$A O.IE! 1.78 td. 2.28 !d.
L-tO O,7E5 1.25 tn. 1.25 !d.
L-tJ- 0.7875 I.25 ,n. 1,75 td,
L-rz o.r875 1.25 rd. 1.75 rd.
L-,t o.r87, I.25 fi, 1,75 t4,
100
100
t0o
100
100
100
100
100
100
100
o.2oo 27,n l.96 Square €dde corogFt€iiPo splitt ! a.2
o.aoo 21.,L8 1.96 o.z5D Ed, co'dete pllo loic -?*
o.2oo 21.1+8 7,* o.zrD oa. c'"onT"jie' splittrr -t.?
o.aoo 2r.l+B 1.95 o.2p hd. coEoEot€iiP' TugoEt -5.6
o.zoo al.l+8 1.96 o.29E nd. coBor-tol'iPo coEr6rcOE
4 a
o.2oo 2r.l+8 1,g6 o.2p !od. cobo-F-te-Plpe coErgrcoF
o,2oo z:r,g. t.S square odge coaoF-te plpe speci.el -€.8
groow
o.zoo z!.52 r,* o.ap Ed. cotror€t€ plpo splitt r 5.s
o.2oo 21.?. t.* o,2'D nd, couc-rate PlPe sp1ltr.r i.o
o.2oo z:r.p. !.* o.2p ftd. co4otet€ piPo Splitt r 1.a
- - - - - - 0 . 6 5 9
- o.!2 10
-- o.]P rz
-- 0.50 12
- 0.46 rr
- - - - - o . r t 7-- r.06 1r
-- 0,62 L2
- - v , l z L )
-- 0.61 1,
plate shown in Fig. VI-1d was 2Df 9 thick, 4.25D in diameter, aid its bottom gurface wasb.Zep above the drop inlet crest. A few tests were made with the bottom surface 0.625Dabove the drop inlet crest. The three piers were 2D/9 thick by 1.2,tD long. The eplitter inthe drop inlet ehown in Fig. vl-le was 2D/9 thick by 0.?5D high. The inlet shown in Fig.VI-1f was 1.25D high by*0.3?5D thick. The opening at crest level extended around 180 de-grees of the upstream side of the drop inlet circumference and was 0.?5D high.
The entrance to the conduit at the base of the drop inlet was formed as by butting thegroo"" end of the concrete pipe against the circular rieer form, wrapping sheet metal around
ihe outside of the pipe, and exteriding it to fill the space between the eod of the pipe and the
riser. The eheet metat served as the inside form,, The groove end of the concrete Pipe wasproport ioned so that the 0.18?5 f td iameter test p iperepresented 24- in.concrete p ipe,a.scale-
i lf f:tO.Z. This gave an enlarged entrance to the conduit that helped reduce thecontraction of
the flow at that-point. The coiduit was 100D long and its slope wae 20 per cent for all tests'
The polished Lucite pipe was asEumed to be hydraulically emooth. Roueetsttsmoothttcurve j-+i,p. 40b, Fig. f rf was used in computing fi iction loeses. The measurements of the
frictioir faci6r given in" fa6te Vt-t indicate that the pipe wae smoother than smooth. This ispresumably imlossibie and can possibly be laid to the. fact that the piezometric preEsure
meagurembnte were congistently in error in one direction. Accurate piezometric pressuremeasurements require the utmoet care.
Piezometers were installed in the drop inlet and conduit to determine the pressures at
the points indicated in Figs. V-1, VI-la and Table VI-2.
36
Part VI
Circular Drop Inlet With Square-Edged and
Rounded Crests and Concrete-Pipe-Groove Ba rrel E nt rance
DESCRIPTION OF SPILLWAY
The proportions of the drop inlet and the spillway are given in F ig. VI - 1 and Table VI-1. These circular drop inlets had two different diameters but only one depth . The drop inlet crests were either square-edged or rounded to the quadrant of a circ le.
A number of different types of headwall or vorte x inhibito r were t r ied and, in this respect, these tests are the most comprehensive conducted thus far. T he s plitter type vortex inhibitor shownin Fig. VI-1b was 2D/ 9 thick and extended back into the dam fill . It was 0.75D high for Series L-25, L-27 and L-31; and 2D high for Series L-33. T he angent anti -vortex wall shown in Fig. VI-1c was 0.33D thick, 0.75D high. and 3 .5D long. T he cover anti-vortex
TABLE VI-1
PROPORTIONS OF SPILLWAYS AND DISCHARGE COEFFICIE TS
Series D D/D Dro/D lID z/D zl/D Inlet Conduit Anti - Vortex Donati of r C N C N K N ( 1't) Crest Entra.nce 11.11 Fro:. - SJDcotb-« % 0 0 . • • •
L-25 0. 1875 1.78 rd . 1.78 rd. 100 0.200 21.47 1.96 Square ed ge Concrete pipe Splitter groove
-}.2 0.66 9
L-26 0.1875 1.78 rd . 2.28 rd. 100 0 .200 21 .48 1.96 0 . 25D rod . Conorete pi pe
NODe groove
-2 _ 0 .42 10
L-27 0.1875 1.78 rd. 2 . 28 rd. 100 0.200 21.48 1 .96 0 .25D rod . Conorete pipe
Spli t t e r groove -5· 0.42 12
L-28 0.1 875 1.78 rd. 2 .28 rd. 100 0 . 200 21.48 1.96 0 . 25D rod. Conarete pipe Te..ngent
groove -5·6 0·50 12
L-29 0.1875 1.78 rd. 2 . 28 rd . 100 0 .200 21.48 1.96 0.25D rod . Conc rete pipe
groove Cover 0 .46 11
L- 29A 0. 1875 1. 78 rd. 2.28 rd. 100 0 .200 21.48 1.96 0.25D r ad. Conc rete pi pe
Cove r 0 · 53 7 groove
L-30 0 . 1875 1 . 25 rd. 1 . 25 rd. 100 0 . 200 21.52 1. 96 Square edge Concrete pipe
Special -a.8 1.06 11 groove
L-31 0 . 1875 1.25 rd. 1.75 rd. 100 0.200 21.52 1.96 0. 25D rod . Concrete pipe
Splitte r groove
.8 0 .62 12
L-32 0. 1875 1.25 rd. 1.75 rd. 100 0.200 21.52 1.96 0. 25D rod. Concrete pipe
Splitte r ~.O 0 . 72 13 groove
L- 33 0. 1875 1.25 rd . 1. 75 rd . 100 0 . 200 21.52 1.96 0. 25D rod. Concrete pipe Splitter
groove -S.8 0 .61 13
plate shown in Fig. VI-1d was 2D/ 9 thick, 4 . 25D in dia met e r , and ' s bo om surface was 0.75D above the drop inlet crest. A few tests were made with he bo om surfac e 0.625D above the drop inlet crest. The three piers were 2D/ 9 t hick by l .24D long . T he splitter in the drop inlet shown in Fig. VI-1e was 2D/ 9 thi ck by 0.7 5D high. T he inlet shown in Fig. VI-lf was 1.25D high by 0.375D thick. The opening at c r est leve extended a round 180 degrees of the upstream side of the drop inlet circumferenc e and was 0 .75D high.
The entrance to the conduit at the base of the drop inle t was formed a s by butting the groove end of the concrete pipe against the circular riser fo r m, wrapping s heet metal around the outside of the pipe, and extending it to fill the s pac e be tween he end of t he pipe and the riser. The sheet metal served as the inside form .. T he groove end of he concrete pipe was proporfioned so that the 0.1875 ft diameter test pipe represe n ed 24 - 'n . concret e pipe, a scale of 1: 10.7. This gave an enlarged entrance to the condu it t ha t helped r educ e t he contraction of the flow at that pOint. The conduit was 100D long a nd its s lope wa s 20 per c ent for all tests.
The polished Lucite pipe was assumed to be hydraulically s mooth . Rouse's "smooth" curve [1-44, p . 405, Fig. 11] was used in computing fr iction losses. T he measurements of the fr i ction factor given in Table VI-1 indicate that t he pipe was s moothe r t han smooth. This is presumably impossible and can possibly be laid to t he fac t tha t the piezometric pressure measurements were consistently in error in one direction. Accu r ate piezometric pressure measurements require the utmost c are.
Piezometers were installed in t he drop inle t and c onduit to determine the pressures at the points indicated in Figs . V -1, VI-1 a and Table VI - 2.
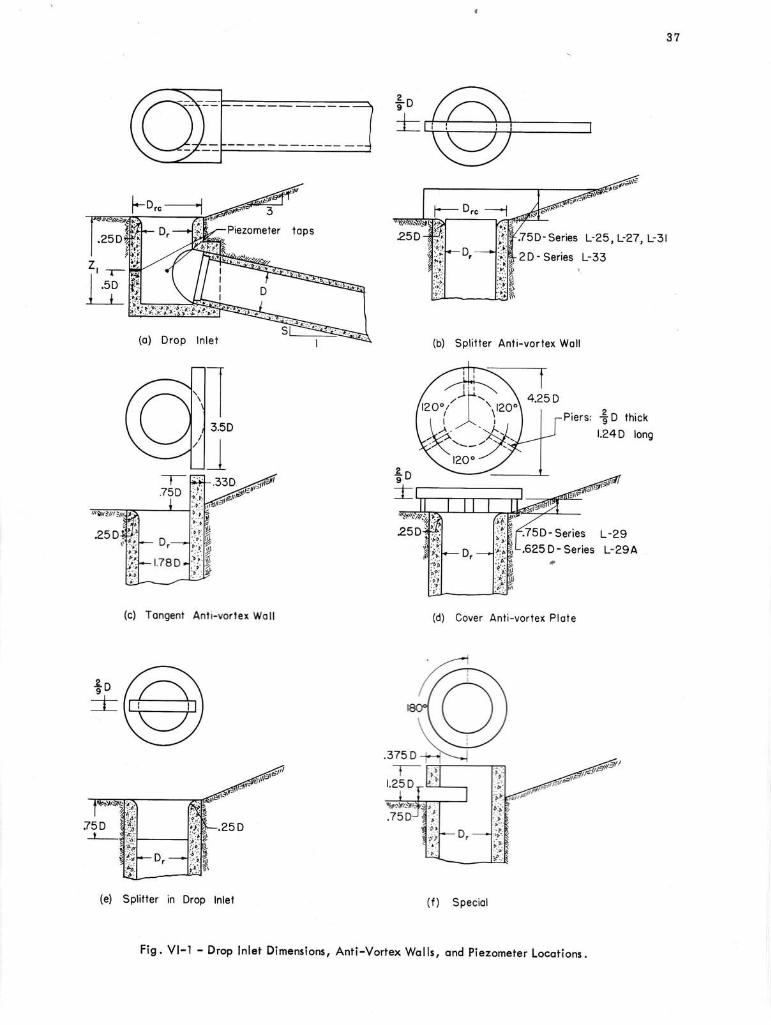
3 7
f,o-f-
I
.75D- Series
2 D - Series
(b) Spl i t ter Ani i-vorlex Woll
(c) Tongent Anli-vortex Woll (d) Gover Anli-vortex Plote
(e) Splitter in Drop Inlet (f ) Speciol
L-25,L-27,L-31
L-33
$o_l
' t i l) {, l
I
i' 120 "
.75D - Series L-29
.625D-Ser ies L-29A
Fig. Vl-l - Drop Inlet Dimensions. ,Anti-vorfex wolls, ond piezometer Locotions.
tops 25D
(0) Drop Inlet
(c) Tangent Ant i-vor tex Wall
(e) Splitter in Drop Inlet
37
L-25, L-27, L-31
' .• :: 2D - Series L-33
:%i
(b) Splitter Anti-vortex Wall
4.25D
Piers: i D thick
1.24D long
L-29
(d) Cover Anti -vortex Plate
.' .. ~
(f) Special
Fig. VI-l - Drop Inlet Dimensions, Anti-Vortex Walls, and Piezometer Locations.
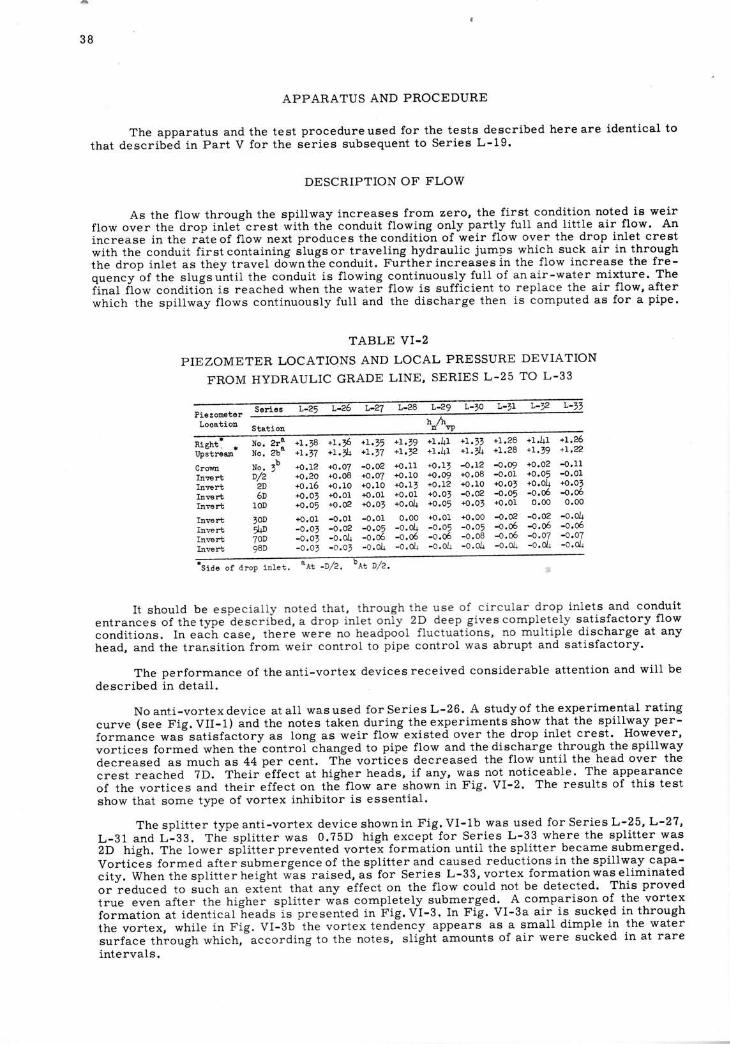
3 B
APPARATUS AND PROCEDURE
The apparatus and the test procedureused for the tests described hereare identical to
that described in Part V for the series subsequent to Series L-19.
DESCRIPTION OF FLOW
As the f low through the spi l lway increases from zero, the f irst condit ion noted is weir
f low over the drop inlet"crest witn t ir i : conduit f lowing only part ly ful l and-i i t t le air f low. An
increase in the r i te of f low next produces the condit ion of weir f low over the drop inlet crest
with the conduit f i rst containing i lugs or travel ing hydraul ic jumps whigh suck air in through
the drop inlet as they travel ddwntl ieconduit. Fuitherincreasesin the f low increase the fre-
quency of the slugsunti l the conduit is f lowing continuous-ly ful l of anair-water mixture- The
final f low condit i6n is reached when the watei f low is suff icient to replace the air f low, after
which the spi l lway f lows continuously ful l and the discharge then is computed as for a pipe.
TABLE VI .z
PIEZOMETER LOCATIONS AND LOCAL PRESSURE DEVIATION
FROM HYDRAULIC GRADE LINE, SERIES L-25 TO L'33
Right . IUpstrem
CrqmInw rbInwrtInErtI!€rb
=t:j]tlr i ^; f,:r6 f,=vi t=e6 f,ai t=t6 l=ri :: ',i
Pi-ezometar 5erl68 !-e '
:Looation
statioa hoAon
No. 30 +0.12 +O.O7 -0 .02 +O.11 +0.1 ,
D/2 +O.?O +O.OB rO.O7 +O.1O +O.09'2D +0.16 ro .1o +o.10 +O. I , +0 .12
6D +o.ol +o.ot +o.o1 +o.01 +o.o,
loD +o.ot +o.o2 +o.ol +o.ol+ +O.o5
Inrert ,OD +O. 01 -0.O1 -0.OI 0.00 +O ' Ol
I!rert ,rD -0.0, -0.02 -0.05 -O.Ol+ -0'05
Inwrt 7OD -0.0, -0.01+ -0.06 -0.06 -o'oo
In@rt 98D -0.0, -0.0, -0.0L -o.& -o'0ll
N q .
N o .
Zra2b-
+L. j8 +L.S +I . t5 +I . t9 +L, l i+L.r1 +1.4 +I , t7 +L. tz +1.1i
,!.27+ L , A
-0 .12+o.08+0. IO-0.02+0.0 ,
+O.O0-o .05-0 .08-O,O,h
+1.28+L .ZO
-o.09
+o.0,-o.o5+0.01-o.o2-o.06-o.06-o.0!
+l.,lr1+r . t 9
+0.02+O.05+o.oll-o.060.00
-o.o2-o,06-o.o7-0. ol+
+ L . 1 O+ I . n
-0.11
+0.01-o.06o.o0
-0.Ott-o.06
I t should be especial ly noted that, through the use of circular drop inlets and conduit
entrances of thetype descriLed, a drop inlet only 2D deep givescompletely satisfactory f low
condit ions. In eath case, there were no headpool f luctuations, no mult iple discharge at any
head, and the transit ion from weir control to pipe control was abrupt and satisfactory.
The performance of the anti-vortex devices received considerable attention and wil l be
described in detai l .
No anti-vortex device at al l wasused for Series L-26. A studyof the experimental rat ing
curve (see Fig. VII-1) and the notes taken during the experiments show that the spi l lway per'
formance was satisfactory as long as weir f low existed over the drop inlet crest. However,
vort ices formed when the control ihanged to pipe f low and the discharge through the spi l lway
decreased as much as 44 per cent. The vort ices decreased the f low unti l the head over the
crest reached ?D. Their effect at higher heads, i f any, was not noticeable. The appearance
of the vort ices and their effect on th6 f low are shown in Fig. VI-2. The results of this test
show that some type of vortex inhibitor is essential.
The spl i t ter type antl-vortex device shown in Fig. VI-1b was used for Series L'25, L-27 '
L -81 and L-33 . The sp l i t te r was 0 .?5D h igh except fo r Ser ies L -33 where the sp l i t te r was
ZO tt ig1r. The lower spi i t tur prevented vorte; formation unti l the spl i t ter became s'ubmerged.
Vort ic!s formed after submergence of the spl i t ter and caused reductions in the spi l lway eapal
city. When the spl i t ter height #as raised, ai for Series L-33, vortex formation was el iminated
or reduced to such an exient that any effect on the f low could not be detected. This proved
true even after the higher spl i t ter wLs completely submelged-.--A^ comparison of the vortex
formation at identical"heads is presented in Fig.VI-3. In Fig. VI-3a air is sucked in through
the vortex, while in Fig. VI-3b the vortex tendency appears as a small dimple in the water
surface through which, according to the notes, sl ight amounts of air were sucked in at rare
intervals.
38
APPARATUS AND PROCEDURE
The apparatus and the test procedure used for the tests described here are identical to that described in Part V for the series subsequent to Series L-19.
DESCRIPTION OF FLOW
As the flow through the spillway increases from zero, the first condition noted i s weir flow over the drop inlet crest with the condu it flowing only partly full and little air flow. An increase in the rate of flow next produces the condition of weir flow over the drop inlet crest with the conduit first containing slugs or traveling hydraulic jumps which suck air in through
-the drop inlet as they travel down the conduit. Further increases in the flow increase the frequency of the slugs until the conduit is flowing continuously full of a n air-water mixture. The final flow condition is reached when the water flow is sufficient to replace the air flow, after which the spill way flows continuously full and the discharge then is computed as for a pipe.
TABLE VI-2
PIEZOMETER LOCATIONS AND LOCAL PRESSURE DEVIATION
FROM HYDRAULIC GRADE LINE, SERIES L-25 TO L-33
Piezometer Series L-25 L-26 L-27 L-28 L-29 L-30 L-31 L-32 L-33
Looation Station h/hvp
Right" No. 2r& +1.38 +1.36 +1.35 +1.39 +1.41 +1.33 +1.28 +1.41 +1.26 • No. 2ba
+1·37 +1.34 +1.37 +1. 32 +1.41 +1.34 +1.28 +1.39 +1.22 Upstream
Crown No. 3b +0.12 +0.07 -0.02 +0.11 +0. 13 - 0.12 -0·09 +0.02 -0.11
In-vert 0/2 +0 . 20 +0.08 +0.07 +0.10 +0.09 +0.08 -0 . 01 +0.05 -0.01 Invert 20 +0.16 +0.10 +0.10 +0.13 +0.12 +0.10 +0 . 03 +0 . 04 +0.03 Invert 60 +0.03 +0.01 +0 . 01 +0.01 +0.03 -0.02 -0.05 -0.06 -0.06 Invert 100 +0.05 +0.02 +0.03 +0.04 +0.05 +0.03 +0.01 0.00 0.00
Invert 300 +0 .01 - 0 .01 -0.01 0.00 +0 .01 +0.00 - 0.02 -0.02 - 0 .04 Invert 54D -0.03 - 0.02 -0.05 -0.04 - 0 . 05 - 0 . 05 -0 . 06 -0.06 -0.06 Invert 700 - 0 .03 - 0.04 - 0 .06 - 0 . 06 - 0 .06 - 0 .08 -0.06 - 0.07 - 0 . 07 Invert 980 - 0 . 03 - 0 . 03 - 0 .04 - 0 . 04 - 0 . 04 -o.ol, - 0 . 04 - 0 .04 - 0 . 04
·Side of d rop i nlet . QAt - 0/ 2 . bAt 0/ 2 .
It should be espec ially noted that , through the use of circular drop inlets and conduit entrances of the type described, a drop inlet only 2D deep gives comple t ely satisfactory flow conditions. In each case, t here were no headpool fluctuations, no multiple discharge at any head, and the trar.sition from weir control to pipe control wa s abrupt and satisfactory.
The performance of the anti - vortex devices received considerable attention and will be described in detail.
No anti-vortex device at all was used for Series L-26. A study of the experimental rating curve (see Fig. VII-I) and the notes taken during the experiments show that the spillway performance was satisfactory as long as weir flow existed over the drop inlet crest. However, vortices formed when the control changed to pipe flow and the discharge through the spillway decreased as much as 44 per cent. The vortices decreased the flow until the head over the crest reached 7D. Their effect at higher heads, if any, was not noticeable. The appearance of the vortices and their effect on the flow are shown in Fig. VI-2. The results of this test show that some type of vortex inhibitor is essential.
The splitter type anti -vortex device shown in Fig. VI-Ib was used for Series L-25, L-27, L-31 and L-33. The splitter was D.75D high except for Series L-33 where the splitter was 2D high. The lower splitter prevented vortex formation until the splitter became submerged. Vortices formed after submergence of the splitter and caused reductions in the spillway capacity. When the splitter height wa s raised, as for Series L-33, vortex formation was eliminated or reduced to such an extent that any effect on the flow could not be detected. This proved true even after the higher splitter was completely submerged. A comparison of the vortex formation at identical heads is presented in Fig. VI-3. In Fig. VI-3a air is sucked in through the vortex, while in Fig. VI - 3b the vortex t endency appears as a small dimple in the water surface through which, according to the notes , slight amounts of air were sucked in at rare intervals.
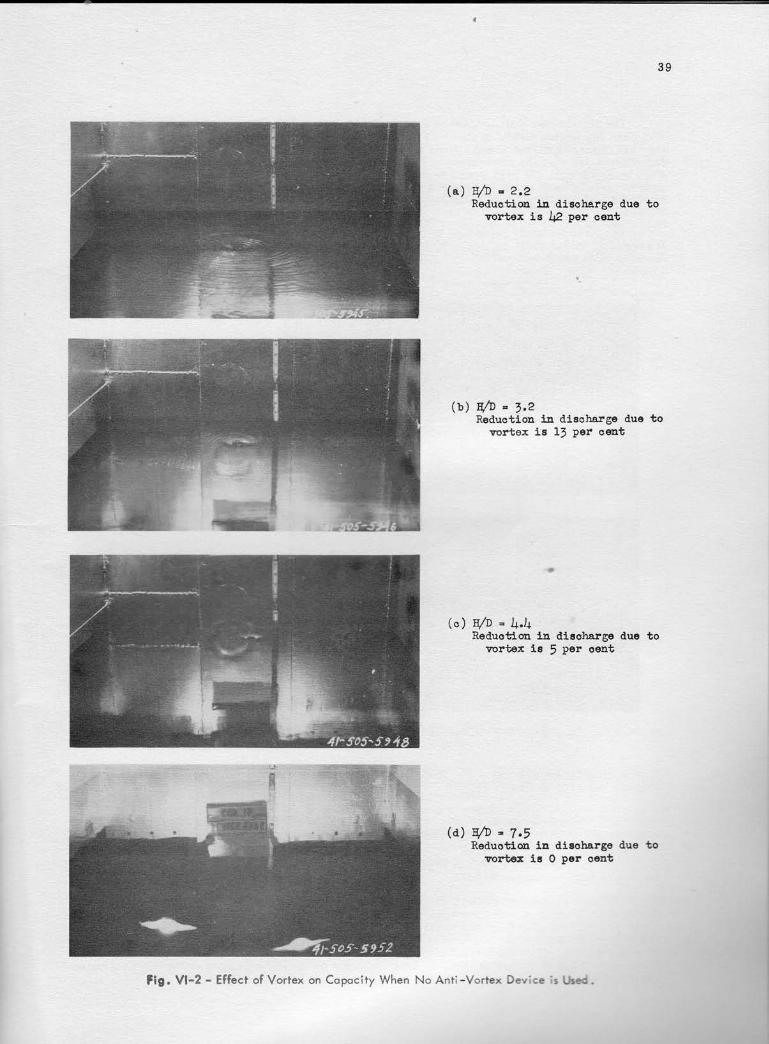
3 9
(a) a/o - 2.2Reduction in disoharge due to
vortex ls 12 per cont
(v) nlo - 3.2Reductiou La dlscharge due to
vortox la 1] per oeat
a
(a) {o - 4.4Red.uotlqa ln dieoharge due to
vortex le ! per oent
(a) s/b - 7.5Reduotlou ln dieobargo tlue
vortex ic O per oent
Flg. Vl-2 - Effect of Vortex on Copocity When No Anti -Vortex Device is tJred.
39
(a) H/D .. 2.2 Reduction in discharge due to
vortex is 42 per cent
t.
(b) H/D " 3.2 Reduction in discharge due to
vortex is 13 per cent
(0) HID " 4.4 Reduotion in disoharge due to
vortex is 5 per oent
(d) H/D " 7.5 Reduotion in disoharge due to
vortex is 0 per oent
fIg. VI-2 - Effect of Vortex on Copacity When No Anti -Vortex Dev'ce's sec.
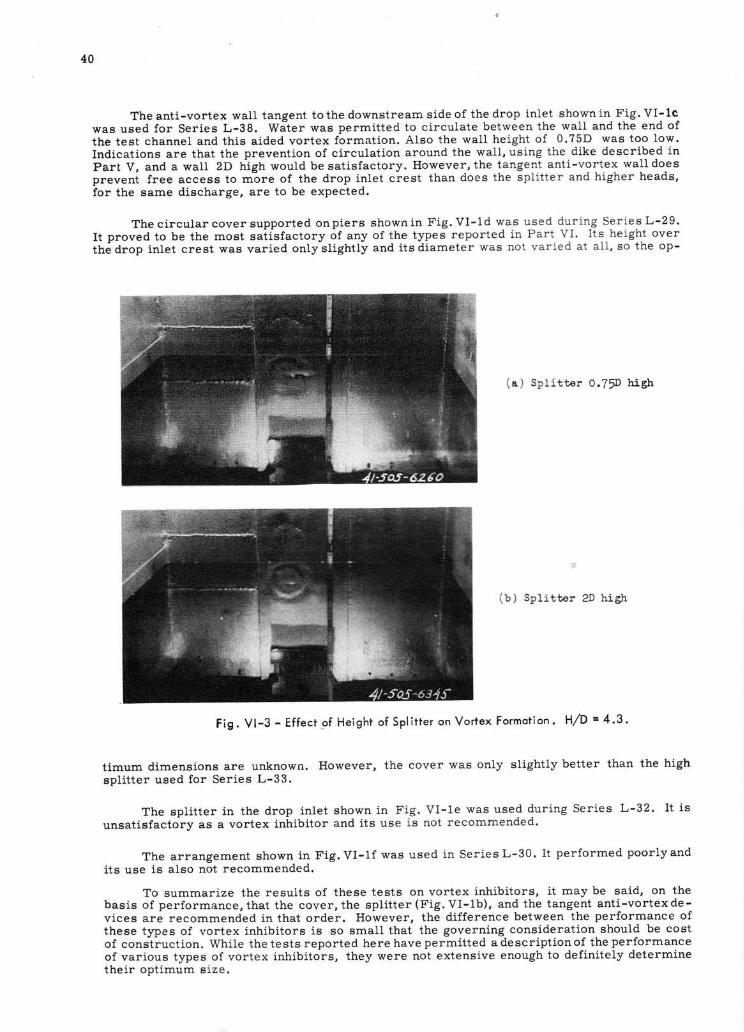
4 0
The anti-vortex wall tangent tothe downstream side of the drop inlet shownin { ig. VI-1c^
was used for Series L-38. Witer was permitted to clrculate between the wall and the end of
the test channel and this aided vortex formation. Also the wall height of 0.?5D was too low.
Indications are that the prevention of circulat ion around the wall , using the dike described in
Part V, and a wall 2D high would be satisfactory. However, the tangent anti-vortex wall does
preveni free access to m-ore of the drop inlet crest than does the spl i t ter and higher heads,
for the same discharge, are to be expected.
The c i rcu la r cover suppor ted onp iers shownin F ig . V I -1d was used dur ing Ser ies L -29 .
It proved to be the most sai isfactory of any of the types reported in Part Vl. I ts height over
the drop inlet crest was varied only sl ightly and i ts diameter was not varied at aII , so the op-
(a) SpLitter o./ !D high
(b) Spl i t ter 2D high
Fig. Vl -3 - Ef fect of Height of Spl i t ter on Vortex Formot ion, H/D = 4 '3 '
t imum dimensions are unknown. However, the cover was only sl ightly better than the high
sp l i t te r used fo r Ser ies L -33 .
The spl i t ter in the drop inlet shown in Fig. VI- le was used during Series L-32. I t is
unsatisfactory as a vortex inhibitor and i ts use is not recommended.
The ar rangement shown in F ig .V I -1 f was used in Ser iesL-30. i t per fo rmed poor lyand
its use is also not recommended.
To summarize the results of these tests on vortex inhibitors, i t may be said, on thebasis of performance, that the cover, the spl i t ter (Fig. VI-1b), and the tangent anti-vortex de-vices are recommended in that order. However, the dif ference between the performance ofthese types of vortex inhibitors is so small that the governing consideration should be cost
of conslruct ion. While the tests reported here have permitted a descript ion of the performance
of various types of vortex inhibitors, they were not extensive enough to definitely determinetheir optimum size.
40
The anti-vortex wall tangent to the downstream side of the drop inlet shown in Fig. VI-lc was used for Series L-38. Water was permitted to circulate between the wall and the end of the test channel and this aided vortex formation. Also the wall height of O. 75D was too low. Indications are that the prevention of circulation around the wall, using the dike described in Part V, and a wall 2D high would be satisfactory. However, the tangent anti-vortex wall does prevent free access to more of the drop inlet crest than does the splitter and higher heads, for the same discharge, are to be expected.
The circular cover supported onpiers shown in Fig. VI-ld was used during Series L-29. It proved to be the most satisfactory of any of the types reported in Part VI. Its height over the drop inlet crest was varied only slightly and its diameter was not varied at all, s o the op-
(a. ) Splitter O.75D high
(b ) Splitter 2D high
Fig. VI-3 - Effect _of Height of Splitter on Vortex Formation. HID = 4.3.
timum dimensions are unknown. However, the cover was only slightly better than the high splitter used for Series L-33.
The splitter in the drop inlet shown in Fig. VI-Ie was used during Series L-32. It is unsatisfactory as a vortex inhibitor and its use is not recommended.
The arrangement shown in Fig. VI-lf was used in SeriesL-30. It performed poorly and its use is also not recommended.
To summarize the results of these tests on vortex inhibitors, it may be said, on the basis of performance, that the cover, the splitter (Fig. VI-Ib), and the tangent anti-vortex devices are recommended in that order. However, the difference between the performance of these types of vortex inhibitors is so small that the governing consideration should be cost of construction. While the tests reported here have permitted a description of the performance of various types of vortex inhibitors, they were not extensive enough to definitely determine their optimum size.
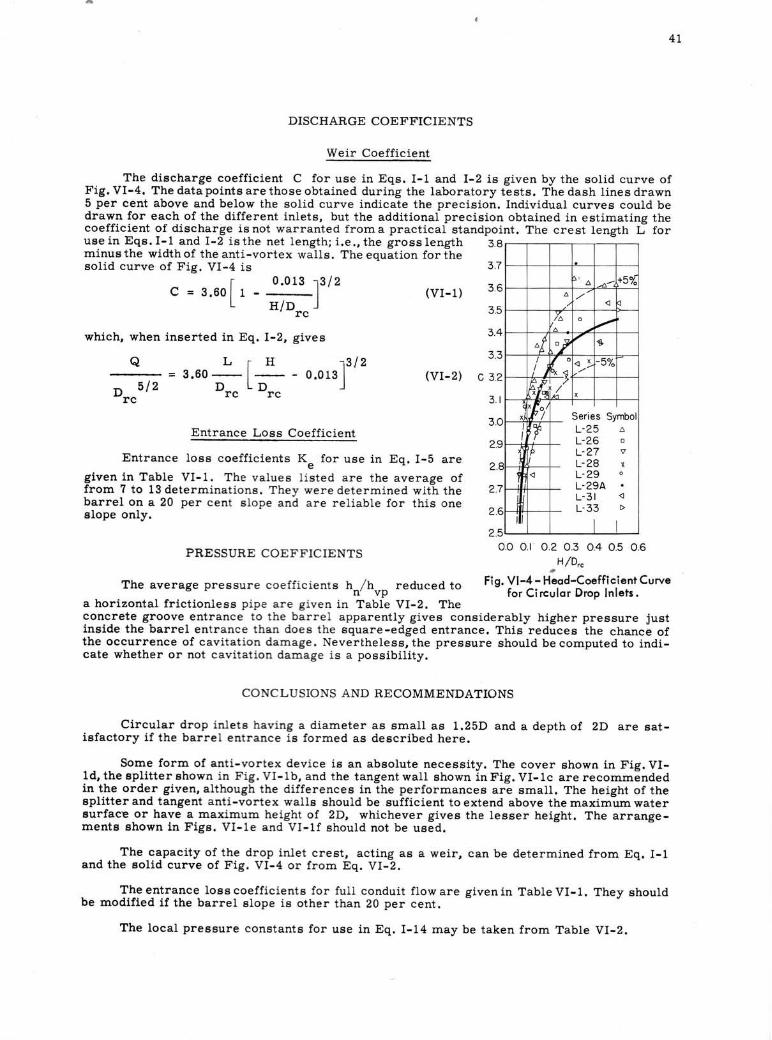
4 7
DISCHARGE COEFFICIENTS
Weir Coeff icient
The discharge coeff icient C for use in Eqs. I-1 and I-2 is given by the sol id curve ofFig. VI-4. The data points are those obtained during the laboratory tests. The dash l ines drawn5 per cent above and below the sol id curve indicate the precision. Individual curves could bedrawn for eaeh of the different inlets, but the additional precision obtained in estimating thecoefficient of discharge isnot warranted froma practical standpoint. The crest length L foru s e i n E q s . I - 1 a n d I . 2 i s t h e n e t l e n g t h ; i . e . , t h e g r o s s l e n g t h 3 . 8 mminus the width of the anti-vortex walls. The equation for the | | | | | | |solid curve of Fig. VI-4 is
c = s . 6 o [ rL
0 . 0 1 3
H1D' r c
7 7
? A
3.4which, when inserted in Eq. I-2, givee
) ' ' '
. 3 l 2o.o13l
(vr-1)
(V I -z ) c 32
3 l
3.O
z.J
a L p H= 3 . 6 0 - l
5 1 2 D , L D r "-rc rc
Entrance Loss Coefficient
Entrance loss coefficlents K. for use in Eq. I-5 aregiven in Table VI-1. The values l isted are the average offrom 7 to 13 determinations. They were determined with thebarrel on a 20 per cent elope and are reliable for this oneslope only.
PRESSURE COEFFICIENTS
2.7
o.o o.r 0.2 0.3 0.4 0.5 0.6A /D,"
a
The average preasure coefficients hr,/h'p reduced to ttn.ruJrt,rfr",:1-otf"nilt,;,ltCurve
a horizontal frictionless pipe are given in Table VI-2. Theconcrete groove entrance to the barrel apparently givee considerably higher pressure justinside the barrel entrance than does the square-edged entrance. This reduces the chance ofthe occurrence of cavitation damage. Nevertheless, the pressure should be computed to indi-cate whether or not cavitation domage is a possibil i ty.
CONCLUSIONS AND RECOMMENDATIONS
Circular drop inlete having a diameter as small as 1.25D and a depth ot 2D are sat-isfactory if the bamel entrance is formed as described here.
Some form of anti-vortex device ie an absolute necessity. The cover shown in Fig. VI-ld, the splitter shown in Fig. VI-lb, and the tangent wall shown in Fig. VI-1c are recommendedinthe orde-r given, although the differences in the performances are small. The height of theeplitter and tangent anti-vortex walla should be sufficient to extend above the maximum watergurface or have a maximum height of 2D, whichever gives the lesser height. The arrange-mentg shown in Fige. VI-1e and VI-1f should not be used.
_ , The capacity of the drop inlet crest, acting as a weir, can be determined from Eq. I-1and the solid curve of Fig. VI-4 or from Eq. VI-2.
Theentrance losscoefficiente for full conduit f loware givenin TableVI-1. They shouldbe modified if the barrel elope ie other than 20 per cent.
| - 9 5
L-26 ol -27 vL-28 xL'29 oL-29AL - 3 1L.33 D
The local pressure constants for use in Eq. I-14 may be taken from Table vl-z.
41
DISCHARGE COEFFICIENTS
Weir Coefficient
The discharge coefficient C for use in Eqs. 1-1 and 1-2 is given by the solid curve of Fig. VI-4. The data points are those obtained during the laboratory tests. The dash lines drawn 5 per cent above and below the solid curv e indicate the precision. Individual curves could be drawn for each of the different inlets , but the additional precision obtained in estimating the coefficient of discharge is not war r anted from a practical standpoint . The crest length L for use in Eqs. 1-1 and 1-2 is the net length; i.e., the gross length 3.8 minus the width of the anti-vortex walls . The equation for the solid curve of Fig. VI-4 is
[ 0.013 J3/2
C = 3.60 1 - --HID rc
which, when inserted in Eq. 1-2, gives
3.7
(VI-l) 3.6
3.5
3.4
Q L [ H J3/2 = 3.60 D -D - 0.013
3.3
(VI-2) C 3.2
Drc
5/2 rc rc
Entrance Loss Coefficient
Entrance loss coefficients K for use in Eq. 1-5 are e given in Table VI- l. The va lue s listed are the average of from 7 to 13 determinations. They were determined with the barrel on a 20 per cent s lope and a re re liable for this one slope only.
3.1
3.0
2.9
2.8
2.7
2.6
2.5
. 6 ...,.- +5%
" ./ / ' <J 9
16 0 V " "I "I ", 1>
I I{ 0 ~~ - 5"10
I !9~ ~ !1~xl x
~ 'F~ x I Series Symbol
I ! ~ L-25 6
L-26 a
x If> L-27 'V
I L-28 1
<J L-29 0
L-29A . I L-31 <J
L-33 I>
II I I
PRESSURE COEFFICIENTS 0.0 0 .1 02 0.3 OA 0 .5 0 .6
H/ D,c
--The average pressu r e coeffic ients h I h reduced to n vp Fig. VI-4 - Head-Coefficient Curve
for Ci rcular Drop Inlets. a horizontal frictionless pipe are given in Table VI-2 . The concrete groove entrance to the ba rre l apparently gives considerably higher pressure just inside the barrel ent r a nce than doe s the square-edged entrance. This reduces the chance of the occurrence of cavitation damage . Nevertheless, the pressure should be computed to indicate whether or not cavita tion damage i s a possibility.
CONCLUSIO NS AND RECOMMENDATIONS
Circular drop inle t s having a d iameter as small as 1.25D and a depth of 2D are satisfactory if the barre l e nt rance i s formed as described here.
Some form of anti - vo rtex device i s an absolute necessity. The cover shown in Fig. VI-1d,the splitter shown in F ig. VI-1b, and the tangent wall shown inFig. VI-1c are recommended in the order given, alt hough the differences in the performances are small. The height of the splitter and tangent anti -vorte x walls should be sufficient to extend above the maximum water surface or have a maxim um he ight of 2D, whichever gives the lesser height. The arrangements shown in Figs. VI-1e a nd VI-lf should not be used.
The capacity of the drop inlet crest, acting as a weir, can be determined from Eq. 1-1 and the solid curve of Fig. VI-4 o r from Eq. VI-2 .
The entrance loss coeffic ient s for full conduit flow are given in Table VI-l. They should be modified if the barrel slope i s other than 20 per cent.
The local pressure const ants for use in Eq. 1-14 may be taken from Table VI-2.
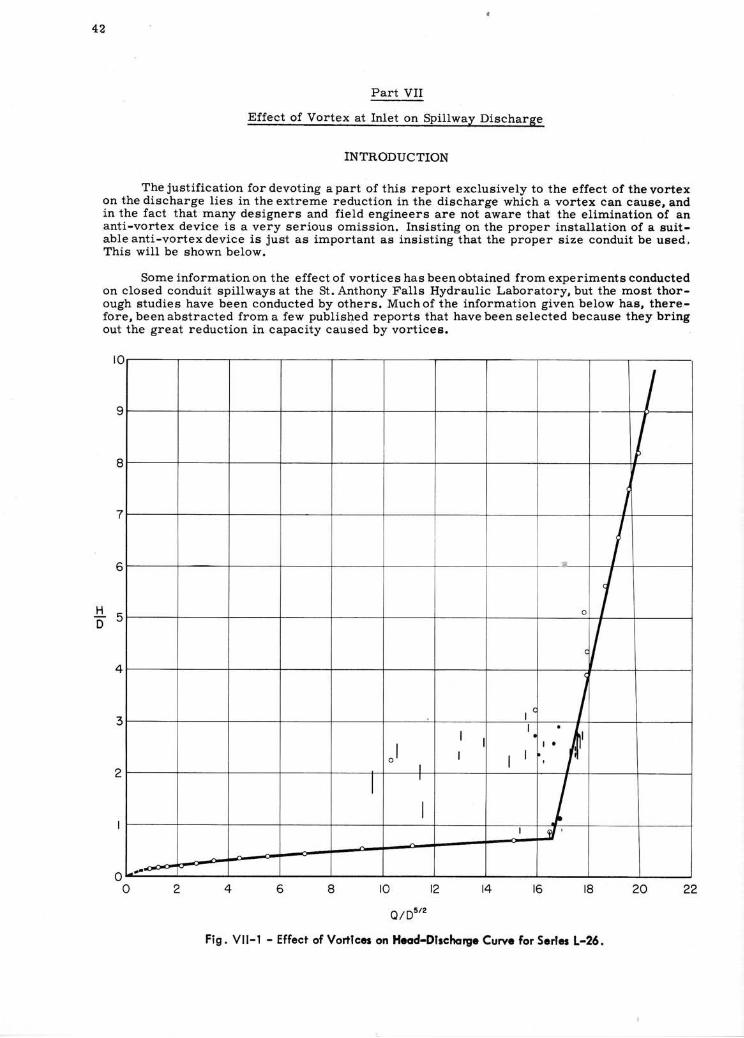
42
Part VII
Effect of Vortex at Inlet on Spil lwav Discharpe
INTRODUCTION
The justification for devoting a part of this report exclusively to the effect of the vortexon the discharge lies in the extreme reduction in the discharge which a vortex can cause, andin the fact that many designers and field engineers are not aware that the elimination of ananti-vortex device is a very serious omission. Insisting on the proper installation of a suit-ableanti-vortexdevice is just as important as insisting that the proper size conduit be used,This will be shown below.
Some information on the effect of vortices has been obtained from experiments conductedon closed conduit spillways at the St. Anthony Falls Hydraulic Laboratory, but the most thor-ough studies have been conducted by others. Muchof the information given below has, there-fore, been abstracted from a few published reports that have been selected because they bringout the great reduction in capacity caused by vortices.
Q/D5 /2
Fig. Vll-l - Effcct of Vo*lccr on Hcod-Dftchorgc Curvc for Scrlcr L-26.
HD
42
Part VII
Effect of Vortex at Inlet on Spillway Discharge
INTRODUCTION
The justification for devoting a part of this report exclusively to the effect of the vortex on the discharge lies in the extreme reduction in the discharge which a vortex can cause, and in the fact that many designers and field engineers are not aware that the elimination of an anti-vortex device is a very serious omission. Insisting on the proper installation of a suitable anti-vortex device is just as important as insisting that the proper size conduit be used , This will be shown below.
Some information on the effect of vortices has been obtained from experiments conducted on closed conduit spillways at the St. Anthony Falls Hydraulic Laboratory, but the most thorough studies have been conducted by others. Muchof the information given below has, therefore, been abstracted from a few published reports that have been selected because they bring out the great reduction in capacity caused by vortices.
10
9
8
7
6
H 5 D
4
3
2
o o
........ 2
I
J
.,. I o f ,V
I ( )
I . I I of'
01
I
I I I , I
I I
j I I .1/ '
4 6 8 10 12 14 16 18 20 22
Fig. VII-l - Effect of VortIces on Head-DIscharge Curve for SerIes L-26.
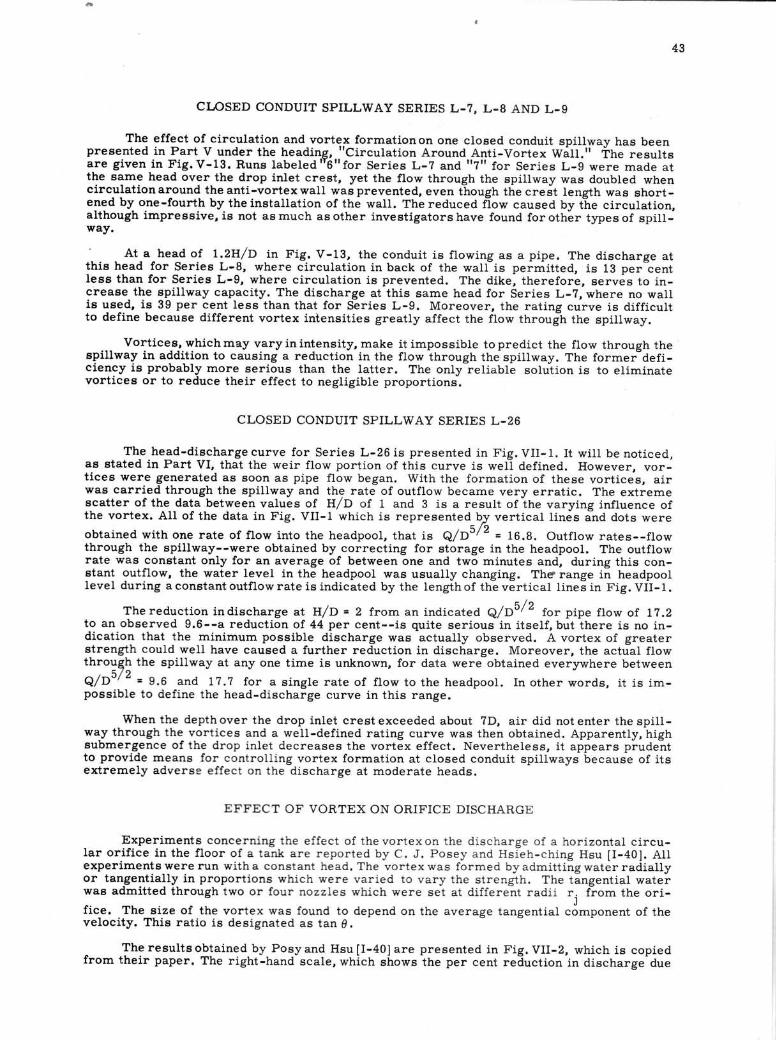
43
CI.OSED CONDUIT SPILLWAY SERIES L.?, L.8 AND L-9
The effect of circulation and vortex formationon one closed conduit spillway has beenpresented in Part V under the heading, t 'Circulation Around Anti-Vortex WiU." ihe resultsare g iven in F ig.V-13. Runs labeledt t6t t for Ser ies L-? and t '? t ' for Ser ies L-9 were made atthe same head over the drop inlet crest, yet the flow through the spillway was doubled whencirculation around the anti-vortex wall \ras prevented, even though the creit length was ghort-ened by one-fourth by the installation of the wall. The reduced flow caused by tle circulation,although impressive, is not ag much as other investigators have found for othlr types of spill-way.
' At a head of l.zH/D in Fig. V-13, the conduit is f lowing as a pipe. The discharge at
this head for Series L-8, where circulation in back of the walf is permitted, is 13 perlentless than for Series L-9, where circulation is prevented. The dike, therefore, serves to in-crease the epil lway capacity. The discharge at this same head for Series L-?, where no wallis used, is 39 per cent less than that for Series L-9. Moreover, the rating curve is diff icultto define because different vortex iniensities greatly affect the flow through the spillway.
Vortices, which may vary in intensity, make it impossible to predict the flow through thespillway in addition to causing a reduction in the flow through thespiltway. The formeidefi-ciency is probably more serious than the latter. The onlyleliable solution is to eliminatevortices or to reduce their effect to negligible proportions.
CLOSED CONDUIT SPILLWAY SERIES L.26
The head-dischargecurve for Ser ies L-26is presented in F ig.VI I -1. I t wi l l benot iced,as stated in Part VI, that the weir f low portion of this curve is wef defined. However, vor-tices were generated as soon as pipe flow began. With the formation of these vortices, airwae carried through the spil lway and the rate of outflow became very ematic. The extremescatter of the data between values of H/D of 1 and 3 is a result ofihe varying influence ofthe vortex. All of the data in Fig. VII-1 which is represented by vertical l ines and dots wereobtained with one rate of f low into the headpool, that ia q/95/2 = 16.8. Outflow rates--flowthrough the spillway--were obtained by correcting for storage in the headpool. The outflowrate waa constant only for an average of between one and two minutes and, during this con-stant outflow, the water level in the headpool was usually changing. The range in headpoollevel during a constant outflow rate is indicated by the length of the vertieal linei in Fig. VII- 1.
Thereduction indischarge at H/o = 2 from an indicated q/o5/2 for pipe flow of 1?.2to an observed 9.6--a reduction of 44 per cent--is quite serious in itself, but there is no in-dication that the minimum possible discharge was actually observed. A vortex of greaterstrength could well have caused a further reduction in discharge. Moreover, the actual flowthrouqh the spillway at any one time is unknown, for data were obtained everywhere betweenq/O'/ '- 9.6 and l?.? for a single rate of f low to the headpool. In other words, it is im-possible to define the head-discharge curve in this range.
W'henthe depthover the drop inlet crestexceeded about ?D, air did notenter thespil l-way through the vortices and a well-defined rating curve was then obtained. Apparently, highsubmergence of the drop inlet decreases the vortex effect. I{evertheless, it appears piudentto provide meana for controlling vortex formation at closed conduit spillways because of itsextremely adverse effect on the discharge at moderate heads.
EFFECT OF VORTEX ON ORIFICE DISCHARGE
Tlxperiments concerning the effect of the vortex on the discharge of a horizontal circu-Iar orif ice in the floor of a tank are reported by C. J. Posey and Hsieh-ching Hsu [I-40]. A1lexperiments were run with a constant head. The vortex was formed by adrnitting water radiallyor tangentially in proportions which were varied to vary the strength. The tangential waterwag admitted through two or four nozzles which were set at different radii r. from the ori-fice. The size of the vortex was found to depend on the average tangential component of thevelocity. This ratio is designated as tan 0.
The resultsobtained by Posyand Hsu [I-40] are presented in Fig, VII-2, which is copiedfrom their Paper. The right-hand scale, which showslhe per cent reduction in discharge due
43
CLOSED CONDUIT SPILLWAY SERIES L-7, L-8 AND L-9
The effect of circulation and vortex formation on one closed conduit spillway has been presented in Part V under the headin~, "Circulation Around Anti-Vortex Wall." The results are given in Fig. V-13. Runs labeled I 6"for Series L-7 and "7" for Series L-9 were made at the same head over the drop inlet crest, yet the flow through the spillway was doubled when circulation around the anti-vortex wall was prevented, even though the crest length was shortened by one-fourth by the installation of the wall. The reduced flow caused by the circulation, although impressive, is not as much as other investigators have found for other types of spillway.
At a head of 1.2H/D in Fig. V-13, the conduit is flowing as a pipe. The discharge at this head for Series L-8, where circulation in back of the wall is permitted, is 13 per cent less than for Series L-9, where circulation is prevented. The dike, therefore, serves to increase the spillway capacity. The discharge at this same head for Series L-7, where no wall is used, is 39 per cent less than that for Series L-9. Moreover, the rating curve is difficult to define because different vortex intensities greatly affect the flow through the spillway.
Vortices, which may vary in intensity, make it impossible to predict the flow through the spillway in addition to causing a reduction in the flow through the spillway. The former deficiency is probably more serious than the latter. The only reliable solution is to eliminate vortices or to reduce their effect to negligible proportions.
CLOSED CONDUIT SPILLWAY SERIES L-26
The head-discharge curve for Series L-26 is presented in Fig. VII-l. It will be noticed, as stated in Part VI, that the weir flow portion of this curve is well defined. However, vortices were generated as soon as pipe flow began. With the formation of these vortices, air was carried through the spillway and the rate of outflow became very erratic. The extreme scatter of the data between values of H/ D of 1 and 3 is a result of the varying influence of the vortex. All of the data in Fig. VII-I which is represented ~ vertical lines and dots were
obtained with one rate of flow into the headpool, that is Q/ D5 2 = 16.8 . Outflow rates--flow through the spillway--were obtained by correcting for storage in the headpool. The outflow rate was constant only for an average of between one and two minutes and, during this constant outflow, the water level in the headpool was usually changing. The" range in headpool level during a constant outflow rate is indicated by the length of the vertical lines in Fig. VII-I.
The reduction in discharge at H/ D = 2 from an indicated Q/ D5/ 2 for pipe flow of 17.2 to an observed 9.6--a reduction of 44 per cent--is quite serious in itself, but there is no indication that the minimum possible discharge was actually observed. A vortex of greater strength could well have caused a further reduction in discharge. Moreover, the actual flow throu,h the spillway at anyone time is unknown, for data were obtained everywhere between
Q/ D5 2 = 9.6 and 17.7 for a single rate of flow to the headpool. In other words, it is impossible to define the head-discharge curve in this range.
When the depth over the drop inlet crest exceeded about 7D, air did not enter the spillway through the vortices and a well-defined rating curve was then obtained. Apparently, high submergence of the drop inlet decreases the vortex effect. Nevertheless, it appears prudent to provide means for cont roll ing vortex formation at closed conduit spillways because of its extremely adverse effe ct on t he discharge at moderate heads.
EFFE CT OF VORTEX ON ORIFICE DISCHARGE
Experiments concerning the e ffect of t he vort e x on the discharge of a hor i zontal circular orifice in the floor of a t a nk are r eported by C. J . Posey and Hs ieh-ching Hsu [1-40]. All experiments were run with a const ant he a d. The vo r t ex was fo rmed by adm itt ing water radially or tangentially in proportions which were va r ie d to vary t he s t r e ngth . The tangential water was admitted through two or fo u r nozzles which were set at different radi i r . from the ori-
J fice. The size of the vorte x was found to depend on the average tangential component of the velocity. This ratio is des ignated as tan ().
The results obtained by Posy and Hsu [1-40] are presented in Fig. VII-2, which is copied from their paper. The right-hand scale, which shows the per cent reduction in discharge due
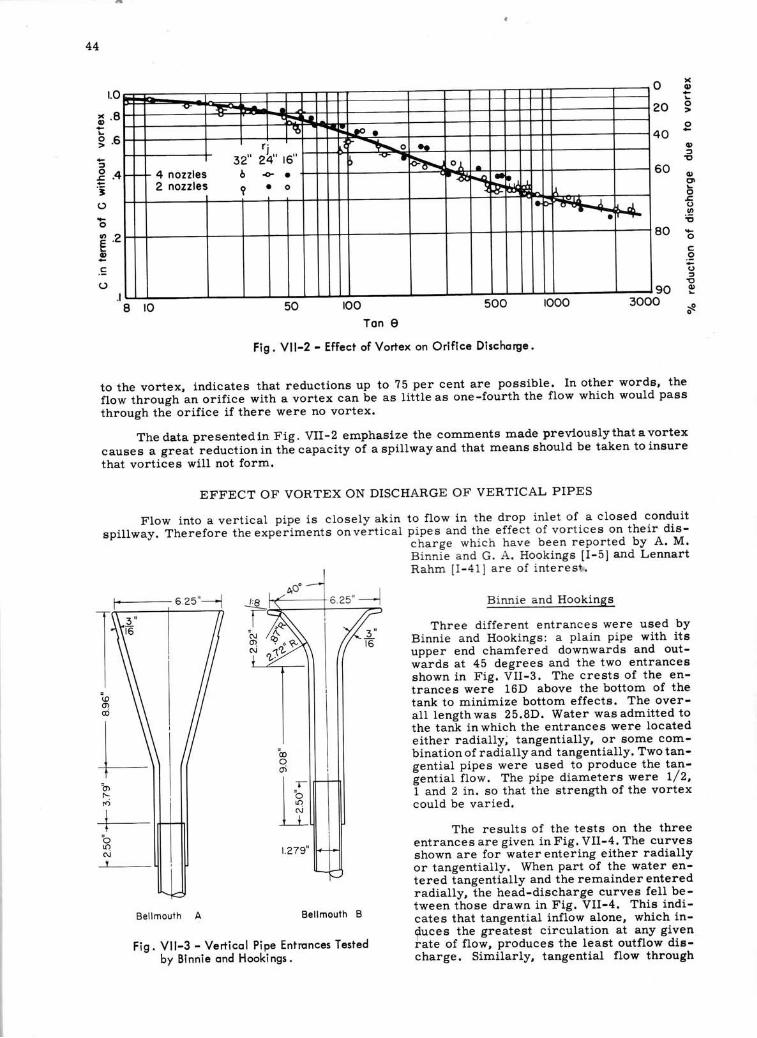
44
r.o o 5
2 0 9o
4 0 -oat,
60
80
=2 . c=3o
o9 . 2g
o
,Eo
octl
c,E().9!,
oc.9oa
!o-J 90
3000
J
.c .to o| ( i-+ sz" zlq" rc"
4nozz les 6 + o2 n o z z l e s ? . o
t : o O.a t-T- o l
4 -l t I
oi], t t
a s
5 . 8t9 . 6
50 too
FIow into a vert ical pipe is closely akin
spi l lway. Therefore the experiments onvert ical
ro 500 roooTon I
Fig. Vlt-2 - Effect of Vortex on Orif ice Dischorge.
to the vortex, indicates that reductions up to ?5 per cent are possible-.- In other words, the
ilow through an orifice with a vortex c"n te as liftle as one-fourth the flow which would pass
through the orif ice if there were no vortex.
The data presentedin Fig. VII-2 emphasize the commentg made prevlouslythat avortex
causes a greaf reductionin th6capacity ol aspil lwayand that meanashould be taken toinsure
that vortices will not form.
EFFECT OF VORTEX ON DISCHARGE OF VERTICAL PIPES
to flow in the drop inlet of a closed conduitpipes and the effect of vortices on their dis--charge
which have been reported by A. M.Binnie and G. A. Hookings [I-5] and LennartRahm II-41] are of interesk
Binnie and Hookings
Three different entrances were used byBinnie and Hookings: a plain pipe with iteupper end chamfered downwards and out-wards at 45 degrees and the two entrancesshown in Fig. VII-3. The crests of the en-trances were 16D above the bottom of thetank to minimize bottom effects. The over-a l l lengthwas 25.8D. Water wasadmit ted tothe tank inwhich the entrances were locatedeither radially, tangentiallyl or Eorrr€ cotrr-bination of radially and tangentially. Two tan-gential pipes were used to produce the tan-
i""ti.r ir6*. The pipe diameters were t/2,1 and 2 in. so that the strength of the vortexcould be varied.
The results of the tests on the threeentrances are given in Fig. VII-4. The curvesshown are for water entering either radiallyor tangentially. When part of the water en-tered iangentially and the remainder enteredradially, the head-discharge curves. fell be-tween those drawn in Fig. VII-4. This indi-cates that tangential inflow alone, which in-{uces the greatest circulation at any giveniate of f low, produces the least outflow dis-charge. Similarly, tangential flow through
IIi
O)CD
\lo
It_r-oaNI
Bellmouth A Bellmouth B
Fig. Vll-3 - Verticol Pipe Entmnces Testedby Binnie ond Hookings.
-@
oot - -t lt = ^t | r )
t lt t
1.279"
. ~ -
44
1.0 "V"
~.8 ~ Io.R
o 20
)( Q) .... .. o >
~ ~o:::: ~. .... g .6 ~ 40
r' ~~O 32" 2~" 16" ~
"V" -.
t- 4 nozzles 0 -0- • .... ;:)
~ .4 2 nozzles
~ • 0 .... '3 u
.. ~ OJ, •
~ K : I-ro- i'A"
.J. l5i1on ~
I- ~ •
,J. .,...
60 Q) CJI ... o
..c:. o III ~
80 -o
.I 8 10 50 100 500
Ton e Fig. VII-2 - Effect of Vortex on Orifice Discharge.
1000 90
3000
to the vortex, indicates that reductions up to 75 per cent are possible. In other words, the flow through an orifice with a vortex can be as little as one -fourth the flow which would pass through the orifice if there were no vortex.
The data presented in Fig. VII-2 emphasize the comments made previously that a vortex causes a great reduction in the capacity of a spillway and that means should be taken to insure that vortices will not form.
EFFECT OF VORTEX ON DISCHARGE OF VERTICAL PIPES
Flow into a vertical pipe is closely akin to flow in the drop inlet of a closed conduit spillway. Therefore the experiments on vertical pipes and the effect of vortices on their dis
charge which have been reported by A. M. Binnie and G. A. Hookings [1-5] and Lennart Rahm [1 -4 1] are of interes.
b If)
N t
Bellmouth A
'00 o ai
11 1.279"
Bellmouth B
Fig. VII-3 - Vertical Pipe Entrances Tested by Binnie and Hookings.
Binnie and Hookings
Three different entrances were used by Binnie and Hookings : a plain pipe with its upper end chamfered downwards and outwards at 45 degrees and the two entrances shown in Fig. VII-3. The crests of the entrances were 16D above the bottom of the tank to minimize bottom effects . The overall length was 25.8D. Water was admitted to the tank in which the entrances were located either radially; tangentially, or some combination of radially and tangentially. Two tangential pipes were used to produce the tangential flow. The pipe diameters were 1/2, 1 and 2 in. so that the strength of the vortex could be varied.
The results of the tests on the three entrances are given in Fig. VII-4. The curves shown are for water entering either radially or tangentially. When part of the water entered tangentially and the remainder entered radially, the head-discharge curves fell between those drawn in Fig. VU-4. This indicates that tangential inflow alone, which in?uces the greatest circulation at any given rate of flow, produces the least outflow discharge. Similarly, tangential flow through
c: .2 ti ::J ~
~
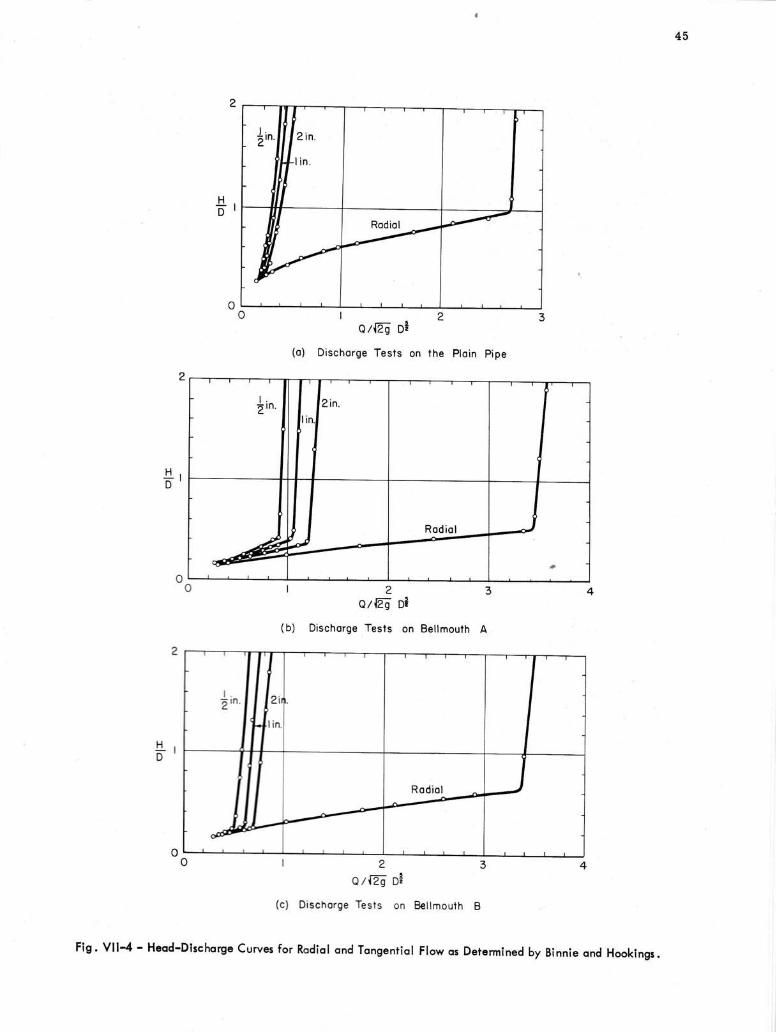
45
I'n
lIfi;r
Rodiol --'tf
HD l
o t 2 3o/ ' lZs 'Di
(o ) D ischorge Tes ts on the P lo in p ipe
i ,n
l/,U Rodio l
IJ
o 1 2 3 4o/{Zs' Dt
(b) Dischorge Tests on Bellmouth A
o f 2 3 4
oz{Zs oi(c) Dischorge Tests on Bellmouth B
Fig. Vll-4 - Heod-Dlschorge Curves for Rodiol ond Tongentiol Flow os Determined by Binnie ond Hookings.
H .E '
o
$ r
,/#JL ^F
R o d i o l )
2
.!::!.I D
H D
o o
2
o o
.!::!. D
~
I . 2 m.
-
2in.
I in .
2 Q/i2g Dt
(a) Discharge Tests an the Plain Pipe
I. 2 1n·
2in.
lin .
Radial
~~ ~
J
2 Q/{2g Di
3
(b) Discharge Tests on Bellmouth A
I
2i.
lin.
-~~ 2
Q/f2g D~
Radial
3
(c) Discharge Tests on Bellmouth B
3
~
..J
,.
4
,
.-J
4
Fig. VII-4 - Head-Discharge Curves for Radial and Tangential Flow as Determined by Binnie and Hookings.
45
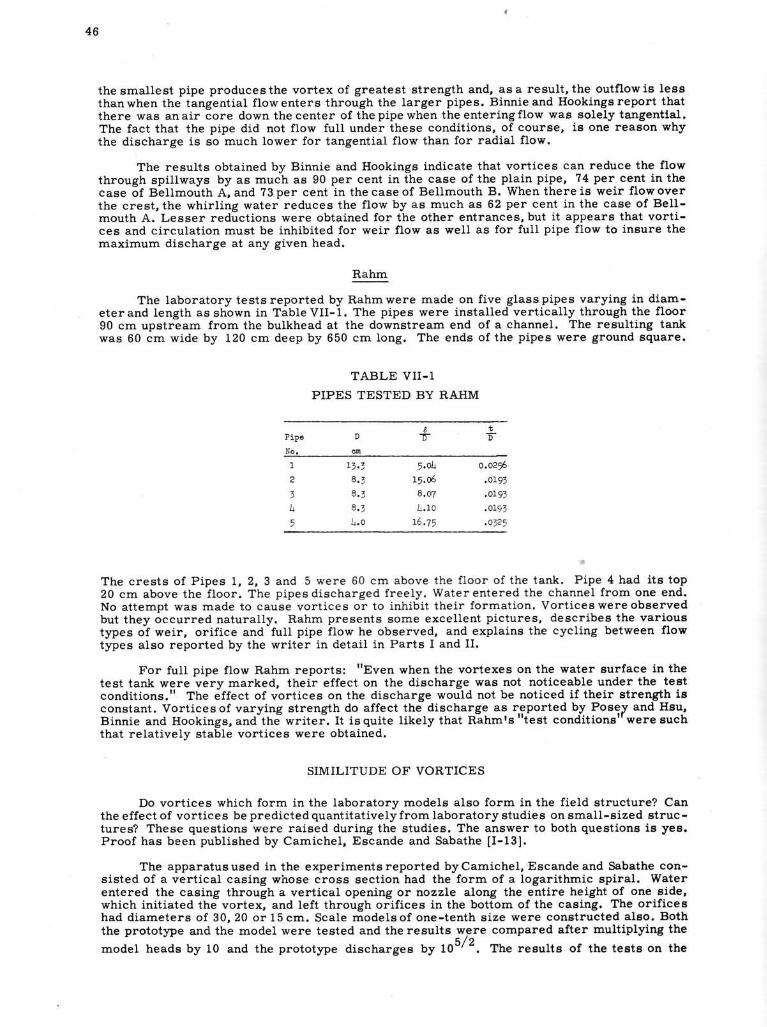
4 6
thesmallest pipe producesthe vortex of greatest strength and, asa result,the outflowis lessthanwhen the tangential f lowenters through the larger pipes. Binnieand Hookingsreport thatthere was anair core down thecenter of thepipewhen theenteringflow was solely tangentlal.The fact that the pipe did not flow full under these conditions, of course, is one reason whythe discharge is so much lower for tangential flow than for radial flow.
The results obtained by Binnie and Hookings indicate that vortices can reduce the flowthrough spil lways by as much as 90 per cent in the case of the plain pipe, 74 per cent in thecase of Bellmouth A, and ?3 per cent in the case of Bellmouth B. When there is weir f lowoverthe crest, the whirl ing water reduces the flow by as much as 62 per cent in the case of Bell-mouth A. Lesser reductions were obtained for the other entrances, but it appears that vorti-ces and circulation must be inhibited for weir flow as well as for full pipe flow to insure themaximum discharge at any gi.ven head.
Rahm
The laboratory testsreported by Rahmwere made on five glaespipes varying in diam-eterand length as shown in TableVII-1. The pipes were installed vertically through the floor90 cm upstream from the bulkhead at the downstream end of a channel. The resulting tankwas 60 cm wide by 120 cm deep by 650 cm long. The ends of the pipes were ground square.
TABLE VII.I
PIPES TESTED BY RAHM
Pip€
No.
D Dt
T-
I
t)1
5
8 . 1R 2
4 . 0
5.o11t5,a6
8.07
o.o2*.or9i
a
The crests of Pipes I, 2, 3 and 5 were 60 cm above the floor of the tank. Pipe 4 had its top20 cm above the floor. The pipes discharged freely. Water entered the channel from one end.No attempt was made to cause vortices or to inhibit their formation. Vortices were observedbut they occurred naturally. Rahm presents some excellent pictures, deecribes the varioustypes oi weir, orif ice and-full pipe flow he observed, and explains the cycling between flowtypes also reported by the writer in detail in Parts I and II.
For full pipe flow Rahm reports: "Even when the vortexes on the water surface in thetest tank were very marked, their effect on the discharge was not noticeable under the testconditions." The dffect of vortices on the discharge would not be noticed if their strength ieconstant. Vorticesof varying strength do affect the discharge as r.eported by Posey and Heu,Binnie and Hookings, and the writer. It is quite l ikely that Rahmrs "test conditions" were suchthat relatively stable vortices lrtere obtained.
SIMILITUDE OF VORTICES
Do vortices which form in the laboratory models also form in the field structure? Canthe effect of vortices be predictedquantitativelyfrom laboratory studies on small-sized struc-tures? These questions were raised during the studies. The answer to both questions is yee.Proof has been published by Camichel, Escande and Sabathe [I-13].
The apparatus used in the experiments reported by Camichel, Escande and Sabathe con-sisted of a vertical casing whose cross section had the form of a logarithmic spiral. Waterentered the casing through a vertical opening or nozzLe along the entire height of one side,which initiated the vortex, and left through oiifices in the bottom of the casing. The orificeshad d iameters of 30,20 or 15cm. Scale modelsof one- tenth s ize were constructed a lso. Boththe prototype and the model were tested and the results
;vfrre compared after multiplying the
model heads by 10 and the prototype discharges by tO"t '. The results of the teets on the
46
the smallest pipe produces the vortex of greatest strength and, as a result, the outflow is less than when the tangential flow enters through the larger pipes. Binnie and Hookings report that there was an air core down the center of the pipe when the entering flow was solely tangential. The fact that the pipe did not flow full under these conditions, of course, is one reason why the discharge is so much lower for tangential flow than for radial flow.
The results obtained by Binnie and Hookings indicate that vortices can reduce the flow through spillways by as much as 90 per cent in the case of the plain pipe, 74 per cent in the case of Bellmouth A, and 73 per cent in the case of Bellmouth B. When there is weir flow over the crest, the whirling water reduces the flow by as much as 62 per cent in the case of Bellmouth A. Lesser reductions were obtained for the other entrances, but it appears that vortices and circulation must be inhibited for weir flow as well as for full pipe flow to insure the maximum discharge at any given head.
Rahm
The laboratory tests reported by Rahm were made on five glass pipes varying in diameter and length as shown in Table VII-I. The pipes were installed vertically through the floor 90 cm upstream from the bulkhead at the downstream end of a channel. The resulting tank was 60 cm wide by 120 cm deep by 650 cm long. The ends of the pipes were ground square.
TABLE VII-l
PIPES TESTED BY RAHM
e t Pipe D D D No . em
13.; 5.04 0.0256 2 8·3 15.06 .0193
3 8·3 8.07 .0193
4 8.3 4 .1 0 .0193
5 4.0 16.75 .0325
The crests of Pipes I, 2, 3 and 5 were 60 cm above the floor of the tank. Pipe 4 had its top 20 cm above the floor. The pipes discharged freely. Water entered the channel from one end. No attempt was made to cause vortices or to inhibit t heir formation. Vortices were observed but they occurred naturally. Rahm presents some excellent pictures, describes the various types of weir, orifice and full pipe flow he observed, and explains the cycling between flow types also reported by the writer in detail in Parts I and II.
For full pipe flow Rahm reports: "Even when the vortexes on the water surface in the test tank were very marked, their effect on the discharge was not noticeable under the test conditions." The effect of vortices on the discharge would not be noticed if their strength is constant. Vortices of varying strength do affect the discharge as reported by Pose?, and Hsu, Binnie and Hookings, and the writer. It is quite likely that Rahm's "test conditions' were such that relatively stable vortices were obtained.
SIMILITUDE OF VORTICES
Do vortices which form in the laboratory models also form in the field structure? Can the effect of vortices be predicted quantitatively from laboratory studies on small-sized structures? These questions were raised during the studies. The answer to both questions is yes. Proof has been published by Camichel, Escande and Sabathe [1-13).
The apparatus used in the experiments reported by Camichel,Escande and Sabathe consisted of a vertical casing whose cross section had the form of a logarithmic spiral. Water entered the casing through a vertical opening or nozzle along the entire height of one side, which initiated the vortex, and left through orifices in the bottom of the casing. The orifices had diameters of 30,20 or 15 cm. Scale models of one-tenth size were constructed also. Both the prototype and the model were tested and the results were compared after multiplying the
model heads by 10 and the prototype discharges by 105/ 2 . The results of the tests on the
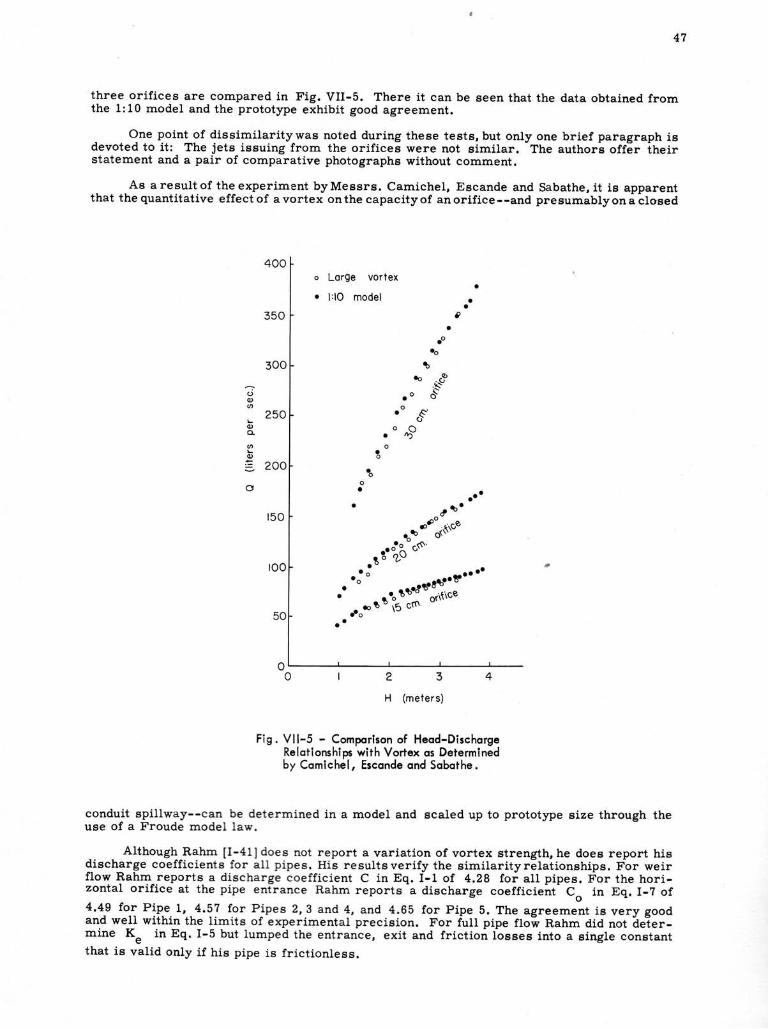
4 7
three ori.fices are compared in Fig. VII-5. There it can be seen that the data obtained fromthe 1:10 model and the prototype exhibit good agreement.
One point of dissimilarity-was noted during these tests, but only one brief paragraph iedevoted to it: The jets issuing from the orifices were not similar.
-The authorl off6r ineir
statement and a pair of comparative photographs without comment.
As aresultof theexperiment byMessrs. Camichel, Escande and Sabathe, it is apparentthat the quantitative effectof avortex onthe capacityof anorif ice--and presumablyoniLlosed
o Lorge vortex
o l : lO model
250
200
a oo
a
o noo
lo%
t$ . 9- .s-"
o'
$
o
a
o
oo=
t ^ " t '
od- . ,.Goq^t 6(r''
.r?'i6-o"
'*-"' ,rt"::"':'�l::"t
t 2
LI
3
(meters)
Fig. Vll-5 - Comporlson of Heod-DischorgeRelotionshioe with Vortex os Determtnedby Comichil, Esconde ond Sobqfhe.
conduit spillway--can be determined in a model and scaled up to prototype size through theuse of a Froude model law.
_. Although Rahm [I-41] does not report a variation of vortex strength, he does report hisdischarge coefficients for a1l pipes. His resultsverify the similarityrelationships. For weirflow Rahm reports a discharge coefficient C in Eq. t-t of 4.28 toi all pipes. For the hori-zontal orifice at the pipe entrance Rahm reports
-a discharge coefficie.tt' Co in Eq. I-? of
.a-9 fo1 Pipe 1, 4.5? for Pipes 2, 3 and 4, and 4.65 for Pipe 5. The agreement is very goodand well within the limits of experimental precision. For futl pipe floi Ratrm did not deter-mine K" in Eq. I-5 but lumped the entrance, exit and friction losses into a eingle conetantthat is valid only if his pipe is frictionless.
47
three orifices are compared in Fig. VII-5. There it can be seen that the data obtained from the 1: 10 model and the prototype exhibit good agreement .
One pOint of dissimilarity was noted during these tests, but only one brief paragraph is devoted to it: The jets issuing from the orifices were not similar . The authors offer their statement and a pair of comparative photographs without comment.
As a result of the experiment by Messrs. Camichel, Escande and Sabathe, it is apparent that the quantitative effect of a vortex on the capacity of an orifice--and presumably on a closed
..-,. u Q) (/)
... Q)
a.
~
~ a
400 0 Large vortex
• • 1:10 model • •
350 ~
• • 0
eo 300 ~
eo .~ i::
. 0 0
0
250 • s· CJ
• o ",:>0
0 • 0
200 · 0
0
• • • • • ~ . 150 0 "
.," . ~\c,e .o~ o~\
.0·0 c,<S:-'
100 t ~ 7,.0
• . .. -· 0 · 0 ~ •• 'f!!'
• .~.
• • ~ ~ecJ . \\Ce ~ 0 on
eo ~ \~ c(1\
50 .·0
••
0 0 2 3 4
H (meters)
Fig . VII-5 - Comparison of Head-Discharge Relationships with Vortex as Determined by Camichel, Escande and Sabat he.
...
conduit spillway--c an be dete r mined in a model and scaled up to prototype size through the use of a Froude model law.
Although Rahm [1-41) does not report a variation of vortex strength, he does report his discharge coefficient s fo r all pipes. His results verify the similarity relationships. For weir flow Rahm reports a di sc harge coeffic ient C in Eq. 1-1 of 4.28 for all pipes. For the horizontal orifice at t he pipe ent rance Rahm reports a discharge coefficient C in Eq. 1-7 of o 4.49 for Pipe 1, 4.57 for Pipes 2, 3 and 4, and 4.65 for Pipe 5. The agreement is very good and well within the limits of experimental precision. For full pipe flow Rahm did not determine Ke in Eq. 1-5 but lumped the entrance, exit and friction losses into a single const ant
that i s valid only if his pipe i s frictionless.
48
Elevotion
:ilF+ 2 7 0 1
. ' '0 |
+ 2 5 0 L
HARSPRANGET DIVERSION TUNNEL
Rahm U-411 reports observations made in 1949 on vortex flow through a drop inlet di-vera ion tunnel . The tunnel isshownin Fig.VI I -6. This tunnelwas 11 m(36f t ) long. Thenear lyhorizontal tunnel 280 m (918 ft) long had an average eross sectional area of 110 sq m (1184
Longitudinol secl ion
\Tunnel oullel
P l o n
100 m
sq ft) . The obl ique upward tunnel mouth was 50 m(164 ft) long. The gate shaft was to be usedfor closing off the tunnel. The transport tunnel was used for removal of the excavated rock.
aRahm states that full pipe flow through the tunnel begins at 850 m"/sec (30,000 cfs). Mr. Rahmwrites:
As l ongas t he f l owd id no t exceed ASOm3/s , t he wa te r l eve l above t he t unne l i n l e t va r i edcon -t i nuous l y and regu la r l y w i t h the f l uc tua t i ons i n d i scha rge . On Ju l y 6 th [ 1949 ] , howeve r , t he ra te o f
f l ow i nc reased rap id l y f r om 850 m" / s [ 30 ,000 c f s ] , wh i ch ra te had been ma in ta i ned cons tan t f o r
abou t 24 hou rs , t o s l i gh t l y above 8?0 -37 " l fO ,ZOO c f s l . Th i s caused a r i se i n t he wa te r l eve l o f noIess t han 2 ,5 r n [8 .2 f t l , f r om+284 ,8 m to+ 287 ,3 m , i n 2 hou rs . . . . I n o rde r t o p reven t t he s i t e f r om
be ing f l ooded , t he f l ow was t hen reduced . , . t o i t s i n i t i a l va l ue o f 850m" / s . Even so , t he wa te r l eve ld i d no t f a l l t o i t s p rev i ous pos i t i on o i equ i l i b r i um co r respond ing t o t h i s r a te o f f l ow , i . e .+284 ,8 r n ,a s h a d b e e n e x p e c t e d . I n s t e a d , a s t a b l e l e v e l w a s r e a c h e d a t a c o n s i d e r a b l y h i g h e r v a l u e , + 2 8 7 , 6 m .
When the water level was higher than about + 283 m, the water was discharged both throughthe tunnel in let and through the gate shaf t , F ig. [VI I -?] . At h igh water levels, th is caused the forma-t ion of whir lpools at both in lets, a strong one at the tunnei in let and a weaker one at the gate shaf t .The water rotated c lock* ise above the tunnel in let and counter-c lockwise above the gate shaf t . . . .
The high water level observed on JuIy 6th remaj.ned unchanged even af ter the rate of inf lowhad been reduced to a value that former ly corresponded to a water Ievel 2,7 m lower, This fact isprobably due to the topographical conf igurat ion of the ground surface around the tunnel in let . The
inc rease i n t he ra te o f f l ow f r o r r v 850 mo /s t o 8?0 mr / s caused a r i se i nwa te r l eve l and an in tens i -f icat ion of the vort ical mot ion above the in let , especia l ly when a vortex was also formed above thegate shaf t . Since the inLet is located on the r iver bank, th is r ise in water level increased the extentof the body of water between the in let and the r iver bank, and hence af forded more favourable con-di t ions for intense vort ical mot ion at the in l .et . The vortex strength was therefore maintained at ahigh valueeven af ter the reduct ion in therateof f low. This state of f low wi thstrong vort ical mot ionat h igh water levels was then as stable as the former weak rotat ion at 1ow water IeveIs.
5cole50
@
Fig. Vtl-6 - HonprSnget Diversion Tunnel .
48
HARSPRANGET DIVERSION TUNNEL
Rahm [1-41] reports observations made in 1949 on vortex flow through a drop inlet diversion tunnel. The tunnel is shown in Fig. VII-6. This tunnel was 11 m (36 ft) long. The nearly horizontal tunnel 280 m (918 ft) long had an average cross sectional area of 110 sq m (1184
Elevotio~ m
o
Longitudinal section
Scale 50 I
100 m I
Fig. VII-6 - Ho~priinget Dive~ion Tunnel.
sq ft). The oblique upward tunnel mouth was 50 m (164 ft) long. The gate shaft was to be used for closing off the tunnel. The transport tunnel was used for removal of the excavated rock.
Rahm states that full pipe flow through the tunnel begins at 850 m 3 / sec (30,000 cfs). Mr. Rahm writes:
As long as the flow did not exceed 850 m 3
/ s, the water level above the tunne I i n let varied continuously and regularly with the fluctuations in discharge. On July 6th [1 9491, however , the rate of
flow increased rapidly from 850 m 3/ s [30,000 cfs], which rate had been maintaine d constant for
about 24 hours, to slightly above 870 m 3/s [30,700 cfs]. This caused a rise in the water level of no less than 2,5 m[8.2 ft], from+284,8m to+ 287,3 m, in 2 hours .... In order to prevent the site from
being flooded, the flow was then reduced ... to its initial value of 850 m 3/ s. Even so, the wate r level did not fall to its previous position of equilibrium corresponding to this rate of flow, i.e. + 284,8 m, as had been expected. Instead, a stable level was reached at a considerably higher value , + 287,6 m.
When the water level was higher than about + 283 m, the water was d ischarged both through the tunnel inlet and through the gate shaft, Fig. [VII-7]. At high water levels, this caused the formation of whirlpools at both inlets, a strong one at the tunnel inlet and a weaker one at the gate shaft. The water rotated clockwise above the tunnel inlet and counter-clockwise above t he gate shaft. ...
The high water level observed on July 6th remained unchanged even after the rate of- inflow had been reduced to a value that formerly corresponded to a water level 2,7 m lower. This fact is probably due to the topographical configuration of the ground surface around the tunnel inlet. The
increase in the rate of flow from 850 m 3 / s to 870 m 3/ s caused a rise in water level and an intensification of the vortical motion above the inlet, especially when a vortex was also formed above the gate shaft. Since the inlet is located on the river bank, this rise in water level increased the extent of the body of water between the inlet and the river bank, and hence afforded more favourable conditions for intense vortical motion at the inlet. The vortex strength was therefore maintained at a high value even after the reduction in the rate of flow. This state of flow with strong vortical motion at high water levels was then as stable as the former weak rotation at low water levels.
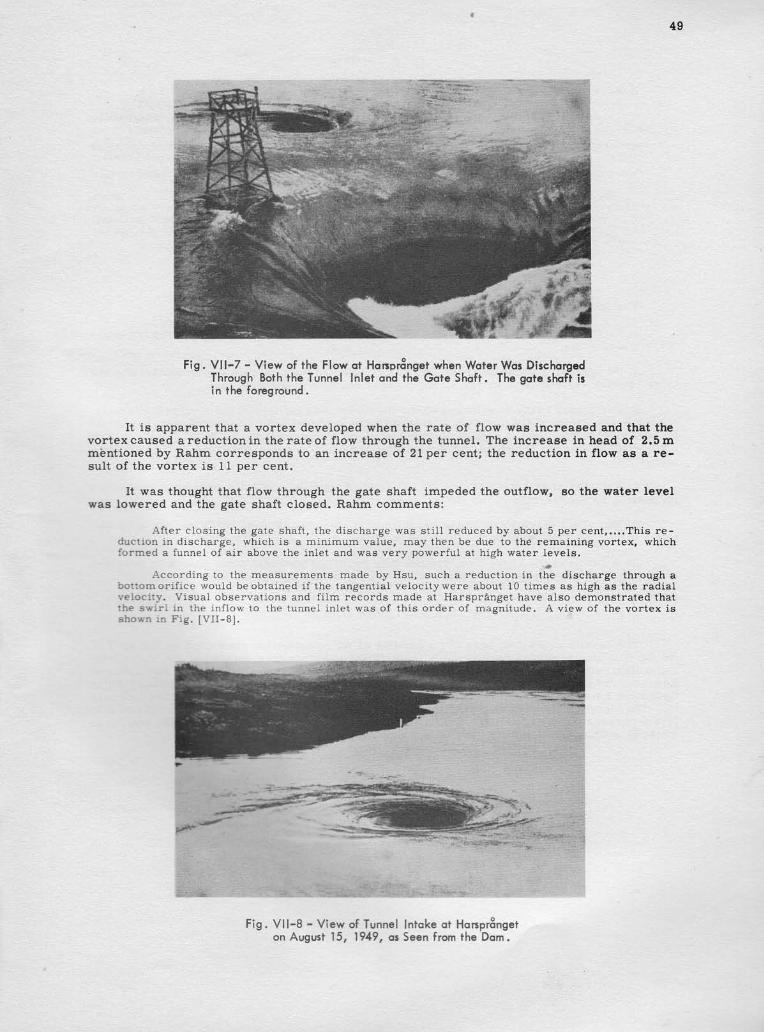
49
Fig. Vll-7 - View of the Flow ot HonprSngef when Woter Wor DischorgedThrough Both the Tunnel Inlet ond the Gofe Shoft. The goie shoft isin the foreground.
It is apparent that a vortex developed when the rate of flow was increased and that thevo r texcauseda reduc t i on in the ra teo f f l ow th rough the tunne l .The inc reage inheado f 2 .5mmbntioned by Rahm corresponds to an increase of 21per cent; the reduction in flow aa a P9-sul t o f the vor tex is 11 per cent .
It was thought that flow through the gate shaft impeded the outflow, so the water levelwas lowered and the gate shaft closed. Rahm comments:
Af te r c l os i ng t he ga te sha f t , t he d i scha rge was s t i l l r educed by abou t 5 pe r cen t , . . . . Th i s r e -duct ion in d ischarge, which is a minimum value, may then be due to the remaining vortex, whichIormed a funnel of a i r above the in let and was very powerfu l at h igh water levels,
- l ,ccording to the measurements made by Hsu, such a reduct ion in t t ie a ischarge through abo : : omor i f i ce wou ld beob ta i ned i f t he t angen t i a l ve l oc i t ywe re abou t 10 t imes as h i gh as t he rad ia lveiocj . rv. Visual observat ions and f i lm records made at HarsprAnget have also demonstrated that:he s 'x i r '^ in the inf l .ow to the tunnel in let was of th is order of magni tude. A v iew of the vortex iss h o ' * n i n F i g . I V I I - B ] ,
F ig . V I I -8 - V iew o f Tunne lon August 15, 1949, os
Intoke qt Honpr8ngetSeen f rom the Dom.
f
Fig. VII-7 - View of the Flow at Harspr~nget when Water Was Discharged Through Both the Tunnel Inlet and the Gate Shaft. The gate shaft is in the foreground.
49
It is apparent that a vortex developed when the rate of flow was increased and that the vortex caused a reduction in the rate of flow through the tunnel. The increase in head of 2.5 m mentioned by Rahm corresponds to an increase of 21 per cent; the reduction in flow as a result of the vortex is 11 per cent.
It was thought that flow through the gate shaft impeded the outflow, so the water level was lowered and the gate shaft closed. Rahm comments:
Afte r closing the gate shaft, the discharge was still reduced by about 5 per cent, .... This reduction in discharge, which is a minimum value, may then be due to the remaining vortex, which armed a funne l of air above the inlet and was very powerful at high water levels . ..
According to the measurements made by Hsu, such a reduction in the discharge through a bo am orifice would be obtained if the tangential velocity were about 10 times as high as the radial velocity. Visual observations and film records made at Harspranget have also demonstrated that he swirl in the inflow to the tunnel inlet was of this order of magnitude. A view of the vortex is
shown in Fig. [VII-8].
Fig. VII-8 - View of Tunnel Intake at Harsprgnget on August 15, 1949, as Seen from the Dam.
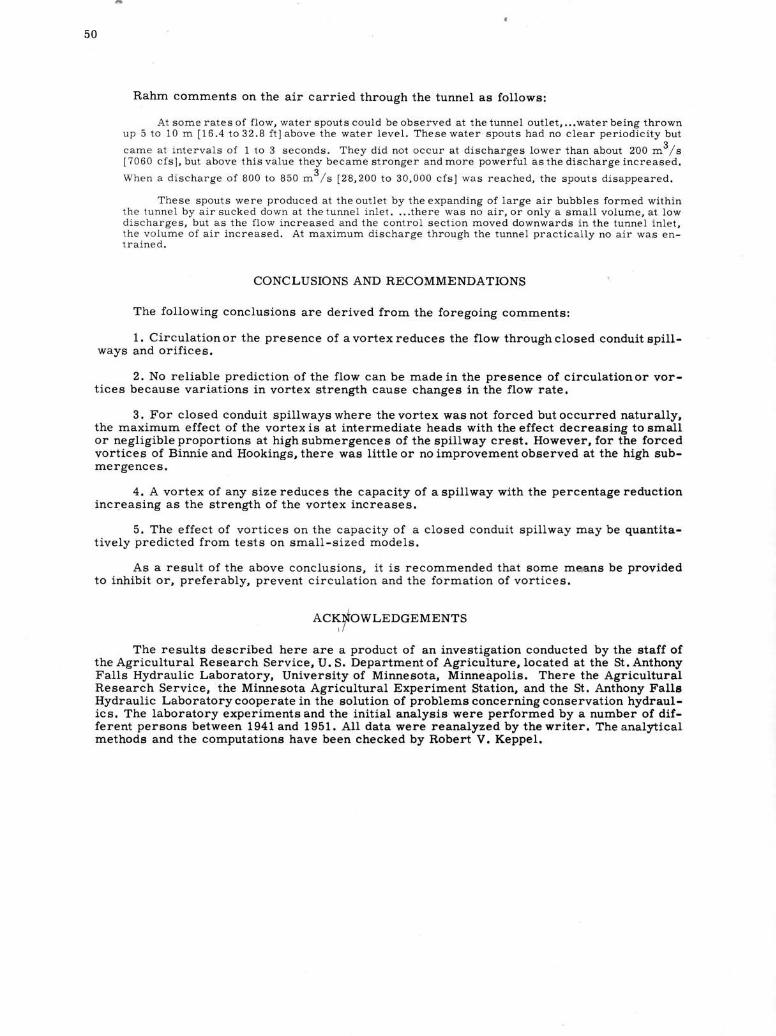
50
Rahm comments on the air carried through the tunnel as follows:
At some rates of f low, water spouts could be observed at the tunnel out let , . . .water being thrownup 5 t o 10 m [16 .4 t o32 .8 f t ] above t he wa te r l eve l . Thesewa te r spou t s had no c l ea r pe r i od i c i t ybu t
came at intervals of 1 to 3 seconds. They did not occur at d ischarges lower than about 2O0 rn"/s[ 7060 c f s ] , bu t above t h i sva lue t hey .becames t ronge r andmore power fu l as thed i scha rge inc reased .
When a d i scha rge o f 800 t o 850 m" , / s l 28 ,2OO to 30 ,000 c f s l was reached , t he spou t s d i sappea red .
These spouts were produced at theout let by theexpanding of large ai r bubbles formed wi th inthe tunnel by ai r sucked down at the tunnel in let . , , , there was no ai r , or only a srnal l volume, at lowdischarges, but as the f low i .ncreased and the contro l sect ion moved downwards in the tunnel in let ,the volume of a i r increased. At maximum di .scharge through the tunnel pract ical ly no ai r was en-t r a ine d.
CONCLUSIONS AND RECOMMENDATIONS
The following conclusions are derived from the foregoing comments:
1. Circulat ion or the presence of a vortex reduces the f low through closed conduit spi l l -ways and ori f ices.
2. No rel iable predict ion of the f low can be made in the presence of circulat ionor vor-t ices because variat ions in vortex strength cause ehanges in the f low rate.
3. For closed conduit spi l lwayswhere thevortex wasnot forced butoccurred natural ly,the maximum effect of the vortex is at intermediate heads with the effect decreasing to smallor negligible proportions at high submergences of the spillway creat. However, for the forcedvortices of Binnie and Hookings, there was little or no improvement observed at the high sub-mergences .
4. A vortex of any sizereduces the capacity of aspi lhvay with the percentagereductionincreasing as the strength of the vortex increases.
5. The effect of vort ices on the capacity of a closed conduit spi l lway may be quanti ta-t ively predicted from tests on small-sized models.
As a result of the above conclusions, it is recommended that aome means be providedto inhibit or, preferably, prevent circulation and the formation of vorticea.
ACKI(OWLEDGEMENTS
The results described here are a product of an investigation conducted by the etaff ofthe Agricultural Research Service, U. S. Department of Agriculture, located at the St. AnthonyFalls Hydraulic Laboratory, University of Minnesota, Minneapolis. There the AgriculturalResearch Service, the Minnesota Agricultural Experiment Station, and the St. Anthony FalleHydraulic Laboratory cooperate in the solution of problemn concerning conservation hydraul-ics. The laboratory experimentsand the initial analysis were performed by a number of dif-ferent peraons between 1941 and 1951. A11 data were reanalyzed by the writer. The analyticalmethods and the computations have been checked by Robert V. Keppel.
50
Rahm comments on the air carried through the tunnel as follows:
At some rates of flow, water spouts could be observed at the tunnel outlet, ..• water being thrown up 5 to 10m [16.4 to 32.8 ft] above the water level. These water spouts had no clear periodicity but
came at intervals of 1 to 3 seconds. They did not occur at discharges lower than about 200 m 3 / s [7060 cfs], but above this value they became stronger and more powerful as the discharge increased.
When a discharge of 800 to 850 m 3/ s [28,200 to 30,000 cfs] was reached, the spouts disappeared.
These spouts were produced at the outlet by the expanding of large air bubbles formed within the tunnel by air sucked down at the tunnel inlet .... there was no air, or only a small volume , at low discharges, but as the flow increased and t he control section moved downwards in the tunnel inlet, the volume of air increased. At maximum discharge through the tunnel practically no air was entrained .
CONCLUSIONS AND RECOMMENDATIONS
The following conclusions are derived from the foregoing comments:
1. Circulation or the presence of a vortex reduces the flow through closed conduit spillways and orifices.
2. No reliable prediction of the flow can be made in the presence of circulation or vortices because variations in vortex strength cause changes in the flow rate.
3. For closed conduit spillways where the vortex was not forced but occurred naturally, the maximum effect of the vortex is at intermediate heads with the effect decreasing to small or negligible proportions at high submergences of the spillway crest. However, for the forced vortices of Binnie and Hookings, there was little or no improvement observed at the high submergences.
4. A vortex of any size reduces the capacity of a spillway with the percentage reduction increasing as the strength of the vortex increases.
5. The effect of vortices on the capacity of a closed conduit spillway may be quantitatively predicted from tests on small-sized models.
As a result of the above conclusions, it is recommended that some m~ns be provided to inhibit or, preferably, prevent circulation and the formation of vortices.
AC~rOWLEDGEMENTS
The results described here are a product of an investigation conducted by the staff of the Agricultural Research Service, U. S. Department of Agriculture, located at the St. Anthony Falls Hydraulic Laboratory, University of Minnesota, Minneapolis. There the Agricultural Research Service, the Minnesota Agricultural Experiment Station, and the St. Anthony Falls Hydraulic Laboratory cooperate in the solution of problems concerning conservation hydraulics. The laboratory experiments and the initial analysis were performed by a number of different persons between 1941 and 1951. All data were reanalyzed by the writer. The analytical methods and the computations have been checked by Robert V. Keppel.