Embed Size (px)
Citation preview
http://www.wiwi.uni‐konstanz.de/forschung/
U n i v e r s i t y o f K o n s t a n zD e p a r t m e n t o f E c o n o m i c s
A Political Economy Explanation for In‐kind Redistribution:
The Interplay of Corruption and Democracy
Zohal Hessami, Claudio Thum, and Silke Uebelmesser
Working Paper Series2012‐25
- 0 -
A POLITICAL ECONOMY EXPLANATION FOR IN-K IND REDISTRIBUTION :
THE INTERPLAY OF CORRUPTION AND DEMOCRACY
Zohal Hessami*, Claudio Thum‡, and Silke Uebelmesser†
Abstract
This paper identifies a novel political-economy explanation for the observed variation in the cash and in-kind (basic health care, public housing or food stamps) mixture of social transfers. We put forward the hypothesis that the share of in-kind transfers is positively correlated with corruption in democratic countries. The argument is derived in a theoretical model which assumes that it is easier for politicians to appropriate cash transfers than in-kind transfers. Voters in corrupt countries know that cash transfers invite corrupt behavior and therefore they elect parties that opt for in-kind redistributive measures. The empirical analysis for 34 OECD countries over the 1984 – 2007 period provides robust evidence in favor of this hypothesis. Moreover, the positive correlation between the in-kind share of social transfers and perceived corruption is stronger for the “most democratic” OECD countries and in countries with specific institutional characteristics such as free media that further enhance democratic accountability.
JEL Classification: D7; H42; H5 Keywords: In-kind social transfers; redistribution; corruption; democracy;
social expenditures
* Corresponding author: University of Konstanz, Department of Economics, Box 138, 78457 Konstanz, Germany,
[email protected], Tel.: +49 7531 88 2137, Fax: +49 7531 88 3130. ‡ University of Munich, Germany, [email protected]
† University of Jena, Germany, [email protected]
- 1 -
1. Introduction
Nowadays, governments in developed countries dispose of substantial fiscal resources to perform basic
functions such as national defense, public order and safety, and the protection of property rights as well as
additional functions that were added subsequently such as education and environmental protection.
Moreover, about a third of the public budget in OECD countries is spent on social expenditures. At closer
inspection, two interesting observations can be made: First, there is variation in the importance of social
transfers across countries, which the literature mainly attributes to partisan biases, cultural differences, the
vulnerability to international macroeconomic shocks, and the general prosperity of a country (Congleton
and Bose, 2010; Hicks and Swank, 1992; Rodrik, 1998).1 A second and more puzzling observation is the
cross-country heterogeneity in the choice of redistributive measures. In some countries social transfers are
mostly allocated to recipients in cash; in other countries in-kind transfers are the prevalent instrument.2 A
government’s choice of redistributive measures is of interest as for instance it may influence the extent to
which redistribution from rich to poor is successful.3
While the theoretical public finance literature on the public provision of private goods (i.e. in-kind
redistribution) is quite extensive and especially emphasizes arguments related to self-targeting and
paternalism considerations (see Balestrino, 2000; Besley and Coate 1991; Blackorby and Donaldson,1988;
Blomquist and Christiansen,1995; Munro, 1992; Thum, 2000; Thum and Thum, 2001), political-economy
explanations for the cross-country heterogeneity in the composition of social transfers are quite scarce.4
As a first notable contribution, Bergstrom and Blomquist (1996) argue that selfish taxpayers without
children favor public provision of daycare so that mothers can join the labor force and thereby contribute
to an increase in tax revenues. Lundholm and Ohlsson (1998) extend this argument by taking into account
the wages of those women who benefit directly from daycare facilities and by showing that the Pareto-
optimal amount of publicly provided daycare lies between the optimal levels of parents and non-parents.
Both papers, however, do not analyze the composition of transfer instruments, i.e. the relative importance
of monetary and in-kind transfers, but only provide a general rationale for the public provision of private
goods in one specific context, i.e. daycare.
A third study by Bearse et al. (2000) is more directly related to our investigation and explains the
empirical observation that poor countries make more use of in-kind redistribution than rich countries. The
authors derive that high-income earners in poor countries would opt out of the publicly provided goods
1 Usually, Anglo-Saxon countries and Scandinavian countries are to be found at the lower and upper end of this distribution, respectively. 2 Note that in the public finance literature “in-kind provision of social transfers”, “public provision of private goods” and “indirect redistribution” are synonymous terms. 3 As an example, see Ter Rele (2007) for an estimate of the redistributive effects of cash and non-cash transfers in
the Netherlands. 4 Currie and Gahvari (2008) underline the importance of political economy explanations for in-kind redistribution by stating that “Political economy considerations must also be part of the story” (p. 334).
- 2 -
(e.g. education) given the low quality of provision. This renders these programs more redistributive and
induces the (poor) median voter to allocate more resources to in-kind redistribution.5
Our objective is to extend the theoretical literature that explains the existence of international
differences in the in-kind provision of social transfers by emphasizing the fact that countries differ both in
the extent of corruption and voters’ ability to hold politicians accountable for their actions. In our model,
politicians make use of redistributive measures to the poor to please the (economically deprived) majority
of voters. Politicians have two instruments of redistribution at their disposal: monetary transfers and in-
kind transfers. This choice is partly influenced by the fact that corrupt politicians seek to appropriate (part
of) the public transfers.6
Monetary transfers have the advantage of leaving consumption choices undistorted unlike in-kind
transfers which can neither be resold nor be topped up.7 On the other hand, in contrast to monetary
transfers in-kind redistribution allows for better monitoring by the general public, which reduces the
opportunities for the appropriation of public resources by politicians.8,9
In summary, we argue that there is a political-economy argument for in-kind redistribution given that
the consumption of in-kind transfers can be more easily monitored by citizens than monetary transfers.
This mechanism, however, only applies to countries in which voters have the power to elect candidates
that implement in-kind redistributive measures. In countries, where voters have little influence on political
decisions, we expect to see a higher cash share of social transfers regardless of the level of corruption.
The empirical literature on the influence of corruption on the composition of public spending is
generally scarce, while the effect of corruption (as well as the extent of democracy) on the cash and in-
kind share of social transfers has not been investigated at all to date.10 Currie and Gahvari (2008) in
particular point to “the limited empirical evidence that can be brought on” theoretical explanations for in-
5 Other studies with a political-economy focus are, e.g. Fernandez and Rogerson (1995), Epple and Romano (1996a,b), Gouveia (1997), and De Donder and Hindriks (1998). They study the political struggle between different income groups and the (non-)existence of voting equilibria whereas our explanation focuses on the quality of political institutions, in particular democracy and corruption. 6 This behavior is a form of corruption in the sense that it is an act “in which the power of public office is used for personal gains in a manner that contravenes the rules of the game” (Jain, 2001, p. 73). 7 These are the standard assumptions in the literature of the public provision of private goods which allow us to use the self-selection property of in-kind transfers and which prevent the publicly provided goods from being equivalent to monetary transfers. 8 An example is (basic) health care. In many countries, health care is at least in parts publicly provided, i.e. tax-financed and means-tested. It can be neither topped up very easily nor resold if it is defined such that it only allows access to selected health-care providers (doctors and hospitals) offering basic health care. 9 A case in point are the 2 million € paid every month as pensions to already deceased individuals in Greece (Reuters, 2011). One can argue that had old-age transfers been provided in-kind, e.g. in the form of accommodation in a nursing home, this fraud would not have happened. 10 Moreover, the theoretical foundation for the existing empirical analyses is of a different nature. It is based on the idea that corruption in public procurement is less observable and more lucrative with regard to certain kinds of expenditures such as defense expenditures (Gupta et al., 2001; Mauro, 1998). Based on similar arguments illustrated with a two-stage rent-seeking model, Hessami (2011) provides evidence for OECD countries that public expenditures on waste (water) management and medical equipment for public hospitals are also prone to corruption.
- 3 -
kind redistribution and state that “the empirical work seems to largely accept the paternalism theory and
move on to other questions” (p. 334). Therefore, in a second step we conduct an empirical analysis in
order to test the implications of our theory.
This paper analyzes the interplay of corruption and democracy as determinants of the composition of
redistributive transfers in the presence of informational asymmetries with respect to politicians’ integrity.
Our theoretical model illustrates that in a setting where voters have sufficient political power it is optimal
to use mixed transfers consisting of monetary and in-kind transfers if corruption exceeds a certain level.
This is the case even though the public provision of goods may distort the consumption of the recipients.
Politicians then use in-kind transfers as a commitment device or as a signal of non-corrupt behavior. These
considerations are confirmed in the regression analysis for 34 OECD countries over the time period from
1984 to 2007. We find that in democratic OECD countries voters have the political power to make sure
that the cash share of social transfers11 is lower when there are high levels of corruption. This is especially
true for the most democratic countries in our sample. Moreover, particular political institutions within
democratic countries amplify this effect.
The remainder of this paper is organized as follows. Section 2 analyzes theoretically why a
government may choose to provide social transfers in-kind rather than in cash and compares the result
with mixed transfers. Section 3 constitutes the empirical part of this paper and includes a description of
the data and of the empirical strategy as well as an extensive regression analysis. Finally, Section 4
concludes the analysis.
2. Theoretical model
To analyze the role of in-kind transfers in democracies, we introduce a simple model. There are two types
of individuals who differ with respect to their exogenously given income: LN low-income, poor
individuals (L) with income 0Y > and 1=HN high-income, rich individuals (H) with income Y ,
where it holds that YY > and L HN N> .12 We assume that the individual income can be observed by
those public officials that are in charge of allocating the public resources earmarked for redistribution.
For simplicity, we further assume that the individuals' preferences can be represented by the Cobb-
Douglas utility function
α−α ⋅= 1kkk xzU , HL,=k , (1)
11 Our data on social transfers encompasses benefits for old age, survivors, incapacity, health, family, and housing. 12 The assumption that the poor individuals are the majority is in line with the conventional wisdom of a left-skewed income distribution function which implies that the median income is below the mean income.
- 4 -
where kz and kx are the quantities of two (normal) private goods and α is the preference parameter. All
prices are normalized to unity.
Redistribution from rich to poor can be seen as a two-stage process. In the first constitutional stage,
the redistributive volume is determined by the choice of a lump-sum tax T levied on the rich. For the
analysis that follows, the redistributive volume is considered to be given. In the second stage, the tax
revenues from the rich are distributed to the poor or (partially) appropriated by the politician.
2.1 Normative analysis
As a benchmark for the positive analysis in section 2.2, we analyze which redistributive measure would
maximize the utility of the poor for a given tax rate collected from the rich. Transfers per capita are given
by the total amount of transfers T divided by the number of poor individuals LN . In the following, the
extent of redistribution is measured by the fraction t, which is defined as the transfer per poor citizen
divided by the low income
Y
NTt L/= . (2)
The fraction t shows the relative income increase of the low-income individual by the redistributive
policy. With these monetary transfers each poor individual maximizes the utility
( ) ( )L L L,
max , s.t. 1L L
L Lz x
U z x t Y z x+ ⋅ = + (3)
which results in the indirect utility
( )*L (1 )V Y tY A t Y+ = + (4)
where
( ) αα αα −−≡ 11A . (5)
This is the first best solution given the transfer t, i.e. the highest utility level of the poor citizens that can
be achieved for given parameter values.
- 5 -
2.2 Positive analysis
We now consider electoral competition with two politicians to determine how the tax revenues from the
rich are distributed to the poor.13 In the run-up to the election, each politician proposes a transfer
instrument , ,q M IM I= from the three possible instruments monetary transfers (M), mixed transfers
(IM) and in-kind transfers (I), in order to maximize the rents from holding office. The degree of
democracy and thus the degree of being held accountable by the voters determines the extent to which the
politician has to trade-off his utility against the (poor) voters’ utility. Then, the election takes place and the
politician who gets elected implements the proposed transfer policy.
To see which policy the politicians propose, we have to characterize the different transfer
instruments.
2.2.1 Instruments
Monetary transfers
Without corruption, the total amount of tax revenues benefits the poor. It is, however, likely that tax
revenues are diverted to other purposes in the presence of corruption. Corrupt politicians might use part of
the tax revenues for their own consumption or to benefit other groups. This redirection of monetary
transfers can hardly be observed if the population cannot monitor who receives transfers.
To capture this aspect of corruption, we assume that π is an indicator for the level of corruption in
this country. This parameter also measures how corrupt the incumbent is, i.e. which share of the tax
revenues he will appropriate. The transfer level therefore decreases to
TT M )1( π−= . (6)
where the superscript M denotes monetary transfers. Corruption reduces transfers leading to the
maximized utility
( ) ( )ML (1 ) 1 (1 )V Y t Y A t Yπ π+ − = + − . (7)
We can state
Proposition 1: In the presence of corruption, 0>π monetary transfers result in lower utility of the poor than in the first-best scenario.
Proof: This follows from comparing (4) and (7).
13 It is also possible to consider instead an incumbent who wants to be reelected. If this politician only looks at the next period (myopic view) when choosing the optimal transfer instrument, the analysis is unchanged.
- 6 -
In-kind transfers
The government can also redistribute income via in-kind transfers. This precludes in our model the
possibility that public resources earmarked for redistribution are appropriated.14 In that case, the
government provides the good z with a fixed quantity z free of charge to the poor.15 Each citizen can
observe the quantity and quality of this good as well as the group of recipients. A disadvantage of this
mechanism results, however, from the distortion of the consumption decision of the recipients.
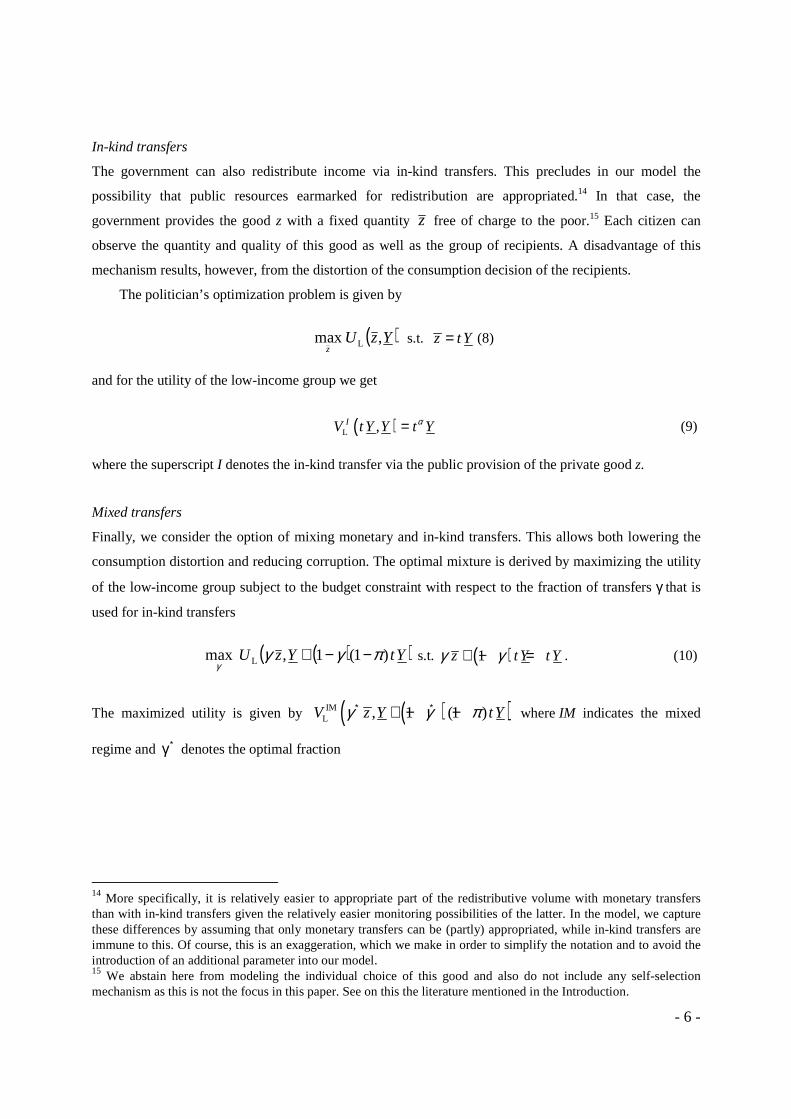
The politician’s optimization problem is given by
( )YzUz
,max L s.t. z tY= (8)
and for the utility of the low-income group we get
( )L ,IV tY Y t Yα= (9)
where the superscript I denotes the in-kind transfer via the public provision of the private good z.
Mixed transfers
Finally, we consider the option of mixing monetary and in-kind transfers. This allows both lowering the
consumption distortion and reducing corruption. The optimal mixture is derived by maximizing the utility
of the low-income group subject to the budget constraint with respect to the fraction of transfers γ that is
used for in-kind transfers
( )( )YtYzU )1(1,max L πγγγ
−−+ s.t. ( )1z tY t Yγ γ+ − = . (10)
The maximized utility is given by ( )( )IML , 1 (1 )V z Y tYγ γ π∗ ∗+ − − where IM indicates the mixed
regime and ∗γ denotes the optimal fraction
14 More specifically, it is relatively easier to appropriate part of the redistributive volume with monetary transfers than with in-kind transfers given the relatively easier monitoring possibilities of the latter. In the model, we capture these differences by assuming that only monetary transfers can be (partly) appropriated, while in-kind transfers are immune to this. Of course, this is an exaggeration, which we make in order to simplify the notation and to avoid the introduction of an additional parameter into our model. 15 We abstain here from modeling the individual choice of this good and also do not include any self-selection mechanism as this is not the focus in this paper. See on this the literature mentioned in the Introduction.
- 7 -
−+−∈∗ 1,
)1(
]1)1([min
t
t
ππαγ (11)
where for 0>α , it follows that ]1,0(* ∈γ
The mixed transfer system is at least as good as in-kind transfers. Pure in-kind transfers can be
obtained by setting γ equal to 1. The reverse, however, is not true. Lowering γ to 0 does not mean that the
mixed system converges to pure monetary transfers. The reason lies in the nature of the good z that cannot
be topped up (as is the case with an apartment of 1 m2). The lower the publicly provided quantity, the
stronger is the restriction on the consumption of the transfer recipients.
2.2.2 Comparison
Comparison of monetary and in-kind transfers
Both monetary transfers (policy M) and in-kind transfers (policy I) have their costs. Corrupt politicians
can spend monetary transfers on other purposes than redistribution, which decreases the transfer level. In-
kind transfers distort the consumption bundle of the transfer recipients. By comparing the utility of the
poor individuals for the two policy options, the optimal transfer type can be derived
( ) ( )ML L(1 ) , 1I t A
V Y tY V tY YAt
α
π π> <
− + − = ⇔ = − < >
. (12)
The optimal policy depends on the proportion of corrupt politicians π, the transfer level t, and the
preference parameter α.
In order to interpret the desirability of in-kind transfers we start with the extreme case where there is
no corruption (i.e. 0=π ).
Proposition 2: If there is no corruption (i.e. 0=π ), (i) the first-best can be reached with
monetary transfers for all levels of redistribution t (i.e. *ML LV V= for any t ), (ii) while there
is at most one transfer level t’ within the relevant range where in-kind transfers yield the first-best (i.e. *( ') ( ')I
L LV t V t= ).
Proof: See the Appendix.
Let us now turn to the case with corruption (i.e. 0>π ). We conduct the following thought
experiment. As we know from above, with no corruption (i.e. 0=π ), in-kind transfers distort the
consumption decision of the poor for 'tt ≠ . Monetary transfers are thus superior to public provision in the
- 8 -
absence of corruption. A positive level of corruption ( 0>π ), however, reduces the expected monetary
transfers. If corruption becomes sufficiently large, monetary transfers must be equivalent to in-kind
transfers.
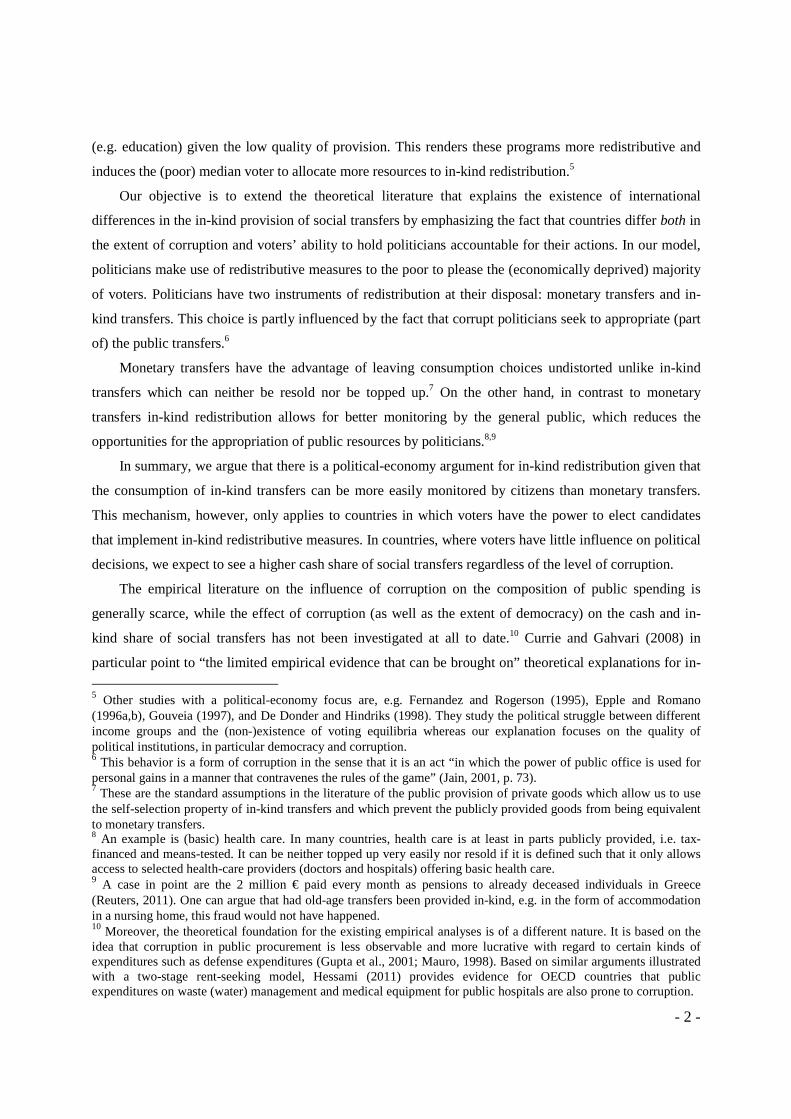
This is illustrated in Figure 1. All combinations of t and π where both policies are equivalent are
represented by threshold Q
( ) ( )ML L(1 ) , 0IQ V Y t Y V t Y Yπ≡ + − − = . (13)
With transfer levels that deviate more strongly from a poor individual’s optimum 't , the attractiveness of
in-kind provision decreases given that the consumption distortion becomes larger. This distortion has to be
weighed against the risk of appropriation of cash transfers by a corrupt politician. Therefore, monetary
transfers only lead to a higher utility level of the poor when the level of corruption is low. It should also be
noted that for very low transfer levels, monetary transfers are always preferred regardless of the extent of
corruption. This can be explained with the assumption that the publicly provided private good cannot be
resold or topped up. It is preferable for the poor to receive 10 euros (which they can use as a subsidy for a
suitable accommodation) rather than to be provided with an apartment of 1 m2.
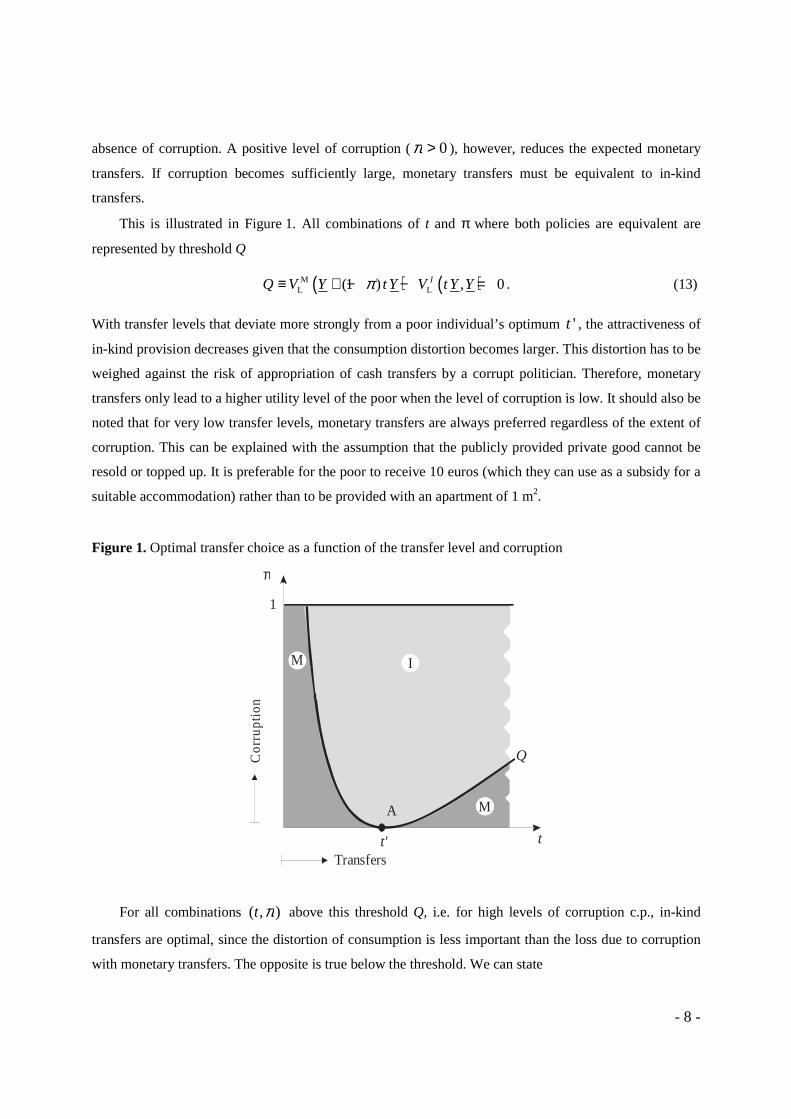
Figure 1. Optimal transfer choice as a function of the transfer level and corruption
t
π
A
1
t'
Q
M
IM
Cor
rupt
ion
Transfers
M
For all combinations ),( πt above this threshold Q, i.e. for high levels of corruption c.p., in-kind
transfers are optimal, since the distortion of consumption is less important than the loss due to corruption
with monetary transfers. The opposite is true below the threshold. We can state
- 9 -
Proposition 3: With sufficiently high corruption, in-kind transfers are superior to monetary
transfers.
Proof: From (12), it follows that ML L 1I t A
V VAt
α
π −> ⇔ > − .
Point A with 0=π represents the solution where both policies yield the first best. At this point, the
slope of the threshold Q is equal to 0.16 For higher (lower) transfers, the slope of the threshold line is
positive (negative), i.e.
0
0 '1Q
dt t
dt
π αα=
> > = ⇔ = = − < <
. (14)
Comparison of mixed transfers with monetary and in-kind transfers
As we know from above, with pure in-kind transfers the poor individual consumes her optimal
consumption bundle at the transfer level t’ . For transfers below t’ , the publicly provided quantity is lower
than the first best consumption quantity. Mixed transfers would mean that this quantity is further
decreased. This cannot be superior to pure public provision.
For transfers above t’ , the mixed transfer system can improve the pure policies. In the following, we
will focus on 'tt > and distinguish between two cases: First, as we know from Figure 1, below the
threshold Q, pure monetary transfers are superior to pure in-kind transfers. The mixing of transfers allows
the public provision of the quantity that the individual would have demanded with pure monetary transfers
without causing corruption and thus allows for higher effective transfers. Second, above the threshold Q,
pure in-kind transfers are superior to pure monetary transfers. Since the publicly provided quantity is
higher than the first-best consumption quantity, however, introducing monetary transfers increases the
utility even though monetary transfers are reduced by corruption.
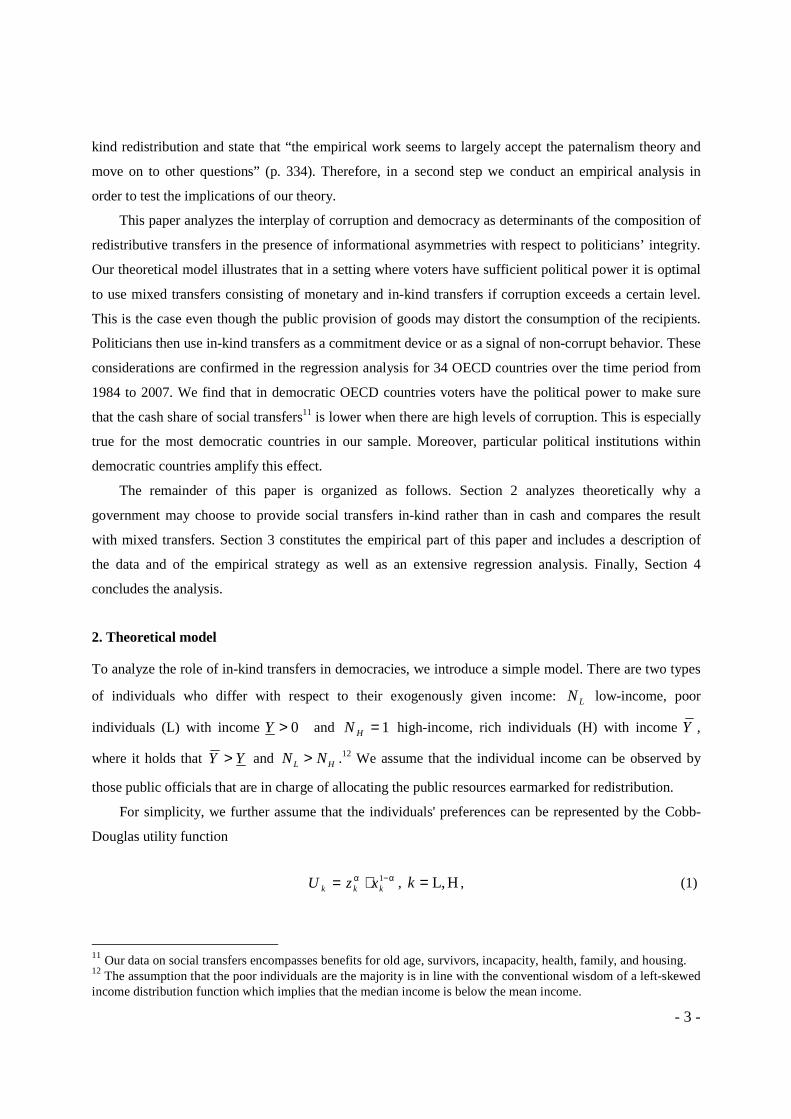
These results are illustrated in Figure 2. Compared to Figure 1, threshold K is added which indicates
the combination of the transfer level t and the level of corruption π where policy I and the mixed policy
IM (for *γγ = ) are equivalent
( )( ) ( )IML L, 1 (1 ) , 0IK V z Y tY V tY Yγ γ π∗ ∗≡ + − − − = . (15)
This holds for
t
1
11
ααπ−
−= . (16)
16 For the derivation of the slope, see the Appendix.
- 10 -
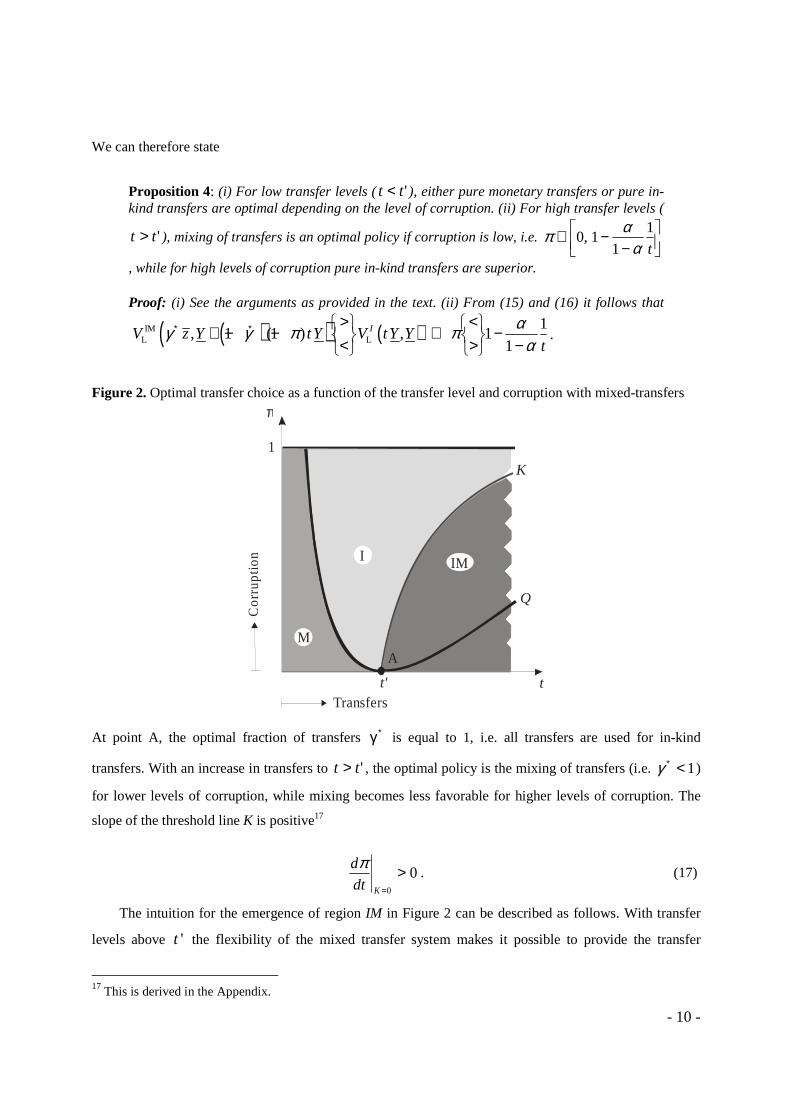
We can therefore state
Proposition 4: (i) For low transfer levels ( 'tt < ), either pure monetary transfers or pure in-kind transfers are optimal depending on the level of corruption. (ii) For high transfer levels (
'tt > ), mixing of transfers is an optimal policy if corruption is low, i.e.
−−∈
t
1
11,0
ααπ
, while for high levels of corruption pure in-kind transfers are superior.
Proof: (i) See the arguments as provided in the text. (ii) From (15) and (16) it follows that
( )( ) ( )IML L, 1 (1 ) ,IV z Y tY V tY Yγ γ π∗ ∗ >
+ − − <
t
1
11
ααπ−
−
><
⇔ .
Figure 2. Optimal transfer choice as a function of the transfer level and corruption with mixed-transfers
A
π
K
Q
M
I IM
t
1
t'
Cor
rupt
ion
Transfers
At point A, the optimal fraction of transfers ∗γ is equal to 1, i.e. all transfers are used for in-kind
transfers. With an increase in transfers to 'tt > , the optimal policy is the mixing of transfers (i.e. 1<∗γ )
for lower levels of corruption, while mixing becomes less favorable for higher levels of corruption. The
slope of the threshold line K is positive17
00
>=Kdt
dπ. (17)
The intuition for the emergence of region IM in Figure 2 can be described as follows. With transfer
levels above 't the flexibility of the mixed transfer system makes it possible to provide the transfer
17 This is derived in the Appendix.
- 11 -
recipient with the optimal amount of the private good, while also transferring a certain cash sum to the
recipient, which he can use in other ways. A pure in-kind provision would in this case have the
disadvantage that the recipient would not value the higher level of the good that is provided as much as he
would value an additional cash transfer.
In a democracy, voters should vote for politicians who propose a program which allows for
sufficiently good monitoring given the level of corruption and the transfer level. Politicians have to take
this into account, when choosing the transfer instrument.
2.2.3 Politicians’ choice of redistributive instruments
The politician’s objective function can be written as
qL
qPol
q UDUDW +−= )1( . (18)
where ]1,0[∈D denotes the degree of democracy,18 and qLU and q
PolU the utility of the (poor) majority
and the politician’s own utility, respectively, both as a function of the chosen transfer instrument q.
Holding office opens up the possibility of appropriating rents. For small D, the politician’s interest
determines the choice of the transfer instrument, while for large D, the voters’ interest matters.
As to qPolU , it is straightforward to order the transfer instruments with respect to the utility they
generate for the politician: M IM If f . Monetary transfers allow appropriation of tYπ , mixed
transfers of Yt)1( *γπ − with ]1,0(* ∈γ as determined in (11), while it is not possible for the politician to
divert resources with in-kind transfers. It follows that in the extreme case with a completely undemocratic
political regime ( 0=D ), politicians will choose monetary transfers as redistributive measure.
As to qLU , the analysis above has shown which transfer policy is optimal from the low-income
voters’ perspective as a function of the redistributive volume and the level of corruption (see Figure 2).
Voters elect the politician whose policy generates the highest utility for them. To say it differently, if the
low-income voters’ utility qLU is higher (lower) with the policy proposed by politician i than with the one
proposed by politician j, politician i will be elected with probability 1ip = ( 0ip = ). If both politicians
propose the same policy, their election probability is equal to 0.5.
18 Note that what we call democracy could also be understood as the efficiency of monitoring procedures, i.e. as the probability of being detected when cheating.
- 12 -
As long as 0>D , the proposed policies will converge in equilibrium, towards the one preferred by
the poor median voter, i.e. *i j Lq q q= = . Choosing *
Lq maximizes the politicians’ probability of winning
the election, which is a necessary condition for appropriating part of the transfer volume.19
Summarizing, a lower (higher) degree of democracy can be expected to make monetary transfers
more (less) likely for any level of corruption (0,1]π ∈ . To test these hypotheses, we now turn to the
empirical analysis.
3. Empirical analysis
3.1 Data description
The political economy argument for in-kind transfers put forward in this paper is that voters can monitor
politicians via these transfers. A necessary condition is that voters are equipped with political power. Only
if there is a sufficiently high degree of democracy, voters can choose between politicians and prevent the
reelection of politicians who deviate from their election pledges. Hence, corruption and expenditures for
cash transfers should be negatively correlated for democratic countries.20 In the following, we focus on
OECD countries in order to test this hypothesis. This choice is motivated by data availability as to the
composition of social expenditures.
The OECD SOCX Database provides disaggregated data for social expenditures across seven
domains: old age (on average accounting for 32.91% of social expenditures), health (28.78%), incapacity
(11.66%), family (9.05%), unemployment (5.57%), survivors (5.25%), and housing (2.06%).21 As to the
importance of in-kind relative to cash transfers, there is quite some variation across categories. The in-
kind share of health and housing expenditures, e.g., is always 100%,22 while it is always 0% for
unemployment-related social transfers in all periods and countries in our sample. As to old-age benefits,
7% of expenditures are on average provided in-kind across all periods and countries (examples include
expenditures for residential care and home-help services for the elderly) while the in-kind share of
survivor benefits capturing, e.g., financial support for funeral expenses amounts to 5%. The importance of
19 If the optimal policy *
Lq is redistribution via in-kind transfers, politicians cannot appropriate anything which makes them indifferent between being elected and not being elected. The underlying assumption then is that in this case they nevertheless choose the policy which maximizes their election probability. 20 As already stated, the impact of corruption on the structure of public expenditures is analyzed in Gupta et al. (2001), Mauro (1997, 1998) and Hessami (2011). 21 There is also data available for two additional domains: active labor market programs and other social policy areas. While the former is excluded from our analysis since only totals are available and no subdivision into cash and in-kind transfers, the latter is not considered as it only represents a negligible share of total social transfers. These two categories add up to 4.72% of total social expenditures. For a detailed description of the SOCX Database, see OECD (2011). 22 In the case of health benefits, it should be noted that cash benefits related to sickness are captured in the incapacity-related category.
- 13 -
in-kind benefits is slightly larger for incapacity-related expenditures with a share of 12% (e.g. residential
care, home-help services and rehabilitation) and even more so for family benefits with a share of 32%
(e.g. day-care and home-help services).
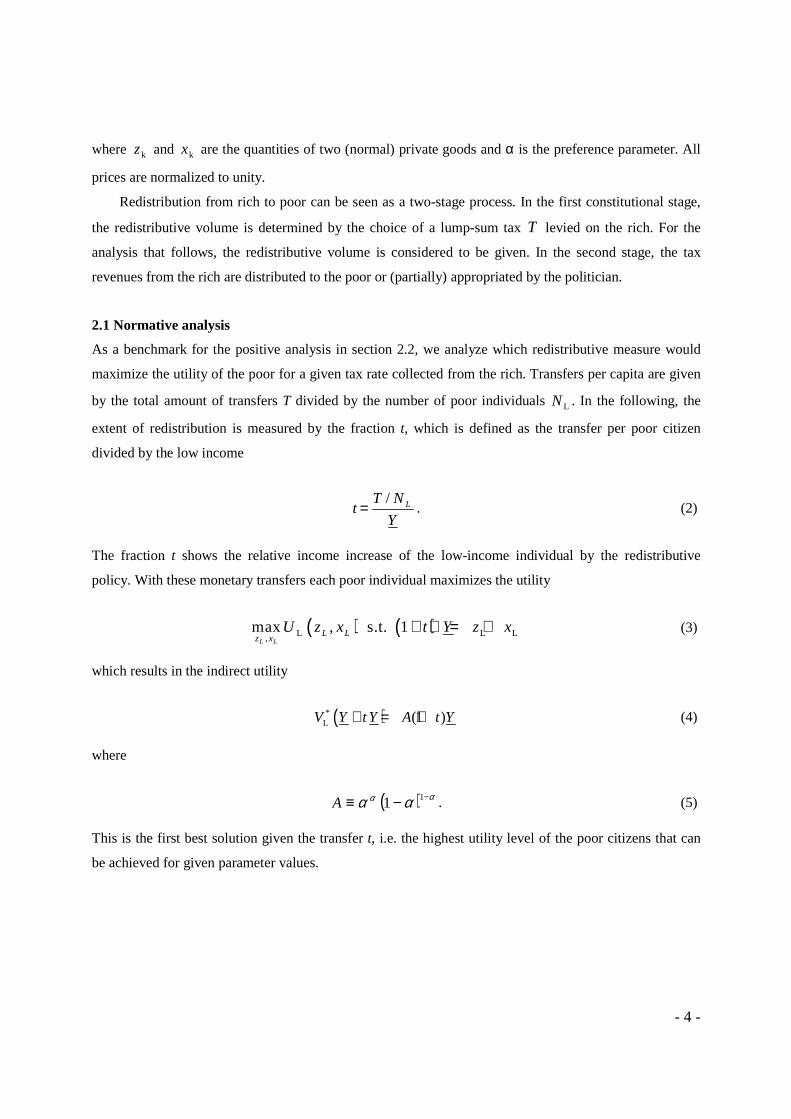
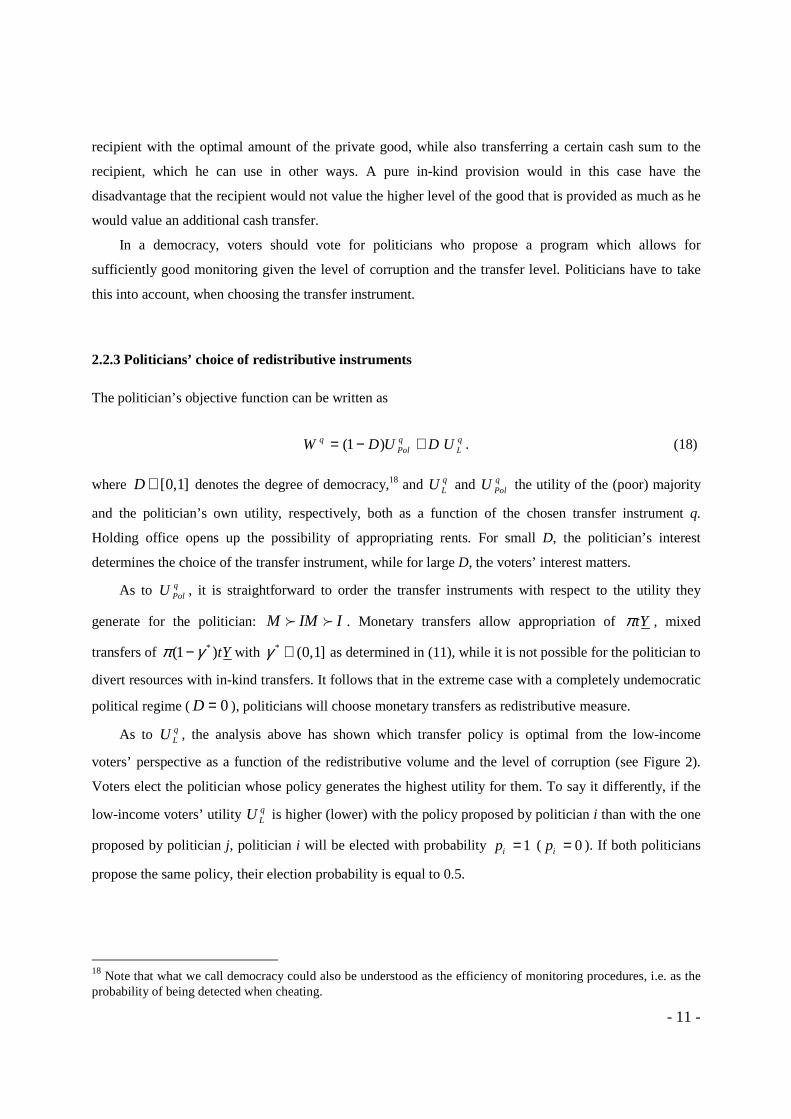
In addition to the variation of the in-kind share across categories, there is also variation across
countries and over time. Figure 3 illustrates averages for the in-kind share of social expenditures for each
of the 34 countries in our sample. South Korea is the country with the highest in-kind share, whereas
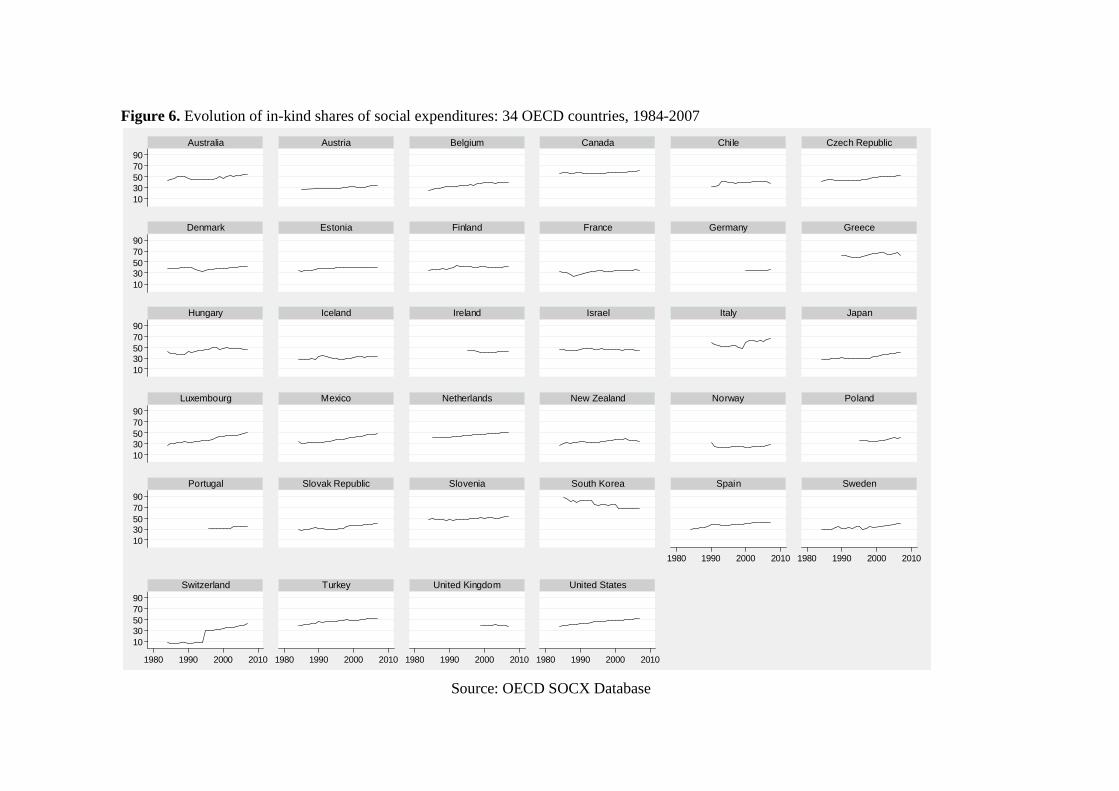
Switzerland has the lowest values. Figure 6 in the appendix in addition illustrates the over-time variation
of this variable for each country. During our period of observation, the in-kind share increases by about 20
percentage points in Luxembourg, Mexico, Sweden, Switzerland and the US, while South Korea
witnessed a decrease of comparable magnitude between 1987 and 2007.23 Overall, regarding the in-kind
share of social expenditures, it should be noted that the variation of the dependent variable in our
estimations is quite high.
Figure 3. Averages of in-kind shares of social expenditures: 34 OECD countries, 1984-2007
Source: OECD SOCX Database
The main explanatory variable in our regressions is the corruption index from the International Country
Risk Guide (ICRG). We prefer this measure over the also widely used indices from Transparency
23 The sharp increase in the mid-1990s by about 20 percentage points in Switzerland can be attributed to the introduction of compulsory health insurance in 1994 (WHO, 2000). Therefore, as of 1995, the share of in-kind social expenditures is driven up substantially due to the fact that health expenditures are entirely provided in-kind.
20 40 60 80
In-kind share averages
SwitzerlandNorwayAustriaIcelandFrance
PortugalJapan
SwedenSlovak Republic
BelgiumGermany
New ZealandPolandSpain
EstoniaMexico
LuxembourgDenmark
ChileUnited Kingdom
FinlandIreland
HungaryUnited States
IsraelNetherlands
Czech RepublicTurkey
AustraliaSlovenia
ItalyCanadaGreece
South Korea
- 14 -
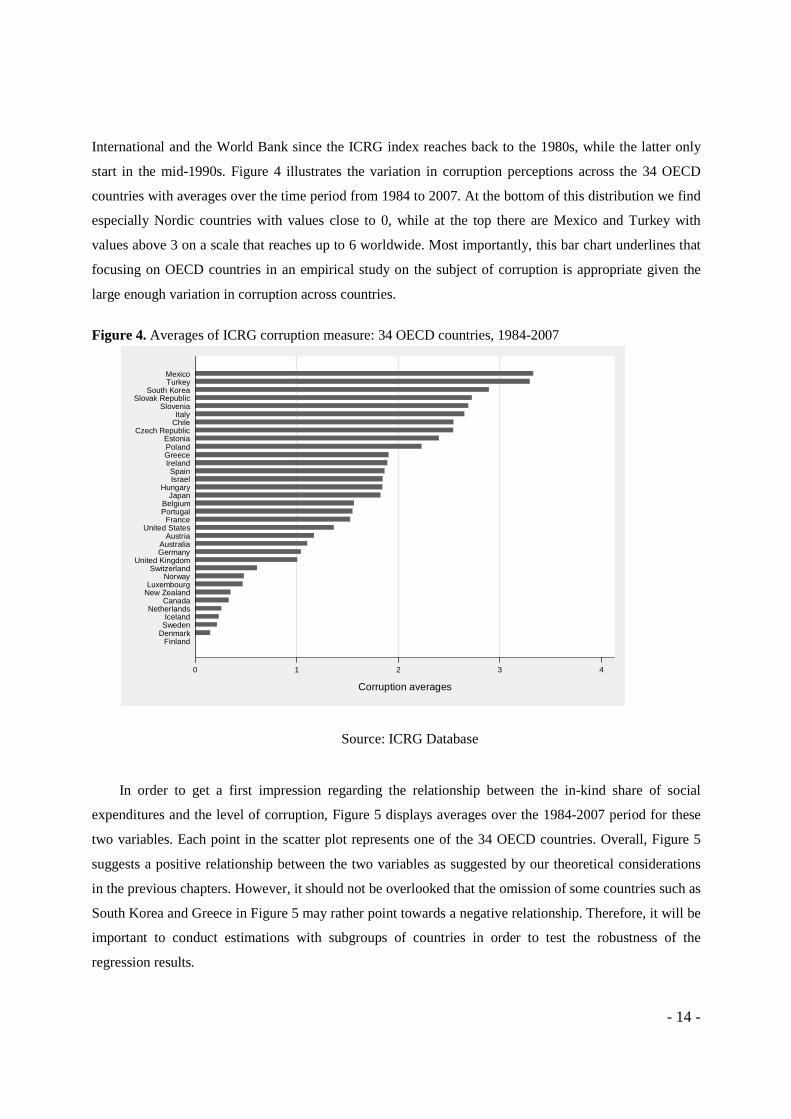
International and the World Bank since the ICRG index reaches back to the 1980s, while the latter only
start in the mid-1990s. Figure 4 illustrates the variation in corruption perceptions across the 34 OECD
countries with averages over the time period from 1984 to 2007. At the bottom of this distribution we find
especially Nordic countries with values close to 0, while at the top there are Mexico and Turkey with
values above 3 on a scale that reaches up to 6 worldwide. Most importantly, this bar chart underlines that
focusing on OECD countries in an empirical study on the subject of corruption is appropriate given the
large enough variation in corruption across countries.
Figure 4. Averages of ICRG corruption measure: 34 OECD countries, 1984-2007
Source: ICRG Database
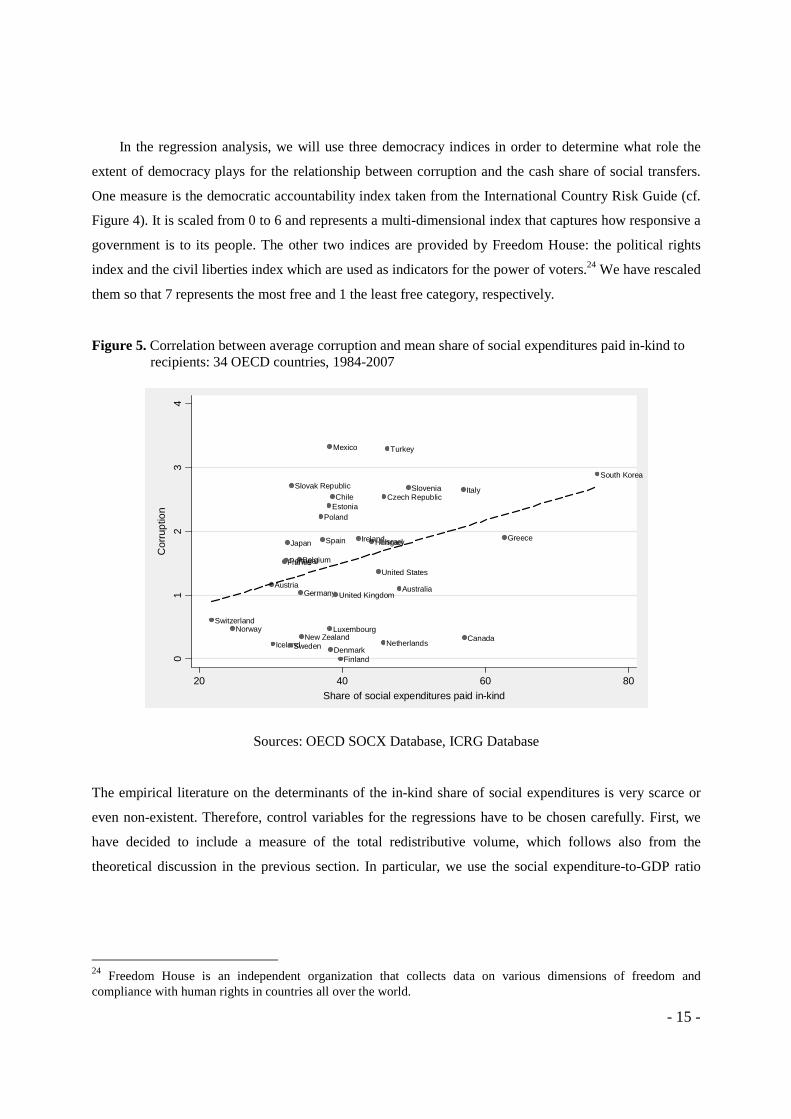
In order to get a first impression regarding the relationship between the in-kind share of social
expenditures and the level of corruption, Figure 5 displays averages over the 1984-2007 period for these
two variables. Each point in the scatter plot represents one of the 34 OECD countries. Overall, Figure 5
suggests a positive relationship between the two variables as suggested by our theoretical considerations
in the previous chapters. However, it should not be overlooked that the omission of some countries such as
South Korea and Greece in Figure 5 may rather point towards a negative relationship. Therefore, it will be
important to conduct estimations with subgroups of countries in order to test the robustness of the
regression results.
0 1 2 3 4
Corruption averages
FinlandDenmarkSwedenIceland
NetherlandsCanada
New ZealandLuxembourg
NorwaySwitzerland
United KingdomGermanyAustralia
AustriaUnited States
FrancePortugalBelgium
JapanHungary
IsraelSpain
IrelandGreecePolandEstonia
Czech RepublicChileItaly
SloveniaSlovak Republic
South KoreaTurkeyMexico
- 15 -
In the regression analysis, we will use three democracy indices in order to determine what role the
extent of democracy plays for the relationship between corruption and the cash share of social transfers.
One measure is the democratic accountability index taken from the International Country Risk Guide (cf.
Figure 4). It is scaled from 0 to 6 and represents a multi-dimensional index that captures how responsive a
government is to its people. The other two indices are provided by Freedom House: the political rights
index and the civil liberties index which are used as indicators for the power of voters.24 We have rescaled
them so that 7 represents the most free and 1 the least free category, respectively.
Figure 5. Correlation between average corruption and mean share of social expenditures paid in-kind to recipients: 34 OECD countries, 1984-2007
Sources: OECD SOCX Database, ICRG Database
The empirical literature on the determinants of the in-kind share of social expenditures is very scarce or
even non-existent. Therefore, control variables for the regressions have to be chosen carefully. First, we
have decided to include a measure of the total redistributive volume, which follows also from the
theoretical discussion in the previous section. In particular, we use the social expenditure-to-GDP ratio
24 Freedom House is an independent organization that collects data on various dimensions of freedom and compliance with human rights in countries all over the world.
AustraliaAustria
Belgium
Canada
Chile Czech Republic
Denmark
Estonia
Finland
France
Germany
GreeceHungary
Iceland
IrelandIsrael
Italy
Japan
Luxembourg
Mexico
NetherlandsNew Zealand
Norway
Poland
Portugal
Slovak Republic Slovenia
South Korea
Spain
Sweden
Switzerland
Turkey
United Kingdom
United States
01
23
4
Cor
rupt
ion
20 40 60 80
Share of social expenditures paid in-kind
- 16 -
taken from the OECD SOCX Database.25 Second, our estimations include the inflation rate on the right-
hand side of the regression equation given that in high-inflation countries governments may be more
inclined to pay transfers in-kind since otherwise either recipients will receive substantially fewer real
transfers over time or the amount to be paid has to be constantly renegotiated and adjusted. Third, we
include a measure for the ideology of the chief executive’s party taken from the Database of Political
Institutions (DPI). It classifies governments as either right-wing (1), centrist (2) or left-wing (3). Our
hypothesis is that left-wing parties are more interested in protecting the poor from being stigmatized.
Therefore, when left-wing parties are in power a lower in-kind share and hence a higher cash share of
social expenditures should be observed.26 Fourth, we control for the population shares of people older than
65 and younger than 15 given that these are factors that influence the relative importance of social
expenditures on old age and family benefits, which may in turn differ in the extent to which they are
allocated in-kind. Fifth, following Bearse et al. (2000) we include the log of real GDP per capita in order
to capture how wealthy a country is. Based on their theoretical model, we would expect richer countries to
have a lower in-kind share of social transfers.
Finally, a last step in the empirical analysis will be to give additional attention to the exact nature of
democracies across the OECD. A number of recent contributions in the political economy literature point
out that differences in the design of electoral systems give rise to differential political and economic
outcomes and imply a substantial amount of variation in the degree to which citizens can control and hold
their political representatives accountable. Therefore, we will use data on the following set of variables:
the extent of press freedom, the World Bank’s voice and accountability index, a dummy for independent
judiciaries, closed lists, and a presidential system dummy as well as a measure for the extent of party
polarization. A more detailed description of these variables and their sources is available in Appendix B.
3.2 Empirical strategy
Our regressions are based on the following empirical model:
In-kind share of social transfers Corruptionit i it it t itα β γ µ ε= + + + +X (19)
where iα and tµ are the country and time fixed effects and itε is the random variable with the standard
assumptions. In our case the cross-sectional dimension is i = 1, 2, 3,…, 34, whereas the time dimension is
t = 1, 2,…, 5. Even though our data covers 24 years we have decided to use five-year averages. This has
25 We also experimented with a squared social expenditure to GDP ratio in order to capture the non-linear relationships implied by figures 1 and 2. However, they always were insignificant and therefore they will not be discussed in the regression analysis section. 26 For existing evidence on the effects of government ideology and inflation on the choice of redistributive measures see Hessami and Uebelmesser (2013).
- 17 -
the advantage that measurement errors are to some degree eliminated. Vector X it contains the control
variables that have been described in section 3.1.
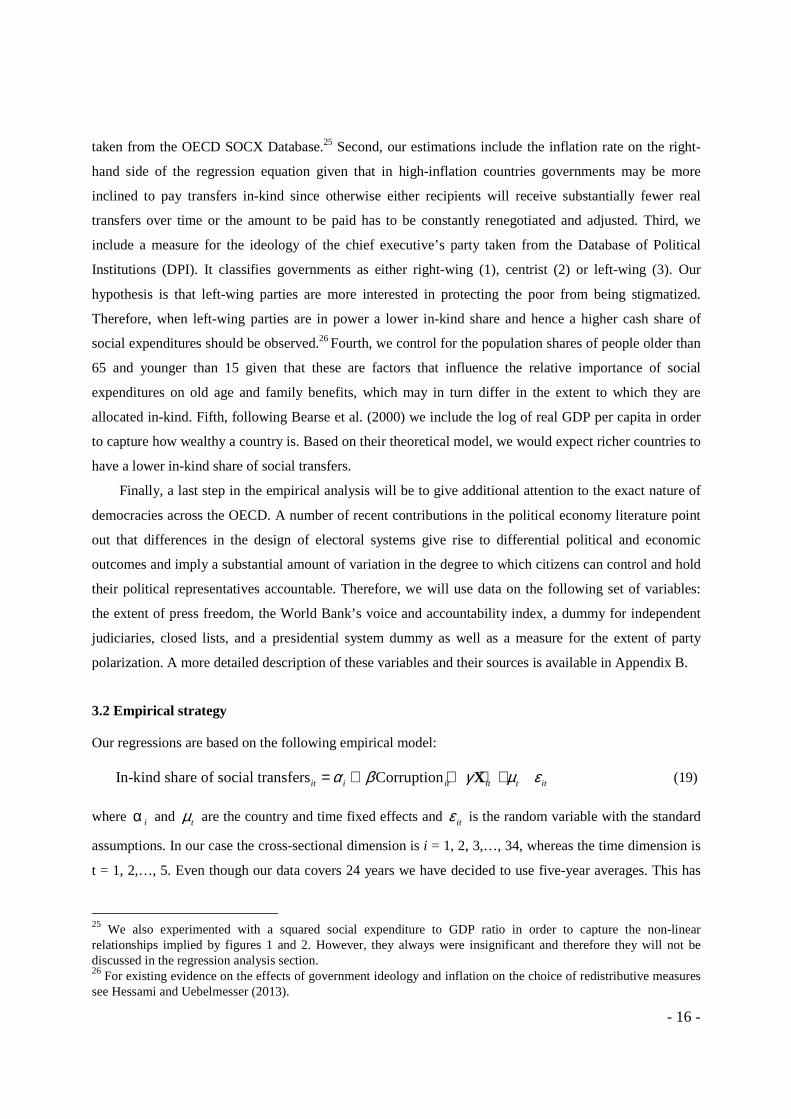
3.3 Results
The first set of estimations includes eight models which differ with regard to the control variables (Table
1). We subsequently add control variables in order to see how the other coefficients respond. Given that
the government ideology measure from the DPI is not available for Switzerland the number of countries in
models 5 to 8 is only 33 instead of 34.
Table 1. Two-way fixed effects estimations, 1984-2007 averaged over five periods, 34 countries
Model 1 Model 2 Model 3 Model 4 Model 5 Model 6 Model 7 Model 8
Dependent variable: In-kind share of social expenditures
FE
FE
FE
FE
FE
FE
FE
DYN
Corruption 1.357** 1.364** 1.253** 1.256** 0.888* 0.847* 0.740* 1.000*
(2.139) (2.149) (2.050) (2.025) (1.843) (1.788) (1.659) (1.677)
Share of old people 0.055 0.159 0.156 0.172 0.140 -0.030 -0.026 (0.142) (0.424) (0.403) (0.579) (0.479) (-0.108) (-0.084)
Share of young people 0.504** 0.571*** 0.569** 0.348* 0.309* 0.044 -0.150 (2.241) (2.630) (2.446) (1.913) (1.724) (0.234) (-0.507)
Social expenditures/GDP
-0.487*** -0.487*** -0.416*** -0.410*** -0.441*** -0.431**
(-3.413) (-3.397) (-3.766) (-3.787) (-4.063) (-2.567)
Inflation rate 0.001 0.005 0.008 0.004 0.120
(0.024) (0.304) (0.477) (0.150) (1.469)
Government ideology -0.499 (-1.491)
Right-wing government 1.691*** 0.910 -0.187 (2.723) (1.544) (-0.228)
Log of real GDP per capita
-14.576*** -9.832** (-4.806) (-2.190)
Lagged dependent variable
0.876*** (10.538)
Observations 146 146 146 146 138 138 135 108
Countries 34 34 34 34 33 33 33 33
[1] All estimations include dummies for the different time periods [2] Hypothesis tests are based on panel-corrected standard errors that are robust to heteroscedasticity and autocorrelation [3] Stars indicate significance at 10% (*), 5% (**) and 1% (***) [4] t-statistics in parentheses
First of all, it should be noted that for all eight models a positive corruption coefficient is found,
which is in line with our main hypothesis for the case of democratic countries. This effect is significant at
the 5% or 10% level, while the coefficient ranges from about 0.7 to 1.4. This means that an increase on the
corruption index scale by one unit (one sixth of the scale) would lead to an increase in the in-kind share of
- 18 -
social expenditures by 0.9 to 1.4 percentage points. In model 8, we have experimented with a dynamic
specification that includes a lagged dependent variable. The results are very similar to models 1 to 7. We
have chosen to estimate this model with Bruno’s (2005a, 2005b) bias corrected least squares dummy
variable estimator that has been designed for unbalanced dynamic panel data models with small N.27
With regard to the other control variables, we can say that the extent of redistribution is negatively
correlated with the in-kind share of social expenditures, while the coefficients for the inflation rate and
government ideology have the expected sign but are insignificant. When we use a right-wing government
dummy instead of the 1-2-3 measure for government ideology, we find that indeed right-wing
governments rely more often on in-kind redistribution than centrist and left-wing governments. In
addition, we can confirm Bearse et al.’s (2000) hypothesis that poor countries allocate a higher share of
social transfers in-kind than rich countries.
In a second set of estimations (see Table 2), we have subdivided the 34 OECD countries into
countries with the highest score of the three democracy indices (models 4.2, 4.4, and 4.6) and countries
that have a score that is lower than this highest value (models 4.1, 4.3, and 4.5). In particular, we find that
20 of 34 countries do have the value of 7 for the political rights index, while the same is true for the civil
liberties index for 11 of 34 countries. Finally, nine countries (Australia, Canada, Denmark, Finland,
Iceland, Netherlands, Norway, New Zealand, and Sweden) have the highest score possible for the ICRG
democratic accountability index.28
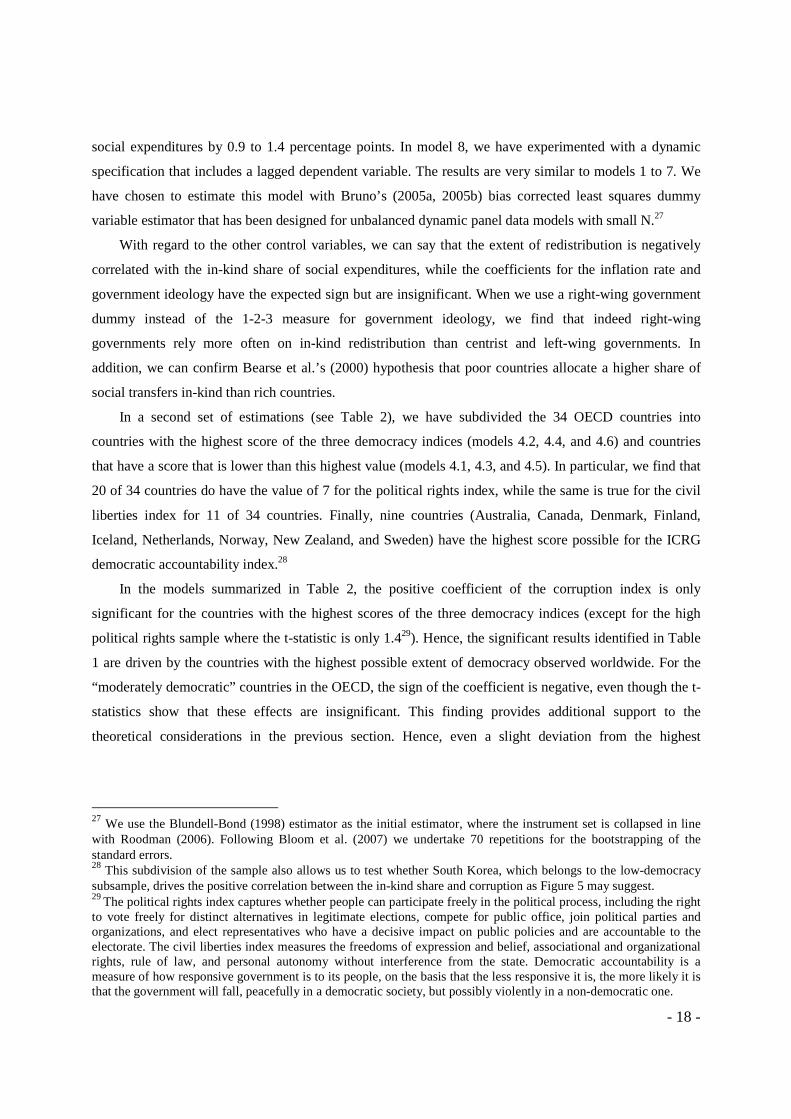
In the models summarized in Table 2, the positive coefficient of the corruption index is only
significant for the countries with the highest scores of the three democracy indices (except for the high
political rights sample where the t-statistic is only 1.429). Hence, the significant results identified in Table
1 are driven by the countries with the highest possible extent of democracy observed worldwide. For the
“moderately democratic” countries in the OECD, the sign of the coefficient is negative, even though the t-
statistics show that these effects are insignificant. This finding provides additional support to the
theoretical considerations in the previous section. Hence, even a slight deviation from the highest
27 We use the Blundell-Bond (1998) estimator as the initial estimator, where the instrument set is collapsed in line with Roodman (2006). Following Bloom et al. (2007) we undertake 70 repetitions for the bootstrapping of the standard errors. 28 This subdivision of the sample also allows us to test whether South Korea, which belongs to the low-democracy subsample, drives the positive correlation between the in-kind share and corruption as Figure 5 may suggest. 29 The political rights index captures whether people can participate freely in the political process, including the right to vote freely for distinct alternatives in legitimate elections, compete for public office, join political parties and organizations, and elect representatives who have a decisive impact on public policies and are accountable to the electorate. The civil liberties index measures the freedoms of expression and belief, associational and organizational rights, rule of law, and personal autonomy without interference from the state. Democratic accountability is a measure of how responsive government is to its people, on the basis that the less responsive it is, the more likely it is that the government will fall, peacefully in a democratic society, but possibly violently in a non-democratic one.
- 19 -
observed extent of democracy means that voters are less able to tie the hands of corrupt politicians with a
higher in-kind share of social transfers.30
Table 2. Two-way fixed effects estimations, 1984-2007 averaged over five periods, 33 countries, subsamples of fully versus moderately democratic countries
Model 4.1 Model 4.2 Model 4.3 Model 4.4 Model 4.5 Model 4.6 Subsamples Low score
political rights index
High score political
rights index
Low score civil liberties
index
High score civil liberties
index
Low score democratic
accountability
High score democratic
accountability Dependent variable: In-kind share of social expenditures
Corruption (ICRG) -0.398 0.854 -0.035 2.435*** -0.016 3.485*** (-0.81) (1.40) (-0.09) (2.41) (-0.04) (3.00)
Share of old people 0.279 1.064*** -0.204 2.427*** -0.098 1.603*** (0.71) (2.83) (-0.74) (4.01) (-0.38) (2.75)
Share of young people 0.341 0.346* -0.191 1.847*** 0.181 1.215** (1.07) (1.76) (-0.87) (3.96) (1.12) (2.4)
Social expenditures/GDP
-1.286*** -0.212** -0.951*** 0.046 -1.247*** 0.234** (-4.15) (-2.24) (-4.66) (0.047) (-7.91) (2.23)
Inflation rate -0.013 0.037 0.032 -0.184* 0.016 -0.134 (-0.33) (0.81) (1.28) (-1.89) (0.64) (1.25)
Right-wing government
4.543*** -0.176 1.992*** -0.397 1.456** -0.371 (3.26) (-0.33) (2.81) (-0.07) (2.29) (-0.61)
Log of real GDP per capita
-15.824*** (-3.69)
7.933* (1.89)
-22.516*** (-7.41)
15.897*** (3.04)
-19.284*** (-7.24)
-5.846 (-0.63)
Observations 52 86 84 54 94 44 Number of countries 13 20 22 11 24 9
[1] All estimations include dummies for the different time periods [2] Hypothesis tests are based on panel-corrected standard errors that are robust to heteroscedasticity and autocorrelation [3] Stars indicate significance at 10% (*), 5% (**) and 1% (***) [4] t-statistics in parentheses
For the remaining control variables, we find a negative and significant coefficient for the social
expenditure-to-GDP ratio in all but one model, which confirms our finding in Table 1 that a higher total
extent of redistribution is associated with a lower in-kind share of social transfers. On the other hand, for
the inflation rate the coefficient is only in one case significantly negative at the 10% level. Finally, in three
out of six models we find evidence that governments that exhibit a more “leftist” or centrist ideology tend
to provide a higher cash rather than in-kind share of social transfers compared to right-wing governments.
As a final step, we acknowledge the fact, that independent of the level of democracy there may be
some (additional) variation in the exact nature of political institutions across the countries in our sample.
30 Similarly, Aidt et al. (2008) and Méndez and Sepúlveda (2006) look into the role of political accountability or political freedom, respectively, as a determinant of corruption and economic growth and find nonlinearities in the corruption-growth relation depending on the quality of the political institutions.
- 20 -
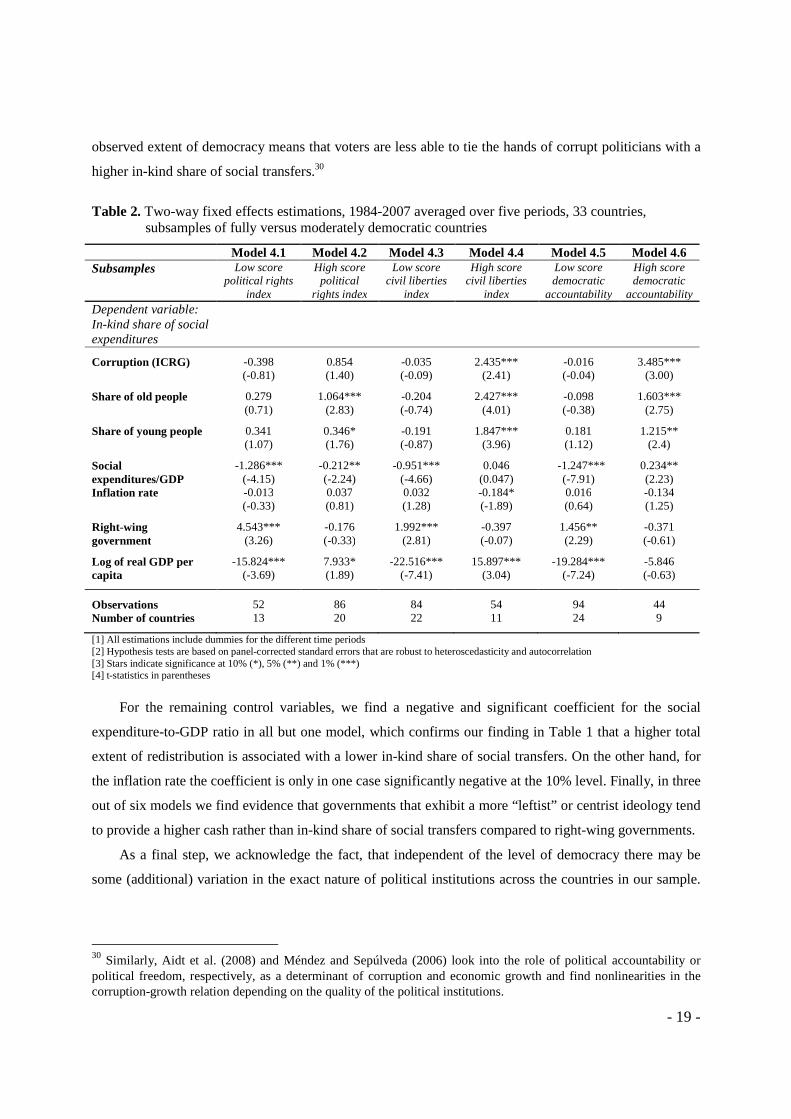
In particular, we are interested in those factors that strengthen voters’ power over politicians and the
extent to which politicians can be held accountable for potential wrong-doings.
Table 3. Two-way fixed effects estimations, 1984-2007 averaged over five periods or 1984-2007 cross-country estimations, 33 countries, characteristics of political system
Model 15 Model 16 Model 17 Model 18 Model 19 Model 20 Dependent variable: In-kind share of social expenditures
Corruption -4.317 -12.521*** -12.081 2.833 3.641 1.626 (-1.550) (-2.915) (-1.288) (0.923) (1.408) (0.353) Social expenditures/GDP -0.560*** -0.537*** -0.451* -0.975*** -0.629** -0.588** (-4.136) (-3.231) (-2.012) (-3.970) (-2.324) (-2.204) Inflation rate 0.022 0.075 0.039 0.082 0.052 0.069 (0.404) (1.423) (0.533) (1.118) (0.590) (0.768) Right-wing government 0.731 0.130 2.199 7.271 2.035 2.984 (1.319) (0.209) (0.436) (1.418) (0.337) (0.469) Share of old people 0.052 0.409 -4.480*** -3.032*** -4.118*** -3.629*** (0.174) (1.118) (-4.565) (-2.884) (-3.286) (-3.134) Share of young people -0.249 -0.422 -2.947*** -1.767** -2.499*** -2.219*** (-1.075) (-1.281) (-4.008) (-2.628) (-3.203) (-2.895) Log of real GDP per capita
-17.903*** -17.555*** 10.634** 8.139 8.309 8.464 (-4.876) (-3.234) (2.236) (1.664) (1.453) (1.439)
Press freedom -0.066 (-0.710) Corruption*Press freedom
0.059 (1.638)
Voice & accountability -7.890** (-2.205) Corruption*Voice & accountability
3.559*** (2.981)
Independent judiciary -62.667** (-2.419) Corruption*Independent judiciary
14.774 (1.542)
Closed list -14.014** (-2.463) Corruption*Closed list 1.905 (0.616) Presidential system -9.485 (-0.582) Corruption*Presidential system
2.887 (0.430)
Party polarization -4.605 (-0.965) Corruption*Party polarization
1.011 (0.321)
Observations 117 92 33 29 33 33 Countries 33 33 33 29 33 33 [1] The estimations for models 15 and 16 include dummies for the different time periods [2] Hypothesis tests for models 15 and 16 are based on panel-corrected standard errors that are robust to heteroscedasticity and autocorrelation [3] Stars indicate significance at 10% (*), 5% (**) and 1% (***) [4] t-statistics in parentheses
- 21 -
For two of these measures (Freedom House’s Press Freedom Index and the World Bank’s Voice and
Accountability Index), there is variation over time which allows us to exploit the panel structure of the
dataset as in the previous estimations (models 15 and 16). However, for the other four measures (Henisz’
independent judiciary dummy, DPI’s closed list, presidentialism, and party polarization measures) there is
hardly any variation over time. Therefore, for models 17 to 20 we conduct a pure cross-sectional analysis
with averages over 24 years.
The hypothesis that we want to investigate in Table 3 is whether there are certain characteristics of
democratic political systems in OECD countries, which allow voters even more to induce an increase in
the in-kind share of social transfers when faced with corruption. Hence, we try to get a more detailed
picture of what constitutes - what we call - a well-functioning “democracy” in the real world.
In model 15, we find indeed a positive coefficient for the interaction term between press freedom and
corruption. However, it has a t-statistic of only 1.64 and is therefore not significant at conventional levels.
On the other hand, we do find a significantly positive coefficient for the interaction term between the
World Bank’s Voice and Accountability Index and corruption in model 16. This implies that the extent to
which a country’s citizens are able to participate in selecting their government, as well as freedom of
expression, freedom of association and a free media do contribute to a higher in-kind share of social
transfers in countries with a high extent of corruption.
For model 17 we again find a positive coefficient for the interaction term. Yet the t-statistic is slightly
below the 10% with t = 1.54. Hence, there is only weak evidence that an independent judiciary allows for
a more effective control of voters over the composition of social transfers. Finally, with regard to closed
lists (model 18), presidential as opposed to parliamentary systems (model 19) and the extent of party
polarization (model 20) we do not find any significant effects with regard to the relevant interaction terms.
To summarize, the empirical analysis in Section 3 of this paper provides evidence for the theoretical
considerations in the preceding section of this paper. In particular, we find in a two-way fixed effects
analysis for 34 OECD countries over the 1984-2007 period that in “democratic” OECD countries a higher
extent of corruption is positively correlated with the in-kind cash share of social transfers.
4. Conclusion
The theoretical literature provides a number of arguments in favor and against the cash or in-kind
provision of social transfers. This paper shows that there is another benefit of in-kind transfers neglected
so far: in-kind transfers can be used as a monitoring instrument by voters. With monetary transfers, voters
are less easily able to observe who receives benefits and how much they receive. When transfers are
provided in-kind, it is much easier to verify who benefits from them. It is rather unlikely that corrupt
politicians would feel tempted to appropriate public resources by lining up for basic health care, moving
into public housing facilities or redeeming food stamps in the supermarket.
- 22 -
These considerations are confirmed in the regression analysis for 34 OECD countries over the time
period from 1984 to 2007. We find that in democratic OECD countries voters have the political power to
make sure that the in-kind share of social transfers is higher when there are higher levels of corruption.
When drawing a distinction between “fully” and “moderately” democratic countries according to three
different widely used democracy indices, we find that the significant effects observed for the entire sample
are driven by the “fully” democratic countries. Finally, we find some evidence that particular
characteristics of a democratic political system make it more likely that voters can induce a higher in-kind
share of social transfers in the presence of corruption. This includes the extent to which citizens are able to
participate in selecting their government, as well as freedom of expression, freedom of association and a
free media. There is weak evidence that this may also be true in countries where there is an independent
judiciary.
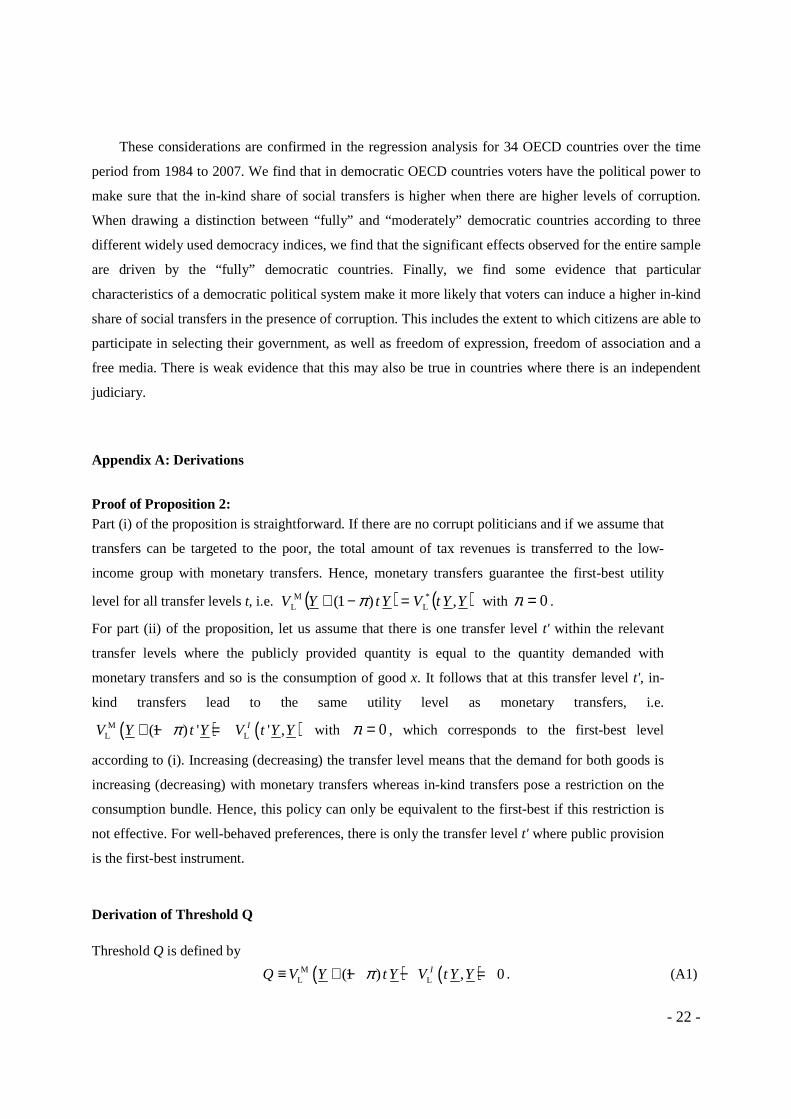
Appendix A: Derivations
Proof of Proposition 2: Part (i) of the proposition is straightforward. If there are no corrupt politicians and if we assume that
transfers can be targeted to the poor, the total amount of tax revenues is transferred to the low-
income group with monetary transfers. Hence, monetary transfers guarantee the first-best utility
level for all transfer levels t, i.e. ( ) ( )YYtVYtYV ,)1( *L
ML =−+ π with 0=π .
For part (ii) of the proposition, let us assume that there is one transfer level t' within the relevant
transfer levels where the publicly provided quantity is equal to the quantity demanded with
monetary transfers and so is the consumption of good x. It follows that at this transfer level t', in-
kind transfers lead to the same utility level as monetary transfers, i.e.
( ) ( )ML L(1 ) ' ' ,IV Y t Y V t Y Yπ+ − = with 0=π , which corresponds to the first-best level
according to (i). Increasing (decreasing) the transfer level means that the demand for both goods is
increasing (decreasing) with monetary transfers whereas in-kind transfers pose a restriction on the
consumption bundle. Hence, this policy can only be equivalent to the first-best if this restriction is
not effective. For well-behaved preferences, there is only the transfer level t' where public provision
is the first-best instrument.
Derivation of Threshold Q
Threshold Q is defined by
( ) ( )ML L(1 ) , 0IQ V Y t Y V t Y Yπ≡ + − − = . (A1)
- 23 -
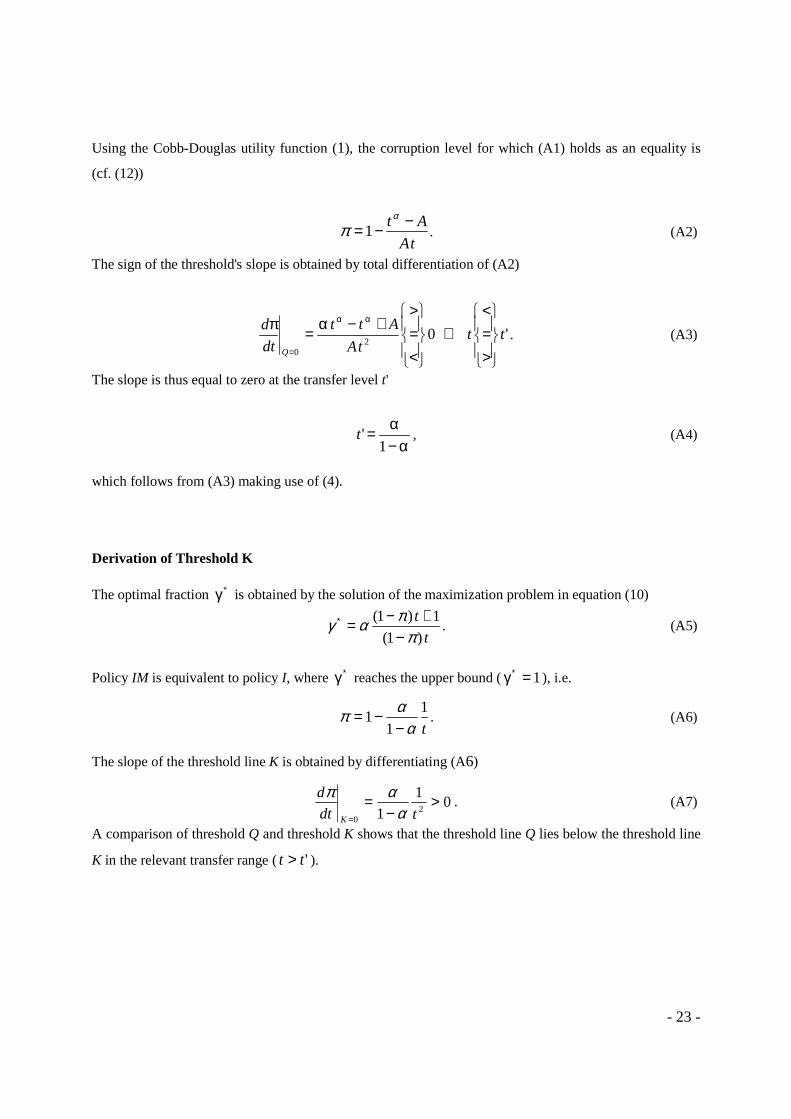
Using the Cobb-Douglas utility function (1), the corruption level for which (A1) holds as an equality is
(cf. (12))
tA
At −−=α
π 1 . (A2)
The sign of the threshold's slope is obtained by total differentiation of (A2)
'02
0
tttA
Att
dt
d
Q
>=<
⇔
<=>
+−α=π αα
=
. (A3)
The slope is thus equal to zero at the transfer level t'
α−
α=1
't , (A4)
which follows from (A3) making use of (4).
Derivation of Threshold K
The optimal fraction ∗γ is obtained by the solution of the maximization problem in equation (10)
t
t
)1(
1)1(
ππαγ−
+−=∗ . (A5)
Policy IM is equivalent to policy I, where ∗γ reaches the upper bound ( 1=γ ∗ ), i.e.
t
1
11
ααπ−
−= . (A6)
The slope of the threshold line K is obtained by differentiating (A6)
01
1 20
>−
== tdt
d
K ααπ
. (A7)
A comparison of threshold Q and threshold K shows that the threshold line Q lies below the threshold line
K in the relevant transfer range ( 'tt > ).
- 24 -
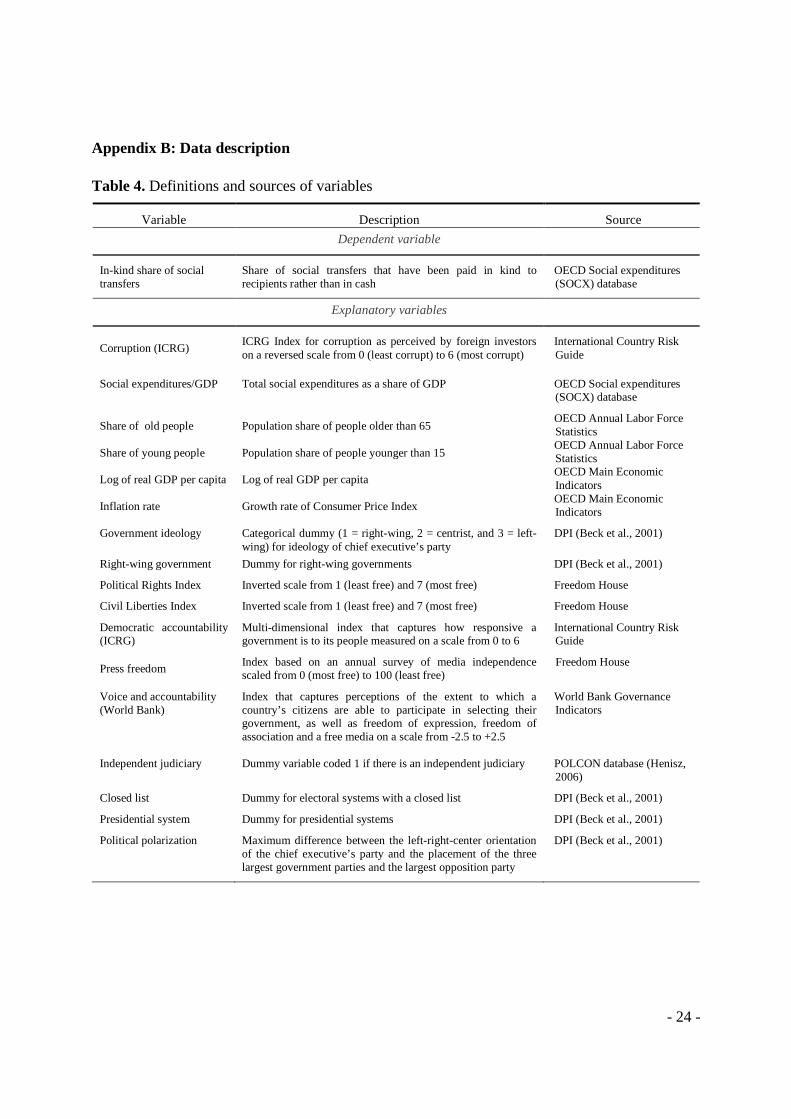
Appendix B: Data description
Table 4. Definitions and sources of variables
Variable Description Source Dependent variable
In-kind share of social transfers
Share of social transfers that have been paid in kind to recipients rather than in cash
OECD Social expenditures (SOCX) database
Explanatory variables
Corruption (ICRG) ICRG Index for corruption as perceived by foreign investors on a reversed scale from 0 (least corrupt) to 6 (most corrupt)
International Country Risk Guide
Social expenditures/GDP Total social expenditures as a share of GDP OECD Social expenditures (SOCX) database
Share of old people Population share of people older than 65 OECD Annual Labor Force Statistics
Share of young people Population share of people younger than 15 OECD Annual Labor Force Statistics
Log of real GDP per capita Log of real GDP per capita OECD Main Economic Indicators
Inflation rate Growth rate of Consumer Price Index OECD Main Economic Indicators
Government ideology Categorical dummy (1 = right-wing, 2 = centrist, and 3 = left-wing) for ideology of chief executive’s party
DPI (Beck et al., 2001)
Right-wing government Dummy for right-wing governments DPI (Beck et al., 2001)
Political Rights Index Inverted scale from 1 (least free) and 7 (most free) Freedom House
Civil Liberties Index Inverted scale from 1 (least free) and 7 (most free) Freedom House
Democratic accountability (ICRG)
Multi-dimensional index that captures how responsive a government is to its people measured on a scale from 0 to 6
International Country Risk Guide
Press freedom Index based on an annual survey of media independence scaled from 0 (most free) to 100 (least free)
Freedom House
Voice and accountability (World Bank)
Index that captures perceptions of the extent to which a country’s citizens are able to participate in selecting their government, as well as freedom of expression, freedom of association and a free media on a scale from -2.5 to +2.5
World Bank Governance Indicators
Independent judiciary Dummy variable coded 1 if there is an independent judiciary POLCON database (Henisz,
2006)
Closed list Dummy for electoral systems with a closed list DPI (Beck et al., 2001)
Presidential system Dummy for presidential systems DPI (Beck et al., 2001)
Political polarization Maximum difference between the left-right-center orientation of the chief executive’s party and the placement of the three largest government parties and the largest opposition party
DPI (Beck et al., 2001)
- 25 -
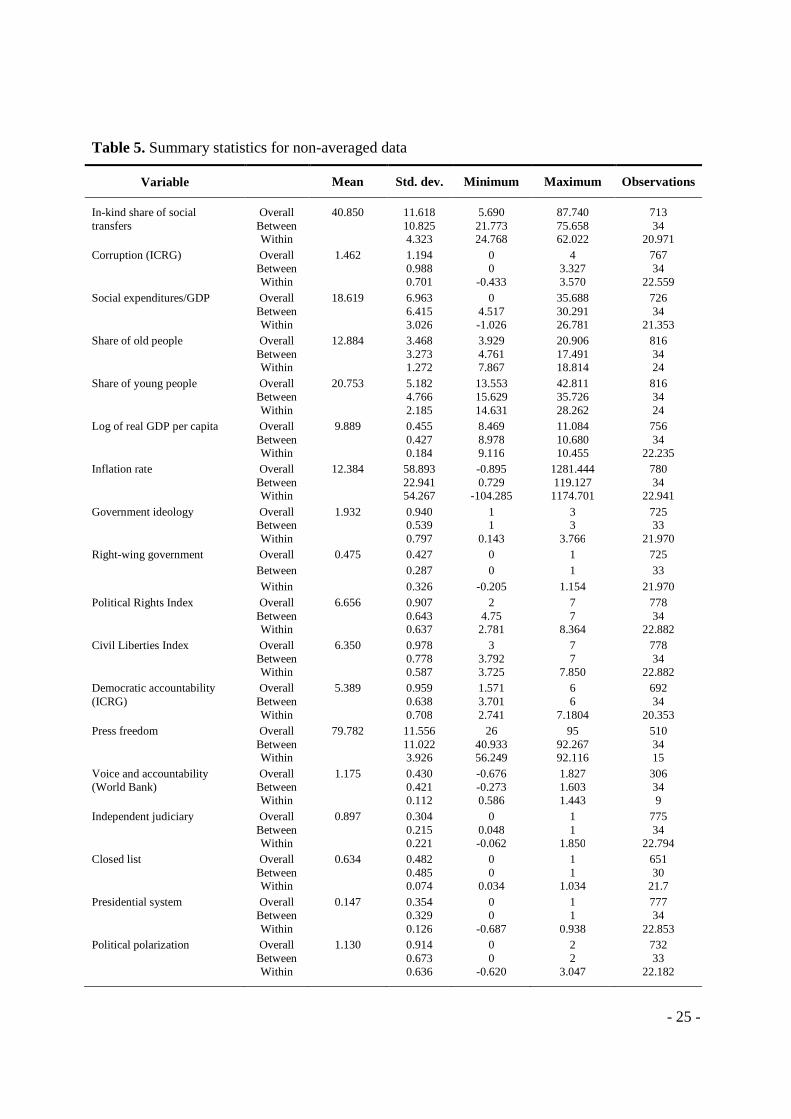
Table 5. Summary statistics for non-averaged data
Variable Mean Std. dev. Minimum Maximum Observations
In-kind share of social transfers
Overall 40.850 11.618 5.690 87.740 713 Between 10.825 21.773 75.658 34
Within 4.323 24.768 62.022 20.971 Corruption (ICRG) Overall 1.462 1.194 0 4 767 Between 0.988 0 3.327 34 Within 0.701 -0.433 3.570 22.559 Social expenditures/GDP Overall 18.619 6.963 0 35.688 726 Between 6.415 4.517 30.291 34 Within 3.026 -1.026 26.781 21.353 Share of old people Overall 12.884 3.468 3.929 20.906 816 Between 3.273 4.761 17.491 34 Within 1.272 7.867 18.814 24 Share of young people Overall 20.753 5.182 13.553 42.811 816 Between 4.766 15.629 35.726 34 Within 2.185 14.631 28.262 24 Log of real GDP per capita Overall 9.889 0.455 8.469 11.084 756 Between 0.427 8.978 10.680 34 Within 0.184 9.116 10.455 22.235 Inflation rate Overall 12.384 58.893 -0.895 1281.444 780 Between 22.941 0.729 119.127 34 Within 54.267 -104.285 1174.701 22.941 Government ideology Overall 1.932 0.940 1 3 725 Between 0.539 1 3 33 Within 0.797 0.143 3.766 21.970 Right-wing government Overall 0.475 0.427 0 1 725 Between 0.287 0 1 33 Within 0.326 -0.205 1.154 21.970 Political Rights Index Overall 6.656 0.907 2 7 778 Between 0.643 4.75 7 34 Within 0.637 2.781 8.364 22.882 Civil Liberties Index Overall 6.350 0.978 3 7 778 Between 0.778 3.792 7 34 Within 0.587 3.725 7.850 22.882 Democratic accountability Overall 5.389 0.959 1.571 6 692 (ICRG) Between 0.638 3.701 6 34 Within 0.708 2.741 7.1804 20.353 Press freedom Overall 79.782 11.556 26 95 510 Between 11.022 40.933 92.267 34 Within 3.926 56.249 92.116 15 Voice and accountability Overall 1.175 0.430 -0.676 1.827 306 (World Bank) Between 0.421 -0.273 1.603 34 Within 0.112 0.586 1.443 9 Independent judiciary Overall 0.897 0.304 0 1 775 Between 0.215 0.048 1 34 Within 0.221 -0.062 1.850 22.794 Closed list Overall 0.634 0.482 0 1 651 Between 0.485 0 1 30 Within 0.074 0.034 1.034 21.7 Presidential system Overall 0.147 0.354 0 1 777 Between 0.329 0 1 34 Within 0.126 -0.687 0.938 22.853 Political polarization Overall 1.130 0.914 0 2 732 Between 0.673 0 2 33 Within 0.636 -0.620 3.047 22.182
- 26 -
Figure 6. Evolution of in-kind shares of social expenditures: 34 OECD countries, 1984-2007
Source: OECD SOCX Database
1030507090
1030507090
1030507090
1030507090
1030507090
1030507090
1980 1990 2000 2010 1980 1990 2000 2010
1980 1990 2000 2010 1980 1990 2000 2010 1980 1990 2000 2010 1980 1990 2000 2010
Australia Austria Belgium Canada Chile Czech Republic
Denmark Estonia Finland France Germany Greece
Hungary Iceland Ireland Israel Italy Japan
Luxembourg Mexico Netherlands New Zealand Norway Poland
Portugal Slovak Republic Slovenia South Korea Spain Sweden
Switzerland Turkey United Kingdom United States
year
- 27 -
References
Adema, W., P. Fron and M. Ladaique (2011). Is the European Welfare State Really More Expensive?
Indicators on Social Spending, 1980-2012; and a Manual to the OECD Social Expenditure
Database (SOCX). OECD Social, Employment and Migration Working Papers, No. 124.
Aidt, T., J. Dutta and V. Sena (2008). Governance Regimes, Corruption and Growth: Theory and
Evidence. Journal of Comparative Economics 36, 195–220.
Balestrino, A. (2000). The Desirability of In-kind Transfers in the Presence of Distortionary Taxes.
Journal of Economic Surveys 13, 333-354.
Bearse, P. M., G. Glomm, and E. Janeba (2000). Why Poor Countries Rely Mostly on Redistribution in-
Kind. Journal of Public Economics 75(3), 463-481.
Bergstrom, T. and S. Blomquist (1996). The Political Economy of Subsidized Day Care. European
Journal of Political Economy 12, 443-457.
Besley, T. and S. Coate (1991). Public Provision of Private Goods and the Redistribution of Income.
American Economic Review 81, 979-984.
Blackorby, C. and D. Donaldson (1988). Cash versus Kind, Self-selection, and Efficient Transfers.
American Economic Review 78, 691-700.
Blomquist, S. and V. Christiansen (1995). Public Provision of Private Goods as a Redistributive Device in
an Optimum Income Tax Model. Scandinavian Journal of Economics 97, 547-567.
Blundell, R. W. and S. R. Bond (1988). Initial Conditions and Moment Restrictions in Dynamic Panel
Data Models. Journal of Econometrics 87(1), 115-143.
Bruno, G. S. F. (2005a). Approximating the Bias of the LSDV Estimator for Dynamic Unbalanced Panel
Data Models. Economics Letters 87(3), 361-366.
Bruno, G. S. F. (2005b). Estimation and Inference in Dynamic Unbalanced Panel Data Models with a
Small Number of Individuals. Stata Journal 5(4), 473-500
Congleton, R. D. and F. Bose (2010). The Rise of the Modern Welfare State, Ideology, Institutions and
Income Security: Analysis and Evidence. Public Choice 144, 535-555.
Currie, J. and F. Gahvari (2008). Transfers in Cash and In-Kind: Theory Meets the Data. Journal of
Economic Literature 46(2), 333–83.
De Donder, P. and J. Hindriks (1998). The Political Economy of Targeting. Public Choice 95(1-2), 177-
200.
Epple, D. and R. E. Romano (1996a). Ends against the Middle: Determining Public Service Provision
When There are Private Alternatives. Journal of Public Economics 62(3), 297-325.
Epple, D. and R. E. Romano (1996b). Public Provision of Private Goods. Journal of Political Economy
104(1), 57-84.
- 28 -
Fernandez, R. and R. Rogerson (1998). On the Political Economy of Education Subsidies. Review of
Economic Studies 62(2), 249-62.
Freedom House (1998). Freedom in the World: The Annual Survey of Political and Civil Liberties.
Transaction: New Brunswick, NJ. Data available at: http://freedomhouse.org/.
Gouveia, M. (1997). Majority Rule and the Public Provision of a Private Good. Public Choice 93(3-4),
221-44.
Gupta, S., L. R. de Mello, and R. Sharan (2001). Corruption and Military Spending. European Journal of
Political Economy 17 (4), 749–777.
Hessami, Z. (2011). Corruption and the Composition of Public Expenditures: Evidence from OECD
Countries. MPRA Working Paper No. 25945, 1-29.
Hessami, Z. and S. Uebelmesser (2013). Empirical Determinants of In-Kind Redistribution: Partisan
Biases and the Role of Inflation. Economics Letters, forthcoming.
Hicks, A. M. and D. H Swank (1992). Politics, Institutions, and Welfare Spending in Industrialized
Democracies, 1960-82. American Political Science Review 86(3), 658-674.
Jain A. K. (2001). Corruption: a Review. Journal of Economic Surveys, 15(1), 71–121.
Lundholm, M. and H. Ohlsson (1998). Wages, Taxes and Publicly Provided Day Care. Journal of
Population Economics 11, 185-204.
Mauro, P. (1997). Why Worry About Corruption. Economic Issues 6, International Monetary Fund.
Mauro, P. (1998). Corruption and the Composition of Government Expenditure. Journal of Public
Economics 69, 263-279.
Méndez, F. and F. Sepúlveda (2006). Corruption, Growth and Political Regimes: Cross Country Evidence.
European Journal of Political Economy 22, 82-98.
Munro, A. (1992). Self-selection and Optimal In-kind Transfers. Economic Journal 102, 1184-1196.
OECD (2011). Social Expenditure Database (SOCX) 1980-2007, OECD: Paris.
Reuters (2011). Greek Phantom Pensioners Claim Benefits after Death. http://www.reuters.
com/article/2011/08/12/us-greece-pensioners-idUSTRE77B4BV20110812 (12 August 2011).
Rodrik, D. (1998). Why Do More Open Economies Have Bigger Governments? Journal of Political
Economy 106(5), 997-1032.
Ter Rele, H. (2007). Measuring the Lifetime Redistribution Achieved by Dutch Taxation, Cash Transfer
and Non-Cash Benefits Programs. Review of Income and Wealth 53(2), 335-362.
Thum, C. (2000). Die öffentliche Bereitstellung privater Güter, Europäische Hochschulschriften, Reihe 5,
Band 2640, Peter Lang Verlag: Frankfurt am Main.
Thum, C. and M. Thum (2001). Repeated Interaction, Redistribution, and the Public Provision of Private
Goods. Scandinavian Journal of Economics 103, 625-643.
- 29 -
WHO (2005): Health Care Systems in Transition: Switzerland. European Observatory on Health Care
Systems. http://www.euro.who.int/__data/assets/pdf_file/0003/96411/E68670.pdf


![2008 05 white presentation at 39th konstanz seminar konstanz 7 may 2008 [mode de compatibilité]](https://img.pdfslide.us/doc/110x75/559877471a28ab39058b461e/2008-05-white-presentation-at-39th-konstanz-seminar-konstanz-7-may-2008-mode-de-compatibilite.jpg)