Embed Size (px)
Citation preview

CAR 2011
University of Illinois
Visualizing Text
Loretta AuvilUIUC
February 25, 2011
CAR 2011
University of Illinois
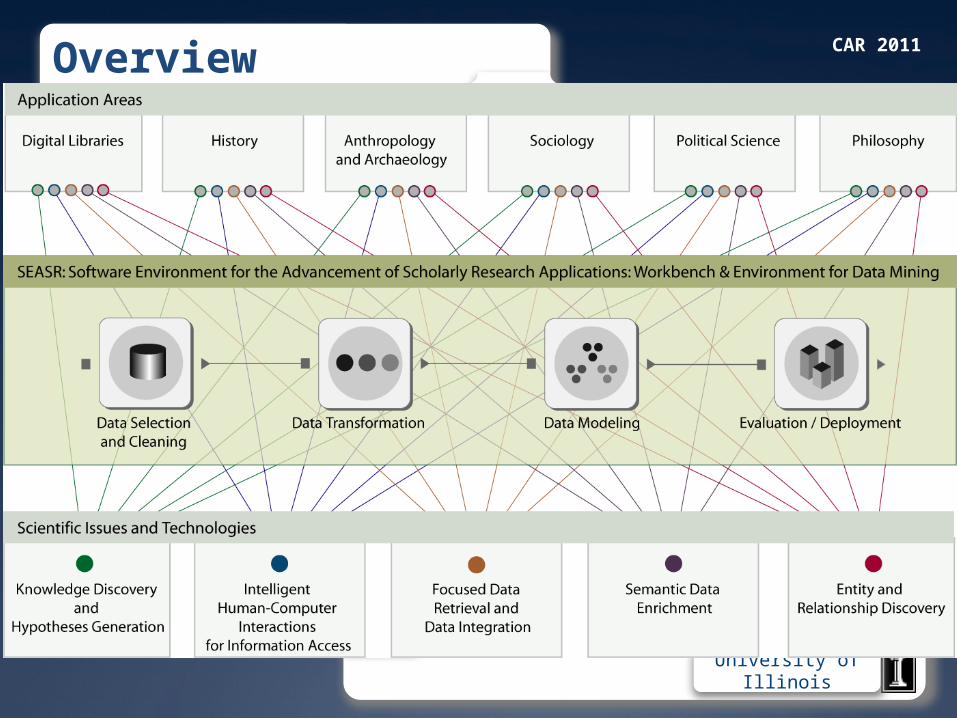
Overview
CAR 2011
University of Illinois
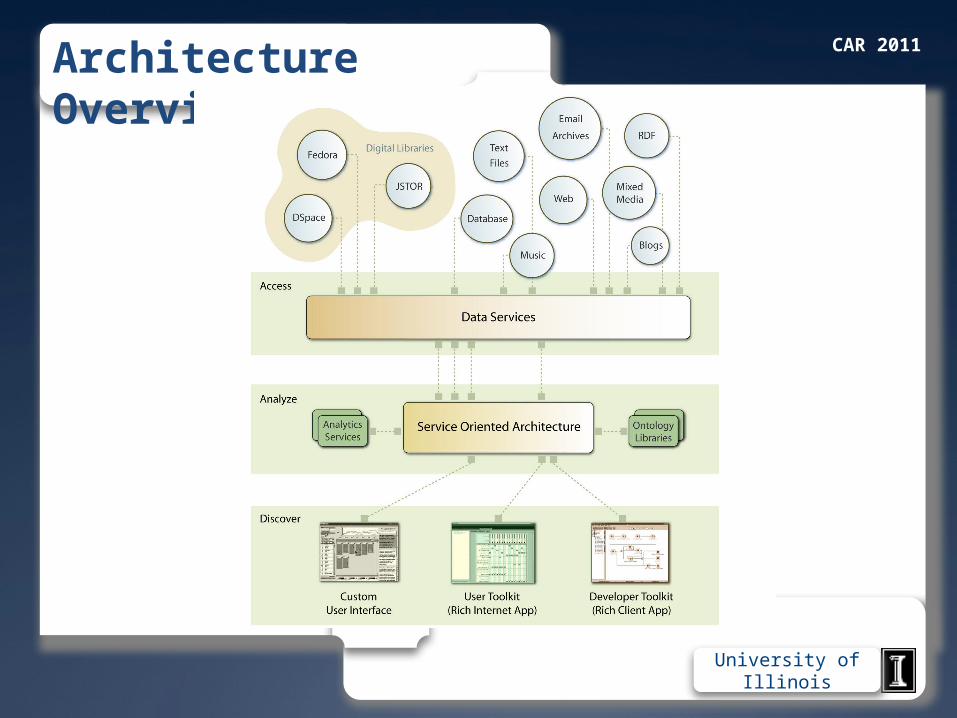
Architecture Overview
CAR 2011
University of Illinois
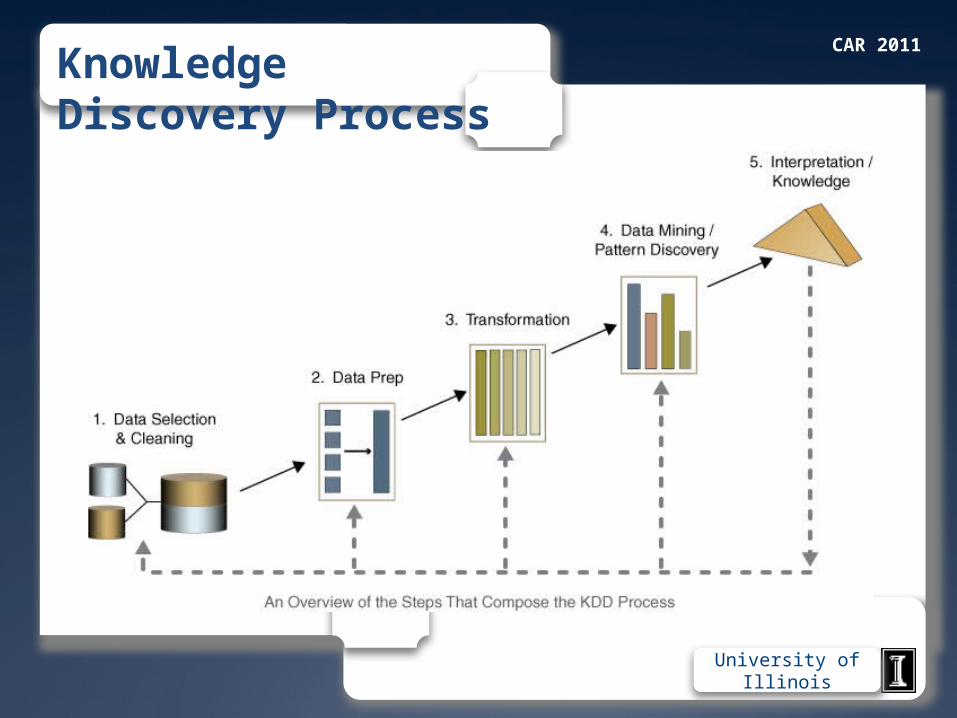
Knowledge Discovery Process
CAR 2011
University of Illinois
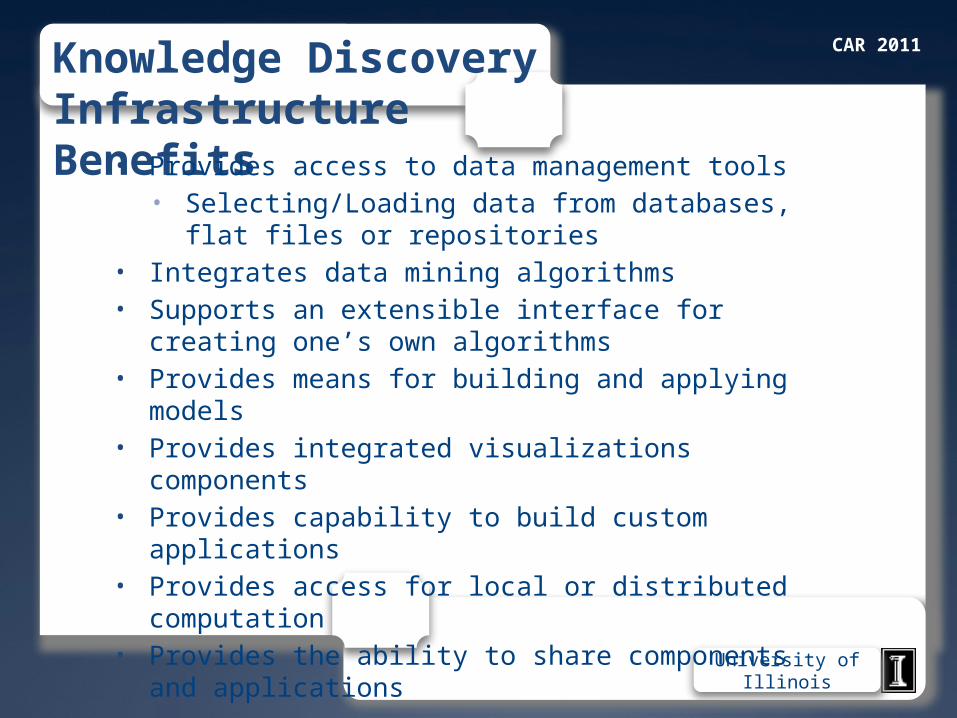
Knowledge Discovery Infrastructure Benefits
• Provides access to data management tools• Selecting/Loading data from databases, flat files or
repositories• Integrates data mining algorithms • Supports an extensible interface for creating one’s own
algorithms• Provides means for building and applying models• Provides integrated visualizations components• Provides capability to build custom applications• Provides access for local or distributed computation• Provides the ability to share components and applications
CAR 2011
University of Illinois
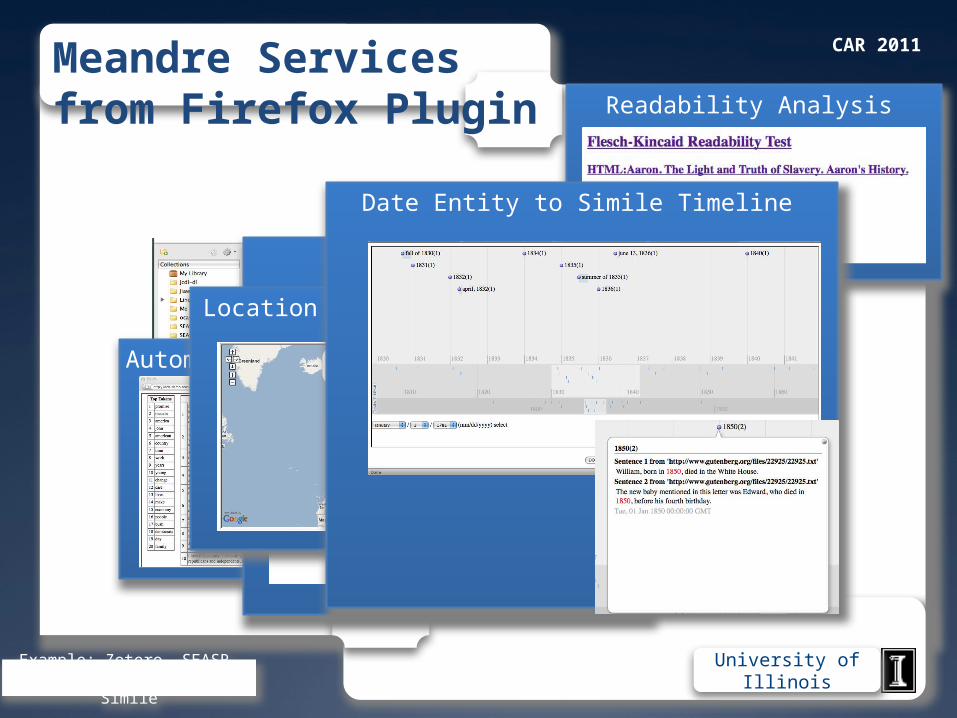
Meandre Services from Firefox Plugin
Tag Cloud Analysis
Readability Analysis
Automatic Summarization
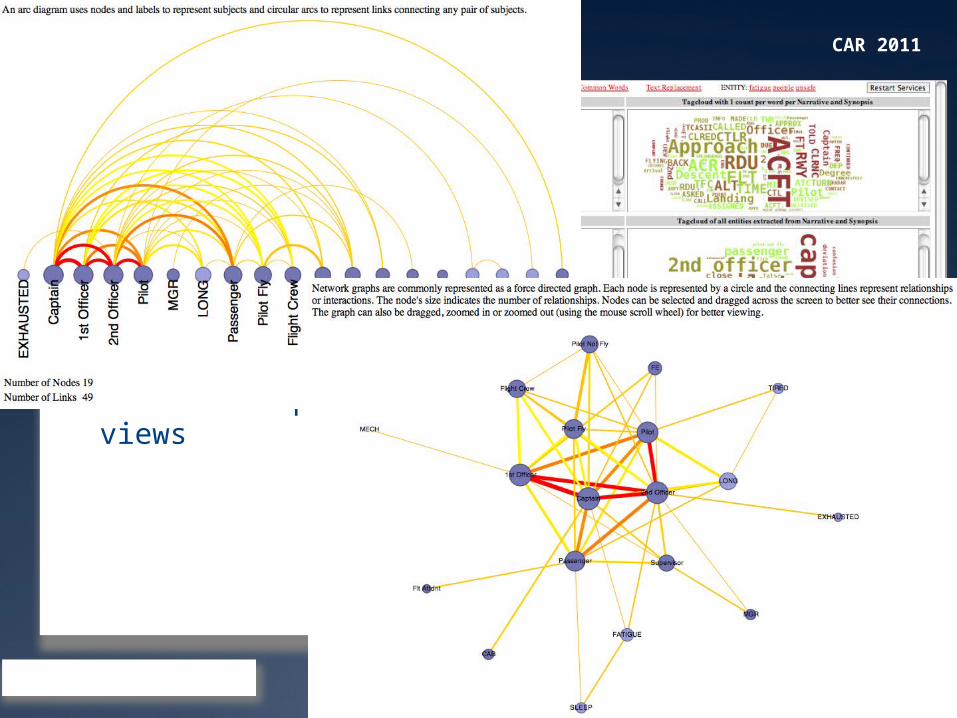
Network Analysis
Location Entity to Google Map
Date Entity to Simile Timeline
Example: Zotero, SEASR, Protovis, Google Maps,
Simile
CAR 2011
University of Illinois
Mashups & Dashboards
• Html driven dashboard
• 6 services• 4 different tag
cloud views• 2 relationship
views
Example: SEASR, Protovis

CAR 2011
University of Illinois
Locations & Top Words from Tweets• Large Blue circles
are Locations extracted from Tweets
• Orange circles are the Top Words found in these tweets
Example: Twitter, SEASR, Protovis

CAR 2011
University of Illinois
Concept Mapping
Example: SEASR, Flare
CAR 2011
University of Illinois
From Silos to Mashups
• Definition: Mashup is a web page or application that uses and combines data, presentation or functionality from two or more sources to create new services
• Why do we want this?• Enable out services in many applications and on a variety of
devices (laptop, high-res display wall, ipad, iphone or the others)• Share and reuse is a good thing• Reach communities with our tools and their data!!!
• What can we do to change this?• We can think and create data driven solutions so that they can
be mashed up with other tools.• We can build web services that can be deployed or accessed.• We can create API’s to be used.
CAR 2011
University of Illinois
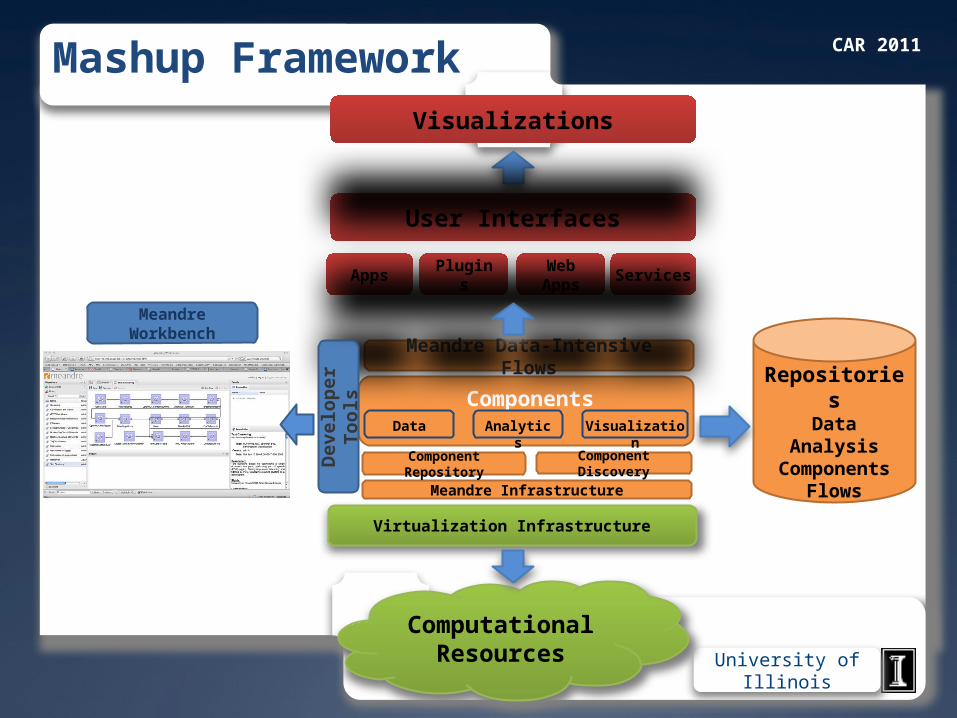
Mashup Framework
Components
Virtualization Infrastructure
Meandre Infrastructure
Visualization
Component Repository
Component Discovery
Meandre Data-Intensive Flows
Apps ServicesPlugin
sWeb Apps
Analytics
Data
Develo
per
Tools
Repositories
DataAnalysis
ComponentsFlows
User Interfaces
Computational Resources
Visualizations
Meandre Workbench

CAR 2011
University of Illinois
Locations
Components
Flows
• Web-based UI• Components and
flows are retrieved from server
• Additional locations of components and flows can be added to server
• Create flow using a graphical drag and drop interface
• Change property values
• Execute the flow
Meandre Workbench
CAR 2011
University of Illinois
Meandre for Mashups
• Major Capabilities • Dataflow execution• Semantic technology (using RDF for storing meta info)• Web-Oriented• Supports publishing services for data, analytics and
visualization• Modular components • Encapsulation and execution mechanism • Promotes reuse, sharing, and collaboration• Cloud-friendly infrastructure• Implements MapReduce for parallelization
• Note: Trading off some performance for reuse, flexibility and modular components… with option to parallelize components to improve performance
CAR 2011
University of Illinois
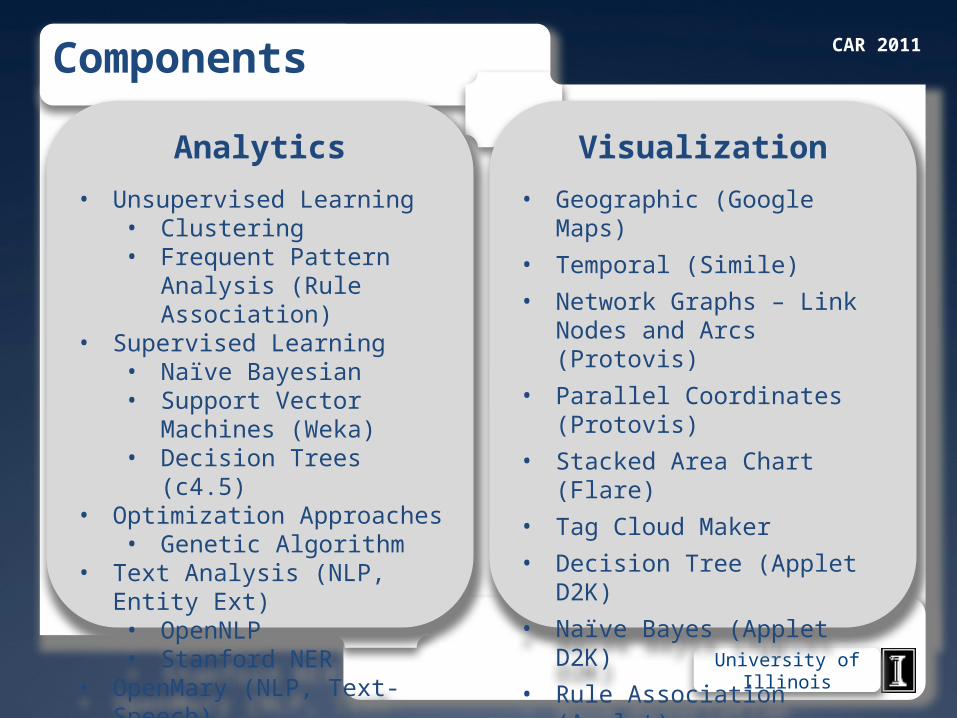
Components
Analytics
• Unsupervised Learning• Clustering• Frequent Pattern Analysis
(Rule Association)• Supervised Learning
• Naïve Bayesian• Support Vector Machines
(Weka)• Decision Trees (c4.5)
• Optimization Approaches• Genetic Algorithm
• Text Analysis (NLP, Entity Ext)• OpenNLP• Stanford NER
• OpenMary (NLP, Text-Speech)
Visualization
• Geographic (Google Maps)
• Temporal (Simile)
• Network Graphs – Link Nodes and Arcs (Protovis)
• Parallel Coordinates (Protovis)
• Stacked Area Chart (Flare)
• Tag Cloud Maker
• Decision Tree (Applet D2K)
• Naïve Bayes (Applet D2K)
• Rule Association (Applet)
• Dendogram (GWT)

CAR 2011
University of Illinois
Links
• www.seasr.org• www.seasr.org/meandre