Embed Size (px)
Citation preview
Negative (Environmental Policy)
Leakage
Don Fullerton (UIUC, Finance)
Daniel Karney (UIUC, Economics)
Kathy Baylis (UIUC, ACES)
July 2011 – Camp Resources
Introduction• Worldwide agreement on carbon emissions is
unlikely.• Individual nations are afraid that unilateral
regulation would cause competitive disadvantage and “leakage” (more pollution elsewhere). Mechanisms:– More polluting output from other sector or region, as
prices of goods under carbon tax increase (border adjustment taxes)
– Or, less demand for oil in one place reduces its world price and increases use elsewhere
• Examples:– EU vs. Rest of World– California vs. Rest of United States– Electricity Sector vs. Rest of Domestic Economy

Hundreds of papers, mostly CGE models
• Paltsev (2001) finds a carbon leakage rate of 10%, Babiker (2005) finds 130%, but typical of recent estimates is Elliott et al. (2010) who find 20%.
• Most presume leakage positive, but some find special cases where it could be negative. Four are:
(1) Felder and Rutherford (1993): CGE, if carbon tax leaves unused oil, delay ROW switch to synthetic fuel (tar sands are even more carbon intensive).
(2)Copeland and Taylor (2005): if ROW gains income, they may choose more enviro-quality via their own carbon tax.
Other Literature (cont’d)
(3) Carbon tax may induce R&D into new abatement technology that can be used in the unregulated sector, especially with weak patent protection; Golombek and Hoel (2004), Di Maria and Smulders (2004), Gerlagh and Kuik (2007), Di Maria and van der Werf (2008).
(4) Karp (2010) finds an “extreme example” with particular cross-price elasticities among three inputs (such as labor, capital, and emissions).
Our Contribution
• We demonstrate a substantial negative effect on leakage not found in prior literature, using a very general and simple model without special cases, particular parameters, endogenous policy, or induced technology.
• Very standard analytical general equilibrium model with two sectors that each use carbon, C, and input, K (which could be labor, capital, or composite of both).
• We differentiate, linearize, solve for leakage, and show exactly when the negative term could swamp the positive term (so that total emissions fall by more than in the taxed sector).
To find Negative Leakage requires three reasonable, general
assumptions
1. Outputs of the two sectors are not perfect substitutes.
2. Firms can substitute from carbon to abatement resources (reduce carbon per unit output).
3. Capital is mobile across sectors.
Then a carbon tax in Y induces substitution from C to K, draw K from X, shrink X, which emits less: Abatement Resource Effect (ARE).
Comments• Can represent two countries or regions,
where one produces Y, and the other produces X, but many identical consumers worldwide buy both X and Y.
• Can represent two sectors of a closed economy.
• Perhaps ‘best’ example is EU-ETS, which applies to electricity and major industries, 40% of GHG, especially if expanded to include U.S. and others.
• Omits leakage from falling price of oil in fixed supply, leading to increased consumption in ROW.
However, • Simplest possible model to demonstrate the ARE.
• Any additional leakage term would not remove ARE.
• More complete trade model where both countries produce both goods, would not remove ARE.
• Can add basic and intermediate inputs (Felder and Rutherford 1993); endogenous number of firms (Gurtzgen and Rauscher 2000); imperfect competition (Babiker 2005, Fowlie 2009), but still ARE.
• Even variable factor supply would not remove ARE, …
• … as long as we have 3 key assumptions above (σU not infinite, σY not zero, and K mobile between sectors).
How missed, in existing literature?
• Some assume fixed carbon per unit of each output.
• Some assume factors not mobile between countries.
• Some assume factors mobile between sectors within a country, but then they apply the tax to all carbon.
• Some CGE models may use all 3 key assumptions, but then just report one leakage number > 0.
• None derives analytical expression for leakage in a model where firms can substitute into mobile factors.
More Comments
1. Distinguish between net negative leakage and negative leakage effects: ARE is a negative effect that may lead to net negative leakage
2. Paper does not try to find optimal policy or second-best policy; only impact of given policy
3. No benefit calculation (no MED carbon)4. Common Question: How big/important is
the Abatement Resource Effect? (see Future Work)
The Basic Model
• Two sectors, each with two inputs, in CRTS
– X=X(KX, CX) with elasticity σX
– Y=Y(KY, CY) with elasticity σY
– Prices pX and pY , perfect competition
• Capital, labor, or composite input (K)
– Fixed Quantity: K = KX + KY
– Rental price: pK
• Carbon or other pollutant (C), not in fixed supply
– Tax rates: τX and τY
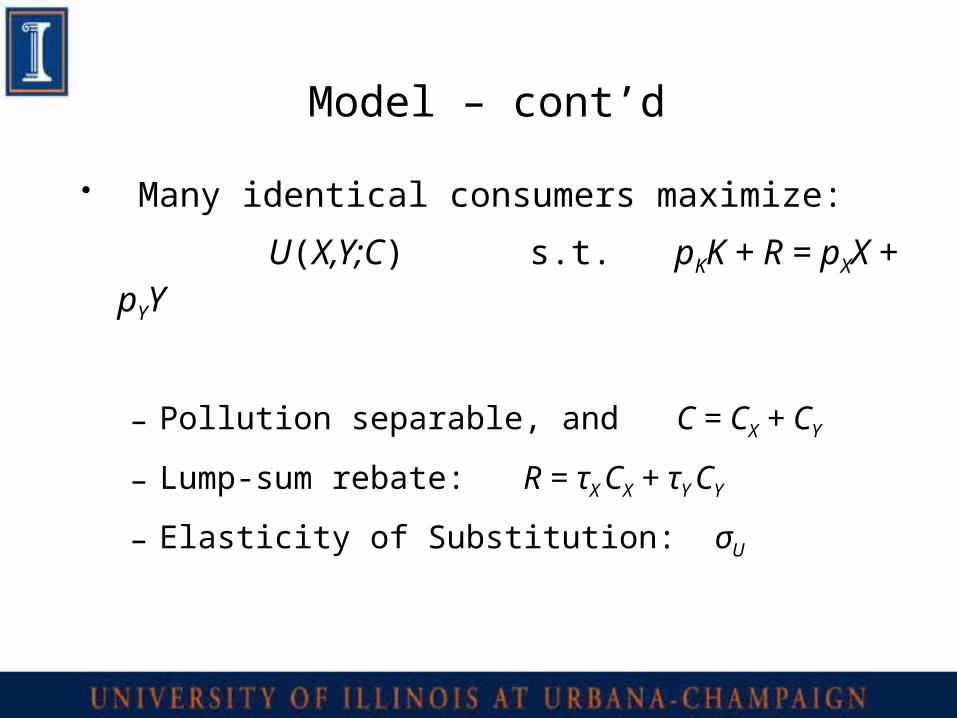
Model – cont’d
• Many identical consumers maximize:
U(X,Y;C) s.t. pKK + R = pXX + pYY
– Pollution separable, and C = CX + CY
– Lump-sum rebate: R = τX CX + τY CY
– Elasticity of Substitution: σU
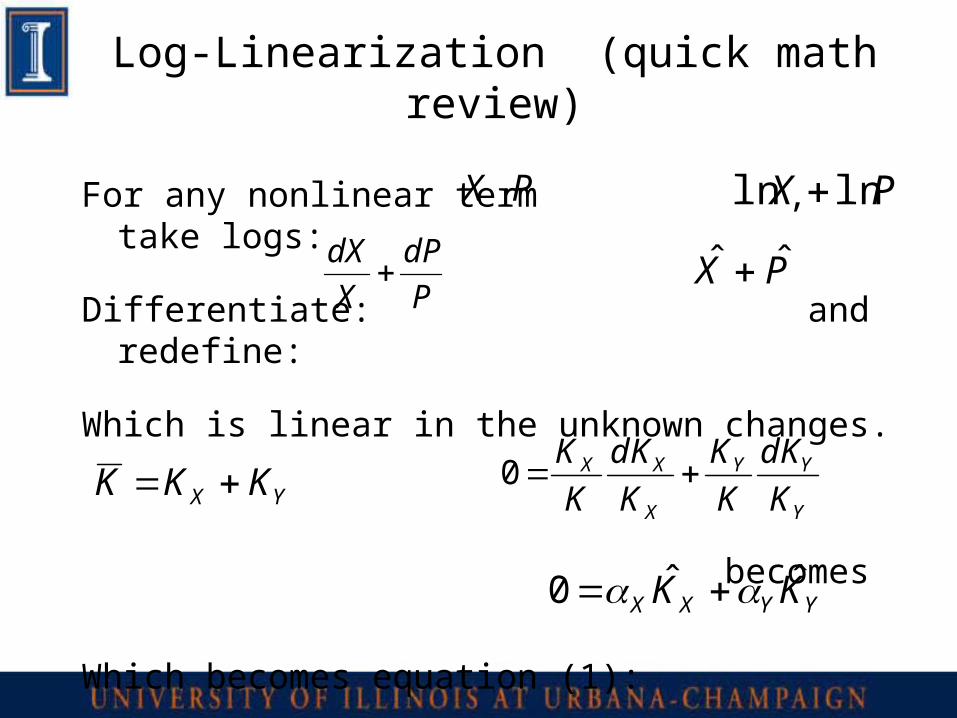
Log-Linearization (quick math review)
For any nonlinear term , take logs:
Differentiate: and redefine:
Which is linear in the unknown changes.
becomes
Which becomes equation (1):
PX PX lnln
P
dP
X
dX PX ˆˆ
YX KKK
YYXX KK ˆˆ0
Y
YY
X
XX
K
dK
K
K
K
dK
K
K0
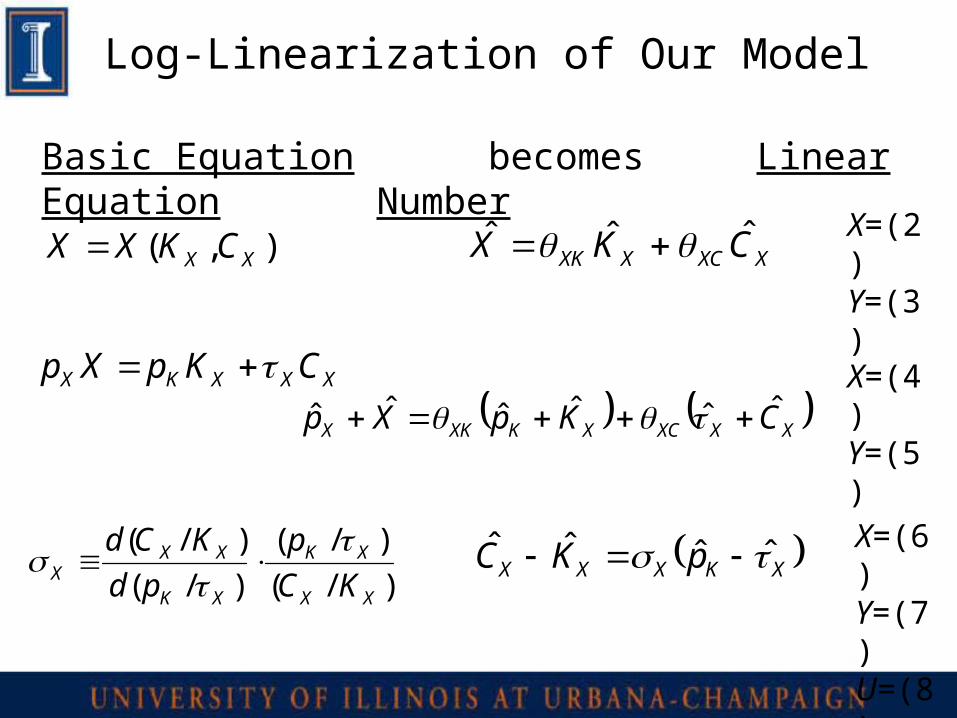
Log-Linearization of Our Model
Basic Equation becomes Linear Equation Number
X=(2)Y=(3)),( XX CKXX XXCXXK CKX ˆˆˆ
X=(4)Y=(5)
XXXKX CKpXp XXXCXKXKX CKpXp ˆˆˆˆˆˆ
X=(6)Y=(7)U=(8)
)/(
)/(
)/(
)/(
XX
XK
XK
XXX KC
p
pd
KCd
XKXXX pKC ˆˆˆˆ
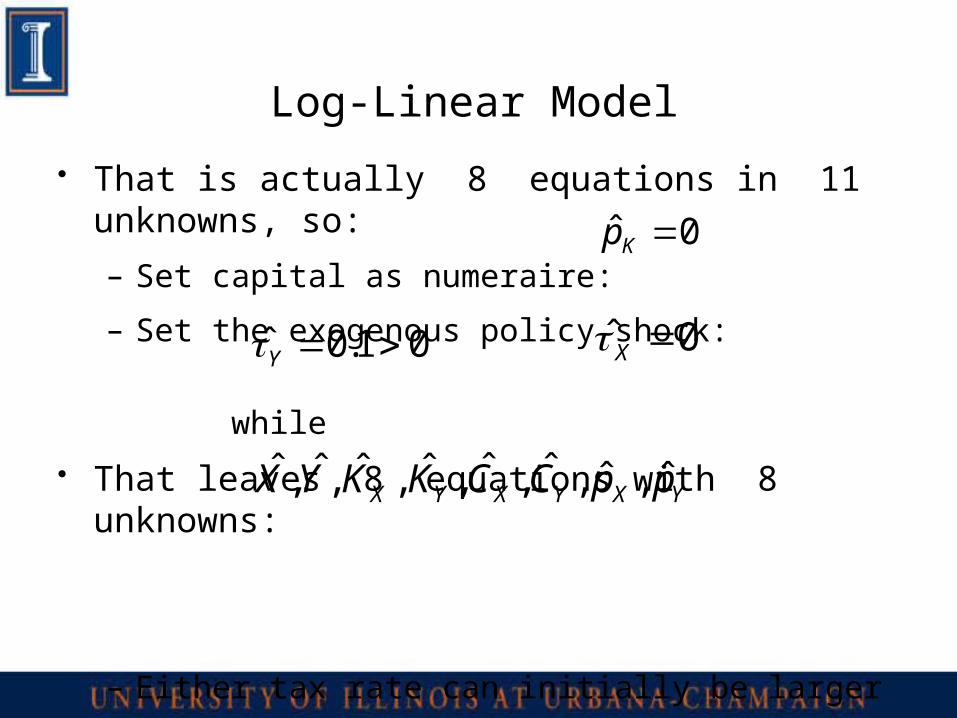
Log-Linear Model
• That is actually 8 equations in 11 unknowns, so:
– Set capital as numeraire:
– Set the exogenous policy shock:
while
• That leaves 8 equations with 8 unknowns:
– Either tax rate can initially be larger
– Tax in X is constant relative to numeraire
0ˆ Kp
0ˆ X01.0ˆ Y
YXYXYX ppCCKKYX ˆ,ˆ,ˆ,ˆ,ˆ,ˆ,ˆ,ˆ
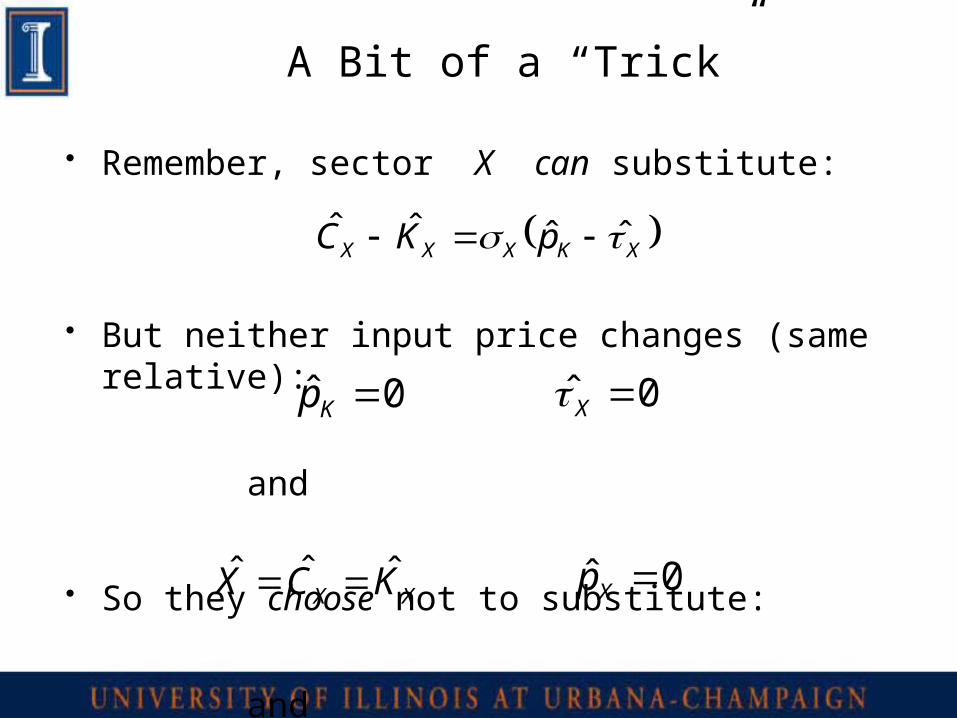
A Bit of a “Trick”
• Remember, sector X can substitute:
• But neither input price changes (same relative):
and
• So they choose not to substitute:
and
XKXXX pKC ˆˆˆˆ
0ˆ Xp
0ˆ Kp 0ˆ X
XX KCX ˆˆˆ
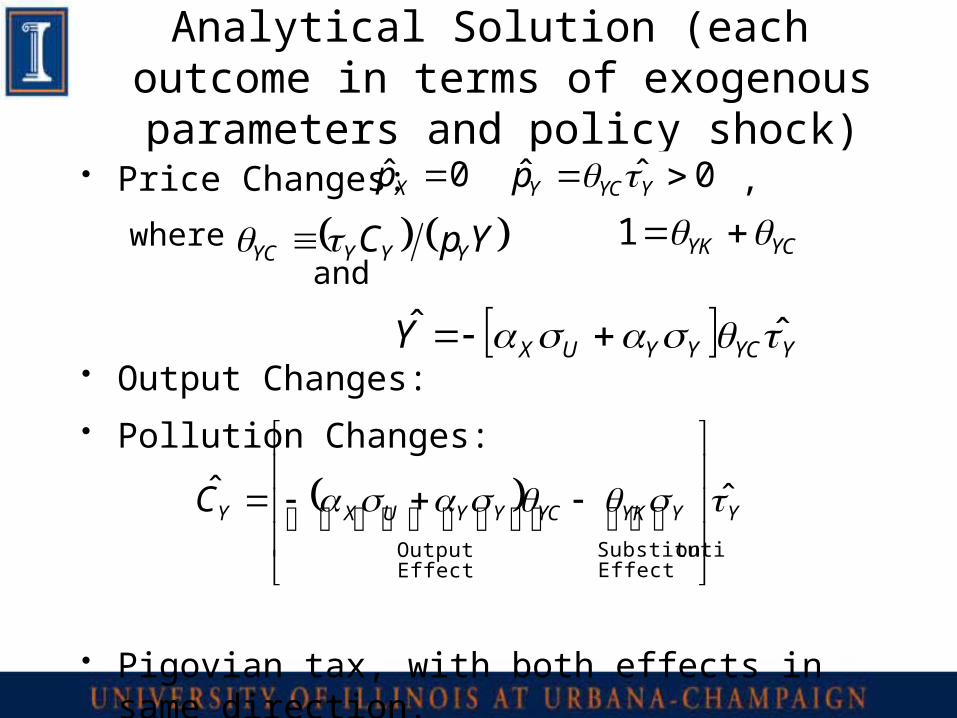
Analytical Solution (each outcome in terms of exogenous parameters and
policy shock)• Price Changes: ,
where and
• Output Changes: • Pollution Changes:
• Pigovian tax, with both effects in same direction.
0ˆ Xp 0ˆˆ YYCYp
YpC YYYYC YCYK 1
YYCYYUXY ˆˆ
YYYKYCYYUXYC ˆˆ
EffectonSubstituti
EffectOutput
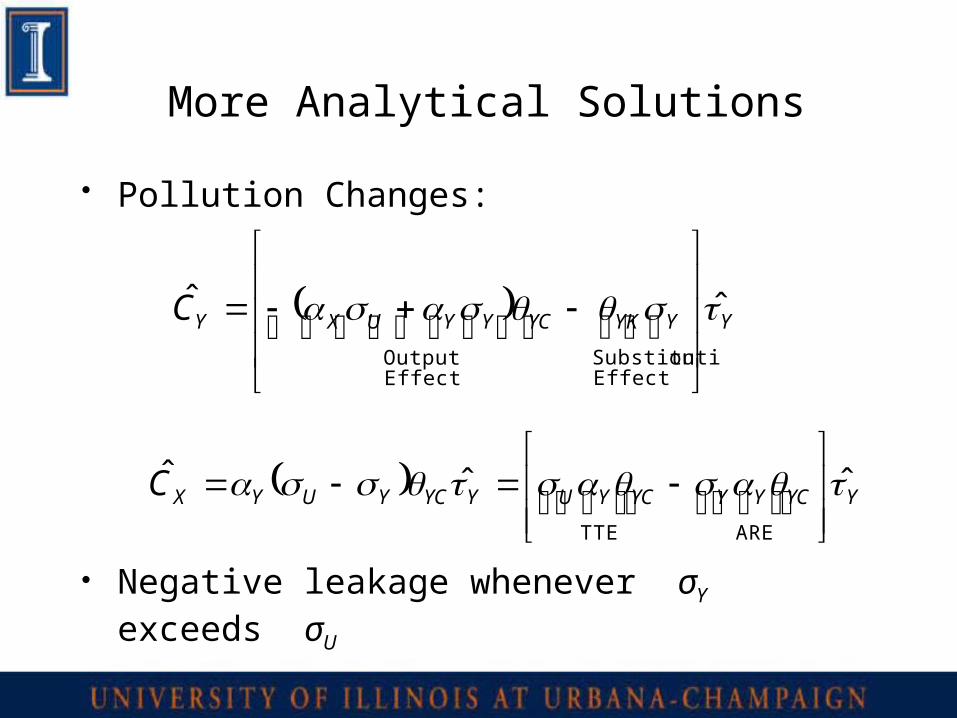
More Analytical Solutions
• Pollution Changes:
• Negative leakage whenever σY exceeds σU
YYYKYCYYUXYC ˆˆ
EffectonSubstituti
EffectOutput
YYCYYYCYUYYCYUYXC ˆˆˆ
ARETTE
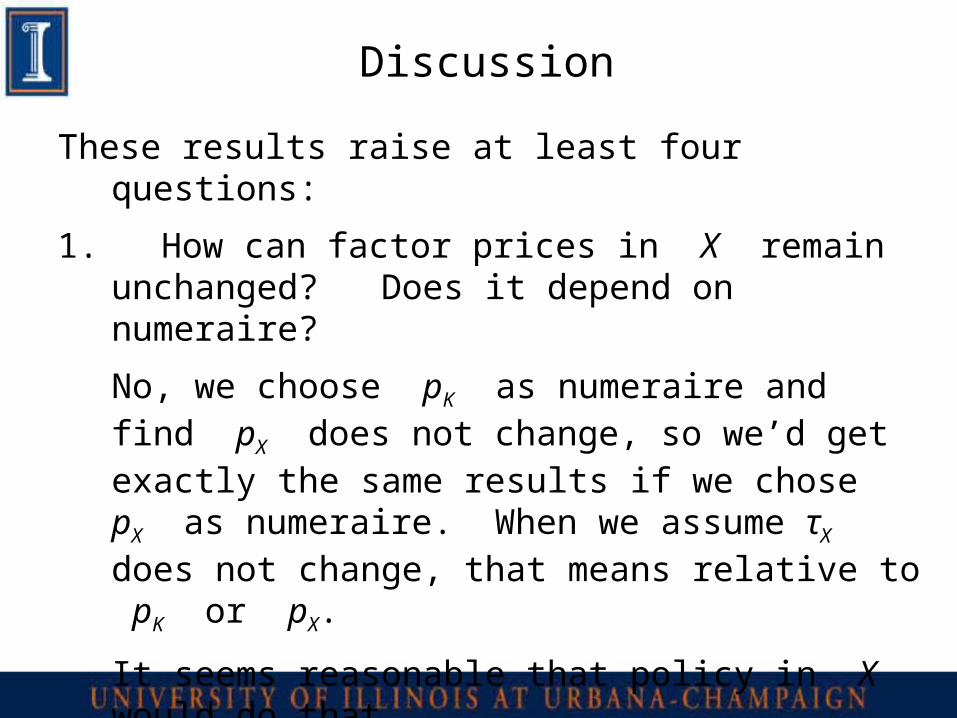
Discussion
These results raise at least four questions:
1. How can factor prices in X remain unchanged? Does it depend on numeraire?
No, we choose pK as numeraire and find pX does not change, so we’d get exactly the same results if we chose pX as numeraire. When we assume τX does not change, that means relative to pK or pX.
It seems reasonable that policy in X would do that.
If instead fixed relative to pY , which rises, then τX must rise, which means additional negative leakage term.
Second Question
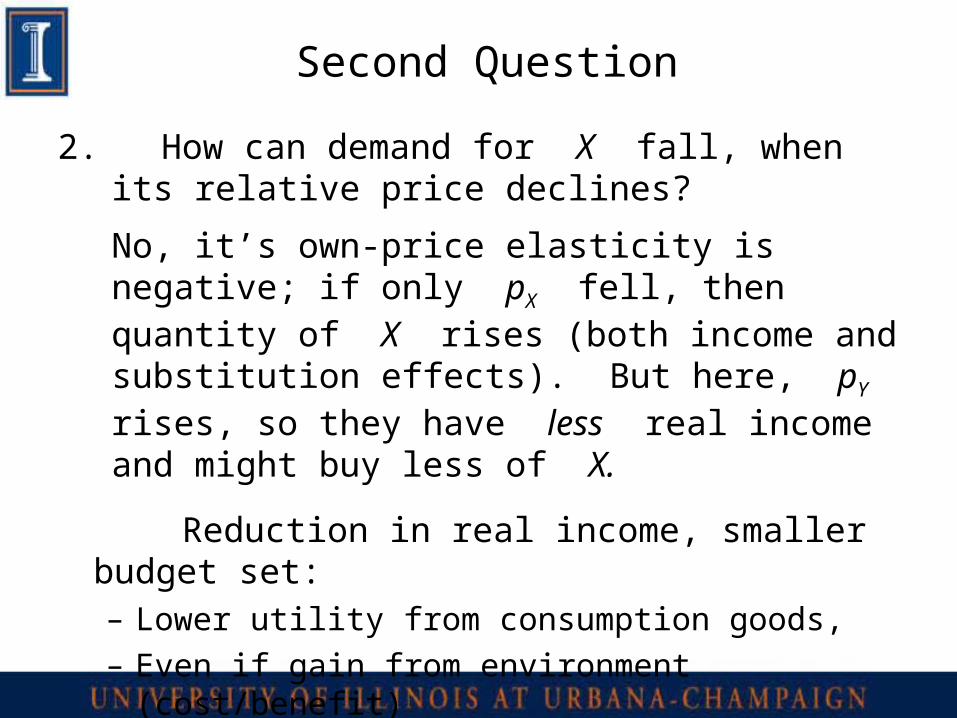
2. How can demand for X fall, when its relative price declines?
No, it’s own-price elasticity is negative; if only pX fell, then quantity of X rises (both income and substitution effects). But here, pY rises, so they have less real income and might buy less of X.
Reduction in real income, smaller budget set:– Lower utility from consumption goods,– Even if gain from environment (cost/benefit)
Third Question
3. How can they lose income, when all of the revenue becomes rebate to consumers? Should that cancel the income effect, so that ?
• Despite this “compensation”, the consumer still cannot reach the original indifference curve.
0ˆ X
Fourth Question
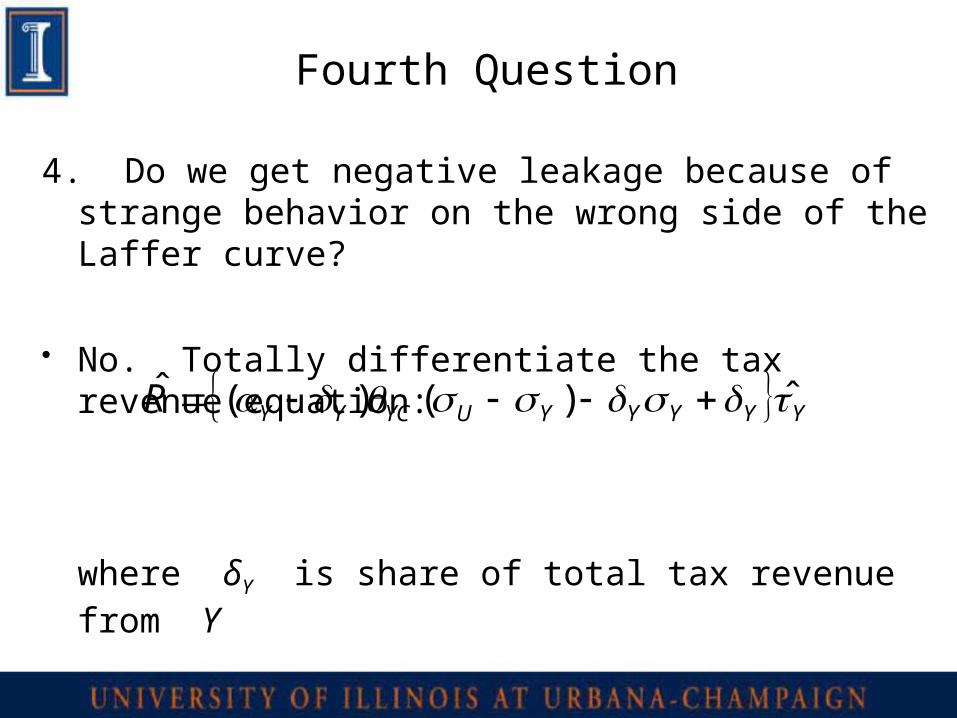
4. Do we get negative leakage because of strange behavior on the wrong side of the Laffer curve?
• No. Totally differentiate the tax revenue equation:
where δY is share of total tax revenue from Y
• Graph change in revenue and leakage in the same space
YYYYYUYCYYR ˆ)()(ˆ
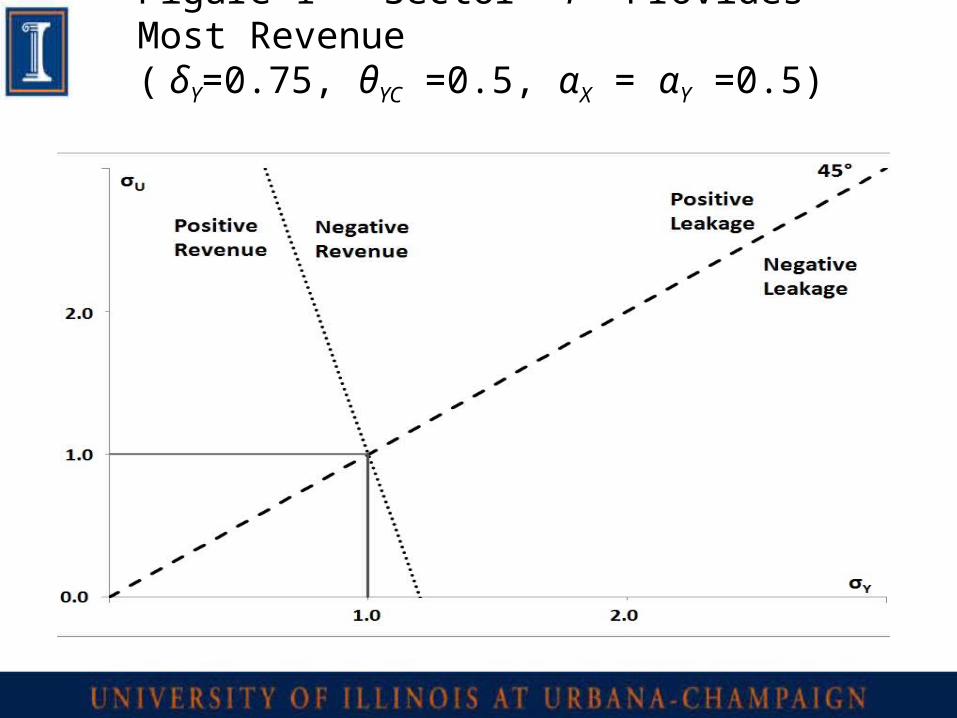
Figure 1 – Sector Y Provides Most Revenue ( δY=0.75, θYC =0.5, αX = αY =0.5)
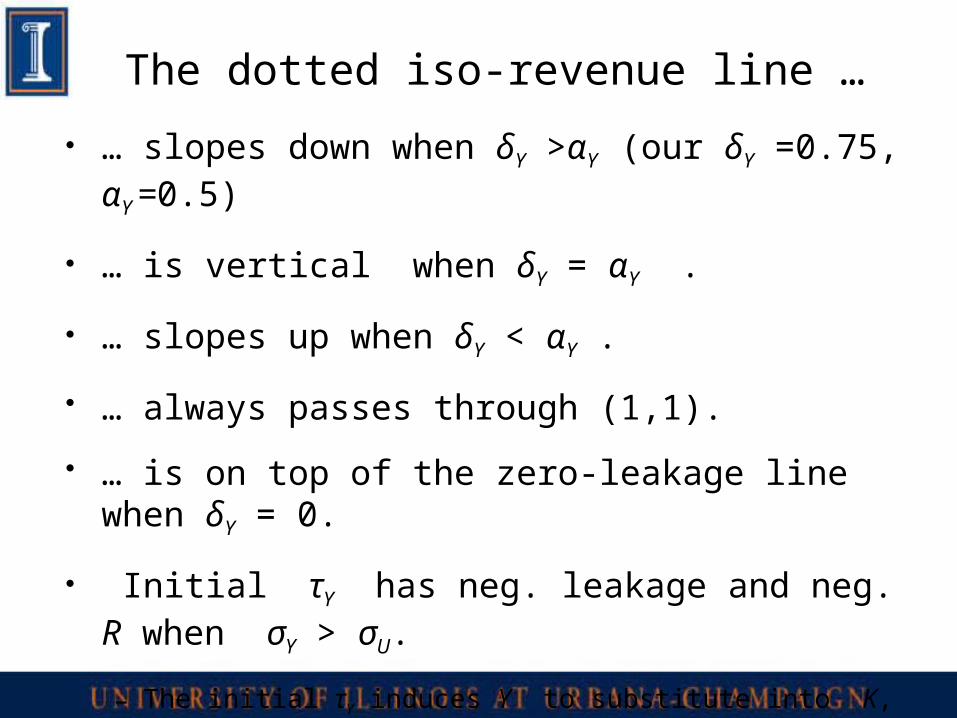
The dotted iso-revenue line …
• … slopes down when δY >αY (our δY =0.75, αY
=0.5)
• … is vertical when δY = αY .
• … slopes up when δY < αY .
• … always passes through (1,1).
• … is on top of the zero-leakage line when δY = 0.
• Initial τY has neg. leakage and neg. R when σY > σU.
– The initial τY induces Y to substitute into K, which draws away from other sector, so X shrinks, with both of its inputs (less CX and less R from τXCX ).
Conclusions (but more…)
• Past CGE models assume trade in the same good, perfect substitutes, where leakage must be positive.
• Or they assume capital is mobile within a region, but not between regions. Then they impose a carbon tax on a whole region (not just one sector).
• Thus they missed this negative leakage effect.
• We build a simple analytical model with imperfect substitutes and mobile capital. Leakage is negative whenever σY exceeds σU .
• We also show connections tax revenue.

Future Work
• We have heard your comments!• Making a richer model to better answer
question: How important is the ARE?• Currently adding features:
1. Adjustable Policy Normalization on τX
2. Government Provision of Public Good; instead of 100% lump-sum rebate
3. Intermediate Energy Good• Shoehorn parameters of CGE model into
expanded analytical model
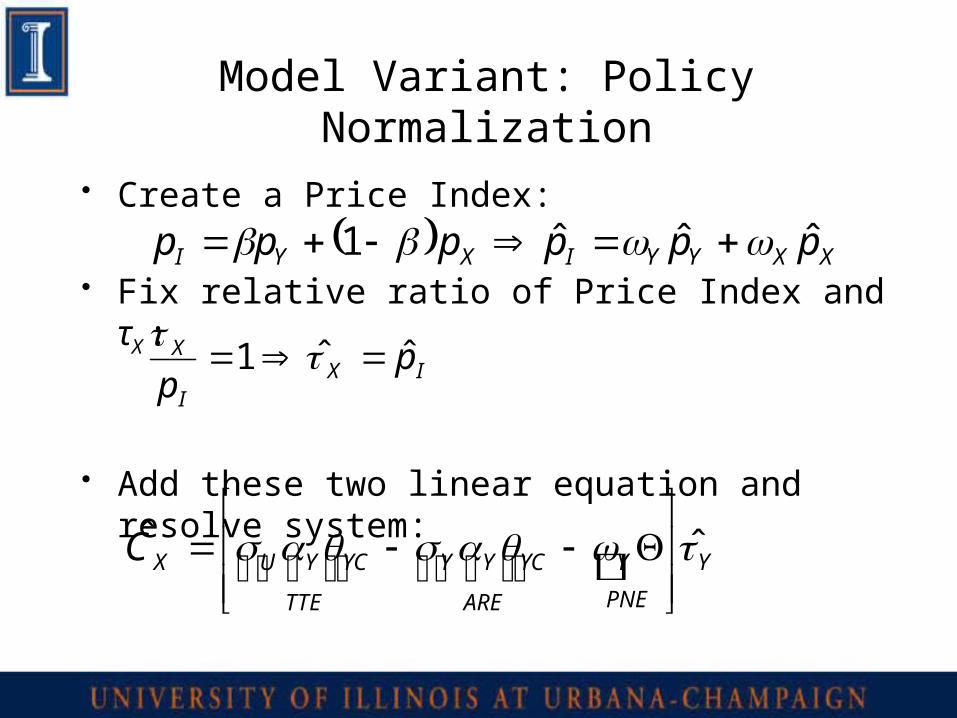
Model Variant: Policy Normalization
• Create a Price Index:
• Fix relative ratio of Price Index and τX :
• Add these two linear equation and resolve system:
XXYYIXYI pppppp ˆˆˆ1
IXI
X pp
ˆˆ1
Y
PNE
Y
ARE
YCYY
TTE
YCYUXC ˆˆ