Embed Size (px)
Citation preview
University of Groningen
Ultrasensitive in situ visualization of active glucocerebrosidase moleculesWitte, Martin D.; Kallemeijn, Wouter W.; Aten, Jan; Li, Kah-Yee; Strijland, Anneke; Donker-Koopman, Wilma E.; Nieuwendijk, Adrianus M.C.H. van den; Bleijlevens, Boris; Kramer,Gertjan; Florea, Bogdan I.Published in:Nature Chemical Biology
DOI:10.1038/nchembio.466
IMPORTANT NOTE: You are advised to consult the publisher's version (publisher's PDF) if you wish to cite fromit. Please check the document version below.
Document VersionPublisher's PDF, also known as Version of record
Publication date:2010
Link to publication in University of Groningen/UMCG research database
Citation for published version (APA):Witte, M. D., Kallemeijn, W. W., Aten, J., Li, K-Y., Strijland, A., Donker-Koopman, W. E., ... Aerts, J. M. F.G. (2010). Ultrasensitive in situ visualization of active glucocerebrosidase molecules. Nature ChemicalBiology, 6(12), 907-913. https://doi.org/10.1038/nchembio.466
CopyrightOther than for strictly personal use, it is not permitted to download or to forward/distribute the text or part of it without the consent of theauthor(s) and/or copyright holder(s), unless the work is under an open content license (like Creative Commons).
Take-down policyIf you believe that this document breaches copyright please contact us providing details, and we will remove access to the work immediatelyand investigate your claim.
Downloaded from the University of Groningen/UMCG research database (Pure): http://www.rug.nl/research/portal. For technical reasons thenumber of authors shown on this cover page is limited to 10 maximum.
Download date: 19-05-2020
1
Ultra-sensitive in situ visualization of active glucocerebrosidase molecules
Witte M.D., Kallemeijn W.W., Aten J., Li K.Y., Strijland A., Donker-Koopman W.E., van
den Nieuwendijk A.M.C.H., Bleijlevens B., Kramer G., Florea B.I., Hooibrink B., Hollak
C.E.M., Ottenhoff R., Boot R.G., van der Marel G.A., Overkleeft H.S., Aerts J.M.F.G.
Supplementary results
Synthesis of the probes
KY170 4, and fluorescent probes MDW933 5 and MDW941 6 were synthesized as follows. First, core
carbocycle 10 was synthesized in 7 steps from D-xylose as described (1). Selective tosylation of the
primary alcohol in 1 by treatment with p-toluenesulfonyl chloride in CH2Cl2 followed by substitution
of the tosylate with sodium azide afforded azido alcohol 11 in 72%. The benzyl groups in 11 were
removed under the agency of BCl3 prior to epoxidation. The resulting free hydroxyls were protected as
the corresponding benzoyl protective groups using benzoyl chloride in pyridine. Epoxidation of
cyclohexene 12 using in situ formed methyl(trifluoromethyl)dioxirane gave epoxides 13 and 14 as a
separable mixture. Deprotection with sodium methoxide in methanol gave 8-deoxy-8-
azidocyclophellitol (KY170, 4). BODIPY Green-alkyne 15 (green fluorescent) or BODIPY Red-
alkyne 16 (red fluorescent) was conjugated to KY170 4 using copper–catalyzed click chemistry,
giving MDW933 5 and MDW941 6 respectively. Non-reactive control probes MDW1064 8 and
MDW1065 9 were synthesized by removing the protective groups in azido alcohol 11 with BCl3 and
subsequent conjugation to either BODIPY Green 15 or BODIPY Red 16.
Supplementary Scheme 1. Synthesis of KY170 4, MDW933 5 and MDW941 6.
Nature Chemical Biology: doi: 10.1038/nchembio.466
2
O OH
OH
OHHO BzO
OBz
OBz
N3
O
HO
OH
OH
N3
O
HO
OBn
OBn
N3
HO
OBn
OBn
HO
BzO
OBz
OBz
N3
BzO
OBz
OBz
N3
O
7 steps
ref. 7
10 11 12 1413D-Xylose
a b c
d
KY170 4
OH
OH
HO
N
O
NB
NF
F
MeO
MeO
NN
OH
OH
HO
N
O
NB
NF
F
NN
MDW933 5
MDW941 6
e
e
HO
OH
OH
N3
17
OH
OH
HO
N
NB
NF
F
MeO
MeO
NN
OH
OH
HO
N
NB
NF
F
NN
g
MDW1065 9
MDW1064 8
f
g
NB
NF
F
MeO
MeO
16
NB
NF
F
15
Nature Chemical Biology: doi: 10.1038/nchembio.466
3
Reagents and conditions: (a) i) p-TosCl, Et3N, CH2Cl2, 0°C; ii) NaN3, DMF, 60°C, 71%; (b) i) BCl3,
CH2Cl2, -78°C, ii) BzCl, pyridine, 70%; (c) CF3COCH3, Oxone, NaHCO3, MeCN/H2O, 13: 49%, 14:
20%; (d) NaOMe, MeOH, 75%; (e) 15 or 16, CuSO4 (10 mol%), sodium ascorbate (15 mol%),
Tol/tert-BuOH/H2O, 90°C, MDW933 5: 56%, MDW941 6: 77%; (f) BCl3, CH2Cl2, -78°C; (g) 15 or
16, CuSO4 (10 mol%), sodium ascorbate (15 mol%), DMF, MDW1064 8: 72%, MDW1065 9: 70%.
Determination of inhibition constants
Previously discontinuous methods have been used to determine the inhibition constants of glycosidase
inhibitors. This method however proved to be unsuitable for the determination of the inhibition
constants of KY170 4, MDW933 5 and MDW941 6 due to their high affinity/fast binding. Therefore
the inhibition constants have been determined in a continuous substrate assay which was first
described in 1982 (2) and has recently been reappraised in 2010 (3). In these experiments, inhibition of
the enzyme and hydrolysis of the substrate proceed concurrently making the situation slightly more
complex than the discontinuous (Scheme 2). The time-dependent interaction of inhibitor (I) with free
β-glucosidase (E) was considered to occur in separate stages (A). A rapid reversible interaction is
followed by a slower, irreversible reaction that transforms the reversible enzyme-inhibitor complex
(EI) into an irreversible enzyme-inhibitor complex (EI*) (Supplementary Scheme 2). Progress curves
were obtained (Supplementary Figure 1a) and apparent rate constant k’ was plotted versus the
concentration (Supplementary Figure 1b) to obtain estimates of the Ki (equilibrium constant) and ki
(rate constant)
Supplementary Scheme 2. Schematic representation of the process occurring during a continuous
substrate assay.
Nature Chemical Biology: doi: 10.1038/nchembio.466
4
KY170 4
20 40 60 80 100
-2000
0
2000
4000
6000
80000 nM
50 nM
100 nM
200 nM
300 nM
400 nM
500 nM
time (min)
Flu
ore
sce
nce
Cyclophellitol 3
20 40 60 80 100
-2000
0
2000
4000
6000
80000 nM
50 nM
100 nM
200 nM
300 nM
400 nM
500 nM
time (min)
Flu
ore
sce
nce
CBE 2
50 100 150
-5000
0
5000
10000
150000
50
70
100
200
300
500
time (min)
Flu
ore
sce
nce
MDW933 5
50 100 150-2000
0
2000
4000
6000
8000
100000 nM
6 nM
8 nM
10 nM
12 nM
14 nM
16 nM
time (min)
Flu
ore
sce
nce
CBE 2
0 100 200 300 400 5000.00
0.05
0.10
0.15
[I] ( M)
kobs (
min
-1)
MDW933 5
0 5 10 15 200.00
0.01
0.02
0.03
0.04
[I] (nM)
kobs (
min
-1)
Cyclophellitol 3
0 200 400 6000.00
0.01
0.02
0.03
[I] (nM)
kobs (
min
-1)
KY170 4
0 200 400 6000.000
0.005
0.010
0.015
0.020
0.025
[I] (nM)
kobs (
min
-1)
a
b
M
M
M
M
M
M
M
MDW941 6
0 5 10 15 200.00
0.02
0.04
0.06
[I] (nM)
kobs (
min
-1)
MDW941 6
20 40 60 80 100
-2000
0
2000
4000
60000 nM
6 nM
8 nM
10 nM
12 nM
14 nM
16 nM
time (min)
Flu
ore
sce
nce
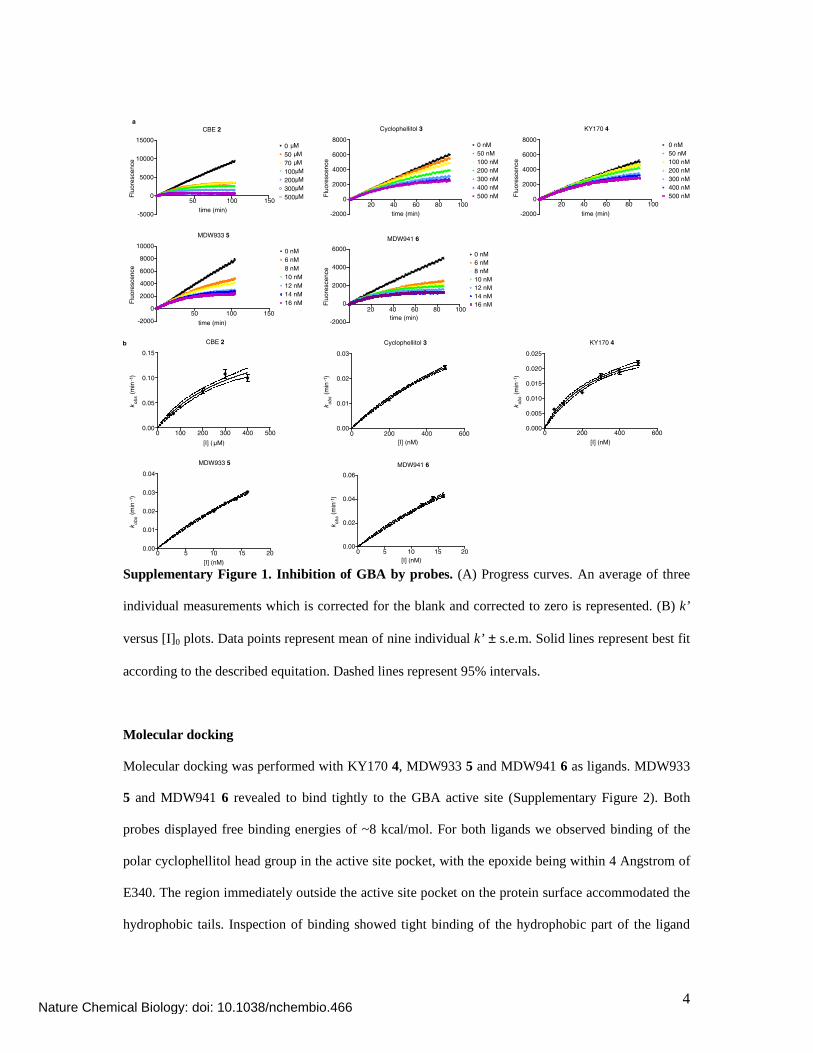
Supplementary Figure 1. Inhibition of GBA by probes. (A) Progress curves. An average of three
individual measurements which is corrected for the blank and corrected to zero is represented. (B) k’
versus [I]0 plots. Data points represent mean of nine individual k’ ± s.e.m. Solid lines represent best fit
according to the described equitation. Dashed lines represent 95% intervals.
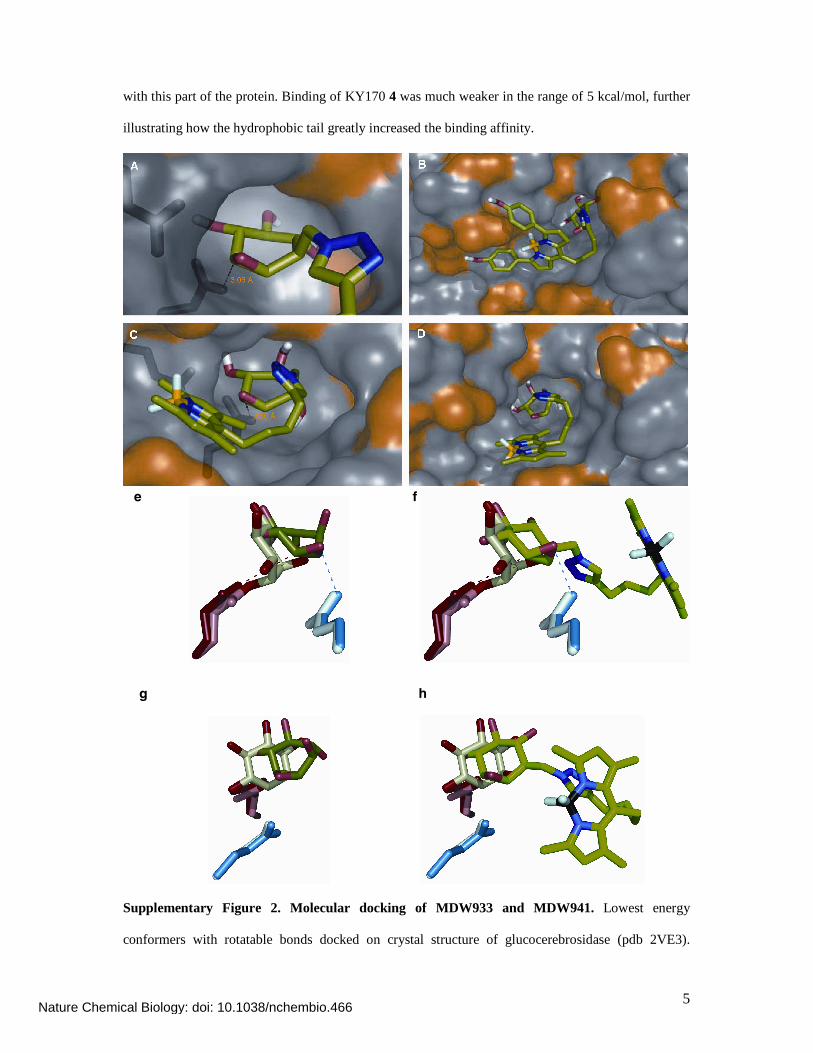
Molecular docking
Molecular docking was performed with KY170 4, MDW933 5 and MDW941 6 as ligands. MDW933
5 and MDW941 6 revealed to bind tightly to the GBA active site (Supplementary Figure 2). Both
probes displayed free binding energies of ~8 kcal/mol. For both ligands we observed binding of the
polar cyclophellitol head group in the active site pocket, with the epoxide being within 4 Angstrom of
E340. The region immediately outside the active site pocket on the protein surface accommodated the
hydrophobic tails. Inspection of binding showed tight binding of the hydrophobic part of the ligand
Nature Chemical Biology: doi: 10.1038/nchembio.466
5
with this part of the protein. Binding of KY170 4 was much weaker in the range of 5 kcal/mol, further
illustrating how the hydrophobic tail greatly increased the binding affinity.
e f
g h
Supplementary Figure 2. Molecular docking of MDW933 and MDW941. Lowest energy
conformers with rotatable bonds docked on crystal structure of glucocerebrosidase (pdb 2VE3).
Nature Chemical Biology: doi: 10.1038/nchembio.466
6
Inhibitor molecule is shown as sticks, GBA as semi-transparent space-filling model, and active-site
residues E235 and E340 as dark-blue sticks (left and right, respectively) (A). Docking of MDW933
shows two common docking conformations (C, D) of -8.2 and -8.1 kcal/mol, docking of MDW941
resulted in -9.6 kcal/mol binding affinity (B). (E-H) Docking comparison with CBE-bound GBA
(2VT0). Top (E) and side (G) view of CBE docked on crystal structure 2V3E (E340, dark red; E235,
dark blue; CBE, dark green) on top of covalent-bound CBE crystal structure 2VT0 (E340, pink; E235,
light blue; CBE, pale green). Top (F) and side (H) view of an overlay of MDW933 (bright green).
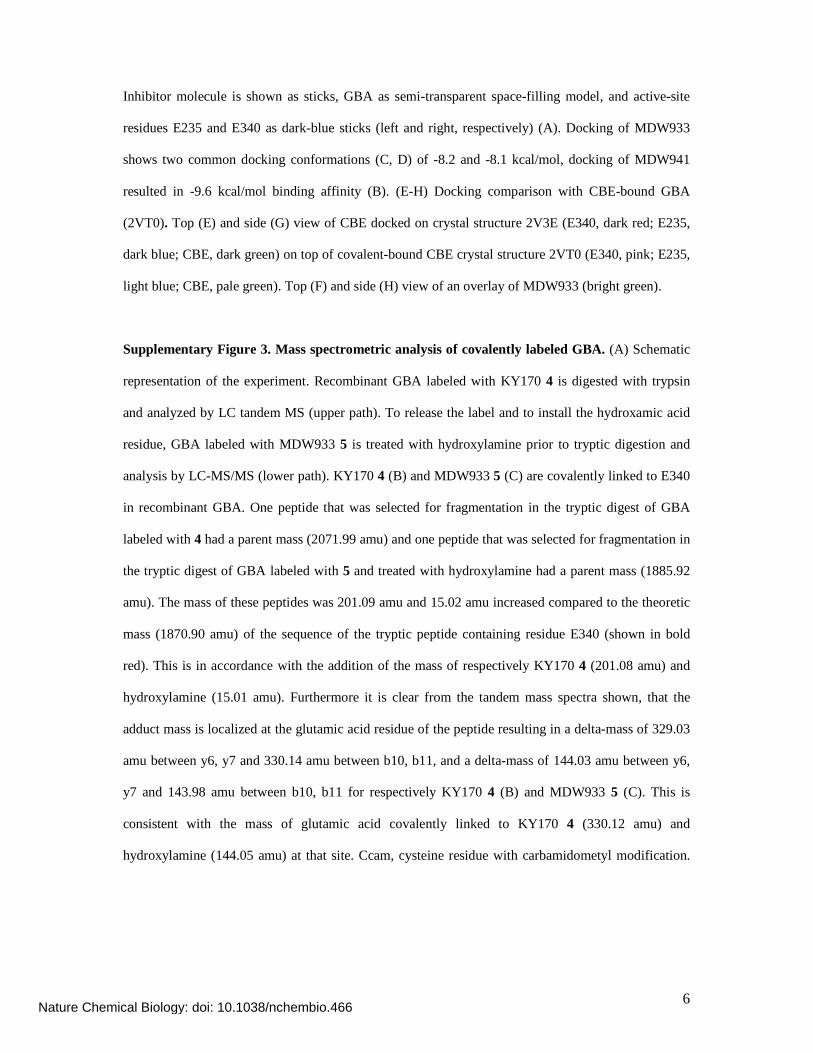
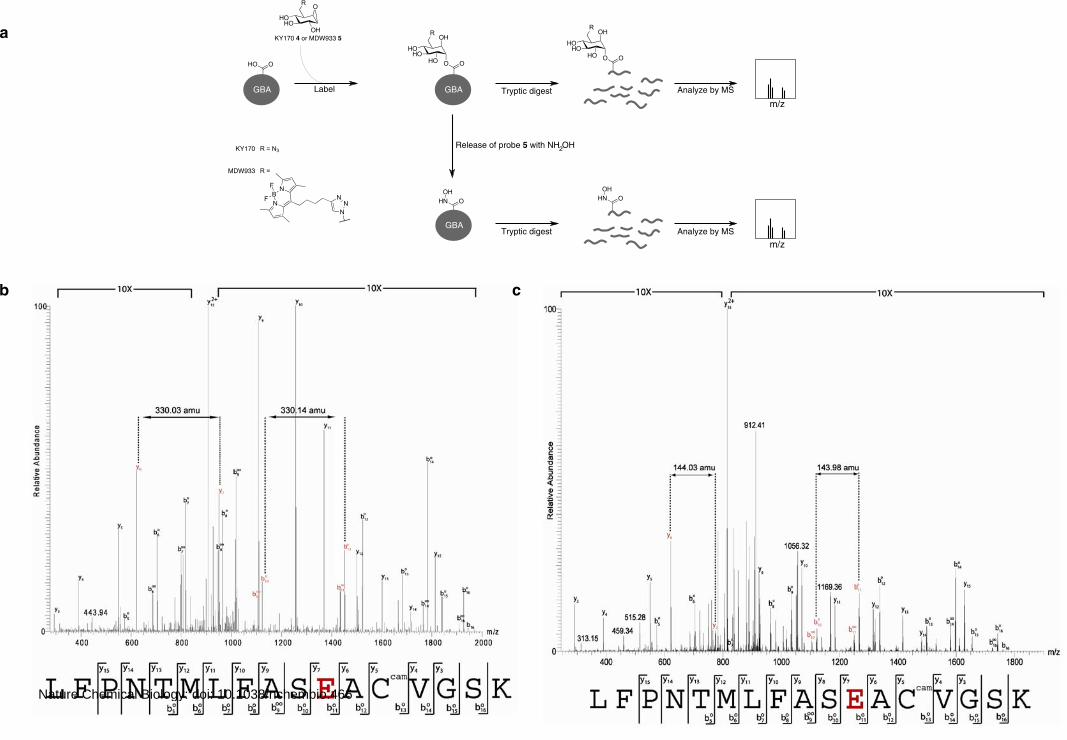
Supplementary Figure 3. Mass spectrometric analysis of covalently labeled GBA. (A) Schematic
representation of the experiment. Recombinant GBA labeled with KY170 4 is digested with trypsin
and analyzed by LC tandem MS (upper path). To release the label and to install the hydroxamic acid
residue, GBA labeled with MDW933 5 is treated with hydroxylamine prior to tryptic digestion and
analysis by LC-MS/MS (lower path). KY170 4 (B) and MDW933 5 (C) are covalently linked to E340
in recombinant GBA. One peptide that was selected for fragmentation in the tryptic digest of GBA
labeled with 4 had a parent mass (2071.99 amu) and one peptide that was selected for fragmentation in
the tryptic digest of GBA labeled with 5 and treated with hydroxylamine had a parent mass (1885.92
amu). The mass of these peptides was 201.09 amu and 15.02 amu increased compared to the theoretic
mass (1870.90 amu) of the sequence of the tryptic peptide containing residue E340 (shown in bold
red). This is in accordance with the addition of the mass of respectively KY170 4 (201.08 amu) and
hydroxylamine (15.01 amu). Furthermore it is clear from the tandem mass spectra shown, that the
adduct mass is localized at the glutamic acid residue of the peptide resulting in a delta-mass of 329.03
amu between y6, y7 and 330.14 amu between b10, b11, and a delta-mass of 144.03 amu between y6,
y7 and 143.98 amu between b10, b11 for respectively KY170 4 (B) and MDW933 5 (C). This is
consistent with the mass of glutamic acid covalently linked to KY170 4 (330.12 amu) and
hydroxylamine (144.05 amu) at that site. Ccam, cysteine residue with carbamidometyl modification.
Nature Chemical Biology: doi: 10.1038/nchembio.466
OHHN O
R O
OH
HOHO
OH
HO
HOHO
O OHO O
GBA Tryptic digest Analyze by MSGBA
KY170 4 or MDW933 5OH
HO
HOHO
O O
Label
GBATryptic digest Analyze by MS
OHHN O
m/z
Release of probe 5 with NH OH 2
RR
NN
NN
BN
F
F
KY170 R = N3
MDW933 R =
m/z
a
b c
Nature Chemical Biology: doi: 10.1038/nchembio.466
8
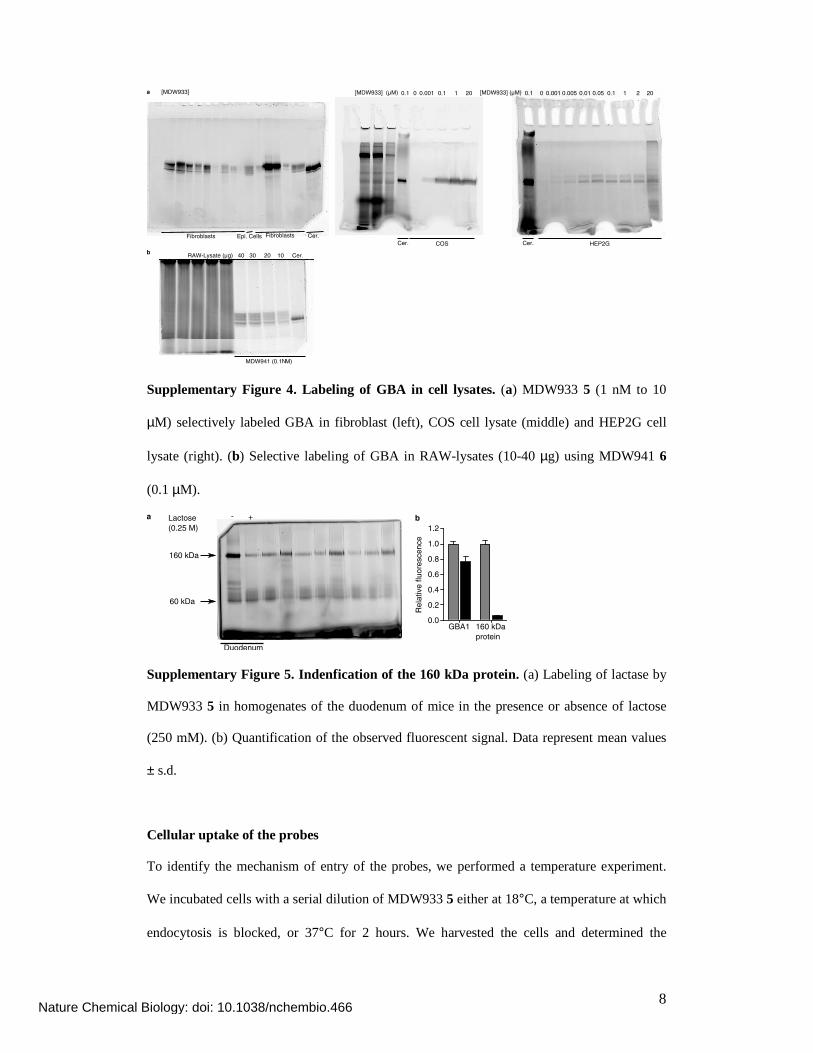
Cer.FibroblastsEpi. CellsFibroblasts
[MDW933] 0.001 0.1 2010
COS Cer.
[MDW933] (μM) 0.1 0.005 0.1 200 210.050.010.001
HEP2G Cer.
[MDW933] (μM) 0.1a
b40 102030 Cer.RAW-Lysate (μg)
MDW941 (0.1 M)N
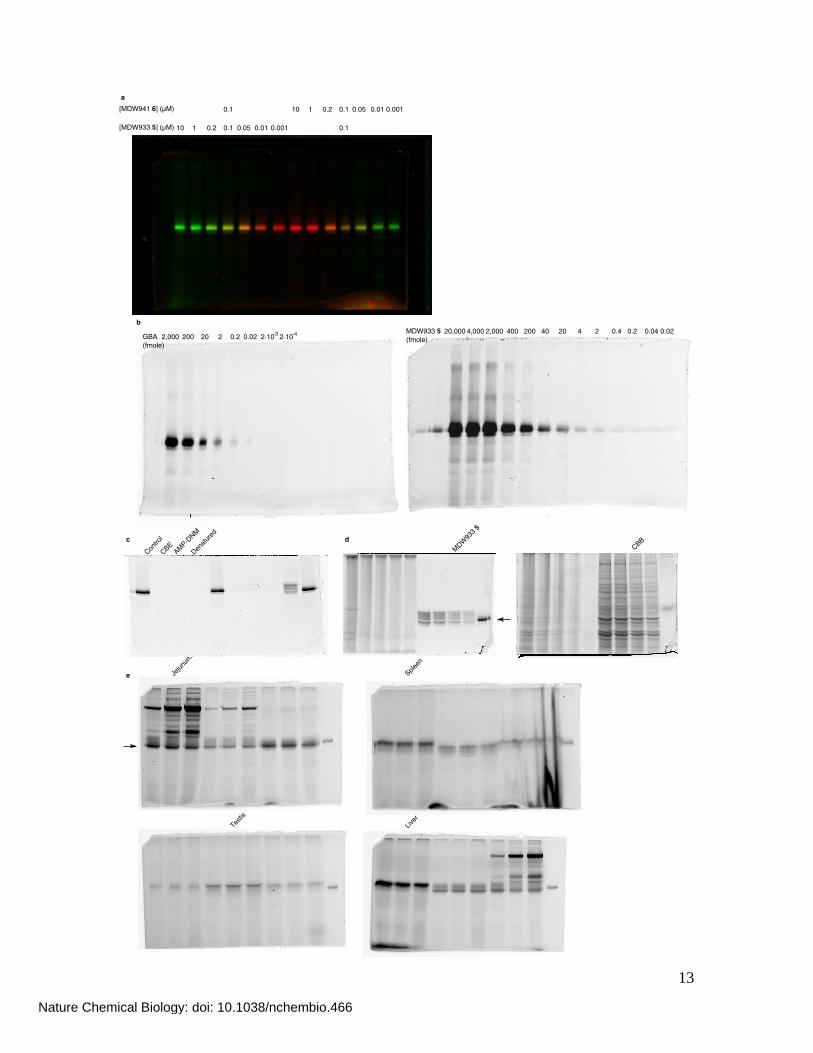
Supplementary Figure 4. Labeling of GBA in cell lysates. (a) MDW933 5 (1 nM to 10
µM) selectively labeled GBA in fibroblast (left), COS cell lysate (middle) and HEP2G cell
lysate (right). (b) Selective labeling of GBA in RAW-lysates (10-40 µg) using MDW941 6
(0.1 µM).
a Lactose
(0.25 M)
- +
60 kDa
160 kDa
Duodenum
0.0
Rela
tive flu
ore
scen
ce
b
GBA1 160 kDa
protein
0.2
0.4
0.6
0.8
1.0
1.2
Supplementary Figure 5. Indenfication of the 160 kDa protein. (a) Labeling of lactase by
MDW933 5 in homogenates of the duodenum of mice in the presence or absence of lactose
(250 mM). (b) Quantification of the observed fluorescent signal. Data represent mean values
± s.d.
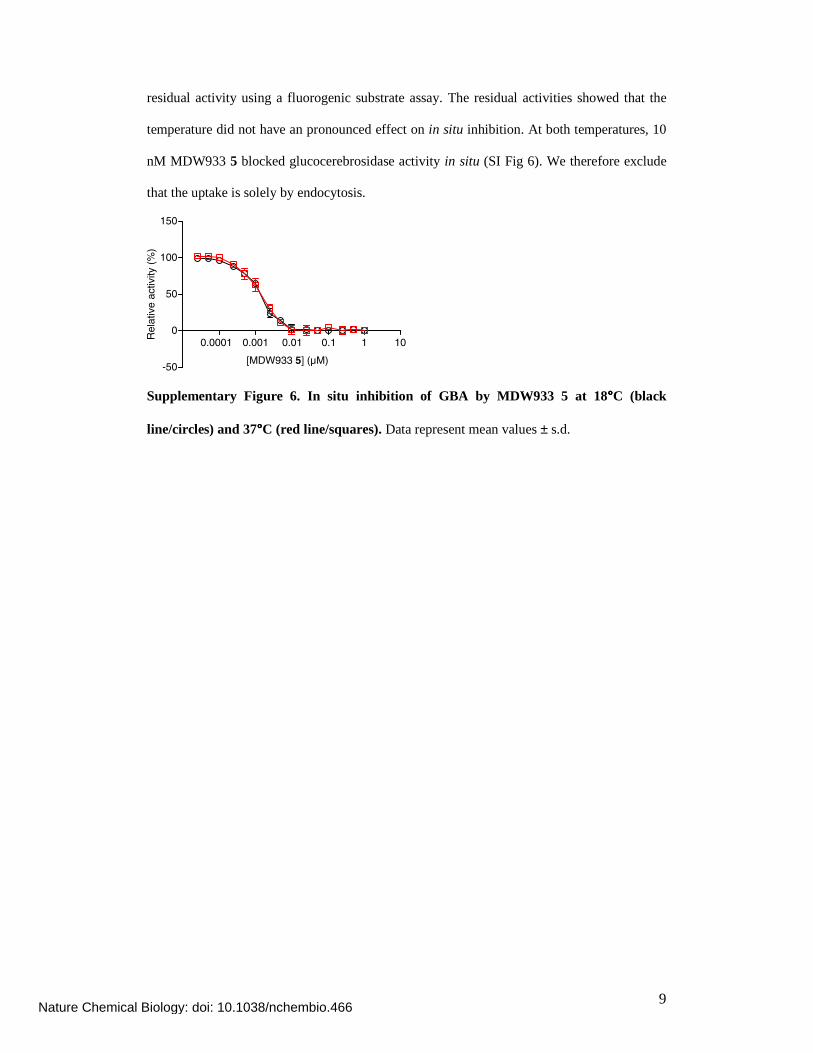
Cellular uptake of the probes
To identify the mechanism of entry of the probes, we performed a temperature experiment.
We incubated cells with a serial dilution of MDW933 5 either at 18°C, a temperature at which
endocytosis is blocked, or 37°C for 2 hours. We harvested the cells and determined the
Nature Chemical Biology: doi: 10.1038/nchembio.466
9
residual activity using a fluorogenic substrate assay. The residual activities showed that the
temperature did not have an pronounced effect on in situ inhibition. At both temperatures, 10
nM MDW933 5 blocked glucocerebrosidase activity in situ (SI Fig 6). We therefore exclude
that the uptake is solely by endocytosis.
0.0001 0.001 0.01 0.1 1 10
-50
0
50
100
150
[MDW933 5] (μM)
Re
lative
activity (
%)
Supplementary Figure 6. In situ inhibition of GBA by MDW933 5 at 18°°°°C (black
line/circles) and 37°°°°C (red line/squares). Data represent mean values ± s.d.
Nature Chemical Biology: doi: 10.1038/nchembio.466
10
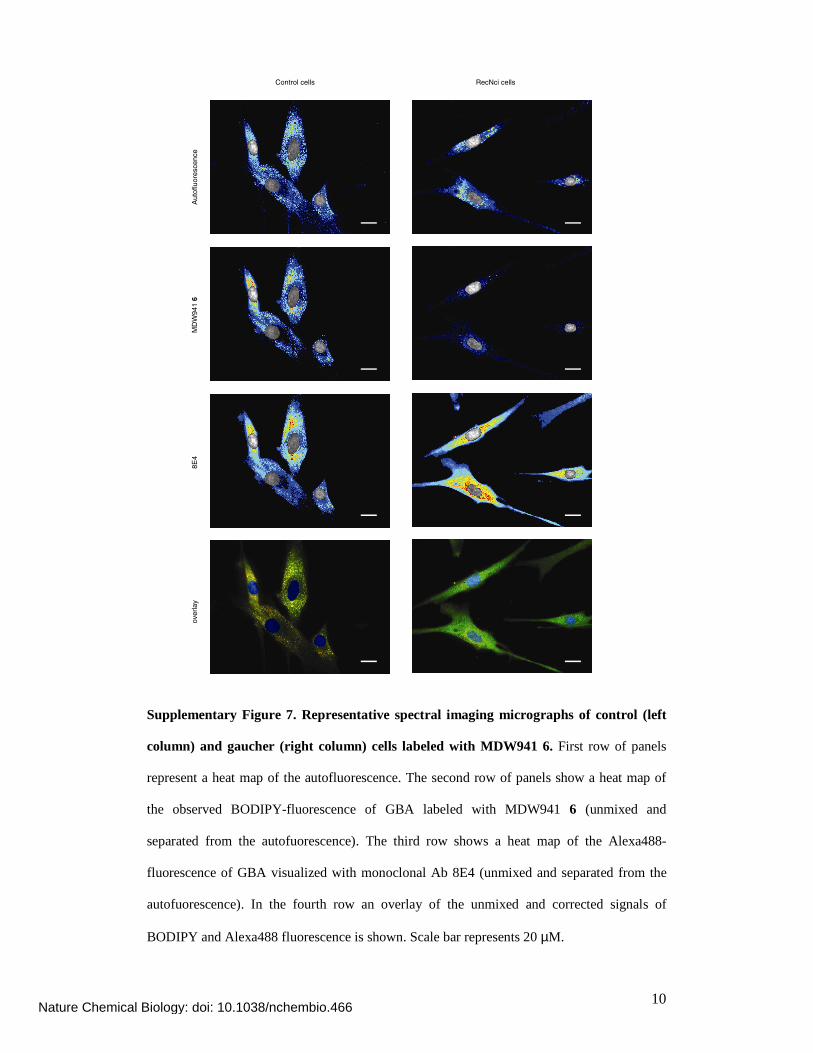
Supplementary Figure 7. Representative spectral imaging micrographs of control (left
column) and gaucher (right column) cells labeled with MDW941 6. First row of panels
represent a heat map of the autofluorescence. The second row of panels show a heat map of
the observed BODIPY-fluorescence of GBA labeled with MDW941 6 (unmixed and
separated from the autofuorescence). The third row shows a heat map of the Alexa488-
fluorescence of GBA visualized with monoclonal Ab 8E4 (unmixed and separated from the
autofuorescence). In the fourth row an overlay of the unmixed and corrected signals of
BODIPY and Alexa488 fluorescence is shown. Scale bar represents 20 µM.
Control cells RecNci cells
Au
tofluo
rescen
ce
MD
W941 6
8
E4
overla
y
Nature Chemical Biology: doi: 10.1038/nchembio.466
11
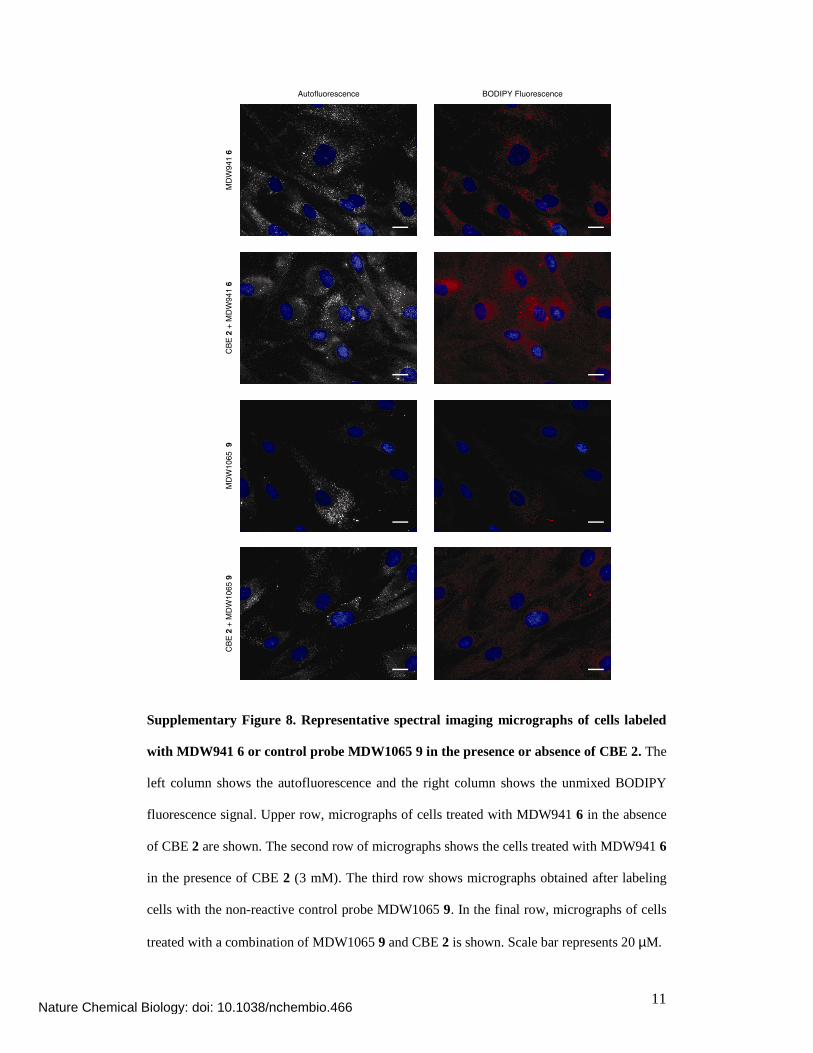
Supplementary Figure 8. Representative spectral imaging micrographs of cells labeled
with MDW941 6 or control probe MDW1065 9 in the presence or absence of CBE 2. The
left column shows the autofluorescence and the right column shows the unmixed BODIPY
fluorescence signal. Upper row, micrographs of cells treated with MDW941 6 in the absence
of CBE 2 are shown. The second row of micrographs shows the cells treated with MDW941 6
in the presence of CBE 2 (3 mM). The third row shows micrographs obtained after labeling
cells with the non-reactive control probe MDW1065 9. In the final row, micrographs of cells
treated with a combination of MDW1065 9 and CBE 2 is shown. Scale bar represents 20 µM.
BODIPY FluorescenceAutofluorescence
MD
W9
41
6C
BE
2 +
MD
W9
41
6M
DW
10
65
9
CB
E 2
+ M
DW
10
65
9
Nature Chemical Biology: doi: 10.1038/nchembio.466
12
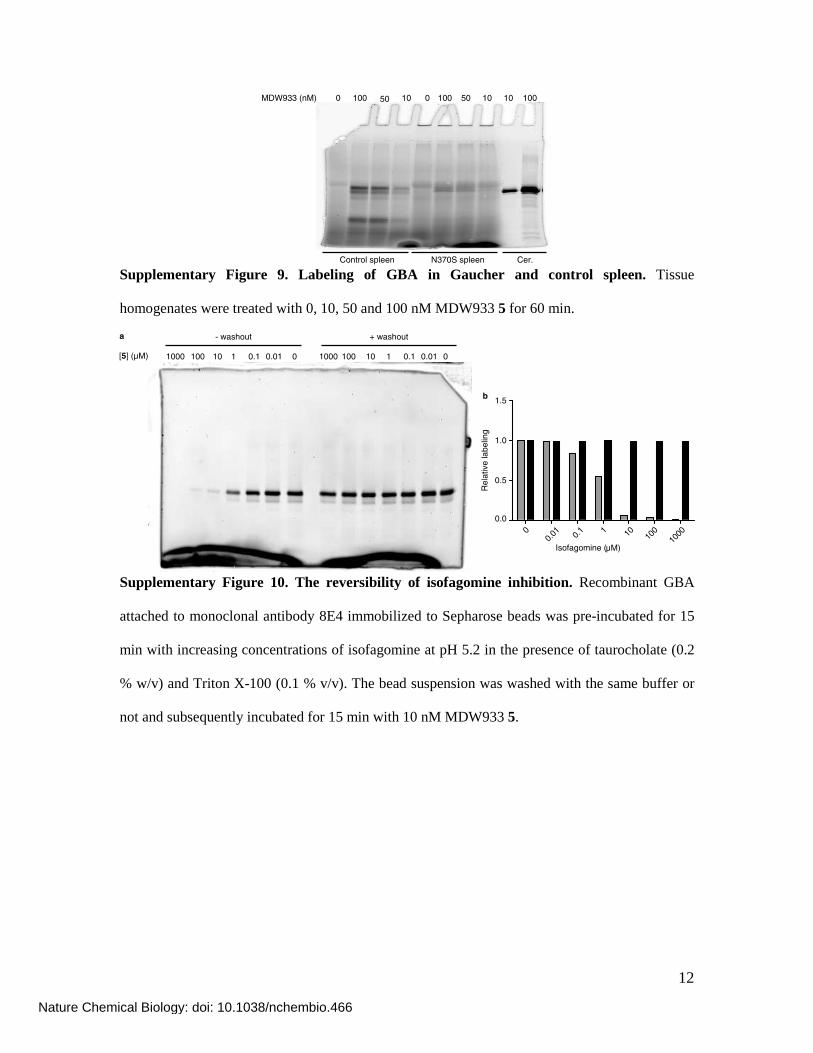
Supplementary Figure 9. Labeling of GBA in Gaucher and control spleen. Tissue
homogenates were treated with 0, 10, 50 and 100 nM MDW933 5 for 60 min.
1000 100 10 1 0.1 0.01 0[5] (μM)
- washout + washout
00.
01 0.1 1 10 10
010
00
0.0
0.5
1.0
1.5
Rela
tive la
belin
g
1000 100 10 1 0.1 0.01 0
Isofagomine (μM)
a
b
Supplementary Figure 10. The reversibility of isofagomine inhibition. Recombinant GBA
attached to monoclonal antibody 8E4 immobilized to Sepharose beads was pre-incubated for 15
min with increasing concentrations of isofagomine at pH 5.2 in the presence of taurocholate (0.2
% w/v) and Triton X-100 (0.1 % v/v). The bead suspension was washed with the same buffer or
not and subsequently incubated for 15 min with 10 nM MDW933 5.
Control spleen
0 100 50 10 0 100 50 10
N370S spleen
MDW933 (nM) 10 100
Cer.
Nature Chemical Biology: doi: 10.1038/nchembio.466
13
CBE
AMP-D
NM
Den
atur
ed
Con
trol d
e
MDW
933 5
CBB
Live
r
Splee
n
Jejunu
m
10 0.0010.010.050.11 0.2
0.1 10 0.0010.010.050.11 0.2
0.1[MDW933 5] (μM)
[MDW941 6] (μM)
a
2,000 242040400 200 0.4 0.2 0.04 0.02MDW933 5
(fmole)
b
2,000 0.020.22200 20GBA
(fmole)
2·10-4
2·10-3 4,00020,000
Testis
c
Nature Chemical Biology: doi: 10.1038/nchembio.466
14
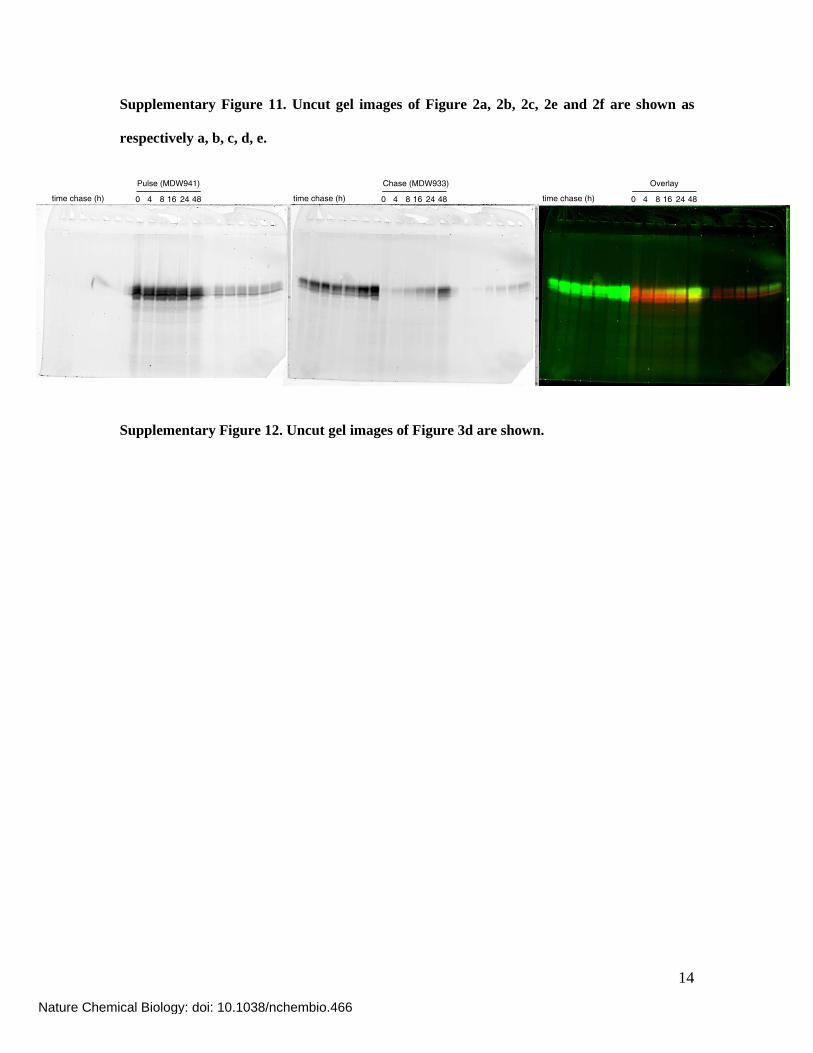
Supplementary Figure 11. Uncut gel images of Figure 2a, 2b, 2c, 2e and 2f are shown as
respectively a, b, c, d, e.
Supplementary Figure 12. Uncut gel images of Figure 3d are shown.
0 4 8 16 24 48time chase (h)0 4 8 16 24 48time chase (h)0 4 8 16 24 48time chase (h)
Pulse (MDW941) Chase (MDW933) Overlay
Nature Chemical Biology: doi: 10.1038/nchembio.466
15
Lungs
Cerezyme
Liver
Cerezyme
MDW933
MDW941Brain
Cerezyme
Duodenum
Cerezyme
MDW933
MDW941
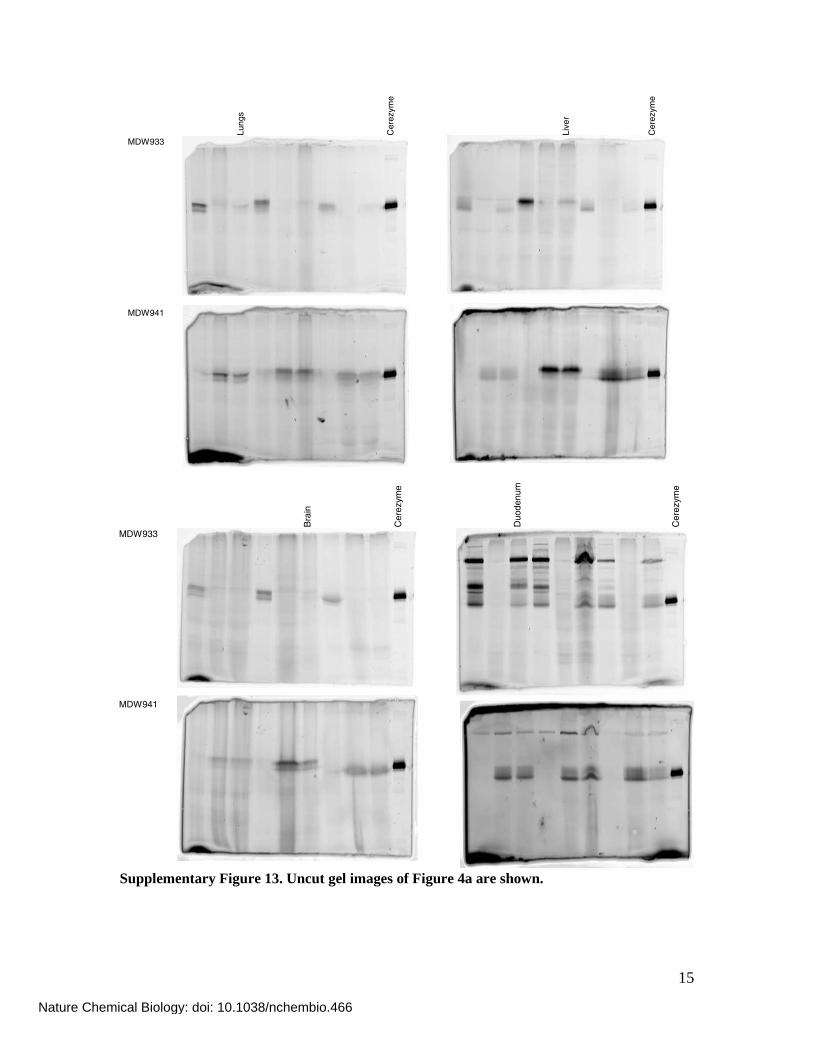
Supplementary Figure 13. Uncut gel images of Figure 4a are shown.
Nature Chemical Biology: doi: 10.1038/nchembio.466
16
Con
tro
l
N37
0S
L44
4P
Rec N
ci
Cere
zym
e
Con
tro
l
N37
0S
L44
4P
Rec N
ci
Cere
zym
e
Untreated MDW933 5 (10 nM)a
Con
tro
l
N37
0S
L44
4P
Rec N
ci
Cere
zym
e
Con
tro
l
N37
0S
L44
4P
Rec N
ci
Cere
zym
e
Untreated MDW933 5 (10 nM)
Fluorescent Read-out Western Blot (8E4)
b
Supplementary Figure 14. Uncut gel images of Figure 5a. Left: fluorescent read-out. Right:
GBA is visualized using Western blotting
Nature Chemical Biology: doi: 10.1038/nchembio.466
17
Supplementary methods
All reagents were of a commercial grade and were used as received unless stated otherwise.
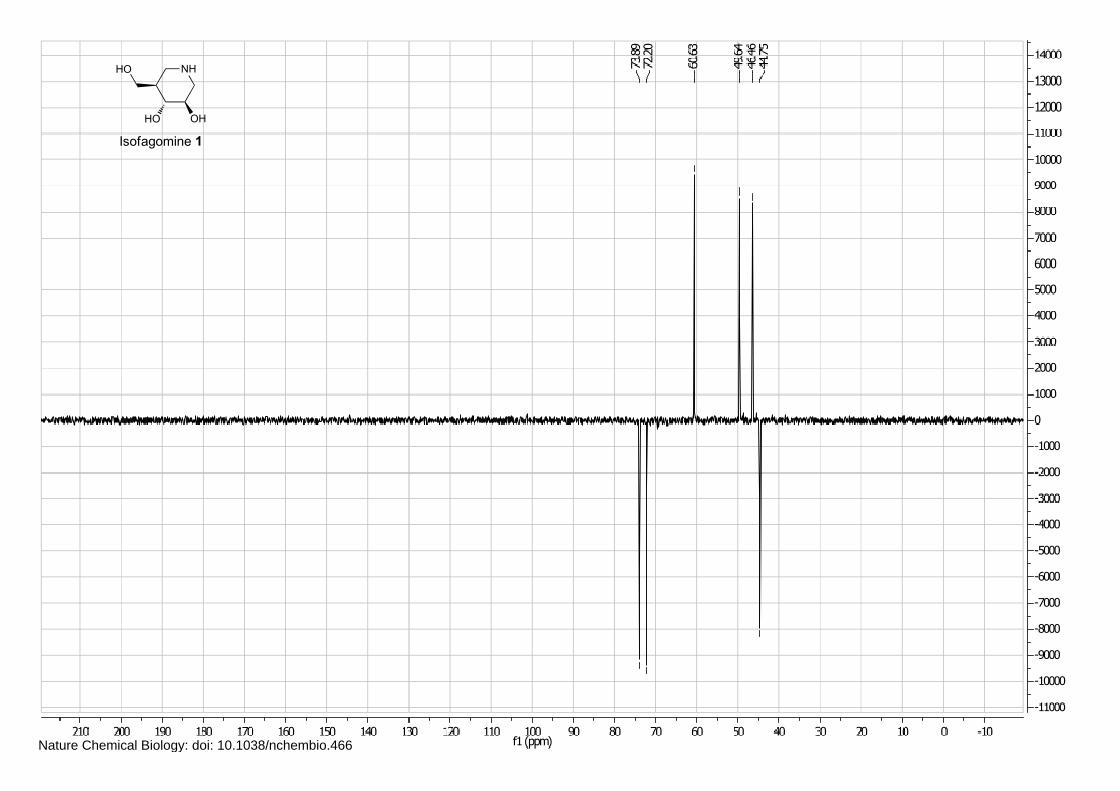
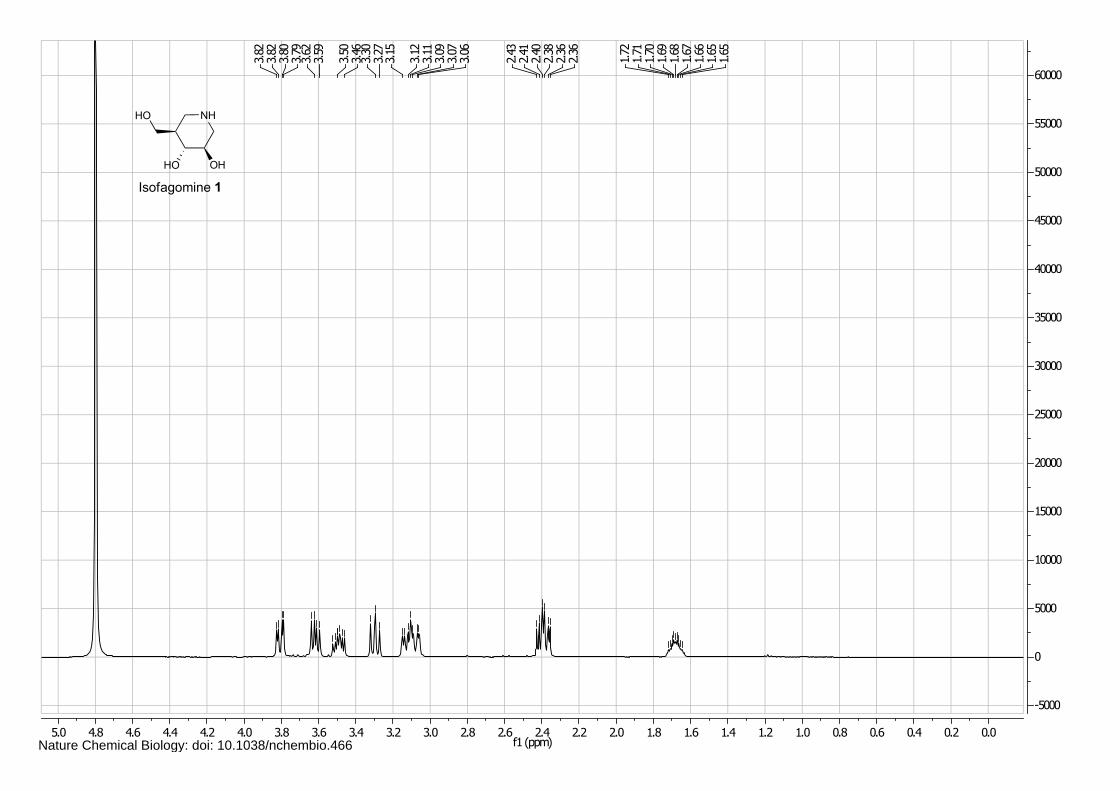
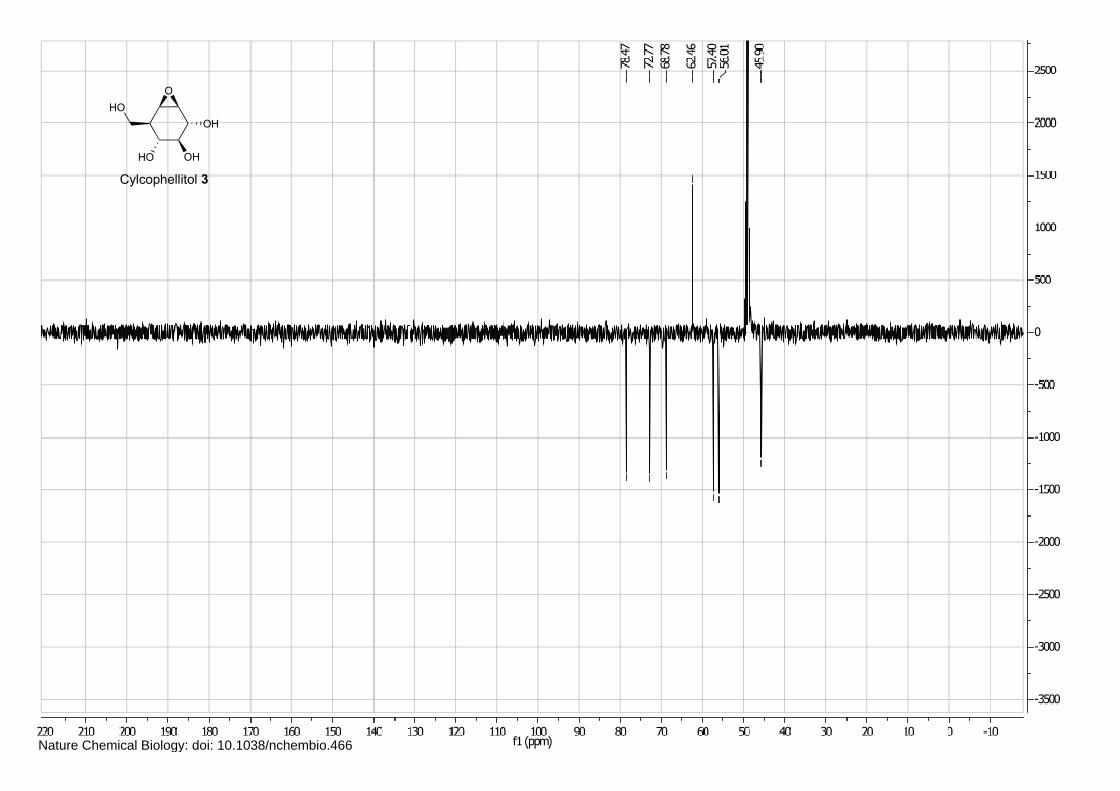
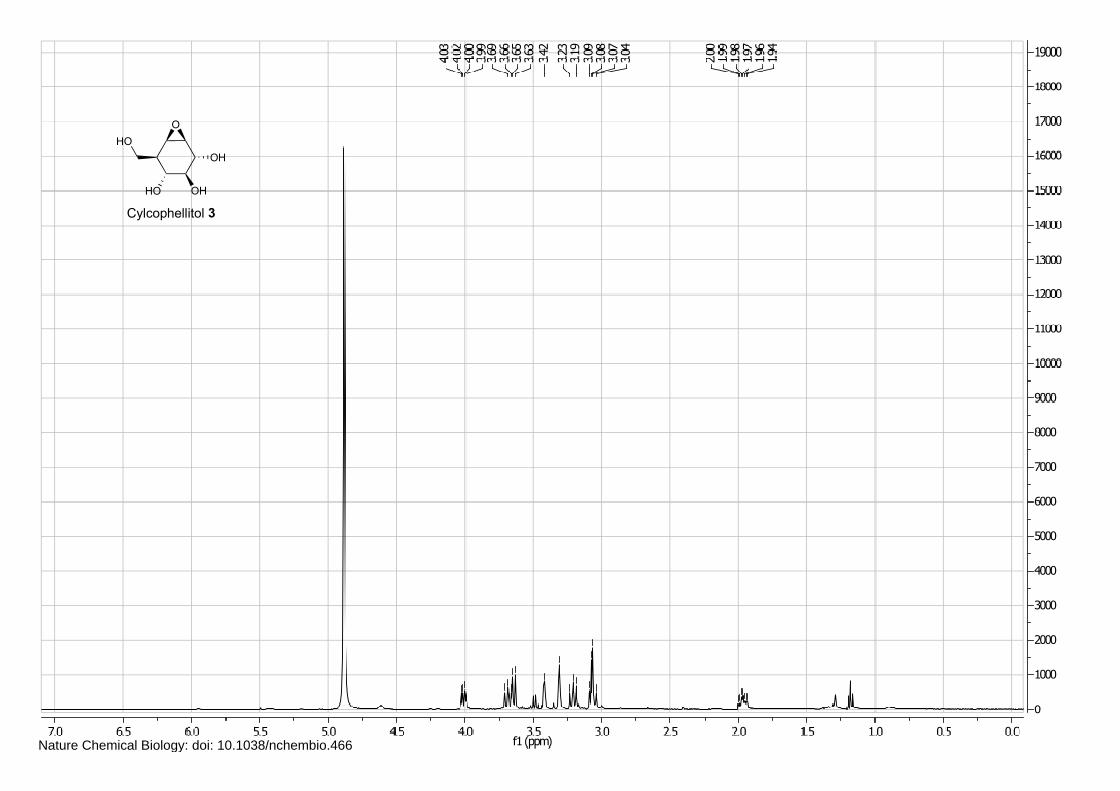
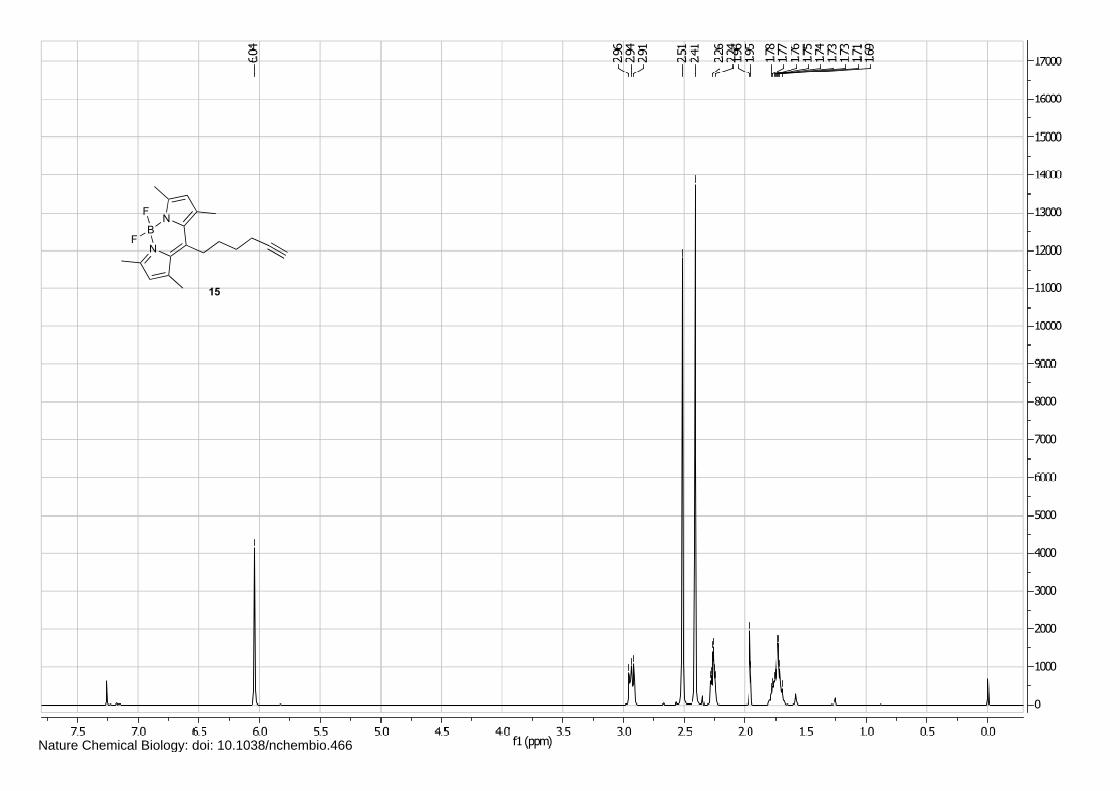
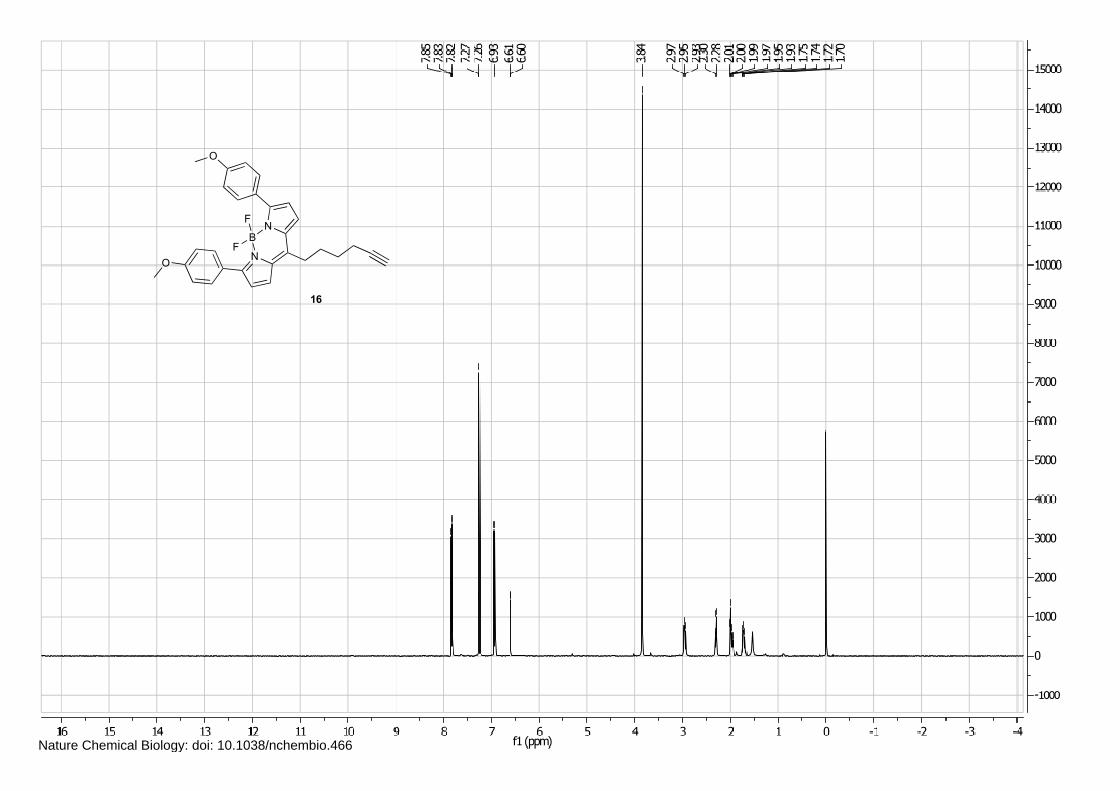
Isofagomine 1 (4), cyclophellitol 3 (1) and BODIPY alkyne green 15 and red 16 (5) were synthesized
as described in literature and their spectral data was in accordance with those reported in literature.
The AMP-DNM 7 used in this research was from a previously synthesized batch (6). Diethyl ether
(Et2O), ethyl acetate (EtOAc), light petroleum ether and toluene were obtained from Riedel-de Haën.
Acetonitrile, dichloromethane, dimethylformamide (DMF), methanol (MeOH), pyridine,
tetrahydrofuran (THF) were purchased from Biosolve. Dichloromethane was distilled from CaH2 and
THF was distilled over LiAlH4 prior to use. All reactions were performed under an inert atmosphere or
Argon unless stated otherwise. Solvents used for flash chromatography were of pro analysi quality.
Reactions were monitored by TLC analysis using Merck aluminum sheets precoated with silica gel 60
with detection by UV-absorption (254 nm) and by spraying with a solution of (NH4)6Mo7O24·H2O (25
g/L) and (NH4)4Ce(SO4)4·H2O (10 g/L) in 10% aqueous sulfuric acid followed by charring at ~150°C
or by spraying with 20% sulfuric acid in ethanol followed by charring at ~150°C. Column
chromatography was performed using either Baker- or Screening Device silica gel in the indicated
solvents. 1H NMR and 13C NMR spectra were recorded on a Bruker DMX-400 (400/100 MHz) or a
Bruker AV-400 (400/100 MHz) spectrometer in the given solvent. Chemical shifts are reported as δ-
values in ppm relative to the chloroform residual solvent peak or tetramethylsilane (TMS) as internal
standard. Coupling constants are given in Hz. All given 13C spectra are proton decoupled. Spin
multiplicities are given as s, d, dd, ddd, dddd, dt, t, td, q and m. High resolution mass spectra were
recorded with a LTQ Orbitrap (Thermo Finnigan). LC/MS analysis was performed on a Jasco HPLC-
system (detection simultaneously at 214 nm and 254 nm) equipped with an analytical Alltima C18
column (Alltech, 4.6 mmD × 250 mmL, 5μ particle size) in combination with buffers A: H2O, B:
acetonitrile and C: 1% aq. TFA and coupled to a Perkin Elmer Sciex API 165 mass instrument.
Optical rotations were measured on a Propol automatic polarimeter (sodium D line, λ = 589 nm). FT-
IR-spectra were recorded on a Paragon-PE 1000.
Nature Chemical Biology: doi: 10.1038/nchembio.466
18
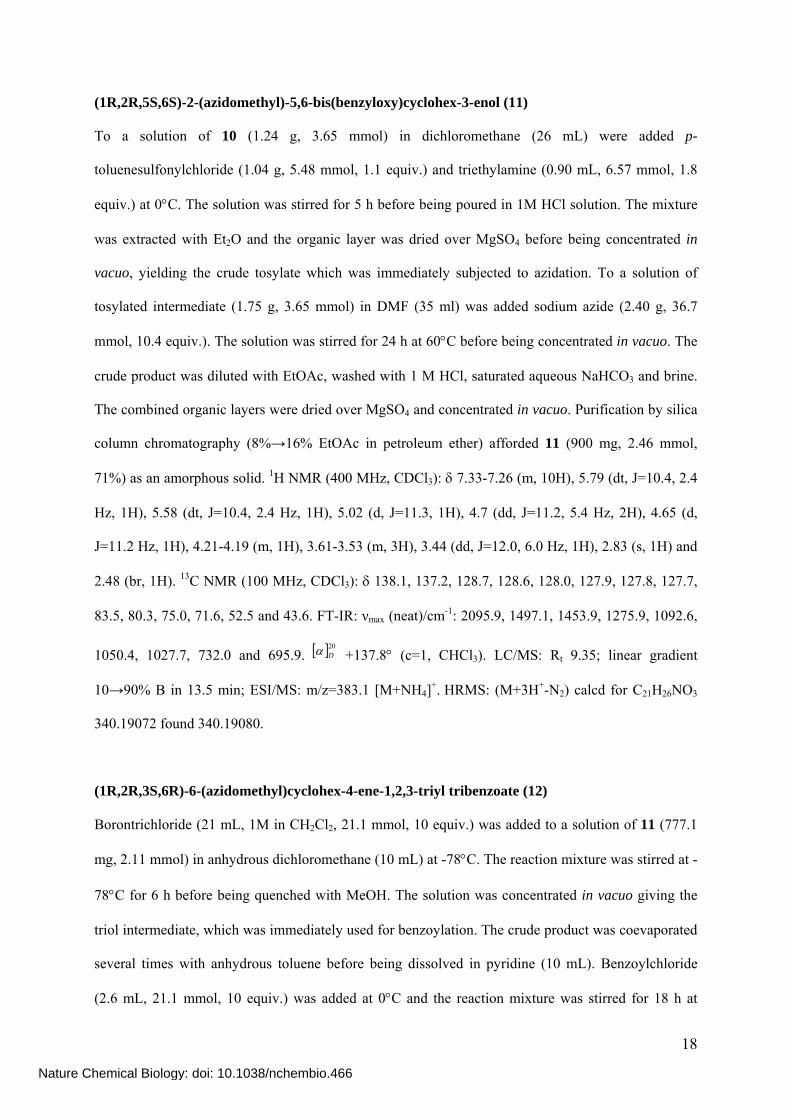
(1R,2R,5S,6S)-2-(azidomethyl)-5,6-bis(benzyloxy)cyclohex-3-enol (11)
To a solution of 10 (1.24 g, 3.65 mmol) in dichloromethane (26 mL) were added p-
toluenesulfonylchloride (1.04 g, 5.48 mmol, 1.1 equiv.) and triethylamine (0.90 mL, 6.57 mmol, 1.8
equiv.) at 0°C. The solution was stirred for 5 h before being poured in 1M HCl solution. The mixture
was extracted with Et2O and the organic layer was dried over MgSO4 before being concentrated in
vacuo, yielding the crude tosylate which was immediately subjected to azidation. To a solution of
tosylated intermediate (1.75 g, 3.65 mmol) in DMF (35 ml) was added sodium azide (2.40 g, 36.7
mmol, 10.4 equiv.). The solution was stirred for 24 h at 60°C before being concentrated in vacuo. The
crude product was diluted with EtOAc, washed with 1 M HCl, saturated aqueous NaHCO3 and brine.
The combined organic layers were dried over MgSO4 and concentrated in vacuo. Purification by silica
column chromatography (8%→16% EtOAc in petroleum ether) afforded 11 (900 mg, 2.46 mmol,
71%) as an amorphous solid. 1H NMR (400 MHz, CDCl3): δ 7.33-7.26 (m, 10H), 5.79 (dt, J=10.4, 2.4
Hz, 1H), 5.58 (dt, J=10.4, 2.4 Hz, 1H), 5.02 (d, J=11.3, 1H), 4.7 (dd, J=11.2, 5.4 Hz, 2H), 4.65 (d,
J=11.2 Hz, 1H), 4.21-4.19 (m, 1H), 3.61-3.53 (m, 3H), 3.44 (dd, J=12.0, 6.0 Hz, 1H), 2.83 (s, 1H) and
2.48 (br, 1H). 13C NMR (100 MHz, CDCl3): δ 138.1, 137.2, 128.7, 128.6, 128.0, 127.9, 127.8, 127.7,
83.5, 80.3, 75.0, 71.6, 52.5 and 43.6. FT-IR: νmax (neat)/cm-1: 2095.9, 1497.1, 1453.9, 1275.9, 1092.6,
1050.4, 1027.7, 732.0 and 695.9. [ ]20Dα +137.8° (c=1, CHCl3). LC/MS: Rt 9.35; linear gradient
10→90% B in 13.5 min; ESI/MS: m/z=383.1 [M+NH4]+. HRMS: (M+3H+-N2) calcd for C21H26NO3
340.19072 found 340.19080.
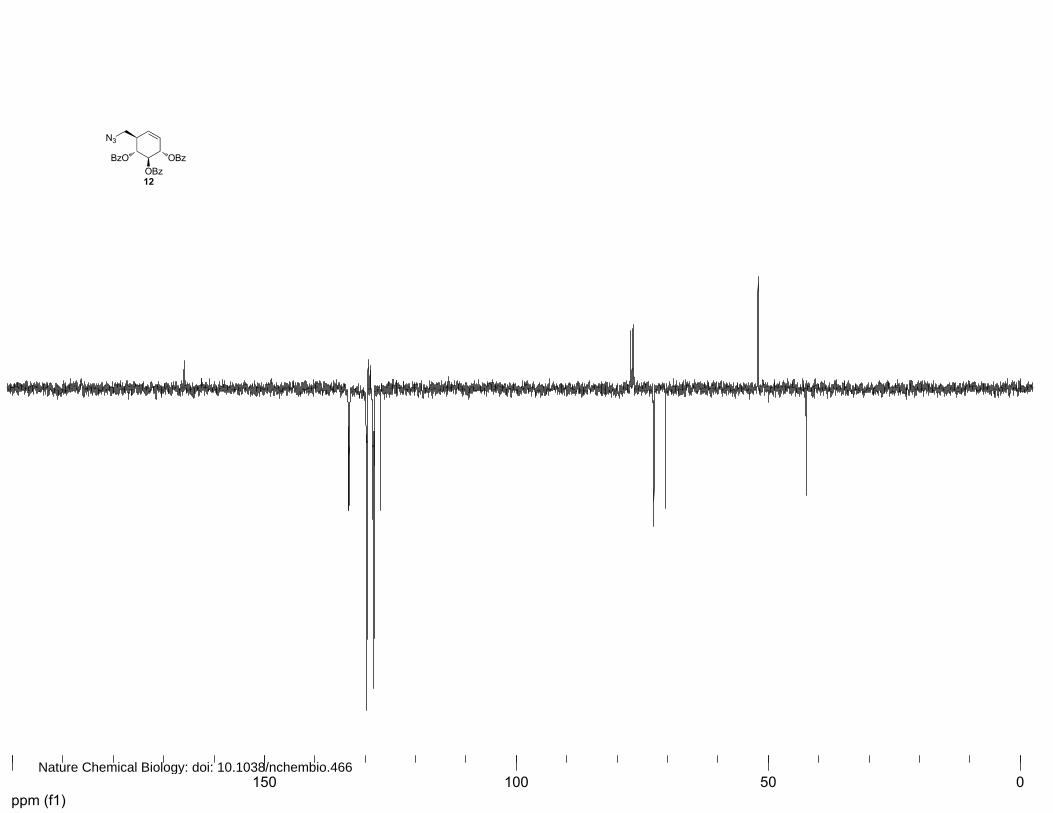
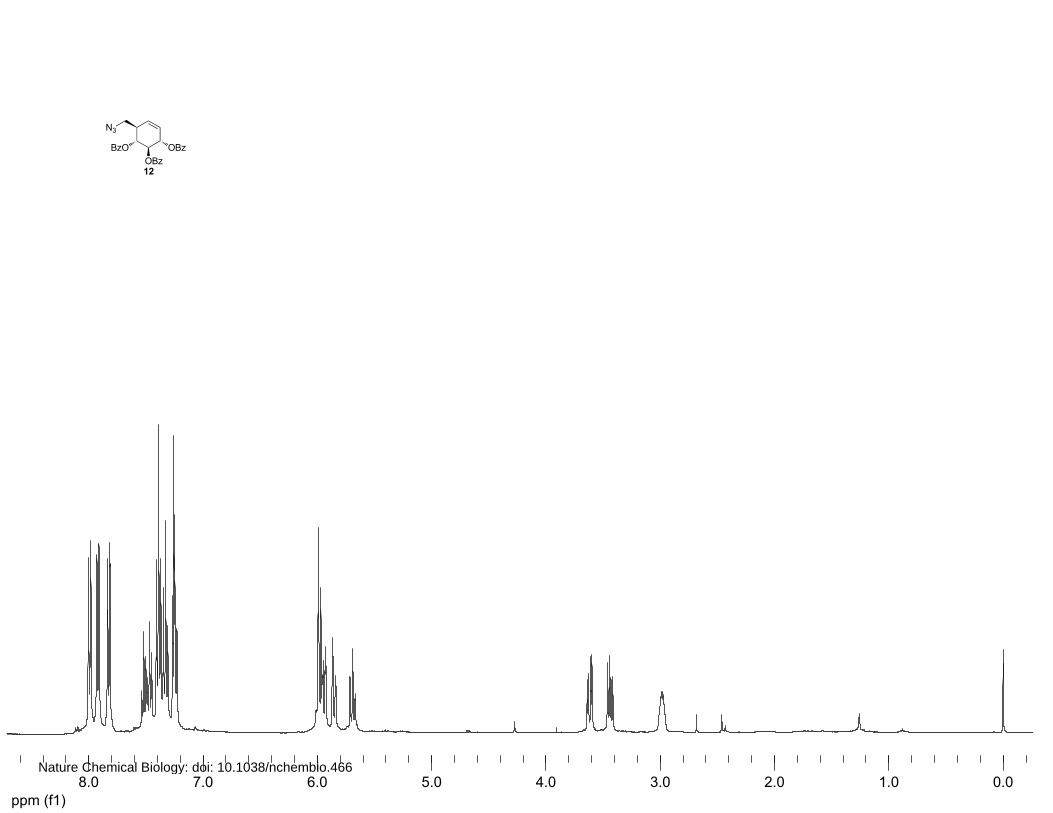
(1R,2R,3S,6R)-6-(azidomethyl)cyclohex-4-ene-1,2,3-triyl tribenzoate (12)
Borontrichloride (21 mL, 1M in CH2Cl2, 21.1 mmol, 10 equiv.) was added to a solution of 11 (777.1
mg, 2.11 mmol) in anhydrous dichloromethane (10 mL) at -78°C. The reaction mixture was stirred at -
78°C for 6 h before being quenched with MeOH. The solution was concentrated in vacuo giving the
triol intermediate, which was immediately used for benzoylation. The crude product was coevaporated
several times with anhydrous toluene before being dissolved in pyridine (10 mL). Benzoylchloride
(2.6 mL, 21.1 mmol, 10 equiv.) was added at 0°C and the reaction mixture was stirred for 18 h at
Nature Chemical Biology: doi: 10.1038/nchembio.466
19
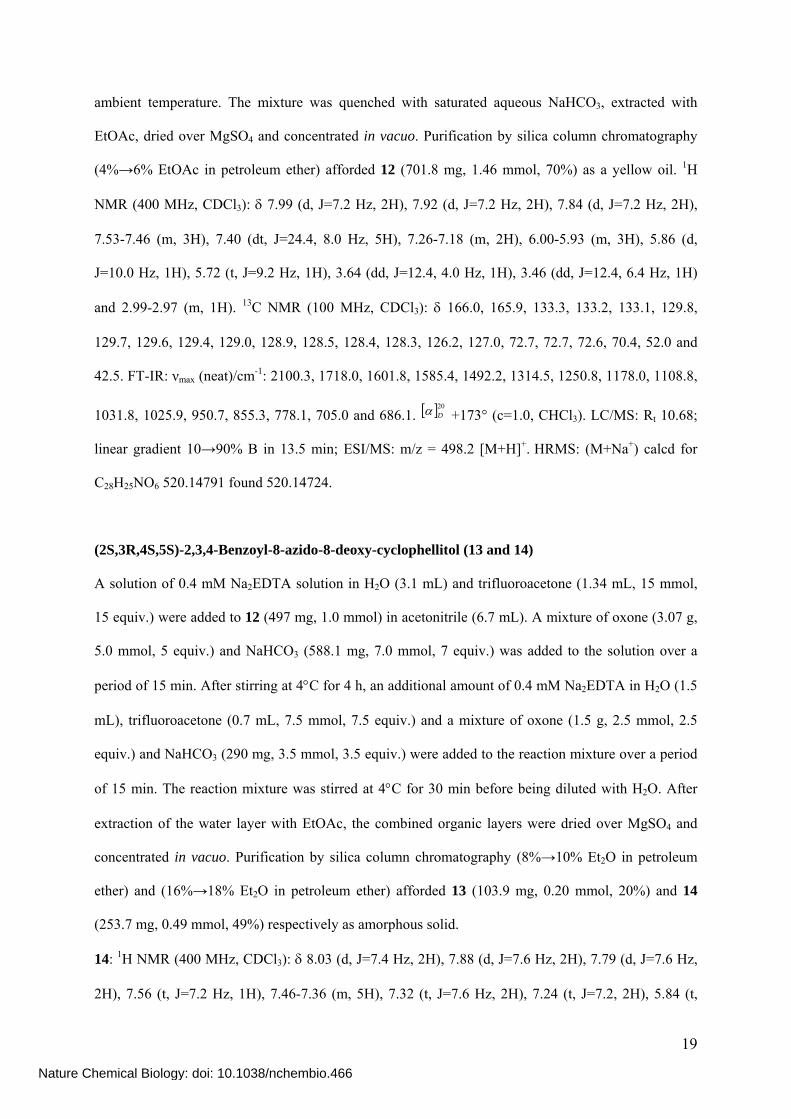
ambient temperature. The mixture was quenched with saturated aqueous NaHCO3, extracted with
EtOAc, dried over MgSO4 and concentrated in vacuo. Purification by silica column chromatography
(4%→6% EtOAc in petroleum ether) afforded 12 (701.8 mg, 1.46 mmol, 70%) as a yellow oil. 1H
NMR (400 MHz, CDCl3): δ 7.99 (d, J=7.2 Hz, 2H), 7.92 (d, J=7.2 Hz, 2H), 7.84 (d, J=7.2 Hz, 2H),
7.53-7.46 (m, 3H), 7.40 (dt, J=24.4, 8.0 Hz, 5H), 7.26-7.18 (m, 2H), 6.00-5.93 (m, 3H), 5.86 (d,
J=10.0 Hz, 1H), 5.72 (t, J=9.2 Hz, 1H), 3.64 (dd, J=12.4, 4.0 Hz, 1H), 3.46 (dd, J=12.4, 6.4 Hz, 1H)
and 2.99-2.97 (m, 1H). 13C NMR (100 MHz, CDCl3): δ 166.0, 165.9, 133.3, 133.2, 133.1, 129.8,
129.7, 129.6, 129.4, 129.0, 128.9, 128.5, 128.4, 128.3, 126.2, 127.0, 72.7, 72.7, 72.6, 70.4, 52.0 and
42.5. FT-IR: νmax (neat)/cm-1: 2100.3, 1718.0, 1601.8, 1585.4, 1492.2, 1314.5, 1250.8, 1178.0, 1108.8,
1031.8, 1025.9, 950.7, 855.3, 778.1, 705.0 and 686.1. [ ]20Dα +173° (c=1.0, CHCl3). LC/MS: Rt 10.68;
linear gradient 10→90% B in 13.5 min; ESI/MS: m/z = 498.2 [M+H]+. HRMS: (M+Na+) calcd for
C28H25NO6 520.14791 found 520.14724.
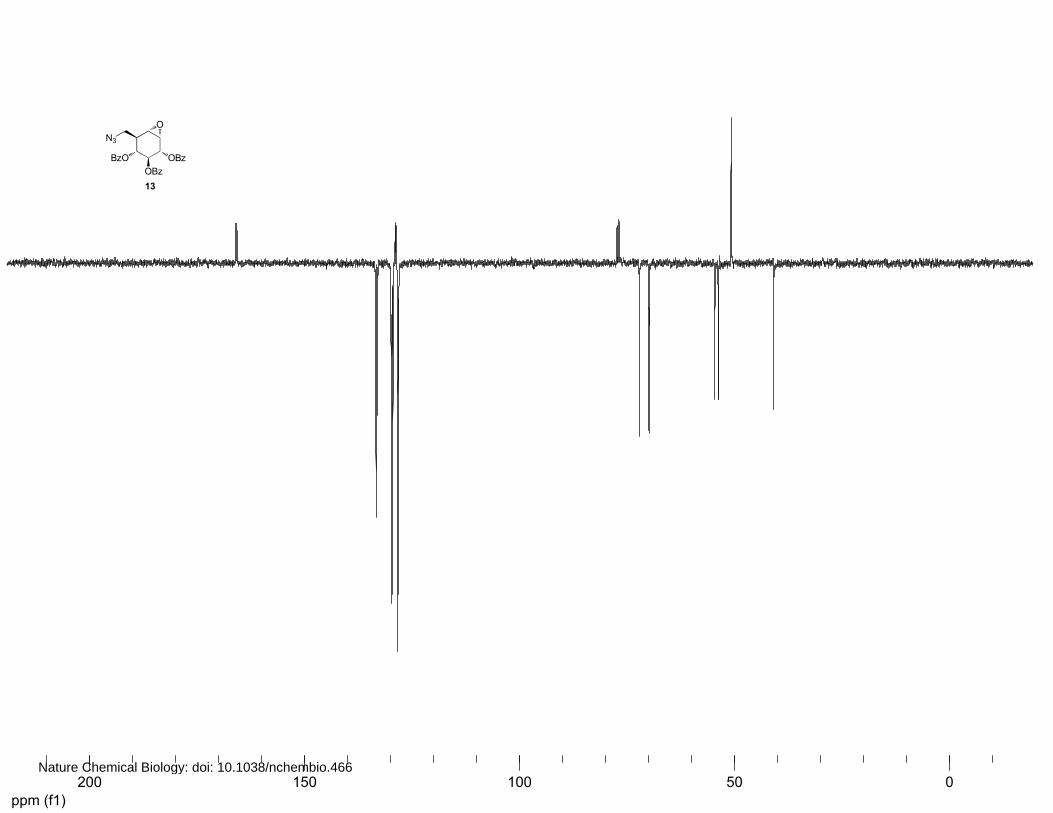
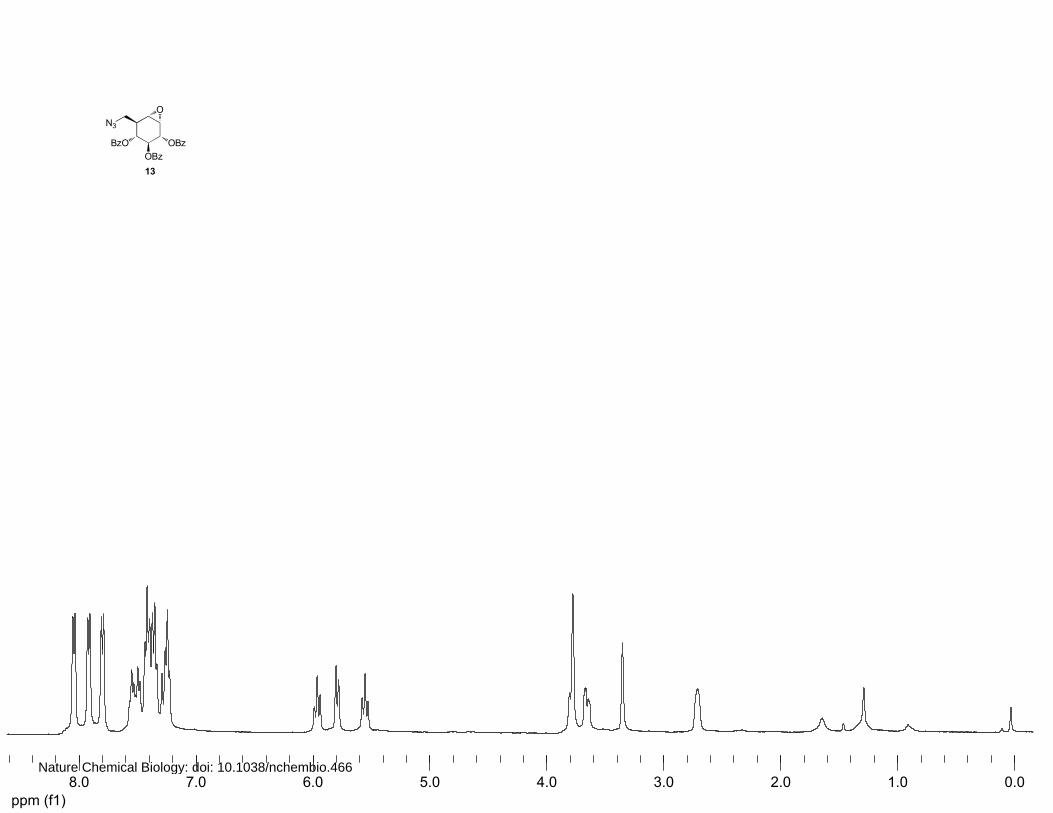
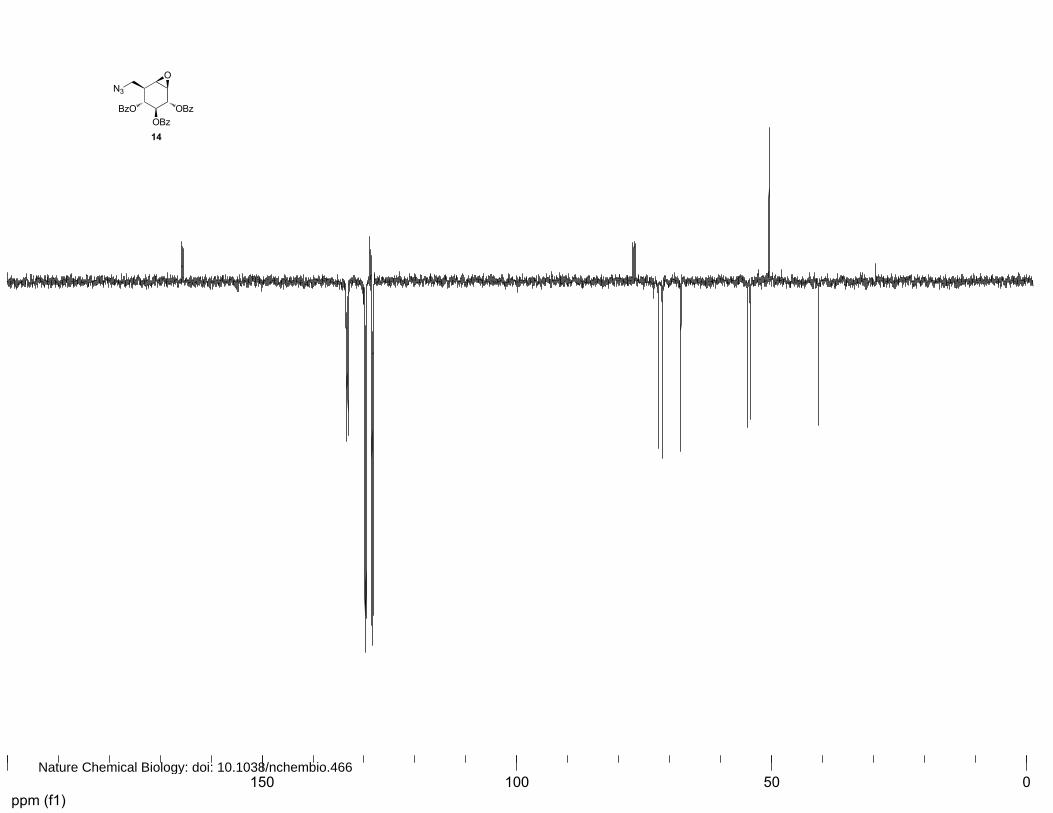
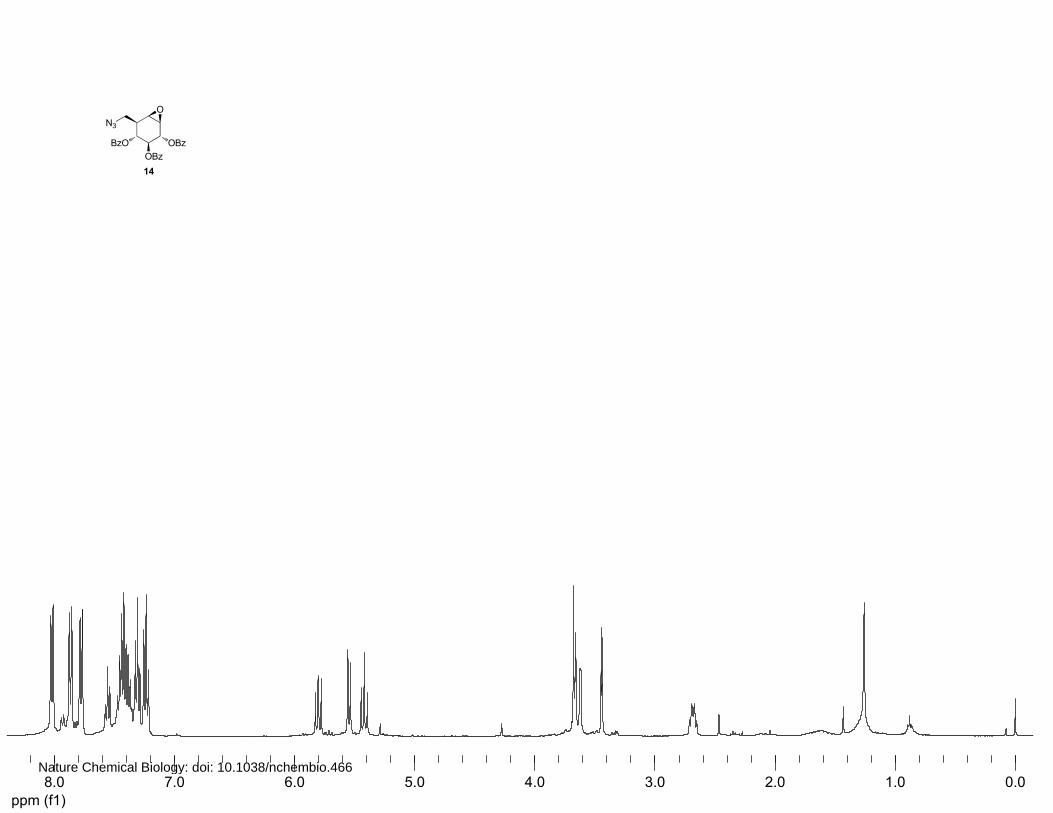
(2S,3R,4S,5S)-2,3,4-Benzoyl-8-azido-8-deoxy-cyclophellitol (13 and 14)
A solution of 0.4 mM Na2EDTA solution in H2O (3.1 mL) and trifluoroacetone (1.34 mL, 15 mmol,
15 equiv.) were added to 12 (497 mg, 1.0 mmol) in acetonitrile (6.7 mL). A mixture of oxone (3.07 g,
5.0 mmol, 5 equiv.) and NaHCO3 (588.1 mg, 7.0 mmol, 7 equiv.) was added to the solution over a
period of 15 min. After stirring at 4°C for 4 h, an additional amount of 0.4 mM Na2EDTA in H2O (1.5
mL), trifluoroacetone (0.7 mL, 7.5 mmol, 7.5 equiv.) and a mixture of oxone (1.5 g, 2.5 mmol, 2.5
equiv.) and NaHCO3 (290 mg, 3.5 mmol, 3.5 equiv.) were added to the reaction mixture over a period
of 15 min. The reaction mixture was stirred at 4°C for 30 min before being diluted with H2O. After
extraction of the water layer with EtOAc, the combined organic layers were dried over MgSO4 and
concentrated in vacuo. Purification by silica column chromatography (8%→10% Et2O in petroleum
ether) and (16%→18% Et2O in petroleum ether) afforded 13 (103.9 mg, 0.20 mmol, 20%) and 14
(253.7 mg, 0.49 mmol, 49%) respectively as amorphous solid.
14: 1H NMR (400 MHz, CDCl3): δ 8.03 (d, J=7.4 Hz, 2H), 7.88 (d, J=7.6 Hz, 2H), 7.79 (d, J=7.6 Hz,
2H), 7.56 (t, J=7.2 Hz, 1H), 7.46-7.36 (m, 5H), 7.32 (t, J=7.6 Hz, 2H), 7.24 (t, J=7.2, 2H), 5.84 (t,
Nature Chemical Biology: doi: 10.1038/nchembio.466
20
J=9.2 Hz, 1H), 5.56 (d, J=8.8 Hz, 1H), 5.43 (t, J=10.0 Hz, 1H), 3.67-3.62 (m, 4H), 3.44 (s, 1H) and
2.71 (dddd, J=9.3, 7.6, 1.4 Hz, 1H). 13C NMR (100 MHz, CDCl3): δ 165.7, 165.6, 165.4, 133.5, 133.3,
133.1, 129.8, 129.6, 129.5, 128.9, 128.7, 128.6, 128.4, 128.3, 128.1, 72.2, 71.4, 67.8, 54.7, 54.2, 50.5
and 40.8. FT-IR: νmax (neat)/cm-1: 2104.5, 1722.6, 1601.9, 1451.6, 1315.2, 1258.3, 1178.4, 1094.8,
1069.6, 1026.1, 853.8, 706.6 and 686.1. [ ]20Dα + 93.6° (c=1.0, CHCl3). LC/MS: Rt 10.24; linear gradient
10→90% B in 13.5 min; ESI/MS: m/z = 514.2 [M+H]+. HRMS: (M+H+) calcd for C28H23N3O7
514.16088 found 514.16007.
13: 1H NMR (400 MHz, CDCl3): δ 8.02 (d, J=7.2 Hz, 2H), 7.89 (d, J=7.2 Hz, 2H), 7.78 (d, J=7.2 Hz,
2H), 7.53-7.19 (m, 5H), 5.96 (t, J=9.6 Hz, 1H), 5.77 (d, J=8.8 Hz, 1H), 5.55 (t, J=9.6 Hz, 1H), 3.77-
3.74 (m, 2H), 3.64 (dd, J=12.8, 4.0 Hz, 1H), 3.32 (s, 1H) and 2.68 (ddd, J=9.2, 5.2, 3.8 Hz, 1H). 13C
NMR (100 MHz, CDCl3): δ 166.0, 165.9, 165.6, 133.4, 133.0, 129.9, 129.7, 129.5, 129.0, 128.9,
128.6, 128.4, 128.3, 128.1, 72.1, 70.0, 69.9, 54.6, 53.8, 50.8 and 40.9. FT-IR: νmax (neat)/cm-1: 2104.6,
1717.8, 1602.1, 1451.8, 1249.4, 1178.1, 1093.3, 1069.0, 1026.0 and 704.5. [ ]20Dα +52.4° (c=1.0,
CHCl3). LC/MS: Rt 10.22; linear gradient 10→90% B in 13.5 min; ESI/MS: m/z = 514.2 [M+H]+.
HRMS: (M+H+) calcd for C28H23N3O7 514.16088 found 514.16017.
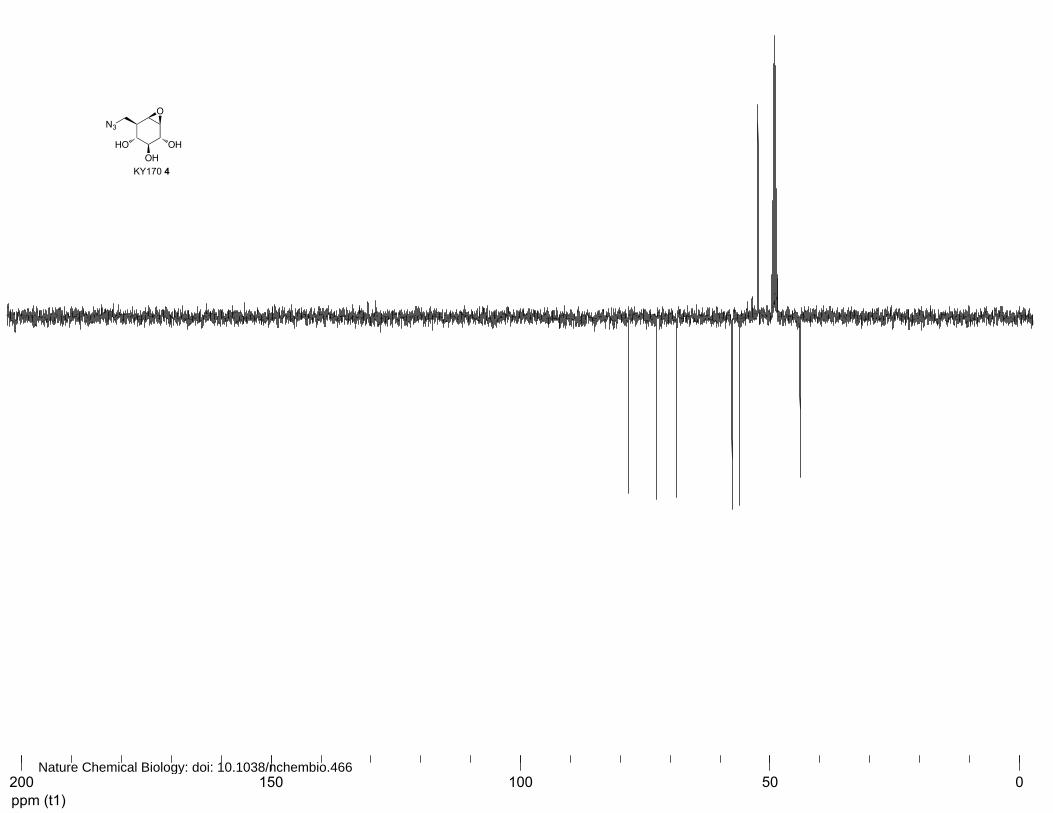
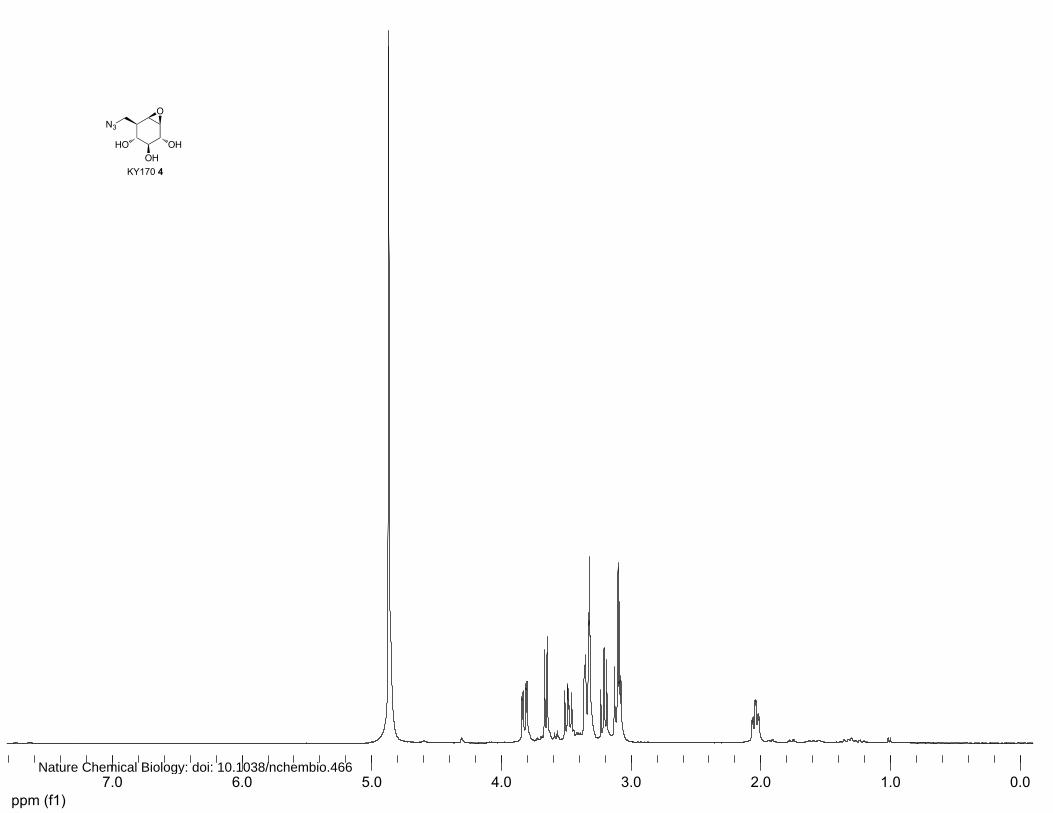
(2S,3R,4S,5S)-8-azido-8-deoxy-cyclophellitol (KY170, 4)
A catalytic amount of NaOMe was added to a solution of 14 (103.9 mg, 0.20 mmol) in MeOH (1.0
mL) and stirred for 1 h at ambient temperature. The reaction mixture was neutralized with Amberlite
IR-120 H+, filtered and concentrated in vacuo. Purification by silica column chromatrography
(6%→8% MeOH in dichloromethane) provided KY170 4 (30.0 mg, 0.15 mmol, 75%). 1H NMR (400
MHz, MeOD): δ 3.84 (dd, J=8.4, 3.6 Hz, 1H), 3.67 (d, J=8.0 Hz, 1H), 3.51 (dd, J=12.0, 8.8 Hz, 1H),
3.36 (d, J=3.2 Hz, 1H), 3.23 (dd, J=10.0, 8.4 Hz, 1H), 3.13-3.08 (m, 2H), 2.07 (ddt, J=9.4, 3.6, 1.6 Hz,
1H). 13C NMR (100 MHz, MeOD): δ 78.3, 72.7, 68.6, 57.6, 56.1, 52.4 and 43.9. FT-IR: νmax (neat)/cm-
1: 3331.7, 3187.9, 2936.1, 2097.6, 1455.8, 1345.9, 1273.4, 1144.2, 1092.5, 1066.5, 1032.1, 995.1,
926.6, 899.8, 818.7, 803.5, 714.1 and 652.0. [ ]20Dα + 174.7° (c=0.6, MeOH). LC/MS: Rt 0.95; linear
Nature Chemical Biology: doi: 10.1038/nchembio.466

21
gradient 10→90% B in 13.5 min; ESI/MS: m/z = 219.2 [M+NH4]+. HRMS: (M+3H+-N2) calcd for
C7H14NO4 176.09173 found 176.09179.
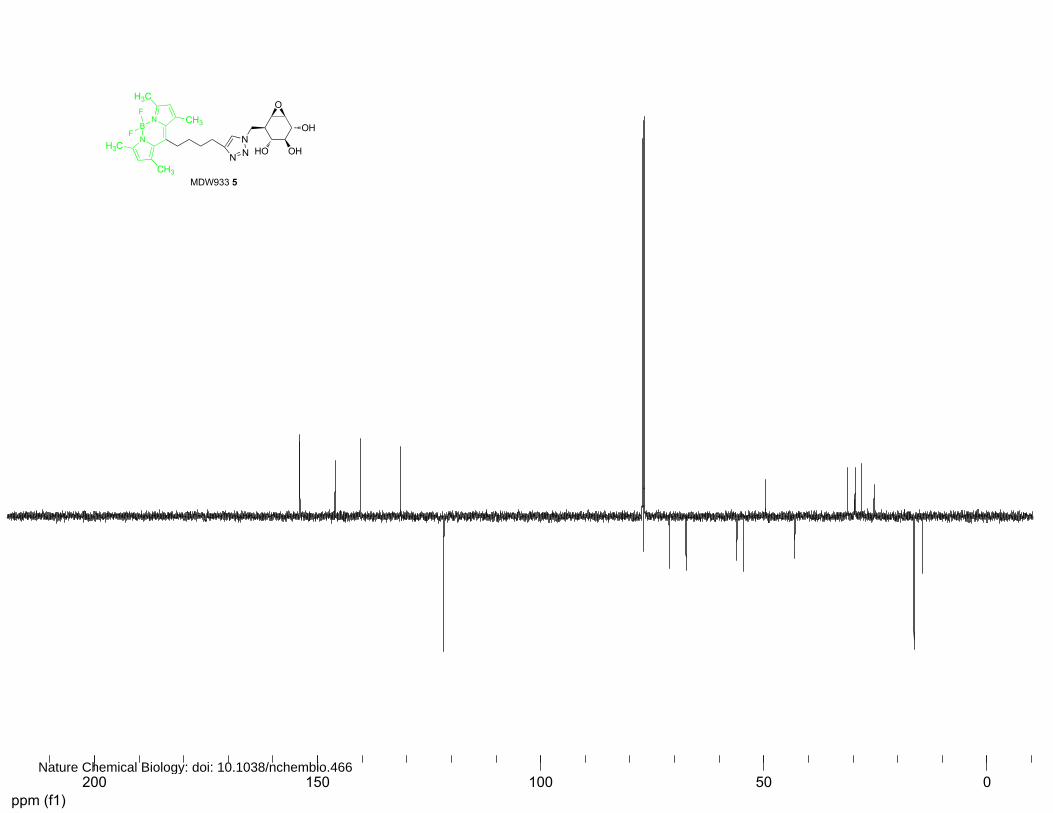
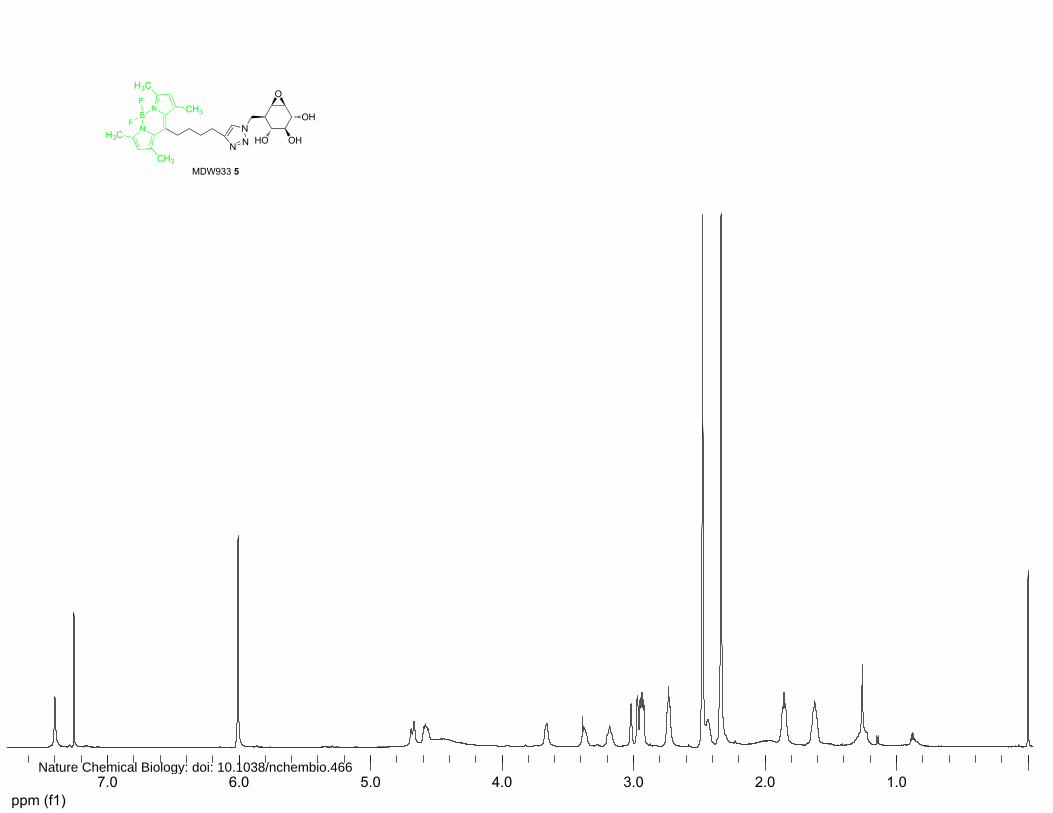
MDW933 5
KY170 4 (8.51 mg, 42 μmol) and BODIPY Green-alkyne 15 (13.8 mg, 42 μmol) (5) were dissolved in
tert-BuOH/Tol/H2O (1.8 mL, 1/1/1 v/v/v). CuSO4 (100 mM in H2O, 42 μL, 4.2 μmol) and sodium
ascorbate (100 mM in H2O, 63 μL, 6.3 μmol) were added. Subsequently, the reaction was heated to
80°C and stirred overnight. The solution was diluted with CH2Cl2, washed with H2O, dried and
concentrated. Purification over silica gel column chromatography (0%→5% MeOH/CH2Cl2) gave
MDW933 5 as an orange powder (56%, 12.49 mg, 23.6 μmol).1H NMR (600 MHz, CDCl3) δ ppm
7.40 (s, 1H), 6.01 (s, 2H), 4.68 (d, J = 12.0 Hz, 1H), 4.58 (dd, J = 13.4, 7.5 Hz, 1H), 3.66 (d, J = 5.6
Hz, 1H), 3.40-3.34 (m, 1H), 3.20-3.15 (m, 1H), 3.02 (s, 1H), 2.97 (s, 1H), 2.96-2.91 (m, 2H), 2.73 (t, J
= 6.4, 6.4 Hz, 2H), 2.49-2.46 (s, 6H), 2.45-2.40 (m, 1H), 2.33 (s, 6H), 1.86 (td, J = 15.0, 7.6, 7.6 Hz,
2H), 1.66-1.58 (m, 2H). 13C NMR (150 MHz, CDCl3) δ ppm 153.9, 146.0, 140.3, 131.4, 121.7, 77.2,
77.0, 76.9, 76.7, 71.1, 67.4, 56.0, 54.5, 49.6, 43.0, 31.2, 29.5, 28.1, 25.2, 16.3, 14.4. LC/MS: Rt 6.83;
linear gradient 10→90% B in 13.5 min; ESI/MS: m/z = 530.00 [M+H]+. HRMS: (M+H+) calcd for
C26H34BF2N5O4 530.27447 found 530.27454
MDW941 6
KY170 4 (5.46 mg, 27 μmol) and BODIPY Red-alkyne 16 (13.1 mg, 27 μmol) (5) were dissolved in
tert-BuOH/Tol/H2O (1.5 mL, 1/1/1 v/v/v). CuSO4 (100 mM in H2O, 27 μL, 2.7 μmol) and sodium
ascorbate (100 mM in H2O, 41 μL, 4.1 μmol) were added. Subsequently, the reaction was heated to
80°C and stirred overnight. The solution was diluted with CH2Cl2, washed with H2O, dried and
concentrated. Purification over silica gel column chromatography (0%→5% MeOH in
dichloromethane) gave MDW941 6 as an purple powder (77%, 14.32 mg, 20.8 μmol).1H NMR (400
MHz, CDCl3) δ ppm 7.80 (d, J = 8.5 Hz, 4H), 7.36 (s, 1H), 7.17 (d, J = 3.4 Hz, 2H), 6.89 (d, J = 8.5
Hz, 4H), 6.54 (d, J = 3.8 Hz, 2H), 5.12-4.83 (m, 1H), 4.80-4.46 (m, 3H), 3.77 (s, 6H), 3.75-3.68 (m,
Nature Chemical Biology: doi: 10.1038/nchembio.466
22
1H), 3.45-3.34 (m, 1H), 3.26-3.13 (m, 1H), 3.11-3.02 (m, 1H), 3.00-2.94 (m, 1H), 2.90-2.78 (m, 2H),
2.73-2.58 (m, 2H), 2.51-2.36 (m, 1H), 2.08-1.91 (m, 2H), 1.84-1.67 (m, 4H). 13C NMR (150 MHz,
CDCl3) δ ppm 160.5, 157.4, 144.6, 136.0, 130.9, 126.8, 125.0, 120.0, 113.7, 71.0, 67.2, 56.0, 55.2,
54.6, 49.6, 42.7, 33.0, 30.3, 29.7, 29.4, 25.0. LC/MS: Rt 8.35; linear gradient 10→90% B in 13.5 min;
ESI/MS: m/z = 686.07 [M+H]+. HRMS: (M+H+) calcd for C36H38BF2N5O4 686.29560 found
686.29559.
(1R,2R,3S,6R)-6-(azidomethyl)cyclohex-4-ene-1,2,3-triol (17)
Azide 11 (103 mg, 0.28 mmol) was dissolved in CH2Cl2 (5 mL) and cooled to -78ºC before BCl3 (5
mL, 1M in CH2Cl2) was added. After 4 h stirring at -78°C, the reaction was quenched by the addition
of MeOH. The temperature was raised to room temperature and the solution was concentrated in
vacuo. Trace of BCl3 were removed by coevaporating with MeOH. The resulting crude triol 17 was
used as such in the click reaction.
MDW1064 (8)
Azide 17 (37 mg, 0.15 mmol) was dissolved in DMF (2 mL). To the solution was added BODIPY
Green-alkyne (82 mg, 0.25 mmol), CuSO4 (1M in H2O, 15 μL, 15 μmol) and sodium ascorbate (1M in
H2O, 23 μL, 23 μmol). The reaction was stirred overnight, after which TLC analysis revealed
complete conversion. The solution was diluted with EtOAc, washed with 1M HCl, NaHCO3 and brine,
dried over Na2SO4 and concentrated under reduced pressure. Silica gel column chromatography
(CH2Cl2→5% MeOH/CH2Cl2) afforded MDW1064 8 as an orange amorphous solid (72%, 55.3 mg,
108 μmol). 1H NMR (400 MHz, CDCl3/MeOD) δ ppm 7.48 (s, 1H), 6.08 (s, 2H), 5.58 (td, J = 10.2,
2.3, 2.3 Hz, 1H), 5.43 (td, J = 10.4, 2.0, 2.0 Hz, 1H), 4.61 (dd, J = 13.8, 3.8 Hz, 1H), 4.47 (dd, J =
13.9, 7.3 Hz, 1H), 3.99-3.95 (m, 1H), 3.47 (dd, J = 9.9, 8.0 Hz, 1H), 3.30 (t, J = 9.7, 9.7 Hz, 1H),
3.03-2.98 (m, 2H), 2.78 (t, J = 7.5, 7.5 Hz, 2H), 2.75-2.67 (m, 1H), 2.49 (s, 6H), 2.40 (s, 6H), 1.95-
1.86 (m, 2H), 1.74-1.64 (m, 2H). 13C NMR (150 MHz, CDCl3/MeOD) δ ppm 153.4, 146.8, 145.7,
Nature Chemical Biology: doi: 10.1038/nchembio.466
23
140.2, 130.9, 130.5, 125.0, 121.9, 121.3, 76.8, 71.6, 70.3, 50.6, 44.0, 30.9, 29.2, 27.6, 24.7, 15.7, 13.7.
LC/MS: Rt 7.22; linear gradient 10→90% B in 13.5 min; ESI/MS: m/z=513.87 [M+H]+.
MDW1065 (9)
Azide 17 (33 mg, 0.15 mmol) was converted to the title compound as described above. To the solution
was added BODIPY Red-alkyne (100 mg, 0.25 mmol), CuSO4 (1M in H2O, 15 μL, 15 μmol) and
sodium ascorbate (1M in H2O, 23 µL, 23 μmol). The reaction was stirred overnight, after which TLC
analysis revealed complete conversion. The solution was diluted with EtOAc, washed with 1M HCl,
NaHCO3 and brine, dried over Na2SO4 and concentrated under reduced pressure. Silica gel column
chromatography (CH2Cl2→5% MeOH/CH2Cl2) afforded title MDW1065 9 as a purple solid (70%, 71
mg, 106 µmol). 1H NMR (400 MHz, CDCl3) δ ppm 7.89-7.78 (m, 4H), 7.36-7.27 (m, 1H), 7.27-7.21
(m, 2H), 6.96-6.89 (m, 4H), 6.62-6.56 (m, 2H), 5.61-5.53 (m, 1H), 5.48-5.36 (m, 1H), 4.54-4.45 (m,
2H), 4.01-3.93 (m, 1H), 3.86-3.79 (m, 6H), 3.50 (t, J = 8.8, 8.8 Hz, 1H), 3.29 (t, J = 9.6, 9.6 Hz, 1H),
3.00-2.87 (m, 2H), 2.81-2.65 (m, 2H), 2.63-2.48 (m, 1H), 1.91-1.75 (m, 4H). 13C NMR (150 MHz,
CDCl3) δ ppm 160.4, 157.4, 147.2, 144.6, 135.9, 130.8, 126.7, 125.4, 125.0, 122.0, 119.9, 113.6, 77.1,
71.8, 70.3, 55.1, 50.8, 44.3, 32.9, 30.2, 29.2, 24.9. LC/MS: Rt 8.36; linear gradient 10→90% B in 13.5
min; ESI/MS: m/z=670.00 [M+H]+.
Determination of the binding constants
To 100 µL McIlvaine buffer (pH 5.2, 0.2% sodium taurocholate, 0.1% Triton X-100) containing 4-
methylumbelliferyl β-D-glucoside (7.5 mM) in Greiner flat bottom black 96-well plate was added 5
μL inhibitor (25× stock in DMSO). The resulting mixture was preincubated at 37°C for 15 min in a
TECAN GENios microplate reader. GBA (2 ng) in McIlvaine buffer (20 μL pH 5.2, 0.2% sodium
taurocholate, 0.1% Triton X-100) was preheated to 37°C for 15 min before being added to the
substrate mix. The resulting solution was mixed by horizontal shaking for 15 sec, after which release
4-methylumbelliferyl measured with a TECAN GENios platereader (λex 340 nm and λem 465 nm) for
the indicated time. Bleaching of the fluorophore, which was observed during the assay, was corrected
Nature Chemical Biology: doi: 10.1038/nchembio.466
24
by subtracting blanks (100 μL substrate buffer, 5 μL DMSO, 20 μL McIlvaine buffer). Apparent rate
constants k’ were obtained by fitting the resulting progress curves (Figure 1A) to the one-phase
association equitation 0'
0max )exp1)(( yyyy tk +−−= − in GraphPad Prism version 5.00 for Windows,
GraphPad Software, San Diego California USA, www.graphpad.com. Measurements were performed
in nine fold and plotting of the obtained k’ values versus [I0] yielded rectangular hyperbolar functions
(Figure 1B). Using the equitation ][
]['0
0
Ι+Ι
=appi
i
Kkk estimates of Ki app and ki were obtained. The Ki
value in the absence of substrate was obtained by correcting the Ki app with )][1(mK
S+ . The Km of 4-
methylumbelliferyl β-D-glucoside for GBA is 1.2 mM.
Molecular docking
KY170 4, MDW933 5, and MDW941 6 were docked on GBA as follows. Allowing conformational
changes in the small compounds, enzyme-ligand complexes were simulated with a low free energy.
Ligand molecules were prepared using MarvinSketch. Lowest energy conformers were calculated and
saved as .pdb files that were used as input for AutodockTools. Rotatable bonds were defined and
.pdbqt files were generated that served as input for Autodock Vina (7). Similarly, protein .pdbqt files
were also prepared using AutodockTools. The protein file was produced from the crystal structure
coordinates of glucocerebrosidase in the open state (pdb 2VE3,(8)). Autodock Vina experiments were
run on a 2.66 GHz Intel duo core iMac computer (Apple Macintosh). Flexible docking experiments
were run using standard settings apart from the exhaustiveness, which was set at 10. A search space
spanning roughly 30 cubic Ångströms around the active site was defined.
Time-lapse microscopy
Fibroblasts were cultured in chamber slides (Lab-Tek II, Nunc, Roskilde, Denmark) and incubated
with 5 nM compound MDW933 5 or MDW941 6; immediately after which mineral oil was thinly
layered on top of the culture medium to prevent evaporation. With the 37°C, 10% CO2 incubator
enclosing the microscope, cells were imaged every 5 min for 2 hours simultaneously using
Nature Chemical Biology: doi: 10.1038/nchembio.466
25
fluorescence microscopy with an N2.1 filter block and phase-contrast brightfield microscopy (Leica
IR-BE with Z-motor drive and a Plan APO 63×/1.40 oil immersion objective (Leica Microsystems,
Rijswijk, The Netherlands), equipped with a KX85 camera, Apogee Instruments, Auburn, CA, USA).
To minimize photo-toxicity fluorescence imaging was limited to 2 h; to monitor for possible toxicity
due to the presence of MDW933 5 or MDW941 6, after 2 h live-cell imaging was continued with
bright field microscopy only for another 98 hours. An auto-focus routine was applied during
acquisition. Images were analyzed using TimeLapseAVI 5.1.4 software (©Ron Hoebe, CMO, AMC,
University of Amsterdam, The Netherlands; [email protected]).
Mass spectrometric analysis of GBA labeled with KY170 4 and MDW933 5
Identification of the site of binding of KY170 4
GBA (5 μg) was labeled with 6 μM KY170 4 in McIlvaine buffer (150 mM, pH 5.2, 0.2% sodium
taurocholate (w/v), 0.1% Triton X-100 (v/v)) for 1h at 37°C (10 μL end volume). Prior to digestion the
pH was adjusted by the addition of 200 mM NH4HCO3 (pH 8.0), and the protein was reduced with 10
mM dithiothreitol for 30 min at 60°C and alkylated with 15 mM iodoacetamide for 30 min at RT in
the dark. The labeled protein was digested by addition of 50 ng trypsin (sequencing grade modified,
Promega) and incubation at 37°C overnight. Protein digests were desalted using reversed phase C18-
Ziptips (2 μg capacity, Millipore). After activation in acetonitrile and loading of the samples, the
Ziptips were washed with 0.1% aqueous trifluoroacetic acid and eluted with 60% acetonitrile, 0.1%
trifluoroacetic acid and 39.9% water. Prior to loading onto the LC-MS system samples were diluted
10-fold with 0.1% aqueous trifluoroacetic acid.
Identification of the site of binding of MDW933
Some 40 μg of recombinant GBA (1 μg/μL) was diluted in 60 μL McIlvaine buffer (150 mM, pH 5.2,
0.2% sodium taurocholate (w/v), 0.1% Triton X-100 (v/v)), incubated with MDW933 5 (10 μL, 20
μM stock in DMSO) for 1h at 37°C and precipitated with chloroform/methanol (C/M, (9)). The
protein pellet was rehydrated in 90 μL 8 M urea/100 mM NH4HCO3, reduced with 5 μL 90 mM
dithiothreitol for 30 min at 37°C, alkylated with 7.5 μL 200 mM iodoacetamide for 30 min at RT in
Nature Chemical Biology: doi: 10.1038/nchembio.466
26
the dark and desalted by C/M. The pellet was dispersed in 100 μL 8 M urea/50 mM Na2CO3 buffer
(pH 9.4). To 50 μL of the protein solution was added 5 μL hydroxylamine hydrochloride (10 M) and
45 µL 8 M Urea/50 mM Na2CO3 buffer (pH 9.2). The pH was adjusted to pH ~9.2 by the addition of
NaOH (5M). The resulting mixture was incubated overnight at 37°C, precipitated with C/M,
redissolved in 10 μL 8 M urea/100 mM NH4HCO3, diluted with 90 μL digest buffer (100 mM Tris-
HCl pH 7.8, 100 mM NaCl, 1mM CaCl2, 2% ACN) and digested with 500 ng trypsin overnight at
37°C. Peptides were collected and desalted on stage tips (10).
LC-MS analysis
Tryptic peptides were analyzed on a Surveyor nanoLC system (Thermo) hyphenated to a LTQ-
Orbitrap mass spectrometer (Thermo). Gold and carbon coated emitters (OD/ID=360/25μm tip ID=5
μm), trap column (OD/ID=360/100 μm packed with 25 mm robust Poros®10R2/ 15 mm BioSphere
C18 5 μm 120Å) and analytical columns (OD/ID=360/75 µm packed with 20 cm BioSphere C18 5 μm
120Å) were from Nanoseparations (Nieuwkoop, The Netherlands). The mobile phases (A: 0.1%
FA/H2O, B: 0.1%FA/ACN) were made with ULC/MS grade solvents (Biosolve). The emitter tip was
coupled end-to-end with the analytical column via a 15 mm long TFE teflon tubing sleeve (OD/ID
0.3×1.58 mm, Supelco, USA) and installed in a stainless steel holder mounted in a nano-source base
(Upchurch scientific, Idex, USA).
General mass spectrometric conditions were: an electrospray voltage of 1.8 kV was applied to the
emitter, no sheath and auxiliary gas flow, ion transfer tube temperature 150°C, capillary voltage 41V,
tube lens voltage 150V. Internal mass calibration was performed with air-borne protonated
polydimethylcyclosiloxane (m/z = 445.12002) and the plasticizer protonated dioctyl phthalate ions
(m/z = 391.28429) as lock mass (11).
10 μL of the samples was pressure loaded on the trap column with a 10 μL/min flow for 5 min
followed by peptide separation with a gradient of 35 min 5-30% B, 15 min 30-60% B, 5 min A at a
flow of 300 μL/min split to 250 nL/min by the LTQ divert valve. For each data dependent cycle, one
full MS scan (300-2000 m/z) acquired at high mass resolution (60,000 at 400 m/z, AGC target 1x10⁶,
maximum injection time 1,000 ms) in the Orbitrap was followed by 3 MS/MS fragmentations in the
Nature Chemical Biology: doi: 10.1038/nchembio.466
27
LTQ linear ion trap (AGC target 5x10³, max inj time 120 ms) from the three most abundant ions. MS2
settings were: collision gas pressure 1.3 mT, normalized collision energy 35%, ion selection threshold
of 500 counts, activation q = 0.25 and activation time of 30 ms. Fragmented precursor ions that were
measured twice within 10 s were dynamically excluded for 60s and ions with z<2 or unassigned were
not analyzed. Data from MS2 was validated manually.
Supplementary reference
(1) Hansen, F. G., Bundgaard, E. & Madsen, R. A short synthesis of (+)-cyclophellitol. J. Org. Chem.
70, 10139 (2005)
(2) Tian, W.X., Tsou, C.-L. Determination of the rate constant of enzyme modification by measuring
the substrate reaction in the presence of the modifier. Biochemistry 21, 1028 (1982)
(3) Baici, A., Schenker, P., Wächter, M. & Rüedi, P. 3-Fluoro-2,4-dioxa-3-phosphadecalins as
inhibitors of acetylcholinesterase. A reappraisal of kinetic mechanisms and diagnostic methods. Chem.
Biodivers. 6, 261 (2009)
(4) Ouchir, H., Mihara, Y. & Takahata, H. A new route to diverse 1-azasugars from N-boc-5-hydroxy-
3-piperidene as a common building block. J. Org. Chem. 70, 5207, (2005).
(5) Verdoes, M. et al. Acetylene functionalized BODIPY dyes and their application in the synthesis of
activity based proteasome probes. Bioorg. Med. Chem. Lett. 17, 6169 (2007)
(6) Wennekes, T. et al. Large-scale synthesis of the glucosylceramide synthase inhibitor N[5-
(adamantan-1-yl-methoxy)-pentyl]-1-deoxynojirimycin Org. Process. Res. Dev. 12, 414 (2008)
(7) Trott, O. & Olsen, A.J. Autodock vina: improving the speed and accuracy of docking with a new
scoring function, efficient optimization, and multithreading. J. Comput. Chem. 31, 455 (2010)
(8) Brumshtein, B. et al. Crystal structures of complexes of N-butyl and N-nonyl-deoxynojirimycin
bound to acid β-glucosidase: Insights into the mechanism of chemical chaperone action in Gaucher
disease. J. Biol. Chem. 282, 29052 (2007)
(9) Wessel, D.& Flügge, U.I. A method for the quantitative recovery of protein in dilute-solution in
the presence of detergents and lipids. Anal. Biochem. 138, 141 (1984).
Nature Chemical Biology: doi: 10.1038/nchembio.466
28
(10) Rappsilber, J., Mann, M. & Ishihama, Y. Protocol for micro-purification, enrichment, pre-
fractionation and storage of peptides for proteomics using StageTips. Nat. Protocols 2, 1896 (2007)
(11) Olsen, J.V. et al. Parts per million mass accuracy on a orbitrap mass spectrometer via lock mass
injection into a c-trap. Mol. Cell. Proteomics 4, 2010 (2005)
Nature Chemical Biology: doi: 10.1038/nchembio.466
NH
HO OH
HO
Isofagomine 1
Nature Chemical Biology: doi: 10.1038/nchembio.466
0.00.20.40.60.81.01.21.41.61.82.02.22.42.62.83.03.23.43.63.84.04.24.44.64.85.0f1 (ppm)
-5000
0
5000
10000
15000
20000
25000
30000
35000
40000
45000
50000
55000
60000
1.65
1.65
1.66
1.67
1.68
1.69
1.70
1.71
1.72
2.36
2.36
2.38
2.40
2.41
2.43
3.06
3.07
3.09
3.11
3.12
3.15
3.27
3.30
3.46
3.50
3.59
3.62
3.79
3.80
3.82
3.82
NH
HO OH
HO
Isofagomine 1
Nature Chemical Biology: doi: 10.1038/nchembio.466
OH
HO OH
HO
O
Cylcophellitol 3
Nature Chemical Biology: doi: 10.1038/nchembio.466
OH
HO OH
HO
O
Cylcophellitol 3
Nature Chemical Biology: doi: 10.1038/nchembio.466
ppm (t1)050100150200
HO
OH
OH
N3
O
KY170 4
Nature Chemical Biology: doi: 10.1038/nchembio.466
ppm (f1)0.01.02.03.04.05.06.07.0
HO
OH
OH
N3
O
KY170 4
Nature Chemical Biology: doi: 10.1038/nchembio.466
ppm (f1)050100150200
OH
OH
HON
O
NB
N
H3C
H3CF
F
N N
CH3
CH3
MDW933 5
Nature Chemical Biology: doi: 10.1038/nchembio.466
ppm (f1)1.02.03.04.05.06.07.0
OH
OH
HON
O
NB
N
H3C
H3CF
F
N N
CH3
CH3
MDW933 5
Nature Chemical Biology: doi: 10.1038/nchembio.466
ppm (f1)050100150
OH
OH
HON
ON
B
NF
F
MeO
MeO
N N
MDW941 6
Nature Chemical Biology: doi: 10.1038/nchembio.466
ppm (f1)0.01.02.03.04.05.06.07.08.0
OH
OH
HON
ON
B
NF
F
MeO
MeO
N N
MDW941 6
Nature Chemical Biology: doi: 10.1038/nchembio.466
ppm (f1) 050100150200
OH
OH
HON
NB
NF
F
N N
MDW1064 8
Nature Chemical Biology: doi: 10.1038/nchembio.466
ppm (t1) 0.05.0
OH
OH
HON
NB
NF
F
N N
MDW1064
Nature Chemical Biology: doi: 10.1038/nchembio.466
ppm (f1) 050100150200
OH
OH
HON
NB
NF
F
MeO
MeO
N NMDW1065 9
Nature Chemical Biology: doi: 10.1038/nchembio.466
ppm (f1) 0.501.001.502.002.503.003.504.004.505.005.506.006.507.007.508.00
OH
OH
HON
NB
NF
F
MeO
MeO
N NMDW1065 9
Nature Chemical Biology: doi: 10.1038/nchembio.466
ppm (f1)050100150200
HO
OBn
OBn
N3
11
Nature Chemical Biology: doi: 10.1038/nchembio.466
ppm (f1)0.01.02.03.04.05.06.07.0
HO
OBn
OBn
N3
11
Nature Chemical Biology: doi: 10.1038/nchembio.466
ppm (f1)050100150
BzO
OBz
OBz
N3
12
Nature Chemical Biology: doi: 10.1038/nchembio.466
ppm (f1)0.01.02.03.04.05.06.07.08.0
BzO
OBz
OBz
N3
12
Nature Chemical Biology: doi: 10.1038/nchembio.466
ppm (f1)050100150200
BzO
OBz
OBz
N3
O
13
Nature Chemical Biology: doi: 10.1038/nchembio.466
ppm (f1)0.01.02.03.04.05.06.07.08.0
BzO
OBz
OBz
N3
O
13
Nature Chemical Biology: doi: 10.1038/nchembio.466
ppm (f1)050100150
BzO
OBz
OBz
N3
O
14
Nature Chemical Biology: doi: 10.1038/nchembio.466
ppm (f1)0.01.02.03.04.05.06.07.08.0
BzO
OBz
OBz
N3
O
14
Nature Chemical Biology: doi: 10.1038/nchembio.466
NB
NF
F
15
Nature Chemical Biology: doi: 10.1038/nchembio.466
NB
NF
F
16
O
O
Nature Chemical Biology: doi: 10.1038/nchembio.466