Embed Size (px)
Citation preview
University of Groningen
Measuring Dialect Pronunciation Differences using Levenshtein DistanceHeeringa, Wilbert Jan
IMPORTANT NOTE: You are advised to consult the publisher's version (publisher's PDF) if you wish to cite fromit. Please check the document version below.
Document VersionPublisher's PDF, also known as Version of record
Publication date:2004
Link to publication in University of Groningen/UMCG research database
Citation for published version (APA):Heeringa, W. J. (2004). Measuring Dialect Pronunciation Differences using Levenshtein Distance. s.n.
CopyrightOther than for strictly personal use, it is not permitted to download or to forward/distribute the text or part of it without the consent of theauthor(s) and/or copyright holder(s), unless the work is under an open content license (like Creative Commons).
The publication may also be distributed here under the terms of Article 25fa of the Dutch Copyright Act, indicated by the “Taverne” license.More information can be found on the University of Groningen website: https://www.rug.nl/library/open-access/self-archiving-pure/taverne-amendment.
Take-down policyIf you believe that this document breaches copyright please contact us providing details, and we will remove access to the work immediatelyand investigate your claim.
Downloaded from the University of Groningen/UMCG research database (Pure): http://www.rug.nl/research/portal. For technical reasons thenumber of authors shown on this cover page is limited to 10 maximum.
Download date: 31-10-2021

Chapter 9
Measuring Dutch dialectdistances
On the basis of a small data set of Norwegian varieties we validated a rangeof different computational methods in Chapter 7. We found that the methodwith the highest score is a variant of the Levenshtein distance, where (i) seg-ment distances are found on the basis of the Barkfilter representation, (ii) fourlength gradations are used, (iii) diphthongs are represented as a sequence of twosegments, (iv) and logarithmic segment distances are used (Section 7.5.1). Thismethod was applied to a larger set of Norwegian varieties in Chapter 8. In thischapter we apply the same method to Dutch dialects. We use data from the ReeksNederlandse Dialectatlassen (RND), a series of Dutch dialect atlasses which wereedited by Blancquaert and Pee in the period 1925–1982. The goal of this chapteris to show that the application of the Levenshtein distance to the Dutch materialof the RND gives interesting and useful results, despite the shortcomings of theRND transcriptions.
In Section 9.1, the RND will be discussed in more detail. In Section 9.2 theselected variant of the Levenshtein distance is applied to this data source, andthe resulting distances are discussed. On the basis of these distances, the dialectsare classified. Results of cluster analysis are presented in Section 9.3, where amain classification is given. In Section 9.4 each of the groups that are foundin the main classification is discussed in more detail. In Section 9.5, results ofmultidimensional scaling are given. Using this technique the Dutch languagearea may be viewed as a continuum. The Dutch dialects are also compared toStandard Dutch. A ranking of difference with respect to Standard Dutch is givenin Section 9.6. In Section 9.7 we draw some conclusions.
213

214 CHAPTER 9. MEASURING DUTCH DIALECT DISTANCES
9.1 Data source
The Reeks Nederlandse Dialectatlassen (RND) is a series of atlasses coveringthe Dutch dialect area. The Dutch dialect area comprises the Netherlands, thenorthern part of Belgium, a smaller northwestern part of France and the Ger-man county Bentheim. The atlas series consist of 16 parts. Although the Dutchlanguage area consists of 16 provinces as well, the 16 volumes do not exactlycorrespond with the 16 provinces. In 1925, the first volume appeared, compiledby Blancquaert. The volume contains transcriptions of dialects in Klein-Brabant.The first recordings for this volume were already made in 1921 or 1922 (Goos-sens, 1997). After this, Blancquaert initiated a project in which recordings weremade of varieties in the whole Dutch language area. To speed up the progress,Blancquaert engaged several collaborators. Unfortunately, Blancquaert died be-fore all the volumes were finished. Pee was his successor and finished the project.The last recordings were made by Entjes in 1975. These recordings are foundin part 14 (Zuid-Drenthe and Noord-Overijssel), that appeared in 1982 as a lastinstallment.
9.1.1 Words
In the RND, the same 141 sentences are translated and transcribed in phoneticscript for each dialect. Blancquaert mentions that the questionaire was conceivedas a range of sentences with words that illustrate particular sounds. The designsaw to it that, e.g., possible changes of old-Germanic vowels, diphthongs andconsonants are represented in the questionaire. Morphologic and syntactic phe-nomena are also represented in the sentences (Blancquaert, 1948, p. 13). Sincedigitizing the phonetic texts is time-consuming on the one hand, and since theLevenshtein distance is a word-based method on the other hand, we selected only125 words from the text. These words were digitized for each dialect and usedas input for the Levenshtein distance. The words represent (nearly) all vowels(monophthongs and diphthongs) and consonants. Also the consonant combina-tion [sx] is represented, which is pronounced as [sk] in some dialects and as [S] insome other dialects. The words are listed in Appendix B Table B.3.
Since the RND transcriptions consists of sentences, the same word may varylexically in different dialects. We digitized and processed only forms which weresemantically equal, as far as we could judge. Among different lexical nouns itmay appear that one form has a determiner, and another has not. We alwaysleft out the determiner. In a sentence, assimilation phenomena can be found. Sothese phenomena are also found in the word transcriptions which we cut fromthe sentences. When two succeeding words in a sentence were not separated bya space, we tried to find the border between the two words by comparing thetranscription with the transcriptions of other nearby varieties in which the wordswere separated by a space, or by comparing with comparable transcriptions in the

9.1. DATA SOURCE 215
same text. If we found that the last segment of a word was shared with the firstsegment of the next word, we included the segment in both words when cuttingthem from the sentence. E.g. we split [Os@bludrINk@n] in [Os@blud] ‘ox-blood’ and[drINk@n] ’drink’.
Sometimes a few of the expected words are missing for certain varieties, e.g.as the consequence of a free translation of some sentences. When two varieties arecompared, and for one of the 125 words a translation is missing in one variety or inboth varieties, the word is not taken into account in the calculation of the distance(see Section 5.1.10.1). For some words, more than one pronunciation was given,since e.g. an older and a newer form may be in circulation simultaneously. Inthese cases, the mean distance over the variants of one word is used for calculatingthe distance (see Section 5.1.10.2).
An extended discussion about the selection of words from the RND can befound in Heeringa (2001). The detailed presentation and discussion of the datais not repeated here, since we focus here on the analysis. The digitized datais publically available at http://www.let.rug.nl/~heeringa/dialectology/
atlas/ with the kind permission of the publisher, De Sikkel.1
9.1.2 Varieties
The RND contains transcriptions of 1956 Dutch varieties. It would be verytime-consuming to digitize all transcriptions. Therefore, we made a selection of360 dialects. When selecting the dialects the goal was to get a net of evenlyscattered dialect locations. First, we selected all locations in the RND whichhave more than 5,000 and fewer than 10,000 inhabitants. In smaller locations thedialect may be less stable due to moving or deaths, while in larger towns theremay exist more than one dialect. Where the density remained too low, smallerlocations were also used. Where an irregular pattern arose, the larger locationswere sometimes replaced by smaller ones. A denser sampling resulted in the areasof Friesland and Groningen, and in the area in and around Bentheim.
In the map of Hof (1933, p. 14a) the Frisian area is divided into Bildts, Woud-fries, Zuidhoeks and Stellingwerfs.2 The selection was adjusted so that each ofthese groups was represented. A special group of Frisian varieties that do not formone geographical area are the ‘town Frisian’ varieties (Stad(s)fries). Just as thedialect of het Bildt, town Frisian dialects may be regarded as an intermediate formof Dutch and Frisian. Town Frisian varieties are spoken in Midsland, Dokkum,Harlingen, Franeker, Leeuwarden, Bolsward, Sneek, Heerenveen, Staveren and onthe island of Ameland. In the map of Daan and Blok (1969) the town Frisian loc-ations appear as language islands in the ‘pure’ Frisian language continuum. Allof these locations are included in our data set. The map of Daan suggested that
1Later on this publisher was taken over by De Boeck, Antwerpen.2A clearer print of this map is found on the cover of the thesis of Breuker (1993).

216 CHAPTER 9. MEASURING DUTCH DIALECT DISTANCES
the variety of Kollum belongs to Kollumerlands. In our results it will appear thatthis variety belongs rather to the town Frisian varieties. Therefore, we also regardKollum as a town Frisian language island. The geographical island of Amelandis represented by Hollum and Nes. Since the collection of ‘pure’ Frisian locationshave the same density as the sample in the remaining part of our study, and thetown Frisian locations are added to them, we get a relatively higher density inFriesland.
For the Frisian locations of Appelscha, Donkerbroek and Tjalleberd two textsare given in the RND. Appelscha is located in the Stellingwerf area. In addi-tion to a Low Saxon Stellingwerf variety, a Frisian variety is spoken, introducedby Frisian laborers who moved to Appelscha at the time of peat-diggings. Weprocess the Frisian variety as a language island. Below, ‘Appelscha 1’ refers tothe Stellingwerf variety and ‘Appelscha 2’ to the Frisian variety. A Frisian anda Stellingwerf variety are also spoken in Donkerbroek. In the map of Daan andBlok (1969) it can be seen that the river Kuinder (or Tjonger) is the bound-ary between Frisian (west) and Low Saxon (east). Since Donkerbroek is locatedwest of this river, we regarded the Frisian variety as part of the Frisian languagecontinuum and the Stellingwerf variety as a Low Saxon language island in theFrisian language continuum. Below ‘Donkerbroek 1’ refers to the Frisian varietyand ‘Donkerbroek 2’ to the Stellingwerf variety. In Tjalleberd, most people spokeFrisian when the RND recordings in Friesland were made. However, a minor partof the population spoke Tjalleberds (or ‘Gietersk’), a variety introduced by peatlaborers from northwestern Overijssel (Giethoorn and surroundings). We processthe Tjalleberd variety as language island. The Frisian variety is referred to as‘Tjalleberd 1’, and the Stellingwerf variety as ‘Tjalleberd 2’.
In Reker (1993, p. x) the province of Groningen is divided in West-Groningen,North-Groningen, Oldambt, Westerwolde, Veenkolonien, and the city of Gronin-gen. The northern part of the province of Drenthe, south of the province ofGroningen, is not displayed on this map. However, the varieties of this area arestrongly related to the Groningen varieties. Because of personal interest, relat-ively more varieties are chosen in Groningen and North-Drenthe. The varietiesare chosen so that each of the different areas is represented.
In part 14 (Zuid-Drenthe and Noord-Overijssel), varieties of the Germancounty Bentheim are included. In a study about Dutch-German contact in andaround Bentheim, the German transcriptions on the one side, and the Dutchtranscriptions on the other side of the Dutch-German border are used (Heeringaet al., 2000). Since the same varieties are used in the present study, a higherdensity is found in and around Bentheim.
The RND includes also some varieties in the Belgium province of Luik. Justas the varieties in Bentheim, these varieties do not belong to the Dutch languagearea. The dialects are found south of the Dutch province of Limburg in the

9.1. DATA SOURCE 217
northeastern part of the Belgium province of Luik. We selected Aubel and Baelenwhich belong to the French language area, and Eupen and Raeren which belongto the German language area.
The geographical distribution of the 360 Dutch varieties is shown in Figure 9.1.Since in Appelscha, Donkerbroek and Tjalleberd two varieties are spoken, themap shows only 357 localities. We divided the Dutch language area in a north-western, northeastern, southwestern and southeastern part. Each of these partsare visualized in more detail in the Figures 9.10, 9.13, 9.15, 9.17, 9.19, 9.21, 9.22and 9.24. More about the selection of varieties from the RND can be found inHeeringa (2001).
To be able to compare the varieties with respect to Standard Dutch, we alsoadded a transcription of Standard Dutch. To assure consistency with the existingRND transcriptions, the Standard Dutch transcription is based on the Tekstboekjeof Blancquaert (1939). However, we transcribed words such as komen, rozen andopen as [ko;m@], [ro:z@] and [o;p@]. In the Tekstboekje of Blancquaert these wordswould end on an [n], just as suggested by the spelling. For more details seeHeeringa (2001).
9.1.3 Groups
The most recent dialect map of the Dutch language was published in 1969 andcompiled by Jo Daan (Daan and Blok, 1969). The map was already mentionedin Section 2.2.1 where we discussed the arrow method. With the arrow method,dialect borders are found on the basis of the perception of the dialect speakers. Inthis map the Dutch language area is divided into 28 different groups. The groupsare mentioned in Table 9.1. The map in Figure 9.2 shows the classification ofour set of varieties according to the map of Daan. For 49 borderline cases wefound it unclear to which of the groups they belong. We left them out, so themap is eventually based on 311 varieties. In this set, 26 of the 28 groups arerepresented. Not represented are Daan’s groups 8 and 16. Three small groupswere represented by only one variety, namely group 2 (Egmond aan Zee), group4 (Koog aan de Zaan) and group 12 (Geraardsbergen). In Section 9.3 we willcompare the results of the Levenshtein distance to the classification that is givenin the map of Daan.
9.1.4 Consistency
As mentioned above the RND consists of 16 different parts. The recordings weremade during a time interval of more than 50 years. Therefore, differences inpronuncation may be in some cases the result of differences in time. The volumesof two adjacent areas never differ by more than 30 years, so the effect of temporaldifference is mainly found when comparing varieties which are geographicallymore distant. Sometimes a rather large interval per volume was found as well. We

218 CHAPTER 9. MEASURING DUTCH DIALECT DISTANCES
Figure 9.1: Distribution of the 357 localities, corresponding with 360 differentvarieties. White diamonds represent language islands and grey diamonds repres-ent localities with two dialects where one of the two dialects is a dialect island.Circles represent small geographic islands. In the Figures 9.10 through 9.24 thedifferent parts of the Dutch language area of shown in more detail.

9.1. DATA SOURCE 219
1 Dialect of Zuid-Holland2 Dialect of Kennemerland3 Dialect of Waterland4 Dialect of Zaan region5 Dialect of northern Noord-Holland6 Dialect of the province of Utrecht and the Alblasserwaard region7 Dialect of Zeeland8 Dialect of region between Holland and Brabant dialects9 Dialect of West Flanders and Zeeuws-Vlaanderen10 Dialect of region between West and East Flanders dialects11 Dialect of East Flanders12 Dialect of region between East Flanders and Brabant dialects13 Dialect of the river region14 Dialect of Noord-Brabant and northern Limburg15 Dialect of Brabant16 Dialect of region between Brabant and Limburg dialects17 Dialect of Limburg18 Dialect of the Veluwe region19 Dialect of Gelderland and western Overijssel20 Dialect of western Twente and eastern Graafschap21 Dialect of Twente22 Dialect of the Stellingwerf region23 Dialect of southern Drenthe24 Dialect of central Drenthe25 Dialect of Kollumerland26 Dialect of Groningen and northern Drenthe27 Frisian language28 Dialects of het Bildt, Frisian cities, Midsland, and Ameland Island
Table 9.1: In the map of Daan and Blok (1969) 28 groups are distinguished. Inthe map in Figure 9.2 the locations of the groups are displayed.

220 CHAPTER 9. MEASURING DUTCH DIALECT DISTANCES
27
2827
2825
27
26
5
23
4
61
22
19
19
18
24
23
20 21
20
7
7
7
11
13
14
15
13
179
1012
Figure 9.2: Locations of the 28 groups as distinguished in the map of Daanand Blok (1969). Provincial borders are represented by thinner lines and dialectborders by thicker ones. The numbers are explained in Table 9.1. Diamonds rep-resent dialect islands. The black diamonds represent Frisian cities, which belongto group 28. The white diamond represents Appelscha, where both the dialectof group 22 and group 26 is spoken. The grey diamond represents Vriezenveenwhich contrasts strongly with its surroundings.

9.1. DATA SOURCE 221
found the largest interval in volume 12 (Gelderland and Zuid-Overijssel) whichwas compiled during a period of 20 years. The 16 volumes of the RND werecompiled by 16 different authors (and some assistants). Some authors workedon more than one volume, and some volumes were compiled by more than oneauthor.
In Table 9.2 an overview is given of volumes and authors. The recording peri-ods are borrowed from Reker (1997). The codes refer to the map in Figure 9.3.In this map, the areas per volume and per author are given. When we discussresults in Section 9.3, we can check whether the border we find represent bordersbetween volumes or authors by consulting this map. For volume 2 (the southernpart of East Flanders) the recordings are for the greater part made by E. Blanc-quaert, and for a lesser part by H. Vangassen in cooperation with Blancquaert.In the map, we mention both authors since the volume does not specify whichtranscriptions were made by which author. All locations in volume 5 (ZeelandIslands) were visited by both E. Blancquaert and P. J. Meertens. Therefore, wemention both authors again. In the map white diamonds represent dialects whichwere recorded by Blancquaert while surrounding dialects were recorded by oneor more other authors. Grey diamonds in the area of volume 11 (Zuid-Hollandand Utrecht) represent dialects which were recorded by Blancquaert and L. Oyen.Black diamonds in the area of volume 15 (Friesland) mark dialects recorded byBlancquaert, K. Boelens and G. van der Woude. By means of these joint record-ings Blancquaert introduced the new fieldworkers to his system, ensuring a basiclevel of consistency.
Slightly different questionnaires are used in the RND. Generally speaking aFlemish version (volumes 1 through 8) and a Dutch version (volumes 9 trough16) were used. For volume 6 many words were replaced by French equivalents.For volume 15 in most cases a Frisian questionnaire was used, and for a fewercases a Dutch questionnaire. Our list of 125 words contains only words for whichequivalents are found in all questionnaires. A questionnaire may direct dialectspeakers to a certain degree, especially on the lexical level. Therefore the use ofdifferent transcriptions can make the RND material less consistent. On the otherhand, questionaires were adapted so that they accord better with the dialectarea for which they were used. This may result in more true transcriptions. Adirecting effect will be found only in transition zones. More about differencesbetween questionaires is discussed in Heeringa (2001).
Although the goal was that transcribers should work using Blancquaert’sguidelines to ensure consistency, the different transcribers use slightly differentnotations (see also Goossens (1977, pp. 71–72)). Examining the transcriptionsof different varieties, it is not always clear whether differences are transcriberdifferences or real pronunciation differences, which makes it hard to trace alltranscriber differences. However, we found a limited set of differences that wereobviously transcriber differences. In this section they will be discussed briefly.For each of them, we describe how we normalized the data for them. In Heeringa

222 CHAPTER 9. MEASURING DUTCH DIALECT DISTANCES
Volume Author(s) Period Code
1 E. Blancquaert 1922–1925 bla 12 E. Blancquaert and H. Vangassen 1927–1930 bla/van 23 E. Blancquaert 1933–1935 bla 34 H. Vangassen 1933–1935 van 45 E. Blancquaert and P. J. Meertens 1932–1939 bla/mee 56 Willem Pee 1934–1940 pee 67 Willem Pee 1946–1953 pee 78 J. C. Claessens 1937–1948 cla 88 W. Goffin 1937–1948 gof 88 A. Stevens 1937–1948 ste 89 A. Weijnen 1939–1949 wei 910 A. R. Hol 1949–1959 hol 1010 J. Passage 1949–1959 pa 1011 L. Oyen 1950–1962 oye 1112 H. Entjes 1950–1970 ent 1212 A. R. Hol 1950–1970 hol 1213 Jo Daan 1950–1962 daa 1314 H. Entjes 1974–1975 ent 1415 K. Boelens 1950–1951 boe 1515 G. van der Woude 1950–1951 wou 1516 A. Sassen 1956–1961 sas 16
Table 9.2: List of volumes and authors of the RND together with the periodsduring which the recordings were made. The codes are used in the map in Fig-ure 9.3.

9.1. DATA SOURCE 223
boe 15
daa 13
daa 13
wou 15wou 15
wou 15
sas 16
daa 13
oye 11
boe 15
ent 14
ent 12
hol 12
ent 14
bla/mee 5
bla/mee 5
bla/mee 5
bla 3
bla 1
wei 9
pee 7
hol 10
pas 10
cla 8
gof 8pee 6
bla/van 2van 4 gof 8
ste 8
Figure 9.3: Distribution of volumes and authors over the 360 RND varieties.Provincial borders are represented by thinner lines and volume/author areas bythicker ones. Black diamonds represent recordings of E. Blancquaert, white dia-monds represent recordings of Blancquaert and L. Oyen, and grey diamondsrepresent recordings of Blancquaert, K. Boelens and G. van der Woude. Thecodes are explained in Table 9.2.

224 CHAPTER 9. MEASURING DUTCH DIALECT DISTANCES
(2001) some of the same consistency problems are discussed more extensively, butthe way in which they are solved may differ slightly from the way we describedin this section.
9.1.4.1 Vowel + trill
In the RND, sometimes the ee, oo and eu before r are transcribed as respectively[e:], [o:] and [ø:] (see e.g., Blancquaert (1948)) and sometimes as [I;], [U;] and [Y;](see e.g., the introduction of volume 13). Sometimes one author even used bothnotations intermixed (see e.g. the introduction of volume 16). To standardizedifferent notations with the same meaning, we could replace each [e], [o] or [ø]before [r] or [ö] by respectively [I], [U] or [Y]. Since an [r] may also be weakenedto a [@], the [e], [o] and [ø] before [@] should also be replaced by respectively [I],[U] or [Y]. However, it is not always clear whether an [@] after an [e], [o] or [ø]is a weakened [r]. If not, the [e], [o] and [ø] should not be changed, to avoidthat e.g., the relation between two different (dialect) pronunciations of zee ‘sea’,namely [ze:] and [ze:@] (the latter would be changed to [zI:@]) is lost. Howeverit is infeasible to determine the exact meaning of the large number of schwa’s inthe large number of varieties. The other possibility is to replace each [I], [U] or[Y] before [r] or [ö] by respectively [e], [o] or [ø]. However, when applying thesesubstitutions, problems arise since the r is deleted in some pronunciations. E.g.the relation between [pI;rt], which is a dialect pronunciation of paard ‘horse’ (andwhich would be changed in [pe;rt]) and [pItj@], which is a dialect pronunciationof paardje ‘small horse’ will be is lost. To overcome all the problems mentioned,we replaced simply each [I], [U] and [Y] everywhere by respectively [e], [o] and [ø],not only when they appear before [r], [ö] or [@], but in all other contexts as well.On the one hand, in the IPA quadrilateral the substitutes are very close to thesubstituted vowels. On the other hand, some contrasts are lost. However, weprefer the loss of these contrasts to retaining contrasts that only reflect notationdifferences and no real differences in pronunciation.
9.1.4.2 Nasal + nasal
In volume 12 of the RND, we found that bloemen ‘flowers’ (sentence 2) was notedas [blo:m;] by Entjes (dialect of Laren), and as [blumn
"] by Hol (Spankeren).
Stenen ‘stones’ (sentence 25) was noted as [ste:n;] by Entjes (Groenlo), and as[ste;nn
"] by Hol (Spankeren). Brengen ‘bring’ (sentence 39) is noted as [brEN;] by
Entjes (Laren), and as [brENn"] by Hol (Spankeren). The examples show that tran-
scribers do not note the Dutch ending en as pronounced in Low Saxon dialectsin the same way. We found similar variation between and even within transcrip-tions of Flemish dialects. Although it is conceivable that some of the differenttranscriptions represent genuine pronunciation differences (and our proceduresare equipped to deal with this), we preferred again to err on the side of caution.

9.1. DATA SOURCE 225
In the introduction of volume 12, Entjes mentioned that he transcribed theword kunnen ‘can’ as [kYn;], while Hol noted the same pronunciation as [kYnn
"].
Entjes writes that he only heard one longer [n], and not two [n]’s as suggestedby Hol. To make the data as consistent as possible we have to replace eitherthe two-nasal notations by one-nasal notations, or the one-nasal notations bytwo-nasal notations. We prefer to use the two-nasal notations which are alsosuggested by Twilhaar (1990). Considering the one-nasal notations, we foundfor e.g. the Dutch word spannen ‘to put’ (in the context of: put a horse toa cart) the following transcriptions: 1) [spAn] (Nieuw Schoonebeek), 2) [spAn;](Oldemarkt), 3) [spAn:] (Blankenberge), 4) [spAn
":] (Alveringem), and 5) [spAn
"]
(Borger). Replacing the half-long, long and syllabic nasals as in the cases 2),3), 4) and 5) can be done by an automatic procedure. Since the short nasal incase 1) represents probable de-gemination, we would like to let this short [n] alsobe replaced by a two-nasal notation especially to retain the relation with thehalf-long nasal. However, this cannot be done by an automatic procedure. Onlynasals that correspond with the Dutch syllable en should be replaced. But noteach short [n] corresponds with the Dutch syllable en as in case 1), so each short[n] in the data should be checked by hand. Therefore, we made a conversion inthe other direction. We retained the notations where only one nasal is noted.This nasal may be noted as half long, long or syllabic. We replaced the two-nasalnotations [mn], [nn] and [Nn] by respectively [m
"], [n
"] and [N
"] when they are found
at the end of a word. If they are not found at the end of a word but rather arefollowed by a vowel, the substitutions are only made when the second nasal isnoted as half-long, long or syllabic. If they are followed by another consonant,the substitutions are always made since in these contexts the second nasal canhardly be pronounced as non-syllabic. When replacing the two-nasal notationby a one-nasal notation, diacritics of the second nasal are left out. If the secondnasal was respectively an [m], [n] or [n], the same procedure was followed.
9.1.4.3 Plosive + nasal
In volume 12 of the RND, we found that dopen ‘baptize’ (sentence 35) was tran-scribed as [dø:pm
"] by Entjes (Groenlo) and as [dø:pn
"] by Hol. In volume 16
Hebben ‘have’ (sentence 106) was noted as [hEbm"] by A. Sassen (Bellingwolde).
In volume 12 the same word was transcribed as [hEbn"] by Hol (Spankeren). In
volume 12 Entjes noted bakken ‘bake’ (sentence 113) as [bAkN"] (Wilp) while Hol
noted this word as [bAkn"] (Hoenderlo). In part 15 G. van der Woude noted gesla-
gen ‘hit’ (sentence 131) as [slA;gN"] (Kollum). The same author noted this word
also as [slAffl;gn"] (Dokkum).
In our opinion, an [n] after [p], [b], [k] and [g] is an unnatural pronunciation.On the other hand, an [m] after [p] or [b] and a [N] after [k] or [g] may bepronounced easily. Therefore, we replaced [pn] by [pm
"], [bn] by [bm
"], [kn] by [kN
"]
and [gn] by [gN"] if the combinations were found at the end of a word. If they were

226 CHAPTER 9. MEASURING DUTCH DIALECT DISTANCES
not found at the end of a word and followed by a vowel, the substitutions areonly made when the nasal is noted as half-long, long of syllabic. If the nasal wasfollowed by another consonant, the substitutions are always made since in thesecontexts the second nasal can hardly be pronounced as non-syllabic. Existingdiacritics of either the plosive or the nasal are not changed.
9.1.4.4 Voiceless palatal plosive
In the feature table of Hoppenbrouwers and Hoppenbrouwers (2001, p. 40) the[c], [tj] and [tj] get the same definition. The [c] is only found in volume 16. Wefollow Hoppenbrouwers and Hoppenbrouwers by changing all [tj]’s and [tj]’s in[c]’s. For the [tj] the substitution is made regardless of whether the [t] or [j] orboth are noted as extra-short.
9.1.4.5 Voiceless velar fricative
In the phonetic overview in volume 16 A. Sassen explicitely mentioned the [gˆ]
(RND notation) as a voiceless fricative. As a sample word Sassen gives the Dutchword wasgoed ‘wash’. We processed this simply as the IPA [x].
9.2 Distances
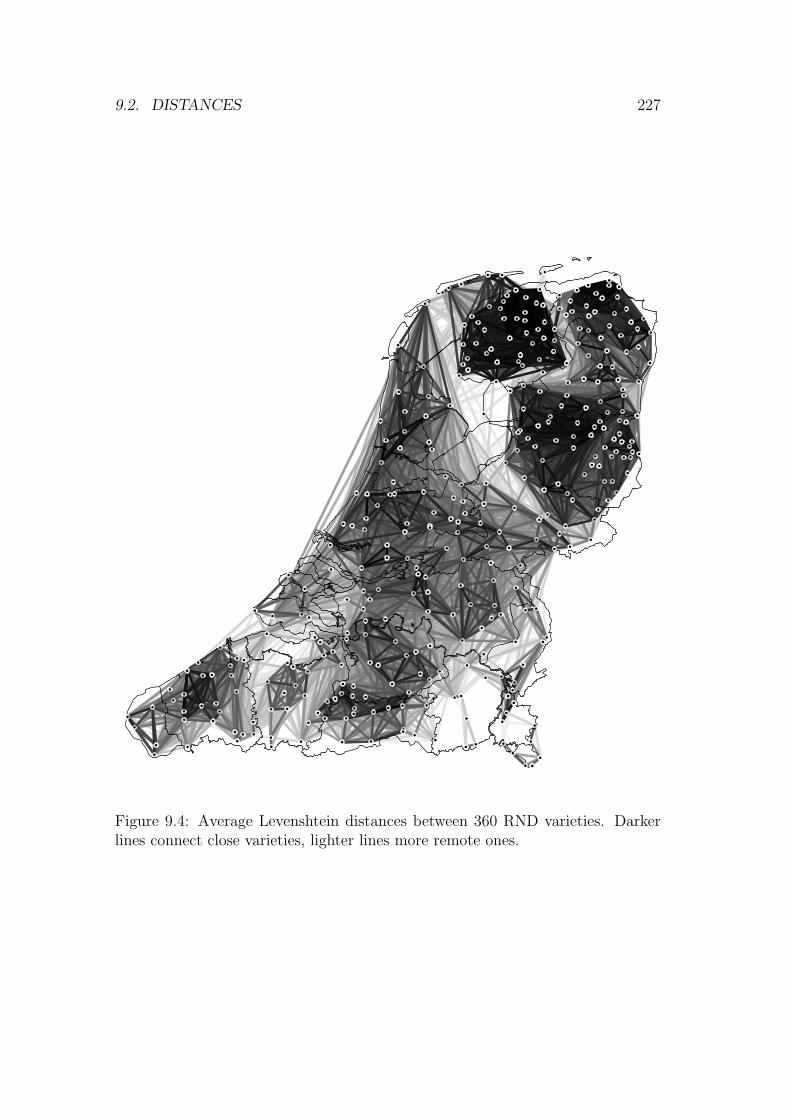
Using the Levenshtein distance, we find the distance between two pronunciationsof the same word. The distance between two varieties is equal to the averageof a series of Levenshtein distances computed from a series of word pairs. For360 varieties, the average Levenshtein distance is calculated for each possiblepair of varieties. The result is a 360 × 360 matrix. In Figure 9.4, the distancesare geographically visualized. Strongly related varieties are connected by darkerlines, while more distant varieties are connected by lighter ones. Where no linesare seen, the varieties are actually connected by white lines, indicating largedistances.
In the picture, the strong relationships between the ‘pure’ Frisian varieties(Northwest) are clearly shown. When examining the picture, we should be awareof the fact that lighter lines, which represent the weaker relations between Frisianand town Frisian, are covered by the darker lines. Also the Groningen dialects(east of Frisian) form a group. Especially the most northern Groningen varietiesare as close to each other as the Frisian varieties are. South of Groningen inDrenthe another small but close group is found. South of this group a largegroup is found in Overijssel. Especially the northern varieties are close. Southof this group a sharp boundary is found, known as the boundary between LowSaxon (northeastern dialects) and Low Franconian (western, southwestern andsouthern dialects). In the rest of the map groups can also be found, although theyare less distinct. However, when looking at the map from some distance, they
9.2. DISTANCES 227
Figure 9.4: Average Levenshtein distances between 360 RND varieties. Darkerlines connect close varieties, lighter lines more remote ones.

228 CHAPTER 9. MEASURING DUTCH DIALECT DISTANCES
can be found. In the southwest, we find a French and West Flemish group. In thecenter of this area a group of strongly related dialects can be found. East of thisarea we find an East Flemish group, although the varieties are not so close. Thesame applies for the Zeeland varieties north of the East Flemish varieties. Theyare not close but emerge as a group since distances to other dialects are large,resulting in a lighter stroke around this set of varieties. East of the East Flemishgroup, we find an Antwerpen group (north) and a Brabant group (south). Thetwo groups are connected in the East. East of these two groups, a lot of whitearea is seen, indicating the large distances that exist among the Limburg dialects.In the Dutch part of the Limburg area a small core area is found, where varietiesare rather close. In the remaining part of the Dutch language area, it is hardto recognize groups on the basis of this map alone. Therefore, cluster analysisis described in Section 9.3. The result is an obvious division into groups. Thisdivision is compared to the division as shown in Daan’s map.
Some borders suggested by the picture may not be real dialect borders. Whenlooking at Figure 9.3, the border between Frisian and Groningen varieties, Frisianand Overijssel varieties and between Groningen and Overijssel varieties coincidewith transcriber borders. This may be accidental, but we will keep track of it inthe sections below.
9.3 Classification
9.3.1 Cluster analysis
On the basis of the distances between the 360 RND varieties we perform clusteranalysis (see Section 6.1). The result is a large dendrogram in which all varietiesare hierarchically ordered. In Figure 9.5 the dendrogram is displayed, showingonly the 13 most significant groups. The scale distance shows percentages. Theway in which percentages are found is described in the Sections 5.1.8 and 5.1.10.In the map in Figure 9.6, the 13 groups in Figure 9.5 are visualized by differentcolors. The colors are chosen by hand and inspired by the dialect map of Daan.When neighboring points belong to different groups, the exact border betweenthe points is found on the basis of triangulation (see Section 6.1.5). To keepthe picture simple, the dots and labels are given only for a restricted set of (ingeneral) better-known locations. In the map, diamonds with and without labelscan also be found. A diamond represents a language island, i.e. a variety whichis only spoken in the location itself, and not in the area around the location.
We choose 13 groups since most of them correspond neatly with the groupswhich we found in the map in Figure 9.4. Some groups were not found in Fig-ure 9.4. The Frisian mixed varieties were not found since they are geographicallyspread among the Frisian varieties. The Southwest Limburg group and the North-east Luik group were not found since they consist of only a few dialects and are

9.3. CLASSIFICATION 229
FrisianFrisian mixed varieties
GroningenOverijssel
Southwest LimburgBrabant
Central Dutch varietiesUrk
East FlandersWest Flanders
ZeelandLimburg
Northeast Luik
0 10 20 30 40
Figure 9.5: Dendrogram derived from the 360 × 360 matrix of Levenshtein dis-tances showing the clustering of groups of Dutch dialects. UPGMA clustering isused (see Section 6.1.2). The scale distance shows percentages. Each of the 13most significant groups is summed in one label and geographically visualized inFigure 9.6. The tree structure explains 70% of the variance.
considered a heterogenous area. Urk was not found as a ‘group’ since it consistsof only one dialect. However, all of these groups are more significant than someother groups that were clearly found in Figure 9.4, e.g. the Zeeland group andthe West Flanders group. When choosing more than 13 groups, we get groupsthat are not clearly recognized as groups in Figure 9.4 or groups with only a few,or even one dialect. Therefore, the number of groups in the main division wasrestricted to 13. In Section 9.4 each of the groups is discussed in more detail.
When considering the four main groups in the dendrogram in Figure 9.5,we get respectively Frisian (Frisian and Frisian mixed varieties), Low Saxon(Groningen and Overijssel), Low Franconian (Southwest Limburg . . . Zeeland)and Limburg varieties (Limburg and Northeast Luik). A difference between ourdivision and the division of Hoppenbrouwers and Hoppenbrouwers (2001, p. 58)is that we find Frisian to be most distant from the central Dutch varieties, whilein the division of Hoppenbrouwers and Hoppenbrouwers the Frisian varieties aremore closely related to the dialects in Noord-Holland, Zuid-Holland and Brabant.This difference confirms our leading hypothesis that regarding words as linguisticunits and considering the structure of a word is important. These two aspectsare not processed in the methodology of Hoppenbrouwers and Hoppenbrouwers.Similar to the main division of (Hoppenbrouwers and Hoppenbrouwers, 2001,p. 58) we find that the Limburg varieties do not belong to the Low Franconianvarieties, but form a separate group.

230 CHAPTER 9. MEASURING DUTCH DIALECT DISTANCES
9.3.2 Area map
When comparing the map in Figure 9.6 with Daan’s map in Figure 9.2, we foundsimilarities and differences. Our Frisian group corresponds perfectly to group27 in the map of Daan. Our group of Frisian mixed varieties includes group 28in Daan’s map, but also the northern part of group 22. Daan’s group 27 con-tains town Frisian varieties (most diamonds on our map), Ameland island (theisland north of Leeuwarden) and the dialect of het Bildt (the area northwest ofLeeuwarden). Group 22 contains the Stellingwerf varieties (on our map northeastof Steenwijk and southwest of Assen). It is striking that Daan’s group 27 and apart of group 22 are one group on our map. Possibly the speakers of the Stelling-werf area in Daan’s study did not consider the town Frisian language islands,but focused mainly on the sharp contrast between the Stellingwerf continuumand the Frisian continuum in their judgments.
In three locations in the Frisian continuum, and in one variety in the Stelling-werf continuum, two varieties are spoken. In Tjalleberd (the higher diamondsouth of Grouw), a Tjalleberd variety and a Frisian variety are spoken. Thelighter blue color in the diamond represents the Tjalleberd dialect island, andthe darker blue around the diamond the Frisian variety. In Donkerbroek (thelighter blue diamond east of Grouw and west of Assen) both a Frisian and aStellingwerf variety is spoken. The lighter blue color in the diamond representsthe Stellingwerf dialect island and the darker blue color around the diamondthe Frisian variety. In Appelscha (the darker blue diamond southwest of Assen)the same two varieties as in Donkerbroek are spoken. The darker blue color inthe diamond represents the Frisian language island, the lighter blue color aroundthe diamond the Stellingwerf variety. The three locations are discussed in moredetail in the sections below.
The Groningen group corresponds with the groups 25, 26 and 24 of Daan’smap. However, the south border on our map is found more southerly, probablyas the result of transcriber differences (see Figure 9.3). The Overijssel group cor-responds with the groups 23, 19, 20 and 21 of the map of Daan. The south borderis the border between the Low Saxon area (north) and the Low Franconian area(south). The border does not coincide with the border between group 19 (north)and groups 18 and 13 (south) in Daan’s map. The difference may be explainedby transcriber differences that influenced our results. In Daan’s map both theGroningen group and the Overijssel group are divided into smaller groups. Inour results, a closer division is not found when regarding only the 13 most signi-ficant groups. Daan and Blok (1969, p. 28) writes that when dialect differencesare small, misgivings may be justified as to whether non-linguistic criteria hadgreater influence than linguistic-criteria. For example differences in social andeconomic structure may influence the awareness of the speakers. Furthermore,we suppose that borders in heterogeneous areas may represent larger differencesthan in homogeneous areas. Our method does not reckon with non-linguistic

9.3. CLASSIFICATION 231
Den Burg
SchiermonnikoogOosterend
Leeuwarden
Grouw
Groningen
Heerhugowaard
Haarlem
Delft
StaverenSteenwijk
Urk
Hattem
Amersfoort
Assen
Emmen
Itterbeck
Lochem
Brugge
Veurne
Middelburg
Gent
Vianen
Zevenbergen
Kalmthout
Mechelen
Groesbeek
Helmond
Venlo
Overpelt
Roeselare
SteenbeekGeraardsbergen Tienen
Kerkrade
Aubel
FrisianFrisian mixed varietiesGroningenOverijsselSouthwest LimburgBrabantCentral Dutch varietiesUrkEast FlandersWest FlandersZeelandLimburgNortheast Luik
Figure 9.6: The 13 most significant groups as given in the dendrogram in Fig-ure 9.5. UPGMA clustering is used (see Section 6.1.2). Diamonds representlanguage islands. Colors are chosen by hand and inspired by the dialect map ofDaan.

232 CHAPTER 9. MEASURING DUTCH DIALECT DISTANCES
factors on the one hand, and the degree of homogeneity on the other hand. Thismay explain why groups on our map are divided into several groups in Daan’smap.
Our group of Central Dutch varieties corresponds with the groups 18, 6, 5,2, 3, 4, 1, 13 and 14 in the map of Daan. The greater part of the south bordercorresponds rather well with the border in the map of Daan between the groups1 and 14 (north) and the groups 7, 15 and 17 (south). Differences can be ex-plained by transcriber differences. However, the northern part of the provinceof Limburg (the part north of Venlo and south of Groesbeek) is a part of group14 in Daan’s map, while it belongs to the Limburg group on our map. In themap of Te Winkel (1901) this area is separated from both group 14 and from theour Limburg group, while it is extended more to the north. We will discuss thisin more detail in Section 9.4.12. Just as our Groningen and Overijssel group,the group of Central Dutch varieties is divided into a large number of groupsin Daan’s map. We mentioned some possible causes in the previous paragraph.However, for our Limburg group we found the opposite. Group 17 in the map ofDaan divides into a southwest Limburg group, a Limburg group and a NortheastLuik group on our map. The fact that the borders did not exist in the aware-ness of the speakers may be explained by the fact that the Limburg area is avery heterogeneous area (Hoppenbrouwers and Hoppenbrouwers, 2001, p. 187).In an area with great dialect variation, it is more difficult to recognize groups(compare the Limburg area in the map in Figure 9.4). It is striking that thevarieties of Steenbergen (the darker red diamond southwesterly of Zevenbergen)and Helmond were found among the Limburg dialects. Their relation with theLimburg varieties is discussed in Section 9.4.12.
Examining the remaining groups, we see that our Brabant group correspondswith groups 15 and 12 in Daan’s map, our East Flanders group corresponds withgroup 11 of the map of Daan, our West Flanders group corresponds with groups10 and 9 in Daan’s map, and our Zeeland group corresponds with group 7 inthe map of Daan. The border between the group of central Dutch varieties andthe Brabant group is similar to the border between group 14 (north) and group15 (south) in Daan’s map, but is also influenced by transcriber differences. Astriking difference between our map and the map of Daan is that the northeastpart of group 11 forms a part of our Brabant group, and not a part of theEast Flanders groups as may be expected on the basis of Daan’s map. This isdiscussed in Section 9.4.6. Furthermore, the groups 12 and 11 form one groupon our map as well as the groups 10 and 9. When examining these differences,we should be aware of the fact that the Belgian part of Daan’s map is not basedon the arrow method, but on information of language geographers who oftenbelonged to dialect-speaking groups themselves. However, we did not know theexact criteria that were used by the language geographers, and the weightingsof the criteria. Although the groups 12 and 10 can be found as separate groupson a deeper level (see Sections 9.4.9 and 9.4.10), their significance is not strong

9.3. CLASSIFICATION 233
enough for them to be recognized as groups in the map of Figure 9.4 or foundamong the 13 most significant groups.
Among the 13 groups, the dialect of Urk is also found as a separate group. InDaan’s map, this dialect belongs to group 19. Possibly the dialect of Urk is mostlike the dialect of group 19, so speakers judge the dialect of Urk as nearly the sameas the dialect of group 19, although strong differences may exist. In our results,Urk is closest to the group of central Dutch varieties, but nonetheless appears asone of the 13 most significant groups. For more details see Section 9.4.8.
9.3.3 Composite cluster map
On the basis of the dendrogram in Figure 9.5 (including the subtrees of the maingroups) we create a composite cluster map. The map is shown in Figure 9.7.In this map the borders between the most significant groups are darker blue,blue and green. These borders can also be found in Figure 9.4 more or less, anddistinguish the areas as shown in Figure 9.6. Less significant borders are lightergreen, greenish yellow, yellow and lighter yellow. The least significant borders arewhite. The benefit of this picture compared to Figure 9.6 is that it shows boththe main groups and further classifications per group. To keep a clear picture,dialect islands which belong to the Frisian mixed varieties, and the dialect islandsSteenbergen and Helmond are excluded. The dialect of Urk belongs to one of the13 main groups. However, no borders are drawn around this variety since thisformer island is isolated by an area in which only Standard Dutch was spoken.
Examining the 13 main groups, we find that the Frisian group appears as anhomogeneous area. Only the dialect of Hindeloopen (southwest) appears to berather deviant from the other varieties of this group. Frisian mixed varieties arespoken on the Ameland island (north of the mainland), in het Bildt (northweston the mainland) and in the Stellingwerf area (along the southeast provinceborder). The Groningen group is divided in a northern and a southern part. Theborder partly coincides with the province border between Groningen (north) andDrenthe (south). The Overijssel group is divided in a western and an easternpart. The western part appears to be very homogeneous. The eastern part isless homogeneous. On the border between the western and the eastern part, thedialect of Vriezenveen appears as a dialect island. This variety is discussed furtherin Section 9.4.4. In the map it can be seen that the large group of Central Dutchvarieties is divided in a western and a southeastern part. The Limburg areais divided a Limburg group, a southwest Limburg group and a southeast Luikgroup. The southeast Luik group is divided in a western and a eastern group.The division in these two groups reflects the Benratherlinie (see Section 9.4.13).In the Brabant group we find in the furthest Southeast a small but rather deviantgroup. In this group we find a west/east division. In the two western varieties(Diest in the north and Tienen in the south) the uvular [ö] is used, just as inthe varieties of the Limburg group and the Northeast Luik group. This may

234 CHAPTER 9. MEASURING DUTCH DIALECT DISTANCES
Frisian1Frisian mixed varieties2Groningen3Overijssel4Southwest Limburg5Brabant6Central Dutch varieties7Urk8East Flanders9West Flanders10Zeeland11Limburg12Northeast Luik13
7
7
2 11
2
13
8
4
2
11
9
7
6
12
105
13
Figure 9.7: Composite cluster map on the basis of the dendrogram in Figure 9.5.UPGMA clustering is used (see Section 6.1.2). The most significant bordersare represented by darker blue, blue and green lines, less signifant borders bylighter green, greenish yellow, yellow and lighter yellow lines. The least significantborders are white. Dialect islands (the diamonds in Figure 9.6) are excluded.

9.4. CLASSIFICATION PER SUBGROUP 235
distinguish them from the other Brabant varieties. In Daan’s map this groupbelongs to the Limburg varieties, and not to the Brabant varieties. However inthe western variety (Velm) the alveolar [r] is used. Examining the Brabant groupfurther we find a rather separate group in the Northwest. This group is discussedin Section 9.4.6. Furthermore we find a division between Anwerpen varieties(north) and Brabant varieties (south). In the center of the East Flanders groupthe dialect of Gent is found as a dialect island. Phonologically the dialect of Gentdiffers strongly from the surrounding varieties. E.g. all vowels in the variety ofGent are longer than in the varieties around this city. In the West Flandersgroup the central part appears to be rather homogeneous. The varieties alongthe eastern province border form a separate group which possibly may be seenas a transition zone between East Flanders and West Flanders. In the furthestSouthwest we find the French Flanders varieties as an separate group. They areseparated from the other varieties of the West Flanders group by a transitionzone. Finally we find some borders in the Zeeland group. However these bordersare not so sharp.
In Section 9.4 the classification of each of the 13 main groups is discussed inmore detail.
9.4 Classification per subgroup
In this section each of the 13 groups as found in the dendrogram in Figure 9.5 anddisplayed in the map in Figure 9.6 is discussed in more detail. In Sections 9.4.1through 9.4.13 a dendrogram will be given per group. From a dendrogram acloser division per group can be derived. The smaller clusters correspond withsmaller areas within the larger area. These areas are displayed in Figure 9.8.The grey diamonds represent varieties that do not actually belong to the groupin which they are geographically found. The white dots represent locations wheretwo varieties are spoken. The one belongs to the local group, the other is a dialectisland that does not belong to the group. When considering this map one shouldbe aware that the significance of the groups is different. However, the main goalof this map is to find the varieties in a cluster of a dendrogram more quickly inthe map. In Sections 9.4.1 through 9.4.13 different parts of the map are shownin more detail.
9.4.1 Frisian
In the map of Daan, group 28 represents the ‘pure’ Frisian varieties. This groupis not divided further. However, a closer division is given in Hof’s map (1933,p. 14a). This map is based on isoglosses. Furthermore, a closer division of

236 CHAPTER 9. MEASURING DUTCH DIALECT DISTANCES
Figure 9.8: Closer division of the Dutch language area on the basis clusters asfound within each of the 13 main groups. Provincial borders are represented bythinner lines and dialect cluster borders by thicker ones. The grey diamondsrepresent varieties that do not actually belong to the group in which they aregeographically found. The white dots represent locations where two varieties arespoken. The one belongs to the group, the other is a dialect island that does notbelong to the group.
9.4. CLASSIFICATION PER SUBGROUP 237
mainland-rural Frisian is given by Van der Veen (1984, 1994). Van der Veenobtained his division on the basis of computational processing of isoglosses. Theseisoglosses are based on high-frequency words gathered from different sources (e.g.the RND).
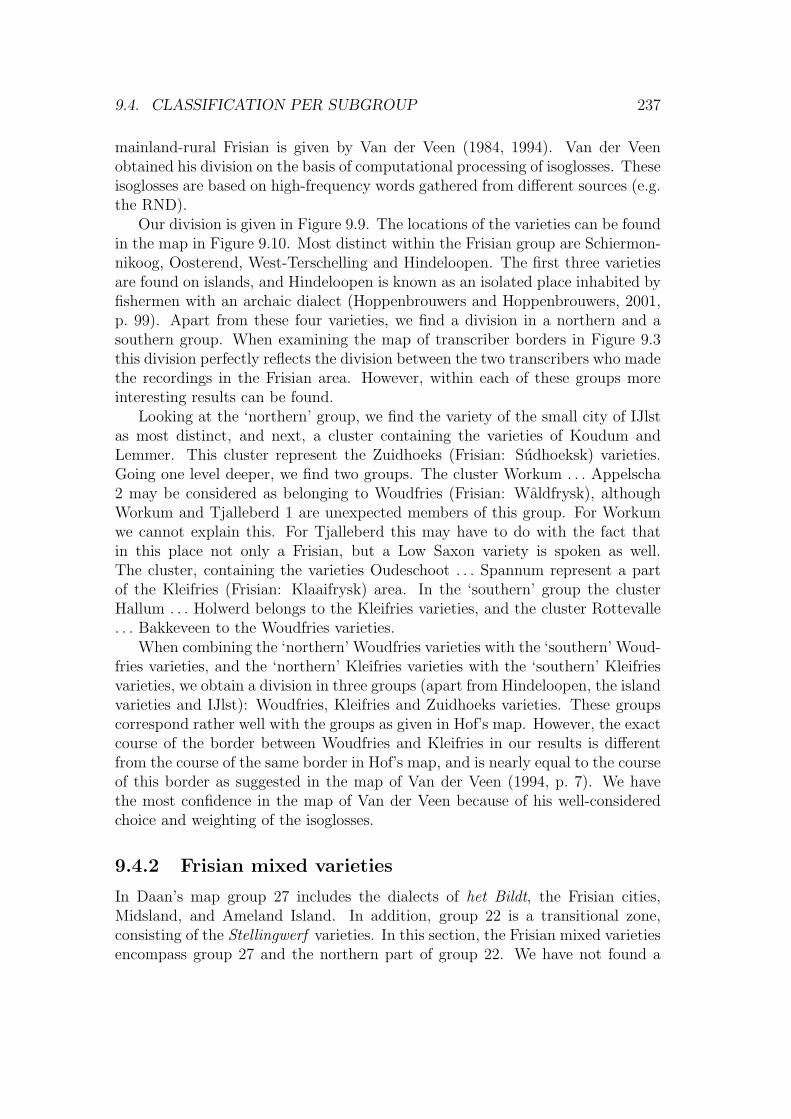
Our division is given in Figure 9.9. The locations of the varieties can be foundin the map in Figure 9.10. Most distinct within the Frisian group are Schiermon-nikoog, Oosterend, West-Terschelling and Hindeloopen. The first three varietiesare found on islands, and Hindeloopen is known as an isolated place inhabited byfishermen with an archaic dialect (Hoppenbrouwers and Hoppenbrouwers, 2001,p. 99). Apart from these four varieties, we find a division in a northern and asouthern group. When examining the map of transcriber borders in Figure 9.3this division perfectly reflects the division between the two transcribers who madethe recordings in the Frisian area. However, within each of these groups moreinteresting results can be found.
Looking at the ‘northern’ group, we find the variety of the small city of IJlstas most distinct, and next, a cluster containing the varieties of Koudum andLemmer. This cluster represent the Zuidhoeks (Frisian: Sudhoeksk) varieties.Going one level deeper, we find two groups. The cluster Workum . . . Appelscha2 may be considered as belonging to Woudfries (Frisian: Waldfrysk), althoughWorkum and Tjalleberd 1 are unexpected members of this group. For Workumwe cannot explain this. For Tjalleberd this may have to do with the fact thatin this place not only a Frisian, but a Low Saxon variety is spoken as well.The cluster, containing the varieties Oudeschoot . . . Spannum represent a partof the Kleifries (Frisian: Klaaifrysk) area. In the ‘southern’ group the clusterHallum . . . Holwerd belongs to the Kleifries varieties, and the cluster Rottevalle. . . Bakkeveen to the Woudfries varieties.
When combining the ‘northern’ Woudfries varieties with the ‘southern’ Woud-fries varieties, and the ‘northern’ Kleifries varieties with the ‘southern’ Kleifriesvarieties, we obtain a division in three groups (apart from Hindeloopen, the islandvarieties and IJlst): Woudfries, Kleifries and Zuidhoeks varieties. These groupscorrespond rather well with the groups as given in Hof’s map. However, the exactcourse of the border between Woudfries and Kleifries in our results is differentfrom the course of the same border in Hof’s map, and is nearly equal to the courseof this border as suggested in the map of Van der Veen (1994, p. 7). We havethe most confidence in the map of Van der Veen because of his well-consideredchoice and weighting of the isoglosses.
9.4.2 Frisian mixed varieties
In Daan’s map group 27 includes the dialects of het Bildt, the Frisian cities,Midsland, and Ameland Island. In addition, group 22 is a transitional zone,consisting of the Stellingwerf varieties. In this section, the Frisian mixed varietiesencompass group 27 and the northern part of group 22. We have not found a

238 CHAPTER 9. MEASURING DUTCH DIALECT DISTANCES
SchiermonnikoogOosterend
West-TerschellingIJlst
WorkumTjalleberd 1
Donkerbroek 1Jubbega
BeetsUreterp
Appelscha 2Oudeschoot
LangweerMakkum
SexbierumSpannum
KoudumLemmer
HallumStiens
FerwerdGrouw
HolwerdRottevalle
VeenwoudenTietjerkBergumOudega
AnjumSurhuisterveen
WestergeestBakkeveen
Hindeloopen
0 10 20 30 40
Figure 9.9: Subtree of the dendrogam in Figure 9.5, representing the Frisiangroup.

9.4. CLASSIFICATION PER SUBGROUP 239
Midsland
West−Terschelling
Oost−Vlieland
Den Burg
Hollum NesSchiermonnikoog
Oosterend
Ferwerd
Holwerd Anjum
Zoutkamp
Sint Annaparochie
Hallum
Stiens
Dokkum
Westergeest KollumGrijpskerk
Sexbierum
Harlingen Franeker
Leeuwarden
TietjerkVeenwouden
BergumSurhuisterveen
Spannum
Grouw
Oudega
RottevalleMarum
Makkum Bolsward
Sneek
IJlst
BeetsBakkeveen
Donkerbroek
Roodeschool
Eenrum
Zijldijk Bierum
Stedum Tjamsweer
Wagenborgen
Niekerk
Groningen
Garmerwolde
Schildwolde
ScheemdaFinsterwolde
PeizeEelde
Hoogezand
ZuidlarenVeendam
Winschoten
Bellingwolde
EextStadskanaal
Onstwedde
Wateringen
Den Oever
SchagenOpperdoes
Heerhugowaard
Enkhuizen
Egmond aan Zee
Hoorn
Heemskerk
De Rijp
Koog aan de Zaan
Volendam
Monnickenwerf
Haarlem
Aalsmeer
Huizen
Warmond
LangeraarNieuwveen
Loenen
Soest
Koudekerk
Utrecht
Delft
Zoetermeer
OudewaterVreeswijk
Driebergen
Workum
HindeloopenLangweer
Tjalleberd
Heerenveen
Oudeschoot
Jubbega
Staveren
Koudum
Lemmer
Noordwolde
Kuinder
Oldemarkt
Steenwijk
VollenhoveKoekange
Urk
Hasselt
Rouveen
Staphorst
IJsselmuidenKampen
Zalk Dalfsen
Oldebroek
Hattem
NunspeetWijhe
Spakenburg Putten
Vaassen
Bathmen
Wilp
Woudenberg
Hoenderlo
DoornVeenendaal
Spankeren
Dieren
Bronkhorst
Appelscha
Assen
Grolloo Borger
Wessingtange
DwingeloOrvelte
OdoornRoswinkel
Ruinen
Emmen
Zuidbarge
Zwinderen
Schoonebeek
Dedemsvaart
Coevorden
EmlichheimHoogstede
Nieuw Schoonebeek
Bergentheim
Radewijk
Itterbeck
Wilsum
Lemele Langeveen
Vasse
UelsenNeuenhaus
Lage
Lattrop Nordhorn
Almelo
TubbergenOotmarsum Tilligte
Delden Hengelo
Oldenzaal
Laren Usselo
Eibergen
Haaksbergen
Zelhem
Groenlo
Blankenberge
Damme
Middelkerke
OostendeBrugge
Gistel Bekegem Oostkamp
Veurne
Oostkerke
Alveringem
Wingene
Brielle
Middelharnis
Renesse
Zierikzee
Steenbergen
WestkapelleGoes
MiddelburgKapelle
Breskens
Lamswaarde
Groenendijk
Ossendrecht
Zandvliet
ClingeKieldrecht
MoerkerkeAssenede
Zelzate
Moerbeke
Beveren
Zomergem
LochristiHingene
GentKalken
Lebbeke
Lippelo
Buggenhout
BerkelPolsbroek
Vianen
LekkerkerkDeil
Klaaswaal
Papendrecht Hardinxveld
Almkerk
DussenDrongelen
FijnaartZevenbergen
Oudenbosch
Dongen Loon op Zand
RoosendaalGoirle
Oirschot
EssenZundert
Kalmthout
Rijkevorsel
Zevendonk
Gierle
Arendonk
WijnegemOelegem
Balen
Boom Itegem
Geel
Meerhout
Thisselt
Mechelen
Herselt
Zolder
Wijk bij Duurstede Renkum
Zevenaar
Doetinchem
DrutenOosterhout ’s−Herenberg
HeerewaardenRavenstein
Groesbeek
Den Dungen
Zeeland
Rijkevoort
Sint Oedenrode Gemert
Bakel
VenrayWanssum
Helmond
Geldrop
Riethoven MeijelTegelen
Venlo
Budel
Overpelt Horn
Bree Kinrooi
Echt
Houthalen Born
Susteren
Aalten
Ulft
Warhem
Reninge
HouthulstGits
Roeselare
Woesten Moorslede
Hondegem
Kortrijk
Bellegem
Steenbeek
Nieuwkerke
Nazareth Bottelare
Aalst
Waregem Heldergem Hekelgem Wemmel
Zwevegem
Ingooigem
Nukerke
Geraardsbergen Lot
Ronse
Humbeek
Grimbergen
Kampenhout
AarschotWerchter Diest
Boutersem
Overijse
VertrijkTienen
Velm
Beek
Sittard
DiepenbeekMeerssen
Kerkrade
Vreren ’s−GravenvoerenVaals
Lauw
Aubel
Raeren
Baelen Eupen
Kapelle−Broek
Bollezeele
Figure 9.10: The northwestern part of the Dutch language area. Province bordersare represented by thinner lines and dialect cluster borders by thicker ones. Thegrey diamonds represent varieties that do not actually belong to the group inwhich they are found geographically. The white dots represent locations wheretwo varieties are spoken. The one belongs to the local group, the other is a dialectisland which does not belong to this group.

240 CHAPTER 9. MEASURING DUTCH DIALECT DISTANCES
FranekerSneek
LeeuwardenKollum
NesHollum
Sint AnnaparochieBolswardHarlingenStaverenDokkum
HeerenveenMidsland
Donkerbroek 2NoordwoldeAppelscha 1Tjalleberd 2
Figure 9.11: Subtree of the dendrogram in Figure 9.5, representing the Frisianmixed varieties group. The group contains town Frisian varieties and the Stelling-werf varieties. The dialect of het Bildt (represented by Sint Annaparochie) isfound among the town Frisian varieties.
detailed discussion on the division of the groups 27 and 22 in the literature yet.In Daan’s map, group 25 is also a transitional area, known as the Westerkwartier.This area is discussed in Section 9.4.3.
In Figure 9.11, a dendrogram is given that shows the division of the Frisianmixed varieties. The locations of the varieties can be found on the map in Fig-ure 9.10. The dendrogram gives a clear division between het Bildt and townFrisian varieties on the one hand (cluster Franeker . . . Midsland), and the Stelling-werf varieties on the other hand (cluster Donkerbroek 2 . . . Tjalleberd 2).
Considering the cluster Franeker . . . Midsland, and ignoring Midsland weagain find a northern and a southern group. Unfortunately, the border betweenthese two groups represents the transcriber border (see Figure 9.3). Nonetheless,some conclusions can be drawn. First, the variety of Kollum clearly belongs tothe town Frisian varieties, although it is found at the border of the Low Saxonarea Kollumerlands (group 25) in Daan’s map. The same finding was also foundby Hoppenbrouwers and Hoppenbrouwers (2001, p. 96). Furthermore, the dialectof Sint Annaparochie (representing the dialects of het Bildt) does not appear asan outlier. Therefore, it is correct that in the map of Daan the dialect of hetBildt is considered as a town Frisian dialect. While the town Frisian varietiesoriginated in making Frisian more Dutch, the dialect of het Bildt originated inmaking Dutch more Frisian. Our division suggested that these developmentsresulted in similar varieties.
Looking at the cluster Donkerbroek 2 . . . Tjalleberd 2, we found that the LowSaxon variety of Tjalleberd is clustered with the Stellingwerf varieties, although

9.4. CLASSIFICATION PER SUBGROUP 241
it appears as the most deviant variety within this group. On the map of Daan, theStellingwerf area is colored green, suggesting that this area belongs to the LowSaxon varieties. However, in our results the Stellingwerf varieties of Donkerbroek,Noordwolde and Appelscha are not found among the Low Saxon varieties. Theyform a cluster (together with Tjalleberd) which is clustered with the cluster of thedialects of the Frisian cities (and other related dialects). Hoppenbrouwers andHoppenbrouwers (2001) who obtained a similar classification, cited Sassen (1953,p. 305) who described the Stellingwerf dialect as a Drenthe dialect which becamemore like Frisian. On the other hand, we found some other Stellingwerf varietiesclustered among the Low Saxon varieties (see Sections 9.4.3 and 9.4.4). Thefact that the Stellingwerf varieties in our data set are found among both Frisianand Low Saxon varieties may partly be explained by transcriber differences, andmeanwhile the question cannot be answered whether Stellingwerf varieties aremore related to Frisian than to Low Saxon, or the other way round.
9.4.3 Groningen
We labeled the group in this section as Groningen varieties since the greater partis found in this province of Groningen. However, the northern part of Drenthealso belongs to this group. The group encloses the groups 25, 26, 24 and a smallnorthern part of group 23 of Daan’s map. In the map of Reker (1993, p. x) theprovince of Groningen is divided in West-Groningen, North-Groningen, Oldambt,Westerwolde, Veenkolonien, and the city of Groningen. The map is based onisoglosses. A map of Heeroma (1963) suggests that the varieties in the northernpart of Drenthe are more related to the Groningen varieties than to the varietiesin the southern part of Drenthe. In Daan’s map Groningen and northern Drentheare clearly one group.
The division of the Groningen and northern Drenthe varieties is given in Fig-ure 9.12. The location of the varieties can be found on the map in Figure 9.13. Atthe highest level in the dendrogram we find two groups. The cluster Marum . . .Zoutkamp represents the Westerkwartier varieties, found as group 25 (Kollumer-lands) on the map of Daan, and as the West-Groningen group in the map ofReker (1993). Going one level deeper, we get a division into Groningen dialectson the one hand (cluster Niekerk . . . Groningen), and dialects mainly found in thenorthern part of Drenthe on the other hand (cluster Onstwedde . . . Dwingelo).According to the map of Daan, the dialect of Zoutkamp should not belong to theWesterkwartier cluster, but to the cluster of Groningen varieties. The fact thatthis variety is classified with the Westerkwartier varieties in our results may beexplained by the fact that Zoutkamp is a borderline case on the one hand, andtranscribed by the same transcriber as the other ‘real’ Westerkwartier varietieson the other hand.
Examining the Groningen dialects, the cluster Niekerk . . . Adorp representsa northern group. This cluster corresponds with the North-Groningen group in

242 CHAPTER 9. MEASURING DUTCH DIALECT DISTANCES
MarumGrijpskerkZoutkamp
NiekerkZuidhorn
OldehoveSchildwolde
WagenborgenTjamsweer
ZijldijkStedumBierum
WarffumEenrum
MiddelstumRoodeschoolGarmerwolde
AdorpFinsterwolde
ScheemdaStadskanaalBellingwoldeWinschoten
VeendamHoogezandGroningen
OnstweddeWessingtange
RoswinkelZuidlaren
PeizeEeldeNorgEext
AssenBorgerGrollooOdoornOrvelteBeilen
Dwingelo
Figure 9.12: Subtree of the dendrogram in Figure 9.5, representing the Gronin-gen group. The group contains varieties in Groningen and the northern part ofDrenthe.
9.4. CLASSIFICATION PER SUBGROUP 243
Midsland
West−Terschelling
Oost−Vlieland
Den Burg
Hollum NesSchiermonnikoog
Oosterend
Ferwerd
Holwerd Anjum
Zoutkamp
Sint Annaparochie
Hallum
StiensKollum
Grijpskerk
Sexbierum
Harlingen Franeker
Leeuwarden
Tietjerk
Surhuisterveen
Spannum
Grouw
OudegaMarum
Makkum Bolsward
Sneek
IJlst
BeetsBakkeveen
Donkerbroek
Roodeschool
Eenrum
Warffum
Middelstum
Zijldijk Bierum
OldehoveAdorp
Stedum Tjamsweer
Wagenborgen
ZuidhornNiekerk
Groningen
Garmerwolde
Schildwolde
ScheemdaFinsterwolde
PeizeEelde
Hoogezand
ZuidlarenVeendam
Winschoten
Bellingwolde
Norg
EextStadskanaal
Onstwedde
Wateringen
Den Oever
SchagenOpperdoes
Heerhugowaard
Enkhuizen
Egmond aan Zee
Hoorn
Heemskerk
De Rijp
Koog aan de Zaan
Volendam
Monnickenwerf
Haarlem
Aalsmeer
Huizen
Katwijk aan Zee Warmond
LangeraarNieuwveen
Loenen
Soest
Koudekerk
Utrecht
Delft
Zoetermeer
OudewaterVreeswijk
Driebergen
Workum
HindeloopenLangweer
Tjalleberd
HeerenveenJubbega
Staveren
Koudum
Lemmer
Noordwolde
Kuinder Steenwijk
VollenhoveKoekange
Urk
Hasselt
Rouveen
Staphorst
IJsselmuidenKampen
Zalk Dalfsen
Oldebroek
Hattem
NunspeetWijhe
Spakenburg Putten
Vaassen
Bathmen
Wilp
Amersfoort
Woudenberg
Barneveld
Hoenderlo
DoornVeenendaal
Spankeren
Dieren
Bronkhorst
Appelscha
Assen
Grolloo Borger
Wessingtange
Dwingelo
BeilenOrvelte
OdoornRoswinkel
Ruinen
Emmen
Zuidbarge
Hollandscheveld
Zwinderen
Schoonebeek
Dedemsvaart Gramsbergen
Coevorden
EmlichheimHoogstede
Nieuw Schoonebeek
Ommen
Hardenberg
Bergentheim
Radewijk
Itterbeck
Wilsum
Lemele Langeveen
Vasse
UelsenNeuenhaus
Lage
Lattrop NordhornVriezenveen
WierdenAlmelo
TubbergenOotmarsum Tilligte
Rijssen
Delden Hengelo
Oldenzaal
Laren Usselo
Lochem
Eibergen
Haaksbergen
Zelhem
Groenlo
Blankenberge
Damme
Middelkerke
OostendeBrugge
Gistel Bekegem Oostkamp
Veurne
Oostkerke
Alveringem
Wingene
Brielle
Middelharnis
Renesse
Zierikzee
Steenbergen
WestkapelleGoes
MiddelburgKapelle
Breskens
Lamswaarde
Groenendijk
Ossendrecht
Zandvliet
ClingeKieldrecht
MoerkerkeAssenede
Zelzate
Moerbeke
Beveren
Zomergem
LochristiHingene
GentKalken
Lebbeke
Lippelo
Buggenhout
BerkelPolsbroek
Vianen
LekkerkerkDeil
Klaaswaal
Papendrecht Hardinxveld
Almkerk
DussenDrongelen
FijnaartZevenbergen
Oudenbosch
Dongen Loon op Zand
RoosendaalGoirle
Oirschot
EssenZundert
Kalmthout
Rijkevorsel
Zevendonk
Gierle
Arendonk
WijnegemOelegem
Balen
Boom Itegem
Geel
Meerhout
Thisselt
Mechelen
Herselt
Zolder
Wijk bij Duurstede Renkum
Zevenaar
Doetinchem
DrutenOosterhout ’s−Herenberg
HeerewaardenRavenstein
Groesbeek
Den Dungen
Zeeland
Rijkevoort
Sint Oedenrode Gemert
Bakel
VenrayWanssum
Helmond
Geldrop
Riethoven MeijelTegelen
Venlo
Budel
Overpelt Horn
Bree Kinrooi
Echt
Houthalen Born
Susteren
Aalten
Ulft
Warhem
Reninge
HouthulstGits
Roeselare
Woesten Moorslede
Hondegem
Kortrijk
Bellegem
Steenbeek
Nieuwkerke
Nazareth Bottelare
Aalst
Waregem Heldergem Hekelgem Wemmel
Zwevegem
Ingooigem
Nukerke
Geraardsbergen Lot
Ronse
Humbeek
Grimbergen
Kampenhout
AarschotWerchter Diest
Boutersem
Overijse
VertrijkTienen
Velm
Beek
Sittard
DiepenbeekMeerssen
Kerkrade
Vreren ’s−GravenvoerenVaals
Lauw
Aubel
Raeren
Baelen Eupen
Kapelle−Broek
Bollezeele
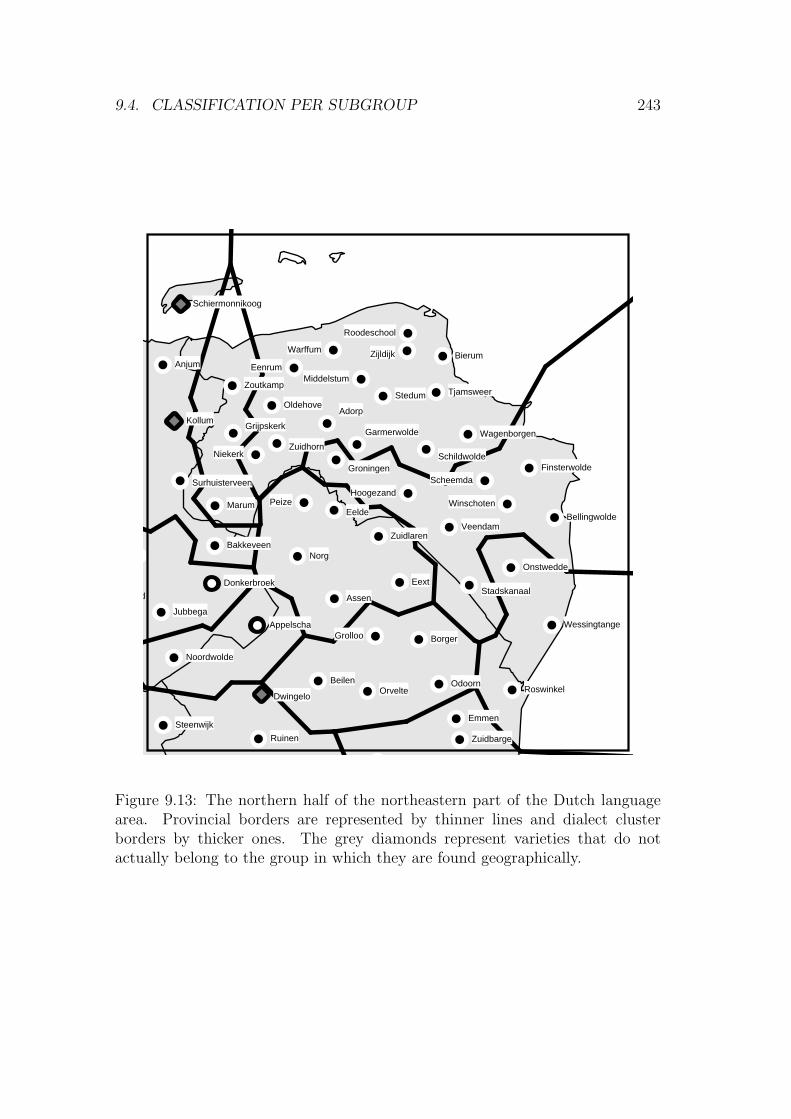
Figure 9.13: The northern half of the northeastern part of the Dutch languagearea. Provincial borders are represented by thinner lines and dialect clusterborders by thicker ones. The grey diamonds represent varieties that do notactually belong to the group in which they are found geographically.

244 CHAPTER 9. MEASURING DUTCH DIALECT DISTANCES
the map of Reker. However, the cluster also encloses the northern part of theOldambt area as given in the map of Reker. The cluster Finsterwolde . . . Gronin-gen represents an eastern group. The cluster corresponds with the Oldambt,the Veenkolonien and the city of Groningen. A clear division between Oldambtand the Veenkolonien is not reflected by this cluster. The dialect of the city ofGroningen is most distinct in this cluster.
Looking at the other cluster that contains mostly varieties in Drenthe, wefind that Dwingelo is not clustered with any of the other varieties in this group.In the map of Daan, this dialect belongs to the Stellingwerf varieties (group22). Unfortunately, Dwingelo was not found in the Stellingwerf group in thedendrogram in Figure 9.11. The map in Figure 9.3 makes it clear that tran-scriber differences caused this separation. Going one level deeper we find thatthe cluster Onstwedde . . . Roswinkel corresponds roughly with the Westerwoldearea in the map of Reker. The other cluster contains varieties which are onlyfound in Drenthe. The cluster Zuidlaren . . . Eext is the group that is sugges-ted to be strongly related to the Groningen varieties in the map of Heeromaand which simply belongs to the Groningen group on the map of Daan. Thecluster Borger . . . Beilen corresponds with the northern part of group of southernDrenthe varieties, found as group 23 on the map of Daan. However, the grouphalts exactly at a transcriber border.
Assen is clustered with the northern Drenthe group, although it appears asthe most deviant variety in this cluster. In the map of Daan, it belongs to thecentral Drenthe varieties, mentioned as group 24. However, according to Daan’smap, Grolloo also belongs to this group. In our dendrogram, Grolloo belongsto another cluster, namely the cluster of the southern Drenthe varieties. Thetranscription of Assen as given in the RND suggests that this variety is stronglyinfluenced by Standard Dutch, which may explain why Assen is not too close toany of the other Drenthe varieties. Furthermore, the position of Grolloo doessuggest that this variety fits perfectly in the southern Drenthe group rather thanthat it belongs to another group, namely the central Drenthe group. We foundno explanation for this.
We may conclude that our results partly are in accordance with the map ofReker (1993). However, the border between the North-Groningen varieties andthe Oldambt varieties is found further south in our results. In addition, we foundno clear division between the Oldambt varieties and the Veenkolonien varieties.To explain this difference, we should check whether the isoglosses used by Rekerexist in the RND data. Furthermore, we clearly found a Westerwolde area, aDrenthe group and a southern Drenthe group. The varieties of the central Dutchgroup were either strongly influenced by Standard Dutch (Assen) or classified inthe southern Drenthe group (Grolloo).

9.4. CLASSIFICATION PER SUBGROUP 245
9.4.4 Overijssel
The Overijssel group encloses the southern part of Drenthe, Overijssel and thenorthern part of Gelderland. Since most varieties are found in Overijssel, we labelthe group simply the Overijssel group. The group corresponds with the southernpart of the groups 22 and 23, the northern part of group 19, and with group 20and 21 in Daan’s map.
The dendrogram is given in Figure 9.14. The locations of the varieties aredisplayed in the map in Figure 9.15. In the dendrogram the deviant position ofVriezenveen immediately catches the eye. This agrees with Daan’s map, in whichthe dialect is encircled, indicating that the dialect in this location is in strongcontrast with its surrounding. Vriezenveen is an old settlement. The settlerscame from the western coast area (Holland) (Entjes, 1970, pp. 2–15). The dialecthas Westphalian influences.
Apart from Vriezenveen, we find two main clusters. The cluster Usselo . . .Eibergen contains varieties in Bentheim and Twente while the cluster Nunspeet. . . Bronkhorst contains the varieties around Bentheim and Twente.
The Bentheim/Twente cluster corresponds with group 21 in the map of Daan.In this cluster the cluster Rijssen/Eibergen and the dialect of Wierden are foundto be rather apart from the other varieties in the cluster. The cluster Usselo. . . Emlichheim represents varieties in or very close to German, where especiallythe cluster Langeveen . . . Emlichheim contains varieties in and around Bentheim.Heeringa et al. (2000) report an investigation into the Dutch-German contact inand around Bentheim. The research was performed on the basis of the RNDtranscriptions and transcriptions of new recordings made in 1999. It appearedthat the Dutch dialects shifted more towards Standard Dutch while all Germandialects shifted towards Standard German. Finally the cluster Tubbergen . . .Oldenzaal contains the core Twente varieties.
In the cluster with varieties around Bentheim and Twente, the dialect of Nun-speet, the cluster Vaassen/Bronkhorst and the dialect of Kuinder are found tobe rather distinct. The deviant position of Nunspeet, Vaassen and Bronkhorstmay be explained by the fact that they are found in a transition zone betweenthe Low Saxon area and the Low Franconian area. According to Daan’s map,the dialect of Kuinder belongs to group 22, i.e. the Stellingwerf varieties. There-fore, Kuinder would fit better in the Stellingwerf group in the dendrogram inFigure 9.11. The fact that this is not the case may be explained by transcriberdifferences. Apart from these four special cases, we find a cluster Emmen . . .Nieuw Schoonebeek in the utmost southeast part of Drenthe, and a cluster Lo-chem . . . Kampen containing varieties west of the Bentheim/Twente group. Thesoutheastern Drenthe group partly covers group 23 and partly group 19 in Daan’smap. In the group west of Bentheim/Twente the cluster Lochem . . . Wijhe forma southern cluster partly corresponding with group 20 in the map of Daan, andthe cluster Hattem . . . Kampen form a northern cluster, covering the utmost

246 CHAPTER 9. MEASURING DUTCH DIALECT DISTANCES
NunspeetKuinderLochemGroenloZelhem
LarenBathmen
WilpWijhe
HattemRuinen
HollandscheveldKoekange
LemeleBergentheimHardenberg
OmmenGramsbergen
RadewijkStaphorstRouveen
DedemsvaartZalk
OldemarktSteenwijk
VollenhoveHasselt
IJsselmuidenCoevordenOldebroek
DalfsenKampenEmmen
ZuidbargeZwinderen
SchoonebeekNieuw Schoonebeek
VaassenBronkhorst
UsseloTilligteVasse
LangeveenLattrop
NordhornHoogstede
NeuenhausWilsum
LageUelsen
ItterbeckEmlichheimTubbergen
DeldenAlmelo
HaaksbergenHengelo
OotmarsumOldenzaal
WierdenRijssen
EibergenVriezenveen
Figure 9.14: Subtree of the dendrogram in Figure 9.5, representing the Overijsselgroup. The group contains varieties in the southern part of Drenthe, Overijsseland the northern part of Gelderland.

9.4. CLASSIFICATION PER SUBGROUP 247
Midsland
West−Terschelling
Oost−Vlieland
Den Burg
Hollum NesSchiermonnikoog
Oosterend
Ferwerd
Holwerd Anjum
Zoutkamp
Sint Annaparochie
Hallum
Stiens
Dokkum
Westergeest KollumGrijpskerk
Sexbierum
Harlingen Franeker
Leeuwarden
TietjerkVeenwouden
BergumSurhuisterveen
Spannum
Grouw
Oudega
Rottevalle
Ureterp
Marum
Makkum Bolsward
Sneek
IJlst
BeetsBakkeveen
Donkerbroek
Roodeschool
Eenrum
Warffum
Middelstum
Zijldijk Bierum
OldehoveAdorp
Stedum Tjamsweer
Wagenborgen
ZuidhornNiekerk
Groningen
Garmerwolde
Schildwolde
ScheemdaFinsterwolde
PeizeEelde
Hoogezand
ZuidlarenVeendam
Winschoten
Bellingwolde
Norg
EextStadskanaal
Onstwedde
Wateringen
Den Oever
SchagenOpperdoes
Heerhugowaard
Enkhuizen
Egmond aan Zee
Hoorn
Heemskerk
De Rijp
Koog aan de Zaan
Volendam
Monnickenwerf
Haarlem
Aalsmeer
Huizen
Katwijk aan Zee Warmond
LangeraarNieuwveen
Loenen
Soest
Koudekerk
Utrecht
Delft
Zoetermeer
OudewaterVreeswijk
Driebergen
Workum
HindeloopenLangweer
Tjalleberd
Heerenveen
Oudeschoot
Jubbega
Staveren
Koudum
Lemmer
Kuinder
Oldemarkt
Steenwijk
VollenhoveKoekange
Urk
Hasselt
Rouveen
Staphorst
IJsselmuidenKampen
Zalk Dalfsen
Oldebroek
Hattem
NunspeetWijhe
Putten
Vaassen
Bathmen
Wilp
Barneveld
Hoenderlo
DoornVeenendaal
Spankeren
Dieren
Bronkhorst
Appelscha
Assen
Grolloo Borger
Wessingtange
Dwingelo
BeilenOrvelte
OdoornRoswinkel
Ruinen
Emmen
Zuidbarge
Hollandscheveld
Zwinderen
Schoonebeek
Dedemsvaart Gramsbergen
Coevorden
EmlichheimHoogstede
Nieuw Schoonebeek
Ommen
Hardenberg
Bergentheim
Radewijk
Itterbeck
Wilsum
Lemele Langeveen
Vasse
UelsenNeuenhaus
Lage
Lattrop NordhornVriezenveen
WierdenAlmelo
TubbergenOotmarsum Tilligte
Rijssen
Delden Hengelo
Oldenzaal
Laren Usselo
Lochem
Eibergen
Haaksbergen
Zelhem
Groenlo
Blankenberge
Damme
Middelkerke
OostendeBrugge
Gistel Bekegem Oostkamp
Veurne
Oostkerke
Alveringem
Wingene
Brielle
Middelharnis
Renesse
Zierikzee
Steenbergen
WestkapelleGoes
MiddelburgKapelle
Breskens
Lamswaarde
Groenendijk
Ossendrecht
Zandvliet
ClingeKieldrecht
MoerkerkeAssenede
Zelzate
Moerbeke
Beveren
Zomergem
LochristiHingene
GentKalken
Lebbeke
Lippelo
Buggenhout
BerkelPolsbroek
Vianen
LekkerkerkDeil
Klaaswaal
Papendrecht Hardinxveld
Almkerk
DussenDrongelen
FijnaartZevenbergen
Oudenbosch
Dongen Loon op Zand
RoosendaalGoirle
Oirschot
EssenZundert
Kalmthout
Rijkevorsel
Zevendonk
Gierle
Arendonk
WijnegemOelegem
Balen
Boom Itegem
Geel
Meerhout
Thisselt
Mechelen
Herselt
Zolder
RenkumDoetinchem
DrutenOosterhout ’s−Herenberg
HeerewaardenRavenstein
Groesbeek
Den Dungen
Zeeland
Rijkevoort
Sint Oedenrode Gemert
Bakel
VenrayWanssum
Helmond
Geldrop
Riethoven MeijelTegelen
Venlo
Budel
Overpelt Horn
Bree Kinrooi
Echt
Houthalen Born
Susteren
Ulft
Warhem
Reninge
HouthulstGits
Roeselare
Woesten Moorslede
Hondegem
Kortrijk
Bellegem
Steenbeek
Nieuwkerke
Nazareth Bottelare
Aalst
Waregem Heldergem Hekelgem Wemmel
Zwevegem
Ingooigem
Nukerke
Geraardsbergen Lot
Ronse
Humbeek
Grimbergen
Kampenhout
AarschotWerchter Diest
Boutersem
Overijse
VertrijkTienen
Velm
Beek
Sittard
DiepenbeekMeerssen
Kerkrade
Vreren ’s−GravenvoerenVaals
Lauw
Aubel
Raeren
Baelen Eupen
Kapelle−Broek
Bollezeele
Figure 9.15: The southern half of the northeastern part of the Dutch languagearea. The state border and the provincial borders are represented by thinner linesand dialect cluster borders by thicker ones. The grey diamonds represent varietiesthat do not actually belong to the group in which they are found geographically.

248 CHAPTER 9. MEASURING DUTCH DIALECT DISTANCES
southern part of group 23, and the larger northern part of group 19 on the mapof Daan. In the latter cluster, it is striking that the cluster Dalfsen/Kampen israther apart. Characteristic for these varieties is the use of the uvular [ö] whichis uncommon for Low Saxon varieties. This uvular [ö] is also found in Zwolle,Deventer and Zutphen, but these varieties are not included in our data set. Moreabout this phenomenon can be found in Hoppenbrouwers and Hoppenbrouwers(2001, p. 92).
In the large cluster Hattem . . . Kampen, we find a small cluster containing thevarieties of Ruinen, Hollandscheveld and Koekange. On the map of Daan, theybelong to group 23, i.e. the southern Drenthe varieties. We expected them tobe clustered with the southern Drenthe group in the dendrogram in Figure 9.12.The fact that they are absent there and found instead among the Overijsselvarieties may be explained by transcriber differences. Furthermore, the varietiesof Oldemarkt, Steenwijk and Vollenhove belong to group 22 in the map of Daan,i.e. the Stellingwerf varieties. Are they misclassified due to transcriber differencesas well? We are not sure since they are clearly separated from Kuinder, whichis also a Stellingwerf variety. Since Oldemarkt, Steenwijk and Vollenhove fitperfectly among the other Overijssel varieties while Kuinder is rather apart, wesuspect that Kuinder is still a real Stellingwerf variety, while the other varietiesare much more strongly related to the Overijssel varieties.
In the dendrogram discussed in this section, we found some differences withDaan’s map, which cannot be explained by transcriber differences. The map ofDaan is based on material from 1939 while the RND transcriptions are based onrecordings made in 1974–1975 (south Drenthe and north Overijssel) and 1950–1970 (south Overijssel). Indeed, we found no explanation other than the factthat the situation has changed since 1939. In the dendrogram, we found a smallsoutheast Drenthe group. This group suggested that the southeastern borderof group 23 is shifted to the south. Furthermore, we expect that the southeastborder of group 22 was shifted more to the west, since most varieties, which shouldbelong to the Stellingwerf group in the map of Daan, do not appear as deviantto the other Drenthe and Overijssel varieties, with the exception of Kuinder.
9.4.5 Southwest Limburg
The southwest Limburg area is a small part of group 17 in Daan’s map. Group17 covers a large area, labeled as the dialect of Limburg. It is striking that oursouthwest Limburg area is not found as a separate group in the map of Daan.Nonetheless, it may be not surprising that a part of group 17 emerges as a separategroup. It is known that the situation is complex in this area, and the varietiesdo not form a homogeneous group (Hoppenbrouwers and Hoppenbrouwers, 2001,p. 187). The dendrogram for our southwest Limburg area is given in Figure 9.16.The locations of the varieties can be found in the map in Figure 9.17.

9.4. CLASSIFICATION PER SUBGROUP 249
LauwVreren
DiepenbeekHouthalen
Zolder
Figure 9.16: Subtree of the dendrogram in Figure 9.5, representing the SouthwestLimburg group.
Although the borders of the southwest Limburg area partly coincide withtranscriber borders, we think that this is not the only explanation why thisset of varieties appears as one of the 13 most significant groups. The varietiesdistinguish themselves from the varieties in our larger Limburg group and smallerNortheast Luik group through the fact that the r is pronounced as an alveolar[r], and not as an uvular [ö]. The division as given by the dendrogram is notsurprising: it follows the geography.
9.4.6 Brabant
The Brabant varieties roughly match group 15 in the map of Daan. However, asmall number of varieties belongs to group 11, and the dialect of Geraardsbergenbelongs to group 12. The division is shown in Figure 9.18 while the localities canbe found in Figure 9.19.
The main division consists of the cluster Velm . . . Tienen and the cluster Lot. . . Geraardsbergen. All varieties in the first cluster are borderline cases. Velmjust belongs to group 17 while Tienen and Diest marginally belong to group 15.On the original map of Daan, intermediate between group 15 and group 17 wefind group 16: the dialect of the region between Brabant and Limburg. Sincenone of the varieties in our set of dialects belongs to this area, this area is notfound in the map in Figure 9.3. However, if we assume that the borders in themap of Daan are drawn too narrowly or that the dialect area has been expandedsince 1939, the dialects of Tienen, Diest and Velm represent a part of this dialectregion.
In the second cluster we find a subcluster Lamswaarde . . . Geraardsbergenand a subcluster Lot . . . Arendonk. Most varieties in the subcluster Lamswaarde. . . Geraardsbergen are found in the northeast of group 11. It is striking thatthese varieties are not clustered with the other varieties of group 11, which arefound in the dendrogram in Figure 9.23 (see Section 9.4.9). Obviously, this cannotbe explained by transcriber differences. Furthermore, in this cluster we find thevarieties of Geraardsbergen and Heldergem. Geraardsbergen belongs to group12 in the map of Daan, and Heldergem is a borderline case. The dialects aregeographically isolated from the other varieties in this cluster and found furthersouth, Geraardsbergen so much so that is close to the Flemish/Walloon border.

250 CHAPTER 9. MEASURING DUTCH DIALECT DISTANCES
Midsland
West−Terschelling
Oost−Vlieland
Den Burg
Hollum NesSchiermonnikoog
Oosterend
Ferwerd
Holwerd Anjum
Zoutkamp
Sint Annaparochie
Hallum
Stiens
Dokkum
Westergeest KollumGrijpskerk
Sexbierum
Harlingen Franeker
Leeuwarden
TietjerkVeenwouden
BergumSurhuisterveen
Spannum
Grouw
Oudega
Rottevalle
Ureterp
Marum
Makkum Bolsward
Sneek
IJlst
BeetsBakkeveen
Donkerbroek
Roodeschool
Eenrum
Warffum
Middelstum
Zijldijk Bierum
OldehoveAdorp
Stedum Tjamsweer
Wagenborgen
ZuidhornNiekerk
Groningen
Garmerwolde
Schildwolde
ScheemdaFinsterwolde
PeizeEelde
Hoogezand
ZuidlarenVeendam
Winschoten
Bellingwolde
Norg
EextStadskanaal
Onstwedde
Wateringen
Den Oever
SchagenOpperdoes
Heerhugowaard
Enkhuizen
Egmond aan Zee
Hoorn
Heemskerk
De Rijp
Koog aan de Zaan
Volendam
Monnickenwerf
Haarlem
Aalsmeer
Huizen
Katwijk aan Zee Warmond
LangeraarNieuwveen
Loenen
Soest
Koudekerk
Utrecht
Delft
Zoetermeer
OudewaterVreeswijk
Driebergen
Workum
HindeloopenLangweer
Tjalleberd
Heerenveen
Oudeschoot
Jubbega
Staveren
Koudum
Lemmer
Noordwolde
Kuinder
Oldemarkt
Steenwijk
VollenhoveKoekange
Urk
Hasselt
Rouveen
Staphorst
IJsselmuidenKampen
Zalk Dalfsen
Oldebroek
Hattem
NunspeetWijhe
Spakenburg Putten
Vaassen
Bathmen
Wilp
Amersfoort
Woudenberg
Barneveld
Hoenderlo
DoornVeenendaal
Spankeren
Dieren
Bronkhorst
Appelscha
Assen
Grolloo Borger
Wessingtange
Dwingelo
BeilenOrvelte
OdoornRoswinkel
Ruinen
Emmen
Zuidbarge
Hollandscheveld
Zwinderen
Schoonebeek
Dedemsvaart Gramsbergen
Coevorden
EmlichheimHoogstede
Nieuw Schoonebeek
Ommen
Hardenberg
Bergentheim
Radewijk
Itterbeck
Wilsum
Lemele Langeveen
Vasse
UelsenNeuenhaus
Lage
Lattrop NordhornVriezenveen
WierdenAlmelo
TubbergenOotmarsum Tilligte
Rijssen
Delden Hengelo
Oldenzaal
Laren Usselo
Lochem
Eibergen
Haaksbergen
Zelhem
Groenlo
Blankenberge
Damme
Middelkerke
OostendeBrugge
Gistel Bekegem Oostkamp
Veurne
Oostkerke
Alveringem
Wingene
Brielle
Middelharnis
Renesse
Zierikzee
Steenbergen
WestkapelleGoes
MiddelburgKapelle
Breskens
Lamswaarde
Groenendijk
Ossendrecht
Zandvliet
ClingeKieldrecht
MoerkerkeAssenede
Zelzate
Moerbeke
Beveren
Zomergem
LochristiHingene
GentKalken
Lebbeke
Lippelo
Buggenhout
BerkelPolsbroek
Vianen
LekkerkerkDeil
Klaaswaal
Papendrecht Hardinxveld
Almkerk
Dussen
FijnaartZevenbergen
Oudenbosch
Dongen
Roosendaal
Oirschot
EssenZundert
Kalmthout
Rijkevorsel
Gierle
WijnegemOelegem
Balen
Boom Itegem
Geel
Thisselt
Mechelen
Herselt
Zolder
Wijk bij Duurstede Renkum
Zevenaar
Doetinchem
DrutenOosterhout ’s−Herenberg
HeerewaardenRavenstein
Groesbeek
Den Dungen
Zeeland
Rijkevoort
Sint Oedenrode Gemert
Bakel
VenrayWanssum
Helmond
Geldrop
Riethoven MeijelTegelen
Venlo
Budel
Overpelt Horn
Bree Kinrooi
Echt
Houthalen Born
Susteren
Aalten
Ulft
Warhem
Reninge
HouthulstGits
Roeselare
Woesten Moorslede
Hondegem
Kortrijk
Bellegem
Steenbeek
Nieuwkerke
Nazareth Bottelare
Aalst
Waregem Heldergem Hekelgem Wemmel
Zwevegem
Ingooigem
Nukerke
Geraardsbergen Lot
Ronse
Humbeek
Grimbergen
Kampenhout
AarschotWerchter
Boutersem
Overijse
VertrijkTienen
Velm
Beek
Sittard
DiepenbeekMeerssen
Kerkrade
Vreren ’s−GravenvoerenVaals
Lauw
Aubel
Raeren
Baelen Eupen
Kapelle−Broek
Bollezeele
Figure 9.17: The southern half of the southeastern part of the Dutch languagearea. State borders and provincial borders are represented by thinner lines anddialect cluster borders by thicker ones. The grey diamonds represent varietieswhich, in our measurements, do not actually belong to the group in which theyare found geographically.
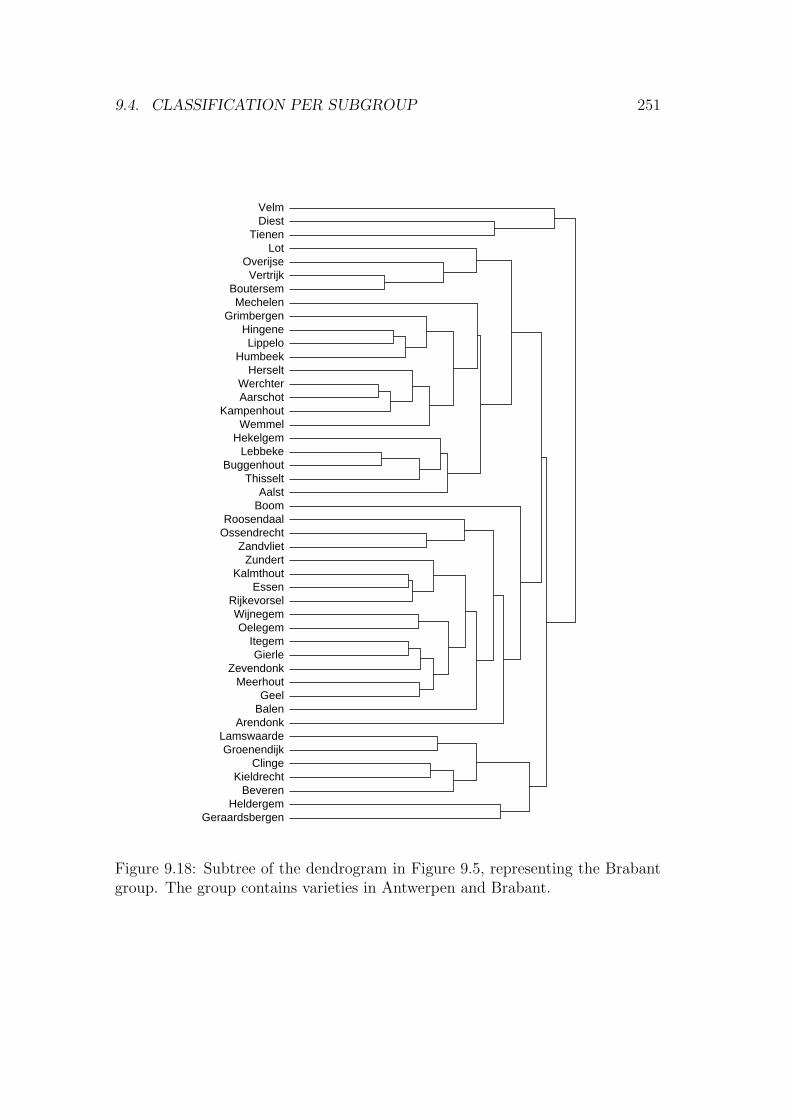
9.4. CLASSIFICATION PER SUBGROUP 251
VelmDiest
TienenLot
OverijseVertrijk
BoutersemMechelen
GrimbergenHingeneLippelo
HumbeekHerselt
WerchterAarschot
KampenhoutWemmel
HekelgemLebbeke
BuggenhoutThisselt
AalstBoom
RoosendaalOssendrecht
ZandvlietZundert
KalmthoutEssen
RijkevorselWijnegemOelegem
ItegemGierle
ZevendonkMeerhout
GeelBalen
ArendonkLamswaardeGroenendijk
ClingeKieldrecht
BeverenHeldergem
Geraardsbergen
Figure 9.18: Subtree of the dendrogram in Figure 9.5, representing the Brabantgroup. The group contains varieties in Antwerpen and Brabant.

252 CHAPTER 9. MEASURING DUTCH DIALECT DISTANCES
Midsland
West−Terschelling
Oost−Vlieland
Den Burg
Hollum NesSchiermonnikoog
Oosterend
Ferwerd
Holwerd Anjum
Zoutkamp
Sint Annaparochie
Hallum
Stiens
Dokkum
Westergeest KollumGrijpskerk
Sexbierum
Harlingen Franeker
Leeuwarden
TietjerkVeenwouden
BergumSurhuisterveen
Spannum
Grouw
Oudega
Rottevalle
Ureterp
Marum
Makkum Bolsward
Sneek
IJlst
BeetsBakkeveen
Donkerbroek
Roodeschool
Eenrum
Warffum
Middelstum
Zijldijk Bierum
OldehoveAdorp
Stedum Tjamsweer
Wagenborgen
ZuidhornNiekerk
Groningen
Garmerwolde
Schildwolde
ScheemdaFinsterwolde
PeizeEelde
Hoogezand
ZuidlarenVeendam
Winschoten
Bellingwolde
Norg
EextStadskanaal
Onstwedde
Wateringen
Den Oever
SchagenOpperdoes
Heerhugowaard
Enkhuizen
Egmond aan Zee
Hoorn
Heemskerk
De Rijp
Koog aan de Zaan
Volendam
Monnickenwerf
Haarlem
Aalsmeer
Huizen
Katwijk aan Zee Warmond
LangeraarNieuwveen
Loenen
Soest
Koudekerk
Utrecht
Delft
Zoetermeer
OudewaterVreeswijk
Driebergen
Workum
HindeloopenLangweer
Tjalleberd
Heerenveen
Oudeschoot
Jubbega
Staveren
Koudum
Lemmer
Noordwolde
Kuinder
Oldemarkt
Steenwijk
VollenhoveKoekange
Urk
Hasselt
Rouveen
Staphorst
IJsselmuidenKampen
Zalk Dalfsen
Oldebroek
Hattem
NunspeetWijhe
Spakenburg Putten
Vaassen
Bathmen
Wilp
Amersfoort
Woudenberg
Barneveld
Hoenderlo
DoornVeenendaal
Spankeren
Dieren
Bronkhorst
Appelscha
Assen
Grolloo Borger
Wessingtange
Dwingelo
BeilenOrvelte
OdoornRoswinkel
Ruinen
Emmen
Zuidbarge
Hollandscheveld
Zwinderen
Schoonebeek
Dedemsvaart Gramsbergen
Coevorden
EmlichheimHoogstede
Nieuw Schoonebeek
Ommen
Hardenberg
Bergentheim
Radewijk
Itterbeck
Wilsum
Lemele Langeveen
Vasse
UelsenNeuenhaus
Lage
Lattrop NordhornVriezenveen
WierdenAlmelo
TubbergenOotmarsum Tilligte
Rijssen
Delden Hengelo
Oldenzaal
Laren Usselo
Lochem
Eibergen
Haaksbergen
Zelhem
Groenlo
Blankenberge
Damme
Middelkerke
OostendeBrugge
Gistel Bekegem Oostkamp
Veurne
Oostkerke
Alveringem
Wingene
Brielle
Middelharnis
Renesse
Zierikzee
Steenbergen
WestkapelleGoes
MiddelburgKapelle
Breskens
Lamswaarde
Groenendijk
Ossendrecht
Zandvliet
ClingeKieldrecht
Moerkerke
Zelzate
Moerbeke
Beveren
LochristiHingene
Kalken
Lebbeke
Lippelo
Buggenhout
BerkelPolsbroek
Vianen
LekkerkerkDeil
Klaaswaal
Papendrecht Hardinxveld
Almkerk
DussenDrongelen
Zevenbergen
Oudenbosch
RoosendaalGoirle
EssenZundert
Kalmthout
Rijkevorsel
Zevendonk
Gierle
Arendonk
WijnegemOelegem
Balen
Boom Itegem
Geel
Meerhout
Thisselt
Mechelen
Herselt
Zolder
Wijk bij Duurstede Renkum
Zevenaar
Doetinchem
DrutenOosterhout ’s−Herenberg
HeerewaardenRavenstein
Groesbeek
Den Dungen
Zeeland
Rijkevoort
Gemert
Bakel
VenrayWanssum
Helmond
Geldrop
Riethoven MeijelTegelen
Venlo
Budel
Overpelt Horn
Bree Kinrooi
Echt
Houthalen Born
Susteren
Aalten
Ulft
Warhem
Reninge
HouthulstGits
Roeselare
Woesten Moorslede
Hondegem
Kortrijk
Bellegem
Steenbeek
Nieuwkerke
Nazareth Bottelare
Aalst
Waregem Heldergem Hekelgem Wemmel
Zwevegem
Ingooigem
Geraardsbergen Lot
Humbeek
Grimbergen
Kampenhout
AarschotWerchter Diest
Boutersem
Overijse
VertrijkTienen
Velm
Beek
Sittard
DiepenbeekMeerssen
Kerkrade
Vreren ’s−GravenvoerenVaals
Aubel
Raeren
Baelen Eupen
Kapelle−Broek
Bollezeele
Figure 9.19: The mid-southern part of the Dutch language area. The state borderand province borders are represented by thinner lines and dialect cluster bordersby thicker ones. The grey diamond represents a variety that, in our measure-ments, does not actually belong to the group in which it is found geographically.
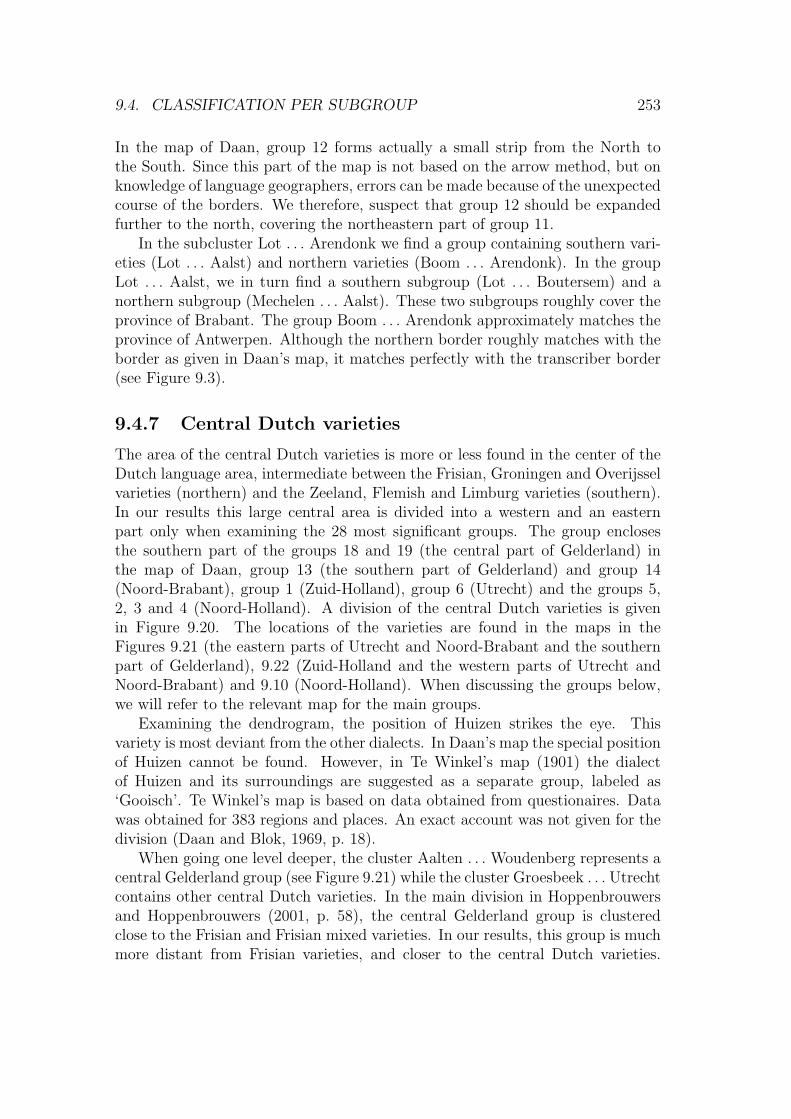
9.4. CLASSIFICATION PER SUBGROUP 253
In the map of Daan, group 12 forms actually a small strip from the North tothe South. Since this part of the map is not based on the arrow method, but onknowledge of language geographers, errors can be made because of the unexpectedcourse of the borders. We therefore, suspect that group 12 should be expandedfurther to the north, covering the northeastern part of group 11.
In the subcluster Lot . . . Arendonk we find a group containing southern vari-eties (Lot . . . Aalst) and northern varieties (Boom . . . Arendonk). In the groupLot . . . Aalst, we in turn find a southern subgroup (Lot . . . Boutersem) and anorthern subgroup (Mechelen . . . Aalst). These two subgroups roughly cover theprovince of Brabant. The group Boom . . . Arendonk approximately matches theprovince of Antwerpen. Although the northern border roughly matches with theborder as given in Daan’s map, it matches perfectly with the transcriber border(see Figure 9.3).
9.4.7 Central Dutch varieties
The area of the central Dutch varieties is more or less found in the center of theDutch language area, intermediate between the Frisian, Groningen and Overijsselvarieties (northern) and the Zeeland, Flemish and Limburg varieties (southern).In our results this large central area is divided into a western and an easternpart only when examining the 28 most significant groups. The group enclosesthe southern part of the groups 18 and 19 (the central part of Gelderland) inthe map of Daan, group 13 (the southern part of Gelderland) and group 14(Noord-Brabant), group 1 (Zuid-Holland), group 6 (Utrecht) and the groups 5,2, 3 and 4 (Noord-Holland). A division of the central Dutch varieties is givenin Figure 9.20. The locations of the varieties are found in the maps in theFigures 9.21 (the eastern parts of Utrecht and Noord-Brabant and the southernpart of Gelderland), 9.22 (Zuid-Holland and the western parts of Utrecht andNoord-Brabant) and 9.10 (Noord-Holland). When discussing the groups below,we will refer to the relevant map for the main groups.
Examining the dendrogram, the position of Huizen strikes the eye. Thisvariety is most deviant from the other dialects. In Daan’s map the special positionof Huizen cannot be found. However, in Te Winkel’s map (1901) the dialectof Huizen and its surroundings are suggested as a separate group, labeled as‘Gooisch’. Te Winkel’s map is based on data obtained from questionaires. Datawas obtained for 383 regions and places. An exact account was not given for thedivision (Daan and Blok, 1969, p. 18).
When going one level deeper, the cluster Aalten . . . Woudenberg represents acentral Gelderland group (see Figure 9.21) while the cluster Groesbeek . . . Utrechtcontains other central Dutch varieties. In the main division in Hoppenbrouwersand Hoppenbrouwers (2001, p. 58), the central Gelderland group is clusteredclose to the Frisian and Frisian mixed varieties. In our results, this group is muchmore distant from Frisian varieties, and closer to the central Dutch varieties.

254 CHAPTER 9. MEASURING DUTCH DIALECT DISTANCES
AaltenUlft
DoetinchemSpankeren
DierenHoenderlo
PuttenSpakenburg
BarneveldWoudenberg
GroesbeekAmersfoort
’s-HerenbergZevenaar
OosterhoutDruten
HeerewaardenRenkum
DoornWijk bij Duurstede
VeenendaalRavenstein
Den DungenSint Oedenrode
RiethovenGemert
BakelZeelandGeldrop
MeijelOirschot
Loon op ZandGoirle
DongenDussen
DrongelenAlmkerk
DeilZevenbergenOudenbosch
FijnaartKatwijk aan Zee
KoudekerkAalsmeer
SoestWateringen
BerkelDriebergenPolsbroek
ZoetermeerWarmond
LoenenLangeraar
NieuwveenOudewater
VreeswijkVianenBrielle
KlaaswaalPapendrecht
LekkerkerkHardinxveld
DelftVolendam
MonnickenwerfHoorn
HaarlemHeemskerk
SchagenDe Rijp
Koog aan de ZaanHeerhugowaard
Den OeverDen Burg
Oost-VlielandEnkhuizen
Egmond aan ZeeOpperdoes
UtrechtHuizen
Figure 9.20: Subtree of the dendrogram in Figure 9.5, representing the CentralDutch varieties group. The group encloses varieties in south Gelderland, Noord-Brabant, Zuid-Holland, Utrecht and Noord-Holland.

9.4. CLASSIFICATION PER SUBGROUP 255
The group covers the southern parts of the groups 18 and 19 of Daan’s map.Unfortunately, the northern border of this group matches exactly the transcriberborder (see Figure 9.3). The southern border, however, matches mainly with theborder found intermediate between the groups 18 and 19 in the North and thegroups 6 and 13 in the South in Daan’s map (see Figure 9.2). However, our borderruns west of Woudenberg, while in the map of Daan the border runs east of thislocation. So for this variety, the influence of transcriber differences is noticeable.
When going one level deeper again, we find a cluster Groesbeek . . . Fijnaartwhich corresponds with southern Gelderland en Noord-Brabant, and a clusterKatwijk aan Zee . . . Utrecht corresponding with Noord-Holland, Zuid-Hollandand the greater part of Utrecht. In the cluster with the south Gelderland andNoord-Brabant varieties, Groesbeek is rather distinct from the other varieties.Geographically, Groesbeek is close to our Limburg group (see Figure 9.17 andSection 9.4.12). The dialect is probably an intermediate variant between theGelderland varieties and the Limburg varieties. Apart from Groesbeek, we finda cluster Amersfoort . . . Meijel, containing varieties in south Gelderland andthe eastern part of Noord-Brabant (see Figure 9.21), and a cluster Oirschot . . .Fijnaart containing mainly varieties in the western part of Noord-Brabant (seeFigure 9.22). The south Gelderland/east Noord-Brabant cluster covers the east-ern parts of the groups 6, 13 and 14 in Daan’s map. The western part of thesouthern border matches with the the western part of the border between group14 (north) and group 17 (south) in the map of Daan. The east Noord-Brabantcluster covers the eastern parts of the groups 13 and 14. The east/west divisionof the group 6, 13 and 14 in our results is clearly the result of transcriber differ-ences. On the other hand, the east/west division of group 14 is also suggested inthe map of Te Winkel (1901).
In the cluster with the varieties in Noord-Holland, Zuid-Holland and Utrecht,we found the dialect of Utrecht to be rather distinct (see Figure 9.22). The dialectof Utrecht is probably a typical town variety, contrasting with the surroundingrural dialects. Going one level deeper, we find the variaties of Katwijk aan Zee,Koudekerk and Aalsmeer as a separate cluster (see Figure 9.22). On the one hand,this is probably the result of transcriber differences (see Figure 9.3). On the otherhand, Katwijk aan Zee is known to be an isolated place inhabited by fishermen,where an archaic dialect is spoken (see Hoppenbrouwers and Hoppenbrouwers,2001, p. 152). In Hoppenbrouwers and Hoppenbrouwers (2001, p. 150) the dialectis even clustered with the Zeeland varieties, while our dendrogram suggests astronger relation to the Holland and Utrecht varieties.
Going one level deeper again, the cluster Soest . . . Delft contains varietiesin Zuid-Holland and Utrecht (see Figure 9.22), while the cluster Volendam . . .Opperdoes contains mainly varieties in Noord-Holland (see Figure 9.10). Thecluster that contains varieties in Zuid-Holland and Utrecht, corresponds withthe groups 1 (Zuid-Holland) and 6 (Utrecht) of the map of Daan. However,we found no border between these two groups. Rather we found a north/south

256 CHAPTER 9. MEASURING DUTCH DIALECT DISTANCES
Midsland
West−Terschelling
Oost−Vlieland
Den Burg
Hollum NesSchiermonnikoog
Oosterend
Ferwerd
Holwerd Anjum
Zoutkamp
Sint Annaparochie
Hallum
Stiens
Dokkum
Westergeest KollumGrijpskerk
Sexbierum
Harlingen Franeker
Leeuwarden
TietjerkVeenwouden
BergumSurhuisterveen
Spannum
Grouw
Oudega
Rottevalle
Ureterp
Marum
Makkum Bolsward
Sneek
IJlst
BeetsBakkeveen
Donkerbroek
Roodeschool
Eenrum
Warffum
Middelstum
Zijldijk Bierum
OldehoveAdorp
Stedum Tjamsweer
Wagenborgen
ZuidhornNiekerk
Groningen
Garmerwolde
Schildwolde
ScheemdaFinsterwolde
PeizeEelde
Hoogezand
ZuidlarenVeendam
Winschoten
Bellingwolde
Norg
EextStadskanaal
Onstwedde
Wateringen
Den Oever
SchagenOpperdoes
Heerhugowaard
Enkhuizen
Egmond aan Zee
Hoorn
Heemskerk
De Rijp
Koog aan de Zaan
Volendam
Monnickenwerf
Haarlem
Aalsmeer
Huizen
Katwijk aan Zee Warmond
LangeraarNieuwveen
Soest
Koudekerk
Utrecht
Delft
Zoetermeer
Oudewater
Driebergen
Workum
HindeloopenLangweer
Tjalleberd
Heerenveen
Oudeschoot
Jubbega
Staveren
Koudum
Lemmer
Noordwolde
Kuinder
Oldemarkt
Steenwijk
VollenhoveKoekange
Urk
Hasselt
Rouveen
Staphorst
IJsselmuidenKampen
Zalk Dalfsen
Oldebroek
NunspeetWijhe
Spakenburg Putten
Vaassen
Bathmen
Wilp
Amersfoort
Woudenberg
Barneveld
Hoenderlo
DoornVeenendaal
Spankeren
Dieren
Bronkhorst
Appelscha
Assen
Grolloo Borger
Wessingtange
Dwingelo
BeilenOrvelte
OdoornRoswinkel
Ruinen
Emmen
Zuidbarge
Hollandscheveld
Zwinderen
Schoonebeek
Dedemsvaart Gramsbergen
Coevorden
EmlichheimHoogstede
Nieuw Schoonebeek
Ommen
Hardenberg
Bergentheim
Radewijk
Itterbeck
Wilsum
Neuenhaus
Lage
Lattrop Nordhorn
WierdenAlmelo
Tilligte
Rijssen
Delden
Oldenzaal
Laren
Lochem
Eibergen
Zelhem
Groenlo
Blankenberge
Damme
Middelkerke
OostendeBrugge
Gistel Bekegem Oostkamp
Veurne
Oostkerke
Alveringem
Wingene
Brielle
Middelharnis
Renesse
Zierikzee
Steenbergen
WestkapelleGoes
MiddelburgKapelle
Breskens
Lamswaarde
Groenendijk
Ossendrecht
Zandvliet
ClingeKieldrecht
MoerkerkeAssenede
Zelzate
Moerbeke
Beveren
Zomergem
LochristiHingene
GentKalken
Lebbeke
Lippelo
Buggenhout
BerkelPolsbroek
LekkerkerkDeil
Klaaswaal
Papendrecht Hardinxveld
Dussen
FijnaartZevenbergen
Oudenbosch
Dongen
Roosendaal
Oirschot
EssenZundert
Kalmthout
Rijkevorsel
Gierle
WijnegemOelegem
Balen
Boom Itegem
Geel
Meerhout
Thisselt
Mechelen
Herselt
Zolder
Wijk bij Duurstede Renkum
Zevenaar
Doetinchem
DrutenOosterhout ’s−Herenberg
HeerewaardenRavenstein
Groesbeek
Den Dungen
Zeeland
Rijkevoort
Sint Oedenrode Gemert
Bakel
VenrayWanssum
Helmond
Geldrop
Riethoven MeijelTegelen
Venlo
Budel
Overpelt
Bree Kinrooi
Echt
Houthalen Born
Susteren
Aalten
Ulft
Warhem
Reninge
HouthulstGits
Roeselare
Woesten Moorslede
Hondegem
Kortrijk
Bellegem
Steenbeek
Nieuwkerke
Nazareth Bottelare
Aalst
Waregem Heldergem Hekelgem Wemmel
Zwevegem
Ingooigem
Nukerke
Geraardsbergen Lot
Ronse
Humbeek
Grimbergen
Kampenhout
AarschotWerchter Diest
Boutersem
Overijse
VertrijkTienen
Velm
Beek
Sittard
DiepenbeekMeerssen
Kerkrade
Vreren ’s−GravenvoerenVaals
Lauw
Aubel
Raeren
Baelen Eupen
Kapelle−Broek
Bollezeele
Figure 9.21: The northern half of the southeastern part of the Dutch languagearea. The state border and provincial borders are represented by thinner linesand dialect cluster borders by thicker ones. The grey diamonds represent varietiesthat do not actually belong to the group in which they are found geographically.

9.4. CLASSIFICATION PER SUBGROUP 257
Midsland
West−Terschelling
Oost−Vlieland
Den Burg
Hollum NesSchiermonnikoog
Oosterend
Ferwerd
Holwerd Anjum
Zoutkamp
Sint Annaparochie
Hallum
Stiens
Dokkum
Westergeest KollumGrijpskerk
Sexbierum
Harlingen Franeker
Leeuwarden
TietjerkVeenwouden
BergumSurhuisterveen
Spannum
Grouw
Oudega
Rottevalle
Ureterp
Marum
Makkum Bolsward
Sneek
IJlst
BeetsBakkeveen
Donkerbroek
Roodeschool
Eenrum
Warffum
Middelstum
Zijldijk Bierum
OldehoveAdorp
Stedum Tjamsweer
Wagenborgen
ZuidhornNiekerk
Groningen
Garmerwolde
Schildwolde
ScheemdaFinsterwolde
PeizeEelde
Hoogezand
ZuidlarenVeendam
Winschoten
Bellingwolde
Norg
EextStadskanaal
Onstwedde
Wateringen
Den Oever
SchagenOpperdoes
Heerhugowaard
Enkhuizen
Egmond aan Zee
Hoorn
Heemskerk
De Rijp
Koog aan de Zaan
Volendam
Monnickenwerf
Aalsmeer
Huizen
Katwijk aan Zee Warmond
LangeraarNieuwveen
Loenen
Soest
Koudekerk
Utrecht
Delft
Zoetermeer
OudewaterVreeswijk
Driebergen
Workum
HindeloopenLangweer
Tjalleberd
Heerenveen
Oudeschoot
Jubbega
Staveren
Koudum
Lemmer
Noordwolde
Kuinder
Oldemarkt
Steenwijk
VollenhoveKoekange
Urk
Hasselt
Rouveen
Staphorst
IJsselmuidenKampen
Zalk Dalfsen
Oldebroek
Hattem
NunspeetWijhe
Putten
Vaassen
Bathmen
Wilp
Barneveld
Hoenderlo
Veenendaal
Spankeren
Dieren
Bronkhorst
Appelscha
Assen
Grolloo Borger
Wessingtange
Dwingelo
BeilenOrvelte
OdoornRoswinkel
Ruinen
Emmen
Zuidbarge
Hollandscheveld
Zwinderen
Schoonebeek
Dedemsvaart Gramsbergen
Coevorden
EmlichheimHoogstede
Nieuw Schoonebeek
Ommen
Hardenberg
Bergentheim
Radewijk
Itterbeck
Wilsum
Lemele Langeveen
Vasse
UelsenNeuenhaus
Lage
Lattrop NordhornVriezenveen
WierdenAlmelo
TubbergenOotmarsum Tilligte
Rijssen
Delden Hengelo
Oldenzaal
Laren Usselo
Lochem
Eibergen
Haaksbergen
Zelhem
Groenlo
Blankenberge
Damme
Middelkerke
OostendeBrugge
Gistel Bekegem Oostkamp
Veurne
Oostkerke
Alveringem
Wingene
Brielle
Middelharnis
Renesse
Steenbergen
WestkapelleGoes
MiddelburgKapelle
Breskens
Lamswaarde
Ossendrecht
ClingeKieldrecht
MoerkerkeAssenede
Zelzate
Moerbeke
Beveren
Zomergem
LochristiHingene
GentKalken
Lebbeke
Lippelo
Buggenhout
BerkelPolsbroek
Vianen
LekkerkerkDeil
Klaaswaal
Papendrecht Hardinxveld
Almkerk
DussenDrongelen
FijnaartZevenbergen
Oudenbosch
Dongen Loon op Zand
RoosendaalGoirle
Oirschot
EssenZundert
Rijkevorsel
Zevendonk
Gierle
Arendonk
WijnegemOelegem
Balen
Boom Itegem
Geel
Meerhout
Thisselt
Mechelen
Herselt
Zolder
Renkum
Zevenaar
Doetinchem
DrutenOosterhout ’s−Herenberg
RavensteinGroesbeek
Zeeland
Rijkevoort
Gemert
Bakel
VenrayWanssum
Helmond
Geldrop
Riethoven MeijelTegelen
Venlo
Budel
Overpelt Horn
Bree Kinrooi
Echt
Houthalen Born
Susteren
Aalten
Ulft
Warhem
Reninge
HouthulstGits
Roeselare
Woesten Moorslede
Hondegem
Kortrijk
Bellegem
Steenbeek
Nieuwkerke
Nazareth Bottelare
Aalst
Waregem Heldergem Hekelgem Wemmel
Zwevegem
Ingooigem
Nukerke
Geraardsbergen Lot
Ronse
Humbeek
Grimbergen
Kampenhout
AarschotWerchter Diest
Boutersem
Overijse
VertrijkTienen
Velm
Beek
Sittard
DiepenbeekMeerssen
Kerkrade
Vreren ’s−GravenvoerenVaals
Lauw
Aubel
Raeren
Baelen Eupen
Kapelle−Broek
Bollezeele
Figure 9.22: The mid-western part of the Dutch language area. The state borderand province borders are represented by thinner lines and dialect cluster bordersby thicker ones. The grey diamonds represent varieties that, in our measurements,do not actually belong to the group in which they are found geographically.

258 CHAPTER 9. MEASURING DUTCH DIALECT DISTANCES
division across the both provinces. Apart from Delft and Soest, we find a clusterWateringen . . . Oudewater representing the northern part, and a cluster Vreeswijk. . . Hardinxsveld representing the southern part. Daan and Blok (1969, p. 31)write that it was problematic to find the right border between Zuid-Holland andUtrecht, although they intuitively thought that there must be a border. Finally,they found that the surname Bartels was pronounced as [bArt@ls] in Zuid-Holland,and as [ba:rt@ls] in Utrecht. However, the A/a-isogloss could not be found on thebasis of the data obtained from the questionaires, but was finally found on thebasis of tape recordings. We doubt whether this Zuid-Holland/Utrecht borderstill reflects the language awareness of the dialect speakers, all the more since wedid not find this border either.
The cluster containing the varieties in Noord-Holland corresponds with thegroups 2, 3, 4 and 5 and a small northern part of group 1 in Daan’s map. Thesedifferent groups in the map of Daan cannot be clearly identified in our dendro-gram. At a deeper level, we find two close clusters: Hoorn . . . Heemskerk andSchagen . . . Heerhugowaard, but neither the one nor the other corresponds clearlywith one of the Noord-Holland groups in Daan’s map. Possibly the situation inthe time that the recordings were made (1950–1962) has changed compared tothe situation at the time that the data for Daan’s map was gathered (1939). Onthe other hand, the dialects of Egmond aan Zee, Volendam and the island Marken(representend by Monnickenwerf in our data set) are known to be independentvarieties (Daan, 1956).
We observe that the border between our Zuid-Holland/Utrecht group andthe Noord-Holland group exactly matches with the transcriber border (see Fig-ure 9.3). The difference concerns Haarlem only. In our results, this dialect isclustered with the Noord-Holland varieties. In the map of Daan, this varietybelongs to group 1 (Zuid-Holland). However, in Daan (1956) the conglomerate ofHaarlem is mentioned as a separate group among the varieties of Noord-Holland.
Summarizing, we found five main clusters: the central Gelderland cluster Aal-ten . . . Woudenberg (see Figure 9.21), the south Gelderland/east Utrecht/eastNoord-Brabant cluster Groesbeek . . . Meijel (see Figure 9.21), the west Noord-Brabant cluster Oirschot . . . Fijnaart (see Figure 9.22), the Zuid-Holland/Utrechtcluster Katwijk aan Zee . . . Delft (see Figure 9.22), and the Noord-Holland clusterHoorn . . . Opperdoes (see Figure 9.10). The southern part of the border betweenthe Zuid-Holland/Utrecht cluster and the west Noord-Brabant cluster matchesthe border in the map of Daan between group 1 (north) and the groups 7 and14 (south). The Zuid-Holland/Utrecht cluster and the central-Gelderland clusterjust miss bordering on each other. They are separated by the Amersfoort dialect.According to Daan’s map, Amersfoort belongs to group 6 and thus was expectedto be clustered among the varieties in our Zuid-Holland/Utrecht cluster. How-ever, it is clustered with the south Gelderland/west Utrecht/west Noord-Brabantcluster, probably as the result of transcriber differences.

9.4. CLASSIFICATION PER SUBGROUP 259
RonseNukerke
KalkenMoerbeke
ZelzateAssenede
LochristiZomergem
NazarethBottelare
Gent
Figure 9.23: Subtree of the dendrogram in Figure 9.5, representing the EastFlanders group.
9.4.8 Urk
It is striking that Urk belongs to none of the other groups. This can also beseen in the map in Figure 9.4, where Urk has no strong connection with othervarieties. The explanation is found in the fact that Urk was an island in thepast, until the Noordoostpolder was impoldered in 1942. In the map of Daan,the variety belongs to group 19. The Urk dialect has a regular vowel systemwhere the duration of vowels is relevant. Rounded and close vowels are usedmore frequently. For the consonants we note inter alia that [sk] is pronouncedwhere [sx] is pronounced in Standard Dutch. More about the dialect of Urk canbe found in Daan (1990).
9.4.9 East Flanders
The group of East Flanders varieties corresponds with the groups 10 and 11 inDaan’s map. The dendrogram is given in Figure 9.23. The locations of thevarieties is shown in the map in Figure 9.24.
In the dendrogram, the cluster with the dialects of Ronse and Nukerke cor-responds with group 10 in Daan’s map. The group forms a region between theWest and East Flanders dialects. The cluster Kalken . . . Gent corresponds withgroup 11. However, in the northeast in Daan’s map the border runs more east-erly than it does on our map. As explained in Section 9.4.6, in our results thesenortheastern varieties are clustered with the varieties that belong to group 12 inthe map of Daan (see Figure 9.18). Furthermore, the dendrogram shows that thetown dialect of Gent differs rather strongly from the varieties in its surroundings.

260 CHAPTER 9. MEASURING DUTCH DIALECT DISTANCES
Midsland
West−Terschelling
Oost−Vlieland
Den Burg
Hollum NesSchiermonnikoog
Oosterend
Ferwerd
Holwerd Anjum
Zoutkamp
Sint Annaparochie
Hallum
Stiens
Dokkum
Westergeest KollumGrijpskerk
Sexbierum
Harlingen Franeker
Leeuwarden
TietjerkVeenwouden
BergumSurhuisterveen
Spannum
Grouw
Oudega
Rottevalle
Ureterp
Marum
Makkum Bolsward
Sneek
IJlst
BeetsBakkeveen
Donkerbroek
Roodeschool
Eenrum
Warffum
Middelstum
Zijldijk Bierum
OldehoveAdorp
Stedum Tjamsweer
Wagenborgen
ZuidhornNiekerk
Groningen
Garmerwolde
Schildwolde
ScheemdaFinsterwolde
PeizeEelde
Hoogezand
ZuidlarenVeendam
Winschoten
Bellingwolde
Norg
EextStadskanaal
Onstwedde
Den Oever
SchagenOpperdoes
Heerhugowaard
Enkhuizen
Egmond aan Zee
Hoorn
Heemskerk
De Rijp
Koog aan de Zaan
Volendam
Monnickenwerf
Haarlem
Aalsmeer
Huizen
Katwijk aan Zee Warmond
LangeraarNieuwveen
Loenen
Soest
Koudekerk
Utrecht
Delft
Zoetermeer
OudewaterVreeswijk
Driebergen
Workum
HindeloopenLangweer
Tjalleberd
Heerenveen
Oudeschoot
Jubbega
Staveren
Koudum
Lemmer
Noordwolde
Kuinder
Oldemarkt
Steenwijk
VollenhoveKoekange
Urk
Hasselt
Rouveen
Staphorst
IJsselmuidenKampen
Zalk Dalfsen
Oldebroek
Hattem
NunspeetWijhe
Spakenburg Putten
Vaassen
Bathmen
Wilp
Amersfoort
Woudenberg
Barneveld
Hoenderlo
DoornVeenendaal
Spankeren
Dieren
Bronkhorst
Appelscha
Assen
Grolloo Borger
Wessingtange
Dwingelo
BeilenOrvelte
OdoornRoswinkel
Ruinen
Emmen
Zuidbarge
Hollandscheveld
Zwinderen
Schoonebeek
Dedemsvaart Gramsbergen
Coevorden
EmlichheimHoogstede
Nieuw Schoonebeek
Ommen
Hardenberg
Bergentheim
Radewijk
Itterbeck
Wilsum
Lemele Langeveen
Vasse
UelsenNeuenhaus
Lage
Lattrop NordhornVriezenveen
WierdenAlmelo
TubbergenOotmarsum Tilligte
Rijssen
Delden Hengelo
Oldenzaal
Laren Usselo
Lochem
Eibergen
Haaksbergen
Zelhem
Groenlo
Blankenberge
Damme
Middelkerke
OostendeBrugge
Gistel Bekegem Oostkamp
Veurne
Oostkerke
Alveringem
Wingene
Brielle
Middelharnis
Renesse
Zierikzee
Steenbergen
WestkapelleGoes
MiddelburgKapelle
Breskens
Lamswaarde
Groenendijk
Ossendrecht
Zandvliet
ClingeKieldrecht
MoerkerkeAssenede
Zelzate
Moerbeke
Beveren
Zomergem
LochristiHingene
GentKalken
Lebbeke
Lippelo
Buggenhout
Polsbroek
Vianen
LekkerkerkDeil
Papendrecht Hardinxveld
Almkerk
DussenDrongelen
Zevenbergen
Oudenbosch
Dongen Loon op Zand
GoirleOirschot
Zundert
Rijkevorsel
Zevendonk
Gierle
Arendonk
Oelegem
Balen
Boom Itegem
Geel
Meerhout
Thisselt Herselt
Zolder
Wijk bij Duurstede Renkum
Zevenaar
Doetinchem
DrutenOosterhout ’s−Herenberg
HeerewaardenRavenstein
Groesbeek
Den Dungen
Zeeland
Rijkevoort
Sint Oedenrode Gemert
Bakel
VenrayWanssum
Helmond
Geldrop
Riethoven MeijelTegelen
Venlo
Budel
Overpelt Horn
Bree Kinrooi
Echt
Houthalen Born
Susteren
Aalten
Ulft
Warhem
Reninge
HouthulstGits
Roeselare
Woesten Moorslede
Hondegem
Kortrijk
Bellegem
Steenbeek
Nieuwkerke
Nazareth Bottelare
Aalst
Waregem Heldergem Hekelgem Wemmel
Zwevegem
Ingooigem
Nukerke
Geraardsbergen Lot
Ronse
Grimbergen
Kampenhout
AarschotWerchter Diest
Boutersem
Overijse
VertrijkTienen
Velm
Beek
Sittard
DiepenbeekMeerssen
Kerkrade
Vreren ’s−GravenvoerenVaals
Lauw
Aubel
Raeren
Baelen Eupen
Kapelle−Broek
Bollezeele
Figure 9.24: The southwestern part of the Dutch language area. National bordersand provincial borders are represented by thinner lines and dialect cluster bordersby thicker ones. The grey diamond represents a variety that does not actuallybelong to the group in which it is found geographically.

9.4. CLASSIFICATION PER SUBGROUP 261
9.4.10 West Flanders
The varieties of West Flanders correspond with group 9 and 10 in the map ofDaan. The dendrogram is given in Figure 9.25, and the locations of the dialectsin the map in Figure 9.24.
On the highest level, we find a cluster Moerkerke . . . Waregem containingvarieties along the eastern provincial border of West Flanders, and a clusterNieuwkerke . . . Hondegem containing varieties in the remaining western part.The southern varieties in the eastern group are in or very near group 10 of Daan’smap. On our version of Daan’s map as given in Figure 9.2 this southern partis visualized. On the original map of Daan, a northern part of group 12 is alsofound, which is geographically not connected to the southern part. This northernpart is not given on our map, since we have no sample sites that fall within thisnorthern part. However, when examining the eastern group in our dendrogram,it is striking to see that it contains varieties both in the North and in the South.Especially the northern varieties of Moerkerke and Wingene are found west ofthe West Flanders/East Flanders provincial border, while on the map of Daanthe northern part of group 10 is only found east of the provincial border. Ourresults suggest that the Flemish language geographers judge the borders of group10 too narrowly.
The group of remaining western varieties corresponds with group 9 in Daan’smap. A closer division of this area is not given. In our dendrogram the clusterNieuwkerke . . . Alveringem contains varieties easterly along the French Flanders/West Flanders border. Going one level deeper, the cluster Brugge . . . Houthulstcontains the other West Flanders varieties, while the cluster Bollezeele . . . Honde-gem contains the varieties in French Flanders. On the original map of Daanthe area of French Flanders is shaded, which suggested some contrast to WestFlanders. Our dendrogram show that the varieties on both sides of the politicalborder were rather strongly related when the RND recordings were made.
The cluster Nieuwkerke . . . Alveringem appears as a transition zone betweenthe Belgian and the French varieties. At first glance the special position of Veurneand Alveringem may be explained by transcriber differences (see Figure 9.3), butsince these varieties form one cluster with Nieuwkerke, we rather think that thiscluster represents a transition area.
9.4.11 Zeeland
The Zeeland varieties belong for the greater part to group 7 in the map of Daan.The dendrogram is shown in Figure 9.26. The locations of the varieties can befound in the map in Figure 9.24.
In the dendrogram, Breskens is most distinct from the other varieties. On themap of Daan, this variety belongs to group 9, i.e. the dialect of West Flandersand Zeeuws-Vlaanderen. However, it may be possible that the dialect of Breskens

262 CHAPTER 9. MEASURING DUTCH DIALECT DISTANCES
NieuwkerkeVeurne
AlveringemBrugge
OostendeBlankenberge
OostkampDamme
RoeselareMoorslede
GitsGistel
BekegemWoestenReninge
OostkerkeMiddelkerke
HouthulstBollezeele
Kapelle-BroekWarhem
SteenbeekHondegemMoerkerke
WingeneBellegem
ZwevegemKortrijk
IngooigemWaregem
Figure 9.25: Subtree of the dendrogram in Figure 9.5, representing the WestFlanders group.
BreskensKapelle
WestkapelleRenesseZierikzee
GoesMiddelharnis
Middelburg
Figure 9.26: Subtree of the dendrogram in Figure 9.5, representing the Zeelandgroup.

9.4. CLASSIFICATION PER SUBGROUP 263
was much more strongly influenced by the Zeeland varieties than other dialectsin the same region. This can be explained by the regular ferry lines betweenBreskens and Vlissingen which started in 1828 and ended only in 2003 when atunnel connection was completed. Apart from Breskens, the varieties of Goes andZierikzee form the core in the dendrogram while the other varieties are clusteredwith them one by one. No clear division per peninsula or island can be found inthe dendrogram.
9.4.12 Limburg
The varieties in our Limburg group are found in the western part of group 14and in the northern and eastern part of group 17 in Daan’s map. The division ofthe Limburg varieties is found in the dendrogram in Figure 9.27. The locationsof the varieties are shown in the map in Figure 9.17.
In the dendrogram we first find a cluster that excludes the varieties of Steen-bergen and Helmond. Steenbergen is found in Noord-Brabant and close to Zee-land (see the map in Figure 9.22). In the two dialects, the uvular [ö] is mainlyused, but the varieties are geographically located among varieties in which the al-veolar [r] is used. In the two varieties, the uvular [ö] is mainly used. In the directsurroundings of Helmond the alveolar [r] is used, but this dialect is geographicallyrather close to the Limburg area, where the use of the uvular [ö] is common. Inthe direct surroundings of Steenbergen the alveolar [r] is used as well, but also ingeographically rather distant varieties the alveolar [r] is still used. However, thepronunciation of the /r/ cannot be a sufficient explanation. The [ö] is also used inthe varieties of Amersfoort and Ravensbergen, which are located among varietiesin which the [r] is used (see Figure 9.20). These two varieties do not deviateso strongly from their geographic neighbours in the dendrogram. Therefore, wecannot explain why the Steenbergen dialect is found in the Limburg group, butconjecture that it has to do with migration.
Going one level deeper, the position of Bree is striking. This cannot explainedby transcriber differences with certainty since in that case a stronger relation withBudel was expected (compare Figure 9.3). Apart from Bree, we find a northerncluster Budel . . . Tegelen and a southern cluster Horn . . . Meerssen.
In the northern cluster, we find a western cluster with the varieties of Budeland Overpelt, and a northeastern cluster Rijkevoort . . . Tegelen. Consideringthe varieties of Budel and Overpelt, we see that Budel is found at the Dutchside of the state boundary, and Overpelt at the Belgian side. The cluster of thetwo varieties forms the northwestern part of group 17 on the map of Daan. Theborder between these two varieties and the south Gelderland/east Utrecht/eastNoord-Brabant cluster in the group of central Dutch varieties (see Section 9.4.7)corresponds with both the western part of the border between group 13 and 14in Daan’s map and the transcriber border.

264 CHAPTER 9. MEASURING DUTCH DIALECT DISTANCES
It is striking that our northeastern cluster does not belong to group 17 (theLimburg dialects) but to group 14 (dialects of Noord-Brabant and northernLimburg) in Daan’s map (see Figure 9.2). In the map of Daan this northeasterncluster is not found as a separate area, it is only a part of group 14. However, inthe map of Te Winkel (1901) the eastern part of group 14 is suggested to be a sep-arate dialect area, labeled as ‘Saksisch-Oostfrankisch’ (Saxon-East Franconian).The southern part of this area corresponds with our northeastern group, althoughthe southern border of our cluster is found more south. Our more southern bor-der coincides with a transcriber border. The western and northern border ofthe northeastern cluster also coincides with a transcriber border, with the ex-ception of Meijel which was is found in the south Gelderland/east Utrecht/eastNoord-Brabant cluster in the group of central Dutch varieties. In contrast to thedialects in the dendrogram of the Limburg group, in the dialect of Meijel mainlythe alveolar [r] is used rather than the uvular [ö]. The western border is alsofound in the map of Te Winkel (1901).
The southern cluster is a part of group 17 of the map of Daan. The southernpart of the southern cluster is bounded on the west side by the state boundarywhich coincides almost with the Maas river. On the west side of this boundary,our Southwest Limburg group is found (see Section 9.4.5). However, this border isnot found on the map of Daan. On the one hand, this is a transcriber border, buton the other hand, this boundary is also found in the map of Te Winkel (1901).As mentioned in Section 9.4.5 the border coincides with an [r]/[ö]-isogloss.
9.4.13 Northeast Luik
The northeast Luik group covers the furthest southeastern part of group 17 inDaan’s map. The dendrogram is given in Figure 9.28. The locations of thevarieties can be found in the map in Figure 9.17. The varieties of Aubel, Baelen,Eupen and Raeren are actually found south of group 17 and belong to the provinceof Luik. Aubel and Baelen belong to the French language area, and Eupen andRaeren belong to the German language area.
When considering group 17 in the map of Daan it may be unexpected that thevarieties in this group do not form one group with the varieties in the Limburggroup. However, it is known that the situation in Limburg is complex, andthe varieties do not form a homogeneous group (Hoppenbrouwers and Hoppen-brouwers, 2001, p. 187). Most varieties in our Northeast Luik group are foundeast of the isogloss that represents the opposition between zeggen ‘to say’ (west,the [E] is used) and sagen (east, the [a] is used, see the map in Goossens (1977)on p. 21 and 60). In the dendrogram, we find a western cluster ’s-Gravenvoeren. . . Eupen, and an eastern cluster Raeren . . . Kerkrade. The division in these twoclusters perfectly reflects the Benratherlinie. This isogloss represents the oppos-ition between Dutch/Low German maken ‘to make’ (west, the [k] is used) andHigh German machen (east, the [x] is used). The dialects west of the Benrather-

9.4. CLASSIFICATION PER SUBGROUP 265
SteenbergenHelmond
BudelOverpelt
RijkevoortVenray
WanssumVenlo
TegelenHorn
SusterenBornEcht
KinrooiSittard
BeekMeerssen
Bree
Figure 9.27: Subtree of the dendrogram in Figure 9.5, representing the Limburggroup.
’s-GravenvoerenAubel
BaelenEupen
RaerenVaals
Kerkrade
Figure 9.28: Subtree of the dendrogram in Figure 9.5, representing the NortheastLuik group.

266 CHAPTER 9. MEASURING DUTCH DIALECT DISTANCES
linie belong to the East Limburg-Ripuarisch transition zone and the dialects eastof the Benratherlinie belong to Ripuarisch, a dialect area around the Germancity of Cologne (see the maps in Goossens (1977) on p. 21 and 60 again).
9.5 Continuum
9.5.1 Multidimensional scaling
In addition to cluster analysis, we also applied multidimensional scaling to thedistances between the 360 RND varieties (see Section 6.2). It appears that onedimension explains 36% of the variance, two dimensions 52%, three dimensions88%, four dimensions 92%, five dimensions 95%, six dimensions 96% and sevendimensions 97%. These percentages make clear that a rather good representationis already obtained when using three dimensions. When using more dimensionsonly a rather small improvement of the variance is obtained. Therefore, weexamine the three-dimensional solution.
Examining the three dimensions, we found that the first dimension distin-guishes between Frisian and Low Saxon varieties on the one hand (low values),and Low Franconian varieties on the other hand (high values). The second di-mension distinguishes between Frisian on the one hand (low values), and LowFranconian (high values) and Low Saxon (even higher values) on the other hand.The town Frisian varieties and the dialect of het Bildt are intermediate betweenFrisian and Low Franconian, but they are closer to Low Franconian than toFrisian in this second dimension. The Stellingwerf varieties are intermediatebetween Frisian and Low Saxon, but they are closer to Low Saxon than to Frisian.The third dimension divides the Low Franconian varieties in three groups. Thefirst group (low values) contains the Dutch Limburg varieties. The second group(mean values) contains varieties in Belgian Limburg, Brabant, Antwerpen andthe greater part of the Netherlandic Low Franconian area. The third group (highvalues) contains varieties in East Flanders, West Flanders and also some Zee-land varieties. The third dimension does not divide either the Frisian or the LowSaxon varieties, all of them belong to the second group.
We investigate which phenomena are especially responsible for each dimen-sion. For this purpose we calculate distances between varieties per dimension.When e.g. two varieties have respectively the values x and x′ in a dimension, thedistance is equal to |x − x′|. In this way, for each pair of varieties the distancefor one dimension is found. Having 360 varieties, we get (360× 359)/2 distances.In Section 5.1 we explained how we applied Levenshtein distance using transcrip-tions. Using Levenshtein distance, a distance matrix can be obtained, contain-ing Levenshtein distances between the different pronunciations of one particularword. This matrix also contains (360× 359)/2 distances.

9.5. CONTINUUM 267
When we have calculated multidimensional scaling distances per dimension onthe one hand, and Levenshtein distances per word on the other hand, the two sortsof distances can be correlated. The stronger the Levenshtein distances correlatewith the distances of one dimension, the more the variation of the correspondingword contributed to the values of that dimension. For each of the 125 words wecalculated the Levenshtein distances between the 360 varieties. This results in 125matrices. Subsequently, each of the matrices was correlated with the distancesderived from the first, second and third dimension, respectively.
It appears that the distances in the first dimension correlate strongest withdistances obtained on the basis of equivalents for waren ‘were’ (r = 0.70). Thevariation of this word is shown in the map in Figure 9.29. In the north we findforms like [Va:rn
"] or [VAdn
"] and in the south forms like [Va;r@], [wU;r@] or [wa;ö@].
In the furthest southwest, we find forms like [wAfirn] or [wU;ön]. So the forms inthe north and in the furthest southwest end on [n] or [n
"] and the forms in the
south on [@]. In some other strongly correlating words, the same phenomenonwas found. We conjecture therefore that the treatment of the weak syllable /@n/is the single most significant dialect marker in Dutch. The two types of endingscorresponds with the division in Frisian and Low Saxon varieties on the one hand(north), and Low Franconian varieties on the other hand (south), as representedby the first dimension. However, the stronger relation between the Low Saxonvarieties and the Low Franconian varieties in the furthest southwest was notfound in the first dimension, which is possibly the main explanation for the factthat a perfect correlation was not found.
Distances in the second dimension correlate strongest with distances obtainedon the basis of equivalents for vader ‘father’ (r = 0.64). The variation of this wordis shown in the map in Figure 9.30. In the northwest we find the Frisian formslike [hEit] and [hAit], and the town Frisian form [vOfl
@d@r]. In the remaining partwe find forms like [va;d@r], [vU;d@r] and [vO;d@ö]. The two different lexical formsclearly correspond with the division between Frisian and non-Frisian varieties asrepresented by the second dimension. Other strongly correlating words representboth lexical and phonological differences.
Distances in the third dimension correlate strongest with distances obtainedon the basis of equivalents for breder ‘broader’ (r = 0.56). The variation of thisword is shown in the map in Figure 9.31. At first glance the word seems to dividethe area in north (using [d]) and south (the [d] is substituted by the [j] or evendeleted). However, the correlation with the distances in the first dimension wasmuch lower (r = 0.27). Another phenomenon that catches the eye is that in mostvarieties the alveolar [r] is used in forms like [bre;d@r], [bre;j@r] or [bri:@]r], whilethe uvular [ö] was used in the Limburg varieties (southeast) in forms as [böE;i@ö].From Figure 4.7 we may conclude that the difference between [r] and [ö] weight

268 CHAPTER 9. MEASURING DUTCH DIALECT DISTANCES
Va>r«
Vi>«n«VAin`ù
VA>rn`
Vi>«n`ù
Vaùrn`
VAs«
Va>r«
wAr«
VAªr«n
Vaùrn`
VAz«n
Vaùn>
V�r«
Vaùrn`
Vaùrn`
VAdn`
VAdn`
w�>rn
wU>{n
wAª>r«
wU>r«
w�>r«
wUùr«
wU>«r«
wAùr«
w�¢>{«
wA>{«
wa>{«
wa>{«
wA£rn
wUùrnwu¢>«r«
wE>«{«w�>{«
h�w
Figure 9.29: Variation of the equivalents for waren ‘waren’. The transcriptionscorrespond with the labels in Figures 9.32 and 9.33. Extra-short sounds are notedin superscript. Distances among 360 Dutch varieties as found on the basis of thefirst dimension of a three-dimensional MDS solution correlate most strongly withdistances obtained on the basis of pronunciations of this word (r = 0.70).

9.5. CONTINUUM 269
va>d«r
hE>ittAªù
v�¢«d«r
hAit
v�£>d«r
va>d«r
va>d«r
vA>d«r
hEit
v8E¢>d«r
va>r
v8a>d«r
v�>d«{
v�>d«r
v8�£ù«r
va>
va>d«{
vU>«d«r
v�>d«{
va>d«r
vU>«d«r
v�¢d«r
vU>d«r
vU>d«r
vAùd«r
v�£>d«r
vad«{
vad«{
v�>d«{
v�>d«r
vU>d«rvu>j«r
v�Ad«{pAp
ba
Figure 9.30: Variation of the equivalents for vader ‘father’. The transcriptionscorrespond with the labels in Figures 9.32 and 9.33. Extra-short sounds are notedin superscript. Distances among 360 Dutch varieties as found on the basis of thesecond dimension of a three-dimensional MDS solution correlate most stronglywith distances obtained on the basis of pronunciations of this word (r = 0.64).

270 CHAPTER 9. MEASURING DUTCH DIALECT DISTANCES
brI£>«d«r
bre>d«rbreùd«r
bre>d«r
brAid«rn`
breij«r
bre>j«r
breùd«
bre>d«r
briùj«r
breùd«r
b{e>j«{
bre£>d«r«
bri>d«r
breùd«r
bre>j«r
brI>d«r
b{EdE{«
bre¢>j«r
briß>r«
bre>j«r«
bre>j«r
bre¢j«r
briùj«r
brE>ij«r
b{e¢>j«{
b{Ei«{
b{E>i«{
brEdr«
wid«rbriù«r
b{i>«d«{b{E>ij«{
Figure 9.31: Variation of the equivalents for breder ‘broader’. The transcriptionscorrespond with the labels in Figures 9.32 and 9.33. Extra-short sounds are notedin superscript. Distances among 360 Dutch varieties as found on the basis of thethird dimension of a three-dimensional MDS solution correlate most strongly withdistances obtained on the basis of pronunciations of this word (r = 0.56).

9.5. CONTINUUM 271
more heavily than the difference between [d] and [j]. The [r]/[ö] distinction dividesonly the southern part of the Dutch language area into two parts: an eastern anda western part. This accords with the third dimension that represents an east-west dimension as well. However, the third dimension distinguishes betweenan east, central and west group, while the [r]/[ö] difference distinguishes onlybetween an east and west area. This difference can be explained by the factthat the third dimension is based not only on the [r]/[ö] difference, but rather onthe aggregate of several phenomena. Nonetheless, the [r]/[ö] difference is one ofthe most important phenomena as appears from the strong correlation. In otherstrongly correlating words the same phenomenon was found as well.
9.5.2 Continuum map
As described in Section 6.2.4 on the basis of the three dimensions of the three-dimensional multidimensional scaling solution, each variety can be representedby a color. The three dimensions determine the intensities of red, green and blue.We used this approach to create a map in which each variety gets its own uniquecolor. We assign the colors to the three dimensions so that the color scheme of ourmap approaches the color scheme in Daan’s map maximally. The first dimensionrepresents the intensity of red, the second dimension inversely the intensity ofblue, and the third dimension inversely the intensity of green.
In Figure 9.32 a color map based on three MDS dimensions is shown. Onthis map dialect points are blown up to small areas until they border each other(see Section 6.2.4). However, dialect islands are not blown up, but representedby diamonds, just as in the map in Figure 9.6. For an explanation about thedialect islands see Section 9.3. To keep a clear picture, the same restricted set oflabels of (in general) better-known locations is printed in the map as in the mapin Figure 9.6.
On the map, the Frisian area (northwest) is represented by bright blue, theLow Saxon area (northeast) is green. The Netherlandic Low Franconian areais colored by different grey shades. Note that the town Frisian varieties (mostdiamonds and the island Ameland north of Leeuwarden) have a color intermediatebetween grey and blue. The same color is found for het Bildt (northwest ofLeeuwarden). The Frisian mixed varieties of Tjalleberd (the higher diamondsouth of Grouw) and Donkerbroek (the diamond intermediate between Grouwand Assen) are more greenish. The ‘pure’ Frisian variety of Appelscha (west ofAssen) is colored blue, just as are the other ‘pure’ Frisian varieties. Turning nowto the southern part of the Low Franconian area, the West Flanders varieties(in the furthest southwest) are colored darker red, the East Flanders varieties

272 CHAPTER 9. MEASURING DUTCH DIALECT DISTANCES
Den Burg
SchiermonnikoogOosterend
Leeuwarden
Grouw
Groningen
Heerhugowaard
Haarlem
Delft
StaverenSteenwijk
Urk
Hattem
Amersfoort
Assen
Emmen
Itterbeck
Lochem
Brugge
Veurne
Middelburg
Gent
Vianen
Zevenbergen
Kalmthout
Mechelen
Groesbeek
Helmond
Venlo
Overpelt
Roeselare
SteenbeekGeraardsbergen Tienen
Kerkrade
Aubel
Figure 9.32: Dialect variation represented by color. The first MDS dimensionis mapped to red, the second inversely to blue and the third inversely to green.Kruskal’s Non-metric MDS is used (see Section 6.2.2). Each of the dialect pointsis blown up to a small area, except the dialect islands that are marked withdiamonds.

9.5. CONTINUUM 273
Den Burg
SchiermonnikoogOosterend
Leeuwarden
Grouw
Groningen
Heerhugowaard
Haarlem
Delft
StaverenSteenwijk
Urk
Hattem
Amersfoort
Assen
Emmen
Itterbeck
Lochem
Brugge
Veurne
Middelburg
Gent
Vianen
Zevenbergen
Kalmthout
Mechelen
Groesbeek
Helmond
Venlo
Overpelt
Roeselare
SteenbeekGeraardsbergen Tienen
Kerkrade
Aubel
Figure 9.33: Dialect variation represented by color. The first MDS dimensionis mapped to red, the second inversely to blue and the third inversely to green.Kruskal’s Non-metric MDS is used (see Section 6.2.2). The color of intermediatepoints is determined by interpolation using Inverse Distance Weighting. Dialectislands are marked with a diamond. They are not involved in the interpolationprocess.

274 CHAPTER 9. MEASURING DUTCH DIALECT DISTANCES
(around Gent) bright red. The Antwerpen area (around and south of Kalmthout)is greyish red, the Belgian Brabant area lighter red. The varieties in the southernpart of Limburg are colored lighter green. In the map the colors of the diamondsof Steenbergen (west of Zevenbergen) and Helmond are a little bit more likethe colors of the Limburg varieties. However, they do not contrast as stronglywith their surroundings as might be expected on the basis of the findings inSection 9.4.12. Although results of cluster analysis and multidimensional scalingare in accordance with each other in general, this example shows that minordifferences can be found. Therefore, it is useful to show results obtained withboth techniques. Broadly speaking our color map is similar to the map of Daan.
In Figure 9.33 a map is given that is related to the map in Figure 9.32.However, in this map the space between the points is colored on the basis ofMDS values which are found by interpolation using Inverse Distance Weighting(see Section 6.2.4 again). This map consequently does justice to the idea that thedialect landscape may be regarded as a continuum. Dialect islands are of coursenot involved in the interpolation process.
9.6 Relation to Standard Dutch
In the same way as distances are calculated between dialects, distances betweendialects and a standard language can be calculated. For the RND material wecalculated distances with respect to Standard Dutch. The results are shown inFigure 9.34. In the map the dialects are colored according to the rainbow. Themost similar dialects are red, followed by orange, yellow and green and lighterblue. The dark blue dialects are most distant.
Exactly in accordance with the general opinion, Haarlem is closest to StandardDutch. The dialect has a distance of 14.7%. The way in which percentages arefound is explained in the Sections 5.1.8 and 5.1.10. Haarlem was followed byBrielle (16.8%, south of Delft), Hoorn (16.9%, east of Heerhugowaard), Warmond(17.0%, south of Haarlem), Heemskerk (17.2%, north of Haarlem) and Vianen(17.5%).
Most distant was the dialect on the island Schiermonnikoog, north of theborder between Friesland and Groningen. The variety has a distance of 44.9%.Although the Schiermonnikoog variety is Frisian, we found in Section 9.4.1 thatit has a distinct position among the other Frisian varieties. However, Schiermon-nikoog is followed by the other (‘pure’) Frisian varieties. The ‘pure’ Frisian vari-ety most like Standard Dutch was West-Terschelling (40.9%, west of Oosterend).This may be explained by the fact that the island Terschelling belonged to theprovince of Noord-Holland until 1942. The high percentages for the Frisian vari-eties may justify the fact that Frisian is recognized as a second official language

9.6. RELATION TO STANDARD DUTCH 275
in the Netherlands. The dialects of het Bildt, the Frisian cities, Midsland, andAmeland Island are clearly less distant from Standard Dutch. Most distant wasFraneker (33.0%, west of Leeuwarden), most similar was Hollum (29.5%, on theisland Ameland north of Leeuwarden).
Besides Frisian, four Limburg dialects were also very distant to StandardDutch: Vaals (43.2%, south of Kerkrade), Kerkrade (42.2%), Raeren (41.8%,south of Vaals) and Aubel (41.6%). Also in the West-Flemish dialect area wefound distant dialects: Alveringem (42.3%, south of Veurne), Warhem (41.0%,southwest of Veurne), Reninge (40.9%, southeast of Alveringem) and Veurne(40.7%). In the province of Overijssel, we found the dialects of Vriezenveen(41.8%), Rijssen (40.8%) and Wierden (40.4%, the three dialects are found south-west of Itterbeck) to be rather distant. The special position of Vriezenveen wasalready found in Section 9.4.4. Although the Groningen dialects belong to themore distant dialects (indicated by lighter blue), they are not as distinct as forexample the Frisian varieties and the four Limburg varieties that we mentionedabove. Most distant were Finsterwolde (41.0%, east of the city of Groningen)and Onstwedde (40.4%, east of Assen).
In Hoppenbrouwers and Hoppenbrouwers (2001) the authors also discuss aranking with respect to Standard Dutch (pp. 124–131). Distances are obtainedby means of the feature frequency method (see Section 2.3.2). The scores in therank order list are divided into 23 intervals. Frisian is found in interval 5 and6, which suggest that Frisian is rather close to Standard Dutch. Town Frisianvarieties are not obviously closer to Standard Dutch than ‘pure’ Frisian varieties,both are found in interval 5 and 6. This is clearly different from our results,where the ‘pure’ Frisian varieties form a group of the most distant varieties,while the town Frisian varieties are obviously more related to Standard Dutch(see Figure 9.34: darker blue versus green). In the results of Hoppenbrouwersand Hoppenbrouwers the Groningen dialects are found in the intervals 13, 15 and16, suggesting that they are much more distant than the Frisian varieties. In ourresults, both, Frisian and Groningen dialects are rather distant, but Frisian ismore distant (Figure 9.34: darker blue versus lighter blue). Our results agreewith those of Hoppenbrouwers and Hoppenbrouwers that the dialect of Kerkradeand neighboring varieties belong to the most distant ones.
The comparison of our results with those of Hoppenbrouwers and Hoppen-brouwers shows that the use of Levenshtein distance gives different results thanthe feature frequency method. Especially when looking at the Frisian dialects,our results are much more in accordance with the prevailing opinion and espe-cially the opinion of the Frisians themselves. Using the Levenshtein distance,words are regarded as linguistic units while the order of segments in a word isalso considered. The example of the Frisian underscores the importance of thesetwo aspects.

276 CHAPTER 9. MEASURING DUTCH DIALECT DISTANCES
Den Burg
SchiermonnikoogOosterend
Leeuwarden
Grouw
Groningen
Heerhugowaard
Haarlem
Delft
StaverenSteenwijk
Urk
Hattem
Amersfoort
Assen
Emmen
Itterbeck
Lochem
Brugge
Veurne
Middelburg
Gent
Vianen
Zevenbergen
Kalmthout
Mechelen
Groesbeek
Helmond
Venlo
Overpelt
Roeselare
SteenbeekGeraardsbergen Tienen
Kerkrade
Aubel
Distance to Standard Dutch:
14.7%22.3%29.8%37.4%44.9%
Figure 9.34: Distances with respect to Standard Dutch. The color between thesample points was found by interpolation. Diamonds represent dialect islands.Most close to Standard Dutch is Haarlem (14.7%), most distant was Schiermon-nikoog (44.9%).

9.7. CONCLUSIONS 277
9.7 Conclusions
We calculated distances between 360 Dutch varieties. Data was taken from theRND. We compared the results with Daan’s map (see Figure 9.2). However,since the RND was compiled by 16 different transcribers, we also kept track oftranscriber borders (see Figure 9.3).
Comparing our division of the main 13 dialect groups with the map of Daan,we found similarities and differences. We found that especially our Groningenand Overijssel group and our group of central Dutch varieties were divided intodifferent groups in the map of Daan. The opposite result was also found. TheLimburg group in the map of Daan was divided into three different groups on ourmap. We explain the differences by the different weighting of dialect contrasts bydialect speakers, whose judgements formed the basis of Daan’s divisions. Socialand economic structures may influence judgements of dialect similarity. Further-more, in a homogeneous area differences can be more easily identified than ina heterogeneous area. This may explain why e.g., the Overijssel area is dividedinto several groups in the map of Daan while the Limburg area is found to beone group.
Both when examining the 13 groups and when examining each of the groupsin more detail, we find real dialect borders and transcriber borders. Sometimes,dialect borders and transcriber borders nearly coincide. For these borders noobvious conclusion can be drawn. Although transcriber differences were normal-ized to some extent, we did not succeed in eliminating them fully, as appearsin the results. Normalizing transcriber differences is risky, since it is not alwaysclear whether differences in notation reflect transcriber differences or dialect dif-ferences. Advisable future work would be to calculate distances between Dutchvarieties again on the basis of data from the Fonologische Atlas Nederlandse Dia-lecten (FAND) (Goeman and Taeldeman, 1996; Goossens et al., 1998, 2000). Thismaterial is known to be of higher quality.
We also calculated distances with respect to Standard Dutch. Just as inHoppenbrouwers and Hoppenbrouwers (2001) we found the dialect of Haarlem tobe most similar to Standard Dutch. In our results, the Frisian varieties were mostdistant, while in the results of Hoppenbrouwers and Hoppenbrouwers (2001) theFrisian varieties were relatively related to Standard Dutch. We think that ourresults are most in accordance with linguistic reality and with general opinion.This difference shows that it is important to regard words as linguistic units andto consider the order of segments in word pronunciation. With the Levenshteindistance used in our research these two aspects are taken into account.

278 CHAPTER 9. MEASURING DUTCH DIALECT DISTANCES