Embed Size (px)
Citation preview
University of Groningen
Evaluating the social outcomes of inclusive educationKoster, Marloes
IMPORTANT NOTE: You are advised to consult the publisher's version (publisher's PDF) if you wish to cite fromit. Please check the document version below.
Document VersionPublisher's PDF, also known as Version of record
Publication date:2008
Link to publication in University of Groningen/UMCG research database
Citation for published version (APA):Koster, M. (2008). Evaluating the social outcomes of inclusive education: a study on the social participationof pupils with special needs in regular primary education and the development of a teacher questionnaire.s.n.
CopyrightOther than for strictly personal use, it is not permitted to download or to forward/distribute the text or part of it without the consent of theauthor(s) and/or copyright holder(s), unless the work is under an open content license (like Creative Commons).
Take-down policyIf you believe that this document breaches copyright please contact us providing details, and we will remove access to the work immediatelyand investigate your claim.
Downloaded from the University of Groningen/UMCG research database (Pure): http://www.rug.nl/research/portal. For technical reasons thenumber of authors shown on this cover page is limited to 10 maximum.
Download date: 20-04-2020
Evaluating the social outcomes of inclusive education
a study on the social participation of pupils with special needs in regular primary education
and the development of a teacher questionnaire
Marloes Koster
Colofon
Evaluating the social outcomes of inclusive education
a study on the social participation of pupils with special needs in regular primary
education and the development of a teacher questionnaire
Marloes Koster Proefschrift Rijksuniversiteit Groningen
ISBN 978-90-367-3581-0
Ontwerp en illustratie omslag: Hester Nijhoff
Drukwerk: Gildeprint Drukkerijen, Enschede
RIJKSUNIVERSITEIT GRONINGEN
Evaluating the social outcomes of inclusive education
a study on the social participation of pupils with special needs in regular primary education and the development of a teacher questionnaire
Proefschrift
ter verkrijging van het doctoraat in de
Gedrags- en Maatschappijwetenschappen
aan de Rijksuniversiteit Groningen
op gezag van de
Rector Magnificus, dr. F. Zwarts,
in het openbaar te verdedigen op
donderdag 20 november 2008
om 13.15 uur
door
Marloes Koster
geboren op 6 april 1980
te Rotterdam
Promotores: Prof. dr. H. Nakken
Prof. dr. S.J. Pijl
Copromotor: Dr. E.J. van Houten-van den Bosch
Beoordelingscommissie: Prof. dr. P.P.M. Leseman
Prof. dr. A.J.J.M. Ruijssenaars
Prof. dr. M.P.C. van der Werf
CONTENTS
5
Contents
CONTENTS ................................................................................................ 5
CHAPTER 1 GENERAL INTRODUCTION .......................................................... 9
1.1 Introduction .................................................................................... 10
1.2 Historical background of educating pupils with special needs: from segregation to inclusive education ........................................................... 12
1.3 Changes in educational policy in the Netherlands ................................. 13
1.4 The social dimension of inclusive education......................................... 15
1.5 Outline of the thesis......................................................................... 17
1.6 References...................................................................................... 18
CHAPTER 2 THE SOCIAL POSITION AND DEVELOPMENT OF PUPILS WITH A PUPIL-BOUND BUDGET IN REGULAR DUTCH PRIMARY SCHOOLS.................... 23
Abstract ............................................................................................... 24
2.1 Introduction .................................................................................... 25
2.2 Method........................................................................................... 28 2.2.1 Introduction.......................................................................................................28 2.2.2 Subjects ............................................................................................................28 2.2.3 Interviews and questionnaires..............................................................................29 2.2.4 Data analyses ....................................................................................................31
2.3 Results ........................................................................................... 32 2.3.1 Subjects ............................................................................................................32 2.3.2 Social position....................................................................................................33 2.3.3 Cognitive, social and social-emotional development ................................................38
2.4 Independent assessors’ judgments .................................................... 39 2.4.1 Reliability of assessments ....................................................................................39 2.4.2 Assessment of cognitive, social and social-emotional development ...........................41 2.4.3 Relation between rejected status and assessment of development............................41
2.5 Discussion ...................................................................................... 42
2.6 References...................................................................................... 45
CHAPTER 3 BEING PART OF THE PEER GROUP: A LITERATURE STUDY FOCUSING ON THE SOCIAL DIMENSION OF INCLUSION IN EDUCATION ......................... 49
Abstract ............................................................................................... 50
3.1 Introduction .................................................................................... 51
3.2 Research method............................................................................. 52
3.3 Selecting the literature ..................................................................... 53
3.4 Social integration............................................................................. 54 3.4.1 Explicit definitions of social integration ..................................................................54 3.4.2 Implicit definitions of social integration..................................................................55 3.4.3 Summary of the definitions of social integration .....................................................57
3.5 Social inclusion................................................................................ 61 3.5.1 Summary of the definitions of social inclusion ........................................................62
CONTENTS
6
3.6 Social participation........................................................................... 64 3.6.1 Summary of the definitions of social participation ...................................................65
3.7 Other related concepts ..................................................................... 67 3.7.1 Summary of the definitions of other related concepts ..............................................68
3.8 Conclusion ...................................................................................... 71
3.9 Discussion ...................................................................................... 73
3.10 References .................................................................................... 75
CHAPTER 4 ASSESSING SOCIAL PARTICIPATION OF PUPILS WITH SPECIAL NEEDS IN INCLUSIVE EDUCATION: THE CONSTRUCTION OF A TEACHER QUESTIONNAIRE...................................................................................... 83
Abstract ............................................................................................... 84
4.1 Introduction .................................................................................... 85
4.2 Construction of the social participation questionnaire ........................... 89 4.2.1 Method..............................................................................................................89 4.2.2 Selection of statements through consultation of a panel ..........................................89 4.2.3 Final selection of statements through assessment by a group of respondents.............90
4.3 Assessing the quality of the questionnaire........................................... 94 4.3.1 Method..............................................................................................................94 4.3.2 Results..............................................................................................................97
4.4 Discussion ...................................................................................... 99
4.5 References.....................................................................................103
CHAPTER 5 EXAMINATION OF THE PSYCHOMETRIC QUALITIES OF THE SOCIAL PARTICIPATION QUESTIONNAIRE..............................................................107
Abstract ..............................................................................................108
5.1 Introduction ...................................................................................109
5.2 Method..........................................................................................110 5.2.1 Participants......................................................................................................110 5.2.2 Instrument ......................................................................................................114 5.2.3 Analysis...........................................................................................................116
5.3 Results ..........................................................................................118 5.3.1 Mokken Scale Analysis ......................................................................................118 5.3.2 Separability of the subscales ..............................................................................121 5.3.3 Revised version of the Social Participation Questionnaire .......................................122 5.3.4 Discriminant validity .........................................................................................124
5.4 Discussion .....................................................................................126
5.5 References.....................................................................................128
CHAPTER 6 VALIDATION OF THE SOCIAL PARTICIPATION QUESTIONNAIRE ...133
Abstract ..............................................................................................134
6.1 Introduction ...................................................................................135
6.2 Method..........................................................................................137 6.2.1 Respondents ....................................................................................................138 6.2.2 Instruments.....................................................................................................140 6.2.3 Procedure ........................................................................................................144 6.2.4 Analysis...........................................................................................................147
6.3 Results ..........................................................................................149
CONTENTS
7
6.3.1 Convergent validity of the four subscales.............................................................149 6.3.2 Second order analysis .......................................................................................150
6.4 Discussion .....................................................................................153
6.5 References.....................................................................................156
CHAPTER 7 SOCIAL PARTICIPATION OF PUPILS WITH SPECIAL NEEDS IN REGULAR DUTCH PRIMARY EDUCATION.....................................................163
Abstract ..............................................................................................164
7.1 Introduction ...................................................................................165
7.2 Method..........................................................................................167 7.2.1 Introduction.....................................................................................................167 7.2.2 Respondents ....................................................................................................167 7.2.3 Instruments to assess key themes......................................................................169 7.2.4 Analysis...........................................................................................................171
7.3 Results ..........................................................................................172
7.4 Discussion .....................................................................................178
7.5 References.....................................................................................181
CHAPTER 8 GENERAL DISCUSSION ...........................................................187
8.1 Introduction ...................................................................................188
8.2 Main findings..................................................................................189 8.2.1 First experiences with the pupil-bound budget......................................................189 8.2.2 Construction of a model of social participation and developing a teacher questionnaire..............................................................................................................................190 8.2.3 Current situation regarding social participation of pupils with special needs..............191
8.3 Reflections on the study ..................................................................191
8.4 Implications of the study .................................................................195 8.4.1 Implications for educational policy ......................................................................195 8.4.2 Implications for teacher training .........................................................................196
8.5 Further research.............................................................................197
8.6 References.....................................................................................198
SUMMARY ..............................................................................................203
SAMENVATTING......................................................................................207
DANKWOORD .........................................................................................213

CONTENTS
8
Chapter 1 General introduction
CHAPTER 1
General introduction
CHAPTER 1
10
1.1 Introduction
For a long time it was assumed that pupils with special needs would not be able
to attend regular schools and that it was better to send them to special ones
(Pijl, 1997). Consequently, many countries had a system of special education
consisting of different types of special schools aiming at pupils with various types
of disabilities. Special education settings were viewed as possessing various
advantages, like lower teacher-pupil ratios, specially trained teachers, greater
individualisation of instruction in homogeneous classrooms and an increased
curricular emphasis on social and vocational goals (Johnson, 1962, in Kavale &
Forness, 2000).
However, the segregation of pupils with special needs came increasingly
into question as many of the presumed advantages could not be proved in
practice. For instance, Gartner and Lipsky (1987) concluded, on the basis of 50
studies concerning the academic performances of mainstreamed and segregated
pupils with disabilities, that there was no significant evidence that separate
special education programmes offered any significant benefits for these pupils.
On the contrary, academic achievement of segregated pupils with disabilities was
even lower compared to that of their counterparts in regular education settings.
Baker, Wang and Walberg (1994) came to similar conclusions after having
summarised the results of several studies on the effects of inclusion on pupils’
learning performances. They found that in the majority of cases, pupils with
special needs educated in regular classes performed better academically than
their counterparts in special settings (Baker et al., 1994). According to Rea,
McLaughin and Walther-Thomas (2002), findings regarding academic
achievement and social outcomes of pupils with learning disabilities are not
conclusive but suggest a positive trend when these pupils are integrated into
general education classrooms. In line with these findings, Kavale and Forness
(2000) state that empirical evidence about the efficacy of special education
continues to be equivocal.
It should be kept in mind that the above-mentioned results apply largely to
pupils with learning disabilities, as studies comparing performances in regular
and special education settings often aim at these pupils. Such comparative
studies are relatively rare for pupils with other categories of disabilities.
GENERAL INTRODUCTION
11
The lack of satisfactory academic performance by pupils in segregated
settings (in particular pupils with learning disabilities), combined with growing
demands for social equity and civil rights and increasing costs of special
education, prompted a drastic reconsideration of the special education delivery
system in the mid 1980s (Rea et al., 2002). Next to academic advantages, civil-
rights aspects of inclusion were emphasised. Segregating pupils with special
needs was increasingly considered as a violation of a pupil’s right to be educated
with typical peers in age-appropriate settings (Fisher, Roach & Frey, 2002; Rea
et al., 2002). Inclusive education was championed as a means to remove
barriers, improve outcomes and avoid discrimination (Lindsay, 2003).
As a result of this change in ideas about special-needs education, including
pupils with special needs into regular education became, and still is, an important
educational policy in many countries. Next to complying with children’s right to
be educated with their typical peers in public schools and improving academic
performance, increasing the social participation of pupils with special needs is a
major goal of inclusive education. Parents often report the latter as being their
first motive for sending their child to a regular school (Sloper & Tyler, 1992;
Strayhorn & Strain, 1986). However, successful social participation of pupils with
special needs turns out to be no matter of course. Research has repeatedly
shown that making friends and building positive relationships with classmates
can be difficult for these pupils. They often have a lower social position in the
classroom and report higher loneliness scores than their typical peers. Since
these negative social experiences can influence a child’s further development, it
is important to monitor the social participation of pupils with special needs.
Teachers can have an important role in the monitoring process.
This study tries to provide assistance for teachers to monitor the social
participation of pupils with special needs. Before proceeding to present the
design and aims of the study, this introductory chapter will briefly discuss the
historical background of educating pupils with special needs. The world-wide
trend from segregation towards inclusive education will be described. In addition,
attention will be paid to the Dutch educational policy with regard to pupils with
special needs and to the social dimension of inclusive education.
CHAPTER 1
12
1.2 Historical background of educating pupils with special needs: from
segregation to inclusive education
As described in the Introduction section, segregation of pupils with special needs
was increasingly regarded as undesirable, and policymakers grew more and more
convinced that these pupils should be educated alongside their typical peers in
regular schools to the greatest extent possible (Pijl & Meijer, 1994). In many
countries it was assumed that with extra effort pupils with all kinds of special
needs could attend regular schools (Nakken & Pijl, 2002). As a result, in almost
all countries with a system of separate special education, new ideas about the
educational care for these pupils arose, new regulations were introduced and
legislation was amended.
In the nineties, integration and mainstreaming were the terms typically
used to describe the provision allocated to pupils with special needs. Both terms
referred primarily to the physical placement of pupils with special needs in
regular schools (Farrell, 2004; Farrell, 2000; Gottlieb, 1981; Kauffman, 1995, in
Kavale & Forness, 2000). Several countries made an effort to implement policies
that fostered the integration of pupils with special needs (Avramidis & Norwich,
2002). Integration became one of the central themes in education. However,
there was a large variety of ways in which pupils could experience integration,
ranging from occasional visits of special-school pupils to a regular school to full-
time placement in a regular classroom of the local school (Farrell, 2000).
Gradually, the term integration became discredited, as it said nothing about the
quality of education but only about the setting in which a pupil was placed
(Farrell, 2004). Questions about how pupils should be best taught remained
unanswered (Gottlieb, 1981; Kauffman, 1995, in Kavale & Forness, 2000).
The term ‘inclusion’ was introduced as a more accurate way of describing
the quality of education offered to pupils with special needs within an integrated
school setting. Compared to integration, inclusion is a much broader concept that
implies that schools restructure themselves so as to be able to cater to all
children, irrespective of their disabilities or background (Frederickson & Cline,
2002). According to inclusive ideals, inclusive schools should meet the needs of
all pupils (Ferguson, 1996, in Kavale & Forness, 2000) and every pupil should
feel himself/herself as a full member of the school community (Ainscow, 1999, in
Freire & César, 2002). Farrell (2000, pp. 154) expresses these ideals clearly, by
stating that pupils in inclusive schools ‘take a full and active part in school-life,
GENERAL INTRODUCTION
13
are a valued member of the school community and are seen as an integral
member’. The movement towards inclusion has been strongly endorsed
internationally by the Salamanca Statement (UNESCO, 1994, in Ainscow & César,
2006). In recent decades many countries have made efforts to move educational
policy and practice in a more inclusive direction (Freire & César, 2002; Mittler,
2000, in Ainscow & César, 2006).
1.3 Changes in educational policy in the Netherlands
The Netherlands have a long history of separate special education for pupils with
various categories of disabilities (Tadema, 2007). In the early years of the 20th
century, a small-scale system of special schools for various groups of pupils
gradually arose alongside regular education (Den Boer, 1990). Special schools
were legally recognised in 1920, and in the following decades the number of
schools for pupils with special needs increased rapidly (Tadema, 2007). The
result was a wide-ranging system of special education, consisting of 15 different
types of special schools (Meijer, 1994). However, more and more policymakers,
educators and parents believed that segregation in education had gone too far
and became uneasy about the high proportion of pupils being educated in a
segregated system (Pijl & Van den Bos, 2001). Questions arose about the extent
to which pupils profited from separate education (Den Boer, 1990), and in
politics it was increasingly thought that pupils should have the right to be
educated with their typical peers in neighbourhood schools. Moreover, the
ballooning costs of special education were considered as alarming. As a result of
the increasing dissatisfaction about the growth of special education, attempts
were made to promote the integration of pupils with special needs into regular
schools. To put a stop to the growing number of pupils attending special schools,
the Special Education Interim Act (ISOVSO) was put into practice in 1985. The
purpose of the Act was to enable schools to develop themselves into
‘orthopedagogical-educational institutes’ (Den Boer, 1990). Within the context of
this Act, peripatetic supervision, which in fact is a visiting special-teacher model
(Pijl & Meijer, 1991), was made possible. The purpose of this type of supervision
was to stimulate replacing pupils from special schools into regular ones and to
prevent special-education referrals (Boerman & Hoogendoorn, 2002). In addition
to the arrangements for peripatetic supervision, schools were able to apply for
CHAPTER 1
14
extra teaching staff via the Aanvullend Formatie Beleid (Additional Staff Policy).
Pupils with problems who were beyond the scope of the usual regulations but
needed extra support, could make use of this policy (Scheepstra, 1998). For
instance, primary schools who educated pupils with Down Syndrome were
allowed to make an appeal for additional funding under this policy. In 1990 a
new government policy document, Weer Samen Naar School (WSNS, Together to
School Again), was intended to accommodate pupils with special needs in regular
education and to put a stop to the growth of special education (Karsten,
Roeleveld, Peetsma & Vergeer, 2001). Under this policy, all primary schools and
special schools for children who had learning and educational problems or who
had mild intellectual disabilities were grouped into regional clusters. As a result,
regular and special schools in the clusters started to collaborate (Pijl & Van den
Bos, 2001). The WSNS policy aims at pupils with relatively mild special needs.
With the introduction of the Wet op de Expertise Centra (Centres of Expertise
Act) in August 2003, the integration of pupils with more complex special needs
was stimulated.
Since this law came into practice, parents of children with special needs
have the right to choose between regular and special education for their child.
Pupils with auditory, speech/language, motor, intellectual or multiple disabilities
as well as severe behavioural, emotional and/or psychiatric problems can attend
a regular school. This is funded with a pupil-bound budget (financial ‘backpack’).
Only pupils who, on the basis of formal comprehensive assessment procedures,
have been labelled as having special needs, qualify for this budget. The budget
caters for educational personnel and teaching aids. Recent data show that an
increasing number of parents decided to send their child with special needs to a
regular school (De Greef & Van Rijswijk, 2006). Especially the number of pupils
diagnosed as having autistic spectrum and/or behavioural disorders attending
regular education (receiving a pupil-bound budget) grew rapidly, from 1549
pupils in October 2003 to 8055 in October 2005 – a growth of more than 400
percent (Grietens, Ghesquière & Pijl, 2006). However, not only the percentage of
pupils with special needs attending regular education has grown: the percentage
of pupils in special education settings has increased too. Similar to the situation
in regular settings, in special education settings particularly the number of pupils
diagnosed as having autistic spectrum and/or behavioural disorders has
increased drastically (De Greef & Van Rijswijk, 2006). In a period of five years
GENERAL INTRODUCTION
15
(2000 to 2005), the percentage of pupils diagnosed as having these types of
disabilities attending separate special education increased by 55 percent (De
Greef & Van Rijswijk, 2006). It seems that because of earlier and refined
diagnostics, more pupils receive an indication regarding autistic spectrum and/or
behavioural disorders. The same tendency might, to a lesser degree, apply to
pupils diagnosed as having other types of disabilities, as there seems to be an
overall increasing identification of pupils requiring extra services. In conclusion,
the introduction of the pupil-bound budget into the Dutch educational system
seems to have led to a new category of users of extra educational care: pupils
attending regular education, who in former years were deprived from extra
educational care, now qualify for this extra care thanks to the pupil-bound
budget (Grietens et al., 2006).
1.4 The social dimension of inclusive education
Relationships among pupils is a key issue of inclusive education (Pijl, 2007).
Many parents of children with special needs hope and expect the physical
presence of their children to lead to their social participation as well (Scheepstra,
1998; Sloper & Tyler, 1992; Strayhorn & Strain, 1986). They wish their child to
build positive relationships with mainstream pupils. However, reality turns out to
be less favourable. Research has repeatedly shown that inclusion of pupils with
special needs does not automatically lead to an increase of positive contacts and
friendships between these pupils and their typical counterparts (De Monchy, Pijl
& Zandberg, 2004; Guralnick, Connor, Hammond, Gottman & Kinnish, 1996;
Guralnick, Hammond, Connor & Neville, 2006; Guralnick, Neville, Hammond &
Connor, 2007; Lee, Yoo & Bak, 2003; Scheepstra, Nakken & Pijl, 1999). A study
by Frostad and Pijl (2007) of Norwegian inclusive classrooms, comprising pupils
with various categories of disabilities, suggests that nearly one-quarter of pupils
with special needs have serious difficulties in forming relationships in their peer
group, while for their typical peers this is only 8 percent. It is known from
several studies that within the group of pupils with special needs, pupils
diagnosed as having autistic spectrum disorders and pupils diagnosed as having
behavioural disorders find it particularly difficult to build relationships with typical
peers and are at risk of becoming isolated in the classroom (De Monchy et al.,
2004; Garrison-Harrell, Kamps & Kravits, 1997).
CHAPTER 1
16
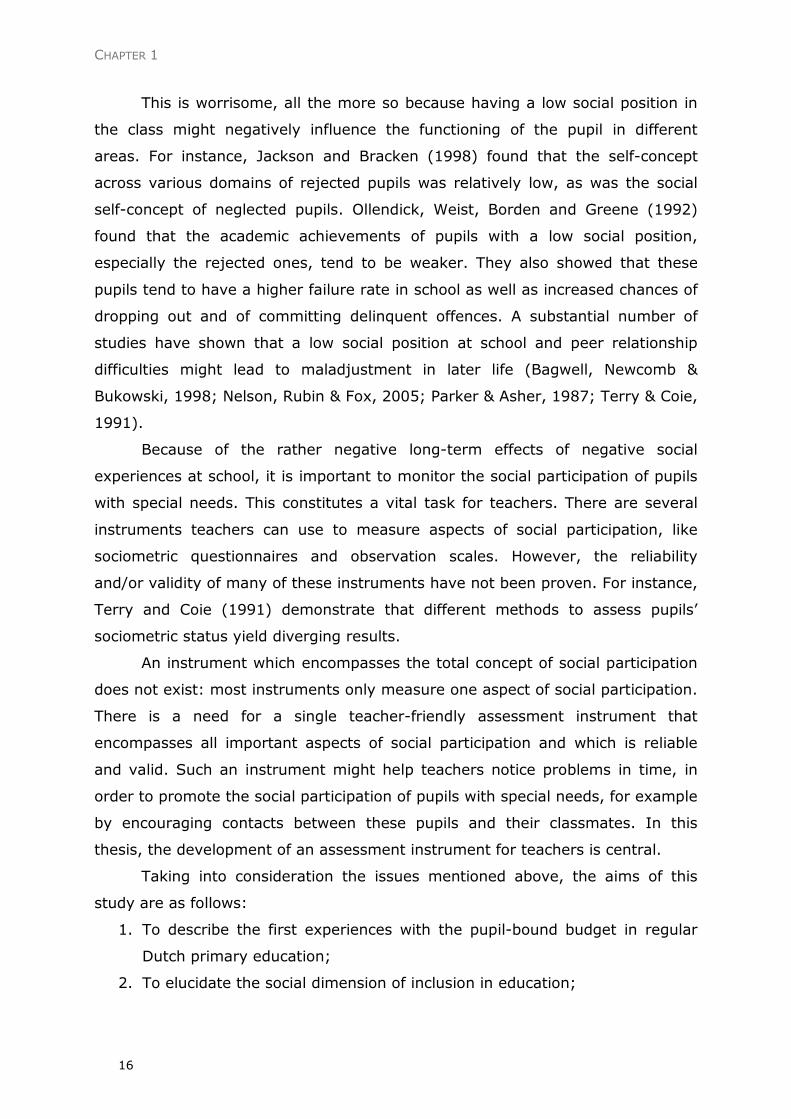
This is worrisome, all the more so because having a low social position in
the class might negatively influence the functioning of the pupil in different
areas. For instance, Jackson and Bracken (1998) found that the self-concept
across various domains of rejected pupils was relatively low, as was the social
self-concept of neglected pupils. Ollendick, Weist, Borden and Greene (1992)
found that the academic achievements of pupils with a low social position,
especially the rejected ones, tend to be weaker. They also showed that these
pupils tend to have a higher failure rate in school as well as increased chances of
dropping out and of committing delinquent offences. A substantial number of
studies have shown that a low social position at school and peer relationship
difficulties might lead to maladjustment in later life (Bagwell, Newcomb &
Bukowski, 1998; Nelson, Rubin & Fox, 2005; Parker & Asher, 1987; Terry & Coie,
1991).
Because of the rather negative long-term effects of negative social
experiences at school, it is important to monitor the social participation of pupils
with special needs. This constitutes a vital task for teachers. There are several
instruments teachers can use to measure aspects of social participation, like
sociometric questionnaires and observation scales. However, the reliability
and/or validity of many of these instruments have not been proven. For instance,
Terry and Coie (1991) demonstrate that different methods to assess pupils’
sociometric status yield diverging results.
An instrument which encompasses the total concept of social participation
does not exist: most instruments only measure one aspect of social participation.
There is a need for a single teacher-friendly assessment instrument that
encompasses all important aspects of social participation and which is reliable
and valid. Such an instrument might help teachers notice problems in time, in
order to promote the social participation of pupils with special needs, for example
by encouraging contacts between these pupils and their classmates. In this
thesis, the development of an assessment instrument for teachers is central.
Taking into consideration the issues mentioned above, the aims of this
study are as follows:
1. To describe the first experiences with the pupil-bound budget in regular
Dutch primary education;
2. To elucidate the social dimension of inclusion in education;
GENERAL INTRODUCTION
17
3. To develop a teacher questionnaire to assess the social participation of
pupils with special needs and to subsequently assess the psychometric
qualities of the questionnaire;
4. To describe the current situation with regard to the social participation of
pupils with special needs in regular Dutch primary schools.
1.5 Outline of the thesis
This thesis is organised into eight chapters. Approaching the first aim, Chapter 2
describes the first experiences with the pupil-bound budget in regular Dutch
primary schools. The focus lies on the social position and development of 20
pupils with special needs who were placed in regular primary schools in the
2003-2004 school year. All pupils, on the basis of formal comprehensive
assessment procedures, have been labelled as having special needs and receive
a pupil-bound budget.
Chapter 3 concerns a literature review that aims at elucidating the social
dimension of inclusion, thereby meeting the second aim. The chapter focuses on
clarifying the often-used concepts of social integration, social participation and
social inclusion, and revealing their characteristic themes. An analysis of
literature was conducted to identify these concepts.
Chapters 4, 5 and 6 are connected with the third aim of the study. The
process of operationalising social participation and the subsequent development
of a teacher questionnaire is central in Chapter 4. The chapter is divided into two
parts. The first focuses on constructing a teacher questionnaire to assess social
participation. The second, empirical part of the study addresses whether that
questionnaire is a potentially reliable and applicable instrument to assess the
social participation of pupils with special needs in regular primary schools.
Chapter 5 addresses the psychometric qualities of the new teacher
questionnaire, named Social Participation Questionnaire, to assess the social
participation of pupils with special needs in regular primary education. The
questionnaire consists of four subscales representing four key themes of social
participation: ‘friendships/relationships’, ‘contacts/interactions’, ‘social self-
perception of the pupil’ and ‘acceptance by classmates’. This fifth chapter focuses
on the psychometric evaluation of the four subscales. In addition, the reliability
CHAPTER 1
18
and the discriminant validity of the entire questionnaire and its subscales are
described.
Chapter 6 aims at validating the Social Participation Questionnaire. More
specifically, the focus lies on the questionnaire’s convergent validity. In order to
examine the convergent validity, four instruments, each focusing on one of the
key themes of social participation, were used. Pupils’ scores on the total
questionnaire and on each of the four subscales were compared with their scores
on these instruments.
Chapter 7 returns to the situation of pupils with special needs in regular
Dutch primary schools, thereby elaborating on Chapter 2. Proceeding from the
fourth aim, Chapter 7 addresses the current state of affairs with regard to the
social participation of pupils with special needs in regular Dutch primary
education. It focuses on the four key themes of social participation:
friendships/relationships, contacts/interactions, social self-perception of the pupil
and acceptance by classmates.
In the final chapter, Chapter 8, conclusions are drawn and several critical
considerations that can be made on the study will be discussed. The chapter
ends with implications for educational policy and practice, and with suggestions
for future research.
1.6 References
Ainscow, M. & César, M. (2006). Inclusive education ten years after Salamanca:
setting the agenda. European Journal of Psychology of Education, 21(3),
231-238.
Avramidis, E. & Norwich, B. (2002). Teachers’ attitudes towards
integration/inclusion: a review of the literature. European Journal of
Special Needs Education, 17(2), 129-147.
Bagwell, C.L., Newcomb, A.F. & Bukowski, W.M. (1998). Preadolescent friendship
and peer rejection as predictors of adult adjustment. Child Development,
69(1), 140-153.
Baker, E.T., Wang, M.C. & Walberg, H.J. (1994). The effects of inclusion on
learning. Educational Leadership, 52(4), 33-36.
Boerman, R.A. & Hoogendoorn, G. (2002). Ambulante begeleiding. Tijdschrift
voor Orthopedagogiek, 41, 90-103.

GENERAL INTRODUCTION
19
De Greef, E.E.M. & Van Rijswijk, C.M. (2006). De groei van deelname aan cluster
4. Opvattingen over oorzaken en groeibeperkende maatregelen. Den
Haag: LCTI.
De Monchy, M., Pijl, S.J. & Zandberg, T.J. (2004). Discrepancies in judging social
inclusion and bullying of pupils with behaviour problems. European Journal
of Special Needs Education, 19(3), 317-330.
Den Boer, K. (1990). Special education in the Netherlands. European Journal of
Special Needs Education, 5(2), 136-149.
Farrell, P. (2004). Making inclusion a reality for all. School Psychology
International, 25(1), 5-19.
Farrell, P. (2000). The impact of research on developments in inclusive
education. International Journal of Inclusive Education, 4(2), 153-162.
Fisher, D., Roach, V. & Frey, N. (2002). Examining the general programmatic
benefits of inclusive schools. International Journal of Inclusive Education,
6(1), 63-78.
Frederickson, N. & Cline, T. (2002). Special educational needs, inclusion and
diversity, a textbook. Buckingham/Philadelphia: Open University Press.
Freire, S. & César, M. (2002). Inclusive ideals/inclusive practices: How far is
dream from reality. Five comparative case studies. European Journal of
Special Needs Education, 18(3), 341-354.
Frostad, P. & Pijl, S.J. (2007). Does being friendly help in making friends? The
relation between the social position and social skills of pupils with special
needs in mainstream education. European Journal of Special Needs
Education, 22(1), 15-30.
Garrison-Harrell, L., Kamps, D. & Kravits, T. (1997). The effects of peer networks
on social-communicative behaviors of students with autism. Focus on
Autism and other Developmental Disabilities, 12(4), 241-254.
Gartner, A. & Lipsky, D.K. (1987). Beyond special education: toward a quality
system for all students. Harvard Educational Review, 57(4), 367-395.
Gottlieb, J. (1981). Mainstreaming: fulfilling the promise? American Journal of
Mental Deficiency, 86(2), 115-126.
Grietens, H., Ghesquière, P. & Pijl, S.J. (2006). Toename leerlingen met
gedragsproblemen in primair en voortgezet onderwijs. Een Nederlands-
Vlaamse vergelijking. BOPO.
CHAPTER 1
20
Guralnick, M.J., Connor, R.T., Hammond, M.A., Gottman, J.M. & Kinnish, K.
(1996). The peer relations of preschool children with communication
disorders. Child Development, 67, 471-489.
Guralnick, M.J., Hammond, M.A., Connor, R.T. & Neville, B. (2006). Stability,
change, and correlates of the peer relationships of young children with
mild developmental delays. Child Development, 77(2), 312-324.
Guralnick, M.J., Neville, B., Hammond, M.A. & Connor, R.T. (2007). The
friendships of young children with developmental delays. A longitudinal
analysis. Journal of Applied Developmental Psychology, 28, 64-79.
Jackson, L.D. & Bracken, B.A. (1998). Relationship between students’ social
status and global and domain-specific self-concepts. Journal of School
Psychology, 36(2), 233-246.
Karsten, T., Peetsma, T., Roeleveld, J. & Vergeer, M. (2001). The Dutch policy of
integration put to the test: differences in academic and psychosocial
development of pupils in special and mainstream education. European
Journal of Special Needs Education, 16(3), 193-205.
Kavale, K.A. & Forness, S.R. (2000). History, rhetoric, and reality. Analysis of the
Inclusion Debate. Remedial and special education, 21(5), 279-296.
Lee, S.H., Yoo, S.Y. & Bak, S.H. (2003). Characteristics of friendships between
children with and without disabilities. Education and Training in
Developmental Disabilities, 38(2), 157-166.
Lindsay, G. (2003). Inclusive education: a critical perspective. British Journal of
Special Education, 30(1), 3-12.
Meijer, C.J.W. (1994). The Netherlands. In C.J.W. Meijer, S.J. Pijl & S. Hegarty
(Eds.), New perspectives in special education. A six-country study of
integration (pp. 95-112). London, New York: Routlegde.
Nakken, H. & Pijl S.J. (2002). Getting along with classmates in regular schools: a
review of the effects of integration on the development of social
relationships. International Journal of Inclusive Education, 6(1), 47-61.
Nelson, L.J., Rubin, K.H. & Fox, N.A. (2005). Social withdrawal, observed peer
acceptance, and the development of self-perceptions in children ages 4 to
7 years. Early Childhood Research Quarterly, 20, 185-200.
Ollendick, T.H., Weist, M.D., Borden, M.C. & Greene, R.W. (1992). Social status
and academic, behavioural, and psychological adjustment: a five-year
GENERAL INTRODUCTION
21
longitudinal study. Journal of Consulting and Clinical Psychology, 60(1),
80-87.
Parker, J.G. & Asher, S.R. (1987). Peer relations and later personal adjustment:
are low-accepted children at risk? Psychological Bulletin, 102(3), 357-389.
Pijl, S.J (2007). Introduction: the social position of pupils with special needs in
regular education. European Journal of Special Needs Education, 22(1), 1-
5.
Pijl, S.J. (Ed.) (1997). Integratie van regulier en speciaal onderwijs.
Onderwijskundig Lexicon. Alphen aan den Rijn: Samson.
Pijl, S.J. & Meijer, C.J.W. (1994). Introduction. In C.J.W. Meijer, S.J. Pijl. & S.
Hegarty (Eds.), New perspectives in special education. A six-country study
of integration (pp. xi-xiv). London, New York: Routlegde.
Pijl, S.J. & Meijer, C.J.W. (1991). Does integration count for much? An analysis
of the practices of integration in eight countries. European Journal of
Special Needs Education, 6(2), 100-110.
Pijl, S.J. & Van den Bos, K.P. (2001). Redesigning regular education support in
the Netherlands. European Journal of Special Needs Education, 16(2),
111-119.
Rea, P.J., McLaughlin, V. & Walther-Thomas, C. (2002). Outcomes for students
with learning disabilities in inclusive and pullout programs. Council for
Exceptional Children, 68(2), 203-223.
Scheepstra, A.J.M. (1998). Leerlingen met Downs syndroom in de basisschool.
Groningen: Stichting Kinderstudies.
Scheepstra, A.J.M., Nakken, H. & Pijl, S.J. (1999). Contact with classmates: the
social position of pupils with Down’s Syndrome in Dutch mainstream
education. European Journal of Special Needs Education, 14(3), 212-220.
Sloper, T. & Tyler, S. (1992). Integration of children with severe learning
difficulties in mainstream schools: evaluation of a pilot study. Educational
and Child Psychology, 9(4), 35-45.
Strayhorn, J.M. & Strain, P.S. (1986). Social and language skills for preventive
mental health: What, how, who and when. In P.S. Strain, M.J. Guralnick &
H. Walker (Eds.), Children’s Social Behavior: Development, Assessment
and Modifications (pp. 287-330). New York: Academic Press.
CHAPTER 1
22
Tadema, A. (2007). From policy to practice. Developments in the education of
children with profound intellectual and multiple disabilities. Groningen:
Stichting Kinderstudies.
Terry, R. & Coie, J.D. (1991). A comparison of methods for defining sociometric
status among children. Developmental Psychology, 27(5), 867-880.
Chapter 2 The social position and development of pupils with a pupil-bound budget in regular Dutch primary schools1
CHAPTER 2 THE SOCIAL POSITION AND DEVELOPMENT OF PUPILS WITH A PUPIL-BOUND BUDGET IN REGULAR DUTCH PRIMARY SCHOOLS
This article is a slightly adapted version of: Koster, M., Pijl, S.J., Van Houten, E.J. & Nakken, H. (2007). The social position and development of pupils with SEN in mainstream Dutch primary schools. European Journal of Special Needs Education, 22(1), 31-46.
CHAPTER 2
24
Abstract
Since August 2003, pupils with auditory, speech/language, motor, intellectual or
multiple disabilities as well as severe behavioural, emotional and/or psychiatric
problems in the Netherlands have been entitled to receive a pupil-bound budget
when they attend a regular school. With this budget, educational personnel and
material aids can be funded. The first experiences with the pupil-bound budget in
regular Dutch primary schools are described in this article. The focus is on the
social position and development of 20 pupils with special needs who were placed
in regular primary schools in the 2003-2004 school year. The teacher, the
parent/parents and the peripatetic teacher of each of the pupils were
interviewed. The interviews aimed at the cognitive, social and social-emotional
development of the pupils. Besides, the teacher, the parent/parents, the
peripatetic teacher and the classmates of the pupils with special needs assessed
the social position of the pupil within the classroom via interviews and a
sociometric questionnaire. The results show that teachers and parents and, to a
lesser extent, the peripatetic teachers, had a more positive view of the social
position of the pupils with special needs than the classmates. The results of the
sociometric questionnaire show that the social position of the pupils with special
needs and that of their typical classmates do not differ significantly, however. In
addition, a panel of five independent assessors judged the development of the 20
pupils with special needs, by reading anonymous pupil dossiers. The
assessments show that the panel had some concerns about the development of
35 percent of these pupils. Nevertheless, the panel was (very) positive about
another 35 percent of the pupils with special needs. An expected relation
between the social position of the pupils with special needs and the panel’s
satisfaction about the development of these pupils was not found.
THE SOCIAL POSITION AND DEVELOPMENT OF PUPILS WITH A PUPIL-BOUND BUDGET
25
2.1 Introduction
Over the last decades, it is no longer taken for granted that pupils with special
needs are sent to schools for special education. For a long time it was assumed
that these pupils would not be able to attend regular schools (Pijl, 1997) and that
it was better to send them to special ones. The placement of these children at a
regular school was considered to be quite unrealistic. This point of view became
increasingly a matter for debate (Limpens, Nekkers & Ter Pelle, 2003). In many
countries it was increasingly assumed that with extra effort pupils with sensory,
motor and/or intellectual disabilities could attend regular schools (Nakken & Pijl,
2002). As a result, in almost all countries with a system of separate special
education, new ideas about the educational care for these pupils arose, new
regulations were introduced and legislation was amended. Integration of children
with special needs became, and still is, a current theme and an important aim.
In the Netherlands attempts are also being made to promote the integration of
children with special needs into regular schools. With the introduction of the
‘Centres of Expertise Act’ (Wet op de Expertise Centra, Ministerie van OCW) in
August 2003, the pupil-bound budget has made its entry into the Dutch
educational system. It is now law that parents of children with special needs
have the right to choose between regular and special education for their child.
Since the law became effective, pupils with auditory, speech/language, motor,
intellectual or multiple disabilities as well as severe behavioural, emotional
and/or psychiatric problems have been entitled to enrol in the so-called
‘Backpack’ policy. This means that when pupils with special needs attend a
regular school they receive a financial ‘backpack’. The money can be spent on
personnel and key teaching aids. It is to be expected that an increasing number
of parents will decide to send their child with special needs to a regular school.
Many parents of children with special needs hope and expect the physical
integration of their children, which is now made possible by the government, to
lead to their social integration as well. Parents often report the latter as being
their main motive for sending their child to a regular school (Scheepstra, 1998,
in De Monchy, Pijl & Zandberg, 2004; Sloper & Tyler, 1992; Strayhorn & Strain,
1986). In the opinion of parents, it is important for their child to go to the same
school as other children in the neighbourhood. They like their child to be
educated with other typically developing children and they often assume that
CHAPTER 2
26
contact with such children will have a positive effect on their child. Parents also
expect integration to lead to increased opportunities for contact with
neighbourhood children, thereby increasing the opportunity to learn how to
handle social situations, make friends and integrate into the local community (De
Monchy et al., 2004). Furthermore, some parents assume that as a result of
sending their child with special needs to a regular school, a change of attitude
will arise among other children, possibly leading to positive long-term effects on
attitudes towards special needs in wider society. Because of the emphasis
parents place on social integration, it is important to verify if this aspect of
integration is really achieved.
If social integration fails, some risks might develop. Research has shown that the
number of contacts and friendships with pupils without special needs does not
increase spontaneously when these pupils are sent to a regular school (Pijl,
2005). Physical integration is indeed a first important step, but it seems next
steps are also necessary, as it turns out that the acceptance of pupils with
special needs cannot be taken for granted. Research on social acceptance
consistently shows that pupils with special needs who are placed in a regular
school class are accepted to a lesser degree than their classmates without special
needs (Larrivee & Horne, 1991). In this context, a great number of researchers
have shown that pupils with special needs have a lower social status than the
other pupils (Larrivee & Horne, 1991). Terry and Coie (1991) state that the lack
of ‘status’ in childhood is a significant predictor of the possible development of
maladjustment in adulthood. Parker and Asher (1987) examined the
presupposition, widespread in social developmental literature, that peer-
relationship difficulties in childhood predict serious maladjustment in later life.
For this purpose they made a review of the literature on the subject. Their
results indicate that children with poor peer adjustment are at risk for later
difficulties in life, thereby confirming the existing presupposition (Parker & Asher,
1987).
The risks of having a low social position in class are discussed by various authors
in literature. The rejected position is especially connected with negative side
effects. According to Jackson and Bracken (1998), rejected children are more
likely to exhibit aggressive and ‘acting out’ behaviours than others. More often
than average they also lack the knowledge about how to join in group activities
effectively (Jackson & Bracken, 1998; Ollendick, Weist, Borden & Greene, 1992).
THE SOCIAL POSITION AND DEVELOPMENT OF PUPILS WITH A PUPIL-BOUND BUDGET
27
In addition, the academic achievements of rejected pupils tend to be weaker.
Furthermore, these pupils tend to have a higher failure rate in school, an
increased chance of dropping out and of committing delinquent offences
(Ollendick et al., 1992).
Because of the above-mentioned possible negative effects of integration, a
pessimistic view of integrating children with special needs within regular
education might emerge. Nevertheless, it might be expected that by taking
particular measures, the negative effects can decrease and more positive effects
can occur. Several researchers suggest that the attitude of typically developing
children can be influenced (Scheepstra, Nakken & Pijl, 1999). For instance,
research has shown that cooperative learning fosters cooperation between
children with special needs and their peers without special needs. Furthermore,
concern for peers is fostered by cooperative learning (Gartin, Murdick & Digby,
1992). Fox (1989, in Gartin et al., 1992) found that after pupils with special
needs and their chronological age peers without special needs participated in
cooperative learning situations, attitudinal changes in both groups of pupils were
noted. Rynders et al. (1993) are positive about the effects of cooperative
learning too. In their opinion, the use of cooperative learning strategies within
integrated recreational activities has proven to be a powerful combination in
facilitating the inclusion of children with and without special needs. Furthermore,
Hunt, Alwell, Farron-Davis and Goetz (1996, in Hall & McGregor, 2000) found
that peer relationships between pupils with special needs and pupils without
special needs were formed when researchers implemented intervention packages
which focused on adult strategies and formal peer friendship programmes.
This study focuses on the first experiences with the pupil-bound budget in
regular Dutch primary schools. Based on the results in international literature
(Larrivee & Horne, 1991; Ray, 1985; Sale & Carey, 1995), it is expected that
pupils with special needs in the Netherlands will have a less positive position in
regular school classes than their classmates without special needs. In addition,
rejected pupils with special needs when compared to the other pupils with special
needs are expected to develop in a less desirable way.
Therefore, the research question in this study is twofold: ‘What social position do
pupils with special needs have in regular Dutch primary school classes?’ and
‘How do pupils with special needs, particularly rejected ones, develop in a
CHAPTER 2
28
cognitive, social and social-emotional sense in regular Dutch primary school
classes?’
2.2 Method
2.2.1 Introduction
In this study, the focus is on the social position of 20 pupils with special needs in
regular schools. The social position was characterised by the pupils’ teacher,
their parent/parents, the peripatetic teacher and their classmates. This study
also addresses the cognitive, social and social-emotional development of the
pupils with special needs as described by their teacher, their parent/parents and
the peripatetic teacher. Furthermore, a panel consisting of five independent
assessors also assessed these three developmental areas.
2.2.2 Subjects
A sample of 20 pupils with special needs participating in full-time regular
education participated in this study. These pupils were chosen from a wider
sample of 115 pupils with a pupil-bound budget who were placed in regular
primary schools in the 2003-2004 school year. This wider sample was drawn
from the files of a national institute (CFI) directly linked to the Ministry of
Education. Among other things, this institute is responsible for making special
needs funding available to schools and it keeps records of regular schools with
recently admitted pupils with special needs. The wider sample can be regarded
as representative of the pupils with a pupil-bound budget in regular Dutch
primary schools with each having the Dutch version of a statement of special
needs. A sample of 20 pupils was taken in the study described in this article, four
of which had various communication disabilities (hard of hearing,
speech/language problems), seven had Down Syndrome, six were described as
having motor disabilities and/or intellectual disabilities while the remaining three
had severe behavioural disorders and/or PDD-NOS.
The sample consisted of the pupils with special needs aged from 4 to 11, plus
their peers (without special needs) in 19 classes in 18 schools. In one school two
pupils with special needs were in the same class. The total number of pupils
(including the 20 pupils with special needs and their classmates) in the 19
THE SOCIAL POSITION AND DEVELOPMENT OF PUPILS WITH A PUPIL-BOUND BUDGET
29
classes was 406. In the case of the 20 pupils with special needs, school leaders,
teachers and parents consented to the study.
2.2.3 Interviews and questionnaires
Three categories of informers were involved. The first category consisted of
classmates of the pupil with special needs. It was important to receive
information from fellow pupils as they associate with the pupil with special needs
on a daily basis. Secondly, the teachers and the parents are important informers
because they closely follow the development of the pupils with special needs.
Their opinions are valuable in evaluating the integration process, although it is
difficult for them to interpret their assessment in terms of which development
can be expected for a particular child, since most of them lack data on the
development of comparable children in other settings. The only professionals
with much experience in supporting pupils with special needs and their teachers
in regular education settings are the peripatetic teachers working in regular
settings. Most peripatetic teachers have wide experience in special education as
well. They are thus the best informed assessors available. For this reason, the
peripatetic teachers form the third category of informers.
Data collection took place in different ways. A questionnaire for pupils and three
interview protocols were drawn up. In addition, a questionnaire was drawn up for
members of a panel of independent assessors.
The questionnaire for all pupils (including the pupils with special needs and their
classmates) in the sample comprised a sociometric questionnaire. Based on Coie,
Dodge and Coppotelli (1982), in the sociometric questionnaire pupils were asked
which three pupils they liked to play with best and which three pupils they
disliked playing with.
The teacher interview addressed a number of general questions about all pupils
in the classroom; on the behaviour of the pupil with special needs in particular;
on the pupil’s social position and number of friends and on his or her cognitive,
social and social-emotional development. In the interviews teachers had to
characterise their pupil with special needs. They could choose between the
following replies (with the later coding categories in brackets): many classmates
like the pupil (popular); many think neutrally about him/her (average); many
CHAPTER 2
30
classmates think differently about the pupil (controversial); many ignore him/her
(ignored) and many dislike him/her (rejected) (Coie et al., 1982).
The parent interview also focused on the pupil’s cognitive, social and social-
emotional development and on his/her social position. Furthermore the interview
addressed the motives underlying the parents’ choice for regular education, and
the extent to which the education offered came up to their expectations.
The interview with the involved peripatetic teachers was aimed at the
advantages and disadvantages of placement at a regular school compared to
placement at a school for special education. This interview too was aimed at the
pupil’s cognitive, social and social-emotional development and his/her social
position.
Finally, it was considered necessary to compare the development and social
position of the pupils with special needs with that of a reference group.
Unfortunately, for these pupils with special needs a reference group was not
available. For instance, it is impossible to compare the integrated pupils with
special needs with pupils with the same kind of special needs in special education
because the settings are very different. It is also impossible to compare the
pupils with special needs with a pupil-bound budget with pupils with special
needs who were already educated at a regular school before the new integration
policy was put into effect. Because of the pupil-bound budget, pupils with severe
disabilities can attend regular education, whereas formerly attending special
education was their only option. The pupils with special needs who already
attended regular education are expected to have less severe disabilities than
those with a pupil-bound budget. For this reason these groups of pupils are not
comparable.
Since there was no reference group, the comparative assessment of the
development and social position of the pupils with special needs had to take
place in an alternative manner. It was decided to draw up a panel of experts for
this purpose. Five experienced peripatetic teachers were asked to be part of an
independent panel to evaluate pupils’ dossiers. The panel can be deemed
independent because each assessor judged the reports of eight pupils with
special needs they did not know. They assessed the pupils’ cognitive, social and
social-emotional development. The available data on pupils consisted of
information derived from interviews with teachers, parents and peripatetic
THE SOCIAL POSITION AND DEVELOPMENT OF PUPILS WITH A PUPIL-BOUND BUDGET
31
teachers as well as from the results of the sociometric questionnaire. Based on
these data pupil dossiers were made, typically comprising four to five pages of
text and a copy of the Individual Education Programme.
2.2.4 Data analyses
The sociometric data on the 20 pupils with special needs and 386 pupils without
special needs were analysed using UCINET software (Borgatti, Everett &
Freeman, 1999). The mean and standard deviation per class were calculated for
the number of times pupils were chosen as preferred to play with. For every
pupil the standard score of preferred to play with was the pupil’s score, minus
the mean of the class, divided by the standard deviation (following Cillessen &
Ten Brink, 1991; Coie et al., 1982). Accordingly, the standard score of being
disliked to play with was calculated.
The social preference and social influence scores are based on these two
standard scores. The social preference score is the standard score being
preferred to play with minus the standard score being disliked to play with. The
social influence score is the standard score being preferred to play with plus the
standard score being disliked to play with. Based on these scores the pupils were
divided into five groups: popular, average, controversial, ignored and rejected.
In the interview teachers had to characterise their pupil with special needs using
the words ‘popular’, ‘average’, ‘controversial’, ‘ignored’ and ‘rejected’. Cohen’s
kappa is calculated for agreement between the teachers’ responses and the
categories based on the sociometric data. Similarly, the parents and the
peripatetic teachers were asked to characterise the pupils with special needs.
The answers were analysed in the same way as for the teachers described
above.
In the interview teachers also had to indicate how many friends their pupil with
special needs had in class. In sociometry, friendship is defined as a reciprocal
choice, implying that two pupils nominate each other as their best friend (De
Monchy et al., 2004). The agreement between the teachers’ responses and the
actual number of friends (as appears from the sociometric questionnaire) was
calculated using the Gower measure of agreement (Gower, 1971). This measure
takes into account that answers that differ a little show more agreement
compared to answers that differ more (De Monchy et al., 2004).
CHAPTER 2
32
We transformed all the available raw data on each pupil into 20 dossiers which
were then sent to the independent panel of assessors. All of these were
peripatetic teachers with experience in supporting pupils with special needs and
their teachers in regular education. Five assessors were involved, two of which
had specialist knowledge and expertise on communication disabilities, two had
this knowledge and expertise in relation to Down Syndrome, while one
specialised in behavioural disorders. Each of the dossiers was assessed
independently by two assessors so that each assessor received eight pupil
dossiers.
The assessors were asked to read the dossiers of the pupils carefully and to
judge the pupil’s cognitive, social and social-emotional development on a 5–point
scale, ranging from 1), very negative and dissatisfying situation, to 5), very
positive and satisfying situation.
Gower’s coefficient (Gower, 1971) was used as an index for agreement between
the assessments. This index uses the absolute sum of differences between the
assessments and compared to Cohen’s kappa (Popping, 1983) is less influenced
by asymmetrical distributions. Gower’s coefficient is 0 if there is no agreement at
all and 1 if there is perfect agreement between the assessments. The assessors
were encouraged to give comments and to explain their assessments.
2.3 Results
2.3.1 Subjects
The definitive sample consisted of 20 pupils - ten boys and ten girls, of whom
two boys were in the same class. Their average age was 5.7 years. Thirteen
pupils were in Kindergarten, three were in Grade 1, two were in Grade 2 and the
remaining two were in Grade 4. The pupils had been in a regular class for seven
months on average and all pupils knew their peers well. The average class in the
study had 21.4 pupils. The total number of pupils in the 19 classes was 406.
THE SOCIAL POSITION AND DEVELOPMENT OF PUPILS WITH A PUPIL-BOUND BUDGET
33
2.3.2 Social position
Social position according to teachers, parents, peripatetic teachers and
classmates
In order to investigate whether the social position of the 20 pupils with special
needs deviated from that of their 386 peers in the 19 classes, their social
position was assessed using the social preference and social influence scores.
These were based on two questions for each of the pupils, i.e.: which three
pupils in the classroom do you like playing with best and which three pupils in
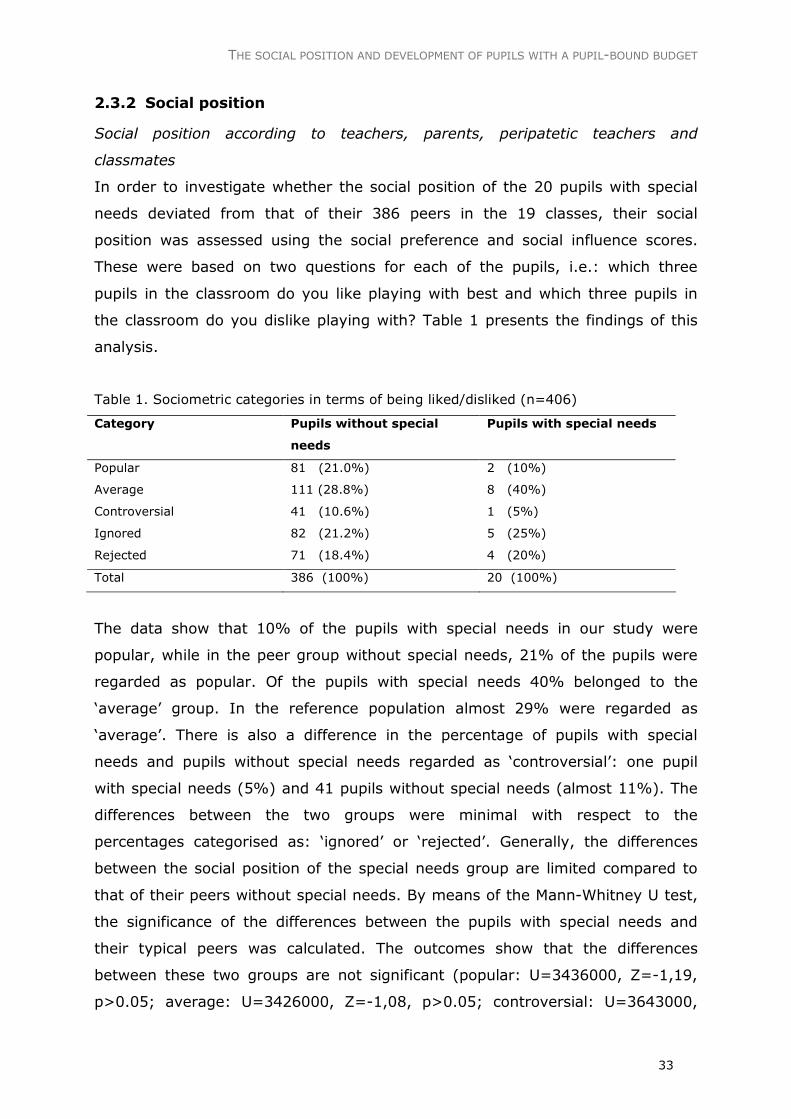
the classroom do you dislike playing with? Table 1 presents the findings of this
analysis.
Table 1. Sociometric categories in terms of being liked/disliked (n=406)
Category Pupils without special
needs
Pupils with special needs
Popular 81 (21.0%) 2 (10%)
Average 111 (28.8%) 8 (40%)
Controversial 41 (10.6%) 1 (5%)
Ignored 82 (21.2%) 5 (25%)
Rejected 71 (18.4%) 4 (20%)
Total 386 (100%) 20 (100%)
The data show that 10% of the pupils with special needs in our study were
popular, while in the peer group without special needs, 21% of the pupils were
regarded as popular. Of the pupils with special needs 40% belonged to the
‘average’ group. In the reference population almost 29% were regarded as
‘average’. There is also a difference in the percentage of pupils with special
needs and pupils without special needs regarded as ‘controversial’: one pupil
with special needs (5%) and 41 pupils without special needs (almost 11%). The
differences between the two groups were minimal with respect to the
percentages categorised as: ‘ignored’ or ‘rejected’. Generally, the differences
between the social position of the special needs group are limited compared to
that of their peers without special needs. By means of the Mann-Whitney U test,
the significance of the differences between the pupils with special needs and
their typical peers was calculated. The outcomes show that the differences
between these two groups are not significant (popular: U=3436000, Z=-1,19,
p>0.05; average: U=3426000, Z=-1,08, p>0.05; controversial: U=3643000,
CHAPTER 2
34
Z=-0,80, p>0.05; ignored: U=3715000, Z=-0,40, p>0.05; rejected:
U=3798000, Z=-0,18, p>0.05).
The social position of each of the pupils with special needs as rated by other
pupils in the classes was compared to teachers’ assessments. In Table 2 both
classmates’ and teachers’ assessments are presented (horizontally for
classmates and vertically for teachers).
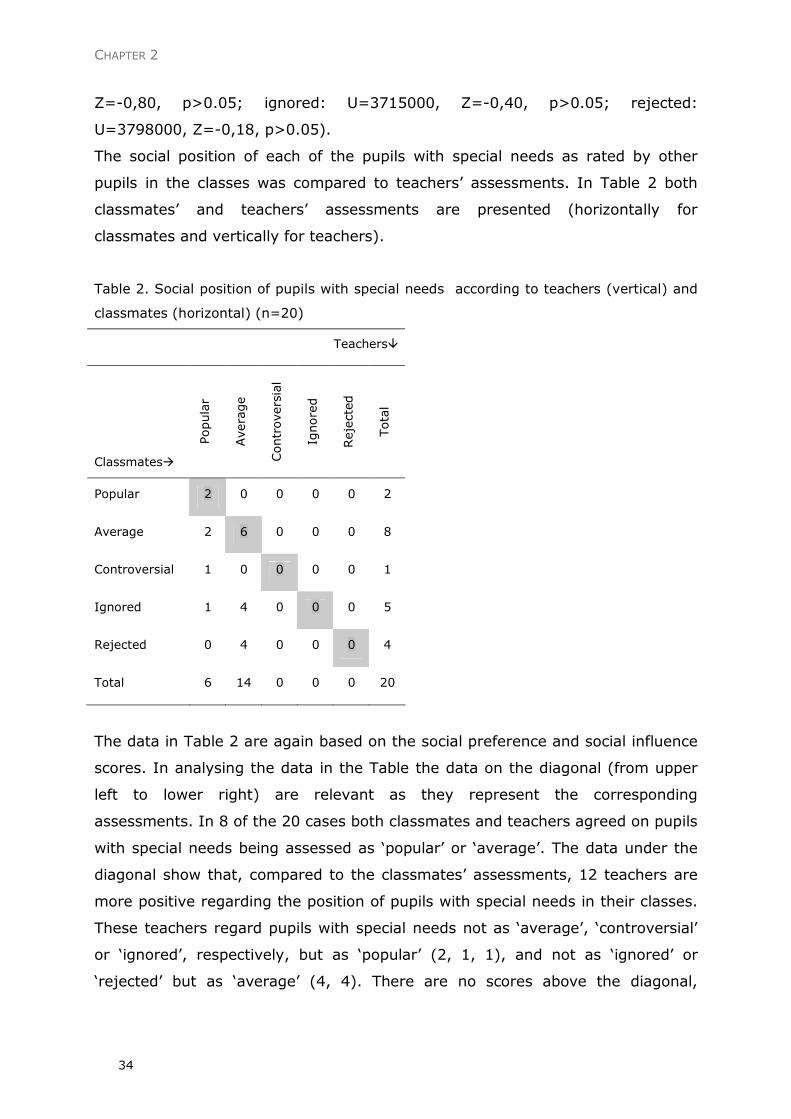
Table 2. Social position of pupils with special needs according to teachers (vertical) and
classmates (horizontal) (n=20)
Teachers�
Classmates�
Popular
Average
Controversial
Ignored
Rejected
Total
Popular 2 0 0 0 0 2
Average 2 6 0 0 0 8
Controversial 1 0 0 0 0 1
Ignored 1 4 0 0 0 5
Rejected 0 4 0 0 0 4
Total 6 14 0 0 0 20
The data in Table 2 are again based on the social preference and social influence
scores. In analysing the data in the Table the data on the diagonal (from upper
left to lower right) are relevant as they represent the corresponding
assessments. In 8 of the 20 cases both classmates and teachers agreed on pupils
with special needs being assessed as ‘popular’ or ‘average’. The data under the
diagonal show that, compared to the classmates’ assessments, 12 teachers are
more positive regarding the position of pupils with special needs in their classes.
These teachers regard pupils with special needs not as ‘average’, ‘controversial’
or ‘ignored’, respectively, but as ‘popular’ (2, 1, 1), and not as ‘ignored’ or
‘rejected’ but as ‘average’ (4, 4). There are no scores above the diagonal,
THE SOCIAL POSITION AND DEVELOPMENT OF PUPILS WITH A PUPIL-BOUND BUDGET
35
meaning that no teacher was more negative about the social position of the
pupils with special needs compared to the classmates’ assessments.
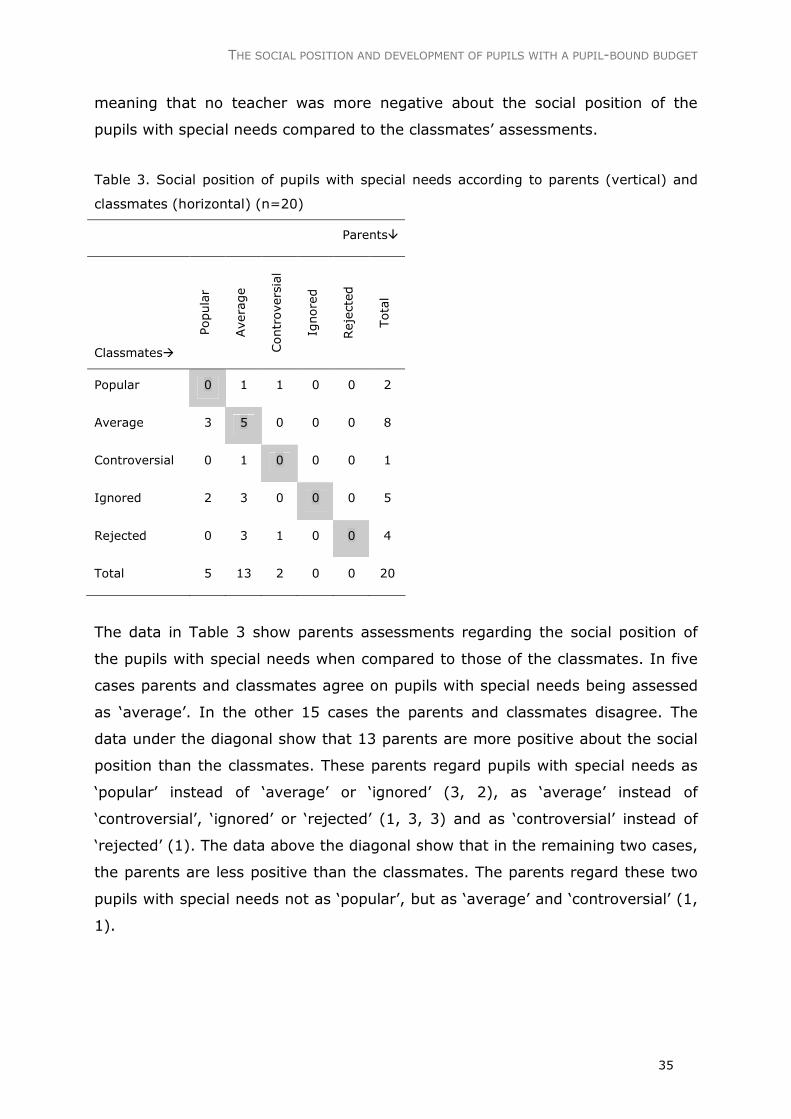
Table 3. Social position of pupils with special needs according to parents (vertical) and
classmates (horizontal) (n=20)
Parents�
Classmates�
Popular
Average
Controversial
Ignored
Rejected
Total
Popular 0 1 1 0 0 2
Average 3 5 0 0 0 8
Controversial 0 1 0 0 0 1
Ignored 2 3 0 0 0 5
Rejected 0 3 1 0 0 4
Total 5 13 2 0 0 20
The data in Table 3 show parents assessments regarding the social position of
the pupils with special needs when compared to those of the classmates. In five
cases parents and classmates agree on pupils with special needs being assessed
as ‘average’. In the other 15 cases the parents and classmates disagree. The
data under the diagonal show that 13 parents are more positive about the social
position than the classmates. These parents regard pupils with special needs as
‘popular’ instead of ‘average’ or ‘ignored’ (3, 2), as ‘average’ instead of
‘controversial’, ‘ignored’ or ‘rejected’ (1, 3, 3) and as ‘controversial’ instead of
‘rejected’ (1). The data above the diagonal show that in the remaining two cases,
the parents are less positive than the classmates. The parents regard these two
pupils with special needs not as ‘popular’, but as ‘average’ and ‘controversial’ (1,
1).
CHAPTER 2
36
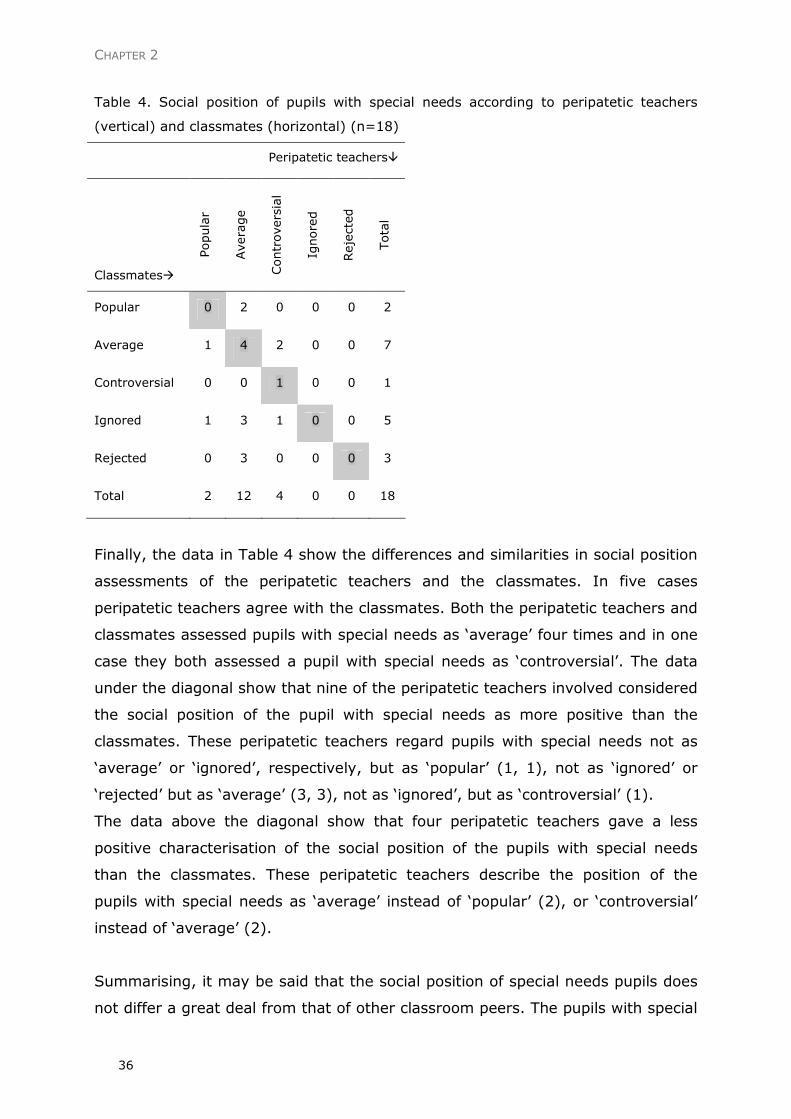
Table 4. Social position of pupils with special needs according to peripatetic teachers
(vertical) and classmates (horizontal) (n=18)
Peripatetic teachers�
Classmates�
Popular
Average
Controversial
Ignored
Rejected
Total
Popular 0 2 0 0 0 2
Average 1 4 2 0 0 7
Controversial 0 0 1 0 0 1
Ignored 1 3 1 0 0 5
Rejected 0 3 0 0 0 3
Total 2 12 4 0 0 18
Finally, the data in Table 4 show the differences and similarities in social position
assessments of the peripatetic teachers and the classmates. In five cases
peripatetic teachers agree with the classmates. Both the peripatetic teachers and
classmates assessed pupils with special needs as ‘average’ four times and in one
case they both assessed a pupil with special needs as ‘controversial’. The data
under the diagonal show that nine of the peripatetic teachers involved considered
the social position of the pupil with special needs as more positive than the
classmates. These peripatetic teachers regard pupils with special needs not as
‘average’ or ‘ignored’, respectively, but as ‘popular’ (1, 1), not as ‘ignored’ or
‘rejected’ but as ‘average’ (3, 3), not as ‘ignored’, but as ‘controversial’ (1).
The data above the diagonal show that four peripatetic teachers gave a less
positive characterisation of the social position of the pupils with special needs
than the classmates. These peripatetic teachers describe the position of the
pupils with special needs as ‘average’ instead of ‘popular’ (2), or ‘controversial’
instead of ‘average’ (2).
Summarising, it may be said that the social position of special needs pupils does
not differ a great deal from that of other classroom peers. The pupils with special
THE SOCIAL POSITION AND DEVELOPMENT OF PUPILS WITH A PUPIL-BOUND BUDGET
37
needs are a little less popular, less often belong to the controversial group and
are more often regarded as average. These differences are not significant.
Further, there is a discrepancy between classmates’ and teachers’ assessments,
between classmates’ and parents’ assessments and between classmates’ and
peripatetic teachers’ assessments. If the pupils’ assessments are used as
reference point, 40% of the teacher assessments are accurate, but 60% of the
teachers overestimate the actual social position of pupils with special needs.
Almost the same holds true for parents’ and peripatetic teachers’ assessments. If
the pupils’ assessments are used as a reference point, 25% of the parents and
28% of the peripatetic teachers give an accurate assessment, but 65% of the
parents and 50% of the peripatetic teachers have a too positive view on the
social position of the pupil with special needs. On the other hand, 10% of the
parents and 22% of the peripatetic teachers underestimate the social position of
the pupil with special needs, whereas none of the teachers underestimate.
Social position in terms of the number of friends
Another indication of the social position of the pupils with special needs in this
study is the number of friends they have in class. The first sociometric analysis,
the one on peers liking or disliking each other, was used to calculate the number
of friends as reported by the pupils. In sociometric analyses friends are defined
as two pupils selecting each other as peers they like or peers with whom they
like to play. There must be reciprocity in their choices (Cullinan, Sabornie &
Crossland, 1992; De Monchy et al., 2004; Juvonen & Bear, 1992).
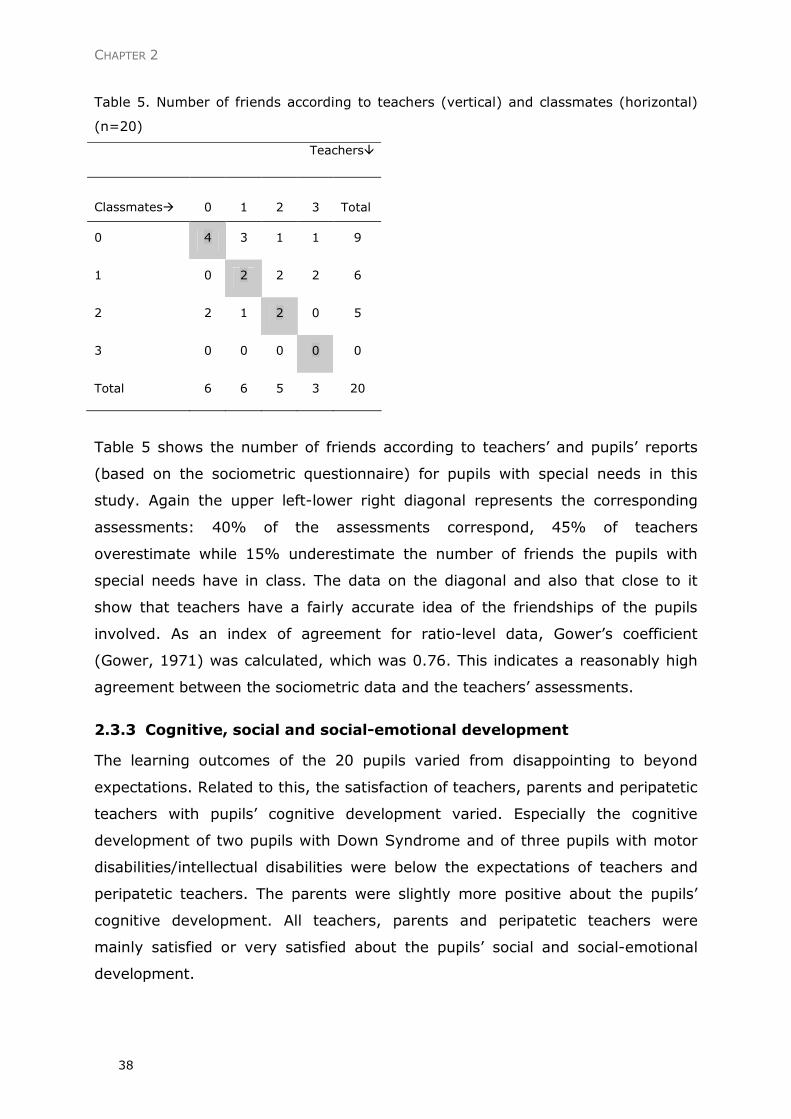
CHAPTER 2
38
Table 5. Number of friends according to teachers (vertical) and classmates (horizontal)
(n=20)
Teachers�
Classmates�
0
1
2
3
Total
0 4 3 1 1 9
1 0 2 2 2 6
2 2 1 2 0 5
3 0 0 0 0 0
Total 6 6 5 3 20
Table 5 shows the number of friends according to teachers’ and pupils’ reports
(based on the sociometric questionnaire) for pupils with special needs in this
study. Again the upper left-lower right diagonal represents the corresponding
assessments: 40% of the assessments correspond, 45% of teachers
overestimate while 15% underestimate the number of friends the pupils with
special needs have in class. The data on the diagonal and also that close to it
show that teachers have a fairly accurate idea of the friendships of the pupils
involved. As an index of agreement for ratio-level data, Gower’s coefficient
(Gower, 1971) was calculated, which was 0.76. This indicates a reasonably high
agreement between the sociometric data and the teachers’ assessments.
2.3.3 Cognitive, social and social-emotional development
The learning outcomes of the 20 pupils varied from disappointing to beyond
expectations. Related to this, the satisfaction of teachers, parents and peripatetic
teachers with pupils’ cognitive development varied. Especially the cognitive
development of two pupils with Down Syndrome and of three pupils with motor
disabilities/intellectual disabilities were below the expectations of teachers and
peripatetic teachers. The parents were slightly more positive about the pupils’
cognitive development. All teachers, parents and peripatetic teachers were
mainly satisfied or very satisfied about the pupils’ social and social-emotional
development.
THE SOCIAL POSITION AND DEVELOPMENT OF PUPILS WITH A PUPIL-BOUND BUDGET
39
2.4 Independent assessors’ judgments
2.4.1 Reliability of assessments
In order to make sure that the independent assessors would give reliable
assessments on the cognitive, social and social-emotional development, each
dossier was assessed by two different assessors. A high level of agreement
between the assessments shows that different assessors came to similar
conclusions. Tables 6a-c present the data based on 20 pupil dossiers. The
findings in the Tables address the cognitive, social and social-emotional
development. Both the first column and the first row of each Table present the
values of the 5–point scale the assessors used. The remaining 25 figures show
the frequency of the various combinations of assessments. The frequency ‘2’ in
the matrix on social-emotional development (Table 6c) in row 2, column 4,
indicates that in two cases an assessor scores a ‘2’ (rather negative) while the
other assessor was much more positive (‘4’). The frequencies on the diagonal
show the concurring assessments. Gower’s coefficients on the data in the Tables
6a-c are 0.84, 0.75 and 0.75 respectively. This suggests that the assessors to a
reasonable degree agree on the cognitive, social and social-emotional
development. The conclusion is that different assessors come to comparable
assessments if they apply the 5-point scale on the pupil descriptions given. The
assessments can, therefore, be used in evaluating the effects on pupil level.
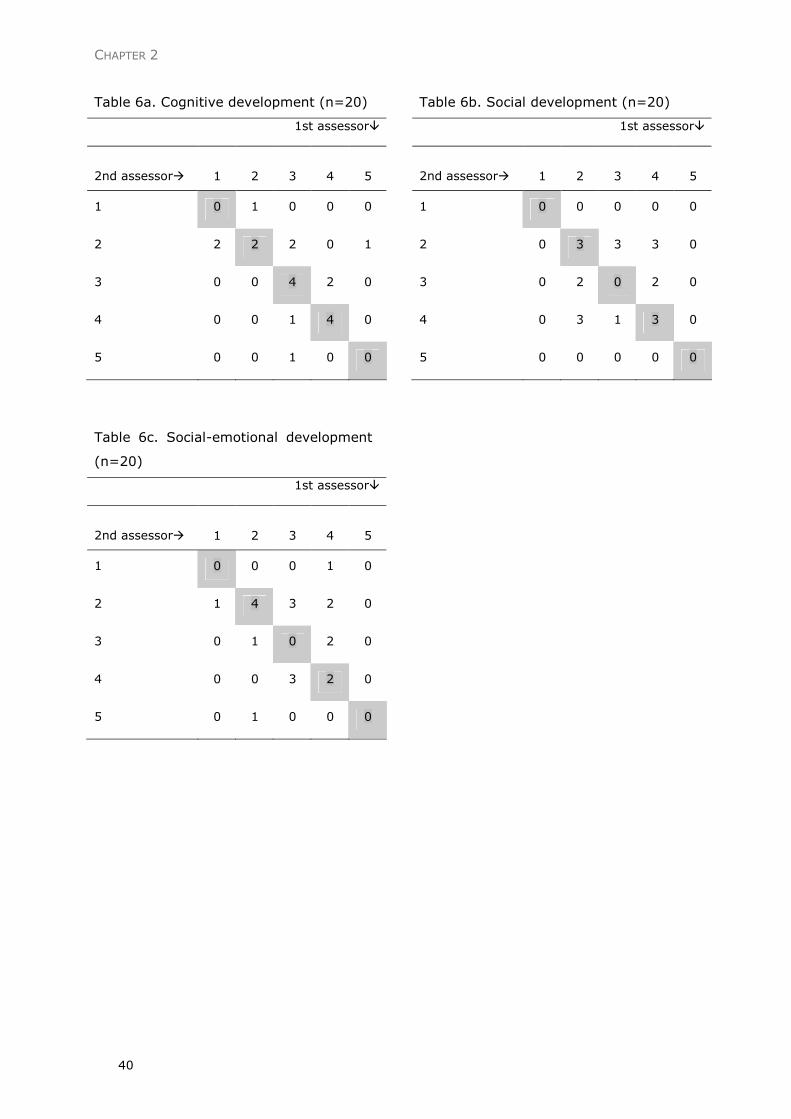
CHAPTER 2
40
Table 6a. Cognitive development (n=20)
1st assessor�
2nd assessor�
1
2
3
4
5
1 0 1 0 0 0
2 2 2 2 0 1
3 0 0 4 2 0
4 0 0 1 4 0
5 0 0 1 0 0
Table 6c. Social-emotional development
(n=20)
1st assessor�
2nd assessor�
1
2
3
4
5
1 0 0 0 1 0
2 1 4 3 2 0
3 0 1 0 2 0
4 0 0 3 2 0
5 0 1 0 0 0
Table 6b. Social development (n=20)
1st assessor�
2nd assessor�
1
2
3
4
5
1 0 0 0 0 0
2 0 3 3 3 0
3 0 2 0 2 0
4 0 3 1 3 0
5 0 0 0 0 0

THE SOCIAL POSITION AND DEVELOPMENT OF PUPILS WITH A PUPIL-BOUND BUDGET
41
2.4.2 Assessment of cognitive, social and social-emotional development
Tables 6a-c already give a first impression of the results of the evaluation. The
intersections of the first two columns and rows in each of the three matrices
show how many pupils were judged as being at risk. These represent
combinations of the low scores (1 and 2), i.e. ‘very negative and dissatisfying’
and ‘negative and dissatisfying’. Other combinations of scores, for example ‘1
and 3’, ‘1 and 4’ or ‘2 and 3’ are not taken as a clear indication that the
development of pupils was disappointing or very disappointing.
In the case of low scores, the assessors felt that the cognitive development of
five pupils was ‘worrying’, that the social-emotional development of another five
pupils was also ‘worrying’ as was the social development of three other pupils.
However, a further analysis of the data shows that there is an overlap between
these pupils. According to the assessors, a total of seven pupils were actually
involved: one pupil was developing negatively in all three areas, one in both the
social and social-emotional areas, two in both the cognitive and social-emotional
areas, one in the cognitive and social areas, one in the social-emotional area and
one in the cognitive area. These seven pupils represent 35% of the group. The
assessors regarded the development of the other thirteen pupils in this study as
being average or above average level. The intersections of the last two columns
and rows in each of the three matrices show how many pupils were assessed as
functioning above average. Corrected for overlap, the cognitive, social and
social-emotional development of, again, seven pupils (35%) were assessed as
above average.
2.4.3 Relation between rejected status and assessment of development
Because of the negative aspects linked to the rejected position, we investigated
the relation between the independent assessors’ judgments with regard to the
development of the pupils with special needs and their social position within the
classroom. We expected the cognitive, social and social-emotional development
of rejected pupils with special needs -as taken from the sociometric
questionnaire- to be assessed in a less positive way than the development of the
other pupils with special needs. As described in the method section, the panel of
independent assessors judged these three developmental areas of the pupils with
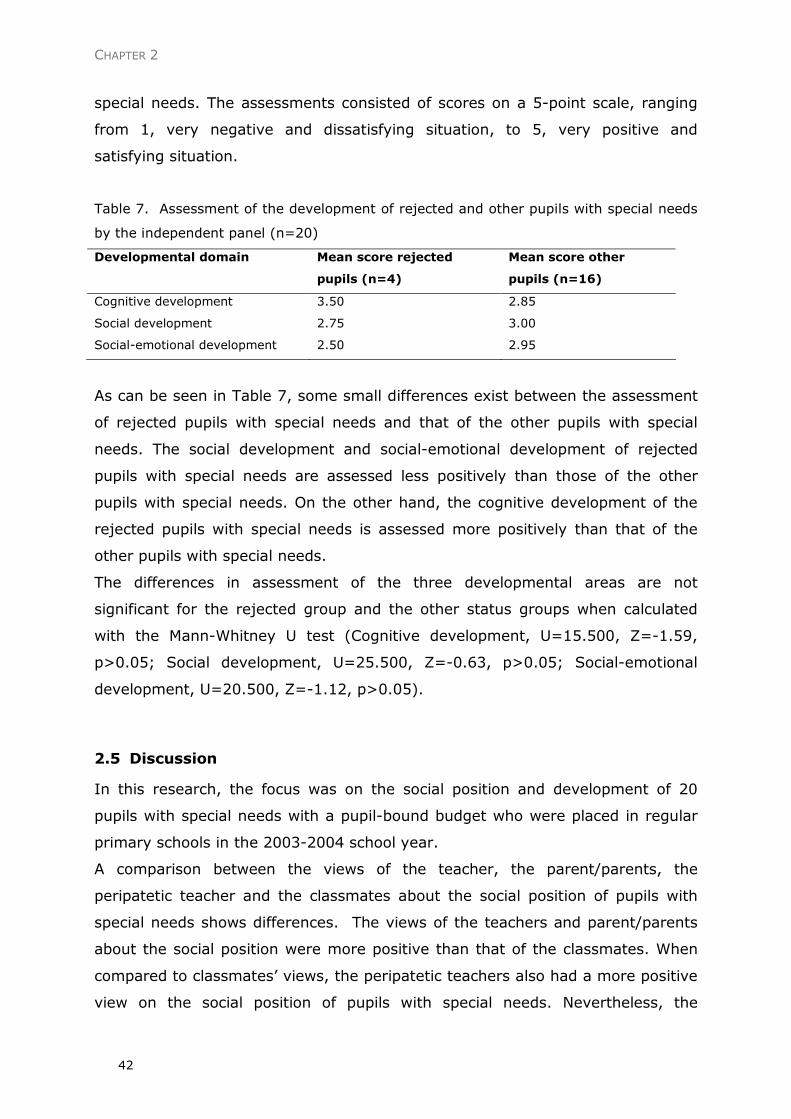
CHAPTER 2
42
special needs. The assessments consisted of scores on a 5-point scale, ranging
from 1, very negative and dissatisfying situation, to 5, very positive and
satisfying situation.
Table 7. Assessment of the development of rejected and other pupils with special needs
by the independent panel (n=20)
Developmental domain Mean score rejected
pupils (n=4)
Mean score other
pupils (n=16)
Cognitive development 3.50 2.85
Social development 2.75 3.00
Social-emotional development 2.50 2.95
As can be seen in Table 7, some small differences exist between the assessment
of rejected pupils with special needs and that of the other pupils with special
needs. The social development and social-emotional development of rejected
pupils with special needs are assessed less positively than those of the other
pupils with special needs. On the other hand, the cognitive development of the
rejected pupils with special needs is assessed more positively than that of the
other pupils with special needs.
The differences in assessment of the three developmental areas are not
significant for the rejected group and the other status groups when calculated
with the Mann-Whitney U test (Cognitive development, U=15.500, Z=-1.59,
p>0.05; Social development, U=25.500, Z=-0.63, p>0.05; Social-emotional
development, U=20.500, Z=-1.12, p>0.05).
2.5 Discussion
In this research, the focus was on the social position and development of 20
pupils with special needs with a pupil-bound budget who were placed in regular
primary schools in the 2003-2004 school year.
A comparison between the views of the teacher, the parent/parents, the
peripatetic teacher and the classmates about the social position of pupils with
special needs shows differences. The views of the teachers and parent/parents
about the social position were more positive than that of the classmates. When
compared to classmates’ views, the peripatetic teachers also had a more positive
view on the social position of pupils with special needs. Nevertheless, the
THE SOCIAL POSITION AND DEVELOPMENT OF PUPILS WITH A PUPIL-BOUND BUDGET
43
differences between the views of classmates and those of the peripatetic
teachers were smaller than those between the views of classmates and those of
teachers and parents.
Despite the discrepancies between teachers and classmates regarding their views
on the social position of the pupils with special needs, there is a reasonable
agreement between the teachers’ and classmates’ opinion about the number of
friends pupils with special needs have. The number of friends, as named by the
teacher and the number of friends as derived from the sociometric questionnaire
shows a certain similarity.
Most of the teachers, the parents and, to a lesser extent, the peripatetic teachers
are satisfied about the development of the pupils with special needs, particularly
their social and social-emotional development, although satisfaction with
cognitive development varied. For about one third of the pupils, the positive
vision of the teacher, parent/parents and peripatetic teacher contrasts with the
more concerned vision of the panel of independent assessors. For these pupils
the panel has ‘worries’ about the cognitive, social and/or social-emotional
development.
Our expectation that there would be a relationship between the rejected status
and the developmental assessment by the independent panel was unfounded. As
described in the introduction section, we expected the assessment of rejected
pupils with special needs to be less positive than the developmental assessment
of the other pupils with special needs. The social and social-emotional
development of the rejected pupils with special needs are indeed assessed less
positively than the development of the other pupils with special needs, but the
differences are not significant. In addition, the cognitive development of the
rejected pupils with special needs was even regarded in a slightly more positive
way than that of the other pupils with special needs.
We draw the conclusions mentioned above based on the research results.
However, a few critical considerations can be made on the research described in
this article. The first is the small number of pupils involved in the research.
Because only 20 pupils with disabilities were involved, it is difficult to draw
overall and general conclusions. Nonetheless, the sample can be regarded as
representative because it is extracted from a wider sample of 115 Dutch pupils
with special needs with a pupil-bound budget. For this reason the research
CHAPTER 2
44
results can be regarded as containing valuable information and as having
consequences which should be taken seriously.
The second consideration focuses on the age of the pupils with special needs in
this research. They were quite young (average age is 5;7). For the youngest
children especially, it is hard to decide which classmates they like and do not like
playing with. Coincidence could have influenced the sociometric research with
these young pupils. For example, it might be possible that a pupil chose a
classmate to play with because this classmate did something nice that day. At
another moment, the pupil might not have chosen this classmate as a playmate.
Therefore, interpretations in this area should be made cautiously.
A final consideration is the distribution of the types of disabilities of the pupils in
the research. Despite efforts to arrange a proportional distribution of types of
disabilities, quite a large group consisted of pupils with Down Syndrome.
Nevertheless, pupils with other kind of special needs are also represented in the
research sufficiently (see the method section). Only the pupils with behavioural
disorders and/or psychiatric disorders are slightly underrepresented.
Keeping in mind the critical considerations, the discrepancies in the views of the
people involved, regarding the development and social position of the pupils with
special needs, are worth noting. These discrepancies are in accordance with the
results of comparable studies. For instance, Scheepstra (1998, in De Monchy et
al., 2004) shows that teachers tend to overrate the social integration of pupils
with Down Syndrome in their class when compared to the views of the
classmates. Furthermore, the study of De Monchy et al. (2004) suggests that
teachers have a too positive view on the social position of the pupils with
behavioural disorders in their classes when compared to the results of a
sociometric test. In addition, our finding that pupils with special needs are less
popular than their typical counterparts needs is consistent with the results of
similar studies (Larrivee & Horne, 1991; Ray, 1985; Sale & Carey, 1995).
Our results emphasise the importance of research into the development and
social position of pupils with special needs in regular schools. It would be
desirable to follow pupils with special needs with a pupil-bound budget for a
longer period. Longitudinal research might make it possible to examine the
constancy of social positions and to examine the long-term development of social
relations, social-emotional functioning and learning performances. However, this
kind of research with pupils with special needs involves particular difficulties.
THE SOCIAL POSITION AND DEVELOPMENT OF PUPILS WITH A PUPIL-BOUND BUDGET
45
Pupils with special needs have a larger chance of changing school or of dropping
out than other pupils, resulting in a possible high drop-out rate of participants
during the research. For this reason it would be necessary to start with a large
number of participants.
In conclusion, considering the often found low social position of pupils with
special needs and the unfavourable side effects of a negative social position, it is
important to aim research at this topic. Further research into the assessment and
influencing of the social position of pupils with special needs in regular classes is
therefore recommended.
2.6 References
Borgatti, S.P., Everett, M.G. & Freeman, L.C. (1999). UCINET for Windows.
Natick: Analytic Technologies.
Cillessen, A.H.N. & Ten Brink, P.W.M. (1991). Vaststelling van relaties met
leeftijdgenoten. Pedagogische Studiën, 68(1), 1-14.
Coie, J.D., Dodge, K.A. & Coppotelli, H. (1982). Dimensions and types of social
status: A cross-age perspective. Developmental Psychology, 18(4), 557-
570.
Cullinan, D., Sabornie, E.J. & Crossland, C.L. (1992). Social mainstreaming of
mildly handicapped students. The Elementary School Journal, 92(3), 339-
351.
De Monchy, M., Pijl, S.J. & Zandberg, T.J. (2004). Discrepancies in judging social
inclusion and bullying of pupils with behaviour problems. European Journal
of Special Needs Education, 19(3), 317-330.
Gartin, B.C., Murdick, N.L. & Digby, A.D. (1992). Cooperative activities to assist
in the integration of students with disabilities. Journal of Instructional
Psychology, 19(4), 241-245.
Gower, J.C. (1971). A general coefficient of similarity and some of its properties.
Biometrics, 27, 857-871.
Hall, L.J. & McGregor, J.A. (2000). A follow-up study of the peer relationships of
children with disabilities in an inclusive school. The Journal of Special
Education, 34(3), 114-135.
CHAPTER 2
46
Jackson, L.D. & Bracken, B.A. (1998). Relationship between students’ social
status and global and domain-specific self-concepts. Journal of School
Psychology, 36(2), 233-246.
Juvonen, J. & Bear, G. (1992). Social adjustment of children with and without
learning disabilities in integrated classrooms. Journal of Educational
Psychology, 84(3), 322-330.
Larrivee, B. & Horne, M.D. (1991). Social status: a comparison of mainstreamed
students with peers of different ability levels. The Journal of Special
Education, 25(1), 90-101.
Limpens, M., Nekkers, J. & Ter Pelle, J. (2003). Samen of apart, anders of
minder. Onderwijs aan leerlingen met speciale leerbehoeften. Enschede:
Stichting leerplanontwikkeling.
Ministerie van OCW (2003). Wet op de Expertise Centra. Den Haag.
Nakken, H. & Pijl, S.J. (2002). Getting along with classmates in regular schools:
a review of the effects of integration on the development of social
relationships. International Journal of Inclusive Education, 6(1), 47-61.
Ollendick, T.H., Weist, M.D., Borden, M.C. & Greene, R.W. (1992). Social status
and academic, behavioural, and psychological adjustment: a five-year
longitudinal study. Journal of Consulting and Clinical Psychology, 60(1),
80-87.
Parker, J.G. & Asher, S.R. (1987). Peer relations and later personal adjustment:
are low-accepted children at risk? Psychological Bulletin, 102(3), 357-389.
Pijl, S.J. (2005). Interventies gericht op sociale integratie: training van sociale
vaardigheden voor leerlingen met beperkingen in het regulier onderwijs.
In B.F. van der Meulen, C. Vlaskamp & K.P. van den Bos (Eds.),
Interventies in de orthopedagogiek (pp. 122-135). Rotterdam:
Lemniscaat.
Pijl, Y.J. (1997). Twintig jaar groei van het speciaal onderwijs. De Lier:
Academisch Boeken Centrum.
Popping, R. (1983). Overeenstemmingsmaten voor nominale data. Groningen:
Rijksuniversiteit Groningen.
Ray, B.M. (1985). Measuring the social position of the mainstreamed
handicapped child. Exceptional children, 52(1), 57-62.
Rynders, J.E., Schleien, S.J., Meyer, L.H., Vandercook, T.L., Mustonen, T.,
Colond, J.S. & Olson, K. (1993). Improving integration outcomes for
THE SOCIAL POSITION AND DEVELOPMENT OF PUPILS WITH A PUPIL-BOUND BUDGET
47
children with and without severe disabilities through cooperatively
structured recreation activities: a synthesis of research. The Journal of
Special Education, 26(4), 386-407.
Sale, P. & Carey, D.M. (1995). The sociometric status of students with disabilities
in a full-inclusion school. Exceptional Children, 62(1), 6-19.
Scheepstra, A.J.M., Nakken, H. & Pijl, S.J. (1999). Contacts with classmates: the
social position of pupils with Down’s syndrome in Dutch mainstream
education. European Journal of Special Needs Education, 14(3), 212-220.
Sloper, T. & Tyler, S. (1992). Integration of children with severe learning
difficulties in mainstream schools: evaluation of a pilot study. Educational
and Child Psychology, 9(4), 34-45.
Strayhorn, J.M. & Strain, P.S. (1986). Social and language skills for preventive
mental health: What, how, who and when. In P.S. Strain, M.J. Guralnick
and H. Walker (Eds.), Children’s Social Behavior: Development,
assessment and modifications (pp. 287-330). New York: Academic Press.
Terry, R. & Coie, J.D. (1991). A comparison of methods for defining sociometric
status among children. Developmental psychology, 27(5), 867-880.

CHAPTER 2
48
Chapter 3 Being part of the peer group: a literature study focusing on the social dimension of inclusion in education1
CHAPTER 3
BEING PART OF THE PEER GROUP: A
LITERATURE STUDY FOCUSING ON THE
SOCIAL DIMENSION OF INCLUSION IN
EDUCATION
This article is a slightly adapted version of: Koster, M., Nakken, H., Pijl, S.J. & Van Houten, E.J. (in press). Being part of the peer group: a literature study focusing on the social dimension of inclusion in education. International Journal of Inclusive Education.
CHAPTER 3
50
Abstract
Maximizing the interaction between pupils with and without special needs is
generally considered an important aspect of inclusion. However, it is frequently
questioned whether pupils with special needs in regular classrooms have
interactions and friendships with their peers. In order to be able to evaluate
these relationships, it is necessary to clarify concepts like social participation,
social integration and social inclusion. At the moment, there is much ambiguity
regarding these concepts. This article aims to elucidate these concepts and
reveal its characteristic themes.
An analysis of literature was carried out to identify these concepts. In the final
analysis 62 articles were included. This analysis showed that the concept social
integration and the related concepts of social inclusion and social participation
are often described inaccurately, with only a few researchers providing explicit
definitions or descriptions. In the majority of articles, implicit descriptions can be
derived from instruments used to measure social integration, social inclusion or
social participation: it is apparent there is much overlap among the use of
concepts by researchers.
Based on the analysis of the 62 articles, it can be concluded that the concepts
social integration, social inclusion and social participation are used as synonyms.
In our opinion, social participation is the most suitable concept. The analysis of
literature reveals four key themes central to all three concepts:
friendships/relationships, contacts/interactions, pupil’s social self-perception and
acceptance by classmates.
A LITERATURE STUDY FOCUSING ON THE SOCIAL DIMENSION OF INCLUSION IN EDUCATION
51
3.1 Introduction
The integration and, more recently, the inclusion of pupils with special needs into
regular education is a much-discussed topic worldwide. It is no longer taken for
granted that these pupils are sent to separate schools for special education.
Farrell (2000, pp. 154) describes inclusion as ‘taking a full and active part in
school-life, be a valued member of the school community and be seen as an
integral member’.
Research has shown that the opportunity for contacts and interactions with
typical peers is one of the main motives of parents for sending their child with
special needs to a regular school (Scheepstra, 1998, in Nakken & Pijl, 2002;
Sloper & Tyler, 1992; Strayhorn & Strain, 1986). In their opinion it is important
for their child to grow up as far as possible in a normal environment. Therefore,
they wish their child to attend a regular neighbourhood school. Parents often
assume that contacts with peers will have a positive effect on their child.
Furthermore, some parents believe that as a result of sending their child to an
ordinary school, a change of attitude will arise from other children, which can
possibly lead to positive long-term effects for the attitude of society as a whole
(Koster, Pijl, Van Houten & Nakken, 2007).
In addition, more intensive contacts with typical peers might have a positive
effect on the social-emotional development of the pupil with special needs (for
example on self-image). However, several researchers have shown there are also
risks in this area. Research shows that, compared to typical pupils, pupils with
special needs are more often teased, abused and ignored in mainstream settings,
which is, in fact, harmful to their self-image (Gottlieb, 1981, in Cole & Meyer,
1991). Wiener and Harris (1989) describe that pupils with special needs (in
particular pupils with learning problems) are rejected and neglected by their
peers. Research on social acceptance consistently shows that pupils with special
needs educated in a regular classroom are less accepted than their classmates
without special needs (Freeman & Alkin, 2000), generally have a social status
which is lower than that of their classmates (Coben & Zigmond, 1986; Goodman,
Gottlieb & Harrison, 1972; Kuhne & Wiener, 2000; Larrivee & Horne, 1991;
Manetti, Schneider & Siperstein, 2001; Pavri & Luftig, 2000; Sabornie, Marshall &
Ellis, 1990; Stone & La Greca, 1990) and are more socially isolated (Evans &
Labon, 1997, in Skårbrevik, 2005; Margalit & Efrati, 1996).
CHAPTER 3
52
From society’s point of view, it is important to aim research at the social
dimension of inclusion. However, there is uncertainty about what such concepts
as social participation, social integration, social status and social inclusion mean.
Many researchers use these in their studies, but it is sometimes unclear what
exactly they mean by them. These concepts are interpreted in numerous ways
(Storey & Smith, 1995), and a well-established criterion for determining the
degree to which pupils with special needs have contacts and friendships with
their peers does not yet exist (Guralnick, 1999, in Odom, 2000). Taking into
consideration the issues mentioned-above, the research question is as follows:
‘In what way may such concepts as social participation, social integration and
social inclusion be defined and what are the characteristic themes?’
3.2 Research method
To define the concepts mentioned above a literature analysis was carried out.
The literature used in this article was derived from two sources: the last six
volumes (2000 – 2005) of three prominent journals in the field of special needs
education (‘International Journal of Inclusive Education’, ‘European Journal of
Special Needs Education’ and ‘Scandinavian Journal of Educational Research’)
and a search of two electronic databases.
The three journals included in the literature search all meet international
publication and quality requirements and are often used as reference. Of the
2005 volume of the ‘International Journal of Inclusive Education’ only the first
two issues were examined, as the last two were not available. Articles with
abstracts and/or titles that included the following terms were selected: ‘social
integration’, ‘social inclusion’, ‘social participation’, ‘social position’ and ‘social
status’.
Subsequently, a search was made of the American Psychological Association
(psycINFO) and Education Resource Information Clearinghouse (ERIC) databases
from January 1995 until December 2005 and the same aforementioned search
terms used, combined with the additional search terms: ‘child(ren)’, ‘pupil(s)’,
‘student(s)’, ‘classmate(s)’, ‘peer(s)’, ‘disabled’, ‘disability/disabilities’,
‘impairment(s)’, ‘impaired’, ‘disorder(s)’, ‘handicap(s)’, ‘handicapped’, ‘special
needs’, ‘special educational needs/SEN’, ‘contact’, ‘relationship’, ‘communication’,
‘social network’, ‘school’, ‘classroom’ and ‘mainstream’.
A LITERATURE STUDY FOCUSING ON THE SOCIAL DIMENSION OF INCLUSION IN EDUCATION
53
There were five selection criteria for the articles:
• based on empirical research or a literature review, so editorials,
commentaries and prologues were excluded;
• published in international scientific journals;
• aimed at pupils with special needs;
• aimed at elementary school pupils or preschoolers;
• focused on the social dimension of inclusion in the school situation (rather
than in the wider community).
In analysing the literature the focus was on the following three themes:
• definition of the concepts used;
• relation between the various concepts used;
• any subdivision in themes within the concepts used.
3.3 Selecting the literature
The search within the last six volumes of the three international journals yielded
15 articles, of which 9 were from the ‘European Journal of Special Needs
Education’, 4 from the ‘International Journal of Inclusive Education’ and 2 from
the ‘Scandinavian Journal of Educational Research’. The search in the electronic
databases resulted in several hundred references.
Because of the large amount of hits, the references were immediately filtered,
based on the criteria formulated above. The first selection of the articles was
based on reading the titles and in cases of uncertainty about the suitability of an
article, also the abstract. Quite a number of articles were deleted from the file.
Many articles, for instance, looked promising but were not aimed at primary
school pupils and preschoolers or focused on the inclusion of other target groups.
After the first rough filtering process, 124 articles from the electronic databases
were selected for further analysis. Together with the 15 articles from the three
journals, the total number of articles was 139. Another 9 publications were
added after examining the references of the selected studies, resulting in 148
studies to be assessed. Of these, 62 were selected after carefully reading the
article. The other 86 articles were put aside, because they appeared not to focus
on including pupils with special needs in mainstream primary education. Most of
the deleted 86 articles focused on pupils with special needs in (post) secondary
education settings and/or on pupils without special needs.
CHAPTER 3
54
A first exploration of the selected literature clearly shows that various
terminologies are used to refer to the social dimension of inclusion. Most of these
are not defined explicitly. Authors often only describe the concepts in an implicit
way, for example by just describing which instruments were used to measure
them. In the following sections, the three most used concepts will be described:
social integration, social inclusion and social participation.
3.4 Social integration
The analysis of the 62 publications made clear that definitions of social
integration not only differ with respect to content, but also in the way they are
presented. Only nine articles presented an explicit definition of social integration.
These explicit definitions are now discussed followed by the implicit definitions of
social integration.
3.4.1 Explicit definitions of social integration
Boutot and Bryant (2005) give a precise definition of social integration. According
to the authors, successful social integration in a mainstream education classroom
means being visible to other pupils (social impact), being someone with whom
other pupils wish to spend time (social preference) and being a member of a
group of friends that spend time together (social network affiliation).
Cartledge and Talbert Johnson (1996) refer to a definition originally proposed by
Cullinan, Sabornie and Crossland (1992). They define social integration as: being
an accepted member of a group, having at least one mutual friendship and
participating actively and equivalently in group activities. Stinson and Antia
(1999) state that inclusive education aims to promote the social and academic
integration of pupils with disabilities. The authors emphasise the importance of
peer acceptance and friendship and consider peer interaction to be important for
social integration. They define the latter as the ability to interact with peers,
make friends with peers and be accepted by peers. This definition builds on work
done by Cullinan et al (1992) and Juvonen and Bear (1992). However, Juvonen
and Bear’s definition emphasizes not only the importance of friendships and peer
relations, but also of the pupil’s self-perception of social acceptance.
A LITERATURE STUDY FOCUSING ON THE SOCIAL DIMENSION OF INCLUSION IN EDUCATION
55
Guralnick (1999) evaluated the social integration of preschool-age pupils with
mild disabilities in inclusive early childhood settings by focusing on three
constructs: the connectedness (or extent) of peer interactions, the quality of
interpersonal relationships and the nature of adjustments that occur during social
exchanges. Social integration of such pupils is achieved when typically
developing pupils connect with and maintain the same quality of interpersonal
relationships with pupils with mild developmental delays as they do with other
pupils. Guralnick (1999) points out that this description departs from the
viewpoint of typical peers. Similar analyses can be made from the perspective of
pupils with special needs. Their ability to connect with their peers, with and
without special needs, constitutes an important index of social integration.
The definition of social integration by Schmidt (2000) is less specific than those
described above. Following Kobi (1983), Schmidt (2000) holds the view that
social integration refers to the frequency and intensity of social contacts between
pupils with and without special needs. This view is similar to Biklen’s (1985, in
Nietupski, 1995) that social integration is about developing positive social
interactions between children with and without special needs. Gable, Rucker and
Smith (1997) describe social integration as pupils’ perceptions of the extent to
which they participate in and are accepted as members of the school community.
The authors used a student survey to measure social integration, the items of
which show that acceptance by, and contact with, classmates as well as pupils
with special needs feeling accepted are important aspects of social integration.
3.4.2 Implicit definitions of social integration
In several articles focusing on social integration only implicit definitions are
presented. According to Cambra and Silvestre (2003), one of the factors which
plays an important role in social integration is ‘peer group socialisation’. They
consider social acceptance to be the essence of social integration. This is in
accordance with Stanovich, Jordan and Perot (1998), who assessed the peer
acceptance of pupils in inclusive classrooms. They consider social integration to
be synonymous with peer acceptance, which can be measured using a
sociometric rating scale. Pijl and Hamstra (2005) also hold the view that social
integration of pupils with special needs can be assessed by using a sociometric
questionnaire.
CHAPTER 3
56
Guralnick, Connor, Hammond, Gottman and Kinnish (1995) however, clearly
distinguish social integration from social acceptance. They examined the
immediate effects of mainstream settings on the social development of preschool
children by measuring acceptance using sociometric ratings, while social
integration was assessed by observing peer interaction. The authors used four
indices for social integration: active and passive interaction, and positive and
negative individual social behaviour. Just like Guralnick et al. (1995), Pearl et al.
(1998), Scheepstra, Nakken and Pijl (1999), Cava and Musitu (2000), Flem and
Keller (2000), Nakken and Pijl (2002) and Dyson (2005) do not consider social
acceptance as the only important aspect, but also highlight social relationships.
For example Pearl et al. (1998) state that focusing on social acceptance provides
an incomplete view of social integration and regard the relationships (affiliations)
between pupils with special needs and their peers as central to social integration.
Pearl et al. (1998) examined social integration of pupils in primary-school
classrooms by assessing social isolation, social behaviour and peer group
affiliations. Farmer and Farmer (1996) hold similar views as they gathered
information on affiliated patterns and social structural characteristics in
mainstream classrooms. They define social integration in terms of being isolated
or belonging to a peer network and distinguish types of peer networks (pro-
social, anti-social or shy cluster) (Farmer & Farmer, 1996). Storey and Smith
(1995) also emphasize peer networks. They consider ‘clique’ analysis of social
interactions to be a promising methodology for assessing social integration, since
it not only provides a framework for comparing frequency of interaction, but also
reveals the ‘who-with-whom’ dimension of interaction patterns (Storey & Smith,
1995). A focus on social interaction as an essential part of social integration can
also be found with Attwood (2000), Brown, Odom, Li and Zercher (1999),
Goldstein and English (1995), Kamps, Dugan, Potucek and Collins (1999) and
Luetke-Stahlman (1995).
Besides social interaction, Brown et al. (1999), in their assessment of social
integration / social inclusion (they use these terms interchangeably), focus on
the social initiations, social bids and social behaviours of pupils with and without
special needs. Mar and Sall (1995) and Nikolaraizi and De Reybekiel (2001) add
that next to social interaction (long term) relationships between pupils are also
important in this context.
A LITERATURE STUDY FOCUSING ON THE SOCIAL DIMENSION OF INCLUSION IN EDUCATION
57
Harper, Maheady, Mallette and Karnes (1999) only focus on this last aspect:
friendships between pupils, with and without special needs. They describe two
peer-tutoring programmes that have been used effectively to promote social
integration (and academic integration) of children with special needs in regular
classrooms. The benefits included improved friendship patterns within the
classroom (Harper et al., 1999).
Williams, Johnson and Sukhodolsky (2005) consider a combination of the
foregoing aspects to be important for social integration. In their descriptions of
strategies to facilitate the social integration of pupils with autism spectrum
disorders (ASD), they focus on the social interactions, (reciprocal) friendships,
peer acceptance and social involvement (affiliations) of pupils with ASD with their
peers (Williams et al., 2005). Yude, Goodman and McConachie (1998) also
consider friendship and acceptance to be essential and positive aspects of social
integration, while two other important aspects ‘being a victim’ and ‘being a bully’
are negative ones. Odom (2000) also distinguishes a positive and a negative
indicator of social integration: social acceptance and social rejection.
Finally, Hepler (1998) explores the social integration of pupils diagnosed as
having emotional difficulties by measuring four aspects: social status, knowledge
of specific cognitive and behavioural skills (like initiating and maintaining a
conversation, entering an ongoing activity), social interaction and pupils’
satisfaction with an integration programme.
3.4.3 Summary of the definitions of social integration
The analysis of articles focusing on social integration shows that in particular,
interaction, peer acceptance, friendship and relationships/affiliations are
regarded by many authors as essential aspects of social integration. Social
behaviour/skills, peer networks, pupils’ self-perception of acceptance, social
contacts, social initiations, social status and participation in group activities are
also named by one or more researchers as important for social integration. In
addition to these positive or neutral aspects, three negative aspects are
described: social isolation, social rejection and bullying. See Table 1 for an
overview of the outcomes.
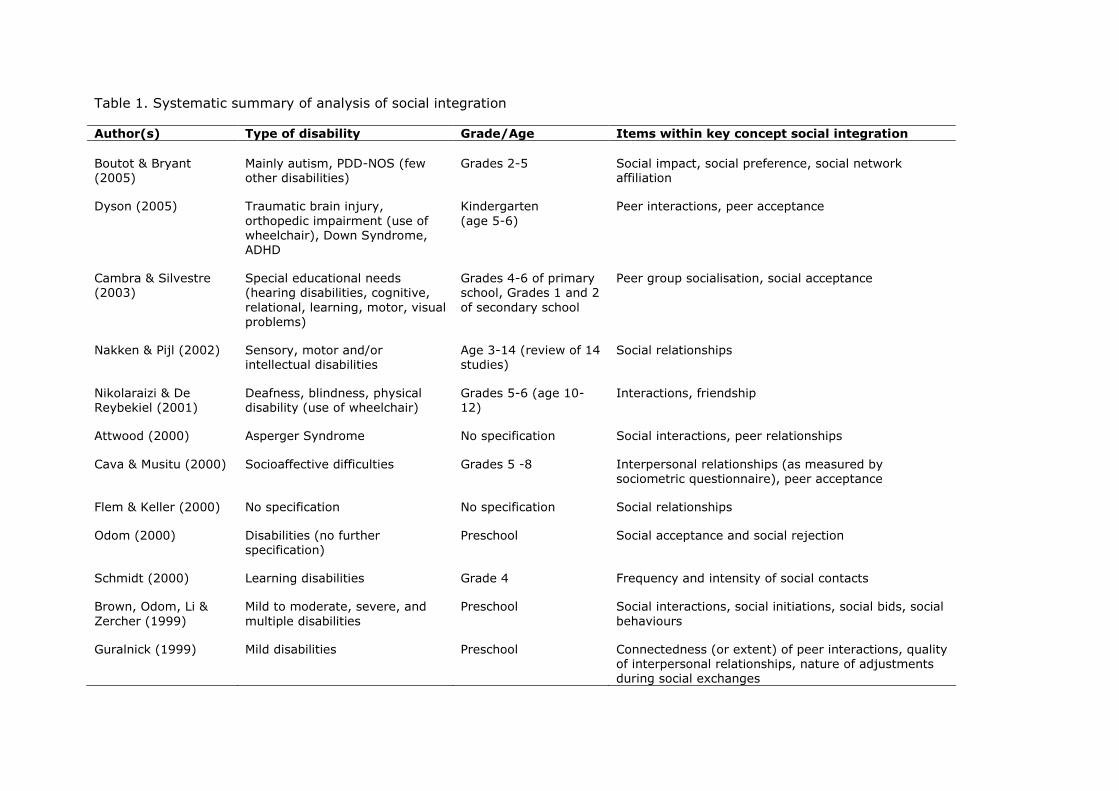
Table 1. Systematic summary of analysis of social integration Author(s) Type of disability Grade/Age Items within key concept social integration
Boutot & Bryant (2005)
Mainly autism, PDD-NOS (few other disabilities)
Grades 2-5
Social impact, social preference, social network affiliation
Dyson (2005) Traumatic brain injury, orthopedic impairment (use of wheelchair), Down Syndrome, ADHD
Kindergarten (age 5-6)
Peer interactions, peer acceptance
Cambra & Silvestre (2003)
Special educational needs (hearing disabilities, cognitive, relational, learning, motor, visual problems)
Grades 4-6 of primary school, Grades 1 and 2 of secondary school
Peer group socialisation, social acceptance
Nakken & Pijl (2002) Sensory, motor and/or intellectual disabilities
Age 3-14 (review of 14 studies)
Social relationships
Nikolaraizi & De Reybekiel (2001)
Deafness, blindness, physical disability (use of wheelchair)
Grades 5-6 (age 10-12)
Interactions, friendship
Attwood (2000)
Asperger Syndrome No specification Social interactions, peer relationships
Cava & Musitu (2000) Socioaffective difficulties Grades 5 -8 Interpersonal relationships (as measured by sociometric questionnaire), peer acceptance
Flem & Keller (2000)
No specification No specification Social relationships
Odom (2000) Disabilities (no further specification)
Preschool Social acceptance and social rejection
Schmidt (2000)
Learning disabilities Grade 4 Frequency and intensity of social contacts
Brown, Odom, Li & Zercher (1999)
Mild to moderate, severe, and multiple disabilities
Preschool Social interactions, social initiations, social bids, social behaviours
Guralnick (1999) Mild disabilities Preschool Connectedness (or extent) of peer interactions, quality of interpersonal relationships, nature of adjustments during social exchanges
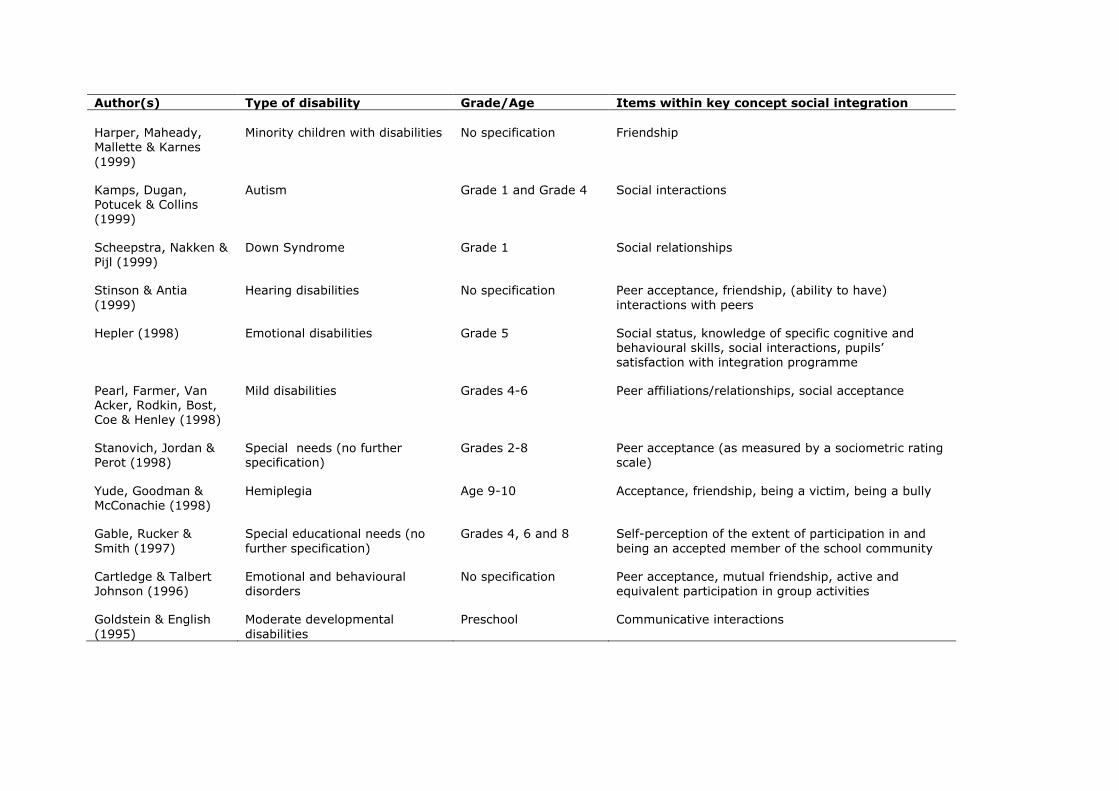
Author(s) Type of disability Grade/Age Items within key concept social integration
Harper, Maheady, Mallette & Karnes (1999)
Minority children with disabilities
No specification
Friendship
Kamps, Dugan, Potucek & Collins (1999)
Autism Grade 1 and Grade 4 Social interactions
Scheepstra, Nakken & Pijl (1999)
Down Syndrome Grade 1 Social relationships
Stinson & Antia (1999)
Hearing disabilities No specification Peer acceptance, friendship, (ability to have) interactions with peers
Hepler (1998) Emotional disabilities Grade 5 Social status, knowledge of specific cognitive and behavioural skills, social interactions, pupils’ satisfaction with integration programme
Pearl, Farmer, Van Acker, Rodkin, Bost, Coe & Henley (1998)
Mild disabilities Grades 4-6 Peer affiliations/relationships, social acceptance
Stanovich, Jordan & Perot (1998)
Special needs (no further specification)
Grades 2-8 Peer acceptance (as measured by a sociometric rating scale)
Yude, Goodman & McConachie (1998)
Hemiplegia Age 9-10 Acceptance, friendship, being a victim, being a bully
Gable, Rucker & Smith (1997)
Special educational needs (no further specification)
Grades 4, 6 and 8 Self-perception of the extent of participation in and being an accepted member of the school community
Cartledge & Talbert Johnson (1996)
Emotional and behavioural disorders
No specification Peer acceptance, mutual friendship, active and equivalent participation in group activities
Goldstein & English (1995)
Moderate developmental disabilities
Preschool Communicative interactions
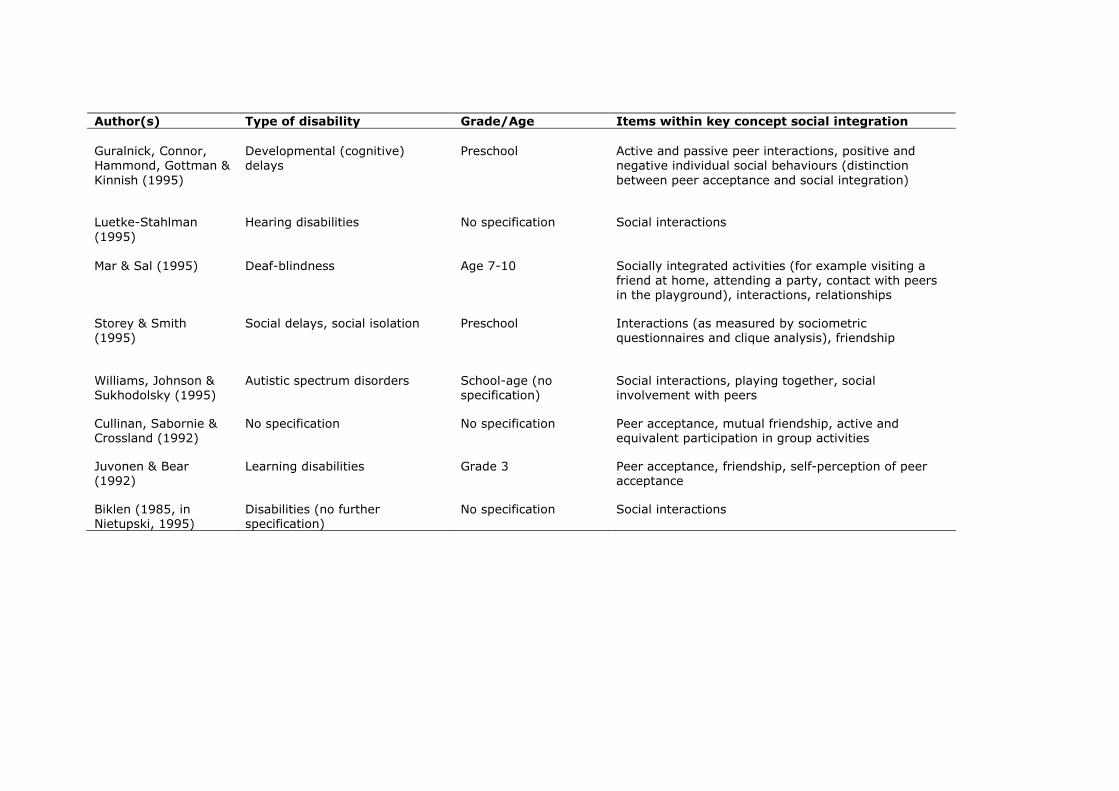
Author(s) Type of disability Grade/Age Items within key concept social integration
Guralnick, Connor, Hammond, Gottman & Kinnish (1995)
Developmental (cognitive) delays
Preschool
Active and passive peer interactions, positive and negative individual social behaviours (distinction between peer acceptance and social integration)
Luetke-Stahlman (1995)
Hearing disabilities
No specification Social interactions
Mar & Sal (1995) Deaf-blindness Age 7-10 Socially integrated activities (for example visiting a friend at home, attending a party, contact with peers in the playground), interactions, relationships
Storey & Smith (1995)
Social delays, social isolation Preschool Interactions (as measured by sociometric questionnaires and clique analysis), friendship
Williams, Johnson & Sukhodolsky (1995)
Autistic spectrum disorders School-age (no specification)
Social interactions, playing together, social involvement with peers
Cullinan, Sabornie & Crossland (1992)
No specification No specification Peer acceptance, mutual friendship, active and equivalent participation in group activities
Juvonen & Bear (1992)
Learning disabilities Grade 3 Peer acceptance, friendship, self-perception of peer acceptance
Biklen (1985, in Nietupski, 1995)
Disabilities (no further specification)
No specification Social interactions
A LITERATURE STUDY FOCUSING ON THE SOCIAL DIMENSION OF INCLUSION IN EDUCATION
61
3.5 Social inclusion
In the former section a distinction was made between explicit and implicit
definitions of social integration. A similar distinction cannot be made for social
inclusion, since the analysis of articles only reveals implicit definitions.
De Monchy, Pijl and Zandberg (2004) examine the social inclusion of pupils with
behavioural problems. The authors do not define social inclusion, but the aspects
which they consider to be important for social inclusion may be derived from
their measuring instruments. De Monchy et al. (2004) assess the social inclusion
of pupils with behavioural problems by measuring their social position in the
classroom and by examining the degree to which they are bullied by classmates
or they actively bully other pupils themselves. The social position of the pupils is
described in terms of being liked, performing a task together and number of
friends. Similar aspects of social inclusion (acceptance, friendship, being a victim
and being a bully) are distinguished by Yude et al. (1998) and Savage (2005).
Ring and Travers (2005) describe the inclusion of a pupil with severe general
learning difficulties in a mainstream school. Data about the pupil’s level of social
inclusion are based on the pupil’s sociometric status, the frequency and nature of
interactions with classmates and the number of acknowledged and
unacknowledged initiatives to make contact with classmates.
Skårbrevik (2005) examines the social inclusion of pupils with special needs in
mainstream Norwegian classrooms using a teacher questionnaire. The
questionnaire comprises ten questions, covering a pupil’s participation in play
and activities, being alone during break times, being teased by other pupils,
invitations to parties and taking the lead in social activities - aspects seen as
essential for social inclusion. This is in line with Hunt, Alwell, Farron-Davis and
Goetz (1996), who investigated the effectiveness of an intervention designed to
facilitate the social inclusion of three pupils with severe multiple special needs by
promoting social relationships, friendships and interactive partnerships between
pupils. This implies that Hunt et al. (1996) see these three aspects as the core of
social inclusion.
Taylor, Asher and Williams (1987, in Frederickson & Furnham, 2004) are less
extensive in their description and measurement of social inclusion. They
examined the social inclusion of pupils with moderate learning difficulties by
using positive peer nominations and a play-rating scale. Frederickson and Turner
CHAPTER 3
62
(2003) also include a sociometric rating scale to assess social inclusion. They
evaluate the Circle of Friends intervention approach, aimed at improving the
social acceptance/social inclusion (the terms are used interchangeably) of pupils
with special needs. They state that the average play rating (acquired via a
sociometric rating scale) given by classmates provides a measure of social
acceptance/social inclusion during this activity. The evaluation also includes
teachers’ views on the social acceptance of pupils with special needs and the
self-perception of the pupils on their social acceptance. Just like Frederickson and
Turner (2003), Pavri and Luftig (2000) include pupils’ own perceptions in
assessing social inclusion. They examine the ‘social face’ of inclusive education
by investigating the perceived loneliness, social competence and social status of
pupils with learning disabilities in such a setting.
3.5.1 Summary of the definitions of social inclusion
The analysis of social inclusion reveals several aspects. Friendship, acceptance,
interaction, relationships, social status and bullying are aspects described most
frequently. Others include performing a task together, initiation, interactive
partnerships, pupils’ self-perception of acceptance, perceived loneliness and
perceived social competence. For an overview of the outcomes we refer to Table
2.
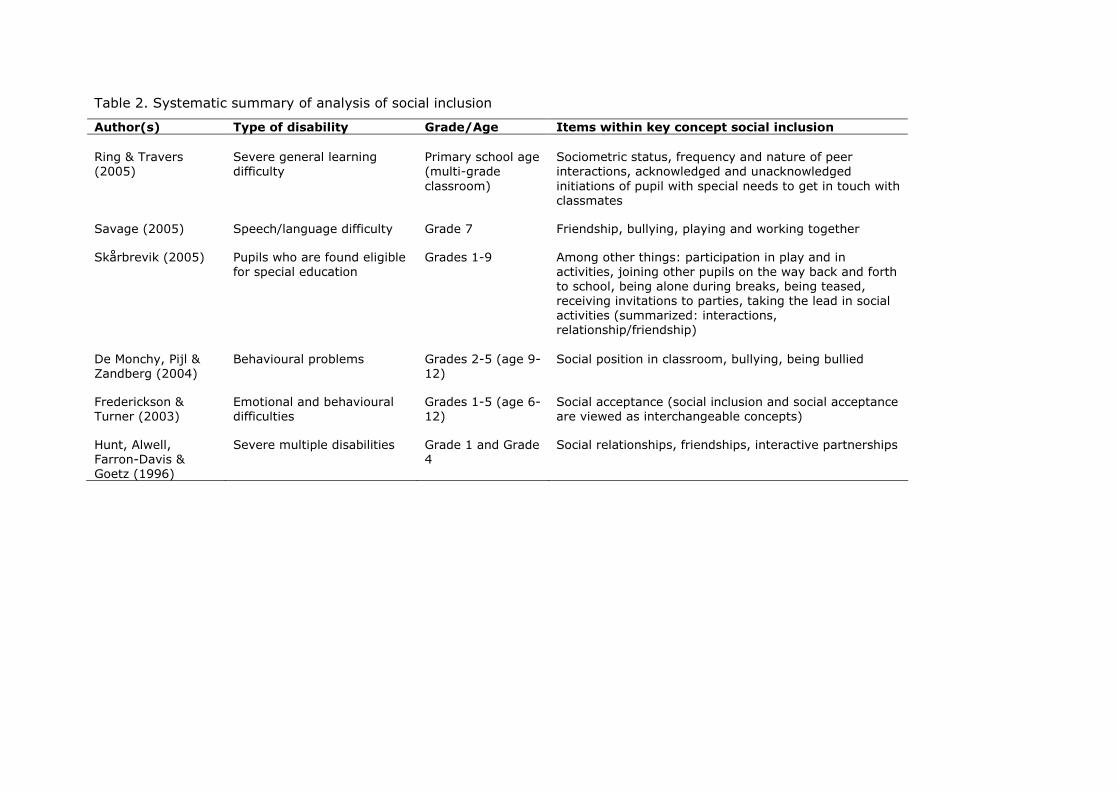
Table 2. Systematic summary of analysis of social inclusion
Author(s) Type of disability Grade/Age Items within key concept social inclusion
Ring & Travers (2005)
Severe general learning difficulty
Primary school age (multi-grade classroom)
Sociometric status, frequency and nature of peer interactions, acknowledged and unacknowledged initiations of pupil with special needs to get in touch with classmates
Savage (2005)
Speech/language difficulty Grade 7 Friendship, bullying, playing and working together
Skårbrevik (2005) Pupils who are found eligible for special education
Grades 1-9 Among other things: participation in play and in activities, joining other pupils on the way back and forth to school, being alone during breaks, being teased, receiving invitations to parties, taking the lead in social activities (summarized: interactions, relationship/friendship)
De Monchy, Pijl & Zandberg (2004)
Behavioural problems Grades 2-5 (age 9-12)
Social position in classroom, bullying, being bullied
Frederickson & Turner (2003)
Emotional and behavioural difficulties
Grades 1-5 (age 6-12)
Social acceptance (social inclusion and social acceptance are viewed as interchangeable concepts)
Hunt, Alwell, Farron-Davis & Goetz (1996)
Severe multiple disabilities Grade 1 and Grade 4
Social relationships, friendships, interactive partnerships
CHAPTER 3
64
3.6 Social participation
The analysis of articles featuring social participation also only reveals implicit
definitions. Of all the researchers describing social participation, Kennedy,
Cushing and Itkonen (1997) and Kennedy, Shukla and Fryxell (1997) are most
explicit in their descriptions. According to Kennedy, Cushing et al. (1997) social
participation comprises two aspects: social contacts between pupils with special
needs and their typical classmates and friendship networks. In another study
(Kennedy, Shukla et al. 1997) the concept of social participation is extended to
include a third dimension: social support behaviours (like greetings, material aids
and emotional support).
Hunt, Soto, Maier and Doering (2003) investigated the effectiveness of a
mainstream / special education collaborative process on the academic and social
participation of pupils with severe disabilities and pupils academically at risk in
mainstream classrooms. To assess the social participation of the pupils, the level
of their engagement and interaction patterns (e.g. initiating and responding to
interactions, participating in conversations, working collaboratively) with
classmates were systematically observed (Hunt et al., 2003). In another study
(Hunt, Soto, Maier, Müller & Goetz, 2002), the social participation of pupils with
augmentative and alternative communication (AAC) needs in mainstream
classrooms was studied. Again, the interaction patterns between pupils were
central in assessing social participation. Not only the frequency of the
interactions, but also the quality (i.e. positive, neutral or negative) and their
communicative function (i.e. a request, protest, comment, or assistance) were
identified. The research of Hunt et al. (2002) shows that social interaction
between pupils with special needs and their classmates seems to be at the core
of social participation. Just like Hunt et al. (2002), Bayliss (1995) emphasizes the
significance of the quality of interaction between pupils with special needs and
their typical peers and the importance of having familiar and equal relationships
between pupils.
Ialongo, Edelsohn, Werthamer-Larsson, Crockett and Kellam (1996) assess the
social participation of first-grade pupils with symptoms of anxiety and
depression. Their measuring instrument (the Peer Assessment) shows that social
participation, among other things, is about playing with other children and the
ability to make friends. Bokhorst, Goossens and De Ruyter (2001) also focus on
A LITERATURE STUDY FOCUSING ON THE SOCIAL DIMENSION OF INCLUSION IN EDUCATION
65
the social participation of anxious pupils. To measure social participation,
observations took place during breaktimes. The authors used an observation
scale which distinguished five levels of increasing social participation, ranging
from ‘unoccupied/not looking’ to ‘cooperative play’. Also Harper and McCluskey
(2002) distinguish levels of social participation by pupils with special needs. They
compare the free-play social behaviours of children with special needs in
inclusive preschool programmes with those of their typically developing
classmates. Four levels of social participation were distinguished, ranging from
‘solitary’ to ‘interaction’ (Harper & McClusky, 2002). In presenting their research
results the authors use the terms ‘social integration’ and ‘social participation’
interchangeably. Just like Harper and McCluskey (2002), Mirenda (1998, in
Power & Hyde, 2002) distinguishes four levels of social participation: none,
involved, active and competitive. The first level implies that the pupil with special
needs is not involved in social activities or in interaction with peers. A socially
competitive pupil is actively involved in the social dynamics of the group, exerts
influence within it and determines his/her own involvement in social activities
(Mirenda, 1998, in Power & Hyde, 2002).
In the ‘International Classification of Functioning, Disability and Health’ (ICF),
developed by the World Health Organization (WHO, 2001), ‘Activities and
Participation’ is an important component in the classification scheme. Domains
within this, which are relevant to the school situation, focus on interpersonal
interaction and relationships.
3.6.1 Summary of the definitions of social participation
The analysis of social participation makes clear that interactions comprise the
most important part of social participation. In addition, friendships, friendship
networks, (lasting) relationships, playing together and social contacts are
described by researchers as major aspects of social participation. Others include
social support behaviours, involvement in group activities and being solitary. See
Table 3 for an overview of the outcomes.
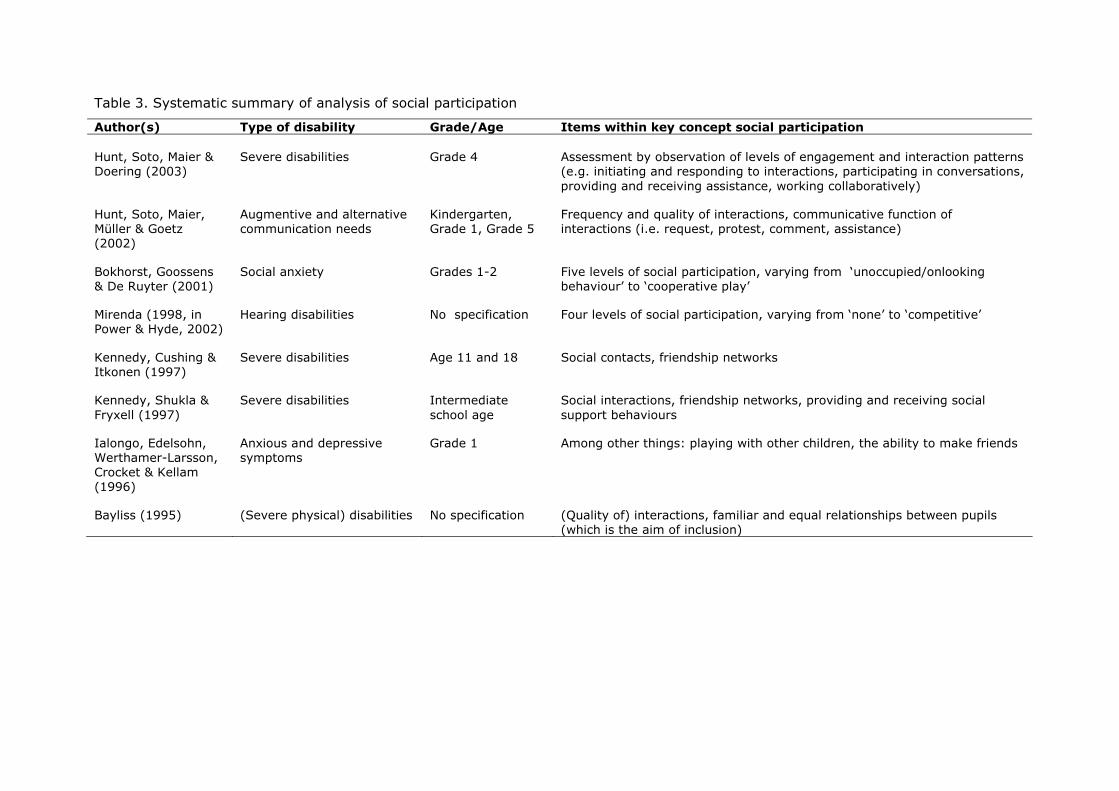
Table 3. Systematic summary of analysis of social participation
Author(s) Type of disability Grade/Age Items within key concept social participation
Hunt, Soto, Maier & Doering (2003)
Severe disabilities
Grade 4
Assessment by observation of levels of engagement and interaction patterns (e.g. initiating and responding to interactions, participating in conversations, providing and receiving assistance, working collaboratively)
Hunt, Soto, Maier, Müller & Goetz (2002)
Augmentive and alternative communication needs
Kindergarten, Grade 1, Grade 5
Frequency and quality of interactions, communicative function of interactions (i.e. request, protest, comment, assistance)
Bokhorst, Goossens & De Ruyter (2001)
Social anxiety Grades 1-2 Five levels of social participation, varying from ‘unoccupied/onlooking behaviour’ to ‘cooperative play’
Mirenda (1998, in Power & Hyde, 2002)
Hearing disabilities No specification Four levels of social participation, varying from ‘none’ to ‘competitive’
Kennedy, Cushing & Itkonen (1997)
Severe disabilities Age 11 and 18 Social contacts, friendship networks
Kennedy, Shukla & Fryxell (1997)
Severe disabilities Intermediate school age
Social interactions, friendship networks, providing and receiving social support behaviours
Ialongo, Edelsohn, Werthamer-Larsson, Crocket & Kellam (1996)
Anxious and depressive symptoms
Grade 1 Among other things: playing with other children, the ability to make friends
Bayliss (1995) (Severe physical) disabilities No specification (Quality of) interactions, familiar and equal relationships between pupils (which is the aim of inclusion)
A LITERATURE STUDY FOCUSING ON THE SOCIAL DIMENSION OF INCLUSION IN EDUCATION
67
3.7 Other related concepts
Several studies describe aspects of social integration, social inclusion or social
participation without mentioning these umbrella concepts. Peer acceptance or
social acceptance is a concept frequently used by researchers. Frederickson and
Furnham (1998), Cook and Semmel (1999), Manetti, Schneider and Siperstein
(2001), Davis, Howell and Cooke (2002), Kemp and Carter (2002), Scholtes,
Vermeer and Meek (2002), Doll, Murphy and Song (2003), and Kuhne and
Wiener (2000) consider peer acceptance (as measured by sociometric
questionnaires) to be of great importance in inclusive education. Arendse,
Vermeer and Severijnen (1998) and Scholtes et al. (2002) stress the importance
of perceived social acceptance. They measured this together with perceived
competence. Peers’ acceptance of children with cerebral palsy focused on aspects
like playing with friends at home, playing with friends in the playground,
receiving invitations to birthday parties, staying at a friend’s home and sitting
next to other children. Besides acceptance, Davis et al. (2002) emphasize the
importance of peer relations and friendships between pupils with special needs
and their typical peers.
Kanioglou, Tsorbatzoudis and Barkoukis (2005) and Conderman (1995) focus on
the social status of pupils with special needs in inclusive classrooms. Kanioglou et
al. (2005) examined the socialisation of primary school pupils described as
having developmental coordination disorders by measuring their social status in
the classroom using a sociogram while Conderman (1995) used a sociogram to
assess the social status of sixth and seventh graders with learning difficulties.
Contrary to these authors, Hall and McGregor (2000) believe that assessment
restricted to the social status of pupils with special needs might overlook
essential aspects. Children may have reciprocal relationships regardless of their
social status. Siperstein and Leffert (1997) as well as Cook and Semmel (1999)
also emphasize the need to go beyond sociometric assessments to examine
relationships of pupils with intellectual disabilities in greater depth, using
interviews focusing on qualitative features of relationships, as well as direct
observation of the behavioural manifestations of friendship.
Vaughn, Elbaum, Schumm and Hughes (1998) describe the social outcomes for
pupils with and without learning disabilities in inclusive classrooms more
extensively, focusing on peer acceptance, friendship and friendship quality, social
CHAPTER 3
68
skills and self-concept. Kemp and Carter (2002) also focus on more than one
aspect. Besides emphasising social acceptance in their study, they focus on the
social skills of pupils with intellectual disabilities and the social interactions
between these pupils and their classmates.
3.7.1 Summary of the definitions of other related concepts
The majority of researchers not using concepts like social integration, social
inclusion or social participation focus on peer- or social acceptance. Next to peer
acceptance, self-perceived social acceptance, (reciprocal) relationships,
friendships, social skills, social status, social interaction, self-concept and
perceived competence are also used as important aspects of inclusion in
education. Table 4 presents an overview of the outcomes.
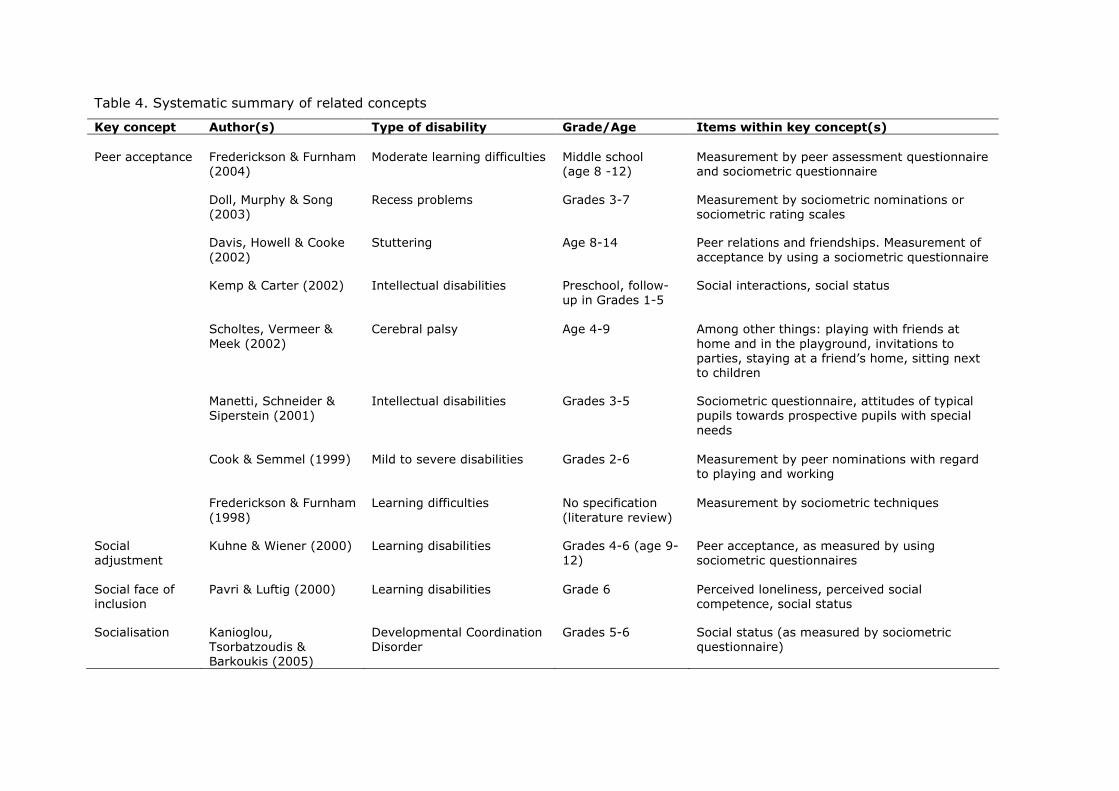
Table 4. Systematic summary of related concepts
Key concept Author(s) Type of disability Grade/Age Items within key concept(s)
Peer acceptance
Frederickson & Furnham (2004)
Moderate learning difficulties
Middle school (age 8 -12)
Measurement by peer assessment questionnaire and sociometric questionnaire
Doll, Murphy & Song (2003)
Recess problems Grades 3-7 Measurement by sociometric nominations or sociometric rating scales
Davis, Howell & Cooke (2002)
Stuttering Age 8-14 Peer relations and friendships. Measurement of acceptance by using a sociometric questionnaire
Kemp & Carter (2002) Intellectual disabilities Preschool, follow-up in Grades 1-5
Social interactions, social status
Scholtes, Vermeer & Meek (2002)
Cerebral palsy Age 4-9 Among other things: playing with friends at home and in the playground, invitations to parties, staying at a friend’s home, sitting next to children
Manetti, Schneider & Siperstein (2001)
Intellectual disabilities Grades 3-5 Sociometric questionnaire, attitudes of typical pupils towards prospective pupils with special needs
Cook & Semmel (1999) Mild to severe disabilities Grades 2-6 Measurement by peer nominations with regard to playing and working
Frederickson & Furnham (1998)
Learning difficulties No specification (literature review)
Measurement by sociometric techniques
Social adjustment
Kuhne & Wiener (2000) Learning disabilities Grades 4-6 (age 9-12)
Peer acceptance, as measured by using sociometric questionnaires
Social face of inclusion
Pavri & Luftig (2000) Learning disabilities Grade 6 Perceived loneliness, perceived social competence, social status
Socialisation Kanioglou, Tsorbatzoudis & Barkoukis (2005)
Developmental Coordination Disorder
Grades 5-6 Social status (as measured by sociometric questionnaire)
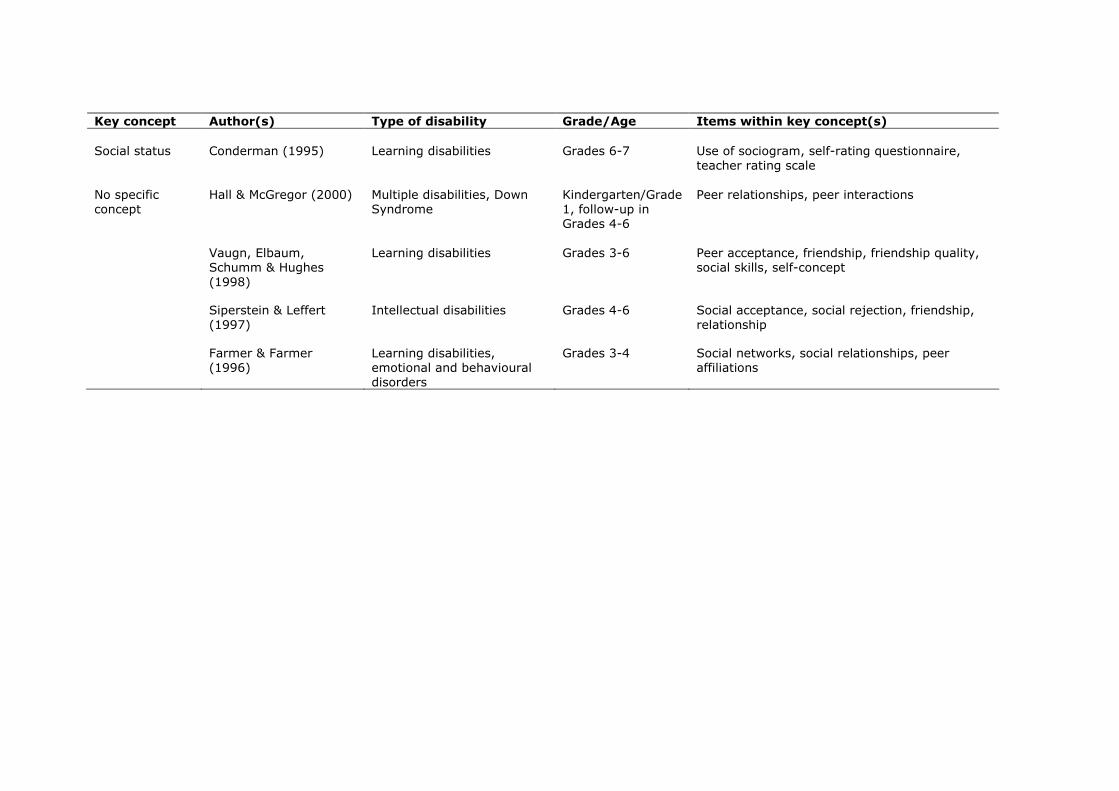
Key concept Author(s) Type of disability Grade/Age Items within key concept(s)
Social status
Conderman (1995)
Learning disabilities
Grades 6-7
Use of sociogram, self-rating questionnaire, teacher rating scale
No specific concept
Hall & McGregor (2000) Multiple disabilities, Down Syndrome
Kindergarten/Grade 1, follow-up in Grades 4-6
Peer relationships, peer interactions
Vaugn, Elbaum, Schumm & Hughes (1998)
Learning disabilities Grades 3-6 Peer acceptance, friendship, friendship quality, social skills, self-concept
Siperstein & Leffert (1997)
Intellectual disabilities Grades 4-6 Social acceptance, social rejection, friendship, relationship
Farmer & Farmer (1996)
Learning disabilities, emotional and behavioural disorders
Grades 3-4 Social networks, social relationships, peer affiliations
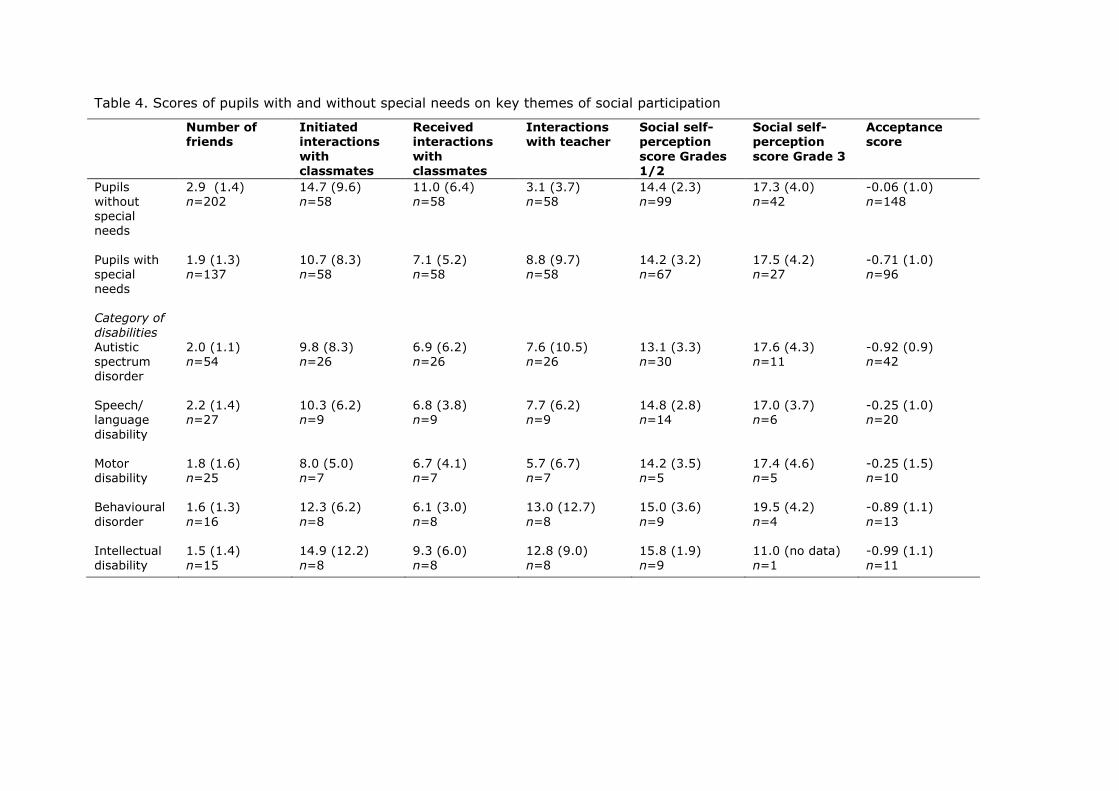
Table 4. Scores of pupils with and without special needs on key themes of social participation
Number of
friends
Initiated
interactions
with
classmates
Received
interactions
with
classmates
Interactions
with teacher
Social self-
perception
score Grades
1/2
Social self-
perception
score Grade 3
Acceptance
score
Pupils without special needs
2.9 (1.4) n=202
14.7 (9.6) n=58
11.0 (6.4) n=58
3.1 (3.7) n=58
14.4 (2.3) n=99
17.3 (4.0) n=42
-0.06 (1.0) n=148
Pupils with special needs
1.9 (1.3) n=137
10.7 (8.3) n=58
7.1 (5.2) n=58
8.8 (9.7) n=58
14.2 (3.2) n=67
17.5 (4.2) n=27
-0.71 (1.0) n=96
Category of
disabilities
Autistic spectrum disorder
2.0 (1.1) n=54
9.8 (8.3) n=26
6.9 (6.2) n=26
7.6 (10.5) n=26
13.1 (3.3) n=30
17.6 (4.3) n=11
-0.92 (0.9) n=42
Speech/ language disability
2.2 (1.4) n=27
10.3 (6.2) n=9
6.8 (3.8) n=9
7.7 (6.2) n=9
14.8 (2.8) n=14
17.0 (3.7) n=6
-0.25 (1.0) n=20
Motor disability
1.8 (1.6) n=25
8.0 (5.0) n=7
6.7 (4.1) n=7
5.7 (6.7) n=7
14.2 (3.5) n=5
17.4 (4.6) n=5
-0.25 (1.5) n=10
Behavioural disorder
1.6 (1.3) n=16
12.3 (6.2) n=8
6.1 (3.0) n=8
13.0 (12.7) n=8
15.0 (3.6) n=9
19.5 (4.2) n=4
-0.89 (1.1) n=13
Intellectual disability
1.5 (1.4) n=15
14.9 (12.2) n=8
9.3 (6.0) n=8
12.8 (9.0) n=8
15.8 (1.9) n=9
11.0 (no data) n=1
-0.99 (1.1) n=11
A LITERATURE STUDY FOCUSING ON THE SOCIAL DIMENSION OF INCLUSION IN EDUCATION
71
3.8 Conclusion
The analysis of literature (presented in Tables 1 - 4) confirms our assumption
that the social dimension of inclusion is described in numerous ways. This does
not imply that the various authors attach very different meanings to these
concepts. On the contrary, the analysis of the 62 articles shows that the concept
of social integration and its related concepts, social inclusion and social
participation, hardly seem to differ in practice with respect to content, if at all.
These three different concepts are often used in very similar ways. In daily
(research) practice the concepts social integration, social inclusion and social
participation are used almost synonymously. Much has been written about the
differences, especially between the concepts integration and inclusion (Booth,
2004; Hegarty, 1991), but in describing the social dimension of inclusion these
differences in meaning seem suddenly irrelevant to most authors. This fact is
visualized in Figure 1.
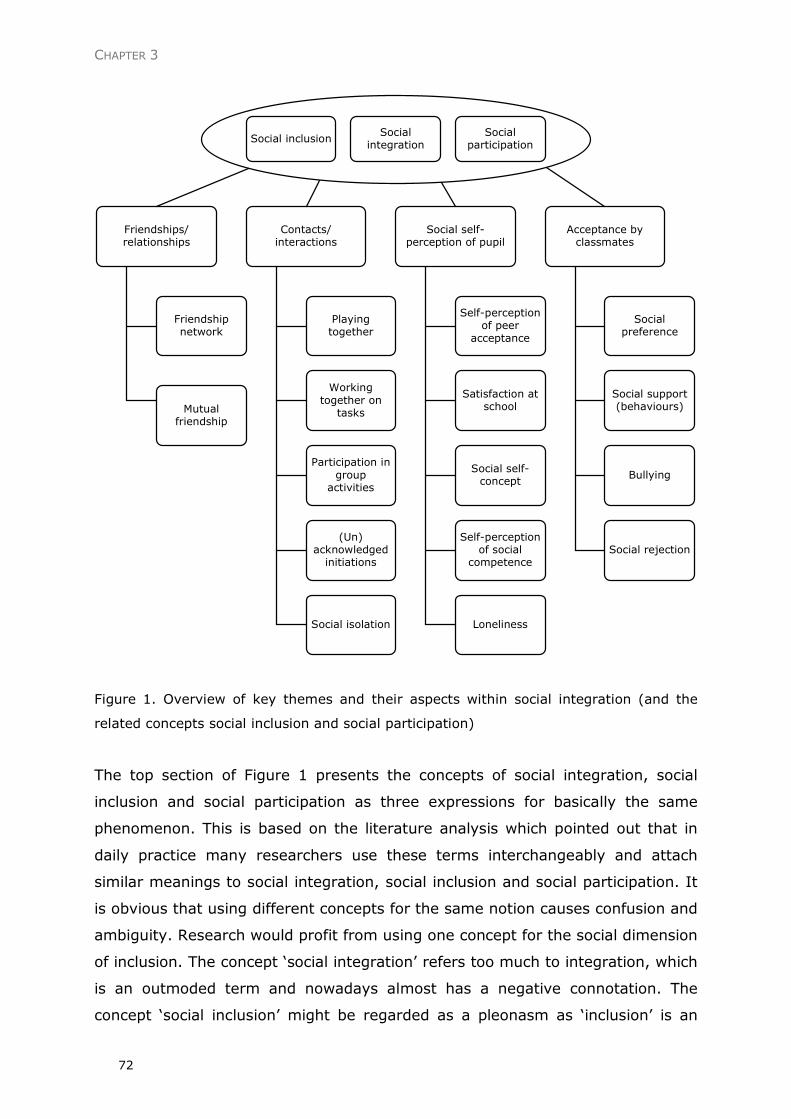
CHAPTER 3
72
Friendships/relationships
Contacts/interactions
Friendship network
Mutual friendship
Playing together
Working together on
tasks
Participation in group
activities
(Un) acknowledged initiations
Social isolation
Social self-perception of pupil
Self-perception of peer
acceptance
Satisfaction at school
Social self-concept
Self-perception of social
competence
Loneliness
Acceptance by classmates
Social preference
Social support (behaviours)
Bullying
Social rejection
Social inclusionSocial
integrationSocial
participation
Figure 1. Overview of key themes and their aspects within social integration (and the
related concepts social inclusion and social participation)
The top section of Figure 1 presents the concepts of social integration, social
inclusion and social participation as three expressions for basically the same
phenomenon. This is based on the literature analysis which pointed out that in
daily practice many researchers use these terms interchangeably and attach
similar meanings to social integration, social inclusion and social participation. It
is obvious that using different concepts for the same notion causes confusion and
ambiguity. Research would profit from using one concept for the social dimension
of inclusion. The concept ‘social integration’ refers too much to integration, which
is an outmoded term and nowadays almost has a negative connotation. The
concept ‘social inclusion’ might be regarded as a pleonasm as ‘inclusion’ is an
A LITERATURE STUDY FOCUSING ON THE SOCIAL DIMENSION OF INCLUSION IN EDUCATION
73
extensive concept which logically embraces the social dimension. That leaves us
with the concept ‘social participation’ as the most suitable concept for the social
dimension of inclusion. In the remainder of this article we will therefore use the
term ‘social participation’.
The analysis of literature further revealed four key themes central to social
participation. These are presented on the second line in Figure 1:
• friendships/relationships;
• contacts/interactions;
• social self-perception of the pupil;
• acceptance by classmates.
Based on these key themes, the following provisional description of social
participation is formulated:
‘Social participation of pupils with special needs in regular education is the
presence of positive social contact/interaction between these children and their
classmates; acceptance of them by their classmates; social
relationships/friendships between them and their classmates and the pupils’
perception they are accepted by their classmates’.
Finally Figure 1 presents an overview of the various ways in which the four key
themes are usually measured in the literature surveyed here.
3.9 Discussion
Inclusive education is often used as a concept referring to a broad process in
schools and their local communities (see Booth & Ainscow, 2002). At the same
time it is used to refer to an education system that meets the needs of a wide
diversity of pupils. It focuses not only on academic issues, but also on meeting
pupils’ physical, social and emotional needs. Illustrative is the OECD definition
(1995) which focuses on the “process which maximises the interaction between
disabled and non-disabled pupils”. Recent literature on inclusive education has
emphasized the importance of meeting social needs more emphatically.
It is therefore not surprising that several research studies have addressed this
topic. Researchers looked at whether pupils with special needs managed to have
contacts and friendships with their peers in inclusive settings and were interested
in the reactions of these peers. In studying this topic, however, a wide array of
barely defined concepts and research instruments were used. This resulted in a
CHAPTER 3
74
collection of studies reporting on very different aspects while using the same
concepts and in studies using very different concepts but actually describing the
same phenomena.
This study focuses on clarifying such concepts as social integration, social
inclusion and social participation. It is apparent that these concepts are often
defined inaccurately, with only a few authors defining what they mean. In most
cases, implicit definitions can be derived from instruments used to measure
social integration, social inclusion or social participation. Several articles even
lack implicit definitions.
The analysis of literature further shows that definitions of the concepts and their
operationalisation in research instruments are often mixed up. For example, in
several studies social acceptance is regarded as an important aspect of inclusive
education. However, in other studies social acceptance is viewed as an
operational transcription of umbrella concepts like ‘social integration’, ‘social
inclusion’ or ‘social participation’. Researchers also use concepts like ‘social
acceptance’, ‘social preference’, or ‘social nominations’ and suggest that these
are very different. In fact these are all associated with sociometry. By means of
sociometric questionnaires, social preference scores and social impact scores can
be calculated, mostly on the basis of received nominations. With these scores,
the degree of social acceptance or peer acceptance can be assessed. It is
important to realise that these terms all amount to the same idea.
Many studies use the concepts ‘social integration’, ‘social inclusion’ and ‘social
participation’ as if they mean exactly the same. The elaborations of these
concepts largely overlap and in practice hardly differ from each other. It is
therefore proposed to use only the term ‘social participation’ for the social
dimension of inclusion. It was further possible to distinguish four key themes
within the concept of social participation. The analysis of literature shows that
some studies focus on only one or two of these themes or on aspects of them.
We wish to emphasize that the importance of each of these themes might differ
for different pupils. Figure 1 enables researchers to select, in accordance with
their sample, their own criteria for social participation.
The provisional description of social participation and its key themes are based
on the outcomes of the literature analysis. It must be remembered that our
conclusions are limited to primary education. Possibly, an exploration of
A LITERATURE STUDY FOCUSING ON THE SOCIAL DIMENSION OF INCLUSION IN EDUCATION
75
literature which aims at secondary or post secondary education might reveal
other themes (or other accents within the themes) of social participation.
Keeping in mind this limitation, the analysis described in this article should be
considered as a first step in elucidating the concepts of social integration, social
inclusion and social participation. In further research, the translation of the key
themes into operational concepts should be central. When it is clear in which
manner the themes can be measured, the social participation of pupils with
special needs in regular primary schools can be monitored and problems can be
noticed in time. As the inclusion of pupils with special needs into mainstream
education is becoming increasingly common worldwide, the monitoring of this
major facet of inclusion is of great importance.
3.10 References
Arendse, A., Vermeer, A. & Severijnen, J. (1998). De Platenschaal voor zelf
waargenomen competentie en sociale acceptatie bij kinderen met
cerebrale parese: een factoranalytisch onderzoek. Bewegen &
Hulpverlening, 15, 224-234.
Attwood, T. (2000). Strategies for improving the social integration of children
with Asperger syndrome. Autism, 4(1), 85-100.
Bayliss, P. (1995). Integration and interpersonal relations: interactions between
disabled children and their non-disabled peers. British Journal of Special
Education, 22(3), 131-139.
Bokhorst, K., Goossens, F.A. & De Ruyter, P.A. (2001). Early detection of social
anxiety: reliability and validity of a teacher questionnaire for the
identification of social anxiety in young children. Social Behavior and
Personality, 29(8), 787-798.
Booth, T. (2004). Reflection. In P. Clough & J. Corbett (Eds.), Theories of
Inclusive Education (pp. 59-64). London: Sage.
Booth, T. & Ainscow, M. (2002). Index for inclusion. Developing learning and
participation in schools. Bristol: Centre for Studies on Inclusive Education.
Boutot, E.A. & Bryant, D.P. (2005). Social integration of students with autism in
inclusive settings. Education and Training in Developmental Disabilities,
40(1), 14-23.
CHAPTER 3
76
Brown, W.H., Odom, S.L., Li, S. & Zercher, C. (1999). Ecobehavioral assessment
in early childhood programs: a portrait of preschool inclusion. The Journal
of Special Education, 33(3), 138-153.
Cambra, C. & Silvestre, N. (2003). Students with special needs in the inclusive
classroom: social integration and self-concept. European Journal of Special
Needs Education, 18(2), 197-208.
Cartledge, G. & Talbert Johnson, C. (1996). Inclusive classrooms for students
with emotional and behavioral disorders: critical variables. Theory into
Practice, 35(1), 51-57.
Cava, M.J. & Musitu, G. (2000). Evaluation of an intervention programme for the
empowerment of self-esteem. Psychology in Spain, 4(1), 55-63.
Coben, S.S. & Zigmond, N. (1986). The social integration of learning disabled
students from self-contained to mainstream elementary school settings.
Journal of Learning Disabilities, 19(10), 614-618.
Cole, D.A. & Meyer, L.H. (1991). Social integration and severe disabilities: a
longitudinal analysis of child outcomes. The Journal of Special Education,
25(3), 340-351.
Conderman, G. (1995). Social status of sixth- and seventh-grade students with
learning disabilities. Learning Disability Quarterly, 18, 13-24.
Cook, B.G. & Semmel, M.I. (1999). Peer acceptance of included students with
disabilities as a function of severity of disability and classroom
composition. The Journal of Special Education, 33(1), 50-61.
Cullinan, D., Sabornie, E.J. & Crossland, C.L. (1992). Social mainstreaming of
mildly handicapped students. The Elementary School Journal, 92(3), 339-
351.
Davis, S., Howell, P. & Cooke, F. (2002). Sociodynamic relationships between
children who stutter and their non-stuttering classmates. Journal of Child
Psychology and Psychiatry, 43(7), 939-947.
De Monchy, M., Pijl, S.J. & Zandberg, T.J. (2004). Discrepancies in judging social
inclusion and bullying of pupils with behaviour problems. European Journal
of Special Needs Education, 19(3), 317-330.
Doll, B., Murphy, P. & Song, S.Y. (2003). The relationship between children’s
self-reported recess problems and peer acceptance and friendships.
Journal of School Psychology, 41, 113-130.
A LITERATURE STUDY FOCUSING ON THE SOCIAL DIMENSION OF INCLUSION IN EDUCATION
77
Dyson, L.L. (2005). Kindergarten children’s understanding of and attitudes
toward people with disabilities. Topics in Early Childhood Special
Education, 25(2), 95-105.
Farmer, T.W. & Farmer, E.M.Z. (1996). Social relationships of students with
exceptionalities in mainstream classrooms: social networks and
homophily. Exceptional Children, 62(5), 431-450.
Farrell, P. (2000). The impact of research on developments in inclusive
education. International Journal of Inclusive Education, 4(2), 153-162.
Flem, A. & Keller, C. (2000). Inclusion in Norway: a study of ideology in practice.
European Journal of Special Needs Education, 15(2), 188-205.
Frederickson, N.L. & Furnham, A.F. (2004). Peer-assessed behavioural
characteristics and sociometric rejection: differences between pupils who
have moderate learning difficulties and their mainstream peers. British
Journal of Educational Psychology, 74, 391-410.
Frederickson, N.L. & Furnham, A.F. (1998). Use of sociometric techniques to
assess the social status of mainstreamed children with learning difficulties.
Genetic, Social, and General Psychology Monographs, 124(4), 381-433.
Frederickson, N. & Turner, J. (2003). Utilizing the classroom peer group to
address children’s social needs: an evaluation of the circle of friends
intervention approach. Journal of Special Education, 36(4), 234-245.
Freeman, S.F.N. & Alkin, M. (2000). Academic and social attainments of children
with mental retardation in general education and special education
settings. Remedial and Special Education, 21(1), 3-18.
Gable, R.K., Rucker, C.N. & Smith, E.V. jr. (1997). Assessing student perceptions
of affective outcomes of special education programs: instrument
development, validation, and comparisons to regular education students.
Educational and Psychological Measurement, 57(4), 685-697.
Goldstein, H. & English, K. (1995). Use of peers as change agents in
communicative interactions with preschoolers with disabilities. Preventing
School Failure, 39(4), 16-21.
Goodman, H., Gottlieb, J. & Harrison, R.H. (1972). Social acceptance of EMRS
integrated into a non-graded elementary school. American Journal of
Mental Deficiency, 76(4), 412-417.
CHAPTER 3
78
Guralnick, M.J. (1999). The nature and meaning of social integration for young
children with mild developmental delays in inclusive settings. Journal of
Early Intervention, 22(1), 70-86.
Guralnick, M.J., Connor, R.T., Hammond, M., Gottman, J.M. & Kinnish, K. (1995).
Immediate effects of mainstreamed settings on the social interactions and
social integration of preschool children. American Journal on Mental
Retardation, 100(4), 359-377
Hall, L.J. & McGregor, J.A. (2000). A follow-up study of the peer relationships of
children with disabilities in an inclusive school. The Journal of Special
Education, 34(3), 114-126.
Harper, G.F., Maheady, L., Mallette, B. & Karnes, M. (1999). Peer tutoring and
the minority child with disabilities. Preventing School Failure, 43(2), 47-
52.
Harper, L.V. & McCluskey, K.S. (2002). Caregiver and peer responses to children
with language and motor disabilities in inclusive preschool programs. Early
Childhood Research Quarterly, 17, 148-166.
Hegarty, S. (1991). Towards an agenda for research in special education.
European Journal of Special Needs Education, 6, 87-99.
Hepler, J.B. (1998). Social integration of children with emotional disabilities and
nonhandicapped peers in a school setting. Early Child Development and
Care, 147, 99-115.
Hunt, P., Alwell, M., Farron-Davis, F. & Goetz, L. (1996). Creating socially
supportive environments for fully included students who experience
multiple disabilities. Journal of the Association for Persons with Severe
Handicaps, 21(2), 53-71.
Hunt, P., Soto, G., Maier, J. & Doering, K. (2003). Collaborative teaming to
support students at risk and students with severe disabilities in general
education classrooms. Exceptional Children, 69(3), 315-332.
Hunt, P., Soto, G., Maier, J., Müller, E. & Goetz, L. (2002). Collaborative teaming
to support students with augmentive and alternative communication needs
in general education classrooms. Augmentive and Alternative
Communication, 18, 20-35.
Ialongo, N., Edelsohn, G., Werthamer-Larsson, L., Crocket, L. & Kellam, S.
(1996). Social and cognitive impairment in first-grade children with
A LITERATURE STUDY FOCUSING ON THE SOCIAL DIMENSION OF INCLUSION IN EDUCATION
79
anxious and depressive symptoms. Journal of Clinical Child Psychology,
25(1), 15-24.
International Classification of Functioning, Disability and Health (2001). Geneva:
World Health Organization, WHO.
Juvonen, J. & Bear, G. (1992). Social adjustment of children with and without
learning disabilities in integrated classrooms. Journal of Educational
Psychology, 84(3), 322-330.
Kamps, D.M., Dugan, E., Potucek, J. & Collins, A. (1999). Effects of cross-age
peer tutoring networks among students with autism and general education
students. Journal of Behavioral Education, 9(2), 97-115.
Kanioglou, A., Tsorbatzoudis, H. & Barkoukis, V. (2005). Socialization and
behavioral problems of elementary school pupils with developmental
coordination disorder. Perceptual and Motor Skills, 101, 163-173.
Kemp, C. & Carter, M. (2002). The social skills and social status of mainstreamed
students with intellectual disabilities. Educational Psychology, 22(4), 391-
411.
Kennedy, C.H., Cushing, L.S. & Itkonen, T. (1997). General education
participation improves the social contacts and friendship networks of
students with severe disabilities. Journal of Behavioral Education, 7(2),
167-189.
Kennedy, C.H., Shukla, S. & Fryxell, D. (1997). Comparing the effects of
educational placement on the social relationships of intermediate school
students with severe disabilities. Exceptional Children, 64(1), 31-47.
Kobi, E.E. (1983). Praktizierte Integration: Eine Zwischenbilanz.
Vierteljahresschrift für Heilpädagogik und ihre Nachbargebiete, 52(2),
196-216.
Koster, M., Pijl, S.J., Van Houten, E.J. & Nakken, H. (2007). The social position
and development of pupils with SEN in mainstream Dutch primary schools.
European Journal of Special Needs Education, 22(1), 31-46.
Kuhne, M. & Wiener, J. (2000). Stability of social status of children with and
without learning disabilities. Learning Disability Quarterly, 23(1), 64-75.
Larrivee, B. & Horne, M.D. (1991). Social status: a comparison of mainstreamed
students with peers of different ability levels. The Journal of Special
Education, 25(1), 90-101.
CHAPTER 3
80
Luetke-Stahlman, B. (1995). Social interaction: Assessment and intervention
with regard to students who are deaf. American Annals of the Deaf,
140(3), 295-303.
Manetti, M., Schneider, B.H. & Siperstein, G. (2001). Social acceptance of
children with mental retardation: testing the contact hypothesis with an
Italian sample. International Journal of Behavioral Development, 25(3),
279-286.
Mar, H.H. & Sall, N. (1995). Enhancing social opportunities and relationships of
children who are deaf-blind. Journal of Visual Impairment & Blindness,
89(3), 280-287.
Margalit, M. & Efrati, M. (1996). Loneliness, coherence and companionship
among children with learning disorders. Educational Psychology, 16(1),
69-79.
Nakken, H. & Pijl S.J. (2002). Getting along with classmates in regular schools: a
review of the effects of integration on the development of social
relationships. International Journal of Inclusive Education, 6(1), 47-61.
Nietupski, J.A. (1995). The evolution of the lre concept for students with severe
disabilities. Preventing School Failure, 39(3), 40-47.
Nikolaraizi, M. & De Reybekiel, N. (2001). A comparative study of children’s
attitudes towards deaf children, children in wheelchairs and blind children
in Greece and in the UK. European Journal of Special Needs Education,
16(2), 167-182.
Odom, S.L. (2000). Preschool inclusion: what we know and where we go from
here. Topics in Early Childhood Special Education, 20(1), 20-27.
OECD (1995). Integrating pupils with special needs into mainstream schools.
Paris: OECD.
Pavri, S. & Luftig, R. (2000). The social face of inclusive education: are students
with learning disabilities really included in the classroom? Preventing
School Failure, 45(1), 8-14.
Pearl, R., Farmer, T.W., Van Acker, R., Rodkin, P.C., Bost, K.K., Coe, M. &
Henley, W. (1998). The social integration of students with mild disabilities
in general education classrooms: peer group membership and peer-
assessed social behaviour. The Elementary School Journal, 99(2), 167-
185.
A LITERATURE STUDY FOCUSING ON THE SOCIAL DIMENSION OF INCLUSION IN EDUCATION
81
Pijl, S.J. & Hamstra, D. (2005). Assessing pupil development and education in an
inclusive setting. International Journal of Inclusive Education, 9(2), 181-
192.
Power, D. & Hyde, M. (2002). The characteristics and extent of participation of
deaf and hard-of-hearing students in regular classes in Australian schools.
Journal of Deaf Studies and Deaf Education, 7(4), 302-311.
Ring, E. & Travers, J. (2005). Barriers to inclusion: a case study of a pupil with
severe learning difficulties in Ireland. European Journal of Special Needs
Education, 20(1), 41-56.
Sabornie, E.J., Marshall, K.J. & Ellis, E.S. (1990). Restructuring of mainstream
sociometry with learning disabled and nonhandicapped students.
Exceptional Children, 56(4), 314-323.
Savage, R. (2005). Friendship and bullying patterns in children attending a
language base in a mainstream school, Educational Psychology in Practice,
21(1), 23-36.
Scheepstra, A.J.M., Nakken, H. & Pijl, S.J. (1999). Contact with classmates: the
social position of pupils with Down’s Syndrome in Dutch mainstream
education. European Journal of Special Needs Education, 14(3), 212-220.
Schmidt, M. (2000). Social integration of students with learning disabilities.
Developmental Disabilities Bulletin, 28(2), 19-26.
Scholtes, V., Vermeer, A. & Meek, G. (2002). Measuring perceived competence
and social acceptance in children with cerebral palsy. European Journal of
Special Needs Education, 17(1), 77-87.
Siperstein, G.N. & Leffert, J.S. (1997). Comparison of socially accepted and
rejected children with mental retardation. American Journal on Mental
Retardation, 101(4), 339-351.
Skårbrevik, K.J. (2005). The quality of special education for students with special
needs in ordinary classes. European Journal of Special Needs Education,
20(4), 387-401.
Sloper, T. & Tyler, S. (1992). Integration of children with severe learning
difficulties in mainstream schools: evaluation of a pilot study. Educational
and Child Psychology, 9(4), 35-45.
Stanovich, P.J., Jordan, A. & Perot, J. (1998). Relative differences in academic
self-concept and peer acceptance among students in inclusive classrooms.
Remedial & Special Education, 19(2), 120-126.
CHAPTER 3
82
Stinson, M.S. & Antia, S.D. (1999). Considerations in educating deaf and hard-
of-hearing students in inclusive settings. Journal of Deaf Studies and Deaf
Education, 4(2), 163-175.
Stone, W.L. & La Greca, A.M. (1990). The social status of children with learning
disabilities: a re-examination. Journal of Learning Disabilities, 23, 32-37.
Storey, K. & Smith, D.J. (1995). Assessing integration in early childhood
education: clique analysis of social interactions. Education & Treatment of
Children, 18(2), 158-184.
Strayhorn, J.M. & Strain, P.S. (1986). Social and language skills for preventive
mental health: What, how, who and when. In P.S. Strain, M.J. Guralnick
& H. Walker (Eds.), Children’s Social Behavior: Development, assessment
and modifications (pp. 287-330). New York: Academic Press.
Vaughn, S., Elbaum, B.E., Schumm, J.S. & Hughes, M.T. (1998). Social
outcomes for students with and without learning disabilities in inclusive
classrooms. Journal of Learning Disabilities, 31(5), 428-436.
Wiener, J. & Harris, P.J. (1989). Integration, rejection and neglect in learning-
disabled children. In J.J. Dumont, & H. Nakken, (Eds.), Cognitive, Social
and Remedial Aspects (pp. 109-115). Amsterdam/Lisse: Swets &
Zeitlinger.
Williams, S.K., Johnson, C. & Sukhodolsky, D.G. (2005). The role of the school
psychologist in the inclusive education of school-age children with autism
spectrum disorders. Journal of School Psychology, 43, 117-136.
Yude, C., Goodman, R. & McConachie, H. (1998). Peer problems of children with
hemiplegia in mainstream primary schools. Journal of Child Psychology
and Psychiatry, 39(4), 533-541.
Chapter 4 Assessing social participation of pupils with special needs in inclusive education: the construction of a teacher questionnaire1
CHAPTER 4
ASSESSING SOCIAL PARTICIPATION OF PUPILS WITH SPECIAL NEEDS IN INCLUSIVE
EDUCATION: THE CONSTRUCTION OF A TEACHER QUESTIONNAIRE
This article is a slightly adapted version of: Koster, M., Nakken, H., Pijl, S.J., Van Houten, E.J. & Lutje Spelberg, H.C. (in press). Assessing social participation of pupils with special needs in inclusive education: the construction of a teacher questionnaire. Educational Research and Evaluation.
CHAPTER 4
84
Abstract
Increasing the social participation of pupils with special needs is an important
goal of inclusive education. However, making friends and building positive
relations with classmates can be difficult for these pupils. They often have a
lower social position in the classroom than their typical peers. Research has
shown that teachers tend to overestimate their social participation. This study
addresses the development of a questionnaire aimed at helping teachers assess
the social participation of pupils with special needs and is divided into two parts.
In the first part of the study the construction of the teacher questionnaire is
described. The questionnaire consists of 30 statements related to four key
themes of social participation: ‘friendships/relationships’, ‘contacts/interactions’,
‘social self-perception of the pupil’ and ‘acceptance by classmates’, yielding four
subscales.
The second part of the study addresses an empirical study in which the quality of
the questionnaire was examined. A confirmatory factor analysis was conducted in
order to gather empirical evidence about our social participation model. The
outcomes did largely support the division of social participation into four key
themes. The analysis revealed that 22 out of 30 statements correlated strongest
with the subscale they were assigned to.
It turned out that the reliability of the questionnaire was high, whereas the
reliability of the four subscales varied. The construct validity was found to be
mainly acceptable. It is concluded that the questionnaire may become a valuable
tool for teachers to assess the social participation of pupils with special needs.
ASSESSING SOCIAL PARTICIPATION: THE CONSTRUCTION OF A TEACHER QUESTIONNAIRE
85
4.1 Introduction
The inclusion of pupils with special needs into regular education is an important
education policy in many countries. Research has shown that increased social
opportunities are parents’ primary motive for their child’s regular school
placement (Sloper & Tyler, 1992; Strayhorn & Strain, 1986). However, in some
cases positive contacts and friendships between pupils with special needs and
their peers without special needs do not occur spontaneously (Guralnick, Connor,
Hammond, Gottman & Kinnish, 1996; Guralnick, Hammond, Connor & Neville,
2006; Guralnick, Neville, Hammond & Connor, 2007; Lee, Yoo & Bak, 2003;
Scheepstra, Nakken & Pijl, 1999). A study by Frostad and Pijl (2007) of
Norwegian inclusive classrooms suggests that between 20 and 25 per cent of
pupils with special needs are not socially included in their peer group, while for
their typical peers this is only 8 per cent.
A review study by Nakken and Pijl (2002) shows that an evaluation of the effects
of mainstreaming on social contacts between these pupils and their typical peers
provides contradictory conclusions. Some studies report no effects, others report
positive effects (like increase of social contacts and friendships), while a few
report negative effects (like increased bullying and negative interaction). A
problem with evaluating the social aspect of inclusion is the ambiguity of the
concepts researchers use. As described by Koster, Nakken, Pijl and Van Houten
(in press), different concepts are adopted to describe the social dimension of
inclusion. Three umbrella concepts, namely ‘social participation’, ‘social
integration’ and ‘social inclusion’, are used frequently by researchers. However,
there is uncertainty about their meaning. Koster et al. (in press) made a review
of literature aimed at elucidating these concepts and revealing characteristic
themes. The literature used in the review was derived from two sources: the last
six volumes (2000 – 2005) of three prominent journals in the field of special
needs education (‘European Journal of Special Needs Education’, ‘International
Journal of Inclusive Education’ and ‘Scandinavian Journal of Educational
Research’) and a search of two electronic databases (ERIC and PsycINFO) from
January 1995 until December 2005. The articles had to be aimed at elementary
school pupils or preschoolers, while their focus had to be on the social aspect of
inclusion in the school situation (rather than in the wider community). In
reviewing the literature the focus was on the following three themes:
CHAPTER 4
86
• definition of the concepts used;
• relation between the various concepts used;
• any subdivision in themes within the concepts used.
The review, consisting of 62 articles in its final form, showed that the concepts of
‘social participation’, ‘social integration’ and ‘social inclusion’ are often described
loosely, with only a few researchers providing explicit definitions or descriptions.
In the majority of articles, implicit descriptions could be derived from
instruments used to measure the aforementioned concepts. In order to elucidate
the concepts, in each article it was tried to reveal which topics were considered
vital with regard to the social dimension of inclusion. It turned out that various
aspects are used by researchers to describe the same phenomena. Many also
use the three umbrella concepts synonymously. The elaborations of these
concepts largely overlap and in research practice hardly differ from each other.
Koster et al. (in press) recommend using the concept ‘social participation’.
Despite the large number of different aspects, from the review it could be
deduced that researchers agree on the importance of several core topics within
social participation. The review of literature resulted in a provisional description
of social participation and identified four key themes central to this concept:
‘friendships/relationships’, ‘contacts/interactions’, ‘pupil’s social self-perception’
and ‘acceptance by classmates’. These key themes should be seen as a
framework for constructing an instrument to measure social participation. Each
key theme is split into two or more sub-themes, which are also derived from the
review of literature (see Figure 1). The sub-themes are further specifications that
serve as a guide for translating each key theme into operational concepts.
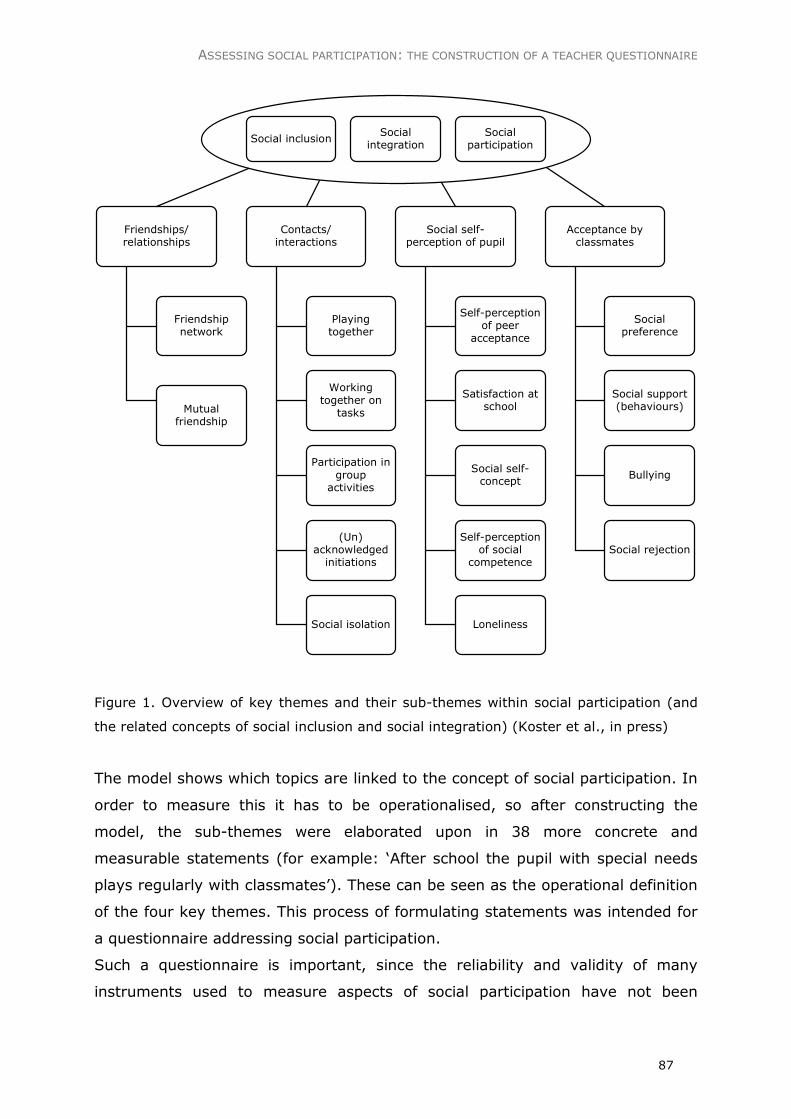
ASSESSING SOCIAL PARTICIPATION: THE CONSTRUCTION OF A TEACHER QUESTIONNAIRE
87
Friendships/relationships
Contacts/interactions
Friendship network
Mutual friendship
Playing together
Working together on
tasks
Participation in group
activities
(Un) acknowledged initiations
Social isolation
Social self-perception of pupil
Self-perception of peer
acceptance
Satisfaction at school
Social self-concept
Self-perception of social
competence
Loneliness
Acceptance by classmates
Social preference
Social support (behaviours)
Bullying
Social rejection
Social inclusionSocial
integrationSocial
participation
Figure 1. Overview of key themes and their sub-themes within social participation (and
the related concepts of social inclusion and social integration) (Koster et al., in press)
The model shows which topics are linked to the concept of social participation. In
order to measure this it has to be operationalised, so after constructing the
model, the sub-themes were elaborated upon in 38 more concrete and
measurable statements (for example: ‘After school the pupil with special needs
plays regularly with classmates’). These can be seen as the operational definition
of the four key themes. This process of formulating statements was intended for
a questionnaire addressing social participation.
Such a questionnaire is important, since the reliability and validity of many
instruments used to measure aspects of social participation have not been
CHAPTER 4
88
proven. For instance, according to Frederickson and Furnham (1998), available
data suggest that the test-retest reliability of the often used sociometric status
group classifications is questionable. This is in line with Bukowksi and Hoza
(1989) who conclude that the stability of many sociometric methods are not
overwhelmingly impressive. Furthermore, Terry and Coie (1991) demonstrate
that different methods to assess pupils’ sociometric status yield diverging results.
Moreover, an instrument which encompasses all aspects of social participation
does not exist: most instruments only measure one aspect of social participation.
Therefore, there is a need for one teacher friendly assessment instrument that
encompasses all important aspects of social participation and which is reliable
and valid. Such an instrument might help teachers monitoring the social
participation of pupils with special needs. This is of importance, all the more
because several studies (De Monchy, Pijl & Zandberg, 2004; Scheepstra et al.,
1999; Whitney, Smith & Thompson, 1994) have shown that teachers’
assessments of the social participation of pupils with special needs in their
classroom are not always appropriate. Teachers tend to overestimate the social
participation of these pupils and to overlook problems like bullying. An
assessment instrument which encompasses the total concept of social
participation might help teachers noticing problems in time. Subsequently,
teachers may be prompted to foster the social participation of pupils with special
needs, for example by encouraging contacts and relationships between these
pupils and their typical classmates.
In this study, the process of operationalising social participation and the
subsequent development of a teacher questionnaire is central. The study is
divided into two parts. The first focuses on constructing a teacher questionnaire
and answers the question of how social participation may be elaborated into a
questionnaire. The second, empirical, part of the study addresses whether such a
questionnaire is a potentially reliable and applicable instrument to assess the
social participation of pupils with special needs in regular primary schools.
ASSESSING SOCIAL PARTICIPATION: THE CONSTRUCTION OF A TEACHER QUESTIONNAIRE
89
4.2 Construction of the social participation questionnaire
4.2.1 Method
Two steps were taken to construct a social participation questionnaire: a panel
was consulted in order to select appropriate statements for this and then a final
selection of statements was made with the assistance of a large group of
respondents.
4.2.2 Selection of statements through consultation of a panel
Participants. The panel consisted of 14 people with much practical experience of
inclusive education. These included parents of a child with a disability attending
regular education, university students with disabilities who had attended a
regular primary school, regular primary school teachers teaching pupils with
special needs and peripatetic teachers.
Procedure. In the introduction section it was described how the four key themes
of social participation were translated into 38 statements. The topics addressed
in the statements are mainly based on literature and partly on the clinical and
research experience of the researchers who work for many years in the tradition
of research looking at the social dimension of inclusion in education. Since this
process might have been coloured by the researchers’ views (e.g. certain sub-
themes might have been overrepresented, while others might have been
undervalued), a panel consisting of 14 people with much practical experience in
inclusive education was asked to critically examine the statements. However,
before the list of statements was presented, the panel brainstormed in small
groups about topics they considered to be important for social participation. They
discussed social participation open-mindedly, without any influence of the results
of the literature review. Only after this brainstorming session was the list of
statements presented to the panel. The members were then asked if the
statements formulated by the researchers were in keeping with their views of
social participation and were invited to mention omissions from the list. Based on
the panel’s feedback, the researchers compiled a final list of statements giving a
complete picture of social participation. This detailed verification of the
statements was intended to increase the chance of including all essential topics
of social participation.
CHAPTER 4
90
Results. The panel agreed with the 38 statements formulated by the researchers,
but they also named supplementary topics which were then incorporated into an
additional 36 new statements. Of these, 22 were indicators of social participation
(for example: ‘The pupil has the feeling s/he is a full member of the group’) and
14 were indicators of social segregation (for example: ‘Classmates often laugh at
the pupil). All new statements were further specifications of the four key themes.
The majority of statements named by the panel were associated with contacts
and interactions between pupils with special needs and their classmates (for
example: ‘The pupil has fun with classmates’). In addition, many statements
were connected to friendships and relationships (for example: ‘Classmates invite
the pupil to play with them during school holidays’). Only a few statements
focused on the pupil’s perception (for example: ‘The pupil has the feeling s/he is
being teased by classmates’) and on the acceptance by classmates (for example:
‘Classmates step into the breach for the pupil when other children treat him/her
in an unpleasant manner’). However, according to the panel the topics addressed
in these statements are considered to be significant for successful social
participation, especially those related to the pupil’s feeling of belonging and
classmates viewing him or her as a full member of the group. A noticeable
finding from the panel session was the distinction between categories of
disabilities. The panel underlined the significance of distinguishing different
categories of disabilities when assessing which statements are important for
social participation. For instance, statements which address social participation of
pupils diagnosed as having behavioural problems might be less relevant in
describing the social participation of pupils with severe intellectual disabilities.
4.2.3 Final selection of statements through assessment by a group of
respondents
Participants. The 36 new statements were added to the original 38, thus making
a final list of 74 statements. Since a questionnaire consisting of 74 statements
would be unsuitable in educational practice, it was necessary to shorten the list.
We could have invited teachers, who are the questionnaire’s intended users, to
assess this large amount of statements for their pupils, in order to reveal the
statements’ psychometric characteristics. On the basis of these characteristics,
ASSESSING SOCIAL PARTICIPATION: THE CONSTRUCTION OF A TEACHER QUESTIONNAIRE
91
the list of statements could have been shortened. However, in stead of directly
presenting the list of statements to teachers, it was more appropriate to take an
extra step by asking a large group of respondents to assess the importance of
each statement. This extra step was considered necessary, as two non-
interchangeable themes are involved here, namely importance and clinical
applicability of the statements. We choose to make a first selection of statements
on the basis of importance (by asking the group of respondents to assess the
importance of each statement) and a second selection on the basis of clinical
applicability (by asking teachers to assess the applicability of the statements for
their pupils, which is the subject of the second part of this article).
The respondents, like the panel, had practical experience of inclusion and
consisted of parents, primary school teachers, students with disabilities who
study at university or attend a secondary school and peripatetic teachers but a
fifth group, consisting of educational advisors, was also added.
Procedure. The respondents were invited to look critically at our theoretical quest
to operationalise social participation. The group was drawn up by means of a
snowball sample. For each type of respondent a suitable sample procedure was
used. Parents were approached by writing letters to parent associations or
contacting their websites. Peripatetic teachers were selected by contacting their
coordinators at Regional Expertise Centres in the Netherlands. Parents and
peripatetic teachers then put us in contact with teachers who might be interested
in taking part in the research, while university students with disabilities were
approached via disability study groups at Dutch universities. The final group of
respondents, the educational advisors, were approached by emailing school
advisory services. Finally, at two conferences on inclusive education we displayed
posters informing participants about the study and inviting them to take part. As
a result of these varying selection procedures, a national distribution of
respondents was achieved.
These respondents were then mailed a questionnaire and asked to complete the
questionnaire for the category of disability with which they were familiar, i.e.
speech/language, motor, intellectual, behavioural or autistic problems. It was
decided to distinguish these various categories of disabilities, as a broad range of
pupils attend regular education and the questionnaire should be suitable for all of
them.
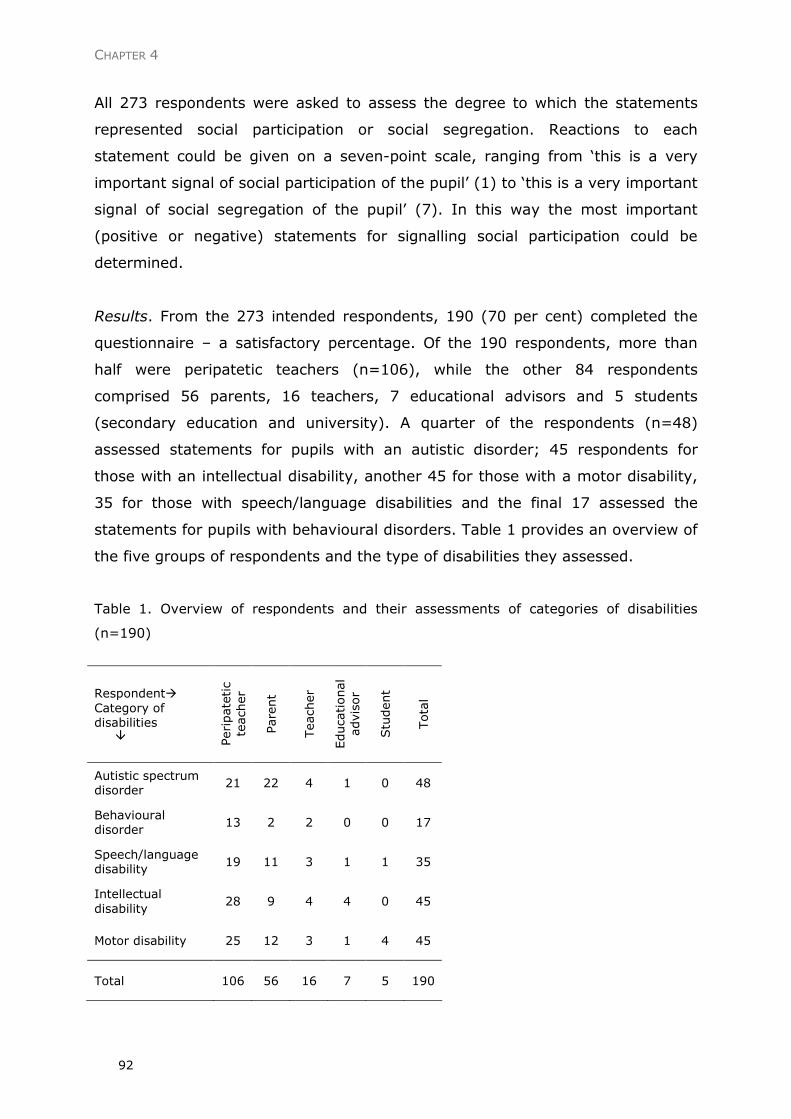
CHAPTER 4
92
All 273 respondents were asked to assess the degree to which the statements
represented social participation or social segregation. Reactions to each
statement could be given on a seven-point scale, ranging from ‘this is a very
important signal of social participation of the pupil’ (1) to ‘this is a very important
signal of social segregation of the pupil’ (7). In this way the most important
(positive or negative) statements for signalling social participation could be
determined.
Results. From the 273 intended respondents, 190 (70 per cent) completed the
questionnaire – a satisfactory percentage. Of the 190 respondents, more than
half were peripatetic teachers (n=106), while the other 84 respondents
comprised 56 parents, 16 teachers, 7 educational advisors and 5 students
(secondary education and university). A quarter of the respondents (n=48)
assessed statements for pupils with an autistic disorder; 45 respondents for
those with an intellectual disability, another 45 for those with a motor disability,
35 for those with speech/language disabilities and the final 17 assessed the
statements for pupils with behavioural disorders. Table 1 provides an overview of
the five groups of respondents and the type of disabilities they assessed.
Table 1. Overview of respondents and their assessments of categories of disabilities
(n=190)
Respondent� Category of disabilities � P
eripatetic
teacher
Parent
Teacher
Educational
advisor
Student
Total
Autistic spectrum disorder
21 22 4 1 0 48
Behavioural disorder
13 2 2 0 0 17
Speech/language disability
19 11 3 1 1 35
Intellectual disability
28 9 4 4 0 45
Motor disability 25 12 3 1 4 45
Total 106 56 16 7 5 190
ASSESSING SOCIAL PARTICIPATION: THE CONSTRUCTION OF A TEACHER QUESTIONNAIRE
93
All respondents assessed the degree to which the 74 statements were important
signals of social participation. Contrary to the expectations of the panel, there
were no significant differences in the assessment of 71 of the 74 statements for
the different categories of disabilities (for 71 statements F varies between 0.22
and 3.67, p>0.05). For three statements the differences were significant (F
varies between 4.29 and 4.78, p<0.05). However, this can be attributed to
chance.
The 30 statements considered as important or very important by at least 75 per
cent of the respondents were selected for the Social Participation Questionnaire.
In total, six statements belonged to the ‘Friendships/relationships’ subscale,
fifteen belonged to the ‘Contacts/interactions’ subscale, four belonged to the
‘Pupil’s social self-perception’ subscale and five belonged to the ‘Acceptance by
classmates’ subscale. The statements were phrased in terms of social
participation or in terms of social segregation. Both the key theme
‘Friendships/relationships’ and the key theme ‘Acceptance by classmates’ are
only represented by statements phrased in terms of social participation. Table 2
gives some examples of the statements. Of the 30 final statements, 17 stem
from the original list of 38 statements developed by the researchers, while the
13 others resulted from the brainstorming session with the panel.
Table 2. Examples of statements categorised under the four key themes of social
participation
Key theme Number of
statements
Statement of social
participation
Statement of social
segregation
Friendships/
relationships
6 ‘the pupil is being invited to
birthday parties’
Contacts/interactions 15 ‘the pupil regularly has fun
with his/her classmates’
‘classmates regularly
exclude the pupil from
activities’
Pupil’s social self-
perception
4 ‘the pupil has the feeling
s/he belongs to the group’
‘the pupil feels lonely at
school’
Acceptance by
classmates
5 ‘classmates consider the
pupil as a full member of
the group’
CHAPTER 4
94
4.3 Assessing the quality of the questionnaire
4.3.1 Method
A confirmatory factor analysis was conducted in order to gather a first impression
of empirical evidence for the Questionnaire’s division into four subscales
representing the four key themes of social participation. The quality of the
Questionnaire was further addressed by examining its reliability, the item-total
correlations and its construct validity.
Participants. In order to select school classes for the empirical study, help was
sought from the respondents involved in constructing the questionnaire by
inviting them to put us in touch with schools educating one or more pupils with
special needs in Grades 1 to 3. In total 17 classes in 13 schools were involved in
the study. In five classes there were two or more pupils with special needs, i.e.
three classes had two pupils, one class had three and another four pupils. In
total 25 pupils with special needs participating in full-time regular primary
education took part in the empirical study. All 25 pupils had the Dutch equivalent
of a statement of special needs and were in Grades 1 to 3. The sample consisted
of pupils with the types of disabilities most common in regular Dutch primary
schools, who have the fastest growth in attending regular Dutch schools and
whose special needs are known to be linked to difficulties in social relationships
and contacts in the regular classroom. Nine pupils were assessed as having
(severe) behavioural disorders (including ADHD), three as having an autistic
spectrum disorder (PDD-NOS), three as having ADHD combined with PDD-NOS
symptoms, five as having a motor disability, two as having an intellectual
disability, two as having speech/language disabilities and one as a hard of
hearing and partially sighted pupil. Not only the pupils with special needs but
also their classmates (n=352) and the teachers (n=17) participated in the study.
The average age of the pupils with special needs was 8.4 years (SD=1.2), while
the average age of their typical peers was 8.0 years (SD=1.3). This small
difference in age was found to be non significant, t(54)=1.0, p=0.32.
The teachers of the participating classes completed the Social Participation
Questionnaire for the pupil(s) with special needs and for two other pupils without
special needs, the latter randomly chosen by using the numbers three and six on
the class register. If the pupil with special needs was number three or six on the
ASSESSING SOCIAL PARTICIPATION: THE CONSTRUCTION OF A TEACHER QUESTIONNAIRE
95
register than the following pupil on the list was chosen, while if pupils number
three and six were of the same sex, the next pupil of the opposite sex on the
register was chosen. In classrooms with two or more pupils with special needs,
the teacher was asked to complete the questionnaire for all pupils with special
needs and for two typical pupils. This meant the Social Participation
Questionnaire would be filled in for the 25 pupils with special needs and for 34
typical pupils (two pupils in each of the 17 classes). However, in one of the
classes, the teacher filled in the Questionnaire for three instead of two typically
developing pupils, so this brought the Questionnaire’s total sample to 25 pupils
with special needs (18 boys, 7 girls) and 35 typically developing pupils (17 boys,
18 girls).
Instruments. The teachers completed the Social Participation Questionnaire for
the pupil(s) with special needs and for two other pupils by answering each
question on a five-point scale, ranging from ‘this strongly applies to the pupil’ (1)
to ‘this does not apply at all to the pupil’ (5). The minimum score for the
questionnaire was 30 (30 x 1), while the maximum was 150 (30 x 5). The lower
the score, the more positive the social participation of the pupil was assessed.
In order to get a first impression of the construct validity of the Social
Participation Questionnaire, other procedures to measure social participation
were needed. However, there is no instrument which, like the Social Participation
Questionnaire, focuses on the total concept of social participation. Therefore, in
order to examine the Questionnaire’s construct validity, four instruments, each
focusing on one of the key themes of social participation, should be applied.
However, in this pilot study, gathering data using in total five instruments in
each classroom would be unfeasible. When administering this number of
instruments, the researchers would have to spend a long time in classes, which
would probably disturb the teachers’ schedule too much. Moreover, it would be
too large a burden for pupils and teachers. It was decided to assess both the key
themes ‘friendships/relationships’ and ‘acceptance by classmates’, as these
themes can be assessed by the same instrument. The sociometric nomination
method was chosen for this purpose. All pupils in the 17 classes completed a
sociometric questionnaire. Based on Coie, Dodge and Coppotelli (1982), this
asked pupils which three classmates they liked to play with best.
CHAPTER 4
96
Analysis. The Questionnaire’s division in four subscales was entirely based on a
literature review and the opinion of respondents with much experience of
inclusive education. The Oblique Multiple Group Method (Holzinger, 1944;
Nunnally, 1978) was used in order to verify the assignment of statements to
subscales. The correlation of each statement to each subscale was computed,
while correcting correlations between statements and subscales in which the
statements take part. If each statement has the highest correlation with the
subscale to which it is assigned, the proposed structure of the scales fits the
data. If a statement correlates higher with the subscales to which is its not
assigned, this indicates that such a statement is assigned wrongly (Stuive,
2007).
The reliability of the Questionnaire was assessed by calculating Cronbach’s
Alpha. The construct validity of the Questionnaire was assessed in two ways.
First, the scores of pupils with special needs on the Questionnaire were
compared with those of their typical classmates. Based on literature (e.g. De
Monchy et al., 2004; Pijl, Frostad & Flem, in press; Scheepstra et al. 1999) it
was expected that, compared to their classmates, the social participation of the
pupils with special needs would be assessed less positively. Second, the
outcomes were compared with those of another instrument commonly used to
assess social facets of inclusion, namely a sociometric questionnaire (see
Instruments). Pupils were asked to nominate three pupils with whom they liked
to play best. Based on their answers, an ‘indegree’ index could be calculated for
every pupil. Indegrees are measures of receptivity or popularity (Wasserman &
Faust, 1994), thus indicating how often a pupil is chosen by a classmate, and can
be considered as an index of acceptance. Next to the indegrees (as a measure of
acceptance), the number of reciprocal friendships of each pupil was calculated.
In sociometric analyses friends are defined as two pupils independently selecting
each other as peers they like or peers with whom they like to play (Cullinan,
Sabornie & Crossland, 1992; Juvonen & Bear, 1992).
The correlation between the score on the Questionnaire and the indegrees was
then calculated. In addition, a calculation was made of the correlation between
the score on the Questionnaire and the number of reciprocal friendships. It was
envisaged that the indegrees and reciprocal friendships would both correlate
negatively with the score on the Questionnaire, meaning that the more a pupil is
accepted by peers (having higher indegrees) and the higher the number of
ASSESSING SOCIAL PARTICIPATION: THE CONSTRUCTION OF A TEACHER QUESTIONNAIRE
97
his/her reciprocal friendships, the more positive the assessment of the pupil’s
social participation would be.
Finally, specific correlation patterns between the indegrees / the number of
reciprocal friendships and the four subscales were expected. It was supposed
that the indegrees would correlate stronger with the subscale ‘Acceptance by
classmates’ than with the other subscales, while pupils’ number of friendships
were expected to correlate stronger with the subscale ‘Friendships/relationships’
than with the other three subscales. Discovering this pattern was regarded as
another source of evidence for the Questionnaire’s construct validity.
4.3.2 Results
Factor analysis. The outcomes of the confirmatory factor analysis, which should
be interpreted cautiously because of the small sample (n=60), did largely
provide the expected empirical evidence for our theoretical model of social
participation. The outcomes of the analysis made clear that the division of the
Social Participation Questionnaire into four subscales, representing four key
themes of social participation, seems to be correct to a large extent. The analysis
revealed that 22 out of 30 statements correlated strongest with the subscale
they were assigned to. The remaining eight statements had higher correlations
with one or more subscales they were not part of (see Table 3). These first
preliminary findings are no basis to change the Social Participation
Questionnaire. Further analysis, with a larger sample, is needed to examine more
profoundly the Questionnaire’s division into distinct subscales.
Table 3. Outcomes Oblique Multiple Group Factor Analysis (n=60)
Subscale Number of statements
belonging to the
subscale
Number (and
numbers) of
exceeding statements
Friendships/relationships 6 0
Contacts/interactions 15 4 (7,10,13,24)
Pupil’s social self-perception 4 2 (12,27)
Acceptance by classmates 5 2 (1,20)
Reliability. The reliability of the Questionnaire was assessed by calculating
Cronbach’s Alpha. Alpha is 0.93, which implies a high reliability (Field, 2005).
CHAPTER 4
98
Also the reliabilities of the subscales ‘Friendships/relationships’ and
‘Contacts/interactions’ are high (respectively 0.94 and 0.88). However, the
subscales ‘Pupil’s social self-perception’ and ‘Acceptance by classmates’ show
reliabilities which are insufficient (respectively 0.69 and 0.64), assuming that
values of alpha around 0.70 are good for ability and related tests (Field, 2005).
The item-total correlations ranged from -0.03 to 0.86. One of the 30 statements
was incongruous and correlated negatively with the total score on the
Questionnaire (with an item-total correlation of -0.03). This implies that this
statement, aimed at pupils daring to tell the pupil with special needs that they
sometimes do not want to play with him/her, does not meet the criteria and
should be removed from the list. Alpha of the questionnaire as a whole remained
0.93 after this statement was removed, while alpha of the
‘Contacts/interactions’ subscale slightly improved (from 0.88 to 0.89). The item-
total correlations of the other 29 statements ranged from 0.12 to 0.86.
Validity. A comparison was made between the scores on the Questionnaire of
pupils with special needs and those of their classmates without special needs in
the 17 classes (no distinction was made between boys and girls, since the mean
score of boys and girls does not differ significantly, t(58)=0.49, p=0.63). On
average, pupils with special needs received a higher mean score (M=72.8,
SD=20.3) than their typical classmates (M=52.8, SD=13.4). This difference is
significant t(53)=-4.4, p<0.05 and represents a large effect size (ES=1.2)
(Cohen, 1992). The outcomes imply that, on average, the social participation of
pupils with special needs is assessed less positively than the social participation
of pupils without special needs. This is in accordance with our expectation that
pupils with special needs would experience more problems in social participation
than their typically developing classmates.
Secondly, correlations were calculated between the score of a pupil on the
Questionnaire and the indegrees s/he had as well as the number of reciprocal
friendships. It turned out that pupils with special needs have significantly lower
indegrees on average than their peers without special needs (2.1 versus 3.2,
t(58)=2.4, p<0.05), which means they are less accepted. The number of
reciprocal friendships is nearly the same for both groups of pupils (pupils with
special needs: 1.4, pupils without special needs: 1.5). The difference is not
significant, t(58)=0.6, p=0.52. The expected negative correlation between the
ASSESSING SOCIAL PARTICIPATION: THE CONSTRUCTION OF A TEACHER QUESTIONNAIRE
99
number of positive nominations and the total score on the questionnaire was
found: the higher the score on the questionnaire, the lower indegrees the pupil
had (-0.49, p<0.05). This means that the less positive the social participation is
assessed, the lower the number of times a pupil with special needs is chosen by
classmates to play with. The expected correlation pattern was not found.
Contrary to expectation, the correlation between the indegrees and the
‘Acceptance by classmates’ subscale (-0.24, p=0.07) was less strong than the
correlations between the indegrees and the other subscales (ranging from -0.35
to -0.55, p<0.05). This means the external measuring of this key theme
(sociometric indegrees) shows the weakest correlation with the statements on
the Questionnaire which focus on acceptance. Therefore, either the statements
on the Questionnaire are not representing acceptance properly, or the external
measuring is unsuitable to assess acceptance.
In addition, and as expected, the number of friendships correlated negatively
with the score on the Questionnaire. The higher the score on the Questionnaire,
the lower the number of reciprocal friendships and vice versa (-0.41, p<0.05),
which implies that the less positive the social participation is assessed, the lower
the number of friendships. Besides, the expected correlation pattern was found:
the number of reciprocal friendships showed a stronger correlation with the
‘Friendships/relationships’ subscale (-0.43, p<0.05) than with the other three
(correlations ranged from -0.28 to -0.34, p<0.05). That is, the external
measuring of friendships/relationships (the reciprocal friendships as assessed by
the sociometric questionnaire) correlates best with the statements on the
Questionnaire related to ‘friendships/relationships’. This implies that this key
theme is operationalised correctly in the Questionnaire.
4.4 Discussion
It is known from several studies (De Monchy et al., 2004; Scheepstra et al.,
1999; Whitney et al., 1994) that teachers’ assessments of the social participation
of pupils with special needs are not always appropriate. Pupils with special needs
are often less popular than their classmates, have fewer friends and are more
often neglected and rejected. However, teachers tend to overlook or
underestimate these problems. One possible explanation for this phenomenon is
related to the Cognitive Dissonance Theory of Festinger and Carlsmith (1959):
CHAPTER 4
100
teachers might be inclined to overlook problems and to overestimate the (social)
development of the pupil with special needs, because they made a well-
considered choice to educate the pupil. A negative social development of the
pupil would be incongruous with their hopes and expectations. The core of the
problem is that teachers’ assessments are often more positive than those of
fellow classmates (see also De Monchy et al., 2004). Since pupils’ assessment is
based on a much larger group of assessors who have no professional interest in
the social participation of pupils with special needs, it is justifiable to use this as
a reference point (De Monchy et al., 2004). However, it would be too limited to
only use sociometric data provided by pupils, since social participation is a much
broader concept. It is vital that teachers make accurate assessments of the total
social participation of pupils, because only when they notice that a pupil becomes
isolated, feels lonely or is being teased, can they take appropriate measures.
Taking measures to resolve or lessen problems with regard to the social situation
of a pupil is important, since negative social experiences at school (like isolation,
a low social status) might lead to externalising and internalising problems
(Durrant, Cunningham & Voelker, 1990) and to maladjustment in later life
(Nelson, Rubin & Fox, 2005; Parker & Asher, 1987; Terry & Coie, 1991).
Thus another way of assessing the social participation of pupils with special
needs and their interaction with fellow pupils is much needed. As mentioned
above, if teachers accurately estimate the social participation of pupils with
special needs, they are more likely to take proper action to stimulate
participation.
This study is aimed at contributing to the development of an instrument which
aims at helping teachers assess pupils’ social participation. At first, the concept
social participation was translated into concrete statements. Next, a
questionnaire was developed to measure the social participation of pupils with
special needs in regular primary schools. Since the Questionnaire consists of
concrete statements focusing on daily practice, this was expected to foster the
accuracy of the teachers’ judgements. In addition, by filling in the Questionnaire
for a pupil, the teacher is forced to think critically about the pupil’s situation in
the classroom, which might lead to renewed and refined insights.
The empirical data showed that the Questionnaire might become usable in
practice. A confirmatory factor analysis did largely provide the expected empirical
evidence for our theoretical model of social participation. The analysis revealed
ASSESSING SOCIAL PARTICIPATION: THE CONSTRUCTION OF A TEACHER QUESTIONNAIRE
101
that 22 out of 30 statements correlated strongest with the subscale they were
assigned to. In future research, including a large sample, the quality of the
separate statements for each subscale and the separability of the four subscales
should be assessed more thoroughly.
The reliability of the entire Questionnaire is high. However, the reliability of the
Questionnaire’s four subscales varied per scale. The subscales
‘Friendships/relationships’ and ‘Contacts/interactions’ showed a high reliability,
whereas the reliabilities of the subscales ‘Pupil’s social self-perception’ and
‘Acceptance by classmates’ were fairly low. In order to strengthen both
subscales, several statements will be added. One statement, belonging to the
‘Contacts/interactions’ subscale will be removed from the list.
If we focus on the outcomes of the sociometric questionnaire in relation to pupils’
scores on the Social Participation Questionnaire, the construct validity of the
questionnaire turns out to be acceptable. The expected negative correlation
between both the indegrees and the number of reciprocal friendships and the
score on the Questionnaire could be confirmed. In addition, the expected
correlation pattern between the number of reciprocal friendships and the
Questionnaire’s subscales was found: the number of friendships showed the
strongest correlation with the ‘Friendships/relationships’ subscale. However, for
the positive nominations (indegrees) the expected pattern was not
demonstrated: the indegrees correlated less strong with the ‘Acceptance by
classmates’ subscale than with the other subscales. It will be necessary to
further examine the construct ‘acceptance by classmates’ in order to improve the
validity of this subscale.
Finally, the expectation that pupils with special needs would experience more
problems in social participation than their typical classmates was confirmed. In
the current study, we did not differ between pupils with different categories of
disabilities. Within the group of 25 pupils with special needs, seven different
categories of disabilities were included. It was decided to include so many
categories as the Questionnaire was developed for all pupils. In order to examine
the applicability of the Questionnaire, it was desirable to involve pupils with
various categories of disabilities in the study. In a future study, it would be
advisable to involve larger homogeneous subgroups of pupils, that way it might
be possible to discover if correlations between the scores on the Social
CHAPTER 4
102
Participation Questionnaire and the scores on external instruments differ for
different subgroups.
Keeping these outcomes in mind, one may draw the conclusion that the Social
Participation Questionnaire may become a valuable tool for teachers to assess
the social participation of pupils with special needs. At the moment, only the first
step in the development of the Questionnaire has been taken. In follow-up
research, the qualities of the subscales and its statements could be examined. In
addition, further examination of the construct validity could take place by
comparing the Questionnaire with other external criteria (like observation scales,
sociometric rating scales or social self-perception questionnaires). A next step
should consist of examining the meaning of the scores. At the moment, we do
not know which scores on the Questionnaire are alarming. Future research
should aim at establishing a cut-off point, beyond which a score is cause for
concern and additional measures need to be taken.
Future research should also aim at the effectiveness of intervention methods.
Several methods have been developed to stimulate or improve the relations of
pupils with special needs and their classmates, some of which have been
reported successful. An often used method is social skills training. However, the
long-term effects of this kind of training are often disappointing. One possible
explanation is that classmates’ image of the pupils does not change and they do
not alter their attitude and behaviour. As a result the trained pupils do not have
many possibilities to practice their new skills: they will not see the benefit of
their new skills and after some time the acquired skills will fade away (Frostad &
Pijl, 2007). Therefore, measures to stimulate social participation of pupils with
special needs should not merely focus on those pupils but also on classmates.
Peer network approaches, in which both the pupil with special needs and typical
peers are involved, seem to be promising. Peer buddy programmes and peer
networks (for example the Circle of Friends approach) have demonstrated
increases in peer acceptance and in establishing friendships between pupils with
special needs and their typical peers (Campbell Miller, Cooke, Test & White,
2003; Frederickson & Turner, 2003). Further examination of the effects of peer
network approaches on the social participation of pupils with special needs is
needed.
ASSESSING SOCIAL PARTICIPATION: THE CONSTRUCTION OF A TEACHER QUESTIONNAIRE
103
4.5 References
Bukowski, W.M. & Hoza, B. (1989). Towards a further understanding of peer
relationships and their contributions to child development. In T.J. Berndt &
G.W. Ladd (Eds.), Peer relationships in child development (pp.15-45). New
York: John Wiley.
Campbell Miller, M., Cooke, M.L., Test, D.W. & White, R. (2003). Effects of
friendship circles on the social interactions of elementary age students
with mild disabilities. Journal of Behavioral Education, 12(3), 167-184.
Cohen, J. (1992). A power primer. Quantitative methods in psychology, 112(1),
155-159.
Coie, J.D., Dodge, K.A. & Coppotelli, H. (1982). Dimensions and types of social
status: A cross-age perspective. Developmental Psychology, 18(4), 557-
570.
Cullinan, D., Sabornie, E.J. & Crossland, C.L. (1992). Social mainstreaming of
mildly handicapped students. The Elementary School Journal, 92(3), 339-
351.
De Monchy, M., Pijl, S.J. & Zandberg, T.J. (2004). Discrepancies in judging social
inclusion and bullying of pupils with behaviour problems. European Journal
of Special Needs Education, 19(3), 317-330.
Durrant, J.E., Cunningham, C.E. & Voelker, S. (1990). Academic, social and
general self-concepts of behavioural subgroups of learning disabled
children. Journal of Educational Psychology, 82(4), 657-663.
Festinger, L. & Carlsmith, J.M. (1959). Cognitive consequences of forced
compliance. Journal of Abnormal and Social Psychology, 58, 203-210.
Field, A. (2005). Discovering Statistics Using SPSS (2nd ed.). London: SAGE
publications.
Frederickson, N.L. & Furnham, A.F. (1998). Sociometric classification methods in
school peer groups: a comparative investigation. Journal of Child
Psychology and Psychiatry, 39(6), 921-933.
Frederickson, N. & Turner, J. (2003). Utilizing the classroom peer group to
address children’s social needs: and evaluation of the Circle of Friends
Intervention Approach. The Journal of Special Education, 36(4), 234-245.
Frostad, P. & Pijl, S.J. (2007). Does being friendly help in making friends? The
relation between the social position and social skills of pupils with special
CHAPTER 4
104
needs in mainstream education. European Journal of Special Needs
Education, 22(1), 15-30.
Guralnick, M.J., Connor, R.T., Hammond, M.A., Gottman, J.M. & Kinnish, K.
(1996). The peer relations of preschool children with communication
disorders. Child Development, 67, 471-489.
Guralnick, M.J., Hammond, M.A., Connor, R.T. & Neville, B. (2006). Stability,
change, and correlates of the peer relationships of young children with
mild developmental delays. Child Development, 77(2), 312-324.
Guralnick, M.J., Neville, B., Hammond, M.A. & Connor, R.T. (2007). The
friendships of young children with developmental delays. A longitudinal
analysis. Journal of Applied Developmental Psychology, 28, 64-79.
Holzinger, K.J. (1944). A simple method of factor analysis. Psychometrika, 9(4),
257-262.
Juvonen, J. & Bear, G. (1992). Social adjustment of children with and without
learning disabilities in integrated classrooms. Journal of Educational
Psychology, 84(3), 322-330.
Koster, M., Nakken, H., Pijl, S.J. & Van Houten, E.J. (in press). Being part of the
peer group: a literature study focussing on the social dimension of
inclusion in education. International Journal of Inclusive Education.
Lee, S.H., Yoo, S.Y. & Bak, S.H. (2003). Characteristics of friendships between
children with and without disabilities. Education and Training in
Developmental Disabilities, 38(2), 157-166.
Nakken, H. & Pijl S.J. (2002). Getting along with classmates in regular schools: a
review of the effects of integration on the development of social
relationships. International Journal of Inclusive Education, 6(1), 47-61.
Nelson, L.J., Rubin, K.H. & Fox, N.A. (2005). Social withdrawal, observed peer
acceptance, and the development of self-perceptions in children ages 4 to
7 years. Early Childhood Research Quarterly, 20, 185-200.
Nunnally, J.C. (1978). Psychometric Theory (2nd ed.). New York: McGraw-Hill.
Parker, J.G. & Asher, S.R. (1987). Peer relations and later personal adjustment:
are low-accepted children at risk? Psychological Bulletin, 102(3), 357-389.
Pijl, S.J., Frostad, P. & Flem, A. (in press). The social position of pupils with
special needs in regular schools. Scandinavian Journal of Educational
Research.
ASSESSING SOCIAL PARTICIPATION: THE CONSTRUCTION OF A TEACHER QUESTIONNAIRE
105
Scheepstra, A.J.M., Nakken, H. & Pijl, S.J. (1999). Contact with classmates: the
social position of pupils with Down’s Syndrome in Dutch mainstream
education. European Journal of Special Needs Education, 14(3), 212-220.
Sloper, T. & Tyler, S. (1992). Integration of children with severe learning
difficulties in mainstream schools: evaluation of a pilot study. Educational
and Child Psychology, 9(4), 35-45.
Strayhorn, J.M. & Strain, P.S. (1986). Social and language skills for preventive
mental health: What, how, who and when. In P.S. Strain, M.J. Guralnick &
H. Walker (Eds.), Children’s Social Behavior: Development, Assessment
and Modifications (pp. 287-330). New York: Academic Press.
Stuive, I. (2007). A comparison of confirmatory factor analysis methods. Oblique
Multiple Group Method versus Confirmatory Common Factor Method.
Groningen: Facilitair Bedrijf GrafiMedia RuG.
Terry, R. & Coie, J.D. (1991). A comparison of methods for defining sociometric
status among children. Developmental Psychology, 27(5), 867-880.
Wasserman, S. & Faust, K. (1994). Social Network Analysis: Methods and
Applications. Cambridge: Cambridge University Press.
Whitney, I., Smith, P.K., & Thompson, D. (1994). Bullying and children with
special educational needs. In P.K. Smith & S. Sharp (Eds.), School
Bullying: insights and perspectives (pp. 213-240). New York: Routledge.

CHAPTER 4
106
Chapter 5 Examination of the psychometric qualities of the Social Participation Questionnaire1
CHAPTER 5
EXAMINATION OF THE PSYCHOMETRIC QUALITIES OF THE SOCIAL PARTICIPATION QUESTIONNAIRE
A slightly adapted and shortened version of this article has been re-submitted for publication and was co-authored by Marieke E. Timmerman, Han Nakken, Sip Jan Pijl and Els J. van Houten
CHAPTER 5
108
Abstract
Enhancing social participation of pupils with special needs is an important goal of
inclusive education. This study addresses the psychometric qualities of a new
teacher questionnaire to assess the social participation of pupils with special
needs in regular primary education. This Social Participation Questionnaire
initially consisted of 34 statements related to four key themes of social
participation: ‘friendships/relationships’, ‘contacts/interactions’, ‘pupil’s social
self-perception’ and ‘acceptance by classmates’, yielding four subscales.
A non-parametric item response analysis, a Mokken Scale Analysis, was used to
examine the quality of the Questionnaire. Based on the analysis results, ten
statements were removed. The resulting four subscales appeared intermediate to
strong. As Mokken’s double monotonicity model turned out to fit well for each
subscale, the subscale scores are on an ordinal scale and the separate
statements are invariantly ordered. The subscale scores are comparable across
pupils with and without special needs, because differential item functioning
appeared to be absent. Subsequent analyses supported the division of
statements into the four subscales.
The Questionnaire as a whole and its subscales were found to be reliable. Finally,
evidence has been obtained for the Questionnaire’s discriminant validity, as the
expected score differences between pupils with and without special needs were
clearly present.
EXAMINATION OF THE PSYCHOMETRIC QUALITIES OF THE SOCIAL PARTICIPATION QUESTIONNAIRE
109
5.1 Introduction
Peer relationships are important in the live of children. Its is widely
acknowledged that childrens’ peer relationships and friendships contribute to
their social and emotional development (Bagwell, 2004; Male, 2007) and also
peer acceptance and social status are seen as vital to the well-being of children.
Most primary school pupils find no difficulty in making friends and building
positive relations with their peers (Powless & Elliott, 1993). However, this does
not apply to pupils with special needs, as research has shown that these pupils
experience considerably more difficulty building friendships in inclusive
classrooms (Frostad & Pijl, 2007). This is striking, as within inclusive education
social participation is considered to be vital. Parents often report increased social
opportunities as their main motive for sending their child with special needs to a
regular school (Sloper & Tyler, 1992). They expect their child to build positive
relationships with typical peers. However, research has repeatedly shown that
inclusion of pupils with special needs does not automatically lead to an increase
of friendships between these pupils and their typical counterparts (De Monchy,
Pijl & Zandberg, 2004). A study by Frostad and Pijl (2007) of Norwegian inclusive
classrooms suggests that nearly a quarter of pupils with special needs have
serious difficulties forming relationships in their peer group, while for their typical
peers this is only 8 percent. This is worrisome, because the consequences of
negative social experiences in school can be far-reaching. For instance, a low
social status in childhood and peer relationship difficulties might lead to
externalising (e.g. aggression) and internalising problems (e.g. anxiety)
(Durrant, Cunningham & Voelker, 1990), and to maladjustment later in life
(Bagwell, Newcomb & Bukowski, 1998; Parker & Asher, 1987). Because of the
rather harmful long-term effects of negative social experiences at school, it is
important to monitor the social participation of pupils. This entails a vital task for
teachers.
Koster, Nakken, Pijl, Van Houten and Lutje Spelberg (in press) developed
a questionnaire for teachers to assess the social participation of pupils with
special needs. First, an analysis of literature was conducted in order to define the
concept of social participation. This analysis revealed four key themes in social
participation: friendships/relationships, contacts/interactions, pupil’s social self-
perception and acceptance by classmates (Koster, Nakken, Pijl & Van Houten, in

CHAPTER 5
110
press). The key themes laid the foundation for the so-called Social Participation
Questionnaire, which aims at helping teachers make more accurate assessments
of the social participation of their pupils, and aids in noticing problems in time.
In the present study, the quality of the Social Participation Questionnaire is
central. Using empirical data from both pupils with and without special needs,
the quality of the separate statements for each subscale, the separability of the
four subscales and their reliability will be assessed. The Questionnaire’s
discriminant validity will be examined by comparing the scores of pupils with
special needs with those of pupils without special needs.
5.2 Method
5.2.1 Participants
For practical reasons, data collection took place in two periods. In each period,
300 regular primary schools were invited to participate in the study. According to
files from the Ministry of Education, the invited schools have at least one pupil in
Grades 1 to 3 who receive a so-called pupil-bound budget. Such a budget is
allocated to pupils who, according to independent committees, meet the Dutch
national criteria for a pupil-bound budget. Herewith, several categories of
disabilities are distinguished, each with their own criteria. Those involve, among
other things, categories of the Diagnostic and Statistical Manual of Mental
Disorders (DSM IV) and intellectual ability, which are assessed by qualified
psychiatrists or psychologists who operate independently from the committees.
The invited schools were randomly drawn from the population of 2074 Dutch
regular primary schools with a pupil with a pupil-bound budget in Grade 1, 2
and/or 3 within 2.5 hours of travelling time from the city of Groningen. This area,
covering nearly two-third of the Netherlands, was chosen to make the data
collection feasible.
First sub-sample. Of the 300 invited schools, 53 were involved in the study. One
school was too busy to participate and 22 schools were unable to participate
because they had no pupils with special needs in Grades 1, 2 or 3. The remaining
224 schools did not respond to our invitation. To examine possible bias in results
from the cooperating schools, random selections of about 20 percent of the
EXAMINATION OF THE PSYCHOMETRIC QUALITIES OF THE SOCIAL PARTICIPATION QUESTIONNAIRE
111
schools who had not responded at all to our invitation to cooperate in the study
(45 schools) and 35 percent of the schools who did cooperate (20 schools) were
invited to complete a short questionnaire by phone.
This questionnaire is largely based on a questionnaire developed by Frostad and
Pijl (2007). In total, 41 non-cooperating schools (91%) and 19 (95%)
cooperating schools answered the questions. For the non-cooperating schools,
the first question aimed at the reason for not participating in the study. It turned
out that 12 schools were not able to participate, because they had no pupils with
special needs in Grade 1, 2 or 3. These 12 schools were not asked to complete
the remainder of the questionnaire. The remaining 29 non-cooperating schools
and 19 cooperating schools completed the questionnaire. The questionnaire
consisted of eight questions addressing attitudes to inclusion, teacher
characteristics, satisfaction about the budget for materials and schooling,
satisfaction about collaboration with parents and the degree to which teachers
felt supported by the director, colleagues and peripatetic teachers at educating
pupils with special needs. The questions had to be answered on a 5-point scale,
ranging from 0 (yes, very much) to 4 (no, not at all). Comparison of the mean
scores of cooperating and non-cooperating schools showed only slight
differences, which appeared to be nonsignificant (see Table 1).
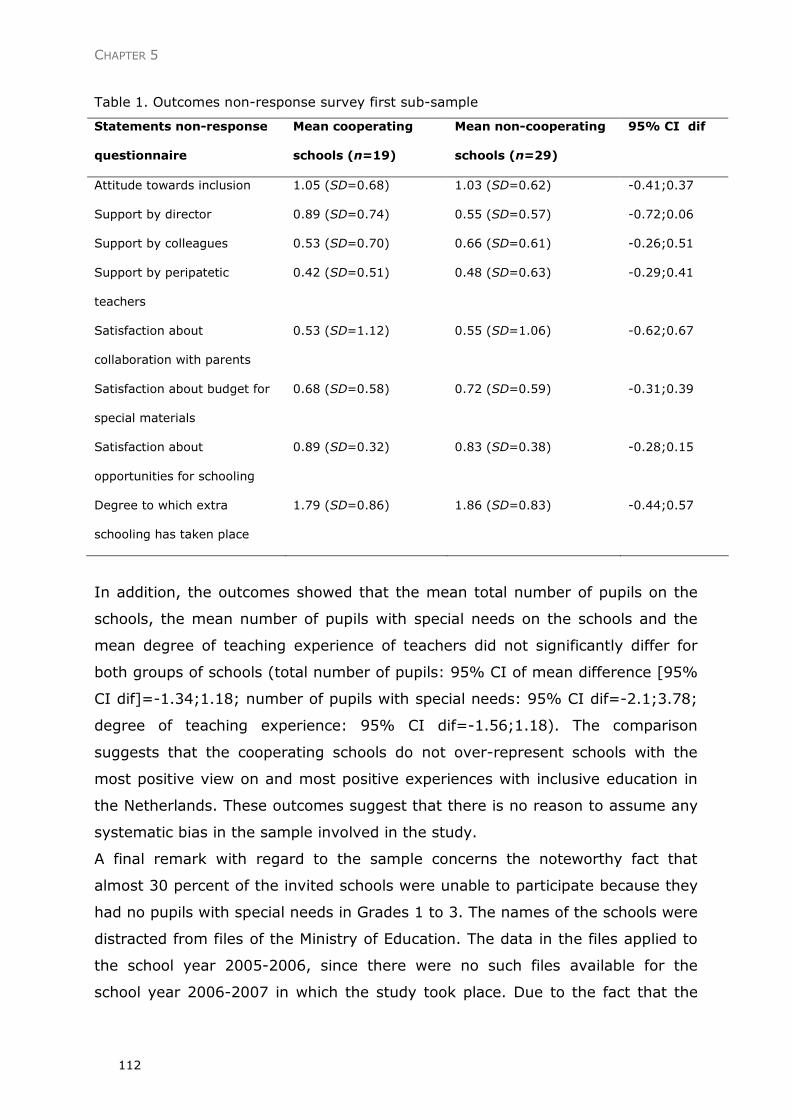
CHAPTER 5
112
Table 1. Outcomes non-response survey first sub-sample
Statements non-response
questionnaire
Mean cooperating
schools (n=19)
Mean non-cooperating
schools (n=29)
95% CI dif
Attitude towards inclusion 1.05 (SD=0.68) 1.03 (SD=0.62) -0.41;0.37
Support by director 0.89 (SD=0.74) 0.55 (SD=0.57) -0.72;0.06
Support by colleagues 0.53 (SD=0.70) 0.66 (SD=0.61) -0.26;0.51
Support by peripatetic
teachers
0.42 (SD=0.51) 0.48 (SD=0.63) -0.29;0.41
Satisfaction about
collaboration with parents
0.53 (SD=1.12) 0.55 (SD=1.06) -0.62;0.67
Satisfaction about budget for
special materials
0.68 (SD=0.58) 0.72 (SD=0.59) -0.31;0.39
Satisfaction about
opportunities for schooling
0.89 (SD=0.32) 0.83 (SD=0.38) -0.28;0.15
Degree to which extra
schooling has taken place
1.79 (SD=0.86) 1.86 (SD=0.83) -0.44;0.57
In addition, the outcomes showed that the mean total number of pupils on the
schools, the mean number of pupils with special needs on the schools and the
mean degree of teaching experience of teachers did not significantly differ for
both groups of schools (total number of pupils: 95% CI of mean difference [95%
CI dif]=-1.34;1.18; number of pupils with special needs: 95% CI dif=-2.1;3.78;
degree of teaching experience: 95% CI dif=-1.56;1.18). The comparison
suggests that the cooperating schools do not over-represent schools with the
most positive view on and most positive experiences with inclusive education in
the Netherlands. These outcomes suggest that there is no reason to assume any
systematic bias in the sample involved in the study.
A final remark with regard to the sample concerns the noteworthy fact that
almost 30 percent of the invited schools were unable to participate because they
had no pupils with special needs in Grades 1 to 3. The names of the schools were
distracted from files of the Ministry of Education. The data in the files applied to
the school year 2005-2006, since there were no such files available for the
school year 2006-2007 in which the study took place. Due to the fact that the
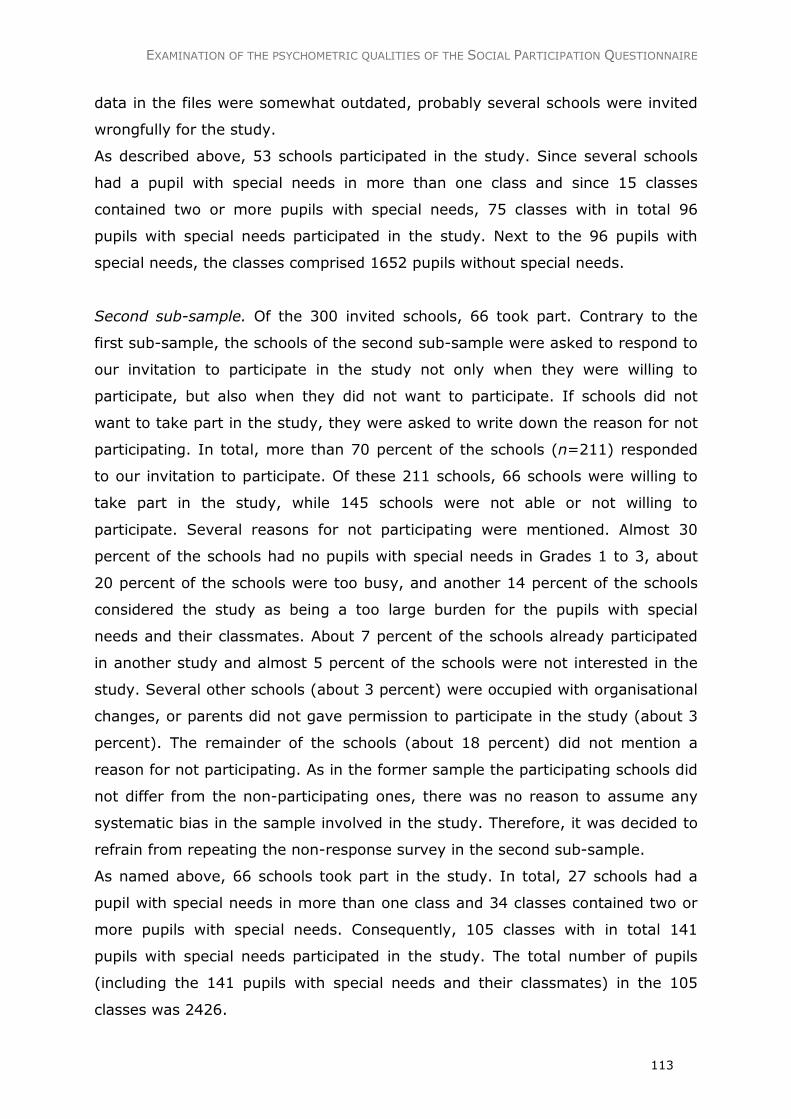
EXAMINATION OF THE PSYCHOMETRIC QUALITIES OF THE SOCIAL PARTICIPATION QUESTIONNAIRE
113
data in the files were somewhat outdated, probably several schools were invited
wrongfully for the study.
As described above, 53 schools participated in the study. Since several schools
had a pupil with special needs in more than one class and since 15 classes
contained two or more pupils with special needs, 75 classes with in total 96
pupils with special needs participated in the study. Next to the 96 pupils with
special needs, the classes comprised 1652 pupils without special needs.
Second sub-sample. Of the 300 invited schools, 66 took part. Contrary to the
first sub-sample, the schools of the second sub-sample were asked to respond to
our invitation to participate in the study not only when they were willing to
participate, but also when they did not want to participate. If schools did not
want to take part in the study, they were asked to write down the reason for not
participating. In total, more than 70 percent of the schools (n=211) responded
to our invitation to participate. Of these 211 schools, 66 schools were willing to
take part in the study, while 145 schools were not able or not willing to
participate. Several reasons for not participating were mentioned. Almost 30
percent of the schools had no pupils with special needs in Grades 1 to 3, about
20 percent of the schools were too busy, and another 14 percent of the schools
considered the study as being a too large burden for the pupils with special
needs and their classmates. About 7 percent of the schools already participated
in another study and almost 5 percent of the schools were not interested in the
study. Several other schools (about 3 percent) were occupied with organisational
changes, or parents did not gave permission to participate in the study (about 3
percent). The remainder of the schools (about 18 percent) did not mention a
reason for not participating. As in the former sample the participating schools did
not differ from the non-participating ones, there was no reason to assume any
systematic bias in the sample involved in the study. Therefore, it was decided to
refrain from repeating the non-response survey in the second sub-sample.
As named above, 66 schools took part in the study. In total, 27 schools had a
pupil with special needs in more than one class and 34 classes contained two or
more pupils with special needs. Consequently, 105 classes with in total 141
pupils with special needs participated in the study. The total number of pupils
(including the 141 pupils with special needs and their classmates) in the 105
classes was 2426.
CHAPTER 5
114
Total sample (sub-sample 1 and sub-sample 2). In total, 119 schools with 180
participating classes were involved. Each teacher was asked to fill in the Social
Participation Questionnaire for the pupil(s) with special needs and for two pupils
without special needs. As the Questionnaire was expected to be filled in for a
diversity of children, this resulted in a broad range of scores. In seven classes,
the teacher filled in the Questionnaire for two pupils with special needs and for
only one pupil without special needs. The final sample thus consisted of 590
pupils, 237 of them with special needs and 353 without special needs. An
overview of categories of disabilities and its distribution is presented in the
second column of Table 2.
Table 2. Distribution of pupils with special needs into categories of disabilities and gender
Category of disabilities Number of pupils in absolute
numbers and percentages
Boy Girl
Behavioural disorder 29 (12.2%) 25 (86.2%) 4 (13.8%)
Autistic spectrum disorder 97 (40.9%) 83 (85.6%) 14 (14.4%)
Motor disability 35 (14.8%) 27 (77.1%) 8 (22.9%)
Intellectual disability 26 (11.0%) 10 (38.5%) 16 (61.5%)
Speech/language disabilities 47 (19.8%) 32 (68.1%) 15 (31.9%)
Learning disabilities 2 (0.8%) 2 (100%) 0
Chronic illness 1 (0.4%) 1 (100%) 0
Total 237 (100%) 180 (75.9%) 57 (24.1%)
5.2.2 Instrument
The Social Participation Questionnaire was constructed during a step by step
process. An exploration of literature (Koster, Nakken, Pijl & Van Houten, in
press) revealed four key themes of social participation: friendships/relationships,
contacts/interactions, pupil’s social self-perception and classmates’ acceptance.
In addition, on the basis of literature, tens of statements concerning social
participation were described. The content of the statements is mainly based on
literature and partly on the clinical and research experience of the researchers
who work for many years in the tradition of research looking at the social
dimension of inclusion in education. Since this process might have been coloured
by the researchers’ views, a panel consisting of 14 people with much practical
experience in inclusive education was asked to critically examine the statements.
The panel members were asked whether the formulated statements were in line
EXAMINATION OF THE PSYCHOMETRIC QUALITIES OF THE SOCIAL PARTICIPATION QUESTIONNAIRE
115
with their views of social participation, and to mention omissions. This detailed
verification of the statements was intended to increase the chance of including all
essential topics of social participation. Based on the panel’s comments, a list of
74 statements was compiled, yielding a picture of social participation (Koster,
Nakken, Pijl, Van Houten & Lutje Spelberg, in press). A second check of the
relevance of each statement was made using the ratings of a large group of
respondents (n=190) who all had experience with inclusive education. The
respondents were asked to rate the importance of each statement. Those
statements rated as important or very important by at least 75 percent of the
respondents were selected for the Questionnaire. In a pilot study the 30 resulting
statements were psychometrically examined on the basis of scores obtained on
60 pupils (25 with special needs and 35 without). The results of a confirmatory
factor analysis (Oblique Multiple Group Method, Holzinger, 1944) largely
supported the Questionnaire’s division into four subscales. The analysis revealed
that 22 out of 30 statements correlated strongest with the subscale they were
assigned to. The remaining eight statements had higher correlations with one or
more subscales they were not part of. The reliabilities of the
‘Friendships/relationships’ and ‘Contacts/interactions’ subscales were high
(respectively 0.94 and 0.88), whereas the reliabilities of the ‘Social self-
perception of pupil’ and ‘Acceptance by classmates’ subscales were fairly low
(respectively 0.69 and 0.64). In order to further improve the reliability of the
latter subscales, respectively three and two statements were added. One
statement, belonging to the ‘Contacts/interactions’ subscale was removed from
the list, as this statement was incongruous and correlated negatively with the
total score on the Questionnaire. Thus, the revised Questionnaire under study
here consisted of 34 statements representing the four key themes of social
participation in 6 to 14 statements, which have to be scored on a 5-point scale
(ranging from ‘this does not apply at all’ to ‘this strongly applies’). The majority
of the statements (n=24) are phrased in terms of social participation, while the
remainder (10 statements) is formulated in terms of social segregation. The key
themes ‘friendships/relationships’ and ‘acceptance by classmates’ are
represented only by statements phrased in terms of social participation. Table 3
gives some examples of both types of statements.
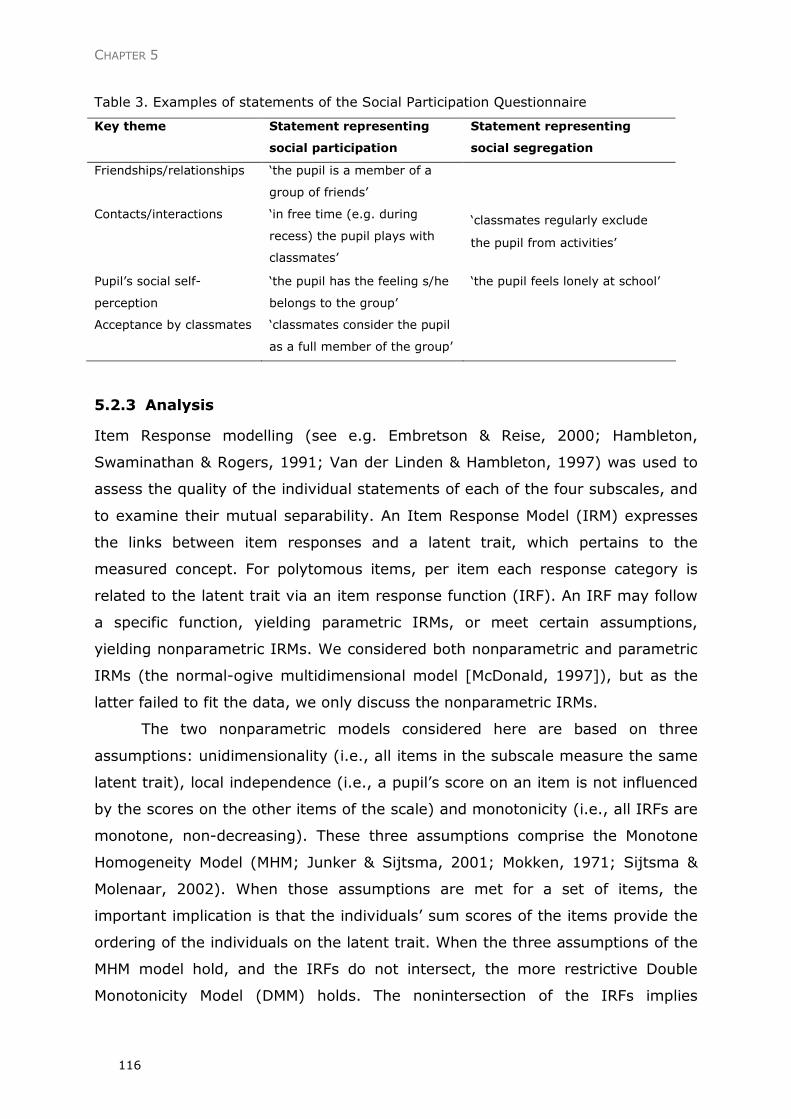
CHAPTER 5
116
Table 3. Examples of statements of the Social Participation Questionnaire
Key theme Statement representing
social participation
Statement representing
social segregation
Friendships/relationships ‘the pupil is a member of a
group of friends’
Contacts/interactions ‘in free time (e.g. during
recess) the pupil plays with
classmates’
‘classmates regularly exclude
the pupil from activities’
Pupil’s social self-
perception
‘the pupil has the feeling s/he
belongs to the group’
‘the pupil feels lonely at school’
Acceptance by classmates ‘classmates consider the pupil
as a full member of the group’
5.2.3 Analysis
Item Response modelling (see e.g. Embretson & Reise, 2000; Hambleton,
Swaminathan & Rogers, 1991; Van der Linden & Hambleton, 1997) was used to
assess the quality of the individual statements of each of the four subscales, and
to examine their mutual separability. An Item Response Model (IRM) expresses
the links between item responses and a latent trait, which pertains to the
measured concept. For polytomous items, per item each response category is
related to the latent trait via an item response function (IRF). An IRF may follow
a specific function, yielding parametric IRMs, or meet certain assumptions,
yielding nonparametric IRMs. We considered both nonparametric and parametric
IRMs (the normal-ogive multidimensional model [McDonald, 1997]), but as the
latter failed to fit the data, we only discuss the nonparametric IRMs.
The two nonparametric models considered here are based on three
assumptions: unidimensionality (i.e., all items in the subscale measure the same
latent trait), local independence (i.e., a pupil’s score on an item is not influenced
by the scores on the other items of the scale) and monotonicity (i.e., all IRFs are
monotone, non-decreasing). These three assumptions comprise the Monotone
Homogeneity Model (MHM; Junker & Sijtsma, 2001; Mokken, 1971; Sijtsma &
Molenaar, 2002). When those assumptions are met for a set of items, the
important implication is that the individuals’ sum scores of the items provide the
ordering of the individuals on the latent trait. When the three assumptions of the
MHM model hold, and the IRFs do not intersect, the more restrictive Double
Monotonicity Model (DMM) holds. The nonintersection of the IRFs implies
EXAMINATION OF THE PSYCHOMETRIC QUALITIES OF THE SOCIAL PARTICIPATION QUESTIONNAIRE
117
invariant item ordering, which means that the items have the same ordering in
terms of probabilities of positive responses to those items (or item category), for
all values of the latent trait.
For each of the subscales, the fit of both the MHM and DMM is assessed using the
programme Mokken Scale analysis for Polytomous items (MSP; Molenaar &
Sijtsma, 2000). For each item, the Item Scalability Coefficient Hi indicates
whether item i fits the MHM, because under the MHM 0 ≤ Hi ≤ 1. Moreover, it
indicates to what extent the item aids in discriminating across individuals. To
ensure items meet the MHM assumptions and to have sufficient discrimination
power, it is generally accepted that Hi should exceed 0.3 (Mokken, 1971).
Coefficient H is a weighted mean of the Hi-values of a set of items making up a
scale, and indicates the degree to which pupils can be ordered by means of the
sum score on the items. With 0.3 ≤ H < 0.4 a subscale is regarded as weak, with
0.4 ≤ H ≤ 0.5 as moderate and with H > 0.5 as strong. Apart from the Item
Scalability Coefficients, other diagnostics are used to assess whether the
monotonicity assumption and the non-intersection assumption of the DMM hold
for each item. Those diagnostics are summarised into criteria values, where a
value ≥ 80 strongly suggests an assumption violation, values between 40 and 80
are questionable, and a value ≤ 40 is satisfying (Molenaar & Sijtsma, 2000). To
assess possible differential item functioning across the groups of pupils with and
without special needs, the ordering of the response categories of all items is
compared across groups. A different ordering suggests differential item
functioning, which would imply that the scales could not be used to compare
individuals from both groups.
To assess the separability of the subscales, the automated item selection
procedure (AISP) in MSP will be used, following the guidelines of Sijtsma and
Molenaar (2002; pp. 80-82). The AISP aims at finding clusters of items, such
that within each cluster the Item Scalability Coefficients exceed a (user-
specified) boundary, and between clusters the Item Scalability Coefficients are
lower than the boundary. To this end, a stepwise selection procedure is applied.
The AISP will be performed on all items using various boundary values, which will
indicate whether the items pertain to one scale only or whether they are
separable into more than one subscale. When more subscales are distinguished
in the AISP, it will be evaluated whether the items are actually assigned to the
prespecified subscales.
CHAPTER 5
118
To sum up, the following analysis strategy will be used: First, for each
subscale the separate statements will be assessed using the Scalability
Coefficients, criteria values to assess the assumptions of the MHM and the DMM,
and the diagnostics for differential item functioning across the two groups. If
necessary, and after considering their content, statements may be deleted from
the subscales. Second, the scalability of each resulting subscale is assessed.
Third, the separability of the subscales will be examined.
When the subscales are in their definite composition, the reliability of both the
subscales and the total Questionnaire will estimated using Rho. Rho suffers from
bias to a lesser extent than classical reliability estimates (Sijtsma & Molenaar,
2002). According to Nunnally and Bernstein (1994, pp. 265), reliabilities of 0.80
and more are satisfactory in basic research.
Finally, discriminant validity of the entire Questionnaire and the four subscales
will be examined by comparing the scores of pupils with special needs with those
of typical pupils. The former are expected to receive lower scores on the
Questionnaire and on each of the four subscales. As there is no overlap of
content between the criteria used to classify the pupils and the Questionnaire’s
statements, a confirmation of this expectation implies evidence for the
Questionnaire’s discriminant validity.
5.3 Results
5.3.1 Mokken Scale Analysis
The four subscales were analysed separately to identify deviant statements, and
to assess possible differential item functioning across pupils with and without
special needs. In the following, only the examination of the properties of the
‘Friendships/relationships’ subscale will be described in detail. Examination of the
other subscales was done similarly. The qualities of the statements of those
subscales will be described briefly; a detailed description can be obtained from
the first author.
‘Friendships/relationships’ subscale. For the six statements of this subscale it was
found that 0.40 ≤ Hi ≤ 0.55. For each of the statements, the criteria values did
not indicate any violation of the monotonicity assumption, but suggested a
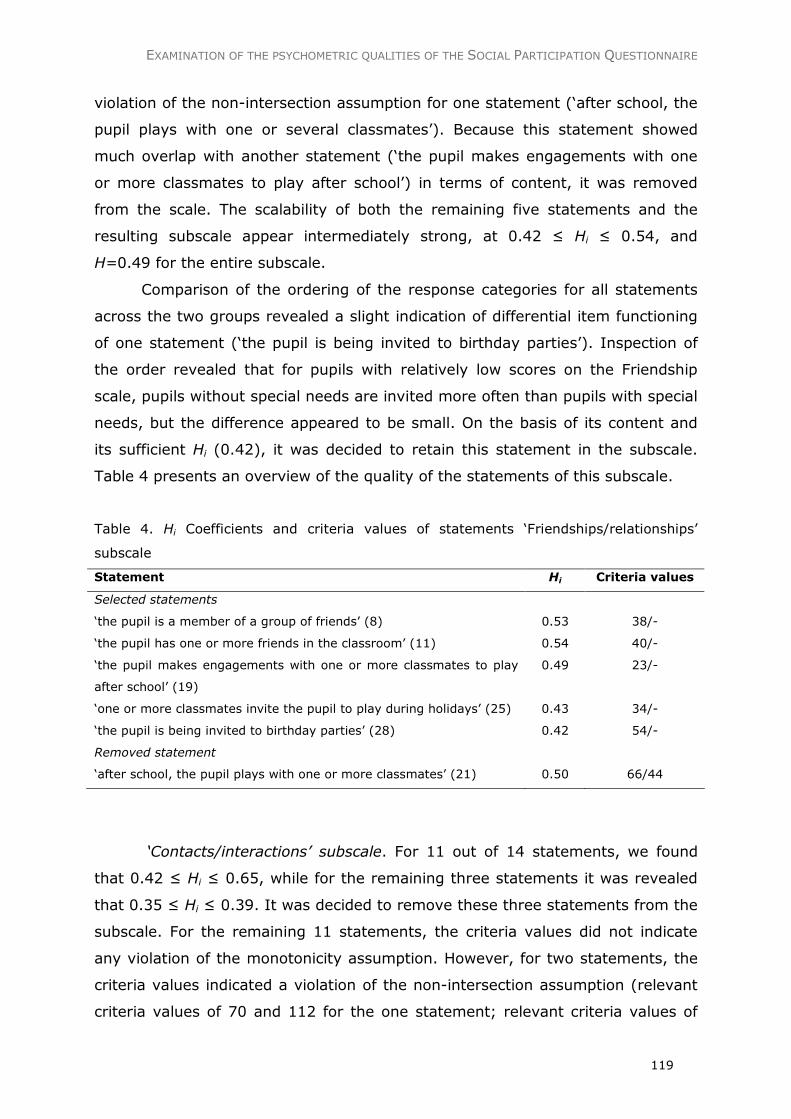
EXAMINATION OF THE PSYCHOMETRIC QUALITIES OF THE SOCIAL PARTICIPATION QUESTIONNAIRE
119
violation of the non-intersection assumption for one statement (‘after school, the
pupil plays with one or several classmates’). Because this statement showed
much overlap with another statement (‘the pupil makes engagements with one
or more classmates to play after school’) in terms of content, it was removed
from the scale. The scalability of both the remaining five statements and the
resulting subscale appear intermediately strong, at 0.42 ≤ Hi ≤ 0.54, and
H=0.49 for the entire subscale.
Comparison of the ordering of the response categories for all statements
across the two groups revealed a slight indication of differential item functioning
of one statement (‘the pupil is being invited to birthday parties’). Inspection of
the order revealed that for pupils with relatively low scores on the Friendship
scale, pupils without special needs are invited more often than pupils with special
needs, but the difference appeared to be small. On the basis of its content and
its sufficient Hi (0.42), it was decided to retain this statement in the subscale.
Table 4 presents an overview of the quality of the statements of this subscale.
Table 4. Hi Coefficients and criteria values of statements ‘Friendships/relationships’
subscale
Statement Hi Criteria values
Selected statements
‘the pupil is a member of a group of friends’ (8) 0.53 38/-
‘the pupil has one or more friends in the classroom’ (11) 0.54 40/-
‘the pupil makes engagements with one or more classmates to play
after school’ (19)
0.49 23/-
‘one or more classmates invite the pupil to play during holidays’ (25) 0.43 34/-
‘the pupil is being invited to birthday parties’ (28) 0.42 54/-
Removed statement
‘after school, the pupil plays with one or more classmates’ (21) 0.50 66/44
‘Contacts/interactions’ subscale. For 11 out of 14 statements, we found
that 0.42 ≤ Hi ≤ 0.65, while for the remaining three statements it was revealed
that 0.35 ≤ Hi ≤ 0.39. It was decided to remove these three statements from the
subscale. For the remaining 11 statements, the criteria values did not indicate
any violation of the monotonicity assumption. However, for two statements, the
criteria values indicated a violation of the non-intersection assumption (relevant
criteria values of 70 and 112 for the one statement; relevant criteria values of
CHAPTER 5
120
100 and 175 for the other). Both statements were removed from the subscale.
The five removed statements had weak discrimination power, since almost all
pupils received a high score on these statements (mean scores range from 4.4 to
4.8). The discrimination power of the remaining nine statements is stronger, as
the distribution of scores on these statements is more diverse (mean scores
range from 3.5 to 4.1).
The scalability of the nine statements appears strong, 0.62 ≤ Hi ≤ 0.74. The
same applies to the resulting subscale, H=0.70. Differential item functioning
appeared to be absent, which implies that the scale scores are directly
comparable across pupils with and without special needs.
‘Social self-perception of pupil’ subscale. For five out of seven statements
it was found that 0.43 ≤ Hi ≤ 0.53, while for the remaining two statements 0.30
≤ Hi ≤ 0.34. For one of these two statements, the non-intersection assumption
was violated (relevant criteria values of 107 and 104). Both statements aim at
the pupil daring to tell or to ask something in the classroom. These statements
are somewhat deviating from the other statements in the subscale, which focus
on feelings of the pupil (like happiness, loneliness, sense of belonging) in stead
of daring. Both statements were removed from the subscale, after which the
scalability of the remaining five items slightly increased (0.47 ≤ Hi ≤ 0.56). For
none of the remaining five statements any violation of monotonicity assumption
or non-intersection assumption was suggested and there is no indication of
differential item functioning. Overall scalability coefficient H is 0.51, which
implies a strong subscale.
‘Acceptance by classmates’ subscale. For five out of seven statements of
this subscale it was found that 0.43 ≤ Hi ≤ 0.53, while for the other two
statements Hi was 0.36 and 0.33. For each of the remaining five statements, the
criteria values did not suggest any violation of both the monotonicity assumption
and the non-intersection assumption. The scale scores are directly comparable
across pupils with and without special needs, as differential item functioning
appeared to be absent. The scalability of the individual five statements and the
resulting subscale appears strong, with 0.48 ≤ Hi ≤ 0.61 and H=0.54 for the
entire subscale.
EXAMINATION OF THE PSYCHOMETRIC QUALITIES OF THE SOCIAL PARTICIPATION QUESTIONNAIRE
121
To summarise, ten out of 34 statements were removed because of their
low Hi value and/or high criteria values. For each of the four resulting subscales,
based on 24 statements, no violations of the four assumptions of the DMM were
observed. In addition, for each subscale differential item functioning appeared to
be absent, implying that the scale scores are directly comparable across pupils
with and without special needs.
5.3.2 Separability of the subscales
The separability of the four subscales was examined with the automated item
selection procedure (AISP). First, the AISP was applied to all 24 statements at
different boundary levels. The results indicated a multidimensional item set, as
with increasing boundary values four subscales were distinguished. With a
boundary value as high as c=0.60, the first selected scale contained all nine
statements of the ‘Contacts/interactions’ subscale. The subsequent three scales
consisted of two statements each, neatly belonging to the
‘Friendships/relationships’, ‘Pupil’s social self-perception’ and ‘Acceptance by
classmates’ subscales, respectively. The remaining nine statements were
indicated as non-scalable, which is not surprising given the high boundary value.
With boundary values c lower than 0.60, the first selected scale consisted of the
‘Contacts/interactions’ statements, mixed with certain statements from the other
three subscales. This is not surprising, because the ‘Contacts/interactions’
subscale itself was found to be much stronger (H=0.70) than the remaining three
(0.49<H<0.54). Presumably, statements of the other three subscales not only
contain aspects related to their own key theme, but also aspects connected to
contacts and interactions.
Repeating the AISP at different boundary levels with all statements except
for the nine statements of the ‘Contacts/interactions’ subscale resulted in a clear
distinction of the three remaining subscales. This indicates that the statements
which initially were attracted to the ‘Contacts/interactions’ subscale also contain
unique aspects that belong to the key themes they are representing. Those
results suggest that the four subscales are distinguished to a reasonable extent.
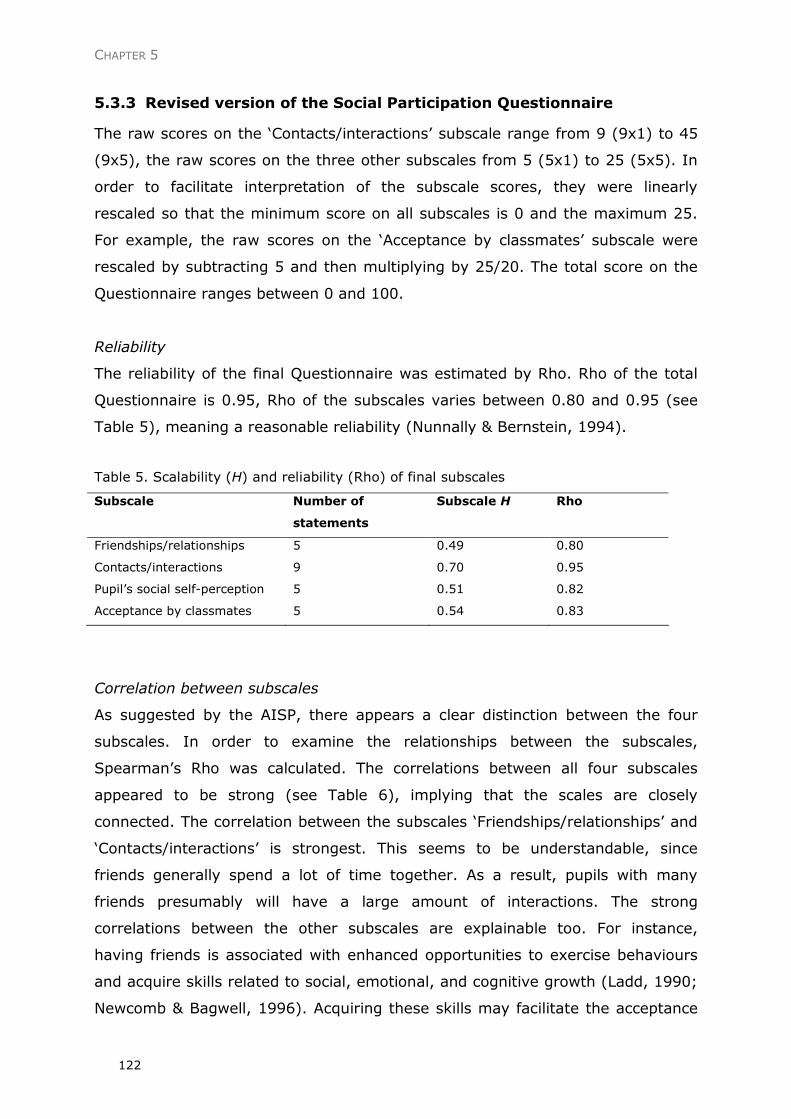
CHAPTER 5
122
5.3.3 Revised version of the Social Participation Questionnaire
The raw scores on the ‘Contacts/interactions’ subscale range from 9 (9x1) to 45
(9x5), the raw scores on the three other subscales from 5 (5x1) to 25 (5x5). In
order to facilitate interpretation of the subscale scores, they were linearly
rescaled so that the minimum score on all subscales is 0 and the maximum 25.
For example, the raw scores on the ‘Acceptance by classmates’ subscale were
rescaled by subtracting 5 and then multiplying by 25/20. The total score on the
Questionnaire ranges between 0 and 100.
Reliability
The reliability of the final Questionnaire was estimated by Rho. Rho of the total
Questionnaire is 0.95, Rho of the subscales varies between 0.80 and 0.95 (see
Table 5), meaning a reasonable reliability (Nunnally & Bernstein, 1994).
Table 5. Scalability (H) and reliability (Rho) of final subscales
Subscale Number of
statements
Subscale H Rho
Friendships/relationships 5 0.49 0.80
Contacts/interactions 9 0.70 0.95
Pupil’s social self-perception 5 0.51 0.82
Acceptance by classmates 5 0.54 0.83
Correlation between subscales
As suggested by the AISP, there appears a clear distinction between the four
subscales. In order to examine the relationships between the subscales,
Spearman’s Rho was calculated. The correlations between all four subscales
appeared to be strong (see Table 6), implying that the scales are closely
connected. The correlation between the subscales ‘Friendships/relationships’ and
‘Contacts/interactions’ is strongest. This seems to be understandable, since
friends generally spend a lot of time together. As a result, pupils with many
friends presumably will have a large amount of interactions. The strong
correlations between the other subscales are explainable too. For instance,
having friends is associated with enhanced opportunities to exercise behaviours
and acquire skills related to social, emotional, and cognitive growth (Ladd, 1990;
Newcomb & Bagwell, 1996). Acquiring these skills may facilitate the acceptance
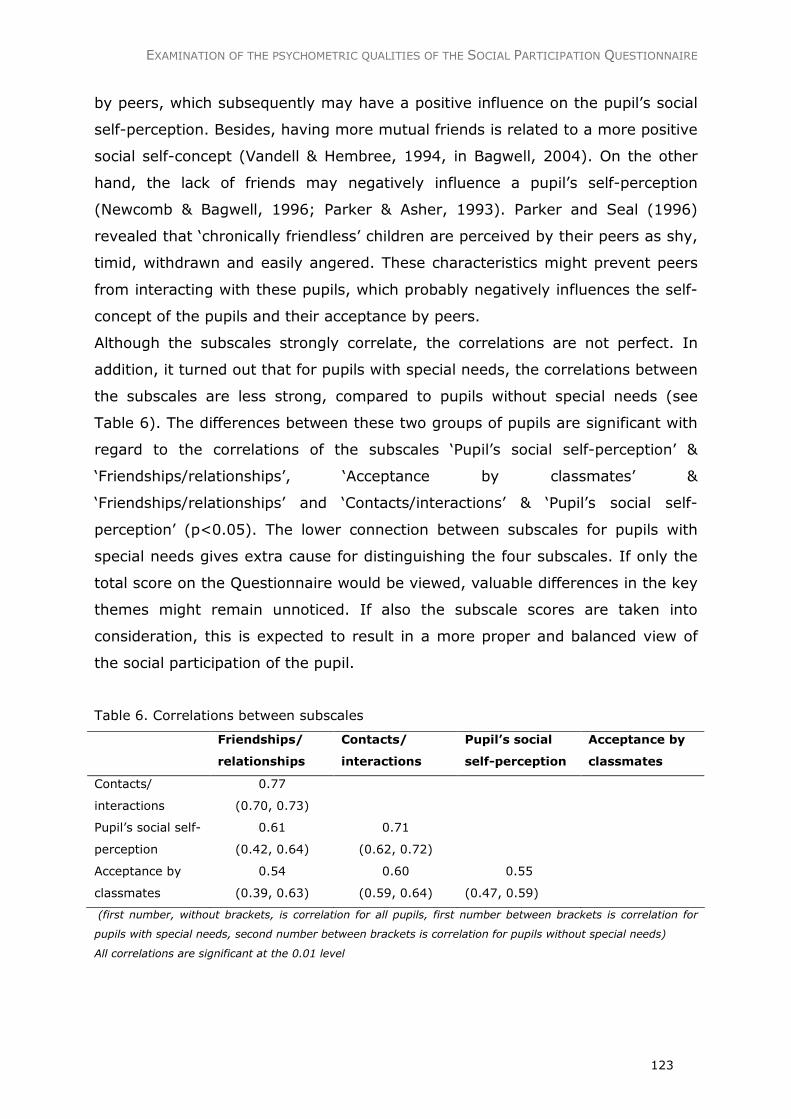
EXAMINATION OF THE PSYCHOMETRIC QUALITIES OF THE SOCIAL PARTICIPATION QUESTIONNAIRE
123
by peers, which subsequently may have a positive influence on the pupil’s social
self-perception. Besides, having more mutual friends is related to a more positive
social self-concept (Vandell & Hembree, 1994, in Bagwell, 2004). On the other
hand, the lack of friends may negatively influence a pupil’s self-perception
(Newcomb & Bagwell, 1996; Parker & Asher, 1993). Parker and Seal (1996)
revealed that ‘chronically friendless’ children are perceived by their peers as shy,
timid, withdrawn and easily angered. These characteristics might prevent peers
from interacting with these pupils, which probably negatively influences the self-
concept of the pupils and their acceptance by peers.
Although the subscales strongly correlate, the correlations are not perfect. In
addition, it turned out that for pupils with special needs, the correlations between
the subscales are less strong, compared to pupils without special needs (see
Table 6). The differences between these two groups of pupils are significant with
regard to the correlations of the subscales ‘Pupil’s social self-perception’ &
‘Friendships/relationships’, ‘Acceptance by classmates’ &
‘Friendships/relationships’ and ‘Contacts/interactions’ & ‘Pupil’s social self-
perception’ (p<0.05). The lower connection between subscales for pupils with
special needs gives extra cause for distinguishing the four subscales. If only the
total score on the Questionnaire would be viewed, valuable differences in the key
themes might remain unnoticed. If also the subscale scores are taken into
consideration, this is expected to result in a more proper and balanced view of
the social participation of the pupil.
Table 6. Correlations between subscales
Friendships/
relationships
Contacts/
interactions
Pupil’s social
self-perception
Acceptance by
classmates
Contacts/
interactions
0.77
(0.70, 0.73)
Pupil’s social self-
perception
0.61
(0.42, 0.64)
0.71
(0.62, 0.72)
Acceptance by
classmates
0.54
(0.39, 0.63)
0.60
(0.59, 0.64)
0.55
(0.47, 0.59)
(first number, without brackets, is correlation for all pupils, first number between brackets is correlation for
pupils with special needs, second number between brackets is correlation for pupils without special needs)
All correlations are significant at the 0.01 level
CHAPTER 5
124
5.3.4 Discriminant validity
To assess the Questionnaire’s discriminant validity, a comparison was made
between the scores of pupils with special needs and those of their typical
classmates. Based on literature (e.g., De Monchy et al., 2004; Pijl, Frostad &
Flem, in press; Scheepstra, Nakken & Pijl, 1999), it was expected that the social
participation of pupils with special needs would be assessed less positively than
that of their classmates. A distinction was also made between different
categories of disabilities. Pupils diagnosed as having autistic spectrum disorders
and pupils diagnosed as having behavioural disorders were expected to receive
the lowest mean scores on the Questionnaire, as research has shown that these
pupils find it particularly difficult to build relationships with typical peers and are
at risk of becoming isolated in the classroom (De Monchy et al., 2004; Garrison-
Harrell, Kamps & Kravits, 1997). Both groups of pupils were expected to receive
low scores on each of the four subscales. Pupils diagnosed as having motor
disabilities were expected to receive the highest scores on the four subscales, as
their type of disability presumably has the least impact on social functioning in
the classroom. In addition, motor disabilities are visible and understandable for
classmates, which fosters acceptance (Lewis, 1995, in Laws & Kelly, 2005).
Comparisons were made between subgroups of pupils with different categories of
disabilities for the scores on the total Questionnaire and for the scores on the
four subscales.
Total Questionnaire. On average, pupils with special needs got a
substantially lower score (M=67.5, SD=16.6) than their typical counterparts
(M=80.2, SD=15.1), and this difference appeared significant (95% CI dif =
10.1;15.3). This implies that the social participation of pupils with special needs
is assessed lower compared to the social participation of their classmates without
special needs. As this confirms the expectation that the social participation of
pupils with special needs would be assessed less highly, it can be regarded as
evidence for the Questionnaire’s discriminant validity.
A one-way analysis of variance (ANOVA) revealed significant group
differences between pupils with different categories of disabilities: F(4,
225)=4.88, p<0.05 (where the learning disabilities and chronic illness categories
were excluded since the group sizes were too small). Pupils diagnosed as having
behavioural disorders (M=62.9, SD=18.3) and autistic spectrum disorders
(M=64.1, SD=15.6) got the lowest scores, which confirms our expectation. The
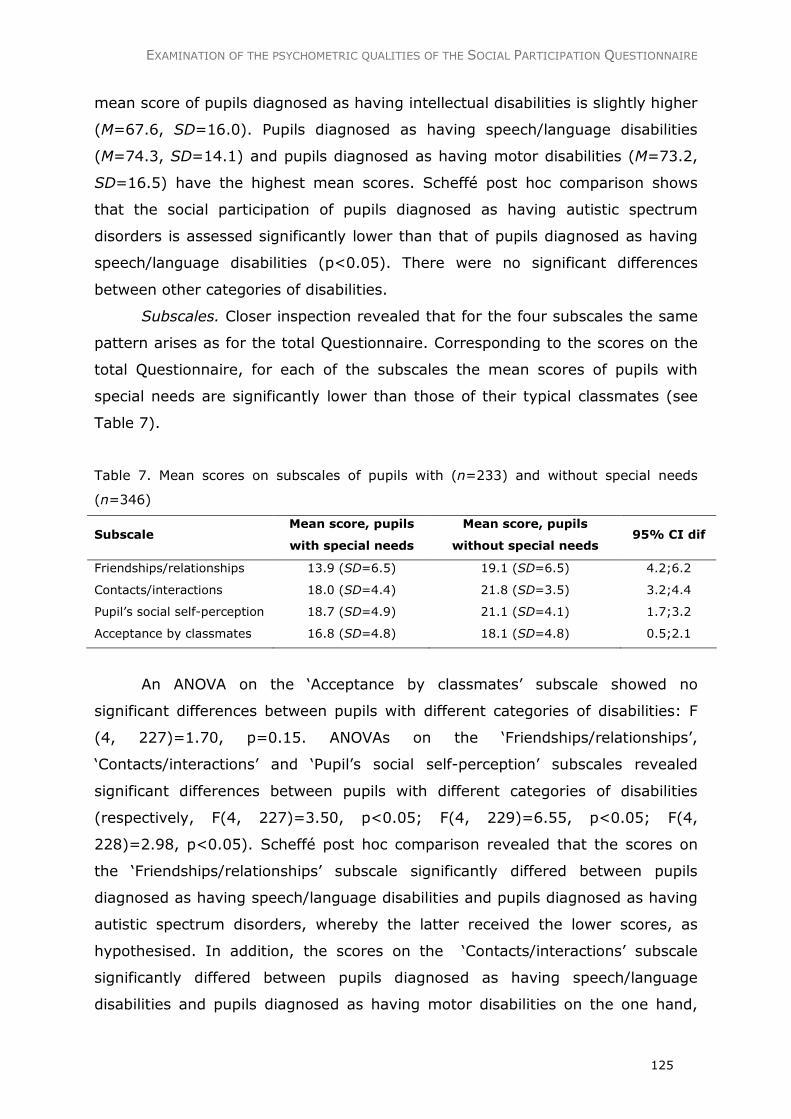
EXAMINATION OF THE PSYCHOMETRIC QUALITIES OF THE SOCIAL PARTICIPATION QUESTIONNAIRE
125
mean score of pupils diagnosed as having intellectual disabilities is slightly higher
(M=67.6, SD=16.0). Pupils diagnosed as having speech/language disabilities
(M=74.3, SD=14.1) and pupils diagnosed as having motor disabilities (M=73.2,
SD=16.5) have the highest mean scores. Scheffé post hoc comparison shows
that the social participation of pupils diagnosed as having autistic spectrum
disorders is assessed significantly lower than that of pupils diagnosed as having
speech/language disabilities (p<0.05). There were no significant differences
between other categories of disabilities.
Subscales. Closer inspection revealed that for the four subscales the same
pattern arises as for the total Questionnaire. Corresponding to the scores on the
total Questionnaire, for each of the subscales the mean scores of pupils with
special needs are significantly lower than those of their typical classmates (see
Table 7).
Table 7. Mean scores on subscales of pupils with (n=233) and without special needs
(n=346)
Subscale Mean score, pupils
with special needs
Mean score, pupils
without special needs 95% CI dif
Friendships/relationships 13.9 (SD=6.5) 19.1 (SD=6.5) 4.2;6.2
Contacts/interactions 18.0 (SD=4.4) 21.8 (SD=3.5) 3.2;4.4
Pupil’s social self-perception 18.7 (SD=4.9) 21.1 (SD=4.1) 1.7;3.2
Acceptance by classmates 16.8 (SD=4.8) 18.1 (SD=4.8) 0.5;2.1
An ANOVA on the ‘Acceptance by classmates’ subscale showed no
significant differences between pupils with different categories of disabilities: F
(4, 227)=1.70, p=0.15. ANOVAs on the ‘Friendships/relationships’,
‘Contacts/interactions’ and ‘Pupil’s social self-perception’ subscales revealed
significant differences between pupils with different categories of disabilities
(respectively, F(4, 227)=3.50, p<0.05; F(4, 229)=6.55, p<0.05; F(4,
228)=2.98, p<0.05). Scheffé post hoc comparison revealed that the scores on
the ‘Friendships/relationships’ subscale significantly differed between pupils
diagnosed as having speech/language disabilities and pupils diagnosed as having
autistic spectrum disorders, whereby the latter received the lower scores, as
hypothesised. In addition, the scores on the ‘Contacts/interactions’ subscale
significantly differed between pupils diagnosed as having speech/language
disabilities and pupils diagnosed as having motor disabilities on the one hand,
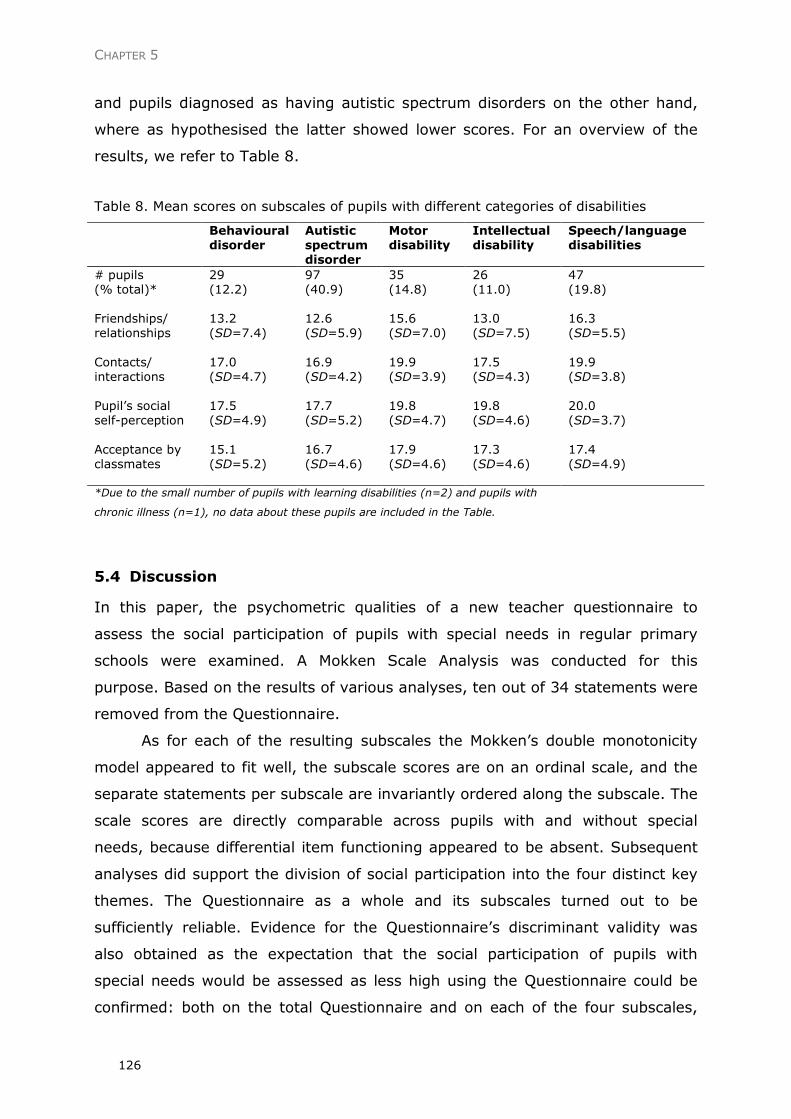
CHAPTER 5
126
and pupils diagnosed as having autistic spectrum disorders on the other hand,
where as hypothesised the latter showed lower scores. For an overview of the
results, we refer to Table 8.
Table 8. Mean scores on subscales of pupils with different categories of disabilities
Behavioural disorder
Autistic spectrum disorder
Motor disability
Intellectual disability
Speech/language disabilities
# pupils (% total)*
29 (12.2)
97 (40.9)
35 (14.8)
26 (11.0)
47 (19.8)
Friendships/ relationships
13.2 (SD=7.4)
12.6 (SD=5.9)
15.6 (SD=7.0)
13.0 (SD=7.5)
16.3 (SD=5.5)
Contacts/ interactions
17.0 (SD=4.7)
16.9 (SD=4.2)
19.9 (SD=3.9)
17.5 (SD=4.3)
19.9 (SD=3.8)
Pupil’s social self-perception
17.5 (SD=4.9)
17.7 (SD=5.2)
19.8 (SD=4.7)
19.8 (SD=4.6)
20.0 (SD=3.7)
Acceptance by classmates
15.1 (SD=5.2)
16.7 (SD=4.6)
17.9 (SD=4.6)
17.3 (SD=4.6)
17.4 (SD=4.9)
*Due to the small number of pupils with learning disabilities (n=2) and pupils with
chronic illness (n=1), no data about these pupils are included in the Table.
5.4 Discussion
In this paper, the psychometric qualities of a new teacher questionnaire to
assess the social participation of pupils with special needs in regular primary
schools were examined. A Mokken Scale Analysis was conducted for this
purpose. Based on the results of various analyses, ten out of 34 statements were
removed from the Questionnaire.
As for each of the resulting subscales the Mokken’s double monotonicity
model appeared to fit well, the subscale scores are on an ordinal scale, and the
separate statements per subscale are invariantly ordered along the subscale. The
scale scores are directly comparable across pupils with and without special
needs, because differential item functioning appeared to be absent. Subsequent
analyses did support the division of social participation into the four distinct key
themes. The Questionnaire as a whole and its subscales turned out to be
sufficiently reliable. Evidence for the Questionnaire’s discriminant validity was
also obtained as the expectation that the social participation of pupils with
special needs would be assessed as less high using the Questionnaire could be
confirmed: both on the total Questionnaire and on each of the four subscales,
EXAMINATION OF THE PSYCHOMETRIC QUALITIES OF THE SOCIAL PARTICIPATION QUESTIONNAIRE
127
the mean scores of pupils with special needs were significantly lower than those
of their typical counterparts. More aspects of the Questionnaire’s construct
validity will be examined in further research.
Scheffé post hoc comparisons of the scores on the Social Participation
Questionnaire made clear that there are significant differences between pupils
with different categories of disabilities. It was revealed that the scores on two
out of four subscales significantly differed between pupils diagnosed as having
autistic spectrum disorders and pupils diagnosed as having speech/language
disorders (and for one subscale also pupils diagnosed as having motor
disabilities), whereby the latter received the highest scores. The other
differences in subscale scores between pupils with different categories of
disabilities were not significant. This might be related to the fact that the
subgroups of disabilities contained rather small numbers of pupils. We could have
decided to involve less categories of disabilities in the study, in order to compose
larger subgroups of specific categories of disabilities. However, we consciously
included such a variety of disabilities in the sample, as the Questionnaire has
been developed for all pupils. This fits with the fact that in the Netherlands, the
group of pupils with special needs attending regular education is rather
heterogeneous. In order to examine the applicability of the Questionnaire, it was
desirable to involve pupils with various categories of disabilities in the study. In a
future study, when the Questionnaire has its definitive form, it would be
advisable to involve larger homogeneous subgroups of pupils. That way it might
be possible to aim analyses on possible differences in scores on the
Questionnaire of pupils with different categories of disabilities. Among other
things, one could assess possible differential item functioning between subgroups
of pupils with different categories of disabilities. In the current study, we do not
know if the scale scores are directly comparable across pupils with different
categories of disabilities, as the subgroups were too small to conduct analyses.
However, on theoretical grounds, we assume that the Questionnaire is applicable
for pupils with various categories of disabilities, as none of its statements are
particularly focused on specific categories of disabilities.
The low mean scores of the pupils diagnosed as having autistic spectrum
disorders (whether or not in combination with behavioural disorders) were in
accordance with other studies, which revealed that in particular these pupils
experience difficulty building relationships with typical peers and are at risk of
CHAPTER 5
128
becoming isolated in the classroom (De Monchy et al., 2004; Garrison-Harrell et
al., 1997). Further research into differences between categories of disabilities is
recommended, since treating pupils with special needs as one homogenous
group might reveal a too negative picture of the social participation of pupils with
specific types of disabilities.
In conclusion, the Social Participation Questionnaire has the potential to
become a useful tool for teachers, as it helps them obtain clarity about the social
participation of their pupils. The Questionnaire takes into consideration the
comprehensiveness of the concept of social participation by providing insight into
four distinguished themes of social participation, while other instruments only
focus on parts of this concept (for instance sociometric questionnaires mainly
focus on pupils’ friendships and/or their acceptance by classmates, and
observation scales mainly focus on interactions). The Social Participation
Questionnaire is a teacher-friendly instrument because it can be completed in a
short time and provides a reliable and wide picture of the social participation of
pupils. Further research into the Questionnaire’s psychometric properties is
needed. The outcomes of the present study provided evidence for the
Questionnaire’s discriminating power, because of the presence of the expected
score differences between pupils with and without special needs. It should be
kept in mind that this difference in scores is a necessary, but not sufficient
prerequisite for establishing the discriminant validity of our Questionnaire. More
aspects of the Questionnaire’s validity will be examined in further research.
After having obtained evidence for the validity of the Social Participation
Questionnaire, its usability in practice will be examined. The Questionnaire is
expected to help teachers make more appropriate assessments of the social
participation of their pupils. As a result, teachers might be encouraged to take
measures in time, which will contribute to optimise the situation of pupils with
special needs in inclusive classrooms.
5.5 References
Bagwell, C.L. (2004). Friendships, peer networks, and antisocial behavior. In J.
B. Kupersmidt & K.A. Dodge (Eds.), Children's peer relations: From
development to intervention (pp. 37-57). Washington, D.C.: American
Psychological Association.
EXAMINATION OF THE PSYCHOMETRIC QUALITIES OF THE SOCIAL PARTICIPATION QUESTIONNAIRE
129
Bagwell, C.L., Newcomb, A.F. & Bukowski, W.M. (1998). Preadolescent friendship
and peer rejection as predictors of adult adjustment. Child Development,
69(1), 140-153.
De Monchy, M., Pijl, S.J. & Zandberg, T.J. (2004). Discrepancies in judging social
inclusion and bullying of pupils with behaviour problems. European Journal
of Special Needs Education, 19(3), 317-330.
Durrant, J.E., Cunningham, C.E. & Voelker, S. (1990). Academic, social and
general self-concepts of behavioural subgroups of learning disabled
children. Journal of Educational Psychology, 82(4), 657-663.
Embretson, S.E. & Reise, S.P. (2000). Item response theory for psychologists.
Mahwah, New Jersey: Lawrence Erlbaum.
Frostad, P. & Pijl, S.J. (2007). Does being friendly help in making friends? The
relation between the social position and social skills of pupils with special
needs in mainstream education. European Journal of Special Needs
Education, 22(1), 15-30.
Garrison-Harrell, L., Kamps, D. & Kravits, T. (1997). The effects of peer networks
on social-communicative behaviors of students with autism. Focus on
Autism and other Developmental Disabilities, 12(4), 241-254.
Hambleton, R.K., Swaminathan, H. & Rogers, H.J. (1991). Fundamentals of Item
Response Theory. Volume 2. Newbury Park: Sage Publications.
Holzinger, K.J. (1944). A simple method of factor analysis. Psychometrika, 9(4),
257-262.
Junker, B.W. & Sijtsma, K. (2001). Nonparametric Item Response Theory in
action: an overview of the special issue. Applied Psychological
Measurement, 25(3), 211-220.
Koster, M., Nakken, H., Pijl, S.J. & Van Houten, E.J. (in press). Being part of the
peer group: a literature study focusing on the social dimension of inclusion
in education. International Journal of Inclusive Education.
Koster, M., Nakken, H., Pijl, S.J., Van Houten, E.J. & Lutje Spelberg, H.C. (in
press). Assessing social participation of pupils with special needs in
inclusive education: the construction of a teacher questionnaire.
Educational Research and Evaluation.
Ladd, G.W. (1990). Having friends, keeping friends, making friends, and being
liked by peers in the classroom: predictors of children’s early school
adjustment? Child Development, 61, 1081-1100.
CHAPTER 5
130
Laws, G. & Kelly, E. (2005). The Attitudes and Friendship Intentions of Children
in United Kingdom Mainstream Schools towards Peers with Physical or
Intellectual Disabilities. International Journal of Disability, Development
and Education, 52(2), 79-99.
Male, D.B. (2007). The friendships and peer relationships of children and young
people who experience difficulties in learning. In L. Florian (Ed.), The
SAGE handbook of Special Education (pp. 460-474). London: SAGE
Publications.
McDonald, R.P. (1997). Normal-ogive multidimensional model. In W.J. Van der
Linden & R.K. Hambleton (Eds.), Handbook of modern item response
theory (pp. 258-269). New York: Springer.
Mokken, R.J. (1971). A theory and procedure of scale analysis with applications
in political research. The Hague: Mouton.
Molenaar, I.W. & Sijtsma, K. (2000). User’s manual MSP5 for Windows.
Groningen: iecProGAMMA.
Newcomb, A.F. & Bagwell, C.L. (1996). The developmental significance of
children’s friendship relations. In W.M. Bukowski, A.F. Newcomb & W.W.
Hartup (Eds.), The company they keep: friendship in childhood and
adolescence (pp. 289-321). Cambridge: Cambridge University Press.
Nunnally, J.C. (1978). Psychometric Theory (2nd ed.). New York: McGraw-Hill.
Nunnally, J.C. & Bernstein, I.H. (1994). Psychometric Theory (3rd ed.). New
York: Mc.Graw-Hill, Inc.
Parker, J.G. & Asher, S.R. (1993). Friendship and friendship quality in middle
childhood: links with peer group acceptance and feelings of loneliness and
social dissatisfaction. Developmental Psychology, 29(4), 611-621.
Parker, J.G. & Asher, S.R. (1987). Peer relations and later personal adjustment:
are low-accepted children at risk? Psychological Bulletin, 102(3), 357-389.
Parker, J.G., & Seal, J. (1996). Forming, losing, renewing, and replacing
friendships: Applying temporal parameters to the assessment of children's
friendship experiences. Child Development, 67, 2248-2268.
Pijl, S.J., Frostad, P. & Flem, A. (in press). The social position of pupils with
special needs in regular schools. Scandinavian Journal of Educational
Research.
EXAMINATION OF THE PSYCHOMETRIC QUALITIES OF THE SOCIAL PARTICIPATION QUESTIONNAIRE
131
Powless, D.L. & Elliott, S.N. (1993). Assessment of social skills of native
American preschoolers: teachers’ and parents’ ratings. Journal of Social
Psychology, 31, 293-307.
Scheepstra, A.J.M., Nakken, H. & Pijl, S.J. (1999). Contact with classmates: the
social position of pupils with Down’s Syndrome in Dutch mainstream
education. European Journal of Special Needs Education, 14(3), 212-220.
Sijtsma, K. & Molenaar, I.W. (2002). Introduction to Nonparametric Item
Response Theory. Volume 5. Thousand Oaks: Sage Publications.
Sloper, T. & Tyler, S. (1992). Integration of children with severe learning
difficulties in mainstream schools: evaluation of a pilot study. Educational
and Child Psychology, 9(4), 35-45.
Van der Linden, W.J. & Hambleton, R.K. (1997). Handbook of modern item
response theory. New York: Springer.

CHAPTER 5
132
Chapter 6 Validation of the Social Participation Questionnaire1
CHAPTER 6
VALIDATION OF THE SOCIAL PARTICIPATION QUESTIONNAIRE
A slightly adapted version of this article has been submitted for publication and was co-authored by Alexander E.M.G. Minnaert, Han Nakken, Sip Jan Pijl and Els J. van Houten
CHAPTER 6
134
Abstract
This study addresses the convergent validity of a new teacher questionnaire to
assess the social participation of pupils with special needs in regular primary
schools. This Social Participation Questionnaire consists of four subscales
representing four key themes of social participation: friendships/relationships,
contacts/interactions, pupil’s social self-perception and acceptance by
classmates.
Inspection of the correlations between the Questionnaire’s subscales and other
instruments to assess the four key themes revealed that evidence for the
Questionnaire’s convergent validity was rather spurious. A second order analysis,
a confirmatory factor analysis using the LISREL program, removed this lack of
clarity and provided evidence for the Questionnaire’s convergent validity. The
outcomes of this analysis support the model of social participation, distinguishing
four key themes.
VALIDATION OF THE SOCIAL PARTICIPATION QUESTIONNAIRE
135
6.1 Introduction
Educating pupils with special needs in inclusive classrooms is an important
objective of many countries. Inclusion in education focuses not only on academic
issues, but also on meeting pupils’ physical, social and emotional needs (Koster,
Nakken, Pijl & Van Houten, in press). In this respect, maximizing social
participation of pupils with special needs is generally considered as a main aim of
inclusion. As described by Koster, Nakken, Pijl & Van Houten (in press), social
participation is about the presence of positive social contacts/interactions
between pupils with special needs and their classmates, acceptance of them by
their classmates, social relationships/friendships between them and their
classmates, and the pupils’ own perception of their social position.
The different aspects of social participation are closely connected. For
instance, having interactions with classmates seems to be a prerequisite for
making friends and, at the same time, pupils with many friends presumably have
many interactions, as friendships in pre-adolescence are associated with shared
activities (LaGreca, 1997, in Male, 2007). Having friends is associated with
enhanced opportunities to exercise behaviours and acquire skills related to
social, emotional and cognitive growth (Ladd, 1990; Newcomb & Bagwell, 1996).
Acquiring these skills may facilitate acceptance by peers, which subsequently
may have a positive influence on the pupil’s social self-perception. Conversely, a
lack of friends may negatively influence a pupil’s social self-perception. Pupils’
social self-perception may also influence their relationships. For instance, pupils
with a low social self-perception may avoid social situations, which prevents
them from building relationships with peers (Pijl & Frostad, 2008). Because of
this strong interrelatedness of the aspects of social participation, pupils may
become involved in a vicious circle, either positive or negative. This latter
scenario is alarming, as it is known from international research that peer
relationship difficulties, a low social status and a negative self-concept might lead
to psychological maladjustment later in life (Bagwell, Newcomb & Bukowski,
1998; Nelson, Rubin & Fox, 2005; Parker & Asher, 1987; Terry & Coie, 1991).
In this respect, pupils with special needs are at risk, since international
studies have frequently shown that inclusion of these pupils does not
automatically lead to an increase of friendships between them and their typical
peers (De Monchy, Pijl & Zandberg, 2004). Whereas the majority of pupils
CHAPTER 6
136
without special needs find no difficulty in making friends and building positive
relations with their peers (Powless & Elliott, 1993), pupils with special needs
experience considerably more difficulty building friendships in inclusive
classrooms (Frostad & Pijl, 2007). Several studies have shown that pupils with
(mild) disabilities — compared to their typical counterparts — report significantly
higher loneliness scores (Heiman & Margalit, 1998; Lackaye & Margalit, 2006;
Luftig, 1988; Pavri & Monda-Amaya, 2000; Williams & Asher, 1992) and a higher
degree of social dissatisfaction with their peer relationships (Taylor, Asher &
Williams, 1987, in Gresham & McMillan, 1997). In addition, the self-concept of
pupils with special needs is found to be significantly lower (Bender & Wall, 1994;
Cambra & Silvestre, 2003; Pijl, Skaalvik & Skaalvik, 2008), which might lead to
externalizing problems (e.g. aggression) and internalizing problems (e.g.
anxiety) (Durrant, Cunningham & Voelker, 1990).
Because of the rather harmful long-term effects of negative social
experiences at school, it is important to monitor the social participation of pupils
with special needs, an increasing percentage of whom attend regular education.
This concerns a vital task for teachers, since they should be the first ones to
notice if a pupil is excluded by peers and becomes isolated (De Monchy et al.,
2004). However, several studies (De Monchy et al., 2004; Scheepstra, Nakken &
Pijl, 1999; Whitney, Smith & Thompson, 1994) have shown that teachers’
assessments of the social participation of pupils with special needs in their
classroom are not always appropriate. They seem to have too positive a view of
the social participation of these pupils, and negative occurrences (like bullying or
neglecting) seem to be noticed insufficiently. It is vital that teachers make
appropriate and complete assessments of the social participation of pupils,
because only when they notice that a pupil becomes isolated or is being teased
can they take appropriate measures. Koster, Nakken, Pijl, Van Houten and Lutje
Spelberg (in press) developed a questionnaire for teachers to assess the social
participation of pupils with special needs. This Social Participation Questionnaire
aims at pupils in Grades 1 to 3, a crucial age period in the lives of children. The
friendships and contacts of pupils in lower grades (pre-schoolers) are still of a
transitory nature, as is their social position in class. In higher grades, children’s
friendships and contacts are more stable. However, in the highest grades of
primary education the social position of pupils tends to be so stable that it is very
hard to change it. Pupils’ views of each other are often persistent, so changing
VALIDATION OF THE SOCIAL PARTICIPATION QUESTIONNAIRE
137
these views is very difficult. Therefore, it is desirable to start intervening at an
early age instead of postponing interventions to the higher grades.
The Social Participation Questionnaire is based on a model of social
participation developed by Koster, Nakken, Pijl and Van Houten (in press). This
model is derived from a review of the literature and distinguishes four key
themes within the concept of social participation: friendships/relationships,
contacts/interactions, pupil’s social self-perception and acceptance by
classmates. The Social Participation Questionnaire covers the total concept of
social participation, with four key themes represented in four subscales. Unlike
other instruments, which aim at certain aspects of social participation (like
sociometric questionnaires or observation scales), the Social Participation
Questionnaire takes into consideration the comprehensiveness of the total
concept of social participation. This study addresses the question of whether the
Social Participation Questionnaire is valid to assess the social participation of
pupils with special needs in regular primary schools.
6.2 Method
In this study, the focus lies on one aspect of the construct validity, namely the
convergent validity of the Social Participation Questionnaire. Convergence means
that evidence from different sources gathered in different ways all indicates the
same or similar meaning of the construct (Kerlinger & Lee, 2000). Convergent
validity is therefore the degree to which two or more attempts to measure the
same concept are in agreement (Bagozzi & Philips, 1982, in Ariño, 2003).
Examination of this type of validity is important, since the correspondence of
results when a concept is measured in different ways is one of the most
convincing evidences of construct validity (Singleton, Straits & Miller Straits,
1993). Examination of the convergent validity of the Social Participation
Questionnaire will take place by comparing the outcomes of the Questionnaire
with the outcomes of other instruments that are also meant to measure social
participation. As there is no instrument which, like the Social Participation
Questionnaire, focuses on the total concept of social participation, several
instruments that aim at certain aspects of social participation were selected (see
instruments section). The Social Participation Questionnaire consists of four
subscales, representing the four important themes within the concept of social
CHAPTER 6
138
participation mentioned above: friendships/relationships, contacts/interactions,
social self-perception of the pupil and acceptance by classmates. In order to
examine the convergent validity of the Questionnaire, four instruments, each
focusing on one of these themes, were applied. Pupils’ scores on the
Questionnaire and on each of the four subscales were compared with their scores
on these instruments.
6.2.1 Respondents
The study took place in Grades 1 to 3 of regular Dutch primary schools that have
at least one pupil with an official special-needs indication. In order to examine
the Questionnaire’s convergent validity it was expected that each key theme
would have to be assessed by one questionnaire, which would result in four
questionnaires per pupil. The researchers considered filling in more than two
questionnaires too large a burden for pupils. Furthermore, when administering
four questionnaires in each class, the researchers would have to spend a long
time in classes. This would probably disturb the teachers’ schedules too much,
and may deter them from participating. It was therefore decided to divide the
study into two. By splitting the study, pupils had to fill in two questionnaires at
most, and time spent in the classroom was expected to be less than one hour. As
a result, disturbance of the daily routine would be minimized.
In total, 600 schools were invited to participate. The first sub-sample of 300
schools was used to compare the Questionnaire with instruments to measure
both the social self-perception of pupils and their acceptance by peers. The
second sub-sample of 300 schools was applied to compare the outcomes of the
Questionnaire with instruments to assess the friendships of pupils as well as their
contacts and interactions. The invited schools are a randomly drawn sample from
the population of 2074 Dutch regular primary schools within 2.5 hours of
traveling time from the city of Groningen. This area, covering nearly two-third of
the Netherlands, was chosen to make the data collection feasible. According to
files from the Ministry of Education, the schools have at least one pupil in Grades
1 to 3 who receives a pupil-bound budget. Such a budget is allocated to pupils
who, according to independent committees, meet certain Dutch national criteria.
Several categories of disabilities are distinguished, each with their own criteria.
These involve, among other things, categories of the Diagnostic and Statistical

VALIDATION OF THE SOCIAL PARTICIPATION QUESTIONNAIRE
139
Manual of Mental Disorders (DSM IV) and intellectual ability, assessed by
qualified psychiatrists or psychologists who operate independently from the
committees.
First sub-sample. Of the 300 invited schools, 53 were involved in the study. A
non-response survey (Koster, Timmerman, Nakken, Pijl & Van Houten, 2008)
showed that there are no significant differences (at α=5%) between cooperating
and non-cooperating schools concerning their attitudes towards and experiences
with inclusive education. Hence there is no reason to assume any systematic bias
in the sample involved in the study. Since several of the 53 participating schools
had a pupil with special needs in more than one class, and since 15 classes
included two or more pupils with special needs, 75 classes with a total of 96
pupils with special needs were involved in the study. The analyses in this article
aimed at social self-perception and acceptance by classmates are based on the
96 pupils with special needs and 148 pupils without special needs. For these 244
pupils, the teacher filled in the Social Participation Questionnaire. An overview of
the categories of disabilities and their distribution in the first sub-sample is
presented in the second and third columns of Table 1.
Second sub-sample. Of the 300 schools that were invited to participate in the
study, 66 took part. As no evidence of systematic bias was found in the former
sample, we refrained from repeating the non-response survey. In total, 27
schools had a pupil with special needs in more than one class and 34 classes
included two or more pupils with special needs. Consequently, 105 classes with a
total of 141 pupils with special needs participated in the study. The analyses in
this article that aim at friendships as well as contacts/interactions are based on
(a selection of) these 141 pupils with special needs and 205 pupils without
special needs. For these 346 pupils, the teacher filled in the Social Participation
Questionnaire. An overview of the categories of disabilities and its distribution in
the second sub-sample is presented in the fourth and fifth columns of Table 1.
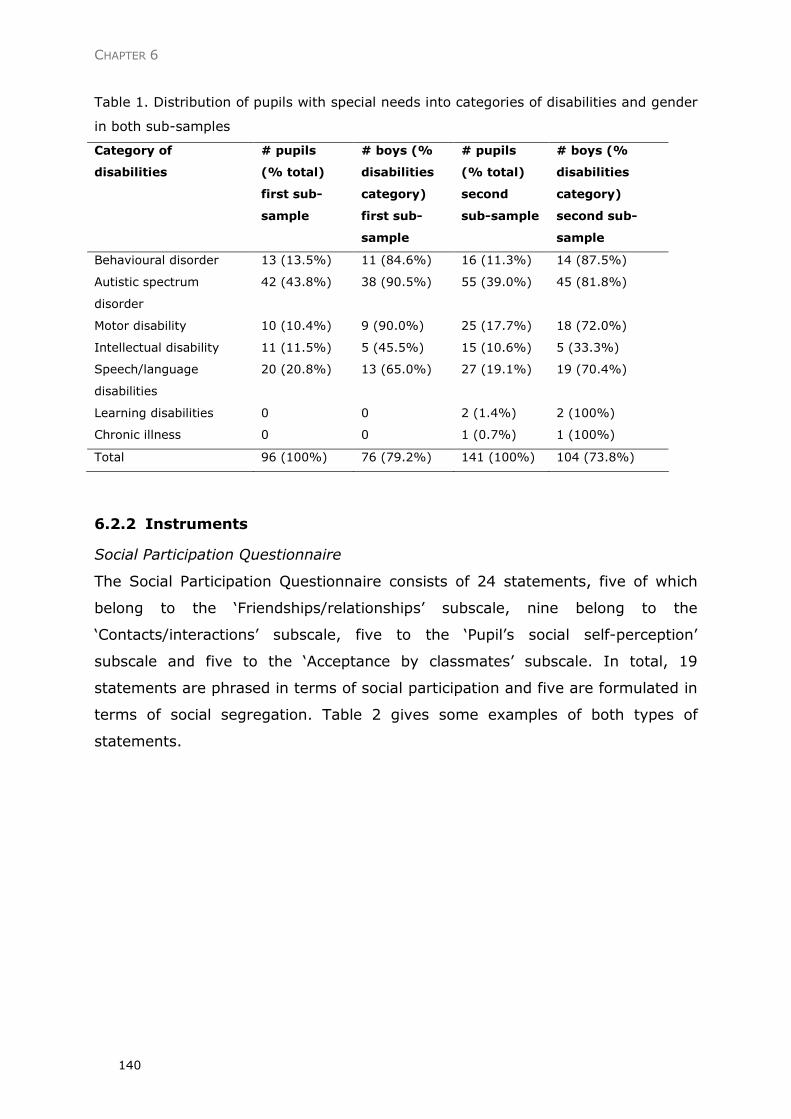
CHAPTER 6
140
Table 1. Distribution of pupils with special needs into categories of disabilities and gender
in both sub-samples
Category of
disabilities
# pupils
(% total)
first sub-
sample
# boys (%
disabilities
category)
first sub-
sample
# pupils
(% total)
second
sub-sample
# boys (%
disabilities
category)
second sub-
sample
Behavioural disorder 13 (13.5%) 11 (84.6%) 16 (11.3%) 14 (87.5%)
Autistic spectrum
disorder
42 (43.8%) 38 (90.5%) 55 (39.0%) 45 (81.8%)
Motor disability 10 (10.4%) 9 (90.0%) 25 (17.7%) 18 (72.0%)
Intellectual disability 11 (11.5%) 5 (45.5%) 15 (10.6%) 5 (33.3%)
Speech/language
disabilities
20 (20.8%) 13 (65.0%) 27 (19.1%) 19 (70.4%)
Learning disabilities 0 0 2 (1.4%) 2 (100%)
Chronic illness 0 0 1 (0.7%) 1 (100%)
Total 96 (100%) 76 (79.2%) 141 (100%) 104 (73.8%)
6.2.2 Instruments
Social Participation Questionnaire
The Social Participation Questionnaire consists of 24 statements, five of which
belong to the ‘Friendships/relationships’ subscale, nine belong to the
‘Contacts/interactions’ subscale, five to the ‘Pupil’s social self-perception’
subscale and five to the ‘Acceptance by classmates’ subscale. In total, 19
statements are phrased in terms of social participation and five are formulated in
terms of social segregation. Table 2 gives some examples of both types of
statements.
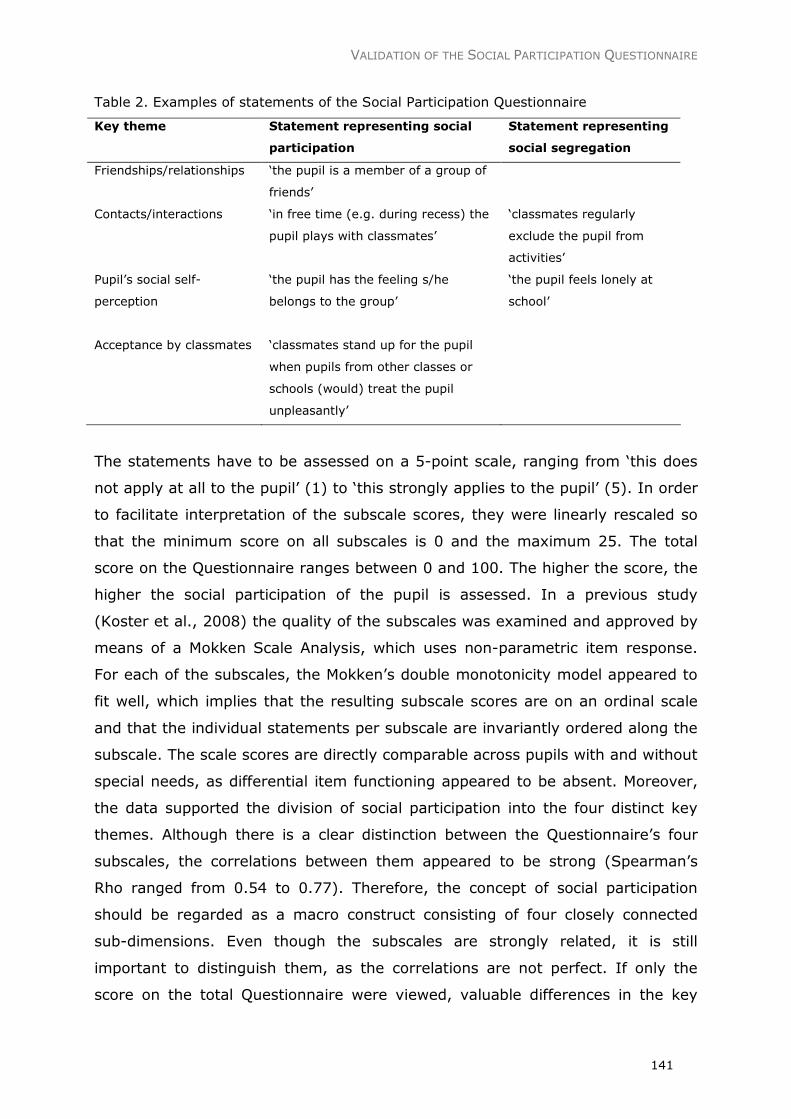
VALIDATION OF THE SOCIAL PARTICIPATION QUESTIONNAIRE
141
Table 2. Examples of statements of the Social Participation Questionnaire
Key theme Statement representing social
participation
Statement representing
social segregation
Friendships/relationships ‘the pupil is a member of a group of
friends’
Contacts/interactions ‘in free time (e.g. during recess) the
pupil plays with classmates’
‘classmates regularly
exclude the pupil from
activities’
Pupil’s social self-
perception
‘the pupil has the feeling s/he
belongs to the group’
‘the pupil feels lonely at
school’
Acceptance by classmates ‘classmates stand up for the pupil
when pupils from other classes or
schools (would) treat the pupil
unpleasantly’
The statements have to be assessed on a 5-point scale, ranging from ‘this does
not apply at all to the pupil’ (1) to ‘this strongly applies to the pupil’ (5). In order
to facilitate interpretation of the subscale scores, they were linearly rescaled so
that the minimum score on all subscales is 0 and the maximum 25. The total
score on the Questionnaire ranges between 0 and 100. The higher the score, the
higher the social participation of the pupil is assessed. In a previous study
(Koster et al., 2008) the quality of the subscales was examined and approved by
means of a Mokken Scale Analysis, which uses non-parametric item response.
For each of the subscales, the Mokken’s double monotonicity model appeared to
fit well, which implies that the resulting subscale scores are on an ordinal scale
and that the individual statements per subscale are invariantly ordered along the
subscale. The scale scores are directly comparable across pupils with and without
special needs, as differential item functioning appeared to be absent. Moreover,
the data supported the division of social participation into the four distinct key
themes. Although there is a clear distinction between the Questionnaire’s four
subscales, the correlations between them appeared to be strong (Spearman’s
Rho ranged from 0.54 to 0.77). Therefore, the concept of social participation
should be regarded as a macro construct consisting of four closely connected
sub-dimensions. Even though the subscales are strongly related, it is still
important to distinguish them, as the correlations are not perfect. If only the
score on the total Questionnaire were viewed, valuable differences in the key
CHAPTER 6
142
themes might remain unnoticed. If the subscale scores are also taken into
consideration, the expected result is a more appropriate and balanced view of
the social participation of pupils.
The reliability of the Questionnaire turned out to be high (Rho is 0.95), and the
four subscales were found to be reliable (Rho varies between 0.80 and 0.95). In
addition, one aspect of discriminant validity of the Questionnaire was
demonstrated. As pupils with special needs are generally known to have lower
levels of social functioning in regular classrooms, they were expected to obtain
on average lower scores on the four subscales and on the total Questionnaire
than pupils without special needs. Because these differences were clearly
present, evidence was obtained for the Questionnaire’s discriminant validity
(Koster et al., 2008).
Instruments to assess key themes
• Assessment of friendships
Many researchers (e.g. Asher & Hymel, 1981, in Asher, Parker & Walker, 1996;
Larrivee & Horne, 1991; Parker & Asher, 1993) regard reciprocal friendship
nomination as the best method to assess friendship. This method, which requires
children to name classmates who fit a particular sociometric criterion (Larrivee &
Horne, 1991), has been used to assess the friendship of children of various ages.
It has been adopted in the literature as the primary method for assessing
friendship (Yugar & Shapiro, 2001), and is likely to be valid for the whole range
of childhood and adolescent years (Bukowski & Hoza, 1989). As the nomination
method is generally regarded as the most suitable to assess friendship, it was
selected for our study.
• Assessment of contacts/interactions
Observation schemes are often used when assessing contacts and interactions
between children (e.g. Blatchford, Bassett & Brown, 2005; Cushing, Horner &
Barrier, 2003; Hall & McGregor, 2000; Murphy, 2004; Odom et al., 1999; Ohna,
2005; Roberts, Pratt & Leach, 1990). For our study, observation schemes
focusing on the nature and number of classroom interactions and which make
use of the time-sampling method were selected.
An exploration of the literature revealed three observation schemes
(Gresham, 1982; Scheepstra et al., 1999; Wood; 1972, in McCauley, Bruininks &
VALIDATION OF THE SOCIAL PARTICIPATION QUESTIONNAIRE
143
Kennedy, 1976) suitable for pupils in Grades 1 to 3, which aim at nature and
number of interactions and which do not take up a lot of time (maximum 30
minutes per pupil). It was chosen to mainly use Gresham’s Observation
Categories (Gresham, 1982), since the applied categories of social interaction are
very clear and the interobserver agreement is high (0.93 to 1.00 in a study of
Montague and Rinaldi, 2001; 0.95 to 1.00 in a study of Lago-Delello, 1998). In
addition, the categories provide an overview of the nature of interactions
(positive and negative), initiated and received interactions, and number of
interactions. Following the observation schemes of Scheepstra et al. (1999) and
Wood (1972, in McCauley et al., 1976), not only interactions between pupils but
also interactions between pupils and teachers are added, since research has
shown that pupils with special needs have many interactions with their teachers
(Scheepstra et al., 1999). Pupils are observed during lessons and free time,
given that when observing social behaviours it is important to collect
observations across a variety of settings and situations (Gresham, 2001;
Hamilton, 2005).
• Assessment of social self-perception
In order to select instruments to measure pupils’ social self-perception, several
instruments were compared for content, psychometric qualities, size, applicability
to pupils in Grades 1-3 and availability of a Dutch version. After a first selection
on the basis of these aspects, three instruments remained: the Self-Perception
Profile for Children (SPP-C, Harter, 1985, in Berndt & Burgy, 1996), the Self-
Description Questionnaire I (SDQI, Marsh, Parker & Smith, 1983, in Berndt &
Burgy, 1996) and the Pictorial Scale of Perceived Competence and Social
Acceptance for Young Children (PSPCSA, Harter & Pike, 1984). A comparison of
the social subscales of these instruments was made. Since the content, size and
reliability of the scales were rather similar (Berndt & Burgy, 1996), the
applicability for first-to-third graders and the availability of Dutch versions were
decisive. It turned out that none of the three instruments aimed at pupils in all
three grades. The SDQI focused on pupils in Grades 2-9, the SPP-C focused on
pupils in Grades 3-8 and the PSPCSA on first- and second-graders. Therefore, it
was necessary to select two instruments for our study. Because of the very
similar content, the same response format and the availability of Dutch versions,
it was decided to use the SPP-C and the PSPCSA. As a result, in Grade 3 the
CHAPTER 6
144
social subscale of the Dutch version of the SPP-C (in Dutch this profile is
abbreviated as CBSK) (Veerman, Straathof, Treffers, Van den Bergh & Ten Brink,
1997) was used. The reliability (Alpha) of the social subscale is 0.74 (Veerman et
al., 1997), which is sufficient when used for research purposes (Nunnally, 1967).
The social subscale of the Dutch version of the PSPCSA (Harter & Pike,
1984; Van Rossum & Vermeer, 1992) was selected for pupils in Grades 1 and 2.
In this scale, verbal items are supplemented by pictures. The reliability of the
social subscale is sufficient (α=0.78) (Van Rossum & Vermeer, 1992).
• Assessment of acceptance by classmates
Peer acceptance is often assessed with sociometric techniques (Berndt & Burgy,
1996). Both procedures of nomination (see Assessment of friendships) and
procedures of peer rating are frequently used. In the procedure of peer ratings,
all classmates rate each of their peers in terms of how much they like them or
would like to play with them on a Likert-type scale. Usually, a 3- or 5-point scale
is used (Hymel, Vaillancourt, McDougal & Renshaw, 2002; Jiang & Cillessen,
2005; Terry & Coie, 1991). There seems to be general agreement that using a
rating scale is the best method to assess acceptance, while the nomination
method is most suitable for the assessment of friendship (Asher & Hymel, 1981,
in Asher et al., 1996; Larrivee & Horne, 1991; Parker & Asher, 1993). According
to Asher et al. (1996), research suggests the utility of distinguishing acceptance,
based on the average ratings children receive from friendship, based on
reciprocal friendship choices. The evidence consistently suggests that acceptance
and friendship are non-overlapping yet not fully independent dimensions of
individual differences (Asher et al., 1996). In accordance with the above-
mentioned results, in our study the peer rating method was selected as
instrument to assess acceptance.
6.2.3 Procedure
Social Participation Questionnaire. The teachers of the 180 classes (75 classes in
the first sub-sample, 105 in the second) filled in the Social Participation
Questionnaire for the pupils with special needs and for two pupils with typical
development. The latter were chosen at random by using the 3rd and 16th pupil
in the class register. If the pupil with special needs was number 3 or 16 on the
VALIDATION OF THE SOCIAL PARTICIPATION QUESTIONNAIRE
145
register, then the following pupil on the list was chosen. Also, if pupils number 3
and 16 were of the same sex, the first following pupil of the opposite sex on the
list was chosen. In classrooms with two or more pupils with special needs, the
teacher completed the Questionnaire for all pupils with special needs and for two
typical pupils.
Assessment of friendships (nomination). All pupils in the 105 classes of the
second sub-sample were asked to fill in a sociometric questionnaire. They were
asked which classmates they considered to be their best friends. Following
Frostad and Pijl (2007), the pupils were allowed to give a maximum of five
nominations.
Assessment of contacts/interactions (observation schedule). For practical
reasons, observations took place only in some of the classes of the second sub-
sample. In 59 classes, observations were carried out during lessons and during
free time. In each class, both the pupil with special needs and a pupil of the
same sex without special needs (for whom the teacher filled in the Social
Participation Questionnaire) were observed for 20 minutes, divided into periods
of five minutes. Fifteen minutes of the observation took place during lessons, the
remaining five minutes took place during free time. Each five-minute period was
divided into 30 ten-second intervals. If a interaction occurred during that period,
a tick was noted in the correct category (positive/neutral/negative initiated
interaction with classmate; positive/neutral/negative received interaction with
classmate; initiated interaction with teacher/received interaction with teacher). If
more than one interaction occurred in a period, only the first one was noted. The
observers were five university students and the first author, who initially
received three hours’ training using videotaped recordings of a classroom
situation. During the training sessions, it turned out that almost all interactions
were coded as neutral: both positive and negative interactions were rarely
coded. Therefore, it was decided to leave the nature of interactions aside. After
training, the agreement between observers was determined by calculating
Cohen’s kappa for three major aspects: ‘interaction/no interaction between pupil
and classmates’, ‘initiated/received interaction of pupil with classmates’ and
‘interaction/no interaction between pupil and teacher’. For these aspects, Cohen’s
kappas were respectively 0.84, 0.76 and 0.72, suggesting reasonable
agreement.
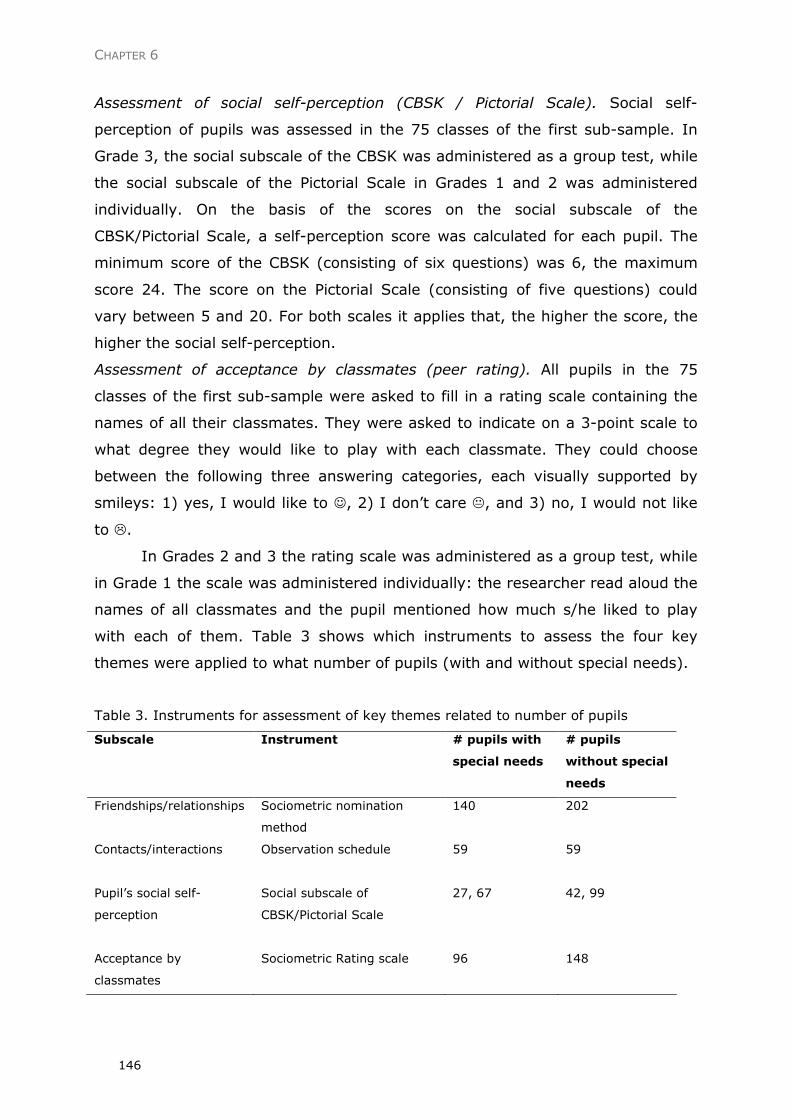
CHAPTER 6
146
Assessment of social self-perception (CBSK / Pictorial Scale). Social self-
perception of pupils was assessed in the 75 classes of the first sub-sample. In
Grade 3, the social subscale of the CBSK was administered as a group test, while
the social subscale of the Pictorial Scale in Grades 1 and 2 was administered
individually. On the basis of the scores on the social subscale of the
CBSK/Pictorial Scale, a self-perception score was calculated for each pupil. The
minimum score of the CBSK (consisting of six questions) was 6, the maximum
score 24. The score on the Pictorial Scale (consisting of five questions) could
vary between 5 and 20. For both scales it applies that, the higher the score, the
higher the social self-perception.
Assessment of acceptance by classmates (peer rating). All pupils in the 75
classes of the first sub-sample were asked to fill in a rating scale containing the
names of all their classmates. They were asked to indicate on a 3-point scale to
what degree they would like to play with each classmate. They could choose
between the following three answering categories, each visually supported by
smileys: 1) yes, I would like to ☺, 2) I don’t care �, and 3) no, I would not like
to �.
In Grades 2 and 3 the rating scale was administered as a group test, while
in Grade 1 the scale was administered individually: the researcher read aloud the
names of all classmates and the pupil mentioned how much s/he liked to play
with each of them. Table 3 shows which instruments to assess the four key
themes were applied to what number of pupils (with and without special needs).
Table 3. Instruments for assessment of key themes related to number of pupils
Subscale Instrument # pupils with
special needs
# pupils
without special
needs
Friendships/relationships Sociometric nomination
method
140 202
Contacts/interactions
Observation schedule 59 59
Pupil’s social self-
perception
Social subscale of
CBSK/Pictorial Scale
27, 67 42, 99
Acceptance by
classmates
Sociometric Rating scale 96 148
VALIDATION OF THE SOCIAL PARTICIPATION QUESTIONNAIRE
147
6.2.4 Analysis
The Questionnaire’s convergent validity was assessed by comparing the scores of
pupils on the four subscales with their scores on the four instruments, which
successively assess friendships, contacts/interactions, social self-perception and
acceptance. Two levels of expectations on convergent validity can be
distinguished. First, specific correlation patterns were expected. It was supposed
that pupils’ scores on the instrument to assess one of the key themes would
correlate the strongest with the subscale representing that key theme. For
instance, pupils’ number of friendships were expected to correlate more strongly
with the ‘Friendships/relationships’ subscale than with the other three subscales.
Secondly, correlation coefficients which meet or exceed .35 were regarded as
another source of evidence of convergent validity (Hammill, Brown & Bryant,
1989, in Trout, Ryan, La Vigne, & Epstein, 2003).
Friendships. The sociometric data resulting from the reciprocal friendship-
nomination method were analysed using the UCINET software (Borgatti, Everett
& Freeman, 1999) to identify friendships. Friendship was defined as a reciprocal
choice, implying that two pupils choose each other as each other’s best friend
(Frostad & Pijl, 2007). The number of friendships was expected to correlate
positively with the score on the ‘Friendships/relationships’ subscale and with the
score on the total Questionnaire. It was decided to use the absolute number of
friendships (instead of standardized Z-scores) in calculating correlations with the
Social Participation Questionnaire, as class size had only minimal influence on a
pupil’s number of friendships.
Interactions. For each pupil the total number of (both initiated and received)
interactions with fellow classmates and the total number of interactions with the
teacher were calculated. The number of interactions with fellow classmates was
expected to show a positive correlation with the ‘Contacts/interactions’ subscale
and with the total Questionnaire. Conversely, a pupil’s number of interactions
with the teacher was expected to correlate negatively with his/her scores on the
‘Contacts/interactions’ subscale and on the total Questionnaire, since having
interactions with the teacher might be at the expense of interactions with
classmates.
Social self-perception. For each pupil a social self-perception score was
calculated on the basis of the outcomes of the CBSK (Grade 3)/Pictorial scale
(Grades 1 and 2). The raw scores of both scales were used for this purpose. For
CHAPTER 6
148
pupils in Grade 3 the score could range between 6 and 24, for pupils in Grades 1
and 2 the score could vary from 5 to 20. The social self-perception score of
pupils was expected to correlate positively with their score on the ‘Pupil’s social
self-perception’ subscale and with their score on the total Questionnaire.
Acceptance. Each pupil received points from all classmates, since all classmates
had indicated on a 3-point scale (see Procedure section) to what degree they
would like to play with the pupil (☺= 1 point, �= 0 points, �= -1 point).
Counting up all points resulted in a raw score for each pupil. As the number of
points a pupil could receive was strongly related to class size, Z-scores were
calculated. This was done by subtracting the mean score of the class from the
pupil’s raw score, then dividing the difference by the standard deviation of the
class. By means of these Z-scores, a correction for class size was made. As a
result, scores of pupils could not only be compared with their classmates’ scores,
but also with scores of pupils from other classes (comprising various numbers of
pupils). The Z-score of acceptance was expected to correlate positively with the
‘Acceptance by classmates’ subscale and with the total Questionnaire.
Finally, confirmatory factor analyses using LISREL software (LISREL 8.80,
Jöreskog & Sörbom, 2007) were conducted in order to further evaluate our
model of social participation. These analyses are a more comprehensive
approach towards assessing the Questionnaire’s convergent validity, as it is a
multi-trait, multi-method assessment. Moreover, these analyses were expected
to provide insight into the degree to which the data fit our model of social
participation (see Introduction section). The Maximum Likelihood (ML) estimation
algorithm was used to verify the conceptual structure of the data.
Four indexes were used to evaluate model fit: the ratio of chi-square to degrees
of freedom is given as a first indication of model fit. This ratio (χ2/df) is, in
comparison with chi-square or the P-statistic, less sensitive to group sizes and
departures from normality (Rozendaal, Minnaert & Boekaerts, 2003). Following
Byrne (1989) and Browne and Cudeck (1993, in Vermunt & Minnaert, 2003), a
χ2/df ratio equaling or below 2 is considered as a good fit. Next to the χ2/df ratio,
the following three indexes were used to evaluate model fit: the root mean
square error of approximation (RMSEA), the goodness of fit index (GFI) and the
incremental fit index (IFI). The latter is based on comparison of the fit of a target
model with that of a null model, and aims at quantifying the proportional
improvement in fit for a target model relative to a null model (Schmukle & Hardt,
VALIDATION OF THE SOCIAL PARTICIPATION QUESTIONNAIRE
149
2005). According to Jaccard and Wan (1996, in Vellutino, Tunmer, Jaccard &
Chen, 2007), statistically non-significant RMSEAs that are no greater than 0.08
suggest acceptable model fit, as do GFIs ≥0.90. Finally, IFIs ≥0.90 indicate an
acceptable fit with the data (Bollen & Curran, 2006).
6.3 Results
6.3.1 Convergent validity of the four subscales
As anticipated, the number of friendships, the number of interactions with
classmates, the self-perception score and the acceptance score correlated
positively with the score on the total Questionnaire and with the score on the
subscales, whereas the number of interactions with the teacher showed a
negative correlation with the scores on the total Questionnaire and the subscales.
As described in the Analysis section, specific correlation patterns were regarded
as evidence for the Questionnaire’s convergent validity. It was supposed that
pupils’ scores on the instrument to assess one of the key themes would correlate
the strongest with the subscale representing that key theme. For the
‘Friendships/relationships’ subscale the expected correlation pattern was
demonstrated, as the number of friendships showed a stronger correlation with
the ‘Friendships/relationships’ subscale than with the other three subscales. For
the ‘Contacts/interactions’ subscale the expected correlation patterns were
mainly demonstrated: the number of both initiated and received interactions with
classmates showed a stronger correlation with the ‘Contacts/interactions’
subscale than with the other subscales. However, the number of interactions with
the teacher showed a slightly stronger correlation with the
‘Friendships/relationships’ subscale than with the ‘Contacts/interactions’
subscale. For the other two subscales, the correlation patterns deviated from the
expectations. The expectation that the self-perception score would show a
stronger correlation with the ‘Pupil’s social self-perception’ subscale than with the
three other subscales could not be confirmed. The expected pattern could not be
demonstrated, neither for pupils in Grade 3 nor for those in Grades 1 and 2. The
same applies for the ‘Acceptance by classmates’ subscale: contrary to the
expectations, the acceptance score showed a stronger correlation with the
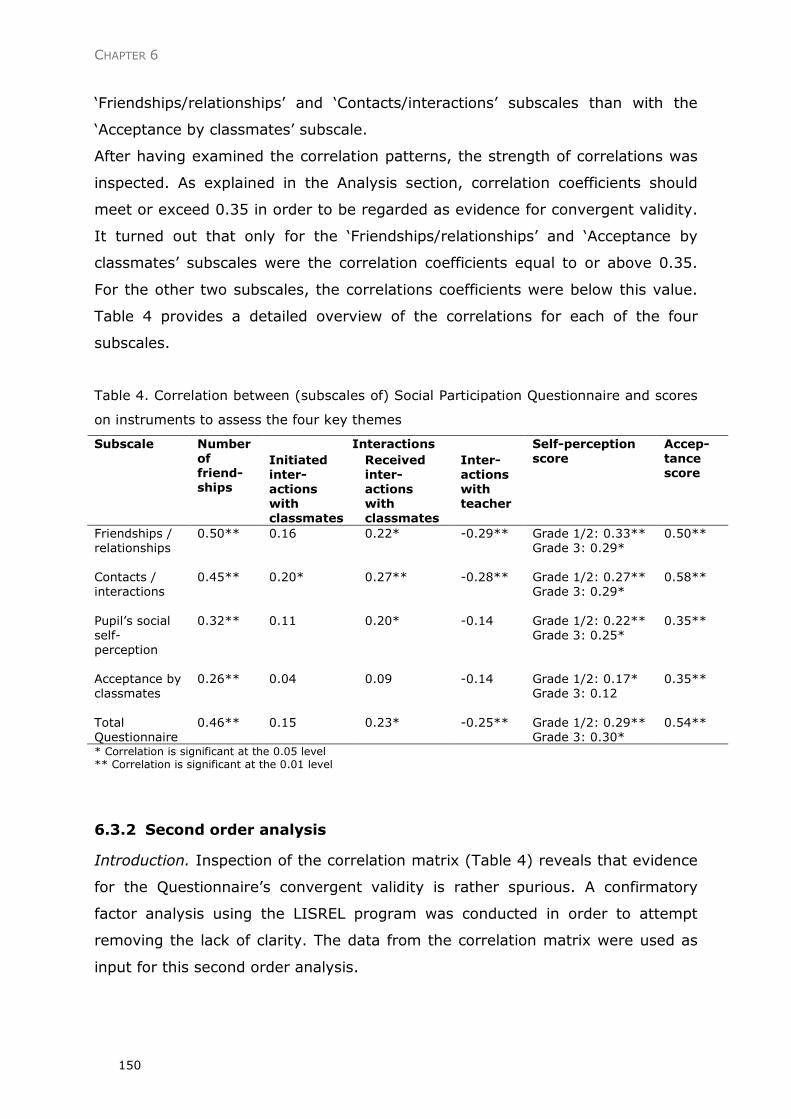
CHAPTER 6
150
‘Friendships/relationships’ and ‘Contacts/interactions’ subscales than with the
‘Acceptance by classmates’ subscale.
After having examined the correlation patterns, the strength of correlations was
inspected. As explained in the Analysis section, correlation coefficients should
meet or exceed 0.35 in order to be regarded as evidence for convergent validity.
It turned out that only for the ‘Friendships/relationships’ and ‘Acceptance by
classmates’ subscales were the correlation coefficients equal to or above 0.35.
For the other two subscales, the correlations coefficients were below this value.
Table 4 provides a detailed overview of the correlations for each of the four
subscales.
Table 4. Correlation between (subscales of) Social Participation Questionnaire and scores
on instruments to assess the four key themes
Interactions Subscale Number of friend-ships
Initiated inter-actions with classmates
Received inter-actions with classmates
Inter-actions with teacher
Self-perception score
Accep- tance score
Friendships / relationships
0.50** 0.16 0.22* -0.29** Grade 1/2: 0.33** Grade 3: 0.29*
0.50**
Contacts / interactions
0.45** 0.20* 0.27** -0.28** Grade 1/2: 0.27** Grade 3: 0.29*
0.58**
Pupil’s social self-perception
0.32** 0.11 0.20* -0.14 Grade 1/2: 0.22** Grade 3: 0.25*
0.35**
Acceptance by classmates
0.26** 0.04 0.09 -0.14 Grade 1/2: 0.17* Grade 3: 0.12
0.35**
Total Questionnaire
0.46** 0.15 0.23* -0.25** Grade 1/2: 0.29** Grade 3: 0.30*
0.54**
* Correlation is significant at the 0.05 level ** Correlation is significant at the 0.01 level
6.3.2 Second order analysis
Introduction. Inspection of the correlation matrix (Table 4) reveals that evidence
for the Questionnaire’s convergent validity is rather spurious. A confirmatory
factor analysis using the LISREL program was conducted in order to attempt
removing the lack of clarity. The data from the correlation matrix were used as
input for this second order analysis.
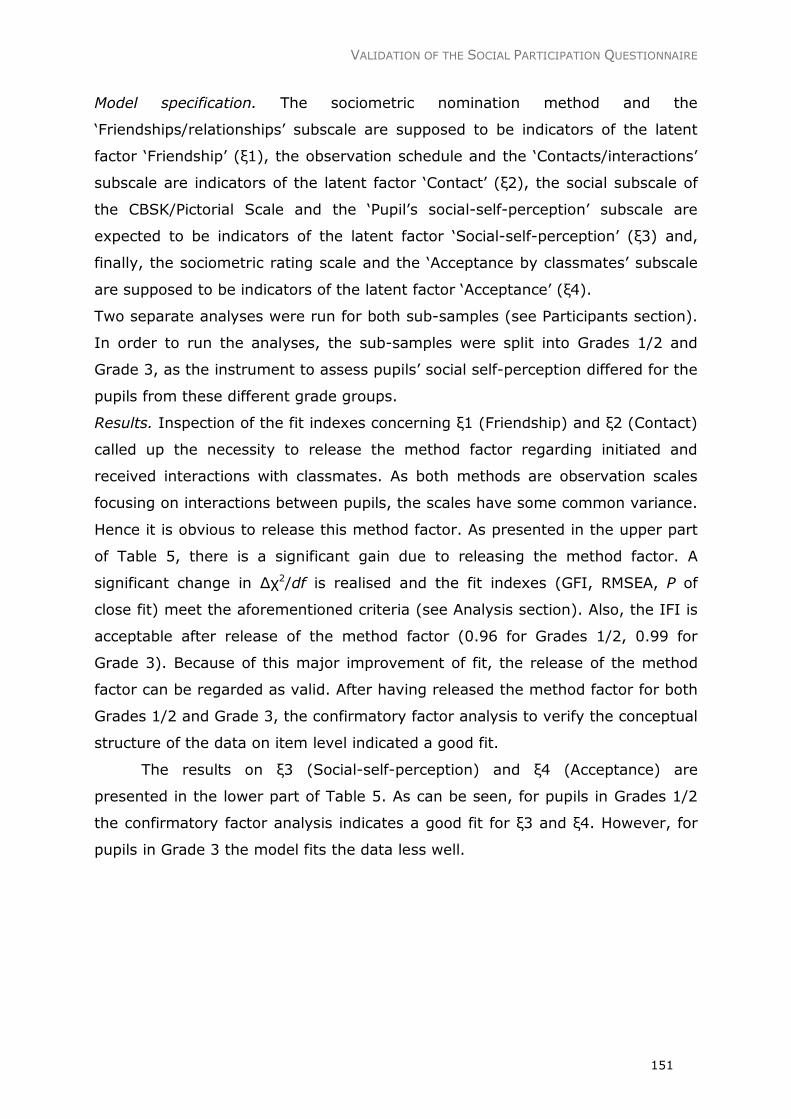
VALIDATION OF THE SOCIAL PARTICIPATION QUESTIONNAIRE
151
Model specification. The sociometric nomination method and the
‘Friendships/relationships’ subscale are supposed to be indicators of the latent
factor ‘Friendship’ (ξ1), the observation schedule and the ‘Contacts/interactions’
subscale are indicators of the latent factor ‘Contact’ (ξ2), the social subscale of
the CBSK/Pictorial Scale and the ‘Pupil’s social-self-perception’ subscale are
expected to be indicators of the latent factor ‘Social-self-perception’ (ξ3) and,
finally, the sociometric rating scale and the ‘Acceptance by classmates’ subscale
are supposed to be indicators of the latent factor ‘Acceptance’ (ξ4).
Two separate analyses were run for both sub-samples (see Participants section).
In order to run the analyses, the sub-samples were split into Grades 1/2 and
Grade 3, as the instrument to assess pupils’ social self-perception differed for the
pupils from these different grade groups.
Results. Inspection of the fit indexes concerning ξ1 (Friendship) and ξ2 (Contact)
called up the necessity to release the method factor regarding initiated and
received interactions with classmates. As both methods are observation scales
focusing on interactions between pupils, the scales have some common variance.
Hence it is obvious to release this method factor. As presented in the upper part
of Table 5, there is a significant gain due to releasing the method factor. A
significant change in ∆χ2/df is realised and the fit indexes (GFI, RMSEA, P of
close fit) meet the aforementioned criteria (see Analysis section). Also, the IFI is
acceptable after release of the method factor (0.96 for Grades 1/2, 0.99 for
Grade 3). Because of this major improvement of fit, the release of the method
factor can be regarded as valid. After having released the method factor for both
Grades 1/2 and Grade 3, the confirmatory factor analysis to verify the conceptual
structure of the data on item level indicated a good fit.
The results on ξ3 (Social-self-perception) and ξ4 (Acceptance) are
presented in the lower part of Table 5. As can be seen, for pupils in Grades 1/2
the confirmatory factor analysis indicates a good fit for ξ3 and ξ4. However, for
pupils in Grade 3 the model fits the data less well.
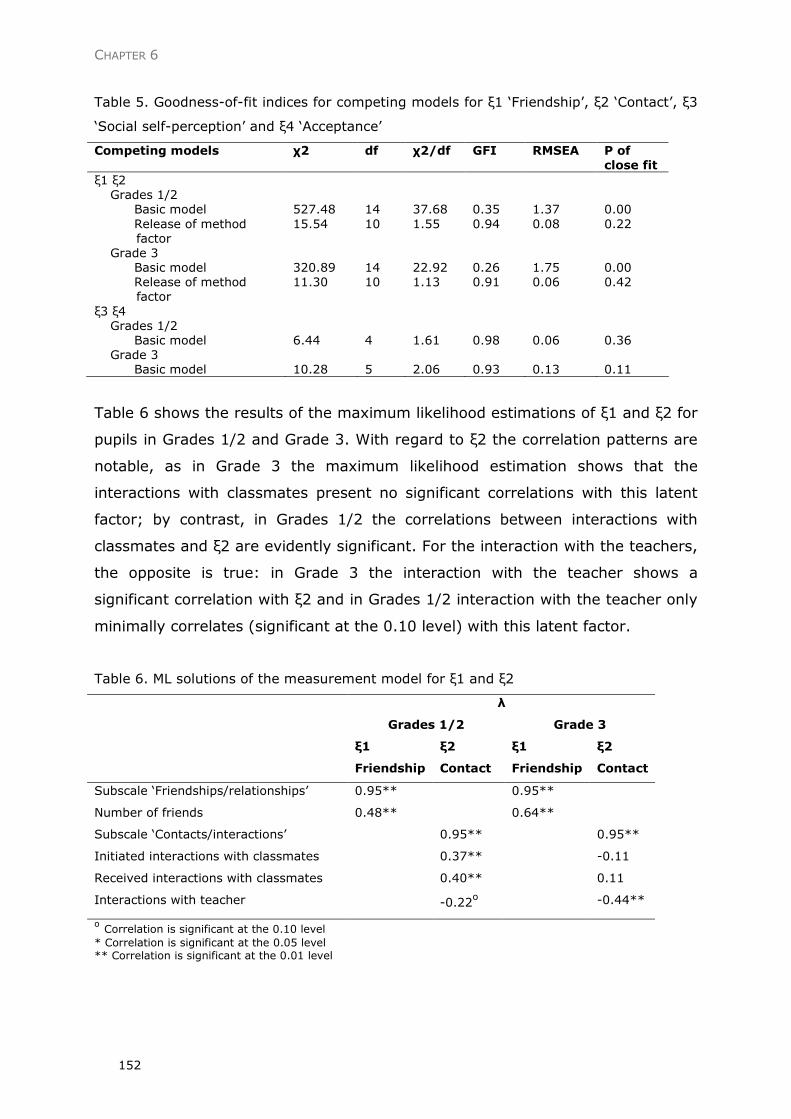
CHAPTER 6
152
Table 5. Goodness-of-fit indices for competing models for ξ1 ‘Friendship’, ξ2 ‘Contact’, ξ3
‘Social self-perception’ and ξ4 ‘Acceptance’
Competing models χ2 df χ2/df GFI RMSEA P of close fit
ξ1 ξ2 Grades 1/2 Basic model
527.48
14
37.68
0.35
1.37
0.00
Release of method factor
15.54 10 1.55 0.94 0.08 0.22
Grade 3 Basic model
320.89
14
22.92
0.26
1.75
0.00
Release of method factor
11.30 10 1.13 0.91 0.06 0.42
ξ3 ξ4 Grades 1/2 Basic model
6.44
4
1.61
0.98
0.06
0.36
Grade 3 Basic model
10.28
5
2.06
0.93
0.13
0.11
Table 6 shows the results of the maximum likelihood estimations of ξ1 and ξ2 for
pupils in Grades 1/2 and Grade 3. With regard to ξ2 the correlation patterns are
notable, as in Grade 3 the maximum likelihood estimation shows that the
interactions with classmates present no significant correlations with this latent
factor; by contrast, in Grades 1/2 the correlations between interactions with
classmates and ξ2 are evidently significant. For the interaction with the teachers,
the opposite is true: in Grade 3 the interaction with the teacher shows a
significant correlation with ξ2 and in Grades 1/2 interaction with the teacher only
minimally correlates (significant at the 0.10 level) with this latent factor.
Table 6. ML solutions of the measurement model for ξ1 and ξ2
λ
Grades 1/2 Grade 3
ξ1
Friendship
ξ2
Contact
ξ1
Friendship
ξ2
Contact
Subscale ‘Friendships/relationships’ 0.95** 0.95**
Number of friends 0.48** 0.64**
Subscale ‘Contacts/interactions’ 0.95** 0.95**
Initiated interactions with classmates 0.37** -0.11
Received interactions with classmates 0.40** 0.11
Interactions with teacher -0.22o -0.44**
o Correlation is significant at the 0.10 level * Correlation is significant at the 0.05 level ** Correlation is significant at the 0.01 level
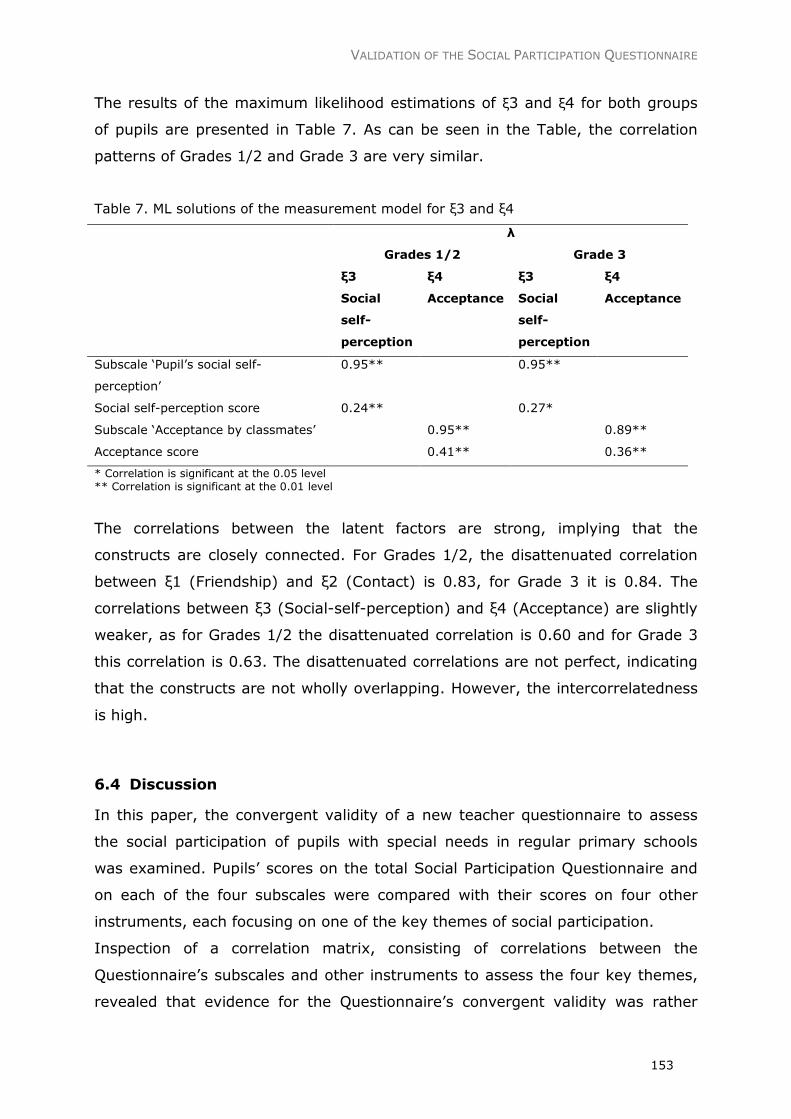
VALIDATION OF THE SOCIAL PARTICIPATION QUESTIONNAIRE
153
The results of the maximum likelihood estimations of ξ3 and ξ4 for both groups
of pupils are presented in Table 7. As can be seen in the Table, the correlation
patterns of Grades 1/2 and Grade 3 are very similar.
Table 7. ML solutions of the measurement model for ξ3 and ξ4
λ
Grades 1/2 Grade 3
ξ3
Social
self-
perception
ξ4
Acceptance
ξ3
Social
self-
perception
ξ4
Acceptance
Subscale ‘Pupil’s social self-
perception’
0.95** 0.95**
Social self-perception score 0.24** 0.27*
Subscale ‘Acceptance by classmates’ 0.95** 0.89**
Acceptance score 0.41** 0.36**
* Correlation is significant at the 0.05 level ** Correlation is significant at the 0.01 level
The correlations between the latent factors are strong, implying that the
constructs are closely connected. For Grades 1/2, the disattenuated correlation
between ξ1 (Friendship) and ξ2 (Contact) is 0.83, for Grade 3 it is 0.84. The
correlations between ξ3 (Social-self-perception) and ξ4 (Acceptance) are slightly
weaker, as for Grades 1/2 the disattenuated correlation is 0.60 and for Grade 3
this correlation is 0.63. The disattenuated correlations are not perfect, indicating
that the constructs are not wholly overlapping. However, the intercorrelatedness
is high.
6.4 Discussion
In this paper, the convergent validity of a new teacher questionnaire to assess
the social participation of pupils with special needs in regular primary schools
was examined. Pupils’ scores on the total Social Participation Questionnaire and
on each of the four subscales were compared with their scores on four other
instruments, each focusing on one of the key themes of social participation.
Inspection of a correlation matrix, consisting of correlations between the
Questionnaire’s subscales and other instruments to assess the four key themes,
revealed that evidence for the Questionnaire’s convergent validity was rather
CHAPTER 6
154
spurious. Only the convergent validity of the ‘Friendships/relationships’ subscale
was satisfactory, as both the strength of the correlation (>0.35) and the
correlation pattern were in accordance with expectations. For the
‘Contacts/interactions’ and ‘Acceptance by classmates’ subscales, the convergent
validity was only proven partly. For the former subscale the expected correlation
patterns were mainly found, but the correlation coefficients were below 0.35,
while for the latter subscale the opposite was the case. For the ‘Pupil’s social self-
perception’ subscale, no evidence for its convergent validity was demonstrated,
as the correlation coefficients were below 0.35 and the expected patterns were
not demonstrated.
The relatively low correlations between the Social Participation Questionnaire and
the instruments to assess the four key themes of social participation are not
surprising, as several categories of respondents were involved. Whereas the
Social Participation Questionnaire was filled in by teachers, pupils and observers
were involved in the assessment of the four key themes. It is known from
various studies that assessments of different informants often provide discrepant
outcomes (Achenbach, 2006; Bartels et al., 2003). For instance, a meta-analysis
by Achenbach, McConaughy and Howell (1987) showed only limited correlation
between maternal and paternal ratings of problem behaviour of the same child.
As in our study teachers, pupils and observers were involved as respondents,
their varying perspectives might have negatively influenced the correlations
between their assessments. Moreover, the various assessment instruments
applied by the different types of respondents might have reduced the
correlations.
Because of the partly low correlations between the different assessment
instruments and the Social Participation Questionnaire, and due to the correlation
patterns which partly deviated from the expectations, the outcomes on the
Questionnaire’s convergent validity were rather inconclusive. However, a second
order analysis, a confirmatory factor analysis using the LISREL program, did
provide evidence for the Questionnaire’s convergent validity. The results from
this second order analysis provide support for the model of social participation,
distinguishing four key themes. The fit indexes for ξ1 (Friendship) and ξ2
(Contact) were satisfactory in all grades. The fit indexes for ξ3 (Social-self
perception) and ξ4 (Acceptance) were acceptable for Grades 1/2, but for Grade 3
VALIDATION OF THE SOCIAL PARTICIPATION QUESTIONNAIRE
155
the model fitted the data less well. The fit indexes suggest that our model is
theoretically viable for Grades 1/2 and only partly viable for Grade 3.
With regard to ξ2 (Contact), an unknown factor seems to play a role. In Grade 3
the maximum likelihood estimation shows that the interactions with classmates
show no significant correlation with the latent factor Contact, whereas in Grades
1/2 the interaction with the teacher shows only a minimal correlation (significant
at the 0.10 level) with this latent factor. One possible explanation for this
correlation pattern might have to do with the fact that in the higher grades the
focus lies increasingly on academic learning and less on play. Pupils with special
needs may be ever more dependent on the teacher, as the gap between them
and their typical classmates becomes larger. As a result, pupils with special
needs in Grade 3 might be more focused on the teacher instead of associating
with classmates. Another possible explanation concerns the different focus of the
‘Contacts/interactions’ subscale versus the observation schedule. Whereas the
subscale encompasses both the quality and the quantity of interactions, the
observation schedule aims solely at quantity of interactions. This difference
might have influenced the correlation between the observations and the latent
factor ‘Contact’.
In further examining the Social Participation Questionnaire, investigating its
utility should be a next step — for instance, examining the meaning of the scores
on the Questionnaire is advisable, as it would be valuable for teachers to know
which scores on the Questionnaire are cause for concern. Future research should
aim at establishing a cut-off point beyond which a score is alarming and
additional measures need to be taken. In addition, further research into the
convergent validity of the subscales ‘Social self-perception of pupil’ and
‘Acceptance by classmates’ for pupils in Grade 3 is recommended.
Taking into consideration the outcomes of this study, it can be concluded that the
Social Participation Questionnaire is partly proven to be a tool of good quality for
teachers. The Questionnaire seems to have the potential to become valuable for
them. Since the Questionnaire consists of concrete statements focusing on daily
practice, this is expected to foster the accuracy of teachers’ judgments. Besides,
by filling in the Questionnaire for a pupil, the teacher is forced to think critically
about the pupil’s situation in the class, which might lead to renewed and refined
insights. As shown in this study and in a former study (Koster et al., 2008), the
Questionnaire as a whole is reliable and valid. In addition, the distinction into
CHAPTER 6
156
four subscales was proven to be correct, indicating that, although overlapping to
a reasonable extent, within social participation four key themes can be
distinguished. Aside from the total score, it seems important to take into
consideration the scores on the four subscales in order to gain further insight into
the different themes of social participation. Such a perspective is expected to
result in a more appropriate and balanced view of the social participation of
pupils, offering starting points for differentiated interventions.
6.5 References
Achenbach, T.M. (2006). As others see us. Clinical and research implications of
cross-informant correlations for psychopathology. Current Directions in
Psychological Science, 15(2), 94-98.
Achenbach, T.M., McConaughy, S.H. & Howell, C.T. (1987). Child/Adolescent
behavioral and emotional problems: implications of cross-informant
correlations for situational specificity. Psychological Bulletin, 101(2), 213-
232.
Ariño, A. (2003). Measures of strategic alliance performance: an analysis of
construct validity. Journal of International Business Studies, 34, 66-79.
Asher, S.R., Parker, J.G. & Walker, D.L. (1996). Distinguishing friendship from
acceptance: implications for intervention and assessment. In W.M.
Bukowski, A.F. Newcomb & W.W. Hartup. (Eds.), The company they keep.
Friendship in childhood and adolescence (pp. 366-405). Cambridge, New
York, Melbourne: Cambridge University Press.
Bagwell, C.L., Newcomb, A.F. & Bukowski, W.M. (1998). Preadolescent friendship
and peer rejection as predictors of adult adjustment. Child Development,
69(1), 140-153.
Bartels, M., Hudziak, J.J., Van den Oord, E.J.C.G., Van Beijsterveldt, C.E.M.,
Rietveld, M.J.H. & Boomsma, D.I. (2003). Co-occurence of aggressive
behavior and rule-breaking behavior at age 12: Multi-rater analyses.
Behavior Genetics, 33(5), 607-621.
Bender, W.N. & Wall, M.E. (1994). Social-emotional development of students
with learning disabilities. Learning Disability Quarterly, 17, 323-341.
VALIDATION OF THE SOCIAL PARTICIPATION QUESTIONNAIRE
157
Berndt, T.J. & Burgy, L. (1996). Social Self-Concept. In B.A. Bracken (Ed.),
Handbook of Self-Concept (pp. 171-209). New York: John Wiley & Sons,
Inc.
Blatchford, P., Bassett, P. & Brown, P. (2005). Teachers’ and pupils’ behavior in
large and small classes: a systematic observation study of pupils aged 10
and 11 years. Journal of Educational Psychology, 97(3), 454-467.
Bollen, K.A. & Curran, P.J. (2006). Latent Curve Models. A structural equation
perspective. New Jersey: John Wiley & Sons, Inc.
Borgatti, S.P., Everett, M.G. & Freeman, L.C. (1999). UCINET for Windows.
Natick: Analytic Technologies.
Bukowski, W.M. & Hoza, B. (1989). Popularity and friendship: issues in theory,
measurement, and outcome. In T.J. Berndt & G.W. Ladd (Eds.), Peer
relationships in child development (pp. 15-45). New York: John Wiley &
Sons.
Byrne, B.M. (1989). Multigroup comparisons and the assumption of equivalent
construct validity across groups: methodological and substantive issues.
Multivariate Behavioral Research, 24(4), 503-523.
Cambra, C. & Silvestre, N. (2003). Students with special educational needs in the
inclusive classroom: social integration and self-concept. European Journal
of Special Needs Education, 18(2), 197-208.
Cushing, L.S., Horner, R.H. & Barrier, H. (2003). Validation and congruent
validity of a direct observation tool to assess student social climate.
Journal of Positive Behavior Interventions, 5(4), 225-237.
De Monchy, M., Pijl, S.J. & Zandberg, T.J. (2004). Discrepancies in judging social
inclusion and bullying of pupils with behaviour problems. European Journal
of Special Needs Education, 19(3), 317-330.
Durrant, J.E., Cunningham, C.E. & Voelker, S. (1990). Academic, social and
general self-concepts of behavioural subgroups of learning disabled
children. Journal of Educational Psychology, 82(4), 657-663.
Frostad, P. & Pijl, S.J. (2007). Does being friendly help in making friends? The
relation between the social position and social skills of pupils with special
needs in mainstream education. European Journal of Special Needs
Education, 22(1), 15-30.
Gresham, F.M. (2001). Social skills instruction for exceptional children. Theory
into Practice, 11(2), 129-133.
CHAPTER 6
158
Gresham, F.M. (1982). Social interactions as predictors of children’s likeability
and friendship patterns: a multiple regression analysis. Journal of
Behavioral Assessment, 4(1), 39-54.
Gresham, F.M. & McMillan, D.L. (1997). Social competence and affective
characteristics of students with mild disabilities. Review of Educational
Research, 67(4), 377-415.
Hall, L.J. & McGregor, J.A. (2000). A follow-up study of the peer relationships of
children with disabilities in an inclusive school. The Journal of Special
Education, 34(3), 114-126.
Hamilton, D. (2005). An ecobehavioural analysis of interactive engagement of
children with developmental disabilities with their peers in inclusive
preschools. International Journal of Disability, Development and
Education, 52(2), 121-137.
Harter, S. & Pike, R. (1984). The Pictorial Scale of Perceived Competence and
Social Acceptance for Young Children. Child Development, 55, 1969-1982.
Heiman, M. & Margalit, M. (1998). Loneliness, depression, and social skills
among students with mild mental retardation in different educational
settings. The Journal of Special Education, 32(3), 154-163.
Hymel, S., Vaillancourt, T., McDougal, P. & Renshaw, P.D. (2002). Peer
acceptance and rejection in childhood. In P.K. Smith & C.H. Hart (Eds.),
Blackwell Handbook of Childhood Social Development (pp. 265-284).
Malden, Oxford, Carlton: Blackwell Publishing.
Jiang, X.L., & Cillessen, A.H.N. (2005). Stability of continuous measures of
sociometric status: a meta-analysis. Developmental Review, 25(1), 1-25.
Jöreskog, K.G. & Sörbom, D. (2007). Lisrel 8.80 for Windows (Computer
software) Lincolnwood, IL: Scientific Software International, Inc.
Kerlinger, F.N. & Lee, H.B. (2000). Foundations of behavioral research (4th ed.).
Orlando: Harcourt College Publishers.
Koster, M., Nakken, H., Pijl, S.J. & Van Houten, E.J. (in press). Being part of the
peer group: a literature study focusing on the social dimension of inclusion
in education. International Journal of Inclusive Education.
Koster, M., Nakken, H., Pijl, S.J, Van Houten, E.J. & Lutje Spelberg, H.C. (in
press). Assessing social participation of pupils with special needs in
inclusive education: the construction of a teacher questionnaire.
Educational Research and Evaluation.
VALIDATION OF THE SOCIAL PARTICIPATION QUESTIONNAIRE
159
Koster, M., Timmerman, M.E., Nakken, H., Pijl, S.J., & Van Houten, E.J. (2008).
Evaluating social participation of pupils with special needs in regular
primary schools: examination of a teacher questionnaire. Manuscript
submitted for publication.
Lackaye, T.D. & Margalit, M. (2006). Comparisons of achievement, effort and
self-perceptions among students with learning disabilities and their peers
from different achievement groups. Journal of Learning Disabilities, 39(5),
432-446.
Ladd, G.W. (1990). Having friends, keeping friends, making friends, and being
liked by peers in the classroom: predictors of children’s early school
adjustment? Child Development, 61, 1081-1100.
Lago-Delello, E. (1998). Classroom dynamics and development of serious
emotional disturbance. Exceptional Children, 64(4), 479-492.
Larrivee, B. & Horne, M.D. (1991). Social status: a comparison of mainstreamed
students with peers of different ability levels, The Journal of Special
Education, 25(1), 90-101.
Luftig, R.L. (1988). Assessment of the perceived school loneliness and isolation
of mentally retarded and nonretarded students. American Journal of
Mental Deficiency, 92(5), 472-475.
Male, D.B. (2007). The friendships and peer relationships of children and young
people who experience difficulties in learning. In L. Florian (Ed.), The
SAGE handbook of Special Education (pp. 460-474). London: SAGE
Publications.
McCauley, R.W., Bruininks, R.H. & Kennedy, P. (1976). Behavioral interactions of
hearing impaired children in regular classrooms. The Journal of Special
Education, 10(3), 277-284.
Montague, M. & Rinaldi, C. (2001). Classroom dynamics and children at risk: a
followup. Learning Disability Quarterly, 24(2), 75-83.
Murphy, B. (2004). Social interaction and language use in Irish infant classrooms
in the context of the revised Irish Primary School Curriculum (1999).
Literacy, 38(3), 149-155.
Nelson, L.J., Rubin, K.H. & Fox, N.A. (2005). Social withdrawal, observed peer
acceptance, and the development of self-perceptions in children ages 4 to
7 years. Early Childhood Research Quarterly, 20, 185-200.
CHAPTER 6
160
Newcomb, A.F. & Bagwell, C.L. (1996). The developmental significance of
children’s friendship relations. In W.M. Bukowski, A.F. Newcomb & W.W.
Hartup (Eds.), The company they keep: friendship in childhood and
adolescence (pp. 289-321). Cambridge: Cambridge University Press.
Nunnally, J.C. (1967). Psychometric Theory. New York: McGraw-Hill Book
Company.
Odom, S.L., McConnell, S.R., McEvoy, M.A., Peterson, C., Ostrosky, M.,
Chandler, L.K., Spicuzza, R.J., Skellenger, A., Creighton, M. & Favazza,
P.C. (1999). Relative effects of interventions supporting the social
competence of young children with disabilities. Topics in Early Childhood
Special Education, 19(2), 75-91.
Ohna, S.E. (2005). Researching classroom processes of inclusion and exclusion.
European Journal of Special Needs Education, 20(2), 167-178.
Parker, J.G. & Asher, S.R. (1993). Friendship and friendship quality in middle
childhood: links with peer group acceptance and feelings of loneliness and
social dissatisfaction. Developmental Psychology, 29(4), 611-621.
Parker, J.G. & Asher, S.R. (1987). Peer relations and later personal adjustment:
are low-accepted children at risk? Psychological Bulletin, 102(3), 357-389.
Pavri, S. & Monda-Amaya, L. (2000). Loneliness and students with learning
disabilities in inclusive classrooms: self-perceptions, coping strategies, and
preferred interventions. Learning Disabilities Research & Practice, 15(1),
22-33.
Pijl, S.J. & Frostad, P. (2008). Self-concept and social position of students with
special needs in regular education. Manuscript in preparation.
Pijl, S.J., Skaalvik. E.M. & Skaalvik, S. (2008). Students with special needs and
the composition of their peer group. Manuscript in preparation.
Powless, D.L. & Elliott, S.N. (1993). Assessment of social skills of native
American preschoolers: teachers’ and parents’ ratings. Journal of Social
Psychology, 31, 293-307.
Roberts, C., Pratt, C. & Leach, D. (1990). Classroom and playground interaction
of students with and without disabilities. Exceptional Children, 57(3), 220-
233.
Rozendaal, J.S., Minnaert, A. & Boekaerts, M. (2003). Motivation and self-
regulated learning in secondary vocational education: information-
VALIDATION OF THE SOCIAL PARTICIPATION QUESTIONNAIRE
161
processing type and gender differences. Learning and Individual
Differences, 13, 273-289.
Scheepstra, A.J.M., Nakken, H. & Pijl, S.J. (1999). Contacts with classmates: the
social position of pupils with Down’s syndrome in Dutch mainstream
education. European Journal of Special Needs Education, 14(3), 212-220.
Schmukle, S.C. & Hardt, J. (2005). A cautionary note on incremental fit indices
reported by LISREL. Methodology, 1(2), 81-85.
Singleton, R.A., Straits, B.C., & Miller Straits, M. (1993). Approaches to social
research (2nd ed.). New York: Oxford University Press.
Terry, R. & Coie, J.D. (1991). A comparison of methods for defining sociometric
status among children. Developmental Psychology, 27(5), 867-880.
Trout, A.L., Ryan, J.B., La Vigne, S.P. & Epstein, M.H. (2003). Behavioral and
emotional rating scale: two studies of convergent validity. Journal of Child
and Family Studies, 12(4), 339-410.
Van Rossum, J.H.A. & Vermeer, A. (1992). Het meten van waargenomen
competentie bij basisschoolkinderen door middel van een platentest.
Bewegen & Hulpverlening, 9(3), 198-212.
Veerman, J.W., Straathof, M.A.E., Treffers, P.D.A., Van den Bergh, B.R.H. & Ten
Brink, L.T. (1997). Handleiding Competentie Belevingsschaal voor
Kinderen. Lisse: Swets & Zeitlinger.
Vellutino, F.R., Tunmer, W.E., Jaccard, J.J. & Chen, R. (2007). Component of
reading ability: multivariate evidence for a convergent skills model of
reading development. Scientific Studies of Reading, 11(1), 3-32.
Vermunt, J. & Minnaert, A. (2003). Dissonance in student learning patterns:
when to revise theory? Studies in Higher Education, 28(1), 49-61.
Whitney, I., Smith, P.K. & Thompson, D. (1994). Bullying and children with
special educational needs. In P.K Smith & S. Sharp (Eds.), School Bullying:
insights and perspectives (pp. 213-240). New York: Routledge.
Williams, G.A. & Asher, S.R. (1992). Assessment of loneliness at school among
children with mild mental retardation. American Journal on Mental
Retardation, 96(4), 373-385.
Yugar, J.M. & Shapiro, E.S. (2001). Elementary children’s school friendships: a
comparison of peer assessment methodologies. School Psychology Review,
30(4), 568-585.

CHAPTER 6
162
Chapter 7 Social participation of pupils with special needs in regular Dutch primary education
CHAPTER 7
SOCIAL PARTICIPATION OF PUPILS WITH SPECIAL NEEDS IN REGULAR DUTCH PRIMARY EDUCATION
CHAPTER 7
164
Abstract
Consistently with the international tendency towards inclusive education,
inclusion of pupils with special needs is increasingly promoted in the Netherlands.
This study addresses the state of affairs with regard to the social participation of
pupils with special needs in regular Dutch primary classrooms. More specifically,
the focus lies on four key themes within social participation: pupils with special
needs’ friendships/relationships, contacts/interactions, social self-perception, and
acceptance by classmates.
The outcomes of the study revealed that on average, pupils with special needs
have a significantly lower number of friends and are less often members of a
cohesive subgroup compared to their typical peers. In addition, pupils with
special needs have less interactions with classmates, have more interactions with
the teacher and are less accepted than pupils without special needs. The social
self-perception of both groups of pupils does not differ. A comparison between
pupils with different categories of disabilities revealed no significant differences.
SOCIAL PARTICIPATION OF PUPILS WITH SPECIAL NEEDS IN REGULAR DUTCH PRIMARY EDUCATION
165
7.1 Introduction
Educating pupils with special needs in inclusive classrooms is an important
objective of many countries. In the Netherlands too, attempts are being made to
include children with special needs in regular schools. In 1990, a new
government policy document, Weer Samen Naar School (WSNS, Together to
School Again), was intended to stimulate inclusion of pupils with special needs in
regular education (Pijl & Van den Bos, 2001). Under this policy, all primary
schools and special schools for children who had been diagnosed as having
learning and educational problems or as having mild intellectual disabilities were
grouped into regional clusters. As a result, regular and special schools in the
clusters started to collaborate (Pijl & Van den Bos, 2001). The WSNS policy aims
at pupils with relatively mild special needs. With the introduction of the Wet op
de Expertise Centra (Centres of Expertise Act) in August 2003, the inclusion of
pupils with more complex special needs was stimulated as since then, parents of
children with special needs have the right to choose between regular and special
education for their child. Pupils with auditory, speech-language, motor,
intellectual or multiple disabilities as well as severe behavioural, emotional
and/or psychiatric problems can attend a regular school. This is funded with a
pupil-bound budget (financial ‘backpack’). Pupils who receive such a budget have
been officially labelled as having special needs on the basis of formal
comprehensive assessment procedures. When such pupils attend a regular
school they receive the budget, which caters for additional educational staff and
teaching aids.
Recent data show that a growing number of parents have opted for regular
education for their child with special needs, as the number of pupils with a pupil-
bound budget attending regular education is increasing rapidly (De Greef & Van
Rijswijk, 2006). The main motive of parents for sending their child with special
needs to a regular school are their child’s increased social opportunities
(Scheepstra, 1998, in Nakken & Pijl, 2002; Sloper & Tyler, 1992; Strayhorn &
Strain, 1986). They hope their child can build positive relationships with typically
developing peers.
However, international studies have repeatedly shown that including pupils with
special needs does not automatically lead to an increase of friendships between
pupils with special needs and their typical counterparts (Buysse, Davis Goldman
CHAPTER 7
166
& Skinner, 2002). A study by Frostad and Pijl (2007) of Norwegian inclusive
classrooms suggests that nearly one quarter of pupils with special needs have
serious difficulties forming relationships in their peer group, while for their typical
peers this is only 8 percent. It is known from several studies that within the
group of pupils with special needs, pupils diagnosed as having autistic spectrum
disorders and pupils diagnosed as having serious behavioural disorders find it
particularly difficult to build relationships with typical peers and are at risk of
becoming isolated in the classroom (Chamberlain, Kasari & Rotheram-Fuller,
2007; De Monchy, Pijl & Zandberg, 2004; Garrison-Harrell, Kamps & Kravits,
1997). Pupils diagnosed as having intellectual disabilities are also at risk of
isolation in the classroom (Nowicki, 2006).
This is worrisome, all the more because being isolated in the class might
negatively influence the functioning of a pupil in different areas. Several studies
have shown that pupils with (mild) disabilities, compared to their typical
counterparts, report a higher degree of social dissatisfaction with their peer
relationships (Taylor, Asher & Williams, 1987, in Gresham & McMillan, 1997) and
show significantly higher loneliness scores (Heiman & Margalit, 1998; Lackaye &
Margalit, 2006; Luftig, 1988; Pavri & Monda-Amaya, 2000; Williams & Asher,
1992). In addition, the self-concept of pupils with special needs is found to be
significantly lower (Bender & Wall, 1994; Cambra & Silvestre, 2003; Pijl, Skaalvik
& Skaalvik, 2008), which might lead to externalising problems (e.g. aggression)
and internalising problems (e.g. anxiety) (Durrant, Cunningham & Voelker,
1990).
Because of the rather harmful long-term effects of negative social experiences at
school (Bagwell, Newcomb & Bukowski, 1998; Nelson, Rubin & Fox, 2005; Parker
& Asher, 1987; Terry & Coie, 1991), it is important to monitor the social
participation of pupils. Social participation has been described as the presence of
positive social contacts/interactions between pupils with special needs and their
classmates; acceptance of them by their classmates; social
relationships/friendships between them and their classmates; and the pupils’
own perception of having a positive relation with peers (Koster, Nakken, Pijl &
Van Houten, in press).
Since it is known from other countries with a long tradition of inclusive education
that pupils with special needs experience difficulties in their social participation, it
is important to examine the state of affairs concerning the social participation of
SOCIAL PARTICIPATION OF PUPILS WITH SPECIAL NEEDS IN REGULAR DUTCH PRIMARY EDUCATION
167
pupils with special needs in the Netherlands. Resulting from the above, the
following research questions are formulated:
1. Does the social participation of pupils with special needs in regular Dutch
primary schools differ from the social participation of pupils without special
needs?
2. Does the social participation of pupils with various categories of disabilities
differ?
In answering the research questions, the focus will lie on the four key themes of
social participation mentioned above: friendships/relationships,
contacts/interactions, the pupil’s social self-perception and acceptance by
classmates.
7.2 Method
7.2.1 Introduction
This study addresses the state of affairs of the social participation of pupils with
special needs in regular Dutch primary schools. The data were gathered by seven
graduate students and the first author. As the method, including participants and
instruments, is already described in detail in previous articles (Koster, Minnaert,
Nakken, Pijl & Van Houten, 2008; Koster, Timmerman, Nakken, Pijl & Van
Houten, 2008), this will only be addressed briefly in the current article. For more
detailed information we refer to these previous articles.
7.2.2 Respondents
The study took place in Grades 1 to 3 of regular Dutch primary schools with at
least one pupil with special needs receiving a pupil-bound budget. Such a budget
is allocated to pupils who, according to independent committees, meet the Dutch
national criteria for a pupil-bound budget. Herewith, several categories of
disabilities are distinguished, each with their own criteria. These involve, among
other things, categories of the Diagnostic and Statistical Manual of Mental
Disorders (DSM IV) and intellectual ability, which are assessed by qualified
psychiatrists or psychologists who operate independently from the committees.
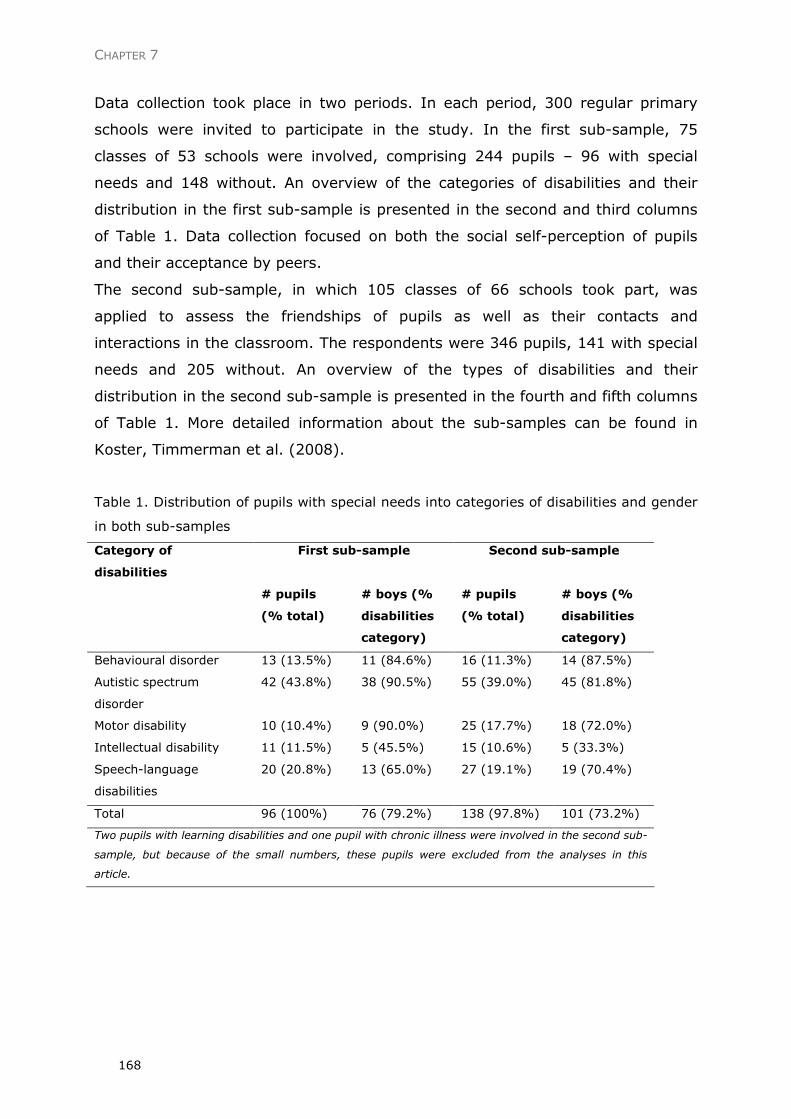
CHAPTER 7
168
Data collection took place in two periods. In each period, 300 regular primary
schools were invited to participate in the study. In the first sub-sample, 75
classes of 53 schools were involved, comprising 244 pupils – 96 with special
needs and 148 without. An overview of the categories of disabilities and their
distribution in the first sub-sample is presented in the second and third columns
of Table 1. Data collection focused on both the social self-perception of pupils
and their acceptance by peers.
The second sub-sample, in which 105 classes of 66 schools took part, was
applied to assess the friendships of pupils as well as their contacts and
interactions in the classroom. The respondents were 346 pupils, 141 with special
needs and 205 without. An overview of the types of disabilities and their
distribution in the second sub-sample is presented in the fourth and fifth columns
of Table 1. More detailed information about the sub-samples can be found in
Koster, Timmerman et al. (2008).
Table 1. Distribution of pupils with special needs into categories of disabilities and gender
in both sub-samples
Category of
disabilities
First sub-sample Second sub-sample
# pupils
(% total)
# boys (%
disabilities
category)
# pupils
(% total)
# boys (%
disabilities
category)
Behavioural disorder 13 (13.5%) 11 (84.6%) 16 (11.3%) 14 (87.5%)
Autistic spectrum
disorder
42 (43.8%) 38 (90.5%) 55 (39.0%) 45 (81.8%)
Motor disability 10 (10.4%) 9 (90.0%) 25 (17.7%) 18 (72.0%)
Intellectual disability 11 (11.5%) 5 (45.5%) 15 (10.6%) 5 (33.3%)
Speech-language
disabilities
20 (20.8%) 13 (65.0%) 27 (19.1%) 19 (70.4%)
Total 96 (100%) 76 (79.2%) 138 (97.8%) 101 (73.2%)
Two pupils with learning disabilities and one pupil with chronic illness were involved in the second sub-
sample, but because of the small numbers, these pupils were excluded from the analyses in this
article.
SOCIAL PARTICIPATION OF PUPILS WITH SPECIAL NEEDS IN REGULAR DUTCH PRIMARY EDUCATION
169
7.2.3 Instruments to assess key themes
The manner in which each key theme is assessed is described briefly below. An
extensive description of the selection procedure for each instrument can be
found in Koster, Minnaert et al. (2008).
Assessment of friendships/relationships. The reciprocal friendship-
nomination method was used to assess friendships. All pupils in the 105 classes
of the second sub-sample were asked which classmates they considered to be
their best friends. Following Pijl, Frostad and Flem (2008), pupils were allowed to
give a maximum of five nominations. Pupils’ number of friendships could be
calculated on the basis of their answers: friends were defined as two pupils
independently selecting each other as best friend. As next to dyadic friendships
several researchers stress the importance of examining membership of peer
networks when studying inclusion (Cullinan, Sabornie & Crossland, 1992; Farmer
& Farmer, 1996; Kindermann, 1993), it was decided to include assessment of
cohesive subgroups in the study. The reciprocal nomination method to identify
dyadic friendships was also used for the identification of cohesive subgroups.
Subgroups of pupils have been identified through statistical analyses (see
Analysis).
Assessment of contacts/interactions. Observations during lessons and free
time took place in order to assess pupils’ contacts and interactions. Mainly based
on Gresham’s observation categories (Gresham, 1982), an observation schedule
was constructed in which initiated and received interactions with both classmates
and the teacher were coded. The observers were five graduate students and the
first author, who initially received three hours’ training using videotaped
recordings of a classroom situation. After training, the agreement between
observers was determined by calculating Cohen’s kappa for three major aspects:
‘interaction/no interaction between pupil and classmates’, ‘initiated/received
interaction of pupil with classmates’ and ‘interaction/no interaction between pupil
and teacher’. For these aspects, Cohen’s kappas were respectively 0.84, 0.76
and 0.72, suggesting reasonable agreement.
For practical reasons, observations took place only in some of the classes
of the second sub-sample. In 58 classes observations were carried out during
lessons and during free time. In each class, both the pupil with special needs and
a randomly selected pupil of the same sex without special needs were observed
for 20 minutes, divided into 5-minute periods. Each period of five minutes was

CHAPTER 7
170
divided into 30 ten-second intervals. If an interaction occurred during that
period, a tick was noted in the correct category (initiated interaction with
classmate; received interaction with classmate; interaction with teacher). When
more than one interaction occurred in a period, only the first one was noted.
Assessment of social self-perception. As there is no Dutch self-perception
scale which is suitable for pupils in Grades 1, 2 and 3 (Koster, Minnaert et al.,
2008), different instruments were applied for different age groups in the first
sub-sample. In Grade 3 the social subscale of the Dutch version of the Self-
Perception Profile for Children (SPP-C, Harter, 1985, in Berndt & Burgy, 1996)
was used. In Dutch this profile is abbreviated as CBSK (Veerman, Straathof,
Treffers, Van den Bergh & Ten Brink, 1997). The social subscale of the Dutch
version of the Pictorial Scale of Perceived Competence and Social Acceptance for
Young Children (PSPCSA, Harter & Pike, 1984; Van Rossum & Vermeer, 1992)
was selected for pupils in Grades 1 and 2. In this scale, verbal items are
supplemented by pictures. The reliability (Alpha) of the social subscale of the
CBSK is 0.74 (Veerman et al., 1997) and that of the Pictorial Scale is 0.78 (Van
Rossum & Vermeer, 1992), which is sufficient for research purposes (Nunnally,
1967).
In Grade 3 the social subscale of the CBSK was administered as a group test,
while the social subscale of the Pictorial Scale in Grades 1 and 2 was
administered individually. On the basis of the scores on the social subscale of the
CBSK/Pictorial Scale, a self-perception score was calculated for each pupil. The
minimum score of the CBSK (consisting of six questions) was 6, the maximum
score 24. The score on the Pictorial Scale (consisting of five questions) could
vary between 5 and 20. For both scales it applies that the higher the score, the
higher the social self-perception.
Assessment of acceptance by classmates. The sociometric peer rating
method was selected as instrument to assess acceptance of pupils in the first
sub-sample. All pupils in the 75 classes were asked to fill in a rating scale
containing the names of all classmates. They were asked to indicate on a 3-point
scale to what degree they would like to play with each classmate. They could
choose between the following three answering categories, each visually
supported by smileys: 1) yes, I would like to ☺, 2) I don’t care �, and 3) no, I
would not like to �. In Grades 2 and 3 the rating scale was administered as a
group test, in Grade 1 it was administered individually: the researcher read out
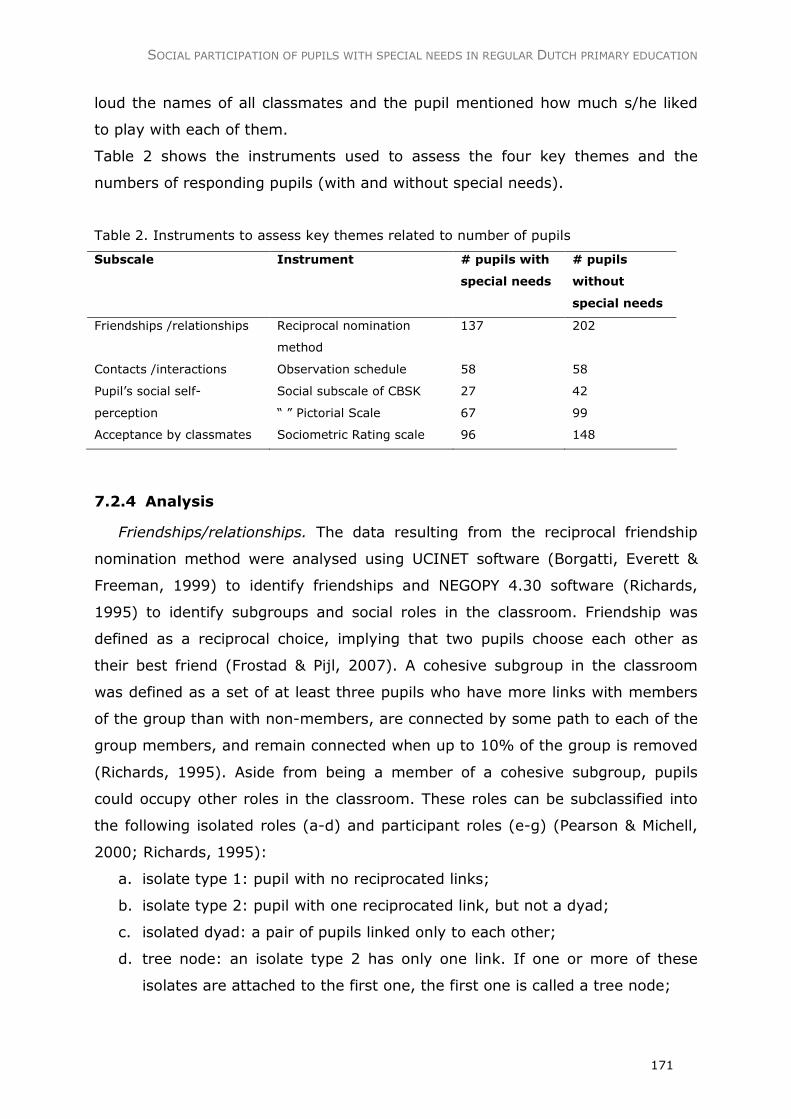
SOCIAL PARTICIPATION OF PUPILS WITH SPECIAL NEEDS IN REGULAR DUTCH PRIMARY EDUCATION
171
loud the names of all classmates and the pupil mentioned how much s/he liked
to play with each of them.
Table 2 shows the instruments used to assess the four key themes and the
numbers of responding pupils (with and without special needs).
Table 2. Instruments to assess key themes related to number of pupils
Subscale Instrument # pupils with
special needs
# pupils
without
special needs
Friendships /relationships Reciprocal nomination
method
137 202
Contacts /interactions Observation schedule 58 58
Pupil’s social self-
perception
Social subscale of CBSK
“ ” Pictorial Scale
27
67
42
99
Acceptance by classmates Sociometric Rating scale 96 148
7.2.4 Analysis
Friendships/relationships. The data resulting from the reciprocal friendship
nomination method were analysed using UCINET software (Borgatti, Everett &
Freeman, 1999) to identify friendships and NEGOPY 4.30 software (Richards,
1995) to identify subgroups and social roles in the classroom. Friendship was
defined as a reciprocal choice, implying that two pupils choose each other as
their best friend (Frostad & Pijl, 2007). A cohesive subgroup in the classroom
was defined as a set of at least three pupils who have more links with members
of the group than with non-members, are connected by some path to each of the
group members, and remain connected when up to 10% of the group is removed
(Richards, 1995). Aside from being a member of a cohesive subgroup, pupils
could occupy other roles in the classroom. These roles can be subclassified into
the following isolated roles (a-d) and participant roles (e-g) (Pearson & Michell,
2000; Richards, 1995):
a. isolate type 1: pupil with no reciprocated links;
b. isolate type 2: pupil with one reciprocated link, but not a dyad;
c. isolated dyad: a pair of pupils linked only to each other;
d. tree node: an isolate type 2 has only one link. If one or more of these
isolates are attached to the first one, the first one is called a tree node;
CHAPTER 7
172
e. liaison 1 (or direct liaison): a pupil who has more than 50% of his linkage
with members of groups in general, but not with members of any single
group. This pupil links groups directly;
f. liaison 2 (or indirect liaison): a pupil who has less than 50% of his linkage
with members of groups. Most links will be with other liaisons. This pupil
connects groups indirectly;
g. group member: a pupil who has more than 50% of his linkage with other
members in the same group. The pupil must have at least two links with
other members.
Roles a to d are called isolated, since pupils who occupy these roles are
minimally connected to others in the group. The other roles (e-g) are categorised
as participant roles, since pupils who occupy these roles have at least two links
with other participants (Richards, 1995).
Contacts/interactions. The total number of (both initiated and received)
interactions with fellow classmates and the total number of interactions with the
teacher were calculated for each pupil.
Social self-perception. For each pupil a social self-perception score was
calculated on the basis of the outcomes of the CBSK (Grade 3) /Pictorial scale
(Grades 1 and 2). The raw scores of both scales were used for this purpose. For
pupils in Grade 3 the score could range between 6 and 24, for pupils in Grades 1
and 2 the score could vary from 5 to 20.
Acceptance by classmates. Each pupil received scores from all classmates
on a 3-point scale (see Instruments). Counting up all scores resulted in a raw
score for each pupil. As the score a pupil could receive was strongly related to
class size, Z-scores were calculated. This was done by subtracting the mean
score of the class from the pupil’s raw score, then dividing the difference by the
standard deviation of the class. As a result, scores of pupils could not only be
compared with their classmates’ scores, but also with scores of pupils from other
classes (comprising various numbers of pupils).
7.3 Results
Friendships/relationships. Based on the friendship nominations and allowing only
reciprocal links, each pupil was categorised as a group member, tree node, dyad,
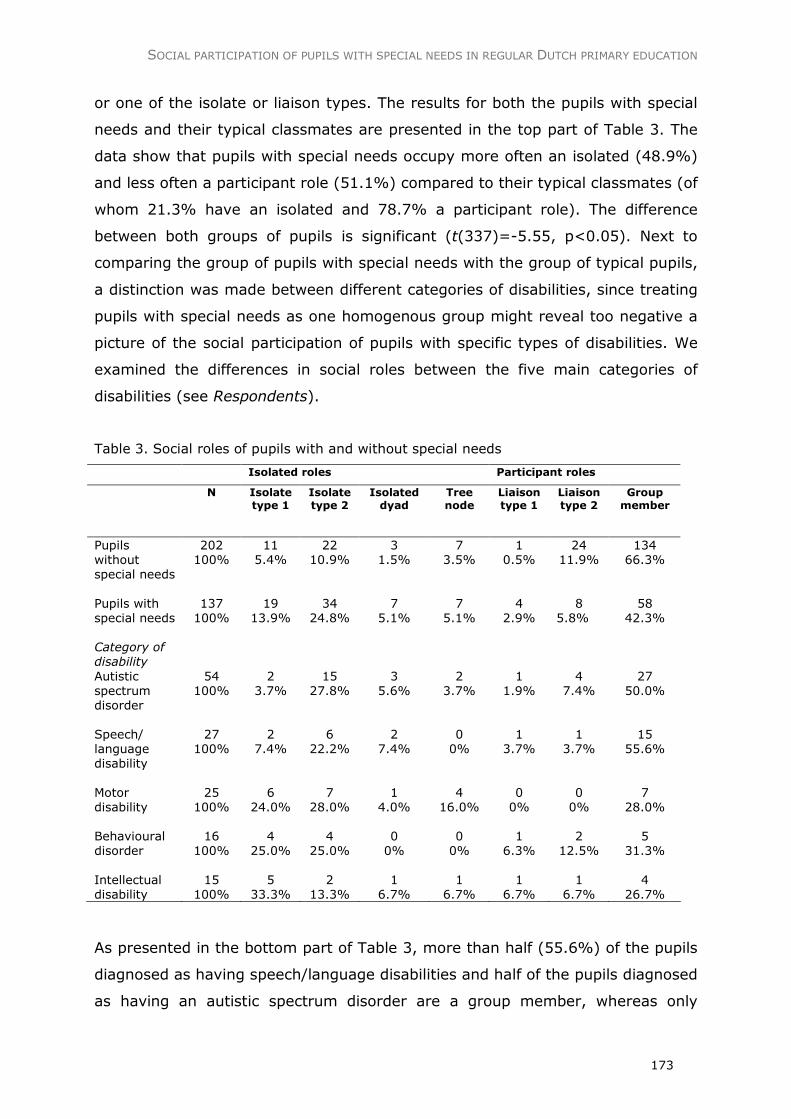
SOCIAL PARTICIPATION OF PUPILS WITH SPECIAL NEEDS IN REGULAR DUTCH PRIMARY EDUCATION
173
or one of the isolate or liaison types. The results for both the pupils with special
needs and their typical classmates are presented in the top part of Table 3. The
data show that pupils with special needs occupy more often an isolated (48.9%)
and less often a participant role (51.1%) compared to their typical classmates (of
whom 21.3% have an isolated and 78.7% a participant role). The difference
between both groups of pupils is significant (t(337)=-5.55, p<0.05). Next to
comparing the group of pupils with special needs with the group of typical pupils,
a distinction was made between different categories of disabilities, since treating
pupils with special needs as one homogenous group might reveal too negative a
picture of the social participation of pupils with specific types of disabilities. We
examined the differences in social roles between the five main categories of
disabilities (see Respondents).
Table 3. Social roles of pupils with and without special needs
Isolated roles Participant roles
N Isolate type 1
Isolate type 2
Isolated dyad
Tree node
Liaison type 1
Liaison type 2
Group member
Pupils without special needs
202 100%
11 5.4%
22 10.9%
3 1.5%
7 3.5%
1 0.5%
24 11.9%
134 66.3%
Pupils with special needs
137 100%
19 13.9%
34 24.8%
7 5.1%
7 5.1%
4 2.9%
8 5.8%
58 42.3%
Category of
disability
Autistic spectrum disorder
54 100%
2 3.7%
15 27.8%
3 5.6%
2 3.7%
1 1.9%
4 7.4%
27 50.0%
Speech/ language disability
27 100%
2 7.4%
6 22.2%
2 7.4%
0 0%
1 3.7%
1 3.7%
15 55.6%
Motor disability
25 100%
6 24.0%
7 28.0%
1 4.0%
4 16.0%
0 0%
0 0%
7 28.0%
Behavioural disorder
16 100%
4 25.0%
4 25.0%
0 0%
0 0%
1 6.3%
2 12.5%
5 31.3%
Intellectual disability
15 100%
5 33.3%
2 13.3%
1 6.7%
1 6.7%
1 6.7%
1 6.7%
4 26.7%
As presented in the bottom part of Table 3, more than half (55.6%) of the pupils
diagnosed as having speech/language disabilities and half of the pupils diagnosed
as having an autistic spectrum disorder are a group member, whereas only
CHAPTER 7
174
26.7% of the pupils with an intellectual disability belong to a group of friends. Of
these latter pupils, one third are totally isolated, which means they have no
friends. About a quarter of the pupils with motor disabilities and the pupils with
behavioural disorders also have no friends at all. ANOVA reveals that the
differences between categories of disabilities are not significant (F(4, 132)=2.37,
p=0.06).
In 34 of the 105 participating classes there were two or more pupils with special
needs in the classroom. Since research has shown that pupils tend to associate
with similar peers (Farmer & Farmer, 1996; McPherson, Smith-Lovin & Cook,
2001), we assumed that pupils with special needs who were in the same
classroom would often be connected to each other (for instance, being a member
of the same cohesive subgroup or being a dyad). However, it turned out that
pupils with special needs were connected to each other in only eight of the 34
classes. More specifically, in six classes the pupils with special needs belonged to
the same cohesive subgroup. In one class, two out of three pupils with special
needs were a dyad and in another class one of the pupils with special needs was
an isolate type 2, who was connected to the other pupil with special needs who
was a group member. There were no connections between the pupils with special
needs in the other 26 groups. The low number of pupils with special needs who
were connected to each other might be related to the fact that in almost two-
thirds (22) of the 34 classes, the categories of disabilities of the pupils differed.
Besides, gender might have played a role. In ten classes, a boy with special
needs and a girl with special needs were involved. None of these pupils were
connected to each other. In elementary education (especially in the higher
grades), boys’ and girls’ networks are often strictly separated, as children prefer
to associate with peers of their own gender (Gest, 2006; Sippola et al., 1997, in
Nowicki, 2006). There appeared to be thus little similarity between many of the
pupils with special needs.
Next to examining the social role of pupils, their number of friendships was
calculated. Analyses revealed that the average number of friends of pupils with
special needs (M=1.9, SD=1.3) is significantly lower compared to that of typical
pupils (M=2.9, SD=1.4, t(340)=6.48, p<0.05) (see second column in Table 4).
This difference represents a moderate effect size, ES=0.71 (Cohen, 1992). In
order to take into account possible differences between categories of disabilities,
a further analysis was done. As presented in the second column of Table 4, the
SOCIAL PARTICIPATION OF PUPILS WITH SPECIAL NEEDS IN REGULAR DUTCH PRIMARY EDUCATION
175
mean number of friends is highest for pupils diagnosed as having speech/
language disabilities (2.2), while this number is lowest for pupils diagnosed as
having an intellectual disability (1.5). However, a one-way analysis of variance
(ANOVA) revealed that the differences between categories of disabilities are not
significant, at F(4, 132)=1.2, p=0.32.
Contacts/interactions. A comparison was made between pupils with and
without special needs with regard to their initiated and received interactions with
classmates and their interactions with the teacher. It turned out that pupils with
special needs initiated fewer interactions with classmates (M=10.7, SD=8.3)
than pupils without special needs (M=14.7, SD=9.6). This difference is
significant at t(114)=2.39, p<0.05, and represents a moderate effect size
(ES=0.44). The number of received interactions also differed significantly. Pupils
with special needs received fewer interactions (M=7.1, SD=5.2) than their
typical classmates (M=11.0, SD=6.4, t(107.7)=3.58, p<0.05), representing a
moderate effect size (ES=0.67). In addition, it turned out that pupils with special
needs (M=8.8, SD=9.7) had significantly more interactions with the teacher than
pupils without special needs (M=3.1, SD=3.7, t(116)=-4.2, p<0.05). The effect
size is large (ES=-0.86).
As presented in the third and fourth columns of Table 4, pupils diagnosed as
having intellectual disabilities had the most interactions with classmates,
whereas pupils diagnosed as having behavioural disorders had the most
interactions with the teacher. The latter received the least interactions from
classmates. Pupils diagnosed as having motor disabilities initiated the least
interactions with classmates and had the least interactions with the teacher.
However, the differences between the various groups of pupils are not
significant: ANOVA revealed no significant group differences between pupils with
different categories of disabilities in terms of initiated interactions with
classmates (F(4, 53)=0.84, p=0.50), received interactions with classmates (F(4,
53)=0.43, p=0.79) and interactions with the teacher (F(4, 53)=1.00, p=0.41).
For an overview of the outcomes on contacts/interactions, see third to fifth
columns of Table 4.
Social self-perception. In all grades, the social self-perception of pupils
with and without special needs turned out to be comparable. In Grade 3, the
mean score of pupils with special needs (M=17.5, SD=4.2) did not differ
significantly from the mean score of their typical counterparts (M=17.3, SD=4.0,
CHAPTER 7
176
t(67)=-0.17, p=0.87; ES=-0.05). In Grades 1/2 the mean score of both groups
of pupils did not differ significantly either (pupils with special needs, M=14.2,
SD=3.2; pupils without special needs, M=14.4, SD=2.3; t(164)=0.66, p=0.51;
ES=0.08).
As can be seen in the sixth column of Table 4, in Grades 1/2 pupils diagnosed as
having an intellectually disability had the highest mean social self-perception
score, whereas pupils diagnosed as having autistic spectrum disorders had the
lowest. In Grade 3, pupils diagnosed as having behavioural disorders had the
highest mean social self-perception score. Contrary to the outcomes of Grades
1/2, in Grade 3 pupils diagnosed as having intellectual disabilities had the lowest
mean score.
ANOVA revealed that the group differences between pupils with various
categories of disabilities are not significant: Grade 1/2: F(4, 62)=1.72, p=0.16;
Grade 3: F(4, 22)=0.85, p=0.51. For an overview of the outcomes on pupils’
social self-perception, see sixth and seventh columns of Table 4.
Acceptance by classmates. A comparison between the acceptance score of
pupils with and without special needs revealed that the former are significantly
less accepted (pupils with special needs, M=-0.71, SD=1.0; pupils without
special needs, M=-0.06, SD=1.0; t(242)=4.9, p<0.05). The effect size is
moderate (ES=0.64).
As shown in the last column of Table 4, pupils diagnosed as having
speech/language disabilities and pupils diagnosed as having motor disabilities are
the most accepted by classmates, whereas pupils diagnosed as having
intellectual disabilities are the least accepted. However, similarly to the
assessment of the other key themes, ANOVA revealed no significant group
differences between pupils with various categories of disabilities: F(4, 91)=2.34,
p=0.06.

SOCIAL PARTICIPATION OF PUPILS WITH SPECIAL NEEDS IN REGULAR DUTCH PRIMARY EDUCATION
177
CHAPTER 7
178
7.4 Discussion
This study addressed the state of affairs concerning the social participation of
pupils with special needs in regular Dutch primary schools. A comparison was
made between the social participation of pupils with special needs and their
classmates without special needs in Grades 1 to 3 and between pupils with
different categories of disabilities. Social participation was subdivided into
friendships/relationships, contacts/interactions, pupil’s social self-perception and
acceptance by classmates.
It turned out that with regard to three key themes of social participation, the
situation of pupils with special needs is less favourable compared to that of their
typical counterparts. Concerning the key theme friendships/relationships, the
outcomes revealed significant differences between these two groups of pupils.
Pupils with special needs had on average fewer friends and belonged to a group
of friends less often. Looking at the key theme contacts/interactions, pupils with
special needs turned out to have fewer interactions with their classmates but
more interactions with the teacher. Pupils with special needs are at a
disadvantage too with regard to the key theme acceptance by classmates, as the
degree to which they were accepted by their classmates turned out to be
significantly lower than the degree of acceptance of typical pupils. The situation
concerning the key theme pupil’s social self-perception is different: the social
self-perception of pupils with special needs did not differ from that of pupils
without special needs. It was expected that pupils with special needs would have
a lower social self-perception than their typical peers, because of their lower
number of friendships, their lower acceptance and their lower number of
interactions with classmates. However, other studies also reveal that pupils with
special needs tend to have a relatively high self-perception (Elias & Van
Nieuwenhuijzen, 2001). According to Elias and Van Nieuwenhuijzen (2001) and
Verhagen and Vermeer (1997), typically developing children do have a realistic
picture of their social competence, while children with special needs might lack
such a realistic picture. Research has revealed that some children, especially
aggressive boys, tend to be positively biased in their self-perceptions (Asher,
Parkhurst, Hymel & Williams, 1990; Boivin & Begin, 1989; in Sletta, Valås &
Skaalvik, 1996). Elias and Van Nieuwenhuijzen (2001) and Gresham and
MacMillan (1997) state that the self-examination of competence of pupils with
SOCIAL PARTICIPATION OF PUPILS WITH SPECIAL NEEDS IN REGULAR DUTCH PRIMARY EDUCATION
179
special needs might be influenced by their need to protect themselves from
negative evaluations. This flattering self-perception might also apply to (some of)
the pupils with special needs in this study. Contrary to expectations, the analyses
revealed no significant differences between pupils with different categories of
disabilities on any of the four distinguished areas of social participation.
The outcomes are fairly worrisome, as pupils with special needs perform
significantly less well than pupils without special needs on three out of four
important areas of social participation. However, the outcomes should be slightly
nuanced. In the first place, taking into consideration the social participation of
pupils with special needs on its own merits without making comparisons with
typical pupils might provide some nuance. For instance, although pupils with
special needs have fewer friends compared to their typical peers, the vast
majority of the pupils with special needs do have one or more friends. This is a
beneficial outcome, since having at least one friend in the classroom may be a
source of companionship and emotional support (Ladd, 1990), and may protect
against the negative effects of low acceptance (Asher et al., 1990; Newcomb &
Bagwell, 1996). Similarly, most pupils with special needs have a positive social
self-perception, are accepted and have a reasonable number of interactions with
peers.
Second, it is unknown how the pupils with special needs involved in the study
would have functioned in special-education settings. The social participation of
pupils with specific categories of disabilities in special schools might have been
disappointing too. For instance, Mand (2007) found that not only in regular
classes but also in special-education settings, a large proportion of pupils with
behavioural disorders have a negative social position in the classroom. These
pupils are to a comparable degree rejected in both educational systems. Hence in
special education too there is a real chance of pupils’ social participation not
working out that favourably.
Third, instead of treating the group of pupils with special needs as one
homogenous group, a distinction between categories of disabilities seems to
provide nuances for pupils with specific disabilities. Beforehand, pupils diagnosed
as having autistic spectrum disorders, serious behavioural disorders and/or
intellectual disabilities were expected to experience the most social participation
problems, as research has revealed that these pupils find it particularly difficult
to build relationships with typical peers and are at risk of becoming isolated in
CHAPTER 7
180
the classroom (Chamberlain et al., 2007; De Monchy et al., 2004; Garrison-
Harrell et al., 1997; Nowicki, 2006). Pupils diagnosed as having motor disabilities
were expected to perform best on each of the four key themes of social
participation, as their type of disability is expected to have the least impact on
social functioning in the classroom. In addition, motor disabilities are visible and
understandable for classmates, which fosters acceptance (Lewis, 1995, in Laws &
Kelly, 2005). Contrary to expectations, there were no significant differences
between pupils with various categories of disabilities. In order to reveal
significant differences, the number of pupils should be larger. Further research,
including larger subgroups of pupils with specific categories of disabilities, is
recommended. A second factor which might have played a role concerns the
severity and complexity of the disabilities involved in the study. This might be an
explanation especially for the relatively high scores of pupils diagnosed as having
autistic spectrum disorders. Most of the pupils with an autistic spectrum disorder
were categorised as having a Pervasive Developmental Disorder - Not otherwise
Specified (PDD-NOS). Relatively few pupils were categorised with other, more
severe types of autistic spectrum disorders.
A final remark concerns the societal meaning of the findings of this study. In
accordance with several other studies, the current study revealed that, compared
to their typical peers, the social participation of pupils with special needs is
assessed as lower. It follows that, although social participation is considered one
of the most important outcomes of inclusion, for a substantial part of the pupils
with special needs optimal social participation is not fully realised in practice.
This is a striking situation: inclusion is promoted because it is assumed to be
positive for pupils with special needs, but on the other hand we know that
inclusion of these pupils might result in negative outcomes (e.g. loneliness,
rejection) for some of them. Ethically, it is inadmissible to just notice that pupils
with special needs have a larger chance of being socially excluded than their
typically developing peers, and do nothing about it. Therefore, schools should
take measures. One possible solution might be to rearrange the composition of
the classroom (Pijl et al., 2008): placing small groups of pupils with special
needs in a regular classroom, rather than single pupils, to ensure social cohesion
among the pupils with special needs. This would respect the tendency of pupils
to associate with similar peers (Farmer & Farmer, 1996; Male, 2007; McPherson
et al., 2001). In that manner, both the stimulating environment of the regular
SOCIAL PARTICIPATION OF PUPILS WITH SPECIAL NEEDS IN REGULAR DUTCH PRIMARY EDUCATION
181
classroom and the presence of peers with comparable special needs are
combined. This might apply particularly to pupils with hearing disabilities, who
because of limited communication possibilities seem to prefer to associate with
other peers with hearing disabilities in integrated settings (Minnett, Clark &
Wilson, 1995). Further research into rearranging the classroom and into other
interventions to improve social participation of pupils with special needs is highly
recommended.
Acknowledgements
Special thanks to Per Frostad (Norwegian University of Science and Technology)
and Erik Logtenberg for their contribution to the study described in this article.
7.5 References
Asher, S.R., Parkhurst, T., Hymel, S. & Williams, G.A. (1990). Peer rejection and
loneliness in childhood. In S.R. Asher. & J.D. Coie, (Eds.), Peer rejection in
childhood (pp.253-273). Cambridge: Cambridge University Press.
Bagwell, C.L., Newcomb, A.F. & Bukowski, W.M. (1998). Preadolescent friendship
and peer rejection as predictors of adult adjustment. Child Development,
69(1), 140-153.
Bender, W.N. & Wall, M.E. (1994). Social-emotional development of students
with learning disabilities. Learning Disability Quarterly, 17, 323-341.
Berndt, T.J. & Burgy, L. (1996). Social Self-Concept. In B.A. Bracken (Ed.),
Handbook of Self-Concept (pp. 171-209). New York: John Wiley & Sons,
Inc.
Borgatti, S.P., Everett, M.G. & Freeman, L.C. (1999). UCINET for Windows.
Natick: Analytic Technologies.
Buysse, V., Davis Goldman, B. & Skinner, M.L. (2002). Setting effects on
friendship formation among young children with and without disabilities.
Exceptional Children, 68(4), 503-517.
Cambra, C. & Silvestre, N. (2003). Students with special educational needs in the
inclusive classroom: social integration and self-concept. European Journal
of Special Needs Education, 18(2), 197-208.
CHAPTER 7
182
Chamberlain, B., Kasari, C. & Rotheram-Fuller, E. (2007). Involvement or
isolation. The social networks of children with autism in regular
classrooms. Journal of Autism and Developmental Disorders, 37, 230-242.
Cohen, J. (1992). A Power Primer. Psychological Bulletin, 112(1), 155-159.
Cullinan, D., Sabornie, E.J. & Crossland, C.L. (1992). Social mainstreaming of
mildly handicapped students, The Elementary School Journal, 92(3), 339-
351.
De Greef, E.E.M. & Van Rijswijk, C.M. (2006). De groei van deelname aan cluster
4. Opvattingen over oorzaken en groeibeperkende maatregelen. Den
Haag: LCTI.
De Monchy, M., Pijl, S.J. & Zandberg, T.J. (2004). Discrepancies in judging social
inclusion and bullying of pupils with behaviour problems. European Journal
of Special Needs Education, 19(3), 317-330.
Durrant, J.E., Cunningham, C.E. & Voelker, S. (1990). Academic, social and
general self-concepts of behavioural subgroups of learning disabled
children. Journal of Educational Psychology, 82(4), 657-663.
Elias, C. & Van Nieuwenhuijzen, M. (2001). Competentiebeleving en sociale
informatieverwerking bij licht verstandelijk gehandicapte kinderen.
Tijdschrift voor Orthopedagogiek, 40, 611-619.
Farmer, T.W. & Farmer, E.M.Z. (1996). Social relationships of students with
exceptionalities in mainstream classrooms: social networks and
homophily. Exceptional Children, 62(5), 431-450.
Frostad, P. & Pijl, S.J. (2007). Does being friendly help in making friends? The
relation between the social position and social skills of pupils with special
needs in mainstream education. European Journal of Special Needs
Education, 22(1), 15-30.
Garrison-Harrell, L., Kamps, D. & Kravits, T. (1997). The effects of peer networks
on social-communicative behaviors of students with autism. Focus on
Autism and other Developmental Disabilities, 12(4), 241-254.
Gest, S.D. (2006). Teacher reports of children’s friendships and social groups:
agreement with peer reports and implications for studying similarity.
Social Development, 15(2), 248-259.
Gresham, F.M. (1982). Social interactions as predictors of children’s likeability
and friendship patterns: a multiple regression analysis. Journal of
Behavioral Assessment, 4(1), 39-54.
SOCIAL PARTICIPATION OF PUPILS WITH SPECIAL NEEDS IN REGULAR DUTCH PRIMARY EDUCATION
183
Gresham, F.M. & McMillan, D.L. (1997). Social competence and affective
characteristics of students with mild disabilities. Review of Educational
Research, 67(4), 377-415.
Harter, S. & Pike, R. (1984). The Pictorial Scale of Perceived Competence and
Social Acceptance for Young Children. Child Development, 55, 1969-1982.
Heiman, M. & Margalit, M. (1998). Loneliness, depression, and social skills
among students with mild mental retardation in different educational
settings. The Journal of Special Education, 32(3), 154-163.
Kindermann, T.A. (1993). Natural Peer Groups as Contexts for Individual
Development: The Case of Children's Motivation in School. Developmental
Psychology, 29(6), 970-977
Koster, M., Minnaert, A.E.M.G., Nakken, H., Pijl, S.J., & Van Houten, E.J. (2008).
Assessing social participation of pupils with special needs in inclusive
education: validation of the Social Participation Questionnaire. Manuscript
submitted for publication.
Koster, M., Nakken, H., Pijl, S.J. & Van Houten, E.J. (in press). Being part of the
peer group: a literature study focussing on the social dimension of
inclusion in education. International Journal of Inclusive Education.
Koster, M., Timmerman, M.E., Nakken, H., Pijl, S.J., & Van Houten, E.J. (2008).
Evaluating social participation of pupils with special needs in regular
primary schools: examination of a teacher questionnaire. Manuscript
submitted for publication.
Lackaye, T.D. & Margalit, M. (2006). Comparisons of achievement, effort and
self-perceptions among students with learning disabilities and their peers
from different achievement groups. Journal of Learning Disabilities, 39(5),
432-446.
Ladd, G.W. (1990). Having friends, keeping friends, making friends, and being
liked by peers in the classroom: predictors of children’s early school
adjustment? Child Development, 61, 1081-1100.
Laws, G. & Kelly, E. (2005). The Attitudes and Friendship Intentions of Children
in United Kingdom Mainstream Schools towards Peers with Physical or
Intellectual Disabilities. International Journal of Disability, Development
and Education, 52(2), 79-99.
CHAPTER 7
184
Luftig, R.L. (1988). Assessment of the perceived school loneliness and isolation
of mentally retarded and nonretarded students. American Journal of
Mental Deficiency, 92(5), 472-475.
Male, D.B. (2007). Friendships and peer relationships. In L. Florian (Ed.), The
SAGE Handbook of Special Education (pp. 460-471). London: Sage.
Mand, J. (2007). Social position of special needs pupils in the classroom – a
comparison between German special schools for pupils with learning
difficulties and integrated primary school classes. European Journal of
Special Needs Education, 22(1), 7-14.
McPherson, M., Smith-Lovin, L., & Cook, J.M. (2001). Birds of a Feather:
homophily in social networks. Annual review of sociology, 27, 415-444.
Minnett, A., Clark, K. & Wilson, G. (1995). Play behaviour and communication
between deaf and heard of hearing children and their hearing peers in an
integrated pre-school. American Annals of the Deaf, 139, 420-429.
Nakken, H. & Pijl S.J. (2002). Getting along with classmates in regular schools: a
review of the effects of integration on the development of social
relationships, International Journal of Inclusive Education, 6(1), 47-61.
Nelson, L.J., Rubin, K.H. & Fox, N.A. (2005). Social withdrawal, observed peer
acceptance, and the development of self-perceptions in children ages 4 to
7 years. Early Childhood Research Quarterly, 20, 185-200.
Newcomb, A.F. & Bagwell, C.L. (1996). The developmental significance of
children’s friendship relations. In W.M. Bukowski, A.F. Newcomb & W.W.
Hartup (Eds.), The company they keep: friendship in childhood and
adolescence (pp. 289-321). Cambridge: Cambridge University Press.
Nowicki, E.A. (2006). A cross-sectional multivariate analysis of children’s
attitudes towards disabilities. Journal of Intellectual Disability Research,
50(5), 335-348.
Nunnally, J.C. (1967). Psychometric Theory. New York: McGraw-Hill Book
Company.
Parker, J.G. & Asher, S.R. (1987). Peer relations and later personal adjustment:
are low-accepted children at risk? Psychological Bulletin, 102(3), 357-389.
Pavri, S. & Monda-Amaya, L. (2000). Loneliness and students with learning
disabilities in inclusive classrooms: self-perceptions, coping strategies, and
preferred interventions. Learning Disabilities Research & Practice, 15(1),
22-33.
SOCIAL PARTICIPATION OF PUPILS WITH SPECIAL NEEDS IN REGULAR DUTCH PRIMARY EDUCATION
185
Pearson, M. & Michell, L. (2000). Smoke Rings: social network analysis of
friendship groups, smoking and drug-taking. Drugs: Education, Prevention
and Policy, 7(1), 21-37.
Pijl, S.J., Frostad, P. & Flem, A. (2008). The social position of pupils with special
needs in regular schools. Scandinavian Journal of Educational Research,
52(4), 387-405.
Pijl, S.J., Skaalvik. E.M. & Skaalvik, S. (2008). Students with special needs and
the composition of their peer group. Manuscript in preparation.
Pijl, S.J. & Van den Bos, K.P. (2001). Redesigning regular education support in
the Netherlands. European Journal of Special Needs Education, 16(2),
111-119.
Richards, W.D. (1995). Negopy 4.30. Manual and User’s Guide. Burnaby: Simon
Fraser University.
Sletta, O., Valås, H., & Skaalvik, E.M. (1996). Peer relations, loneliness, and self-
perceptions in school-aged children. British Journal of Educational
Psychology, 66, 431-445.
Sloper, T. & Tyler, S. (1992). Integration of children with severe learning
difficulties in mainstream schools: evaluation of a pilot study. Educational
and Child Psychology, 9(4), 35-45.
Strayhorn, J.M. & Strain, P.S. (1986). Social and language skills for preventive
mental health: What, how, who and when. In P.S. Strain, M.J. Guralnick &
H. Walker (Eds.), Children’s social behavior: Development, assessment
and modifications (pp. 287-330). New York: Academic Press.
Terry, R. & Coie, J.D. (1991). A comparison of methods for defining sociometric
status among children. Developmental Psychology, 27(5), 867-880.
Van Rossum, J.H.A. & Vermeer, A. (1992). Het meten van waargenomen
competentie bij basisschoolkinderen door middel van een platentest.
Bewegen & Hulpverlening, 9(3), 198-212.
Veerman, J.W., Straathof, M.A.E., Treffers, P.D.A., Van den Bergh, B.R.H. & Ten
Brink, L.T. (1997). Handleiding Competentie Belevingsschaal voor
Kinderen. Lisse: Swets & Zeitlinger.
Williams, G.A. & Asher, S.R. (1992). Assessment of loneliness at school among
children with mild mental retardation. American Journal on Mental
Retardation, 96(4), 373-385.

CHAPTER 7
186
Chapter 8 General discussion
CHAPTER 8
GENERAL DISCUSSION
CHAPTER 8
188
8.1 Introduction
During the last decades, the inclusion of pupils with special needs has been
increasingly promoted. In the Netherlands, the government supported inclusion
by amending legislation and regulations on special needs education. Since the
pupil-bound budget was introduced into the Dutch educational system in August
2003, the number of pupils with special needs in regular education has increased
(De Greef & Van Rijswijk, 2006). Many parents have socially motivated
arguments in choosing regular education for their child. They hope and expect
their child mixing with pupils without special needs will lead to social
participation, thus implying their child will build friendships with typical peers and
becomes a full member of the regular class. Furthermore, some parents assume
that as a result of sending their child with special needs to a regular school, a
change of attitude will arise among other children, possibly leading to positive
long-term effects on attitudes towards disability in wider society. This focus on
the social outcomes of including pupils with special needs fits with the reasoning
behind inclusion. As described by Farrell (2000), inclusion implies that all pupils
take a full and active part in school-life, are valued members of the school
community and are seen as an integral member. Since this social dimension can
be regarded as the core of inclusion, and because it is known from numerous
studies (e.g. Asher & Coie, 1990; Parker & Asher, 1987; Terry & Coie, 1991) that
difficulties in this area (like being rejected or feeling lonely) can have negative
consequences on pupils’ development, it is important to verify if this aspect of
inclusion is achieved in practice.
This study looks at the social dimension of inclusion and consists of three phases.
In the first phase (8.2.1), the initial experiences with the pupil-bound budget in
regular Dutch primary education are central. The second phase (8.2.2) focuses
on helping teachers accurately assess pupils’ social participation. To this end, the
construction of a model of social participation, the development of a teacher
questionnaire to assess the social participation of pupils with special needs and
the subsequent assessment of the psychometric qualities of this questionnaire
were addressed. The third phase (8.2.3) focuses on the consequences of
inclusion on the social development of pupils with special needs by describing
their current situation in this respect in regular Dutch primary schools.
GENERAL DISCUSSION
189
8.2 Main findings
8.2.1 First experiences with the pupil-bound budget
The preparatory study described in Chapter 2, about the first experiences with
the pupil-bound budget in regular Dutch primary education, revealed that the
social position of pupils with special needs did not significantly differ from the
social position of typical classmates. This outcome deviated from other studies
(e.g. De Monchy, Pijl & Zandberg, 2004; Larrivee & Horne, 1991; Sale & Carey,
1995), in which it was revealed that pupils with special needs occupy a lower
social position in class on average than their typically developing peers. Despite
the fact that this outcome seems unexpected at first glance, it might be
explained by two factors. First, the young age of the children (average age 5;7)
could be a factor that played a role. Whereas during preschool, friendships are
largely based on proximity and formed through change encounters, in later age
periods children of like minds increasingly seek each other out and become
friends because of shared interests and similarity (Schaffer, 1996). As the pupils
in our sample were quite young (mainly preschoolers), this explains why the
pupils with special needs were accepted to the same degree as pupils without
special needs. Secondly, the overrepresentation of pupils with Down Syndrome,
who in literature have traditionally been described as cheerful, happy and
sociable (Walz & Benson, 2002), might partly explain why the social position of
the pupils with special needs was comparable to that of typical pupils. Next to
the pro-social behaviours of pupils with Down Syndrome, the visibility of their
disability seems to foster acceptance (Lewis, 1995, in Laws & Kelly, 2005).
Further examination of the outcomes of the preparatory study revealed a
discrepancy between the teachers’ views on the social position of the pupil with
special needs and the classmates’ views (as measured with a sociometric
questionnaire). Teachers’ views turned out to be far more positive, which is in
accordance with the results of comparable studies in which teachers were more
positive about the social position of pupils with special needs compared to the
results of sociometric questionnaires completed by pupils (De Monchy et al.,
2004; Scheepstra, 1998). In addition to this discrepancy between teachers’ and
pupils’ views on the social position of pupils with special needs, another one was
revealed. Whereas the teachers, parents and to a lesser degree the peripatetic
teachers of the pupils with special needs were generally satisfied with the pupils’
CHAPTER 8
190
cognitive, social and social-emotional development, a panel of independent
assessors had some concerns about the development of one third of the pupils
with special needs. Teachers and parents were especially more positive
compared to the panel concerning pupils’ social and social-emotional
development.
In concluding, the preparatory study indicated that, although the social position
of pupils with special needs did not differ from that of their typical counterparts,
it is important to study the social outcomes of inclusion, as teachers seem to
overestimate pupils’ social(-emotional) development.
8.2.2 Construction of a model of social participation and developing a
teacher questionnaire
The discrepancy in views on the social and social-emotional development of
pupils with special needs, as shown in the preparatory study, led to the next
phase of the study. The tendency of teachers to be too optimistic about the
social and social-emotional development of the pupils with special needs is
worrying seeing that they are the obvious adults to monitor pupils’ social and
emotional development in school. It is only when teachers notice a pupil
becoming isolated or teased that appropriate measures can be taken. This
underlines the importance of developing an instrument for teachers which helps
them assess the social participation of pupils with special needs.
Thus, it was decided to construct a model of social participation and then develop
an instrument for teachers aimed at helping them assess the social participation
of pupils with special needs. This comprised the core of the second phase of the
study. Based on an analysis of literature, a model of social participation,
distinguishing four key themes (‘friendships/relationships’,
‘contacts/interactions’, ‘social self-perception of the pupil’ and ‘acceptance by
classmates’), was constructed. This formed the basis for the teacher
questionnaire, named Social Participation Questionnaire. Examination of the
psychometric qualities of the Questionnaire revealed that both the reliability and
the construct validity (enclosing discriminant and convergent validity) were
satisfactory.
GENERAL DISCUSSION
191
8.2.3 Current situation regarding social participation of pupils with
special needs
The outcomes with respect to the social participation of pupils with special needs
in regular Dutch primary education are in line with those of many international
studies, i.e. causes for concern. With regard to three key themes of social
participation, the situation of pupils with special needs turned out to be less
favourable compared to that of their typical counterparts. Concerning
friendships/relationships the outcomes showed significant differences between
these two groups of pupils. Pupils with special needs had less friends, on
average, and were less often a member of a group of friends. Looking at
contacts/interactions, pupils with special needs turned out to have less
interaction with their classmates, whereas they had more with the teacher.
Regarding acceptance by classmates, pupils with special needs were again at a
disadvantage, as the degree to which they were accepted by their classmates
was significantly lower compared to that of typical pupils. The situation deviated,
however, for the key theme pupil’s social self-perception in that pupils with
special needs did not differ from pupils without special needs in this respect.
Both groups of pupils had on average a relatively positive social self-perception.
8.3 Reflections on the study
Some critical considerations need to be taken into account regarding this study.
With regard to the first phase, in which the preparatory study took place, two
points can be mentioned concerning the sample. The sample size was small
(n=20) and pupils with Down Syndrome were overrepresented. However, it was
not possible to involve a larger sample as the study was conducted at the behest
of the Ministry of Education and had to be completed in a short time. The fact
that more than one third of the pupils involved in the study were diagnosed as
having Down Syndrome is related to the fact that at the time the study took
place (the 2003-2004 school year), it was this group of pupils with special needs
in particular who attended regular education. The increase in the number of
pupils with other categories of disabilities attending regular education started
later.
Another critical consideration is related to the second phase of the study and
concerns the assessment of pupils’ friendships/relationships and
CHAPTER 8
192
contacts/interactions. In order to validate the ‘Friendships/relationships’
subscale, pupils’ scores for this were compared with their number of friendships
as derived from the reciprocal nomination method. This implies that the
assessment of friendship was limited to quantitative data, namely their number
of friendships. Also in assessing pupils’ interaction, only quantitative data were
gathered, by counting the number of interactions. It might have been better
when not only these data, but also qualitative data would have been gathered.
These qualitative data could have led to a different weighting of the quantitative
data, which would possibly have had a positive influence on the validation of the
‘Friendships/relationships’ and ‘Contacts/interactions’ subscales, as these include
both the quality and the quantity of friendships and interactions.
Another reason why it could have been better to choose a more qualitative
approach in the assessment of pupils’ friendships, is related to the fact that
several researchers (e.g. Aboud & Mendelson, 1996; Kutnick & Kington 2005;
Newcomb & Bagwell, 1996; Parker & Asher, 1993; Schneider, Wiener & Murphy,
1994) emphasize the importance of taking into consideration the quality of
friendships in stead of merely focusing on quantity, since having one close friend
might be more important for a child than having a larger number of less close
friends. Although this might have been valuable for the study, it would also have
been complex. Among other things, the quality of friendship presumably should
have been assessed in different ways for the different age groups, as the
characteristics of peer relationships vary for different age periods (Schaffer,
1996). In addition, compared to quantitative friendships measures, relating
qualitative friendship measures to pupils’ scores on the Social Participation
Questionnaire would have been far more difficult. This would probably have
negatively influenced the validation process and as our aim was to validate the
Social Participation Questionnaire, the quantitative approach was justifiable.
Regarding the reciprocal nomination method to assess friendships, a second
critical consideration can be made. The answers of pupils to the question who
they consider their best friends in the group, are subject to the issues of the day.
This might especially apply to the youngest children. For instance, it might be
possible a pupil nominated a classmate as friend because (s)he did something
nice that day. At another moment, the pupil might not have chosen this
classmate as a friend. Teachers’ ratings of the Social Participation Questionnaire
statements are less dependent on such issues. The fact that the scores on the
GENERAL DISCUSSION
193
Social Participation Questionnaire, which provide a balanced picture of pupils’
social participation, are compared with data that are dependent on the issues of
the day, causes friction and might have negatively influenced the Questionnaire’s
validation.
Another critical consideration, referring to both the second and the third phase,
is the distribution of categories of disabilities. Although attempts were made to
obtain a proportional distribution of categories of disabilities, some subgroups
were overrepresented. In the studies described in Chapters 5, 6 and 7, pupils
diagnosed as having an autistic spectrum disorder comprised over 40 percent of
the total sample. The overrepresentation of these pupils might have had a
negative influence on the score of the group of pupils with special needs as a
whole, since such pupils in particular, together with pupils diagnosed as having
severe behavioural disorders, have difficulty in building relationships with peers
and are at risk of becoming neglected and rejected (Chamberlain, Kasari &
Rotheram-Fuller, 2007; De Monchy et al., 2004; Garrison-Harrell, Kamps &
Kravits, 1997). However, this negative influence might be enervated a little, as
most of the pupils with an autistic spectrum disorder were categorized as having
a Pervasive Developmental Disorder - Not otherwise Specified (PDD-NOS).
Relatively few pupils were categorized with other, more severe, types of autistic
spectrum disorders. Nonetheless, it would have been better if there had been a
proportional distribution of disabilities. Among other things, this would have
enabled comparisons between pupils with different categories of disabilities and
to discover significant differences between them.
Irrespective of these critical considerations with regard to the development and
examination of the Social Participation Questionnaire, one might conclude that
the Questionnaire is an instrument of good quality, which has the potential to
become a valuable tool for teachers.
Regarding the third phase of the study, in which the current situation concerning
the social participation of pupils with special needs in regular primary schools
was central, several critical considerations can be made. Firstly with regard to
the instruments used to assess pupils’ social participation (described in Chapter
7). This study was largely aimed at developing an instrument to help teachers
assess the social participation of pupils with special needs. In addition, the study
aimed to describe the current state of social participation of pupils with special
needs in regular Dutch primary schools. Whereas in Chapters 4 to 6, the
CHAPTER 8
194
development of the instrument for teachers (the Social Participation
Questionnaire) and the examination of its psychometric qualities were central, in
Chapter 7 the current situation was described. This latter was done without using
the Social Participation Questionnaire. The Questionnaire was only in its
definitive form after the analyses described in Chapter 6 were conducted and a
new round of data collection was not possible. Nonetheless, the data gathered
during the validation process were regarded as a suitable alternative to describe
the current state of pupils’ social participation in regular education, as it provides
interesting and relevant outcomes regarding each of the key themes. It would
have been a lost opportunity if these would only have been used as input to
validate the Questionnaire. In future research, the Social Participation
Questionnaire is intended to be used on a large scale in order to provide an
overview of the social participation of pupils with special needs.
Another consideration with regard to the third phase of the study concerns the
interpretation of the outcomes. Those concerning the state of the social
participation of pupils with special needs give rise for concern as in three out of
four important areas of social participation, pupils with special needs perform
significantly less well than typical pupils. However, the outcomes should be
slightly nuanced.
First, taking into consideration the social participation of pupils with special needs
on its own merits without making comparisons with typical pupils provides some
nuance. For instance, although pupils with special needs have less friends
compared to their typical peers, the vast majority of them (85.7%) have one or
more friends. This is a beneficial outcome, since having at least one friend in the
classroom may be a source of companionship and emotional support (Ladd,
1990) and may protect against the negative effects of low acceptance (Asher,
Parkhurst, Hymel & Williams, 1990; Newcomb & Bagwell, 1996). Similarly, most
pupils with special needs have a positive social self-perception, are accepted and
have a reasonable number of interactions with peers.
Second, distinguishing different categories of disabilities, in stead of considering
the pupils with special needs as one homogeneous group, provides some nuance
for certain subgroups. In our study, the social participation of pupils diagnosed
as having speech/language disabilities was assessed highest, followed by those
diagnosed as having motor disabilities. The social participation of pupils
diagnosed as having autistic spectrum disorders, behavioural disorders and
GENERAL DISCUSSION
195
intellectual disabilities was assessed less positively. In stead of treating pupils
with special needs as one homogenous group, it might be better to distinguish
different categories of disabilities.
Although the worrisome results regarding the social participation of pupils with
special needs in regular education can be slightly ameliorated, they should be
taken seriously. Some people might consider it unfair to compare pupils with
special needs with their typical counterparts, as the former will probably perform
less well in several areas. One could consider laying down specific standards for
pupils with special needs, in stead of comparing them with the norms of typical
pupils. However, this would be an artificial solution, as although teachers might
take account of those norms, pupils and peers will not. Irrespective of having
specific standards for pupils with special needs, the consequences of being lonely
or of being neglected will remain the same. Thereby, although on first thoughts it
might seem unfair to compare pupils with special needs with typical peers, it is
justifiable to make the comparison.
8.4 Implications of the study
8.4.1 Implications for educational policy
Inclusive education mainly arose from an ideological perspective. It was thought
that all pupils with special needs should be educated alongside their typical
peers, which fitted with the wider societal tendency towards inclusion, implying
no one should be excluded. Despite the fact that ideological reasons laid the
foundation for the inclusion of pupils with special needs, it is crucial to evaluate
these pupils’ development in regular education. In Chapters 2 and 7 of this
study, the social participation of pupils with special needs in regular education is
evaluated. The outcomes described in Chapter 7 in particular have important
implications for educational policy, as they again show that the physical presence
of pupils with special needs in regular education does not automatically lead to
optimal social participation. Policymakers should therefore take into
consideration that additional measures need to be taken in order to make
inclusion successful.
Based on the outcomes of the third phase of the study, in stead of concluding
that additional measures need to be taken in regular education, one might
CHAPTER 8
196
conclude that it is better to send pupils with special needs to special schools.
After all, on three out of four important areas of social participation, these pupils
perform significantly less well than their typical counterparts. However, this is a
too simplified conclusion, as it is unknown how the pupils with special need in the
study would have functioned in special education settings. Possibly, the social
participation of pupils with specific categories of disabilities in special schools
might have also fallen short of expectations. For instance, Mand (2007) found
that not only in regular classes, but also in special education settings, a large
proportion of pupils with behavioural disorders have a negative social position in
the classroom. These pupils are unpopular in both education systems to a similar
degree. Related to this, Karsten, Peetsma, Roeleveld and Vergeer (2001) found
little evidence to support the idea that at-risk pupils make less progress, in
academic or psychosocial development, in regular education settings than those
in special schools. The outcomes of the studies of Karsten et al. (2001) and Mand
(2007) indicate that the social participation of pupils with special needs does not
automatically improve when they attend a special school, as in both regular and
special education settings some pupils are seen as outsiders and are at risk of
becoming isolated.
8.4.2 Implications for teacher training
As the number of pupils with special needs attending regular education is
growing, teacher training should increasingly aim at taking this group into
account. It would be advisable to distinguish different categories of disabilities in
teacher training, since this study has shown that the social participation of pupils
with different categories of disabilities differs.
In school curricula, the focus is mainly on achieving academic skills, like reading
and writing and, in keeping with a modern competitive society, the importance
attached to examining these subjects is increasing. As a result, in teacher
training, academic skills have priority, with too little attention seemingly paid to
social aspects of education. It is vital to emphasize these social aspects more, as
a pupil’s wellbeing in the classroom seems to be a prerequisite for acquiring
academic skills. Several studies (e.g. Asher & Coie, 1990; Ollendick, Weist,
Borden & Greene, 1992) have shown that when a child becomes isolated or is
rejected in the classroom, this negatively affects school performance. If teacher
GENERAL DISCUSSION
197
training were to focus more on pupils’ social participation, teachers might be able
to notice problems earlier in this areas and take measures. It is anticipated this
would then positively influence pupils’ performances in several areas.
8.5 Further research
The Social Participation Questionnaire helps teachers assess the social
participation of pupils with special needs. When teachers notice problems in this
area, they need to know which interventions can be arranged. Therefore, it
would be advisable to study possible interventions.
In former years, interventions were usually solely aimed at the pupil with special
needs, of which the often used social skills training is an example. The long-term
effects of this kind of training are often disappointing (Pijl, 2005). One possible
explanation is that classmates’ image of the pupils who participate in the training
does not change and they do not alter their attitude and behaviour. As a result
the trained pupils do not have many possibilities to practice their new skills: they
will not see the benefit of their new skills and after some time the acquired skills
will fade away (Frostad & Pijl, 2007). From an educational (orthopedagogical)
perspective, interventions involving both pupils with special needs as well as
classmates and/or teachers seem more appropriate. In stead of focusing on the
pupil with special needs, the functioning of pupils within their environment and
the characteristics of this environment should be pivotal. Analysing
environmental factors and arranging changes to the environment should be
central to any interventions.
Several factors, which might influence a pupil’s social participation could be
directive for the nature of the interventions. A first factor concerns the
characteristics of pupils, with and without special needs, in inclusive classrooms,
as these characteristics might well influence pupils’ social position in the
classroom. Recent studies suggest that the ‘similarity hypothesis’ (Male, 2007)
might be one of the possible causes of social problems of pupils with special
needs in inclusive classrooms. This hypothesis is based on the idea that children
have the tendency to associate with similar peers. This tendency seems to be a
disadvantage for pupils with special needs in inclusive classrooms, as their
special needs make them different from their typical peers. In view of the
CHAPTER 8
198
effectiveness of interventions, it is important to discover the relation between
pupils’ characteristics and their social participation in the classroom.
Teacher characteristics are a second factor, as teachers’ attitudes towards
inclusive education might influence their acting in the classroom. It is widely
acknowledged that the view of teachers is a key element in successfully
implementing inclusive education (Avramidis & Norwich, 2002; Monsen &
Frederickson, 2004).
Third, the organisation of the class and school are factors which should be taken
into consideration within the scope of interventions. For instance, the attitude of
school staff in schools with much experience in inclusive education might differ
from that of a school staff who lack experience, which might influence a pupil’s
social participation. In addition, preconditions (like teaching aids, support staff)
could be relevant aspects.
A final factor concerns parent characteristics, as the outcome of inclusion seems
to depend to a large extent on the attitudes of parents of children with and
without special needs (Smith Myles & Simpson, 1990).
In concluding, when more research is aimed at studying the factors which
influence the social participation of pupils with special needs, and when these
factors are taken into consideration when drawing up interventions, this is
expected to contribute to optimising the situation of pupils with special needs in
inclusive classrooms.
8.6 References
Aboud, F.E. & Mendelson, M.J. (1996). Determinants of friendship selection and
quality: Developmental perspectives. In W.M.Bukowski, A.F. Newcomb &
W.W. Hartup (Eds.), The company they keep: Friendship in childhood and
adolescence (pp. 87-114). Cambridge: Cambridge University Press.
Asher, S.R. & Coie, J.D. (1990). Peer rejection in childhood. Cambridge:
Cambridge University Press.
Asher, S.R., Parkhurst, T., Hymel, S. & Williams, G.A. (1990). Peer rejection and
loneliness in childhood. In S.R. Asher. & J.D. Coie, (Eds.), Peer rejection
in childhood (pp.253-273). Cambridge: Cambridge University Press.
GENERAL DISCUSSION
199
Avramidis, E. & Norwich, B. (2002). Teachers’ attitudes towards
integration/inclusion: a review of the literature. European Journal of
Special Needs Education, 17(2), 129-147.
Chamberlain, B., Kasari, C. & Rotheram-Fuller, E. (2007). Involvement or
isolation. The social networks of children with autism in regular
classrooms. Journal of Autism and Developmental Disorders, 37, 230-242.
De Greef, E.E.M. & Van Rijswijk, C.M. (2006). De groei van deelname aan cluster
4. Opvattingen over oorzaken en groeibeperkende maatregelen. Den
Haag: LCTI.
De Monchy, M., Pijl, S.J. & Zandberg, T.J. (2004). Discrepancies in judging social
inclusion and bullying of pupils with behaviour problems. European Journal
of Special Needs Education, 19(3), 317-330.
Farrell, P. (2000). The impact of research on developments in inclusive
education. International Journal of Inclusive Education, 4(2), 153-162.
Frostad, P. & Pijl, S.J. (2007). Does being friendly help in making friends? The
relation between the social position and social skills of pupils with special
needs in mainstream education. European Journal of Special Needs
Education, 22(1), 15-30.
Garrison-Harrell, L., Kamps, D. & Kravits, T. (1997). The effects of peer networks
on social-communicative behaviors of students with autism. Focus on
Autism and other Developmental Disabilities, 12(4), 241-254.
Karsten, T., Peetsma, T., Roeleveld, J. & Vergeer, M. (2001). The Dutch policy of
integration put to the test: differences in academic and psychosocial
development of pupils in special and mainstream education. European
Journal of Special Needs Education, 16(3), 193-205.
Kutnick, P. & Kington, A. (2005). Children’s friendships and learning in school:
cognitive enhancement through social interaction? British Journal of
Educational Psychology, 75, 521-538.
Ladd, G.W. (1990). Having friends, keeping friends, making friends, and being
liked by peers in the classroom: predictors of children’s early school
adjustment? Child Development, 61, 1081-1100.
Larrivee, B. & Horne, M.D. (1991). Social status: a comparison of mainstreamed
students with peers of different ability levels. The Journal of Special
Education, 25(1), 90-101.
CHAPTER 8
200
Laws, G. & Kelly, E. (2005). The Attitudes and Friendship Intentions of Children
in United Kingdom Mainstream Schools towards Peers with Physical or
Intellectual Disabilities. International Journal of Disability, Development
and Education, 52(2), 79-99.
Male, D.B. (2007). The friendships and peer relationships of children and young
people who experience difficulties in learning. In L. Florian, (Ed.), The
SAGE handbook of Special Education (460-474). London: SAGE
Publications.
Mand, J. (2007). Social position of special needs pupils in the classroom – a
comparison between German special schools for pupils with learning
difficulties and integrated primary school classes. European Journal of
Special Needs Education, 22(1), 7-14.
Monsen, J.J. & Frederickson, N. (2004). Teachers’ attitudes towards
mainstreaming and their pupils’ perceptions of their classroom learning
environment. Learning Environments Research, 7, 129-142.
Newcomb, A.F. & Bagwell, C.L. (1996). The developmental significance of
children’s friendship relations. In W.M. Bukowski, A.F. Newcomb & W.W.
Hartup (Eds.), The company they keep: friendship in childhood and
adolescence (pp. 289-321). Cambridge: Cambridge University Press.
Ollendick, T.H., Weist, M.D., Borden, M.C. & Greene, R.W. (1992). Social status
and academic, behavioural, and psychological adjustment: a five-year
longitudinal study, Journal of Consulting and Clinical Psychology, 60(1),
80-87.
Parker, J.G. & Asher, S.R. (1993). Friendship and friendship quality in middle
childhood: links with peer group acceptance and feelings of loneliness and
social dissatisfaction. Developmental Psychology, 29(4), 611-621.
Parker, J.G. & Asher, S.R. (1987). Peer relations and later personal adjustment:
are low-accepted children at risk? Psychological Bulletin, 102(3), 357-389.
Pijl, S.J. (2005). Interventies gericht op sociale integratie: de training van sociale
vaardigheden voor leerlingen met beperkingen in het regulier onderwijs.
In B.F. van der Meulen, C. Vlaskamp & K.P. van den Bos (Eds.),
Interventies in de orthopedagogiek: bijdragen aan de wetenschap der
orthopedagogiek (pp. 122-135). Rotterdam: Lemniscaat.
Sale, P. & Carey, D.M. (1995). The sociometric status of students with disabilities
in a full-inclusion school. Exceptional Children, 62(1), 6-19.
GENERAL DISCUSSION
201
Schaffer, H.R. (1996). Social Development. Oxford: Blackwell Publishers.
Scheepstra, A.J.M. (1998). Leerlingen met Downs syndroom in de basisschool.
Groningen: Stichting Kinderstudies.
Schneider, B.H., Wiener, J. & Murphy, K. (1994). Children’s friendships: the giant
step beyond peer acceptance. Journal of Social and Personal Relationships,
11, 323-340.
Smith Myles, B. & Simpson, R.L. (1990). Mainstreaming modification preferences
of parents of elementary-age children with learning disabilities. Journal of
Learning Disabilities, 23(4), 234-239.
Terry, R. & Coie, J.D. (1991). A comparison of methods for defining sociometric
status among children. Developmental Psychology, 27(5), 867-880.
Walz, N.C. & Benson, B.A. (2002). Behavioral Phenotypes in Children with Down
Syndrome, Prader-Willi Syndrome, or Angelman Syndrome. Journal of
Developmental and Physical Disabilities, 14(4), 307-321.

CHAPTER 8
202
Summary
SUMMARY
SUMMARY
204
This thesis is aimed at the social participation of pupils with special needs in
regular primary education, in particular at developing an instrument for teachers
to assess the social participation of these pupils.
Chapter 1 describes the background and rationale of the study. Over the
past century, the Netherlands has built up a comprehensive system of special
education. During the last decades, however, the policy has been to promote the
inclusion of pupils with special needs in regular education. A large step was made
in August 2003 with the so-called Wet op de Expertise Centra (Centres of
Expertise Act), which enables pupils with auditory, speech/language, motor,
intellectual or multiple disabilities as well as severe behavioural, emotional
and/or psychiatric problems to qualify for a pupil-bound budget (the so-called
‘backpack’) and gives parents the opportunity to choose between regular and
special education for their child. An increasing number of parents have decided
to send their child with special needs to a regular school because they envisage
more opportunities for their offspring’s social participation.
Chapter 2 focuses on the first experiences with the pupil-bound budget in
regular primary education. A first impression is given of the cognitive, social and
social-emotional development of twenty, mainly young, pupils (average age 5;7
years), with a pupil-bound budget several months after their placement at a
regular primary school. It looks at the assessments of teachers, parents and
peripatetic teachers regarding the children’s development. Teachers’ satisfaction
about pupils’ cognitive development varied, but in the main they were satisfied
about pupils’ social and social-emotional development. A notable fact in all
assessments is that the parents were somewhat more positive, while the
peripatetic teachers were slightly more cautious when assessing pupils’
development. The outcome of a sociometric questionnaire, completed by all
pupils of groups with one or more pupils with special needs, provides a more
negative picture than that of parents, teachers and peripatetic teachers. This
showed that nine out of twenty pupils with special needs were typified as ignored
or rejected, although this was not mentioned by teachers, parents or peripatetic
teachers. In fact the results also showed that some of the pupils without special
needs were ignored or rejected and the percentage did not differ significantly
from the percentage of pupils with special needs who were.
Since the study was aimed at the initial experiences with pupil-bound
funding, it was impossible to compare the development of pupils with such a
SUMMARY
205
budget with the development of a control group. As an alternative, a panel of
independent assessors, consisting of five experienced peripatetic teachers, were
asked to judge the cognitive, social and social-emotional development of the
twenty pupils with special needs based on anonymous pupil dossiers. The
outcomes show that the panel had concerns about the development of 35 per
cent of the pupils, which deviates from the views of teachers, parents and, to a
lesser degree, the peripatetic teachers. On the other hand, the panel was
positive about an equal percentage of other pupils with special needs.
Chapter 3 concerns a literature review aimed at elucidating the social
dimension of inclusion in education. The review shows that frequently used
concepts like social integration, social inclusion and social participation are
considered synonymous by many researchers. In this study, social participation
was chosen as a central concept. Based on the literature review, it was
concluded that four key themes can be distinguished within the concept of social
participation: friendships/relationships, contacts/interactions, social self-
perception of the pupil and acceptance by classmates. Subsequently, on the
basis of these themes a model of social participation was constructed.
Chapter 4 describes how the model of social participation was used to
develop a teacher questionnaire intended to help teachers accurately assess the
social participation of pupils with special needs. The first experiences with the
quality of the Questionnaire, which comprised four subscales representing the
four key themes of social participation, are also described. The outcomes
concerning the psychometric qualities turned out to be promising, but should be
interpreted with caution because of the small sample. The results of a
confirmatory factor analysis (Multiple Group Method) largely supported the
division of social participation into four key themes. The reliability of the
Questionnaire turned out to be high, whereas the subscales’ reliability varied
from moderate to high. Based on these results, a few adaptations were made. It
was concluded that a large-scale study should be undertaken to examine the
quality of the Questionnaire more in-depth. Chapters 5 to 7 report on this.
Chapter 5 addresses the psychometric qualities of the Social Participation
Questionnaire. By means of a non-parametric item response analysis,
(Mokken Scale Analysis), the quality of the Questionnaire and its subscales were
examined. Based on the analysis results, ten statements were removed from the
Questionnaire, resulting in a definite version consisting of 24 statements. The
SUMMARY
206
outcomes of the analyses showed that the four subscales were intermediate to
strong. Mokken’s double monotonicity model (DMM) turned out to fit well for
each subscale. The subscale scores were on an ordinal scale and the separate
statements were invariantly ordered. Furthermore, the subscale scores are
comparable across pupils with and without special needs. In addition, the
outcomes of the analyses supported the model of social participation, in which
four key themes are distinguished. The Questionnaire as a whole and its
subscales were found to be reliable. Finally, evidence was obtained for the
Questionnaire’s discriminant validity.
Chapter 6 focuses on the convergent validity of the Social Participation
Questionnaire. The correlations between the Questionnaire’s four subscales and
external criteria turned out to be disappointing: some correlations were relatively
weak and some correlation patterns deviated from expectations. Consequently,
there was no conclusive evidence for the Questionnaire’s convergent validity. A
second order analysis, a confirmatory factor analysis using the LISREL program,
did provide evidence for the convergent validity of the Questionnaire. Based on
the outcomes of the Questionnaire’s psychometric qualities, it can be concluded
that the Questionnaire can become a valuable tool for teachers in helping them
notice problems regarding the social participation of pupils with special needs in
time. Further research into the utility of the Questionnaire and into the meaning
of scores is advisable.
Chapter 7 makes use of the research data employed for developing and
assessing the quality of the Social Participation Questionnaire. On the basis of
this research data the current state of affairs regarding the social participation of
pupils with special needs in regular primary education is described. The
outcomes are quite worrisome, as in three out of four important areas of social
participation, pupils with special needs perform less well than their fellow pupils
without special needs. However, the outcomes should be seen in context. The
vast majority of the pupils with special needs involved the study are being
accepted, have one or more friends in the classroom, have a reasonable number
of interactions with classmates and have a positive social self-perception.
In Chapter 8 the main findings of this study are summarized and the
methodological difficulties considered. In the light of this the implications for
educational policy and for educational practice are discussed and suggestions for
future research made.
Samenvatting
SAMENVATTING
SAMENVATTING
208
Dit proefschrift richt zich op de sociale participatie van leerlingen met
beperkingen binnen het regulier basisonderwijs, in het bijzonder op de
ontwikkeling van een instrument waarmee leerkrachten de sociale participatie
van deze leerlingen in kaart kunnen brengen.
Hoofdstuk 1 beschrijft de achtergrond van en aanleiding tot het
onderzoek. Nederland heeft in de afgelopen eeuw een omvangrijk systeem van
speciaal onderwijs opgebouwd. In de laatste decennia is echter beleid in gang
gezet om de inclusie van kinderen met beperkingen in het regulier onderwijs te
bevorderen. Een grote stap werd gezet met de Wet op de Expertise Centra
(WEC). Sinds de introductie van deze wet op 1 augustus 2003 komen kinderen
met auditieve, communicatieve, motorische, verstandelijke of meervoudige
beperkingen, als ook ernstige gedrags- emotionele en/of psychiatrische
problemen in aanmerking voor leerlinggebonden financiering (LGF), het
zogenaamde Rugzakje. Toekenning van een leerlinggebonden budget geeft
ouders de mogelijkheid zelf te kiezen voor deelname van hun kind aan regulier of
speciaal onderwijs. Een toenemend aantal ouders kiest voor plaatsing op een
reguliere school, waarbij met name de vergrote mogelijkheden voor sociale
participatie van hun kind de reden vormen voor deze keuze.
Hoofdstuk 2 is gericht op de eerste ervaringen met leerlinggebonden
financiering in het regulier basisonderwijs. Er wordt een indruk gegeven van de
cognitieve, sociale en sociaal-emotionele ontwikkeling van twintig overwegend
jonge leerlingen (gemiddelde leeftijd is 5;7 jaar) met een Rugzakje een aantal
maanden na de plaatsing op een reguliere basisschool. Het gaat daarbij om de
oordelen die leerkrachten, ouders en ambulant begeleiders hebben over de
ontwikkeling van de leerlingen. De tevredenheid van de leerkrachten over de
cognitieve ontwikkeling van de leerlingen is wisselend. Over de sociale en
sociaal-emotionele ontwikkeling van de leerlingen zijn de leerkrachten over het
geheel genomen tevreden. Opvallend in al deze beoordelingen is dat de ouders
vaak nog wat positiever oordelen dan de leerkrachten, terwijl de ambulant
begeleiders wat meer reserves laten blijken. De uitkomsten van een
sociometrische vragenlijst, ingevuld door alle leerlingen van groepen met één of
meer leerlingen met een beperking, leveren een negatiever beeld op dan dat van
ouders, leerkrachten en ambulant begeleiders. Uit de uitkomsten van deze lijst
blijkt dat negen van de twintig leerlingen met beperkingen als genegeerd of
verworpen worden getypeerd. Deze typeringen worden door geen van de
SAMENVATTING
209
leerkrachten, ouders of ambulant begeleiders genoemd. Overigens blijkt ook een
deel van de leerlingen zonder beperkingen te worden genegeerd of verworpen
volgens de uitkomsten van de sociometrische vragenlijst: de percentages
genegeerde en afgewezen leerlingen verschillen niet noemenswaardig tussen de
groep leerlingen met beperkingen en die zonder. Aangezien het onderzoek
gericht was op de eerste ervaringen met LGF, was het niet mogelijk om de
ontwikkeling van de leerlingen met een Rugzakje te vergelijken met een
normgroep. Als alternatief is een panel van externe beoordelaars, bestaande uit
vijf ervaren ambulant begeleiders, gevraagd op basis van geanonimiseerde
leerling-dossiers een oordeel te geven over de ontwikkeling van de twintig
leerlingen op cognitief, sociaal en sociaal-emotioneel gebied. De uitkomsten laten
zien dat het panel zich in enige mate zorgen maakte over 35% van de leerlingen,
wat in contrast staat met het oordeel van leerkrachten, ouders en in mindere
mate ambulant begeleiders. Anderzijds was het panel (zeer) positief gestemd
over eenzelfde percentage andere leerlingen met een beperking.
Hoofdstuk 3 betreft een literatuurverkenning waarbij het verhelderen van
de sociale dimensie van inclusie in het onderwijs centraal staat. Uit de
literatuurverkenning komt naar voren dat de vaak gebruikte termen ‘sociale
integratie’, ‘sociale inclusie’ en ‘sociale participatie’ door veel onderzoekers als
synoniemen worden beschouwd en als zodanig worden gehanteerd. In dit
onderzoek is sociale participatie gekozen als centraal begrip. Op basis van de
literatuurverkenning werd geconcludeerd dat vier thema’s kunnen worden
onderscheiden binnen sociale participatie: vriendschappen/relaties,
contacten/interacties, sociale zelfperceptie van de leerling en acceptatie door
klasgenoten. Aan de hand van deze thema’s is vervolgens een model van sociale
participatie ontworpen.
In hoofdstuk 4 wordt beschreven hoe het model van sociale participatie
wordt gebruikt voor het ontwikkelen van een vragenlijst voor leerkrachten. De
‘Vragenlijst Sociale Participatie’ is bedoeld om leerkrachten te ondersteunen bij
het maken van accurate beoordelingen van de sociale participatie van leerlingen
met beperkingen. In dit hoofdstuk worden de eerste bevindingen met betrekking
tot de kwaliteit van de vragenlijst beschreven. De vragenlijst bestaat uit vier
subschalen waarin de vier hoofdthema’s van sociale participatie worden
geoperationaliseerd. De uitkomsten met betrekking tot de psychometrische
eigenschappen van de vragenlijst bleken veelbelovend te zijn, maar dienen met
SAMENVATTING
210
enige voorzichtigheid geïnterpreteerd te worden in verband met het kleine aantal
respondenten. De uitkomsten van een confirmerende factoranalyse (Multiple
Groep Methode) ondersteunden grotendeels de verdeling van sociale participatie
in vier hoofdthema’s. De betrouwbaarheid van de vragenlijst als geheel was
hoog, terwijl de betrouwbaarheid van de vier subschalen uiteenliep van matig tot
hoog. Op basis van deze uitkomsten werden enkele wijzigingen in de vragenlijst
aangebracht en werd geconcludeerd dat door middel van grootschaliger
onderzoek de kwaliteit van de vragenlijst verder onderzocht zou moeten worden.
In de hoofdstukken 5 tot en met 7 wordt hiervan verslag gedaan.
Hoofdstuk 5 richt zich op de psychometrische kwaliteiten van de
Vragenlijst Sociale Participatie. Door middel van een non-parametrische item
respons analyse (Mokken-analyse) is de kwaliteit van de vragenlijst als geheel en
van de vier afzonderlijke subschalen onderzocht. Op basis van de uitkomsten van
de analyses is een tiental items uit de vragenlijst verwijderd, resulterend in een
definitieve vragenlijst bestaande uit 24 items. De uitkomsten van de analyses
laten zien dat de vier subschalen gematigd sterk tot sterk zijn. Het dubbele
monotonie model (DMM) van Mokken bleek van toepassing te zijn op iedere
subschaal. De subschaalscores liggen op een ordinale schaal en de afzonderlijke
items zijn invariant geordend. Daarnaast zijn de subschaalscores vergelijkbaar
voor leerlingen met en zonder beperkingen. Bovendien wordt het model van
sociale participatie, waarin de vier hoofdthema’s worden onderscheiden,
ondersteund door de uitkomsten van de analyses. De betrouwbaarheid van de
vragenlijst als geheel bleek hoog te zijn en ook de vier subschalen zijn
betrouwbaar bevonden. Tenslotte bleken er sterke aanwijzingen te zijn voor de
discriminante validiteit van de vragenlijst.
In hoofdstuk 6 staat de convergente validiteit van de Vragenlijst Sociale
Participatie centraal. De correlaties tussen de vier subschalen van de vragenlijst
en externe criteria bleken tegen te vallen: een aantal correlaties was relatief laag
en enkele correlatiepatronen weken af van de verwachtingen. Hierdoor was er
geen afdoende steun voor de convergente validiteit van de vragenlijst. Een
secundaire analyse, te weten een confirmerende factoranalyse met behulp van
LISREL, verschafte echter wel aanwijzingen voor de convergente validiteit van de
Vragenlijst Sociale Participatie. Op basis van de uitkomsten betreffende de
psychometrische kwaliteiten van de Vragenlijst Sociale Participatie, kan
geconcludeerd worden dat de vragenlijst voor leerkrachten een waardevol
SAMENVATTING
211
hulpmiddel kan worden bij het tijdig signaleren van problemen op het gebied van
sociale participatie van leerlingen met beperkingen. Nader onderzoek naar onder
andere de bruikbaarheid van de vragenlijst en naar de betekenis van scores is
wenselijk.
Hoofdstuk 7 maakt gebruik van onderzoeksmateriaal dat gebruikt is bij
de ontwikkeling en kwaliteitstoetsing van de Vragenlijst Sociale Participatie. Aan
de hand van dit onderzoeksmateriaal wordt de actuele stand van zaken met
betrekking tot de sociale participatie van leerlingen met beperkingen binnen het
regulier basisonderwijs beschreven. De uitkomsten zijn in enige mate
zorgwekkend, aangezien leerlingen met beperkingen op drie van de vier
hoofdthema’s van sociale participatie lager scoren dan hun medeleerlingen
zonder beperkingen. Enige nuancering is echter op zijn plaats. Veruit het
merendeel van de leerlingen met beperkingen wordt geaccepteerd en heeft één
of meer vrienden in de groep, een acceptabel aantal interacties met klasgenoten
en een positief sociaal zelfbeeld.
In hoofdstuk 8 worden de belangrijkste bevindingen uit dit proefschrift
samengevat en de methodologische problemen van het onderzoek besproken. In
het licht hiervan wordt een discussie gevoerd over de implicaties van dit
onderzoek voor het onderwijsbeleid en voor de onderwijspraktijk en worden
aanbevelingen voor vervolgonderzoek gedaan.

SAMENVATTING
212

Dankwoord
DANKWOORD
DANKWOORD
214
Het is zover: het proefschrift is af. Een groot aantal mensen heeft direct of
indirect bijgedragen aan de totstandkoming van dit proefschrift. Op deze plek wil
ik hen allen hiervoor hartelijk bedanken. Een aantal personen wil ik in het
bijzonder noemen.
In de eerste plaats gaat mijn dank uit naar de drie personen die mij de afgelopen
jaren hebben begeleid: prof. dr. Han Nakken, prof. dr. Sip Jan Pijl en dr. Els van
Houten.
Han, ik prijs mij gelukkig met jou als 1e promotor. Na je emeritaat had je het
rustiger aan kunnen gaan doen, maar voor mijn gevoel is het tegenovergestelde
gebeurd. Je hebt niet alleen de grote lijn van mijn onderzoek in de gaten
gehouden, maar ook al mijn teksten (van de eerste pogingen tot de definitieve
versies) grondig gelezen en van commentaar voorzien. Jouw betrokkenheid en
inzet heb ik zeer gewaardeerd, evenals de vele kopjes thee waar jij mij vrijwel
ieder overleg van voorzag. Ik bewonder jouw enorme hoeveelheid vakkennis,
jouw scherpe, doch opbouwende manier van feedback geven en jouw passie voor
de wetenschap. Dat laatste werkt aanstekelijk!
Sip Jan, als 2e promotor was je sterk betrokken bij mijn onderzoek. Ik heb grote
bewondering gekregen voor jouw vakkennis en deskundigheid op het gebied van
inclusief onderwijs. Jouw vermogen om (in mijn ogen) tegenvallende resultaten
te relativeren en de zonnige zijde ervan te belichten heb ik als zeer waardevol
ervaren. Daarnaast heb ik erg veel plezier beleefd aan het samen met jou
deelnemen aan conferenties in Glasgow, Genève, Gent en Göteborg.
Els, jij was als co-promotor aan mijn onderzoek verbonden. Ik wil jou allereerst
hartelijk bedanken voor het doorsturen van de vacature in het najaar van 2003.
Als jij niet aan mij had gedacht als potentiële Promovendus, had ik dit
proefschrift niet kunnen schrijven. Daarnaast ben ik je niet alleen dank
verschuldigd voor de betrokkenheid bij mijn onderzoek, maar ook voor je
ondersteuning bij het begeleiden van studenten en het voorbereiden van
colleges. Ik heb veel van je geleerd.
Daarnaast wil ik mijn collega’s uit het AIO-huis bedanken voor de fijne tijd. Ik
heb het mede dankzij jullie de afgelopen jaren enorm naar mijn zin gehad. Van
het vieren van verjaardagen, het samen lunchen en het met elkaar uiteten gaan
heb ik erg genoten. In het bijzonder wil ik Marianne Punter bedanken. Marianne,
gedurende drie jaar waren wij kamergenootjes. Bedankt voor je hulp, je
DANKWOORD
215
luisterend oor, je boekentips en je gezelligheid. Ik ben zeer blij dat je mijn
paranimf wilt zijn.
De scholen die hebben deelgenomen aan het onderzoek mogen niet onvermeld
blijven. Zij waren onmisbaar voor het onderzoek Alle leerlingen, leerkrachten,
intern begeleiders, ambulant begeleiders en ouders die hebben deelgenomen aan
het onderzoek wil ik heel hartelijk bedanken voor hun medewerking.
De vele schoolbezoeken zou ik nooit alleen hebben kunnen behappen. Met hulp
van studenten is het gelukt de scholen die door heel Nederland verspreid lagen
te bezoeken. In chronologische volgorde wil ik de studenten bedanken die in het
kader van hun doctoraalscriptie of masterthesis een bijdrage hebben geleverd
aan het onderzoek: Christel Koldeweij, Annet Hessels, Evelien Klei, Sandra
Meijer, Maaike Mollema en Maria van Gosliga. Bedankt voor jullie bijdrage aan
mijn onderzoek. Speciale dank gaat uit naar Ysanne Drijber. Gedurende het half
jaar dat jij onderzoeksstagiaire was heb je veel en goed werk verricht. Bedankt
voor je inzet. Paula Dijk en Ellen Hendriks hebben in de functie van
studentassistent een grote bijdrage geleverd aan het verzamelen van data. Het
vroege opstaan en de lange reistijden (inclusief vertragingen) hebben jullie prima
doorstaan. Ik heb jullie inzet enorm gewaardeerd.
Collega’s prof. dr. Alexander Minnaert, dr. Henk Lutje Spelberg en dr. Marieke
Timmerman wil ik bedanken voor hun adviezen met betrekking tot statistische
bewerkingen, het bieden van ondersteuning bij analyses en het meewerken aan
artikelen.
Dr. Per Frostad wil ik bedanken voor zijn hulp bij het leren werken met het
statistische programma Negopy. Per, thanks for your help and for showing me
the beautiful Norwegian mountains.
Mijn dank gaat uit naar Lynn George en Ruth Rose voor het redigeren van de
artikelen die zijn opgenomen in dit proefschrift. Dankzij hun kritische feedback
zijn de teksten naar een hoger niveau getild.
Hester Nijhoff wil ik bedanken voor het maken van de illustratie op de omslag die
de finishing touch vormt van mijn proefschrift.
Mijn laatste woorden van dank zijn gericht aan het thuisfront. Lieve papa, mama,
San, Remco, Ben en Gerdien, bedankt voor jullie interesse in mijn onderzoek.
Mama, wanneer ik zenuwachtig was voor conferenties, heb ik me erg gesteund
gevoeld door jouw lieve sms-jes. Ook mijn andere familie en vrienden en
vriendinnen wil ik bedanken voor de belangstelling voor mijn onderzoek. In het
DANKWOORD
216
bijzonder wil ik Inge bedanken. Ik heb genoten van onze vele thee-, eet-, skate-,
squash-, en hardloopdates de afgelopen jaren. Zij vormden een uitstekende
afwisseling van het werk.
Erik, mijn slotwoorden zijn voor jou. Straks ga ik met de doctorstitel aan de haal,
maar eigenlijk verdien jij ‘em ook een beetje. Als ik ingewikkelde vragen had
over de verwerking van mijn data en dacht dat ik onoverkomelijke problemen
had, bedacht jij vaak ingenieuze oplossingen. Het was fijn om erop te kunnen
vertrouwen dat het uiteindelijk altijd wel goed zou komen. Het is een
geruststellende gedachte dat jij mij ook in de laatste fase van mijn promotie, in
de functie van paranimf, ter zijde zal staan. Bedankt daarvoor, maar bovenal
bedankt voor jouw vertrouwen in mij.