Embed Size (px)
Citation preview

University of Groningen
Cognitive control in media multitaskersWiradhany, Wisnu; Nieuwenstein, Mark R.
Published in:Attention, Perception & Psychophysics
DOI:10.3758/s13414-017-1408-4
IMPORTANT NOTE: You are advised to consult the publisher's version (publisher's PDF) if you wish to cite fromit. Please check the document version below.
Document VersionPublisher's PDF, also known as Version of record
Publication date:2017
Link to publication in University of Groningen/UMCG research database
Citation for published version (APA):Wiradhany, W., & Nieuwenstein, M. R. (2017). Cognitive control in media multitaskers: Two replicationstudies and a meta-Analysis. Attention, Perception & Psychophysics, 79(8), 2620-2641.https://doi.org/10.3758/s13414-017-1408-4
CopyrightOther than for strictly personal use, it is not permitted to download or to forward/distribute the text or part of it without the consent of theauthor(s) and/or copyright holder(s), unless the work is under an open content license (like Creative Commons).
Take-down policyIf you believe that this document breaches copyright please contact us providing details, and we will remove access to the work immediatelyand investigate your claim.
Downloaded from the University of Groningen/UMCG research database (Pure): http://www.rug.nl/research/portal. For technical reasons thenumber of authors shown on this cover page is limited to 10 maximum.
Download date: 15-08-2019
Cognitive control in media multitaskers: Two replicationstudies and a meta-Analysis
Wisnu Wiradhany1 & Mark R. Nieuwenstein1
# The Author(s) 2017. This article is an open access publication
Abstract Ophir, Nass, andWagner (2009, Proceedings of theNational Academy of Sciences of the United States ofAmerica, 106(37), 15583–15587) found that people with highscores on the media-use questionnaire—a questionnaire thatmeasures the proportion of media-usage time during whichone uses more than one medium at the same time—showimpaired performance on various tests of distractor filtering.Subsequent studies, however, did not all show this associationbetween media multitasking and distractibility, thus castingdoubt on the reliability of the initial findings. Here, we reportthe results of two replication studies and a meta-analysis thatincluded the results from all published studies into the rela-tionship between distractor filtering and media multitasking.Our replication studies included a total of 14 tests that had anaverage replication power of 0.81. Of these 14 tests, only fiveyielded a statistically significant effect in the direction of in-creased distractibility for people with higher scores on themedia-use questionnaire, and only two of these effects heldin a more conservative Bayesian analysis. Supplementingthese outcomes, our meta-analysis on a total of 39 effect sizesyielded a weak but significant association betweenmedia mul-titasking and distractibility that turned nonsignificant aftercorrection for small-study effects. Taken together, these find-ings lead us to question the existence of an association
between media multitasking and distractibility in laboratorytasks of information processing.
Keywords Mediamultitasking . Distractibility . Selectiveattention .Workingmemory . Task switching
Over the past two decades, the amount of information that isavailable online through the World Wide Web has increasedexponentially (Palfrey & Gasser, 2008), and the accessibilityof this information has likewise increased with the introduc-tion of various modern multimedia devices (e.g., Lenhart,2015). Taken together, these developments have led to twomajor changes in individual behavior. First, people spendmany hours per day online, as indicated by a recent surveyfrom Pew research center, which showed that 24% of teens inthe United States report being online Balmost constantly^(Lenhart, 2015). Second, people tend to engage in media mul-titasking (e.g., Brasel & Gips, 2011; Judd & Kennedy, 2011):Instead of being focused on a single task or stream of infor-mation, they try to monitor and interact with multiple streamsof information simultaneously.
The fact that many people nowadays spend large portionsof their waking lives in a media-rich environment raises theinteresting question as to whether this experience might influ-ence the information-processing mechanisms of the mind andbrain. That is, could the frequent engagement in media multi-tasking have benefits for our ability to deal with multiplestreams of information? In a recent study, Ophir, Nass, andWagner (2009) addressed this question, and their results pro-duced a surprising conclusion. In the study, Ophir and col-leagues introduced the media-use questionnaire as a measureof the proportion of media-usage time during which peopleconsume more than one type of media, and they used theresulting Media Multitasking Index (MMI) to conduct a
Electronic supplementary material The online version of this article(https://doi.org/10.3758/s13414-017-1408-4) contains supplementarymaterial, which is available to authorized users.
* Wisnu [email protected]
1 Department of Experimental Psychology, Research School ofBehavioural and Cognitive Neurosciences, University of Groningen,Grote Kruistraat 2/1, 9712 TS Groningen, The Netherlands
Atten Percept PsychophysDOI 10.3758/s13414-017-1408-4

quasi-experimental study in which the performance of partic-ipants with a high and low MMI was compared for severalwidely usedmeasures of information processing (see Table 1).
Specifically, as can be seen in Table 1, the participants inOphir et al.’s study completed two task-switching experi-ments, a change-detection task with and without distractors,anN-back task with two levels of memory load (two-back andthree-back), an AX-continuous-performance task (AX-CPT)with and without distractors, a Stroop task, and a stop-signaltask. Surprisingly, the results showed that people with highscores on the media-use questionnaire were impaired whenthe task required some form of filtering out irrelevant,distracting information, such that heavy media multitaskers(HMMs)—but not light media multitaskers (LMMs)—werenegatively affected by the presence of distractors in thechange-detection and AX-CPT tasks. In addition, the resultsshowed that HMMs made more false alarms in the N-backtask, and they showed slower response times and larger switchcosts in the task-switching experiment. In interpreting thesefindings, Ophir et al. argued that HMMs had difficulty insuppressing the memory representations of earlier encoun-tered targets in the N-back task, and that they had difficultyin inhibiting a previously used task set in the task-switchingexperiment. Accordingly, Ophir et al. concluded that Bheavymedia multitaskers are more susceptible to interference fromirrelevant environmental stimuli and from irrelevant represen-tations in memory^ (p. 15583).
Results of follow-up studies to Ophir et al.’s (2009)pioneering work
Following Ophir et al.’s (2009) pioneering study, several re-ports were published that followed up on this pioneering workby examining the association between questionnaire measuresof media multitasking and various measures of information-processing capacity, distractibility, brain functioning, person-ality, and daily-life functioning. The results of these studiespresent a large and mixed set of results.
On the one hand, some studies found correlates of theMMIwith lower working-memory capacity (Cain, Leonard,Gabrieli, & Finn, 2016; Sanbonmatsu, Strayer, Medeiros-Ward, & Watson, 2013), limited top-down control over visualselective attention (Cain & Mitroff, 2011), lower gray-matterdensity in the anterior cingulate cortex (Loh, Kanai &Watanabe, 2014), lower scores on measures of fluid intelli-gence (Minear, Brasher, McCurdy, Lewis, & Younggren,2013), an improved ability for dividing spatial attention (Yap& Lim, 2013) an improved ability to integrate visual and au-ditory information (Lui & Wong, 2012), more frequent self-reports of depression and social anxiety symptoms (Becker,Alzahabi, & Hopwood, 2013), higher scores on certain sub-scales of self-report measures of impulsivity (Minear et al.,
Table 1 Tasks, analyses, and effects reported by Ophir et al. (2009)
Task Conditionsincluded
Findings and effectsizes in Ophir et al.(2009)
P(rep)Exp.1
P(rep)Exp.2
Changedetection
Memory set of2, with 0, 2,4, or 6distractors
Interaction of group(LMM vs. HMM)and number ofdistractors forMemory Set Size 2condition (f = .34; d =.68): HMMs showeda decline inperformance withincreasing numbersof distractors; LMMsdid not
.95 .97
Memory set of4, with 0, 2,or 4distractors
Memory set of6, with 0 or2 distractors
No analyses reportedfor conditions with 4and 6 targets
Memory set of8, with 0distractors
No significantdifference in memorycapacity of HMMsand LMMs incomparison ofmemory sets of 2, 4,6, and 8 items,without distractors
AX-CPT With vs.withoutdistractors
Significant interactionof group (LMM vs.HMM) anddistractors (presentvs. absent) forresponse times:HMMs slower torespond to target (d =1.19) and nontarget(d = 1.19) probesonly in the conditionwith distractors
.86 .76
.86 .76
N-back task 2-back vs.3-back
Interaction of Group(LMM vs. HMM) ×Condition (2-back vs.3-back) forfalse-alarm rate, withHMMs showing astronger increase infalse alarms as mem-ory load increasedfrom 2-back to3-back (f = .42; d =.84)
.95 .92
Taskswitching:number--letter
Task-repeatandtask-switchtrials
HMMs showedsignificantly slowerresponse times forboth switch (d = .97)and repeat (d = .83)trials and a largerswitch cost (d = .96)
.72 .80
.60 .69
.71 .79
Stop-signaltask
Not specified No analyses reported,but Ophir et al. didmention there was nosignificant differencebetween LMMs andHMMs
Atten Percept Psychophys

2013; Sanbonmatsu et al., 2013), increased self-reports of at-tentional lapses and mind-wandering in daily life (Ralph,Thomson, Cheyne, & Smilek, 2013), lower academic achieve-ment (Cain et al., 2016), and with lower self-reports for exec-utive functioning in daily life (Baumgartner, Weeda, van derHeijden, & Huizinga, 2014). At the same time, however, thesestudies also reported nonsignificant associations for variousother outcome measures, and the results of studies thatexamined the association between MMI and outcomemeasures similar to those used by Ophir et al. generallyfailed to replicate the original effects. For instance,Baumgartner et al. (2014) found that participants with higherscores for media multitasking were less, not more, susceptibleto distraction in the Eriksen flanker task, and Ophir et al.’soriginal finding of an association with increased susceptibilityto distraction in a change-detection task was also not replicat-ed in several other studies (Cardoso-Leite et al., 2015;Gorman & Green, 2016; Uncapher, Thieu, & Wagner,2015). Likewise, Ophir et al.’s finding of increased switchcosts in HMMs was not replicated in four subsequent studies(Baumgartner et al., 2014; Cardoso-Leite et al., 2015; Gorman& Green, 2016; Minear et al., 2013), with one study showingthat HMMs had less, not more, difficulty in switching tasksthan LMMs (Alzahabi & Becker, 2013).
The current study
Taken together, it can be concluded that while the follow-upstudies to Ophir et al.’s (2009) pioneering study reported ev-idence suggestive of various correlates of media multitasking,the original findings by Ophir et al. were not always replicat-ed. Thus, it can be said that the currently available evidenceregarding a relationship between media multitasking and dis-tractibility is mixed and in need of further scrutiny. To shedfurther light on the possible existence of this relationship, weconducted two replication studies that included all experi-ments that showed a deficit in HMMs in the original studyby Ophir et al., and we conducted a meta-analysis that includ-ed the results of all studies probing the existence of a
relationship between media multitasking and distractibilityin laboratory tasks of information processing. While the rep-lication studies were done to afford insight into the replicabil-ity of Ophir et al.’s specific findings, the meta-analysis wasconducted to provide a test of the strength of the relationshipmedia multitasking and distractibility across all studies doneto date.
Justification of methods and approach to statisticalinference
In this section, we will describe and motivate our approach intesting the existence of a relationship between mediamultitasking and distractibility. As alluded to above, thisapproach involved the use of replication tests for the specificfindings of Ophir et al. (2009; see Table 1) and involved theuse of a meta-analysis to quantify the strength of the MMI–distractibility link across all studies that have probed this re-lationship, including the two replication studies reported here.While the outcomes of our replication studies shed light on thereplicability of the specific effects found by Ophir et al., themeta-analysis can provide an answer to the more central ques-tion of whether there exists an association between mediamultitasking and distractibility in general, and for certaintypes of tasks in particular. Our choice for relying on themeta-analysis for an answer to the main question of whetherthere exists an association between media multitasking anddistractibility was motivated by the fact that this associationhas been examined in several other studies, and that, therefore,the most powerful, reliable answer to this question can begained from considering the evidence that all of these studiesprovide together.
For the replication studies, we adhered to the recommen-dations provided for replication research (e.g., Brandt et al.,2014; Open Science Collaboration, 2015). To start, we care-fully identified the main findings of interest reported by Ophiret al. (2009) and selected them as our targets for the replicationtests.1 Secondly, we copied the methods of Ophir et al. asclosely as possible to ensure there were no methodologicaldifferences that could explain any differences in outcomes.Thirdly, we aimed to include as many participants as possibleto ensure a reasonable level of power for successful replicationof Ophir et al.’s results, if they were real. Fourthly, we adhereto the recommendations provided by the PsychonomicSociety in that we used a rigorous set of statistical methodsto evaluate the outcomes of our replication studies. In thefollowing sections, wewill further elaborate on how these fourpoints were implemented in our replication studies.
1 The results of these replication tests are presented in the main text, and ouranalyses for other outcome measures and conditions are reported in a supple-mentary document.
Table 1 (continued)
Task Conditionsincluded
Findings and effectsizes in Ophir et al.(2009)
P(rep)Exp.
1
P(rep)Exp.
2
Stroop task Not specified No analyses reported
Taskswitching
Not specified No analyses reported
Note. LMM = light media multitaskers; HMM = heavy mediamultitaskers; d = effect size in Cohen’s d for the effects reported byOphir et al.; P(rep) = acquired replication power for our replication testswith α = .05
Atten Percept Psychophys

Selection of outcomes of interest for replication studies Forthe replication tests, a first point of consideration was that thestudy by Ophir et al. (2009) included several tasks that haddifferent conditions and different outcomes (e.g., accuracyand response times for four types of trials in the AX-CPT),which were in some cases examined in several different anal-yses. To avoid the risk of inflation of null-hypothesis rejectionrates with multiple testing, a first step in our replication effortswas to select the main findings of interest from Ophir et al. Indoing so, we closely examined the report of Ophir et al. todetermine which findings were used as the basis for theirconclusion that there exists an association between mediamultitasking and increased distractibility. Our analysis of thismatter identified seven key findings (see Table 1), and thesefindings thus became our outcomes of interest in examiningthe replicability of Ophir et al.’s findings. Specifically, for thechange-detection task, Ophir et al. reported a significant groupby distractor set size interaction for the condition with twotargets. For the AX-CPT, the main finding of interest was thatHMMs showed slower responses in the condition withdistractors, but only on trials in which the probe requiredparticipants to refer to the cue they had to maintain in memoryduring the presentation of the distractors separating the cueand the probe (AX and BX trials). For the N-back task, thiswas the finding of an interaction between group and working-memory load for false alarms, such that HMMs showed astronger increase in false alarms as load increased across thetwo-back and three-back conditions. Lastly, for the task-switching experiment, Ophir et al. found that HMMs wereslower on both switch and nonswitch trials, and they alsoshowed a larger switch cost (i.e., a larger difference in re-sponse times for switch and nonswitch trials). In discussingthese three results, Ophir et al. took each to reflect evidencefor increased distractibility (cf. description of results on p.15585 in Ophir et al.), and, accordingly, we selected each ofthese three outcomes of the task-switching experiment as tar-gets for our replication attempt.
Methods used in the replication studies For our replicationstudies, we aimed to replicate the methods of Ophir et al.(2009) as closely as possible. Specifically, we first asked asmany participants as possible to fill in the same media-usequestionnaire that was used by Ophir et al., and we thenassigned participants with scores in the first quartile of thedistribution of media multitasking scores to the LMM group,whereas participants with scores in the fourth quartile wereassigned to the HMM group. These participants were invitedto take part in a lab study. In using the same group of partic-ipants for all experiments in the lab study, our procedure dif-fered from that of Ophir et al. because Ophir et al. used dif-ferent groups of participants for different tasks. In addition,our procedure differed from that of Ophir et al. because weused quartiles as the criteria for the assignment of participants
to the LMM and HMM groups, whereas Ophir et al. assignedparticipants to these groups on the basis of their scores beingone standard deviation below or above the group mean. Ourchoice for using quartiles, as opposed to using Ophir et al.’sstandard-deviation-based criterion, was motivated by practicaland empirical considerations as the use of quartiles wouldresult in larger groups of participants in the LMM andHMM groups, and, furthermore, some previous studies havebeen successful in identifying differences between LMMs andHMMs using the quartile-based approach (Cain & Mitroff,2011; Yap & Lim, 2013).
To ensure that the methods we used for the experiments inthe lab study were identical to those used by Ophir et al.(2009), we requested and received the original experimentprograms used by Ophir et al. This allowed us to copy theexact methods of Ophir et al. for our replication studies.However, there was one task for which we did not copyOphir et al.’s methods exactly. This concerned the AX-CPT,for which we chose not to include a condition withoutdistractors, since Ophir et al. found that HMMs only per-formed worse than LMMs when this task was done in thepresence of distractors. Except for the omission of this condi-tion without distractors, the AX-CPTwas identical to the taskused byOphir et al., and the other tasks—change detection,N-back, and task-switching—were all identical to those used byOphir et al. as well.
Data analysis for the replication studies In analyzing theresults of our replication attempts, we complied with the sta-tistical guidelines of the Psychonomic Society (PsychonomicSociety, 2012). As stated in these guidelines, the conventionalapproach of null-hypothesis significance testing (NHST) hasseveral vulnerabilities, and researchers should therefore beencouraged to supplement the results of NHSTs with othermetrics and analyses, such as power analyses, effect sizesand confidence intervals, and Bayesian analyses. Inimplementing this recommendation, we first computed ouracquired replication power to determine the likelihood thatwe would be able to replicate the effects of interest, givenour sample size. As detailed below, these power analysesshowed that our sample sizes were sufficiently large to yieldan average replication power of .81, which is generally con-sidered to be an acceptable level of power (Cohen, 1992). Todetermine whether our replication attempts were successful,we conducted NHSTs to determine whether the effects ofinterest reached significance at α = .05, and, in doing so, weused one-sided tests for directional predictions that could betested using a t test. For hypotheses involving more than twocondition means, we reported the regular F statistics, as theseare one-sided by definition. In interpreting the results of theseNHSTs, we refrained from interpreting nonsignificant resultswith p < .1 as trends, as it has been demonstrated that suchnonsignificant results should not be taken to reflect a trend in
Atten Percept Psychophys

the direction of statistical significance, because the inclusionof additional data will not necessarily result in a lower p -value(Wood, Freemantle, King, & Nazareth, 2014). In addition toconducting the NHSTs, we also calculated effect sizes andtheir confidence intervals to gain further insight into thestrength of both significant and nonsignificant effects.Lastly, we also conducted a Bayes factors analysis. As de-tailed below, this type of analysis is an important supplementto NHST because it provides a more conservative estimate ofthe extent to which the data support the presence of an effect,and because it also allows one to determine the extent to whicha nonsignificant result provides evidence in favor of the nullhypothesis.
Bayes factors analyses As alluded to above, a Bayes factorsanalysis allows one to quantify the extent to which the ac-quired data support the existence (H1) or absence (H0) of aneffect, with a continuous measure that expresses the ratio ofthe likelihood of the data under these respective hypotheses(Jarosz & Wiley, 2014; Rouder, Morey, Speckman, &Province, 2012; Rouder, Speckman, Sun, Morey, & Iverson,2009; Wagenmakers, 2007). This measure has advantagesover the traditional approach of significance testing becauseit allows for an assessment of the evidence for bothH1 andH0,instead of only allowing the rejection of H0 if the observeddata is unlikely under the null hypothesis (i.e., less than α).Furthermore, it has been shown that, compared to significancetests, Bayes factors provide a more robust test of the acquiredevidence because significance tests tend to overestimate theevidence against H0. Specifically, when adopting a BF10 > 3as the criterion for the presence of an effect, it has been foundthat 70% of 855 effects that reached significance with p valuesbetween .01 and .05 did not reach this threshold of BF10 > 3(Wetzels et al., 2011). Thus, a Bayes factors analysis not onlysupplements the NHST in allowing for a quantification ofevidence in favor the null hypothesis but it can also be saidto provide a more conservative test for the presence of aneffect than that provided by NHST.
In calculating Bayes factors, we assumed the default priorvalues included in BayesFactor package in R (Morey, Rouder,& Jamil, 2015), and we expressed the evidence in terms ofBF01 (ratio of likelihood of data given H0 : likelihood of datagivenH1) in case our significance test yielded a nonsignificanteffect, and in terms of BF10 (ratio of likelihood of data givenH1 : likelihood of data given H0) in case the significance testyielded a statistically significant effect. For all BFs, valuesgreater than one signified evidence in favor of one hypothesisover the other, with greater values signifying greater evidence.In characterizing the resulting BFs, we followed the nomen-clature of Jeffreys (1961), which considers BFs of 1–3 asanecdotal evidence, 3–10 as moderate evidence, 10–30 asstrong evidence, and 30–100 as very strong evidence.
Experiment 1
Method
Participants A total of 154 undergraduate students from theFaculty of Psychology, Universitas Gadjah Mada, Indonesia,were invited to fill in the media-use questionnaire in an onlinestudy. Of these 154 participants, 148 participants completedthe questionnaire. TheMMI scores were normally distributed,as indicated by a Kolmogorov–Smirnov test, Z = .70, p = .49,with an average score of 6.80 and a standard deviation of 1.98.Using the lower and upper quartiles of the distribution ofMMIscores as criteria, we classified 23 participants as LMMs and24 as HMMs. These participants were invited for a lab studyfor which they would receive a monetary compensation of50.000 rupiah (~3.5 €). In total, 13 HMMs (MMMI = 9.74,SD = .66) and 10 LMMs (MMMI = 4.09, SD = 1.12) respondedto our invitation for the lab study.
Materials and general procedure The materials used for thereplication studies included the same media-use questionnaireas that used by Ophir et al. (2009) and four experiments(change detection, N-back, AX-CPT, and task switching),which showed the main effects of interest (see Table 1). Asin Ophir et al. (2009), the questionnaire was set out in anonline study. The data for the four experiments were collectedin an open computer lab equipped with multiple Intel i3 desk-top computers, which had a 2.6 GHz CPU and 2 GB of RAM.Stimuli were presented on a 20-inch LCD monitor, and thepresentation of stimuli and collection of responses were con-trolled using software written in PsychoPy Version 1.8.2.(Peirce, 2007). The responses were recorded using aQWERTYkeyboard. Each of the four tasks took approximate-ly 15 minutes to be completed, and the order of the tasks wasrandomized across participants.
The media-use questionnaire To assess media multitask-ing, we used the same questionnaire as the one introducedby Ophir et al. (2009). This questionnaire consists of 144items that each ask the participant the following: Whenusing [one of 12 possible media], how often do you alsouse [the same media or one of the other 11 media]? Thetypes of media covered by the questionnaire includeprinted media, e-mail, television, video, music, nonmusicaudio, phone, text messaging, instant messaging (e.g.,chat), browsing, video games, Internet browser, and othermedia. To answer the items, the participant is asked tochoose between never, sometimes, often, and almostalways. By combining all 12 types of media, thus includ-ing the possibility of using the same medium twice, thisyields a total of 144 combinations for which responses areweighted with a value of 0 (never), .33 (sometimes), .67(often) or 1 (almost always). To compute the Media
Atten Percept Psychophys
Multitasking Index (MMI), the scores for the 144 items aresubsequently entered into the following equation:
MMI ¼ ∑12
i¼1
mi � hihtotal
;
in which mi is the sum score for media multitasking usingprimary medium i, hi is the number of hours spent consum-ing primary medium i per week, and htotal is the sum ofhours spent consuming any of the 12 media. The MMI thusindicates the percentage of media-usage time during whicha participant uses two media at the same time. Note that byimplication, the MMI is insensitive to the actual amount oftime people spent using different media at the same time,as the calculation of the MMI entails that 1 hour of mediamultitasking per day produces the same MMI as 16 hoursof media multitasking. This aspect of the MMI has beenpointed out in previous studies (Cain et al., 2016; Moisalaet al., 2016), and we return to its implications in the generaldiscussion section.
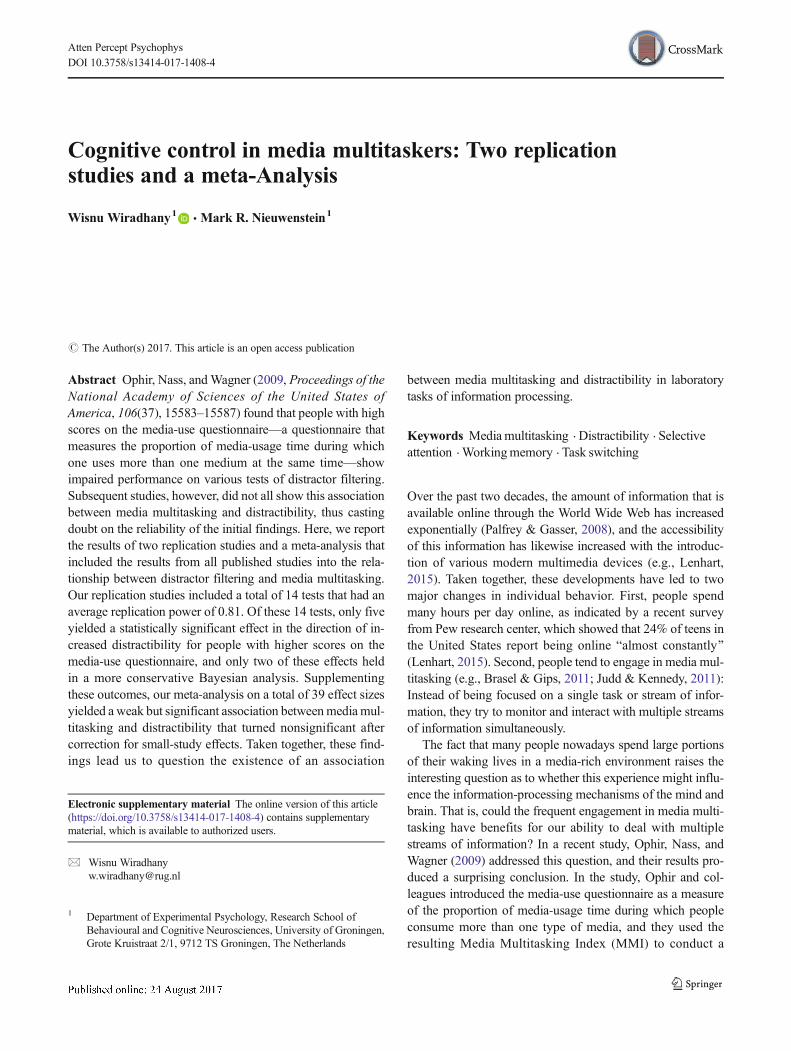
Materials, design, and procedure for change detectionWeused a change-detection task identical to the one used byOphir et al. (2009), who used a task designed by Vogel,McCollough, and Machizawa (2005). As indicated in Fig. 1,each trial began with the appearance of a fixation cross for200 ms, which was followed by a 100-ms display of a mem-ory array consisting of two, four, six, or eight red bars that hadto be remembered. Except for the memory array with eight redbars, the other arrays could also include blue bars that servedas distractors, with the possible numbers of blue bars being [0,2, 4, or 6], [0, 2, or 4], and [0 or 2], for memory arrays withtwo, four, and six target elements, respectively. Following theappearance of this array, there was a 900-ms retention intervalfollowed in turn by a test array that was shown for 2,000 ms.In the test array, one of red bars could have a different orien-tation compared to the same bar in the memory array, and thetask for the participants was to press one of two designatedkeys to indicate whether a red bar had changed its orientation,which was the case on 50% of the trials. Following this re-sponse, the test array disappeared, and the memory array forthe next trial appeared after 200 ms. The task consisted of atotal of 200 trials, yielding 10 change and 10 no-change trialsfor each combination of memory set size and distractor setsize.
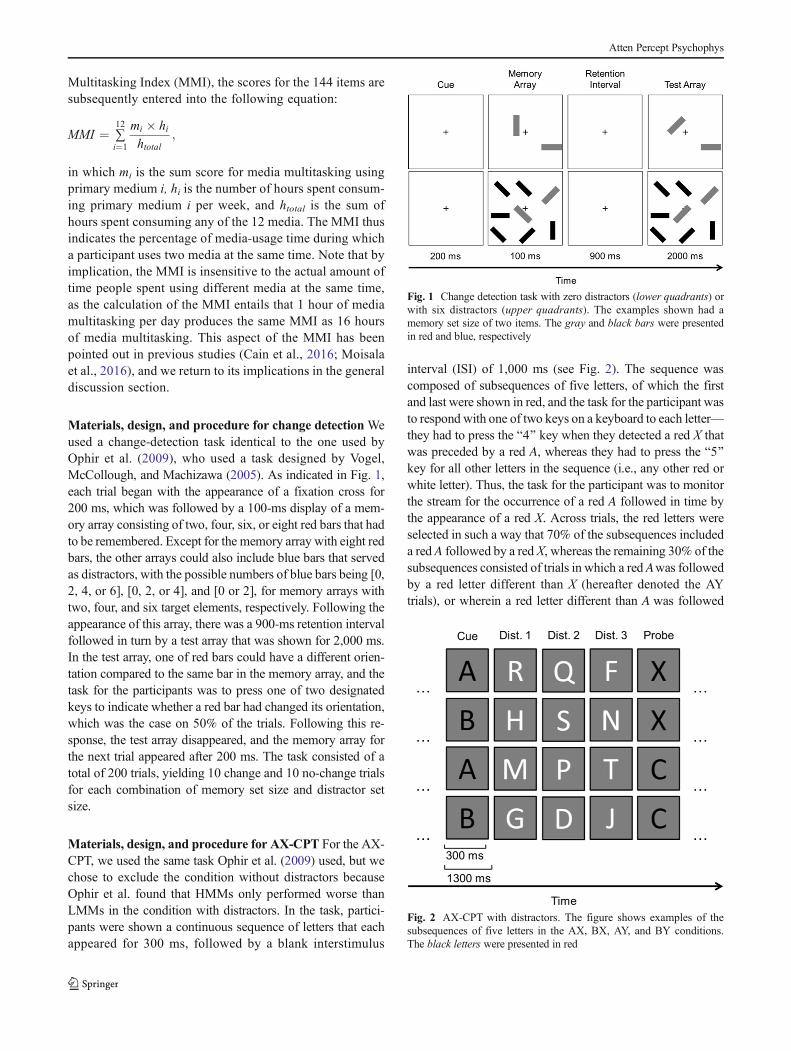
Materials, design, and procedure for AX-CPT For the AX-CPT, we used the same task Ophir et al. (2009) used, but wechose to exclude the condition without distractors becauseOphir et al. found that HMMs only performed worse thanLMMs in the condition with distractors. In the task, partici-pants were shown a continuous sequence of letters that eachappeared for 300 ms, followed by a blank interstimulus
interval (ISI) of 1,000 ms (see Fig. 2). The sequence wascomposed of subsequences of five letters, of which the firstand last were shown in red, and the task for the participant wasto respond with one of two keys on a keyboard to each letter—they had to press the B4^ key when they detected a red X thatwas preceded by a red A, whereas they had to press the B5^key for all other letters in the sequence (i.e., any other red orwhite letter). Thus, the task for the participant was to monitorthe stream for the occurrence of a red A followed in time bythe appearance of a red X. Across trials, the red letters wereselected in such a way that 70% of the subsequences includeda red A followed by a red X, whereas the remaining 30% of thesubsequences consisted of trials in which a red Awas followedby a red letter different than X (hereafter denoted the AYtrials), or wherein a red letter different than A was followed
Fig. 1 Change detection task with zero distractors (lower quadrants) orwith six distractors (upper quadrants). The examples shown had amemory set size of two items. The gray and black bars were presentedin red and blue, respectively
Fig. 2 AX-CPT with distractors. The figure shows examples of thesubsequences of five letters in the AX, BX, AY, and BY conditions.The black letters were presented in red
Atten Percept Psychophys

by a red X (hereafter denoted BX trials), or wherein a red letterdifferent than Awas followed by a red letter different than X(hereafter denoted BY trials). The experiment consisted offive series of 30 subsequences, and participants were allowedto take a short break after each series.
Materials, design, and procedure for N-back task The N-back task was also identical to the task used by Ophir et al.(2009). Participants were presented a sequence of black letterson a white screen. Each letter appeared for 500 ms, followed bya blank ISI for 3,000ms (see Fig. 3). The task for the participantwas to determine if a currently shown letter was the same as theone shown two positions earlier (two-back condition), or threepositions earlier (three-back condition). To respond to such tar-gets, participants pressed the B4^ key of the keyboard whereasthey pressed the B5^ key in response to all other letters. Thetwo- and three-back conditions each consisted of the presenta-tion of 90 letters, of which 13 were targets. As in the study byOphir et al., the two-back condition was always done first,followed in time by the three-back condition.
Materials, design, and procedure for task switching Thetask-switching experiment was also identical to that used byOphir et al. (2009). In each trial of this task, participants werepresented with a fixation cross for 1,000 ms followed by a cuefor 100ms that indicated Bnumber^ or Bletter.^After the cue, anumber and a letter were shown adjacent to each other (seeFig. 4). When cued to respond to the number, participants hadto indicate whether the number was odd (press B1^ on thekeyboard) or even (press the B2^ key of the keyboard) asquickly as possible. When cued to respond to the letter, par-ticipants had to respond as quickly as possible to the letter bypressing B1^ if the letter was a vowel and B2^ if it was aconsonant, with the letter being drawn from the set A, E, I,U, P, K, N, and S. The experiments consisted of four blocks of80 trials, of which 40% were Bswitch^ trials (number cuepreceded by letter cue or vice versa) whereas the remainingtrials were Brepeat^ trials. These two types of trials were pre-sented in a random order.
Data analyses: Outcome measures and criteria for exclud-ing observations In this section, we describe the criteria weused for the exclusion of participants and trials, and the out-come measures we used for analyses. For all experiments, weexcluded participants who performed at chance. This resultedin the exclusion of one participant from the LMM group forthe change-detection task. For the other experiments, no par-ticipants were excluded on the basis of this criterion. Ourexclusion criteria for trials differed across experiments, andthese criteria are detailed in the sections to follow.
For the change-detection task, our analysis included onlythose trials in which the participant responded in time to thetest array, that is, during the 2 seconds for which the test arraywas presented. This resulted in a loss of 4.02% of the trials.For the remaining trials we used the hit and false-alarm rates tocalculate Cowan’s K as a measure of working memory capac-ity (see Cowan, 2000), with K = S * (H-F), where K is thenumber of targets retained in working memory, S is the num-ber of elements in the memory set, and H and F are hit andfalse alarm rates, respectively.
For the AX-CPT, we examined the hit and false-alarm ratesonly for responses to the last red letter in the sequence, whichwould be a target in case it was anX that was preceded by a redA (AX trials) or a nontarget in all other cases (BX trials). SinceOphir et al. (2009) only found differences in response times,our analysis of these trial types also focused on responsetimes. For these analyses, we only included those trials inwhich the participant’s response to first and last red letterswere correct and we also excluded trials in which the responsetime to first and last red letters in the sequence were lower than200 ms. This resulted in the exclusion of 40.6% of the trials,2
Fig. 3 Example of a sequence of letters for the two-back (top row) andthree-back (bottom row) conditions in the N-back task
Fig. 4 Example of a trial sequence in the number–letter task-switchingexperiment. Switch and repeat trials differ in terms of whetherparticipants are cued to respond to the number (repeat) or the letter(switch) on the next trial
2 In deciding to include only trials with correct responses to both the first andthe last red letter of the sequence, we may have applied an unusually strictcriterion for trial inclusion, as previous studies using the AX-CPT typicallyincluded trials irrespective of whether the response to the cue was correct.However, since the correct judgment of the last red letter requires a correctjudgment of the first, we felt that it was reasonable to use this more strictinclusion criterion. Notably, however, the results did not change whenwe usedthe more lenient inclusion criterion of including all trials with a correct re-sponse to the last red letter in the sequence.
Atten Percept Psychophys

thus leaving an average of 89 trials per participant to include inour analysis.
For the N-back task, we ignored response times and hitrates, and instead focused the false-alarm rates because themain finding of interest in Ophir et al.’s (2009) study was aninteraction effect of load (two-back vs. three-back) and group(LMM vs. HMM) on false-alarm rates, with HMMs showinga stronger in increase in false alarms with increasing load.
For the analysis of the task-switching experiment, we ex-amined the response times for switch and repeat trials, usingonly those trials in which the response was correct. In addi-tion, we examined the switch cost, which is the difference inresponse times for switch and repeat trials. Prior to data anal-ysis, we removed trials with response times below 200 ms andwe used van Selst and Jolicoeur’s (1994) procedure to detectoutliers on the upper end of the distribution. This resulted inthe exclusion of 4.07% of the trials.
Results
Our report of the results in the main text is restricted to theanalyses of the main findings of interest, listed in Table 1. Wereport the results of the analyses of other outcome measuresand conditions in a supplementary document. In the follow-ing, we describe, per experiment, our achieved replicationpower for the effects of interest, followed in turn by a reportof the results of applying NHST for these effects, along withthe outcomes for any auxiliary effects that were tested in thesame analysis (e.g., the main effects of group and distractor setsize in the change-detection task, for which the prediction wasa significant interaction without significant main effects; seeTable 1). In addition, we report the effect sizes and their con-fidence intervals for all effects, and we report the outcomes ofa Bayesian analysis for the seven effects of interest.
Change detection: Achieved replication power For thechange-detection task, we had to remove one participant fromthe LMM group due to chance-level performance. To calcu-late the achieved power we had for replicating Ophir et al.’s(2009) finding of a significant interaction group (LMM vs.HMM) and distractor set size (0, 2, 4, or 6), for the conditionwith a memory set size of two items, the final sample size thusconsisted of 10 HMMs and 12 LMMs. Since the sample sizesdiffered per group, we were unable to calculate the exact pow-er we had for our statistical test of the interaction effect, be-cause this would require more detailed insights about the orig-inal effects than we could gain from the statistics reported forthese effects. To circumvent this matter, we decided to com-pute a conservative power estimate, by using twice thesmallest sample size for our calculations. Thus, our calcula-tion of achieved power was based on a sample size of 2 × 10 =20 for the change-detection task. To calculate our achievedreplication power, we used G*Power 3.1. software (Faul,
Erdfelder, Lang, & Buchner, 2007), and selected and set thefollowing parameters: F tests, ANOVA repeated measures,within–between interaction, post hoc, effect size f = .344, α= .05, number of groups = 2, number of measurements = 4,correlation among repeated measures = .5, and nonsphericitycorrection ε = 1. This calculation showed that a conservativeestimate of our replication power for the interaction effect wasequal to .95.
Change detection: Results To determine whether our resultsreplicated Ophir et al.’s (2009) finding of a Group × DistractorSet Size interaction, we conducted a repeated-measuresANOVA, with group (LMM vs. HMM) as a between-subjects factor and distractor set size (0, 2, 4, or 6) as awithin-subjects factor. The analysis yielded a main effect ofgroup, F(1, 20) = 6.48, p = .019, ηp
2 = .12, d = .74, and a maineffect of distractor set size, F(3, 60) = 2.97, p = .039, ηp
2 =.079, d = .58. As can be seen in Fig. 5, the main effect of groupreflected the fact that performance was worse overall forHMMs than for LMMs, and the main effect of distractor setsize entailed that all participants showed a decrease in perfor-mance with increasing numbers of distractors. Most impor-tantly, however, the results did not show a significant Group× Distractor Set Size interaction, F(3, 60) = 0.22, p = .880, ηp
2
= .01, and our calculation of an effect size for this interactioneffect yielded a negative effect because the rate at which per-formance decreased across increasing distractor set sizes washigher for LMMs than HMMs, d = −.21, CI [−1.11, 0.69],thus demonstrating a trend in opposite direction to Ophiret al.’s (2009) finding of increased susceptibility to distractionin HMMs. A Bayes factors analysis for this interaction effectyielded a BF01 = 6.83, thus indicating that our experimentyielded moderate evidence for the absence of this interactioneffect.
AX-CPT: Achieved replication power For the AX-CPT, ourprimary targets for replication were the reaction times on AXand BX trials (see Table 1), for which Ophir et al. (2009)found that HMMs responded more slowly than LMMs.Replication power was calculated by entering our sample sizeinto the G*Power 3.1. software (Faul et al., 2007), with thesesettings: t tests, difference between two independent means,post hoc, one-tail, effect size d = 1.19 for AX RT and 1.19 forBX RT, α = .05, Ngroup1 = 10, Ngroup2 = 13. This analysisshowed that our sample size yielded a power of .86 for repli-cating both of these effects.
AX-CPT: Results To determine if HMMs responded slowerto AX and BX trials, we conducted two independent-samples ttests. These analyses showed that HMMs responded slowerthan LMMs in BX trials, t(21) = 1.88, p = .037 (one-tailed), d= .79, CI [−0.12, 1.70],BF10 = 2.42, but not onAX trials, t(21)= .76, p = .229 (one-tailed), d = .32 CI [−0.56, 1.20], BF01 =
Atten Percept Psychophys

1.43 (see Fig. 6). Thus, while the significance tests yieldedevidence for a statistically significant difference in responsetimes onBX trials only, the Bayes factors analysis showed thatthis effect was based on only anecdotal evidence. Likewise,the Bayes factors analysis for the nonsignificant difference inRTs on AX trials also showed that there was only anecdotalevidence in favor of the absence of this difference.
N-back: Achieved replication power For the N-back task,the primary finding of interest in the study by Ophir et al.(2009) was that HMMs showed a significant increase in falsealarms as memory load increased across the two-back andthree-back conditions. Given that our sample sizes for theLMM and HMM groups differed (N = 10 and N = 13 forHMMs and LMMs, respectively), we decided to calculate aconservative power estimate using a sample size of 10 partic-ipants per group. The analysis in G*Power 3.1. (Faul et al.,
2007) was done with these settings: F tests, ANOVA repeatedmeasures, within–between interaction, post hoc, effect size f =.423, α = .05, number of groups = 2, number of measurements= 2, correlation among repeated measures = .5, andnonsphericity correction ε = 1. This conservative estimate ofour replication power had a value of .95, thus signifying amore than acceptable level of power for this test (e.g.,Cohen, 1992).
N-back task: Results Figure 7 shows the false-alarm rates ofLMMs and HMMs for the two-back and three-back condi-tions. In analyzing these results, we conducted a repeated-measures analysis of variance, with group (LMM vs. HMM)as a between-subjects factor and WM load (two-back vs.three-back) as a within-subjects factor. The results showedno significant main effect of WM load, F(1, 21) =.97, p =.335, ηp
2 = .044, and no main effect of group, F(1, 21) =.96, p = .338, ηp
2 =.044. More importantly, the criticalGroup × WM Load interaction also failed to reach signifi-cance, F(1, 21) = .08, p = .781, ηp
2 < .001, d = .13, CI[−0.75, 1.01], BF01 = 2.6.
Task switching: Achieved replication power For the task-switching experiment, Ophir et al. (2009) found that HMMswere significantly slower to respond on both switch and repeattrials, and that they also showed a significantly larger switchcost, defined in terms of the difference in RT between switchand repeat trials. Replication power for these three effects wascomputed in G*Power (Faul et al., 2007), with the followingsettings: settings: t tests; difference between two independentmeans; post hoc; one-tail; effect size d = .97 for switch RT, .83for repeat RT, and .96 for switch cost; α = .05; Ngroup1 = 10;Ngroup2 = 13. These analyses showed that our sample size of10 HMMs and 13 LMMs yielded a power of .72, .60, and .71,respectively, for replicating Ophir et al.’s finding of a differ-ence in switch RT, repeat RT, and switch cost.
Task switching: Results The results of our task-switchingexperiment are shown in Fig. 8. An analysis of these resultsshowed that, compared to LMMs, HMMs were slower inswitch trials, t(21) = 2.0, p = .029 (one-tailed), d = .84, CI[−0.07, 1.75], BF10 = 2.84, and they had a larger switch cost,t(12.33, corrected for inequality of variance) = 2.97, p = .006(one-tailed), d = 1.35, CI [0.38, 2.32], BF10 = 20.1. However,we did not find that HMMs were also slower in the repeattrials, t(21) = 1.43, p = .083 (one-tailed), d = .60, CI [−0.29,1.49], BF01 = .72.
Discussion
In Experiment 1, we tested the replicability of the seven find-ings that we identified as being the key findings that led Ophiret al. (2009) to conclude that heavy media multitasking is
Fig. 6 Results for the AX-CPT with distractors in Experiment 1. Meanresponse times (ms) are shown for correct responses to targets (AX) andnontargets (AY, BX, and BY). Error bars represent within-groupstandard errors of the means (Morey, 2008)
Fig. 5 Change-detection performance for the condition with two targetsand zero, two, four, or six distractors in Experiment 1. Error barsrepresent within-subjects standard errors of the means (Morey, 2008)
Atten Percept Psychophys

associated with increased susceptibility to distraction. In test-ing the replicability of these findings, we copied the methodsused by Ophir et al., we used a sample size that yielded anadequate level of power (Cohen, 1992), and we used the arigorous approach to statistical analysis, such that we used acombination of power analyses, NHST, effect sizes, andBayes factors in examining the outcomes of our replicationstudy. By implication, we can assess the success versus failureof our replication studies in terms of different metrics (seealso, Open Science Collaboration, 2015).
To start, one can evaluate the results of our first replicationstudy in terms of the achieved replication power—that is, thelikelihood that we would replicate the effects of Ophir et al.,given our sample sizes, and assuming that the effects found byOphir et al. were true—and statistical significance. From thisperspective, a first point of consideration is that the results ofour power analyses showed that our tests had an average
replication power of .81, which is generally considered anacceptable level of power (Cohen, 1992), and which meansthat one would expect that if the seven effects reported byOphir et al. were true, then at least five of these seven effects(i.e., 81% of the seven effects tested) would be replicated at α= .05 in the current replication study. This turned out not to bethe case, as only three of the seven effects reached significancein our replication study. Specifically, HMMs were significant-ly slower than LMMs in responding to BX probes in the AX-CPT, they were significantly slower than LMMs inresponding on switch trials in the task-switching experiment,and they showed a larger switch cost than LMMs in the task-switching experiment. On the other hand, we did not find asignificant difference in response times on AX trials in theAX-CPT, we did not find a difference in false alarms in theN-back task, we did not find a difference in vulnerability todistraction in the change-detection task, and we also did notfind a difference in response times on repeat trials in the task-switching experiment.
When evaluating the results of our replication study on thebasis of Bayes factors, we find that only one of the threestatistically significant effects—the finding of a greater switchcost in HMMs—was based on strong evidence, whereas theeffects for response times on BX trials in the AX-CPT, and forswitch trials in the task-switching experiment were based ononly anecdotal evidence. Importantly, however, the Bayes fac-tors also showed that only one of the four nonsignificant ef-fects yielded moderate evidence in favor of the null hypothe-sis, and this concerned the absence of an interaction effect ofmedia multitasking and distractor set size in the change detec-tion task. Thus, according to the Bayesian analyses, our rep-lication attempt was largely indecisive, as only two of theseven effects of interest produced clear evidence for the pres-ence or absence of an effect.
Moving beyond the binary diagnosis of the presence versusabsence of effects in terms of statistical significance or BF > 3,we can also evaluate the outcomes of our replication study byconsidering the corresponding effect sizes and their confi-dence intervals. This evaluation moves beyond the diagnosisof presence versus absence of effects, as it sheds light on thestrength of these effects. When comparing the effect sizes weobtained in our seven replication tests to those found by Ophiret al. (see Fig. 9), we find that the average effect size for thereplication tests was markedly lower than the average size ofthese effects in Ophir et al. (M = 0.55, SD = .51 vs.M = 0.95,SD = .19, respectively). At the same time, however, all of theeffects found by Ophir et al. fell within the 95% confidenceinterval of the replication effect sizes, and, except for the out-come of the change-detection task, all other replication testsyielded evidence for an effect in the same direction as theeffects found by Ophir et al. Thus, when considering effectsize, the results of our first replication study can be said toconform largely to the outcomes of Ophir et al., with the
Fig. 8 Results for the task-switching experiment in Experiment 1. Meanresponse time (ms) is shown for correct responses on switch and repeattrials, for HMMs and LMMs separately. Error bars represent within-group standard errors of the means
Fig. 7 Results N-back task. False alarm rates are plotted as a function ofWM load (two-back vs. three-back) and Group (LMM vs. HMM). Errorbars represent within-group standard errors of the means (Morey, 2008)
Atten Percept Psychophys
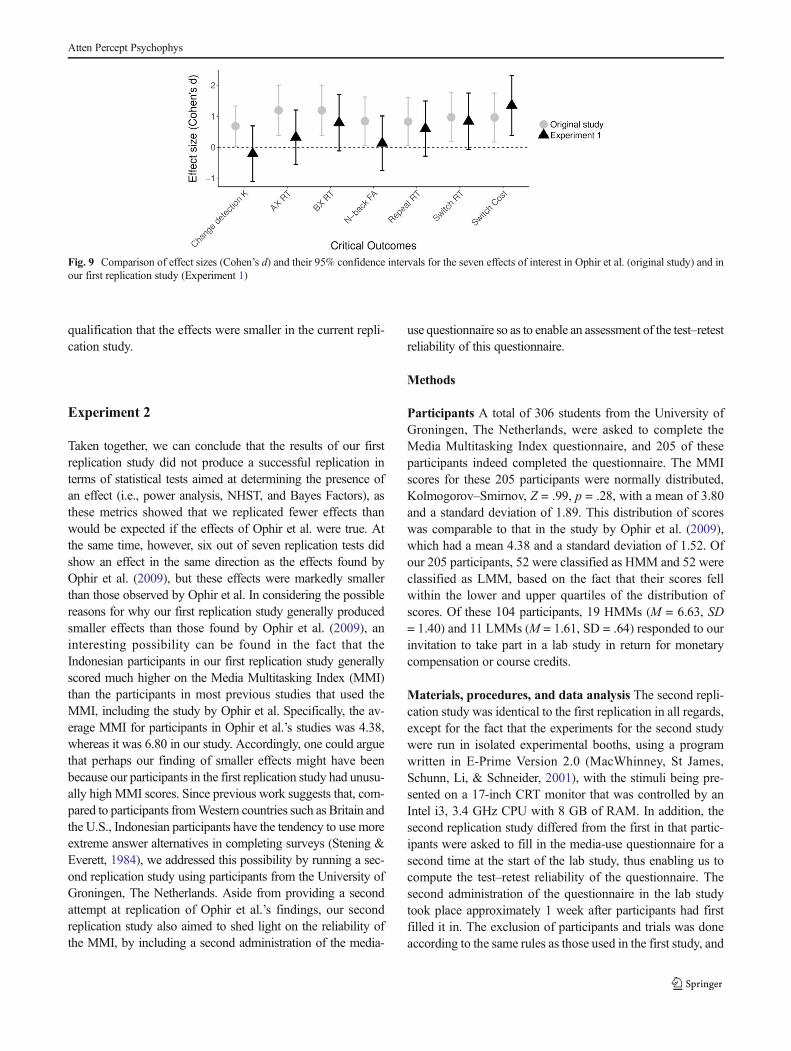
qualification that the effects were smaller in the current repli-cation study.
Experiment 2
Taken together, we can conclude that the results of our firstreplication study did not produce a successful replication interms of statistical tests aimed at determining the presence ofan effect (i.e., power analysis, NHST, and Bayes Factors), asthese metrics showed that we replicated fewer effects thanwould be expected if the effects of Ophir et al. were true. Atthe same time, however, six out of seven replication tests didshow an effect in the same direction as the effects found byOphir et al. (2009), but these effects were markedly smallerthan those observed by Ophir et al. In considering the possiblereasons for why our first replication study generally producedsmaller effects than those found by Ophir et al. (2009), aninteresting possibility can be found in the fact that theIndonesian participants in our first replication study generallyscored much higher on the Media Multitasking Index (MMI)than the participants in most previous studies that used theMMI, including the study by Ophir et al. Specifically, the av-erage MMI for participants in Ophir et al.’s studies was 4.38,whereas it was 6.80 in our study. Accordingly, one could arguethat perhaps our finding of smaller effects might have beenbecause our participants in the first replication study had unusu-ally high MMI scores. Since previous work suggests that, com-pared to participants fromWestern countries such as Britain andthe U.S., Indonesian participants have the tendency to use moreextreme answer alternatives in completing surveys (Stening &Everett, 1984), we addressed this possibility by running a sec-ond replication study using participants from the University ofGroningen, The Netherlands. Aside from providing a secondattempt at replication of Ophir et al.’s findings, our secondreplication study also aimed to shed light on the reliability ofthe MMI, by including a second administration of the media-
use questionnaire so as to enable an assessment of the test–retestreliability of this questionnaire.
Methods
Participants A total of 306 students from the University ofGroningen, The Netherlands, were asked to complete theMedia Multitasking Index questionnaire, and 205 of theseparticipants indeed completed the questionnaire. The MMIscores for these 205 participants were normally distributed,Kolmogorov–Smirnov, Z = .99, p = .28, with a mean of 3.80and a standard deviation of 1.89. This distribution of scoreswas comparable to that in the study by Ophir et al. (2009),which had a mean 4.38 and a standard deviation of 1.52. Ofour 205 participants, 52 were classified as HMM and 52 wereclassified as LMM, based on the fact that their scores fellwithin the lower and upper quartiles of the distribution ofscores. Of these 104 participants, 19 HMMs (M = 6.63, SD= 1.40) and 11 LMMs (M = 1.61, SD = .64) responded to ourinvitation to take part in a lab study in return for monetarycompensation or course credits.
Materials, procedures, and data analysis The second repli-cation study was identical to the first replication in all regards,except for the fact that the experiments for the second studywere run in isolated experimental booths, using a programwritten in E-Prime Version 2.0 (MacWhinney, St James,Schunn, Li, & Schneider, 2001), with the stimuli being pre-sented on a 17-inch CRT monitor that was controlled by anIntel i3, 3.4 GHz CPU with 8 GB of RAM. In addition, thesecond replication study differed from the first in that partic-ipants were asked to fill in the media-use questionnaire for asecond time at the start of the lab study, thus enabling us tocompute the test–retest reliability of the questionnaire. Thesecond administration of the questionnaire in the lab studytook place approximately 1 week after participants had firstfilled it in. The exclusion of participants and trials was doneaccording to the same rules as those used in the first study, and
Fig. 9 Comparison of effect sizes (Cohen’s d) and their 95% confidence intervals for the seven effects of interest in Ophir et al. (original study) and inour first replication study (Experiment 1)
Atten Percept Psychophys
the exclusion of participants and trials is described in detail perexperiment in the following sections.
Results
Test–retest reliability of the MMI To determine the reliabil-ity of the MMI, we computed the test–retest correlation for theparticipants who took part in the lab study. This analysisshowed that the correlation between the repeated administra-tions of the questionnaire was high, with r(28) = .93, p < .01.
Change-detection task: Achieved replication power For thechange-detection task, we had to remove one participant fromthe HMM group due to chance-level performance, thus yield-ing a final sample size of 18 HMMs and 11 LMMs. To calcu-late our power for replicating Ophir et al.’s (2009) finding ofan interaction between media multitasking and distractor setsize, we entered a sample size of 2 × 11 = 22 into G*Power3.1. (Faul et al., 2007), with the following settings: F tests,ANOVA repeated measures, within–between interaction, posthoc, effect size f = .344, α = .05, number of groups = 2,number of measurements = 4, correlation among repeatedmeasures = .5, and nonsphericity correction ε = 1. This calcu-lation showed that our sample size for the change-detectiontask yielded a replication power of .97 for finding the Group ×Distractor Set Size interaction effect reported by Ophir et al.
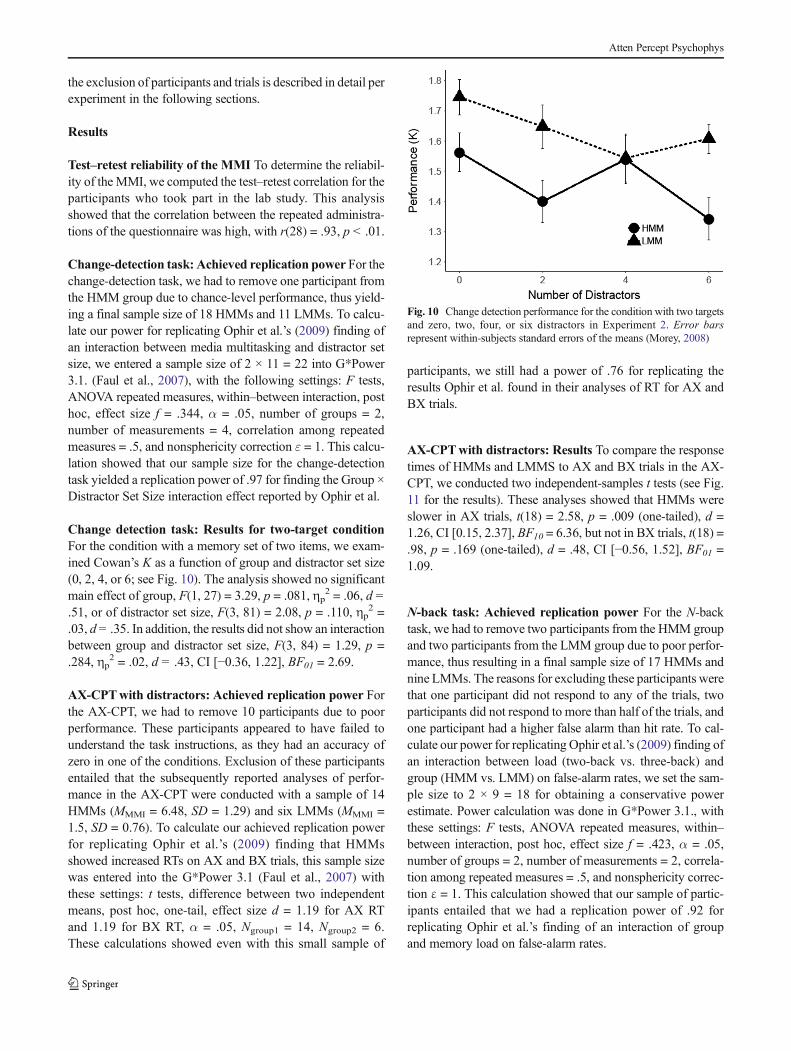
Change detection task: Results for two-target conditionFor the condition with a memory set of two items, we exam-ined Cowan’s K as a function of group and distractor set size(0, 2, 4, or 6; see Fig. 10). The analysis showed no significantmain effect of group, F(1, 27) = 3.29, p = .081, ηp
2 = .06, d =.51, or of distractor set size, F(3, 81) = 2.08, p = .110, ηp
2 =.03, d = .35. In addition, the results did not show an interactionbetween group and distractor set size, F(3, 84) = 1.29, p =.284, ηp
2 = .02, d = .43, CI [−0.36, 1.22], BF01 = 2.69.
AX-CPTwith distractors: Achieved replication power Forthe AX-CPT, we had to remove 10 participants due to poorperformance. These participants appeared to have failed tounderstand the task instructions, as they had an accuracy ofzero in one of the conditions. Exclusion of these participantsentailed that the subsequently reported analyses of perfor-mance in the AX-CPT were conducted with a sample of 14HMMs (MMMI = 6.48, SD = 1.29) and six LMMs (MMMI =1.5, SD = 0.76). To calculate our achieved replication powerfor replicating Ophir et al.’s (2009) finding that HMMsshowed increased RTs on AX and BX trials, this sample sizewas entered into the G*Power 3.1 (Faul et al., 2007) withthese settings: t tests, difference between two independentmeans, post hoc, one-tail, effect size d = 1.19 for AX RTand 1.19 for BX RT, α = .05, Ngroup1 = 14, Ngroup2 = 6.These calculations showed even with this small sample of
participants, we still had a power of .76 for replicating theresults Ophir et al. found in their analyses of RT for AX andBX trials.
AX-CPTwith distractors: Results To compare the responsetimes of HMMs and LMMS to AX and BX trials in the AX-CPT, we conducted two independent-samples t tests (see Fig.11 for the results). These analyses showed that HMMs wereslower in AX trials, t(18) = 2.58, p = .009 (one-tailed), d =1.26, CI [0.15, 2.37], BF10 = 6.36, but not in BX trials, t(18) =.98, p = .169 (one-tailed), d = .48, CI [−0.56, 1.52], BF01 =1.09.
N-back task: Achieved replication power For the N-backtask, we had to remove two participants from the HMM groupand two participants from the LMM group due to poor perfor-mance, thus resulting in a final sample size of 17 HMMs andnine LMMs. The reasons for excluding these participants werethat one participant did not respond to any of the trials, twoparticipants did not respond to more than half of the trials, andone participant had a higher false alarm than hit rate. To cal-culate our power for replicating Ophir et al.’s (2009) finding ofan interaction between load (two-back vs. three-back) andgroup (HMM vs. LMM) on false-alarm rates, we set the sam-ple size to 2 × 9 = 18 for obtaining a conservative powerestimate. Power calculation was done in G*Power 3.1., withthese settings: F tests, ANOVA repeated measures, within–between interaction, post hoc, effect size f = .423, α = .05,number of groups = 2, number of measurements = 2, correla-tion among repeated measures = .5, and nonsphericity correc-tion ε = 1. This calculation showed that our sample of partic-ipants entailed that we had a replication power of .92 forreplicating Ophir et al.’s finding of an interaction of groupand memory load on false-alarm rates.
Fig. 10 Change detection performance for the condition with two targetsand zero, two, four, or six distractors in Experiment 2. Error barsrepresent within-subjects standard errors of the means (Morey, 2008)
Atten Percept Psychophys

N-back task: ResultsAn analysis of the false-alarm rates (seeFig. 12) as a function of group (HMMvs. LMM) and memoryload (two-back vs. three-back) showed no significant maineffect of WM Load, F(1, 24) = 3.38, p = .078, ηp
2 = .123,and no main effect of group, F(1, 24) = .003, p = .954, ηp
2 <.001. In addition, the interaction of Group × WM Load failedto reach significance, F(1, 24) < .001, p = .982, ηp
2 < .01, d<.01, CI [−0.85, 0.85], BF01 = 2.46.
Task switching: Achieved replication power To calculateour power for replicating Ophir et al.’s (2009) findings thatHMMs showed larger switch costs and higher RTs on repeatand switch trials for the task-switching experiment, we enteredour sample size of 19 HMMs and 11 LMMs into G*Power3.1. (Faul et al., 2007), using these settings: t tests; differencebetween two independent means; post hoc; one-tail; effect sized = .97 for switch RT, .83 for repeat RT, and .96 for switchcost; α = .05; Ngroup1 = 19; Ngroup2 = 11. These calculationsshowed that our sample yielded replication powers of .80, .69,and .79, for the effects Ophir et al. found for switch RT, repeatRT, and switch cost, respectively.
Task switching: Results The results for the task-switchingexperiment are shown in Fig. 13. The analyses showed thatHMMs were significantly slower than LMMs in switch trials,t(28) = 1.73, p = .047 (one-tailed), d = .66. CI [−0.14, 1.46],BF10 = 1.93. The analyses of switch costs and response timeson repeat trials showed no statistically significant difference,
with t(28) = 1.21, p = .117 (one-tailed), d = .46, CI [−0.33,1.25], BF01 = 0.95, and t(28) = 1.66, p = .054 (one-tailed), d =.63, CI [−0.16, 142], BF01 = 1.79.
Discussion
Aside from demonstrating that the MMI has a high test–retestreliability (see also, Baumgartner, Lemmens, Weeda, &Huizinga, 2016), the results from our second replication studylargely conform to those obtained in our first replication study.Specifically, our tests of the replicability of Ophir et al.’s(2009) main findings had an average replication power of.81, yet only two out of seven findings yielded a statisticallysignificant outcome in the same direction as that found byOphir et al. Specifically, HMMs were slower in AX trials ofthe AX-CPT task and they were slower than LMMs on switchtrials. In terms of Bayes factors, our analyses showed that thedifference in AX trials was based on moderately strong evi-dence, whereas the difference on switch trials was based ononly anecdotal evidence. In addition, the BFs showed that allof the nonsignificant effects involved only anecdotal evidencein favor of the null hypothesis. As for the effect sizes (see Fig.14), the results of our second replication study showed that alleffects were in the same direction as those found by Ophiret al., with HMMs performing worse than LMMs. However,as in our first replication study, the effects in the second rep-lication study were again smaller than those found by Ophiret al. (with M = 0.56, SD = .37 vs. M = 0.95, SD = .19,respectively). Accordingly, it can be concluded that the resultsof our second replication generally conform to those of ourfirst replication study in suggesting that while HMMs mayindeed perform worse than LMMs on various tests of distract-ibility, the magnitude of these differences is smaller than theeffects found by Ophir et al.
0 For the study by Cardoso-Leite et al. (2016), we could not include the effectfor AX-RT, because these authors only reported an analysis for the average RTon AX and BX trials. Since both types of trials can be assumed to measure thesame kind of distractibility effect (cf. Ophir et al., 2009), we included Cardoso-Leite et al.’s effect for average RT in our analysis.
Fig. 11 Results for the AX-CPTwith distractors in Experiment 2. Meanresponse times (ms) are shown for correct responses to AX and BX trials.Error bars represent within-group standard errors of the means (Morey,2008)
Fig. 12 Results N-back. False-alarm rates are plotted as a function ofWM load (two-back vs. three-back) and group (LMM vs. HMM). Errorbars represent within-group standard errors of the means (Morey, 2008)
Atten Percept Psychophys

Meta-analysis
Taken together, the results of our replication studies can besaid to provide only partial support for the existence of anMMI–distractibility link, as the majority of our significancetests and Bayes factors analyses did not yield convincing sup-port for the existence of this link, but the outcomes did gen-erally show effects in the same direction as those found byOphir et al. (2009). As a final step in our examination of theMMI–distractibility link, we aimed to arrive at a proper esti-mate of the strength of the relationship between media multi-tasking and distractibility in laboratory tests of informationprocessing. To this end, we conducted a meta-analysis thatincluded the results of the current replication studies alongwith those of all previous studies that have used similar labo-ratory tasks to investigate the relationship betweenmedia mul-titasking and distractibility, including the seminal study byOphir et al. (2009). By calculating a weighted mean effect sizeon the basis of the results of all studies done to date, thisanalysis can provide the most sensitive and powerful test of
the existence and strength of the MMI–distractibility link. Inaddition, we also made use of moderator analyses to deter-mine whether the MMI–distractibility link differed across cer-tain subsets of tasks or participants, and we used meta-analytical tools to diagnose and correct for the presence ofany small-study effects (i.e., the influence of the presence ofrelatively many small studies that showed large, positiveeffects, and relatively few, similarly small studies withnegative or null effects; Duval & Tweedie, 2000; Egger,Davey Smith, Schneider, & Minder, 1997; Peters, Sutton,Jones, Abrams, & Rushton, 2007; Sterne et al., 2011;Thompson & Sharp, 1999).
Methods
Criteria for study inclusion We aimed to include all pub-lished studies that examined the relationship between mediamultitasking and distractibility in laboratory tasks such asthose used in the original study by Ophir et al. (2009).Accordingly, our inclusion criteria for the meta-analysis werethat the study in question should include a statistical test of thisrelationship, either in the form of a between-groups compari-son of LMMs and HMMs, or in the form of a correlationbetween media multitasking and performance on one or morelaboratory tests of distractibility in information processing. Indetermining which tasks can be considered to provide an in-dex of distractibility, we adopted a categorization and defini-tion of distractibility similar to that used by Ophir et al. in theirinterpretation of their findings. Specifically, we selected tasksin which participants were asked to respond to target stimulithat were presented under conditions in which distractioncould either be caused by irrelevant stimuli that were present-ed simultaneously or before or after the target in a particulartrial (environmental distraction), or by irrelevant stimuli heldin memory (memory-based distraction), or by an irrelevant,previously used task set (task-set distraction). Accordingly,any task that involved the sequential or simultaneous presen-tation of one or more targets and one or more distractorswould be considered an index for vulnerability to
Fig. 14 Overview of the results of our second replication study. Effect sizes (Cohen’s d) and their 95% confidence intervals are shown for the seveneffects of interest in Ophir et al. (original study) and in our second replication study (Experiment 2)
Fig. 13 Results for the task-switching experiment in Experiment 2.Mean response time (ms) is shown for correct responses on switch andrepeat trials, for HMMs and LMMs separately. Error bars representwithin-group standard errors of the means
Atten Percept Psychophys

environmental distraction, whereas any task that involved thepossibility of distraction from previously memorized stimuliwould be considered an index of vulnerability to memory-based distraction, and any task that involved a comparisonof performance with or without a task-switch would be con-sidered as an index of distraction caused by a previously usedtask set.
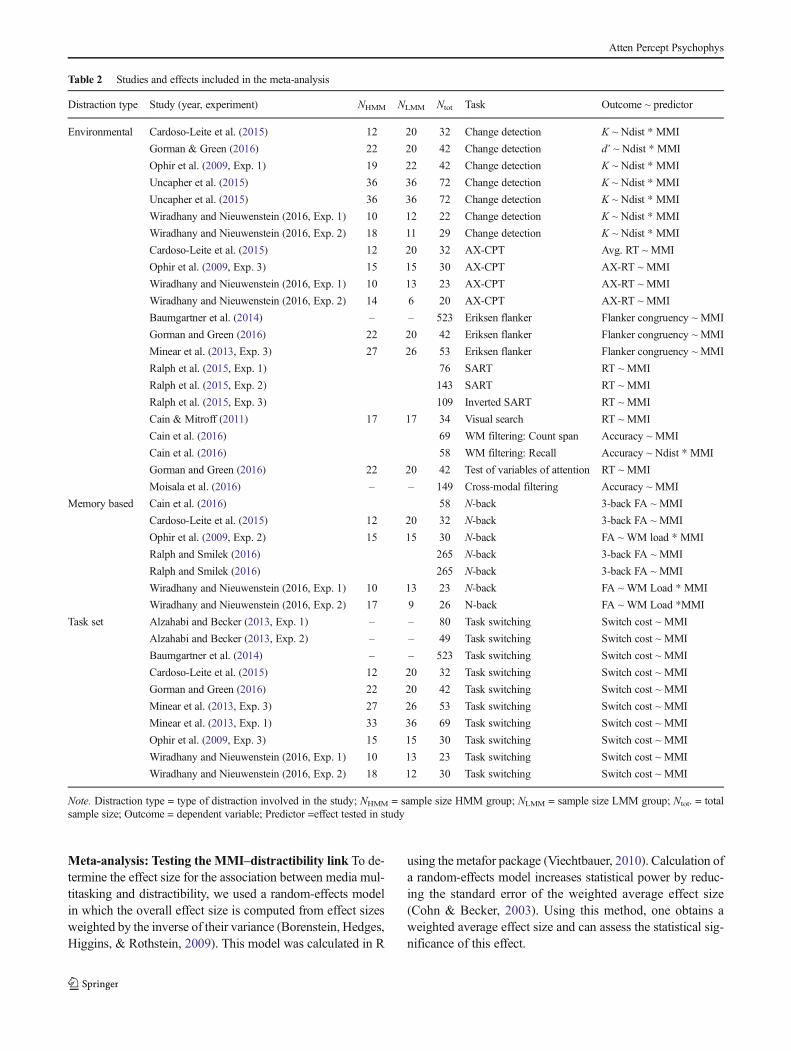
Literature search and studies included The search for stud-ies on the relationship between media multitasking and dis-tractibility was done using the PsycInfo, ERIC, Medline, andCMMC databases, with a combination of the following key-words: media multitasking* AND (cognitive control* ORworking memory* OR attention*). This search yielded a totalof 40 published articles, of which 12 included one or moreexperiments that met our selection criteria (Alzahabi &Becker, 2013; Baumgartner et al., 2014; Cain et al., 2016;Cain & Mitroff, 2011; Cardoso-Leite et al., 2015; Gorman &Green, 2016; Minear et al., 2013; Moisala et al., 2016; Ophiret al., 2009; Ralph & Smilek, 2016; Ralph, Thomson, Seli,Carriere, & Smilek, 2015; Uncapher et al., 2015). Aside fromthese published studies, we also included the effect sizes fromExperiments 1 and 2 of the current study. These studies arelisted in Table 2, along with the type of task that was used inthe study, the type of distraction that was involved in this task,and the distractibility effect that was used for computing theeffect size.
Selection of outcome variables In selecting the outcomes forinclusion in our meta-analysis, we chose to avoid the intrica-cies involved in modeling multilevel dependencies that wouldexist due to the varying strengths of correlations between out-comes obtained from different trial types in the same task (i.e.,RTs for AX and BX trials, switch costs and RTs for switch andrepeat trials in a task-switching experiment) and between out-comes obtained on different tasks for the same sample ofparticipants (e.g., distractibility in the N-back task and dis-tractibility in the change-detection task). To this end, we choseto select one outcome per task, and we used a procedure forrobust variance estimation to correct for variance inflationstemming from the inclusion of correlated observations fordifferent tasks done by the same participants (Hedges,Tipton, & Johnson, 2010; Scammacca, Roberts, & Stuebing,2014).
Specifically, for the AX-CPT, we chose to include the re-sponse times for AX trials, as this type of trial can be consid-ered a more reliable index of performance because it occursmore frequently in the task than the BX trials.3 For studies on
task switching, we reasoned that, compared to RTs on switchand repeat trials, the switch cost constitutes the most straight-forward index of interference caused by a previously used taskset, and hence we chose to only the switch cost, and not theaverage RTs on switch or repeat trials.
For studies using different tasks than those used by Ophiret al. (2009), we selected the outcome measure that bestreflected the participant’s performance in the presence of en-vironmental, memory-based, or task-set based distraction.Specifically, for the Sustained Attention to Response Task(SART; Ralph et al., 2015) and Test of Variables ofAttention (TOVA; Gorman & Green, 2016) we used responsetimes to targets that were shown in a sequence of distractors.Likewise, for studies using the Eriksen flanker task(Baumgartner et al., 2014; Gorman & Green, 2016; Minearet al., 2013), we chose to use the flanker congruency effect forresponse times to the target, which reflects the difference inRTs when targets are flanked by congruent or incongruentdistractors, with larger congruency effects being indicativeof greater vulnerability to distraction. For the cross-modalfiltering task used by Moisala et al. (2016), we used the cor-relation between the MMI and accuracy in conditions inwhich distractors were presented in a different sensory modal-ity than the targets. For the count-span and working-memoryfiltering tasks of Cain et al. (2016), we used recall perfor-mance for conditions in which the to-be-remembered targetswere shown together with distractors. Lastly, for the visual-search task used by Cain and Mitroff (2011), we included theresults for a test of an interaction effect of the presence vs.absence of a singleton distractor and group (HMM vs. LMM).
Effect-size calculation Effect sizes were calculated in term ofCohen’s d (Cohen, 1988, 1992), with positive values denotingevidence for greater vulnerability to distraction in HMMs andnegative values denoting an effect in opposite direction. Incase of comparisons involving a within-group factor, such asthe change detection task with different numbers ofdistractors, we first calculated partial eta squared using theequation below (Cohen, 1988; Lakens, 2013):
η2P ¼ F � df effectF � df effect þ df error
:
Assuming a minimum variability in the repeated measures,the partial eta squared was then transformed into a standard-ized mean difference using the equation (see Cohen, 1988):
d ¼ffiffiffiffiffiffiffiffiffiffiffiffiffiffiffiffiffiffiffiffiffi
η2P1−η2P
� 2k
s
;
with k denoting the number of between-group levels.
3 For the study by Cardoso-Leite et al. (2015), we could not include the effectfor AX-RT, because these authors only reported an analysis for the average RTon AX and BX trials. Since both types of trials can be assumed to measure thesame kind of distractibility effect (cf. Ophir et al., 2009), we included Cardoso-Leite et al.’s effect for average RT in our analysis.
Atten Percept Psychophys
Meta-analysis: Testing the MMI–distractibility link To de-termine the effect size for the association between media mul-titasking and distractibility, we used a random-effects modelin which the overall effect size is computed from effect sizesweighted by the inverse of their variance (Borenstein, Hedges,Higgins, & Rothstein, 2009). This model was calculated in R
using the metafor package (Viechtbauer, 2010). Calculation ofa random-effects model increases statistical power by reduc-ing the standard error of the weighted average effect size(Cohn & Becker, 2003). Using this method, one obtains aweighted average effect size and can assess the statistical sig-nificance of this effect.
Table 2 Studies and effects included in the meta-analysis
Distraction type Study (year, experiment) NHMM NLMM Ntot Task Outcome ~ predictor
Environmental Cardoso-Leite et al. (2015) 12 20 32 Change detection K ~ Ndist * MMI
Gorman & Green (2016) 22 20 42 Change detection d’ ~ Ndist * MMI
Ophir et al. (2009, Exp. 1) 19 22 42 Change detection K ~ Ndist * MMI
Uncapher et al. (2015) 36 36 72 Change detection K ~ Ndist * MMI
Uncapher et al. (2015) 36 36 72 Change detection K ~ Ndist * MMI
Wiradhany and Nieuwenstein (2016, Exp. 1) 10 12 22 Change detection K ~ Ndist * MMI
Wiradhany and Nieuwenstein (2016, Exp. 2) 18 11 29 Change detection K ~ Ndist * MMI
Cardoso-Leite et al. (2015) 12 20 32 AX-CPT Avg. RT ~ MMI
Ophir et al. (2009, Exp. 3) 15 15 30 AX-CPT AX-RT ~ MMI
Wiradhany and Nieuwenstein (2016, Exp. 1) 10 13 23 AX-CPT AX-RT ~ MMI
Wiradhany and Nieuwenstein (2016, Exp. 2) 14 6 20 AX-CPT AX-RT ~ MMI
Baumgartner et al. (2014) – – 523 Eriksen flanker Flanker congruency ~ MMI
Gorman and Green (2016) 22 20 42 Eriksen flanker Flanker congruency ~ MMI
Minear et al. (2013, Exp. 3) 27 26 53 Eriksen flanker Flanker congruency ~ MMI
Ralph et al. (2015, Exp. 1) 76 SART RT ~ MMI
Ralph et al. (2015, Exp. 2) 143 SART RT ~ MMI
Ralph et al. (2015, Exp. 3) 109 Inverted SART RT ~ MMI
Cain & Mitroff (2011) 17 17 34 Visual search RT ~ MMI
Cain et al. (2016) 69 WM filtering: Count span Accuracy ~ MMI
Cain et al. (2016) 58 WM filtering: Recall Accuracy ~ Ndist * MMI
Gorman and Green (2016) 22 20 42 Test of variables of attention RT ~ MMI
Moisala et al. (2016) – – 149 Cross-modal filtering Accuracy ~ MMI
Memory based Cain et al. (2016) 58 N-back 3-back FA ~ MMI
Cardoso-Leite et al. (2015) 12 20 32 N-back 3-back FA ~ MMI
Ophir et al. (2009, Exp. 2) 15 15 30 N-back FA ~ WM load * MMI
Ralph and Smilek (2016) 265 N-back 3-back FA ~ MMI
Ralph and Smilek (2016) 265 N-back 3-back FA ~ MMI
Wiradhany and Nieuwenstein (2016, Exp. 1) 10 13 23 N-back FA ~ WM Load * MMI
Wiradhany and Nieuwenstein (2016, Exp. 2) 17 9 26 N-back FA ~ WM Load *MMI
Task set Alzahabi and Becker (2013, Exp. 1) – – 80 Task switching Switch cost ~ MMI
Alzahabi and Becker (2013, Exp. 2) – – 49 Task switching Switch cost ~ MMI
Baumgartner et al. (2014) – – 523 Task switching Switch cost ~ MMI
Cardoso-Leite et al. (2015) 12 20 32 Task switching Switch cost ~ MMI
Gorman and Green (2016) 22 20 42 Task switching Switch cost ~ MMI
Minear et al. (2013, Exp. 3) 27 26 53 Task switching Switch cost ~ MMI
Minear et al. (2013, Exp. 1) 33 36 69 Task switching Switch cost ~ MMI
Ophir et al. (2009, Exp. 3) 15 15 30 Task switching Switch cost ~ MMI
Wiradhany and Nieuwenstein (2016, Exp. 1) 10 13 23 Task switching Switch cost ~ MMI
Wiradhany and Nieuwenstein (2016, Exp. 2) 18 12 30 Task switching Switch cost ~ MMI
Note. Distraction type = type of distraction involved in the study; NHMM = sample size HMM group; NLMM = sample size LMM group; Ntot. = totalsample size; Outcome = dependent variable; Predictor =effect tested in study
Atten Percept Psychophys

Moderator analyses Aside from examining the strength andsignificance of the association between media multitaskingand distractibility across all studies included in the meta-anal-ysis, we also examined whether the strength of this link wasdifferent for studies employing tasks with different types ofdistraction, for studies using different populations of partici-pants, and for studies employing different statistical methodsin assessing the association between media multitasking anddistractibility. Specifically, we conducted three moderatoranalyses. In the first, we examined whether the results weredifferent for tasks involving environmental, memory-based, ortask-set distraction. In the second, we examined if the resultswere different depending on whether the study participantswere adolescents, university students, or people from the gen-eral population. In the third, we examined if the results weredifferent for studies in which the MMI–distractibility link wastested using either a correlational approach (i.e., resulting in acorrelation coefficient that expresses the relationship betweendistractibility and the participants’ scores on a questionnairemeasure of media multitasking), or an extreme-groups com-parison based on cutoffs determined by either quartile scoresor a criterion based on the standard deviation.
Tests and corrections for small-study effects Lastly, we alsoexamined whether the outcomes of the meta-analysis wereinfluenced by small-study effects (Carter & McCullough,2014; Duval & Tweedie, 2000; Egger et al., 1997; Peterset al., 2007; Sterne et al., 2011; Thompson & Sharp, 1999).Such effects are said to be present when the outcome of ameta-analysis is influenced by the inclusion of relativelymanysmall-sample studies showing large, positive effects and rela-tively few small-sample studies showing negative or null ef-fects. This state of affairs is typically interpreted as evidencefor a reporting bias, such that researchers might refrain fromattempting to publish small-sample studies showing negativeor nonsignificant outcomes, and journals might likewise re-frain from accepting such studies for publication.Alternatively, small-study effects can also arise due to trueheterogeneity in case the small-sample studies not only differfrom the larger studies in terms of sample size but also in termsof certain methodological aspects (e.g., Sterne, Gavaghan, &Egger, 2000). Accordingly, an interpretation of the presence ofsmall-study effects requires a consideration of whether thestudies employing large and small sample sizes differed interms of certain methodological aspects, and whether the dis-tribution of study effect sizes shows a preponderance of small-sample studies with positive, significant effects and an ab-sence of similarly small studies showing negative or nonsig-nificant effects.
To evaluate the presence of small-study effects, we con-structed used a contour-enhanced funnel plot in which effectsizes were plotted against a measure of their precision (i.e.,standard error; Egger et al., 1997; Sterne et al., 2011; Sterne &
Egger, 2001), and in which areas of statistical significance (p< .05) were highlighted (Peters et al., 2007; see also Carter &McCullough, 2014; Nieuwenstein, Blom, Morey, &Wicherts,2015). In such a plot, the presence of small-study effects canbe judged by determining whether the effect sizes of smallerstudies with lower precision are distributed symmetricallyaround the estimate of the mean effect size, as would be ex-pected when these effects are sampled from a distributioncentered on the estimated mean effect size. Furthermore, byhighlighting the areas of statistical significance, one can judgewhether the studies that appear to be missing are studies thatwould have been expected to produce nonsignificant or nulleffects, thus allowing for an evaluation of whether the asym-metry might be due to a reporting bias (as opposed to trueheterogeneity caused by differences in the design of smallerand larger studies; Peters et al., 2007). In addition to visualinspection, we also performed a regression analysis in whichthe standard errors of the effect sizes are used as a predictor forthe effect size (Egger et al., 1997), thus offering a means toverify the presence of funnel-plot asymmetry in terms of thestatistical significance of the association between effect sizesand study precision.
When small-study effects are found that are suggestive of areporting bias, one should correct the estimated overall effectsize for this bias. To this end, one can use the regressionanalysis to estimate the effect size of a study with maximalprecision (i.e., an extrapolation to a study with a standard errorof zerp; Moreno et al., 2009), or one can apply the so-calledtrim-and-fill procedure to fill in any effects that appear tomissing in the asymmetrical funnel plot (Duval & Tweedie,2000). While there is ongoing debate about whether theseprocedures lead to a proper overall estimate of effect size,there is consensus that these procedures can be used as sensi-tivity tests to determine the extent to which the outcome of ameta-analysis is dependent on the presence of small-studyeffects. Accordingly, we planned to conduct these correctiveprocedures in case an asymmetry suggestive of reporting biaswas present, thus allowing for a further evaluation of the ex-istence and strength of the association between media multi-tasking and distractibility.
Results
Forest plot and results random-effect model Figure 15shows a forest plot with the effect sizes that were included inthe meta-analysis. The effect sizes are grouped by the type ofdistraction that was involved in the task (environmental, mem-ory based, or task set), and the effects that were found byOphir et al. (2009) are listed first for each type of distraction.This visualization of effects shows that the majority of studiesinvestigating the association between media multitasking anddistractibility link yielded nonsignificant results, as the confi-dence intervals for the majority of effects included zero. To
Atten Percept Psychophys

estimate the mean effect size, we conducted a meta-analysisusing a random-effects model. The results of this analysisshowed a small but significant, positive association betweenmedia multitasking and distractibility, with d = .17, 95% CI[.165, .173], p = .007, one-tailed. At the same time, however,the analysis also made clear that there was significant hetero-geneity amongst the effects in the analysis, I2 = 57.02%, p <.0001.
Moderator analyses To determine if the heterogeneity of theeffects of different studies can be explained in terms of differ-ences between studies examining different types of distracti-bility, populations of participants, or methods of analyses, weconducted three moderator analyses. These analyses revealedthat there were no differences between studies examining dif-ferent types of distractibility, participants from different pop-ulations, or different methods of analysis, with F(2, 36) =1.11, p = .342, F(2, 36) = .29, p = .745, and F(2, 36) = 2.81,p = .074, respectively.
Funnel plot and small-study effects Next, we examinedwhether the data set showed evidence for small-study effects.
To this end, we constructed a funnel plot in which effect sizesare plotted as a function of their standard error, and in whichthe areas of statistical significance (p < .05) were highlighted.In the absence of small-study effects, this plot should form asymmetrical funnel distribution of effect sizes around themean effect size. As can be seen in Fig. 16a, however, thedistribution is clearly asymmetrical, with a preponderance ofsmall sample (large SE) studies showing large, positive ef-fects, and a relative lack of similarly imprecise studies show-ing effects on the other side of the mean effect size. As aformal verification of this impression, we conducted Egger’stest (Egger et al., 1997) to examine the relationship betweeneffect sizes and standard errors. This test showed that thisrelationship was significant, Z = 2.83, p = .005, thusunderscoring the presence of funnel plot asymmetry.
In interpreting the asymmetrical distribution of small-sample studies, it is important to note that the studies thatappear to be missing on the lower left side of the funnel arestudies that would be expected to have yielded either nonsig-nificant or negative results. This observation is indicative ofreporting bias, as the asymmetry appears to be associated withthe direction and significance of outcomes (Carter &
Fig. 15 Forest plot of the effect sizes (Cohen’s d) for studies included inthe meta-analysis. Studies are grouped according to the type of distractionthat was involved in the task, with 1 denoting environmental distraction, 2denoting memory-based distraction, and 3 denoting distraction caused by
a previously used task set in a task-switching experiment. Error barsrepresent 95% confidence interval of the effect size. RT =: responsetimes; FA = false alarm rate; CPT = continuous performance task;TOVA = Test of Variables of Attention
Atten Percept Psychophys

McCullough, 2014; Peters et al., 2007). Furthermore, it alsoseems unlikely that the asymmetry can be explained in termsof true heterogeneity between studies, as our moderator anal-yses made clear that this heterogeneity could not be explainedin terms of differences between tasks, study populations, ormethods of analysis. Accordingly, it seems possible that thereason for the asymmetrical distribution of small studies couldbe reporting bias, thus warranting further corrective proce-dures to determine what the estimated effect size would bewhen this bias is corrected for. To do so, we performed twocorrective procedures. First, we used the trim-and-fill proce-dure to impute the ostensibly missing effects on the left side ofthe funnel and to recalculate the overall effect size (Duval &Tweedie, 2000). This analysis showed that the associationbetween media multitasking and distractibility turned nonsig-nificant after correction, with Cohen’s d = .07, and p = .81 (seeFig. 16b). Secondly, we used a regression-based method thathas been deemed more suitable for data sets with relativelyhigh heterogeneity, as is true for the current dataset (Morenoet al., 2009). With this method, we estimated the expectedeffect size for a study with a standard error of zero. The resultsof this analysis corroborated the outcome of the trim and fillprocedure in that it yielded an effect size of Cohen’s d = .001.Taken together, these results make clear that the earlier esti-mated effect size was strongly influenced by the presence ofsmall-study effects, such that the small but significant associ-ation turned nonsignificant after correction for these effects.4
General discussion
In a pioneering study, Ophir et al. (2009) found that peoplewith higher scores on a questionnaire measure of media mul-titasking show an increased susceptibility to distraction in var-ious laboratory tasks of information processing. While subse-quent studies did show associations between media multitask-ing and various outcome measures other than those used byOphir et al., they generally failed to replicate the original find-ings, thus casting doubt on the existence of an associationbetween media multitasking and distractibility. In the currentstudy, we conducted two replication studies to determine thereplicability of the original findings by Ophir et al., and weconducted a meta-analysis to assess the existence and strengthof the association between media multitasking and distracti-bility across all studies that compared the performance ofHMMs and LMMs on laboratory tests of distractibility ininformation processing. The results of our replication studiesshowed only weak and partial support for the findings ofOphir et al., such that only five of our 14 tests yielded asuccessful replication according NHST, whereas a Bayesiananalysis indicated that only two of these effects were based onconvincing evidence for an association between media multi-tasking and distractibility. Furthermore, the results of ourmeta-analysis showed that the association between mediamultitasking and distractibility is weak and strongly influ-enced by small-study effects, such that the application oftwo corrective procedures for small-study effects changedthe estimate of the overall effect size from a significantCohen’s d of .17 to a nonsignificant effect of .01–.07.
Taken together, the results of our work present reason toquestion the existence of an association between media mul-titasking, as defined by the MMI or other questionnaire mea-sures, and distractibility in laboratory tasks of information
4 It is worth mentioning that we also conducted a meta-analysis using Bayesfactors (Rouder & Morey, 2011). This analysis is report in the supplementarydocument and it yielded an effect size estimate of .03, with strong evidence infavor of the null hypothesis.
a b
Fig. 16 a Funnel plot showing the relationship between the effect sizesand standard errors of previous studies into the relationship betweenmedia multitasking and distractibility. Effect sizes are plotted along thex-axis and standard errors along the y-axis, and the gray areas denote the
areas in which effects were statistically significant. The vertical dashedline indicates the estimated mean effect size. b Funnel plot including theeffects that were imputed using the trim and fill method
Atten Percept Psychophys

processing. This reason is that our meta-analysis shows thatthe association between media multitasking and distractibilityapproximates an effect size of zero after correction for small-study effects. What remains to be explained then is why somestudies did show evidence of such an association, includingsome of the current replication tests. As a case in point, con-sider the results of the current replication studies. Althoughthe outcomes of these tests generally failed to replicate theeffects of Ophir et al. in terms of statistical significance andBayes factors, the outcomes did consistently show nonsignif-icant effects in the direction of HMMs being more vulnerableto distraction then LMMs. Accordingly, one may ask how it ispossible that so many tests consistently showed a difference inone particular direction, given that this difference does notexist according to the meta-analysis. Importantly, however, thisstate of affairs might be less telling or mysterious as it seems. Tostart, it is important to note that our replication attempts wereimplemented as two independent studies using a between-group comparison in which HMMs and LMMswere comparedon seven indices of distractibility. Given that these indiceswould be expected to be correlated within the same subjects,especially when they derive from the same task, it becomesclear that any coincidental difference in distractibility betweenthe LMM and HMM groups would translate into a consistentpattern across the seven indices. Likewise, when consideringthe broader literature, it is noteworthy that our meta-analysismakes clear that, regardless of statistical significance, thereare 11 studies showing greater distractibility in LMMs, threestudies showing no difference between LMMs and HMMs, and25 studies showing greater distractibility in HMMs (seeTable 2). Given that our analysis also suggests the existenceof a bias against small-sample studies showing negative andnonsignificant results, it becomes clear that the distribution ofstudies showing positive and negative results is not so muchdifferent than what would be expected for a set studies thattested the outcomes stemming from a distribution that is cen-tered at an effect size of zero.
An alternative interpretation of the current findings mightbe that the association between media multitasking and dis-tractibility does exist, but that it is very weak. This conclusionwould stem from considering the effect size estimate withoutany correction for small-study effects. Under this interpreta-tion, an important implication of the current work is that futurestudies into the relationship between the media multitaskingand other outcome measures should take into account the factthat these relationships is likely to be very small and onlydetectable using extremely large samples of participants. Tobe precise, to achieve 80% power to detect an effect with aneffect size of .17 one would need 428 participants per groupfor the HMM and LMM groups.
In considering whether or not such large-scale studieswould show evidence for an association between media mul-titasking and distractibility in information processing, a last
point of note is that perhaps future studies should also use adifferent calculation of the MMI (see also Baumgartner et al.,2014; Cain et al., 2016). To wit, the current calculation yieldsa measure of the proportion of media-usage time during whichsomeone uses two media at the same time. This means that aperson who spends only 1 hour per day using his laptop whilewatching television can have the same MMI as a person whodoes this 16 hours per day. Evidently, if there would exist anassociation between media multitasking in daily life and per-formance on laboratory measures of information processing,then this association would be more likely to be seen whenusing a measure of media multitasking that expresses theamount of time someone spends on this activity (see alsoCain et al., 2016; Moisala et al., 2016).
Conclusions and future directions
The idea that frequent media multitasking could be associatedwith differences in information-processing capacity is enticingand timely. However, our experiments and meta-analysis didnot provide much support for this idea. Instead, our meta-analysis showed that the association betweenmedia multitask-ing and distractibility is likely to be very small, and thereforeunlikely to be detected in studies employing relatively smallsample sizes. Accordingly a key implication of the currentstudy is that future studies on the link between media multi-tasking and cognitive functioning should use relatively largesamples of participants to ensure sufficient statistical power.
Acknowledgements We are thankful to Dr. Sri Kusromaniah and herteam from the Faculty of Psychology, Universitas Gadjah Mada,Indonesia for their help during data collection and preparation for Study1, to Dr. Matthew S. Cain and Dr. Melina R. Uncapher for sharing theirunpublished results and dataset for the meta-analysis, and to Prof.Anthony D. Wagner for providing excellent comments during the reviewprocess.
The data collection for Study 1 was funded by Faculty of Psychology,Universitas Gadjah Mada research grant 2014. This article is a part of thePh.D. project of the first author, which is financed by IndonesiaEndowment Fund for Education (LPDP), Ministry of Finance, Republicof Indonesia.
Open Access This article is distributed under the terms of the CreativeCommons At t r ibut ion 4 .0 In te rna t ional License (h t tp : / /creativecommons.org/licenses/by/4.0/), which permits unrestricted use,distribution, and reproduction in any medium, provided you giveappropriate credit to the original author(s) and the source, provide a linkto the Creative Commons license, and indicate if changes were made.
References
Alzahabi, R., & Becker, M. W. (2013). The association between mediamultitasking, task-switching, and dual-task performance. Journal ofExperimental Psychology: Human Perception and Performance,39(5), 1485–1495. https://doi.org/10.1037/a0031208
Atten Percept Psychophys

Baumgartner, S. E., Lemmens, J. S., Weeda, W. D., & Huizinga, M.(2016). Measuring media multitasking. Journal of MediaPsychology. https://doi.org/10.1027/1864-1105/a000167
Baumgartner, S. E., Weeda, W. D., van der Heijden, L. L., & Huizinga,M. (2014). The relationship between media multitasking and exec-utive function in early adolescents. The Journal of EarlyAdolescence. https://doi.org/10.1177/0272431614523133
Becker, M.W., Alzahabi, R., & Hopwood, C. J. (2013). Media multitask-ing is associated with symptoms of depression and social anxiety.Cyberpsychology, Behavior and Social Networking, 16(2), 132–135. https://doi.org/10.1089/cyber.2012.0291
Borenstein,M., Hedges, L. V, Higgins, J. P. T., & Rothstein, H. R. (2009).Introduction to meta-analysis. West Sussex: Wiley.
Brandt, M. J., IJzerman, H., Dijksterhuis, A., Farach, F. J., Geller, J.,Giner-Sorolla, R., … van’t Veer, A. (2014). The replication recipe:What makes for a convincing replication? Journal of ExperimentalSocial Psychology, 50(1), 217–224. https://doi.org/10.1016/j.jesp.2013.10.005
Brasel, S. A., &Gips, J. (2011). Mediamultitasking behavior: Concurrenttelevision and computer usage. Cyberpsychology, Behavior andSocial Networking, 14(9), 527–534. https://doi.org/10.1089/cyber.2010.0350
Cain,M. S., Leonard, J. A., Gabrieli, J. D. E., & Finn, A. S. (2016).Mediamultitasking in adolescence. Psychonomic Bulletin & Reviewhttps://doi.org/10.3758/s13423-016-1036-3
Cain, M. S., & Mitroff, S. R. (2011). Distractor filtering in mediamultitaskers. Perception, 40(10), 1183–1192. https://doi.org/10.1068/p7017
Cardoso-Leite, P., Kludt, R., Vignola, G., Ma, W. J., Green, C. S., &Bavelier, D. (2015). Technology consumption and cognitive control:Contrasting action video game experience with media multitasking.Attention, Perception, & Psychophysics, 78, 218–241. https://doi.org/10.3758/s13414-015-0988-0
Carter, E. C., & McCullough, M. E. (2014). Publication bias and thelimited strength model of self-control: Has the evidence for egodepletion been overestimated? Frontiers in Psychology, 5, 1–11.https://doi.org/10.3389/fpsyg.2014.00823
Cohen, J. (1988). Statistical power analysis for the behavioral sciences(Vol. 2). Mahwah: Erlbaum.
Cohen, J. (1992). A power primer. Psychological Bulletin, 112(1), 155–159. https://doi.org/10.1037/0033-2909.112.1.155
Cohn, L. D., & Becker, B. J. (2003). How meta-analysis increases statis-tical power. Psychological Methods, 8(3), 243–253. https://doi.org/10.1037/1082-989X.8.3.243
Cowan, N. (2000). The magical number 4 in short-term memory: Areconsideration of mental storage capacity. Behavioral and BrainSc i ence s , 24 ( 1 ) , 87–185 . h t t p s : / / do i . o rg / 10 . 1017 /S0140525X01003922
Duval, S. J., & Tweedie, R. L. (2000). Trim and fill: A simple funnel-plot-based method of testing and adjusting for publication bias in meta-analysis. Biometrics, 56(2), 455–463. https://doi.org/10.1111/j.0006-341x.2000.00455.x
Egger, M., Davey Smith, G., Schneider, M., &Minder, C. (1997). Bias inmeta-analysis detected by a simple, graphical test. BMJ (ClinicalResearch Ed), 315(7109), 629–34. https://doi.org/10.1136/bmj.316.7129.469
Faul, F., Erdfelder, E., Lang, A.-G., & Buchner, A. (2007). G*Power 3: Aflexible statistical power analysis program for the social, behavioral,and biomedical sciences. Behavior Research Methods, 39(2), 175–91. https://doi.org/10.3758/bf03193146
Gorman, T. E., & Green, C. S. (2016). Short-term mindfulness interven-tion reduces the negative attentional effects associated with heavymedia multitasking. Scientific Reports, 6, 24542. https://doi.org/10.1038/srep24542
Hedges, L. V., Tipton, E., & Johnson, M. C. (2010). Robust varianceestimation in meta-regression with dependent effect size estimates.
Research Synthesis Methods, 1(1), 39–65. https://doi.org/10.1002/jrsm.5
Jarosz, A., & Wiley, J. (2014). What are the odds? A practical guide tocomputing and reporting Bayes factors. The Journal of ProblemSolving, 7, 2–9. Retrieved from http://docs.lib.purdue.edu/jps/vol7/iss1/2/
Jeffreys, H. (1961). Theory of probability (3rd ed.). Oxford: OxfordUniversity Press.
Judd, T., &Kennedy, G. (2011). Measurement and evidence of computer-based task switching and multitasking by BNet Generation^ stu-dents. Computers & Education, 56(3), 625–631. https://doi.org/10.1016/j.compedu.2010.10.004
Lakens, D. (2013). Calculating and reporting effect sizes to facilitatecumulative science: A practical primer for t-tests and ANOVAs.Frontiers in Psychology, 4, 1–12. https://doi.org/10.3389/fpsyg.2013.00863
Lenhart, A. (2015). Teens, social media & technology overview 2015(Pew Research Center’s Internet & American Life Project).Retrieved from http://www.pewinternet.org/2015/04/09/teens-social-media-technology-2015/ Accessed 9 Apr 2015
Loh K. K., Kanai R., Watanabe K. (2014) Higher Media Multi-TaskingActivity Is Associated with Smaller Gray-Matter Density in theAnterior Cingulate Cortex. PLoS ONE, 9(9), e106698.
Lui, K. F. H., &Wong, A. C.-N. (2012). Does media multitasking alwayshurt? A positive correlation between multitasking and multisensoryintegration. Psychonomic Bulletin & Review, 19(4), 647–53. https://doi.org/10.3758/s13423-012-0245-7
MacWhinney, B., St James, J., Schunn, C., Li, P., & Schneider, W.(2001). STEP—A system for teaching experimental psychologyusing E-Prime. Behavior Research Methods, Instruments, &Computers: A Journal of the Psychonomic Society, Inc, 33(2),287–96.
Minear, M., Brasher, F., McCurdy, M., Lewis, J., & Younggren, A.(2013). Working memory, fluid intelligence, and impulsiveness inheavy media multitaskers. Psychonomic Bulletin & Review, 20,1274–81. https://doi.org/10.3758/s13423-013-0456-6
Moisala, M., Salmela, V., Hietajärvi, L., Salo, E., Carlson, S., Salonen,O., … Alho, K. (2016). Media multitasking is associated with dis-tractibility and increased prefrontal activity in adolescents andyoung adults. NeuroImage, 134, 113–121. https://doi.org/10.1016/j.neuroimage.2016.04.011
Moreno, S. G., Sutton, A. J., Ades, A., Stanley, T. D., Abrams, K. R.,Peters, J. L., & Cooper, N. J. (2009). Assessment of regression-based methods to adjust for publication bias through a comprehen-sive simulation study. BMC Medical Research Methodology, 9(2),1–17. https://doi.org/10.1186/1471-2288-9-2
Morey, R. D. (2008). Confidence Intervals from normalized data: A cor-rection to Cousineau (2005). Tutorial in Quantitative Methods forPsychology, 4(2), 61–64.https://doi.org/10.3758/s13414-012-0291-2
Morey, R. D., Rouder, J. N., & Jamil, T. (2015). Computation of BayesFactors for Common Design. R Package Version 0.9.12-2.Retrieved from http://cran.r-project.org/package=BayesFactorAccessed 19 Sep 2015
Nieuwenstein, M. R., Blom, T. N., Morey, R. D., & Wicherts, J. M.(2015). On making the right choice: A meta-analysis and large-scale replication attempt of the unconscious thought advantage.Judgement and Decision Making, 10(1), 1–17.
Open Science Collaboration. (2015). Estimating the reproducibility ofpsychological science. Science, 349(6251), aac4716–aac4716.https://doi.org/10.1126/science.aac4716
Ophir, E., Nass, C., & Wagner, A. D. (2009). Cognitive control in mediamultitaskers. Proceedings of the National Academy of Sciences ofthe United States of America, 106(37), 15583–15587. https://doi.org/10.1073/pnas.0903620106
Atten Percept Psychophys

Palfrey, J., & Gasser, U. (2008). Born digital: Understanding the firstgeneration of digital natives. New York: Basic Books.
Peirce, J. W. (2007). PsychoPy—Psychophysics software in Python.Journal of Neuroscience Methods, 162(1/2), 8–13. https://doi.org/10.1016/j.jneumeth.2006.11.017
Peters, J. L., Sutton, A. J., Jones, D. R., Abrams, K. R., & Rushton, L.(2007). Performance of the trim and fill method in the presence ofpublication bias and between-study heterogeneity. Statistics inMedicine, 26, 4544–4562. https://doi.org/10.1002/sim
Psychonomic Society. (2012). Psychonomic Society guidelines on statis-tical Issues. Retrieved from http://www.psychonomic.org/page/statisticalguideline Accessed 19 Aug 2012
Ralph, B. C. W., & Smilek, D. (2016). Individual differences in mediamultitasking and performance on the n-back. Attention, Perception,& Psychophysics https://doi.org/10.3758/s13414-016-1260-y
Ralph, B. C. W., Thomson, D. R., Cheyne, J. A., & Smilek, D. (2013).Media multitasking and failures of attention in everyday life.Psychological Research, 78(5), 661–669. https://doi.org/10.1007/s00426-013-0523-7
Ralph, B. C.W., Thomson, D. R., Seli, P., Carriere, J. S. A., & Smilek, D.(2015). Media multitasking and behavioral measures of sustainedattention. Attention, Perception, & Psychophysics, 77(2), 390–401.https://doi.org/10.3758/s13414-014-0771-7
Rouder, J. N., & Morey, R. D. (2011). A Bayes factor meta-analysis ofBem’s ESP claim. Psychonomic Bulletin & Review, 18(4), 682–689. https://doi.org/10.3758/s13423-011-0088-7
Rouder, J. N., Morey, R. D., Speckman, P. L., & Province, J. M. (2012).Default Bayes factors for ANOVA designs. Journal ofMathematical Psychology, 56(5), 356–374. https://doi.org/10.1016/j.jmp.2012.08.001
Rouder, J. N., Speckman, P. L., Sun, D., Morey, R. D., & Iverson, G.(2009). Bayesian t tests for accepting and rejecting the null hypoth-esis. Psychonomic Bulletin & Review, 16(2), 225–237. https://doi.org/10.3758/PBR.16.2.225
Sanbonmatsu, D.M., Strayer, D. L., Medeiros-Ward, N., &Watson, J. M.(2013). Who multi-tasks and why? Multi-tasking ability, perceivedmulti-tasking ability, impulsivity, and sensation seeking. PLoSONE,8(1), e54402. https://doi.org/10.1371/journal.pone.0054402
Scammacca N., Roberts G., Stuebing K. K. (2014) Meta-Analysis WithComplex Research Designs: Dealing With Dependence FromMultiple Measures and Multiple Group Comparisons. Review ofEducational Research, 84(3), 328-364.
Stening, B.W., & Everett, J. E. (1984). Response styles in a cross-culturalmanagerial study. The Journal of Social Psychology, 122, 151–156.
Sterne, J. A. C., & Egger, M. (2001). Funnel plots for detecting bias inmeta-analysis: Guidelines on choice of axis. Journal of Clinical
Epidemiology, 54(10), 1046–1055. https://doi.org/10.1016/S0895-4356(01)00377-8
Sterne, J. A. C., Gavaghan, D., & Egger, M. (2000). Publication andrelated bias in meta-analysis: Power of statistical tests and preva-lence in the literature. Journal of Clinical Epidemiology, 53(11),1119–1129. https://doi.org/10.1016/S0895-4356(00)00242-0
Sterne, J. A. C., Sutton, A. J., Ioannidis, J. P. A., Terrin, N., Jones, D. R.,Lau, J.,…Higgins, J. P. T. (2011). Recommendations for examiningand interpreting funnel plot asymmetry in meta-analyses ofrandomised controlled trials. BMJ (Clinical Research Ed), 343,d4002. https://doi.org/10.1136/bmj.d4002
Thompson, S. G., & Sharp, S. J. (1999). Explaining heterogeneity inmeta-analysis: A comparison of methods. Statistics in Medicine,18(20), 2693–2708. https://doi.org/10.1002/(SICI)1097-0258(19991030)18:20<2693::AID-SIM235>3.0.CO;2-V
Uncapher, M. R., Thieu, M. K., & Wagner, A. D. (2015). Media multi-tasking andmemory: Differences in workingmemory and long-termmemory. Psychonomic Bulletin & Review https://doi.org/10.3758/s13423-015-0907-3
van Selst, M., & Jolicoeur, P. (1994). A solution to the effect of samplesize on outlier elimination. The Quarterly Journal of ExperimentalPsychology Section A, 47(3), 631–650. https://doi.org/10.1080/14640749408401131
Viechtbauer, W. (2010). Conducting meta-analyses in R with the metaforpackage. Journal of Statistical Software, 36(3), 1–48.
Vogel, E. K., McCollough, A. W., & Machizawa, M. G. (2005). Neuralmeasures reveal individual differences in controlling access to work-ing memory. Nature, 438(7067), 500–503. https://doi.org/10.1038/nature04171
Wagenmakers, E.-J. (2007). A practical solution to the pervasive prob-lems of p values. Psychonomic Bulletin & Review, 14(5), 779–804.https://doi.org/10.3758/BF03194105
Wetzels, R., Matzke, D., Lee, M. D., Rouder, J. N., Iverson, G. J., &Wagenmakers, E.-J. (2011). Statistical evidence in experimentalpsychology: An empirical comparison using 855 t tests.Perspectives on Psychological Science: A Journal of theAssociation for Psychological Science, 6(3), 291–8. https://doi.org/10.1177/1745691611406923
Wood, J., Freemantle, N., King, M., & Nazareth, I. (2014). Trap of trendsto statistical significance: Likelihood of near significant P valuebecoming more significant with extra data. BMJ (ClinicalResearch Ed), 348, g2215. https://doi.org/10.1136/bmj.g2215
Yap, J. J. Y., & Lim, S. S. W. H. (2013). Media multitasking predictsunitary versus splitting visual focal attention. Journal of CognitivePsychology, 25(7), 889–902. https://doi.org/10.1080/20445911.2013.835315
Atten Percept Psychophys