Embed Size (px)
Citation preview
UNIVERSITY OF CARDIFF
SCHOOL OF ENGINEERING
Decision Support System for Brownfield Site Sustainable Regeneration
Cristina Pellegrino MPhil 2007

UMI Number: U584989
All rights reserved
INFORMATION TO ALL USERS The quality of this reproduction is dependent upon the quality of the copy submitted.
In the unlikely event that the author did not send a complete manuscript and there are missing pages, these will be noted. Also, if material had to be removed,
a note will indicate the deletion.
Dissertation Publishing
UMI U584989Published by ProQuest LLC 2013. Copyright in the Dissertation held by the Author.
Microform Edition © ProQuest LLC.All rights reserved. This work is protected against
unauthorized copying under Title 17, United States Code.
ProQuest LLC 789 East Eisenhower Parkway
P.O. Box 1346 Ann Arbor, Ml 48106-1346
UNIVERSITY OF CARDIFF
SCHOOL OF ENGINEERING
Decision Support System for Brownfield Site Sustainable Regeneration
Cristina Pellegrino MPhil 2007
Supervisor Pr H R Thomas

Form: PG/R/06/09 Ca r d if fUNI VERS I TY
P R I F Y S G O L
CaeRDY[9Specim en Layout for Thesis Summary and Declaration/Statements page to be included in a Thesis
DECLARATION
This work has not previously been accepted in substance for any degree and is not concurrently submitted in candidature for any degree^—
O fc z A * ,BBnriiriatB, natB /2/12/01Signed ..................... . rrTT... ..................................................... (candidate) Date
STATEMENT 1
This thesis is being submittedJn partial fulfillment of the requirements for the degree of MPhil
S igned ..................................................... (candidate) D a te .........
STATEMENT 2
This thesis is the result of my own independent work/investigation, except where otherwise stated.Other sources are acknowledge^ by explicit references. , ,
S igned .................................................................. (candidate) D a te .......'PPJP.l...STATEMENT 3
I hereby give consent for my thesjsj if accepted, to be available for photocopying and for inter-library loan, and for the title and summary to be made-available to outside organisations. 1 *
12 iz jcPtSigned ....................................r.................................................. (candidate) D a te ................ ( . .. .. ./ . .......:...
STATEMENT 4 - BAR ON ACCESS APPROVED
I hereby give consent for my thesis, if accepted, to be available for photocopying and for inter-library loans after expiry of a bar on access apprtSv<kl/bv the Graduate Development Committee. y *.
C PPpP-IZ b N2. cr¥Signed ............................................ rrrr: (candidate) D a te ........... '.TT..V.......>..........

Form: PG/R/06/09
P R I F Y S G O L
C a eR D V [§)
NOTICE OF SUBMISSION OF THESIS: POSTGRADUATE RESEARCH DEGREES
Please return the completed form to:Relevant School Office
Please TYPE or write in BLACK ink and use BLOCK capitals
SECTION A: TO BE COMPLETED BY THE CANDIDATE AND SUBMITTED WITH THE THESIS
STUDENT ID NUMBER
CANDIDATE’S LAST NAME PELLEGRINO
CANDIDATE’S FIRST NAME(S) CRISTINA
SCHOOL SCHOOL OF ENGINEERING
TITLE OF DEGREE Please circle appropriate value
MPHIL
FULL TITLE OF THESIS DECISION SUPPORT SYSTEM FOR BROWNFIELD SITE SUSTAINABLE REGENERATION
IS THIS A RESUBMISSION? -< <D CA □ z o □
THESIS SUBMITTED FOR Permanent Binding O
EXAMINATION IN: Temporary binding Q
Ca r d if fUNI VERS I TY

Form: PG/R/06/09
PRI F V S G O L
Ca£RDY[§>
STUDENT ID NUMBER
ADDRESS FOR RECEIPT OF YOUR RESULT LETTER, DEGREE
CERTIFICATE AND DETAILS OF THE GRADUATION CEREMONY:
9 BURNE JONES CLOSE
DANESCOURT
CARDIFF
Postcode (if applicable): CF5 2RY
Please note that vou must notifv Reaistrv immediatelv if this address chanaes.Changes of address should be reported to : [email protected]
PLEASE INDICATE WHETHER YOU WISH TO ATTEND THE
DEGREE CEREMONY:
Yes HH
No □
PREFERRED CONTACT TELEPHONE (WITH DIALLING
CODE/S):
0044 (0) 781 6371461
EMAIL/S:
CANDIDATE’S SIGNATURE: DATE OF SUBMISSION: ^ . L l9 . ) . l O ? T
Ca r d if fUNI VERS I TY

Acknowledgements
The author would like to express extreme gratitude to the following people, without whose
knowledge, advice and assistance, the work of this project could not have been completed.
To Pr Thomas for his guidance and patience in the development and finalisation of this
research.
To Pr Yong for his highly appreciated help and suggestions that helped me to develop an
innovative idea for the project.
To the RESCUE team for allowing me to contribute to their research and the use of the results
in the development of this project.
To Parsons Brinckerhoff Ltd and in particular to Adrian Dolecki for providing support and
relevant expertise at different times.
Particular thanks to Derek and John for their support and encouragement throughout this
work.

Dedicate to my family to whom I owe everything
ABSTRACT
The work described in this thesis concerns the development of a Brownfield Site Sustainable
Regeneration - Decision Support System (BSSR-DSS). The project aims to develop a pilot
system that can provide information and alternatives for sustainable brownfield regeneration
as a platform to make decisions in this context.
One of the main characteristics of the BSSR-DSS is its ability to process the input data
(related to site characteristics), run simulations and assess/evaluate different scenarios in order
to obtain the most sustainable solution.
The process input data for the BSSR-DSS relates to a wide range of sustainability indicators
that have been developed in the European Project “RESCUE - Regeneration of European
Sites in Cities and Urban Environments”.
The system involves the elaboration of methods and approaches using innovative mathematical
techniques such as Artificial Neural Networks and Fuzzy Logic to analyze and evaluate the input data
(site characteristics and sustainability indicators) to produce a significant output.
The literature review undertaken confirmed that no current system integrating the two above
mathematical techniques has been implemented to date.
The system is also linked to a Geographic Information System (GIS) called MAPINFO. This
allows extensive information searches to be undertaken that can be site specific, and the
information displayed on a map.
L ist o f C ontents
Chapter 1 Introduction
1.1 The Brownfield Problem 1
1.1.2 Progress 2
1.2 The background to the development of the Decision Support System for Brownfield
Site Sustainable Regeneration 4
1.3 The Decision Support System 6
1.3.1 The scientific problem 8
1.3.2 The tasks 9
1.4 The thesis 10
Chapter 2 Sustainability, Planning and the Legislative Framework for Brownfield Site
Redevelopment
2.1 Sustainability 12
2.1.1 The sustainability concept 12
2.1.2 Sustainability definition in the context of Brownfield Regeneration 14
2.1.3 Sustainability Indicators 19
2.2 UK Planning and Legislation Framework 21
Chapter 3 Literature Review
3.1 Introduction 29
3.2 Artificial Neural Networks 29
3.2.1 Examples of use of ANN 30
3.3 Use of a Belief Function and Artificial Neural Networks in Brownfield
Redevelopment Decision Making 31
3.4 Integrated Simulation System of GIS and ANN for Land Appraisal 33
3.5 Fuzzy Logic and Brownfield Regeneration 34
3.5.1 Examples of Fuzzy Logic integrated to Brownfield Regeneration 34
3.6 Software and decision support system 37
3.6.1 GIS for brownfield TOOLKIT 38
3.6.2 London’s Brownfield Resource Pilot Project: the Wandle Valley 40
3.6.3 A GIS-based decision support system for brownfield redevelopment 42
3.6.4 DESYRE - Decision support system for rehabilitation of contaminated sites
45
3.6.5 Conceptual framework for understanding brownfield redevelopment issues 47
3.6.6 Multicriteria analysis and GIS for territory - MAGISTER 49
3.6.7 Sustainable City - GIS software for urban management 52
3.6.8 Sustainable development indicators - the Dashboard 54
3.6.9 Global system for sustainable development 57
3.7 Research projects for brownfield regeneration 59
3.7.1 RESCUE regeneration of European Sites in Cities and Urban Environments
59
3.7.2 CABERNET Concerted Action on Brownfield and Economic Regeneration
Network 61
3.7.3 SUBR:IM Sustainable Urban Brownfield Regeneration: Integrated
Management 63
3.7.4 REVIT Revitilising Industrial Sites 63
Chapter 4 Methodology
4.1 Methodology 70
4.2 Fuzzy Logic 70
4.2.1 Rule evaluation and the fuzzy associative memory 71
4.2.2 Fuzzification and membership functions 74
4.2.3 Defuzzification 76
4.3 Artificial Neural Networks 78
4.3.1. Architecture of an Artificial Neural Network 83
4.3.2 Training an Artificial Neural Network 84
4.3.3 Transfer function of Artificial Neural Networks 85
4.4 Integration of fuzzy logic and artificial neural networks to GIS 87
Chapter 5 The Decision Support System for Brownfield Sites Sustainable Regeneration
5.1 The Decision Support System - generalities 90
5.2 Mapbasic programming language 91
5.3 Input variables 95
5.4 Architecture of DSS 98
5.5 Implementation 100
5.5.1 Phase 1 101
5.5.2 Phase 2 109
5.6 Testing 114
5.7 Interface 115
Chapter 6 Case Studies
6.1 Case Studies 118
6.1.1 French Case Studies 120
6.1.2 German Case Studies 123
6.1.3 Polish Case Studies 130
6.1.4 UK Case Studies 135
6.2 Test Case Study - Newport 142
Chapter 7 Interpretation of results
7.1 Results 150
7.1.1 Interpretation of the results from case studies 151
7.1.2 Interpretation of the results from the test case - Newport 154
7.2 Considerations 155
Chapter 8 Conclusions
8.1 Critique of the work 158
8.2 Final considerations 160
8.3 Issues 161
8.4 Potential Future Developments 163
Appendix A Sustainability Indicators
Appendix B Case Studies Tables
Appendix C Data
List of Figures
2.1 Dimensions of sustainability 14
2.2 Pyramid of human needs 16
3.1 System Interface 41
3.2 Simple Influence Diagram 48
4.1 A simple block diagram of the control system 72
4.2 The rule structure and the rule matrix 74
4.3 The features of a membership function 75
4.4 The horizontal coordinate of the centroid 78
4.5 A basic artificial neuron 79
4.6 A model of a processing element 80
4.7 A simple neural network diagram 82
4.8 Example of feedforward network 83
4.9 Example of feedback network 84
4.10 Sample Transfer Functions 85
5.1 DSS Scheme 91
5.2 The DSS Algorithm 99
5.3 Newport Docks GIS Map 100
5.4 The developed ANN 112
6.1 Loisinord Site 121
6.2 The Loisinord ski piste opened in November 2006 121
6.3 Les Tertiales site 122
6.4 Map of the Ruhr area 123
6.5 Northward aerial view of the site 124
6.6 Listed shaft towers 126
6.7 Detail of the 3D model of the planned future use 127
6.8 Map location of Espenhain 128
6.9 Eastward aerial view of the site 129
6.10 Concept for the site and its surroundings 130
6.11 Ski slope at Sport Valley 131
6.12 Sosnowiec Coal Mine 133
6.13 Markham Employment Growth Zone 136
6.14 Markham Willows 138
6.15 The Gateshead Quay 140
6.16 The Baltic 141
6.17 The Old Town Dock area 143
6.18 Aerial view of the area 144
List of Tables
5.1 Decoding Tables 102
5.2 SWG analysis for the case studies and the test case 106
5.3 Fuzzy Associative Matrix 108
5.4 Grade of sustainability 113
7.1 Results 150
7.2 Table comparing results for measure of sustainability 152
7.3 Comparison of results for type of redevelopment 153
Chapter 1
Introduction
1.1 The Brownfield Problem
Brownfields are abandoned or under-utilised areas normally within the urban core of
a city. These sites are generally areas that have previously been built-on, yet have
become derelict or have fallen into disrepair. Some sites may be contaminated.
Brownfield sites are an important component of the government’s strategy to develop
sustainable urban communities.
Across the U.K., in general brownfield sites result from a wide range of former
industrial activities, including mineral extraction, coal and steel production, gasworks,
electrical generation, traditional engineering-based activities, transport infrastructure
and chemical production, as well as a wide range of more minor industrial activities.
In 1996, the Department of Environment (DOE) (now part of the Department for
Environment, Food and Rural Affairs-DEFRA) published a series of nearly 47
"industry profiles," which provide information on the history of different industrial
activities in the U.K. and identify the likely contamination problems to be found on
the sites involved.
A National Land-Use Database was started in 1998 to assist in the identification of
previously developed sites that might be, or might become, available for new
development uses. Work continues on populating the database, but interim statistics
released in May 1999 reveal there are some 33,000 hectares of land in England that

Chapter 1 - Introduction
are previously developed and either vacant or derelict, and that might be suitable for
redevelopment.
The UK Government has set the target, through the key national land use policy, to
promote a sustainable pattern of physical development and land and property use in
cities, towns and the countryside. This includes the following goals for promoting
brownfield redevelopment:
• economic and social regeneration of the surrounding areas
• environmental improvement of the sites themselves
• reduction in "development pressure" on greenfield sites.
This objective is backed up by specific Public Service Agreement (PSA) targets for
60 percent of new housing to be provided on previously developed land or through
conversion of existing buildings, and for brownfield land to be reclaimed at a rate of
over 1,100 hectares per annum by 2004, reclaiming 5 percent of current brownfield
land by 2004 (target over achieved) and 17 percent by 2010.
However, currently there is a lack of integrated and comprehensive knowledge on the
condition, location and management of brownfield sites throughout the UK and little
attention has been given to the contribution that brownfield sites make to biodiversity,
nature conservation and amenity.
1.1.2 Progress
In many urban areas of the U.K., the redevelopment of brownfield sites is led largely
by the private sector. A significant proportion of projects take place with very little
direct involvement from public bodies and government agencies, except in their roles

Chapter 1 - Introduction
as regulators, issuing and enforcing necessary approvals and legal permissions (such
as town and country planning). This private sector focus may be the result of a
combination of the following four factors:
• the fact that most of the current brownfield land stock is already privately
owned
• the particular "economic history" of the sites and the industries that were
formerly on the land
• the current state of the national and regional economies and, in particular, the
demand for land in urban areas
• conscious political choice by successive national governments.
However, there are also significant government programmes to promote and support
brownfield redevelopment. These programmes can be split into four types:
• spatial planning - with the “Town and Country Planning Act”2 which
promotes brownfield redevelopment largely by inhibiting or preventing
development projects on Greenfield sites, and by making brownfield land
available for development;
• technical support - that takes proactive and reactive forms. Proactive, national
government and other private sector-led groups fund research and
development and the development of "best practice" advice to assist the
development and construction industries in working on brownfield sites. On
the reactive side, the focus is on removing factors that might inhibit
brownfield redevelopment.
Chapter 1 - Introduction
• financial support - brownfield redevelopment is eligible for direct public
sector financial support where this is necessary to achieve social and
economic policy objectives, whilst financial support for the private sector can
take a number of forms such as grant aid, loans, guarantees
• direct development by public bodies and agencies such as preparation for
development platforms for subsequent development by the private sector,
simple site clearance projects.
1.2 The background to the development of the Decision
Support System for Brownfield Site Sustainable Regeneration
The decision making process for any problem usually encompasses:
An identification phase in which the problem is identified;
A development phase in which possible solutions are identified and
developed;
A selection phase in which the solution to be implemented is chosen;
A monitoring phase to prove/disprove that the chosen option or set of options
has been implemented.
Several "layers" of decision support can be distinguished: the input information, the
tools to assist particular decision making issues, and the overall system in which
decision making is applied. Decision support codifies specialist expertise in a way
that allows its reproducible use by many. It integrates specific information about an
area or more and general information such as legislation, guidelines and know-how,
4
Chapter 1 - Introduction
to produce decision-making knowledge in a way that is transparent, consistent and
reproducible.
The Decision Support System (DSS) has been developed to support decision makers
to meet some of the challenges of the UK Government in brownfield redevelopment.
Gaps and obstacles in brownfield redevelopment have been reviewed extensively in
the U.K. by a number of organizations, including the Parliamentary Office of Science
and Technology and the Urban Task Force. Key challenges have been identified and
these include:
• improving understanding of the social, economic and environmental factors
related to brownfield redevelopment
• quantifying and assessing the contribution made by brownfield redevelopment
to sustainable development
• integrating brownfield considerations into other aspects of regeneration, such
as architecture and social development
• building confidence in brownfield regeneration (e.g. risk communication
methods)
• developing tools to promote good practice in brownfield redevelopment (e.g.
by demonstration of technologies, better integration of technical approaches
with management needs)
• ensuring holistic approaches to managing large areas of brownfield, in
particular in dealing with regional groundwater issues
5
Chapter 1 - Introduction
• maximizing the benefits from brownfield regeneration (e.g. in terms of
recycling and reuse of resources on the sites)
• developing cost-effective methods for assessing sites for contamination
problems
• strengthening the evaluation of contamination management technologies (e.g.
in terms of practicability, long-term effectiveness and their wider
environmental and resource-use impact)
• improving approaches for communicating with and involving stakeholder
groups.
The “Decision Support System” represents a tool to promote best practice in
brownfield redevelopment through a heuristic approach.
1.3 The Decision Support System
The work described in this thesis concerns the development of a Decision Support
System for Brownfield Site Sustainable Regeneration. The project aims to develop a
pilot system that can provide information and alternatives for sustainable brownfield
regeneration as a platform to make decisions in this context.
One of the main characteristics of the Brownfield Site Sustainable Regeneration
Decision Support System (BSSR-DSS) is its ability to process the input data (related
to site characteristics), run simulations and assess/evaluate different scenarios in order
to obtain the most sustainable solution.
6
Chapter 1 - Introduction
The BSSR-DSS process input data relates to a wide range of sustainability indicators
that have been developed in the European Project “RESCUE - Regeneration of
European Sites in Cities and Urban Environments”1.
The system uses a Geographic Information System (GIS) called MAPINFO. This
allows extensive information searches to be undertaken that can be site specific,and
allows to create an user friendly interface.
In addition, GIS serves to facilitate brownfields redevelopment in three important
ways:
Continuity across the project and integration with other efforts—GIS for
brownfields redevelopment can integrate historic, social, economic, and
environmental data and can be managed across the life span of a project as it
moves from assessment to cleanup to redevelopment and, finally, into full use
where brownfields information will be integrated with other land use records,
property management, and data.
Project management tool—GIS can be used to join, display, and use a range of
spatial and attribute data, both historic and current, to manage a multiphased,
multistakeholder redevelopment project.
Stakeholder relationships— Successful brownfields redevelopment depends on
multistakeholder engagement to redevelop a site that meets the needs of
community members and is economically feasible and environmentally
responsible. A GIS system can be easily learned and used by all stakeholder
groups to collect and compare a wide range of data and redevelopment
options, reducing feelings of bias or unfair representation.
Chapter 1 - Introduction
The aim of the BSSR-DSS is to provide the decision-makers with an easy and user-
friendly tool able to formulate a basis for the decisions that would lead to
improvement in the quality of derelict land recycling - in the context of sustainability
of the built environment and the quality of urban life.
The system is designed for practical application by stake-holders such as public
authorities, planners, architects, engineers and real estate owners that are involved in
the complex processes of brownfield regeneration projects.
It is argued that the decisions made can contribute substantially to reducing the costs
of land rehabilitation, and thus not only help to overcome the current obstacles in
such projects, but also contribute to reducing the demand for greenfield development
and conservation of natural resources.
Typically, when developers and other organisations have an interest in a brownfield
site, they must perform an extensive information search to determine its planning and
environmental status and identify a sustainable approach. An information search of
this type could take days, weeks, or even months to compile.
The BSSR-DSS allows this search to take a matter of minutes once the input data are
available. The results are also displayed in an easy to understand form.
1.3.1 The scientific problem
The scientific problem related to the development of the BSSR-DSS is the derivation
of criteria for the sustainability of brownfield redevelopment related to economical,
social and environmental aspects of a project.
Chapter 1 - Introduction
But in particular, the problem involves the elaboration of methods and approaches
using innovative mathematical techniques such as artificial neural networks and fuzzy
logic to analyze and evaluate the input data (site characteristics and sustainability
indicators) to produce a significant output.
The literature review undertaken, as shown later in the thesis, confirmed that no
current system integrating the two above mathematical techniques has been
implemented to date.
Artificial Neural Networks have been mainly utilised in concomitance with GIS for
studies related to land use, whilst Fuzzy Logic has been integrated to other
mathematical techniques to assist decisions related to site remediation.
1.3.2 The tasks
During the development of the DSS the following tasks have been undertaken:
Design of methods for comparing the indicators
Adaptation of the criteria for sustainability developed by RESCUE to the
system developed
Elaboration of a mathematical model that measures the regeneration process
Application, use and development of the code for fuzzy logic and artificial
neural networks
Development of a simulation process based on the developed mathematical
model to compare different scenarios for the regeneration projects suitable for
that area.
9
Chapter 1 - Introduction
1.4 The thesis
This thesis submitted for the degree of MPhil provides first an overview of the
brownfield regeneration problem analysing the legislation framework for the U.K and
the relation to the sustainability issue.
A review of the systems and software developed in this sector to provide assistance
and support to those involved in brownfield regeneration is then presented. This is
followed by an overview of current and past research programmes and projects
undertaken at European Level to promote sustainability and best practice within the
brownfield regeneration field.
The core of the thesis is the development of the BSSR-DSS and the methodology
used. This includes an overview of the mathematical techniques utilised to implement
the system.
To allow a successful and practical approach to the development of the system, real
case studies have been utilised to test the software. A local site situated in Newport
(Wales - UK) has then been utilised to test the system and compare results with a real
situation. Details of all the case studies are also presented in the following chapters.
To conclude the thesis an interpretation of the results is presented, together with some
suggestions for future developments and enhancements of the system.
10

Chapter 1 - Introduction
REFERENCES:
1. RESCUE (2005) - Analytical Sustainability Framework. Available from:
http://www.rescue-europe.com/html/results.html
2. CLARINET Contaminated Land Rehabilitation Network for Environmental
Technologies (2002) - Brownfield and Redevelopment o f Urban Areas.
Available from: http://www.clarinet.at/librarv/brownfields.pdf
11
Chapter 2
Sustainability, Planning and the
Legislative Framework for
Brownfield Site Redevelopment
2.1 Sustainability
2.1.1 The sustainability concept
In 1987 the concept of sustainability was made known and popular by the report ‘Our
Common Future’ of the World Commission on Environment and Development
(WCED)1. The Brundtland Report defines sustainable development as "a development
that satisfies today’s needs without the risk, that future generations will not be able to
satisfy their needs." This definition was generally agreed upon world-wide.
This report was a major impulse for the United Nations Conference on Environment
and Development (UNCED) in Rio de Janeiro in 1992. The main result of the Rio-
conference was an action plan for sustainable development: the Agenda 21. 170
countries committed to start supporting sustainable development in their countries.
In May 1994 the European Commission and the city of Aalborg, Denmark, realised
the first European Conference for Sustainable Cities and Municipalities to promote
the realisation of chapter 28 in Agenda 21 and the development of local sustainability
objectives. All cities that signed the Aalborg Charter in 1995 committed to start12
Chapter 2 -Sustainability. Planning and the Legislative Framework for Brownfield Site
Redevelopment
"Local Agenda 21"-processes. They also bound themselves to develop local action
plans for long-term environmental and social urban planning by the end of 1996.
“Sustainability” is a frequently used word that is subject to a wide range of
interpretations. Taken by itself, it conveys little more than a vague declaration of
intent to ensure that present needs are not met in ways that will compromise future
generations.
Without some relation to a particular frame of reference, however, the concept of
sustainability has virtually no meaning at the level of practical problem solving. It is
necessary to establish such a frame of reference in order to clarify the concept of
sustainability.
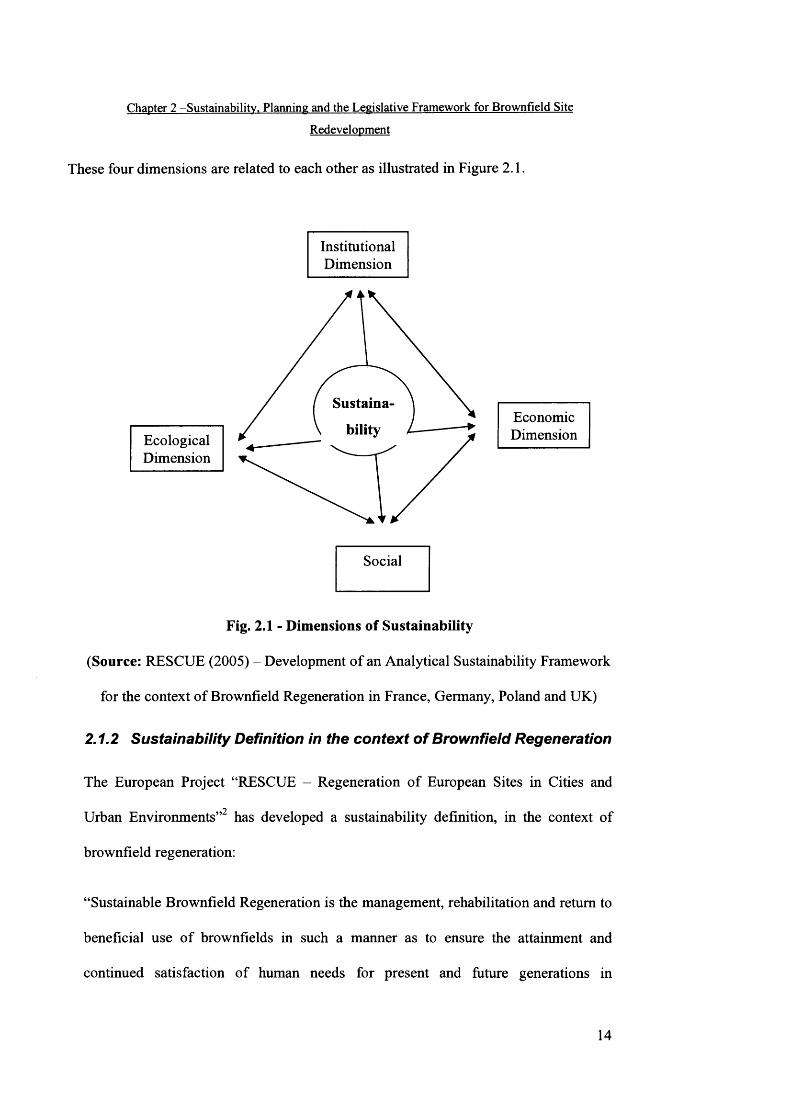
In the relevant literature four dimensions of sustainability are distinguished:
• environmental dimension: resource use does not exceed the regeneration rate,
decreasing consumption of non-renewable resources, no negative ecological impacts;
• economic dimension: direct and attractive benefits for stakeholders, fully
internalised costs and benefits (including inter-generational and inter-national costs),
and improvement of living standard of community
• social dimension: meet actual needs of community, equal access to benefits,
resources and information, reduce social disparities;
• institutional dimension: compatible with local culture, share responsibilities,
visible impacts on involved organisations and institutions; involvement into decision
making, legislative and fiscal framework.
13
Chapter 2 -Sustainability. Planning and the Legislative Framework for Brownfield Site
Redevelopment
These four dimensions are related to each other as illustrated in Figure 2.1.
InstitutionalDimension
EcologicalDimension
Sustaina
bilityEconomicDimension
Social
Fig. 2.1 - Dimensions of Sustainability
(Source: RESCUE (2005) - Development of an Analytical Sustainability Framework
for the context of Brownfield Regeneration in France, Germany, Poland and UK)
2.1.2 Sustainability Definition in the context of Brownfield Regeneration
The European Project “RESCUE - Regeneration of European Sites in Cities and
Urban Environments” has developed a sustainability definition, in the context of
brownfield regeneration:
“Sustainable Brownfield Regeneration is the management, rehabilitation and return to
beneficial use of brownfields in such a manner as to ensure the attainment and
continued satisfaction of human needs for present and future generations in
14
Chapter 2 -Sustainability. Planning and the Legislative Framework for Brownfield Site
Redevelopment
environmentally sensitive, economically viable, institutionally robust and socially
acceptable ways within the particular regional context.”
Due to the fact that some of the terms used in the definition are broad they need some
further explanation. The following explanations shall serve to provide a basis for the
common understanding of sustainability in the brownfield context.
In 2000 the Organisation for Economic Co-operation and Development (OECD)
provided the following definition of brownfield:
“Brownfield land is that (land) which is, or is likely to be contaminated as a result of
former industrial, commercial or governmental operations.”3
The Contaminated Land Rehabilitation Network for Environmental Technologies in
Europe (CLARINET)4, that is a Concerted Action within the Environment & Climate
Programme of the European Commission DG Research, has developed a different
definition for brownfield site. These are defined as:
have been affected by the former uses of the site and surrounding land
are derelict or underused
may have real or perceived contamination problems
are mainly in developed urban areas
require intervention to bring them back to beneficial use
The expression “beneficial use” of brownfield land is linked to economic and social
sustainability. The term demands direct and attractive benefits for all stakeholders
15
Chapter 2 -Sustainability. Planning and the Legislative Framework for Brownfield Site
Redevelopment
within the affected region, including owners, planners/developers, future users,
neighbouring communities. With respect to social sustainability the benefits should be
distributed relatively equally among the stakeholders.
Self Fulfillment
E goistic
Social
Safety
P hysical
Fig. 2.2 - Pyramid of human needs
(Source: RESCUE (2005) - Development of an Analytical Sustainability Framework
for the context of Brownfield Regeneration in France, Germany, Poland and UK and
MASLOW 1970)
With regard to the four sustainability dimensions “beneficial use” of the resources
would be broken down into: beneficial for the environment (e.g. improved ecosystem
stability), beneficial for the stakeholders (e.g. in monetary terms); beneficial for the
community (e.g. better living standard, development, increased social cohesion);
beneficial for the development of sustainable institutions (e.g. fostering more efficient
structures in administration, offering new opportunities of citizen participation).
Brownfield regeneration and urban planning have also to satisfy human needs. In the
late 1960's, Abraham Maslow2 developed a theory of human needs and suggested an
arrangement of them in a hierarchy of strength or potency. His theory is that the
16

Chapter 2 -Sustainability. Planning and the Legislative Framework for Brownfield Site
Redevelopment
appearance of one need usually occurs after the prior satisfaction of another more
important or more powerful need. That is, man strives to satisfy higher needs after the
lower needs have been satisfied.
The hierarchic theory is often represented as a pyramid (see Figure 2.2), with the
larger, lower levels representing the lower biological needs, and the upper point
representing the need for self-actualisation. The five types of needs, in order of power
that MASLOW identified are: physical needs, safety needs, social needs, egoistic
needs and self-fulfilment needs.
According to Maslow’s theory, different people or stakeholders will have different
needs within brownfield regeneration and so will express different expectations.
Those people with unsatisfied security needs might look for immediate benefits (e.g.
jobs, health situation) while those with unsatisfied social and esteem needs might look
for social integration or prestigious roles in the redevelopment process.
Sustainable brownfield regeneration should satisfy at least the three bottom levels of
needs for all stakeholders.
The rationale behind the phrase “present and future generations” is to undertake a
form of site development that increases the flexibility of present and future
generations to make decisions about their development. Present development should
not compromise the needs of present and future generations in any of the
sustainability dimensions; on the contrary, the options to choose should increase.
With regard to the environment, the expectation is that brownfield regeneration
happens in an environmentally sensitive manner. A wide-reaching aim is that the
17
Chapter 2 -Sustainability. Planning and the Legislative Framework for Brownfield Site
Redevelopment
overall environmental state is improving in the region of the project site in the long
term by using renewable resources (air, water, plants, animals and biodiversity) in the
process of brownfield regeneration. In addition, the negative environmental impacts
emitting from the site should be reduced stepwise (noise, radiation, infiltration of
dangerous substances).
In addition future infrastructure and buildings should be designed in a manner that
facilitates simple deconstruction or easy adaptation to different uses.
From the economic point of view, sustainable brownfield regeneration should achieve
a positive benefit-cost-balance for stakeholders in the short to medium term
perspective. Economic sustainability needs a supportive environment, in particular
with respect to institutions and markets. The economic environment should provide
stability for the brownfield economy, for the political system, and for the affected
society. The companies engaged in brownfield regeneration need clear and reliable
rules, e.g. about taxes, environmental and social standards. At the same time
companies need to maintain their flexibility to make new decisions and to adapt to
changing framing conditions.
Institutions involved in brownfield regeneration should enable the stakeholders to
improve and to develop their ability to manage these processes in a sustainable way
even when framing conditions change over time. Therefore, the institutional structure
between and within the stakeholders’ organisations has to reflect the aspect of
sustainability.
A brownfield regeneration process is socially acceptable when it meets the actual (as
well as the known and expected future) needs of the communities in the region. It also
18
Chapter 2 -Sustainability. Planning and the Legislative Framework for Brownfield Site
Redevelopment
has to consider the aspect of maintenance or increase of development chances for
future generations.
2.1.3 Sustainability Indicators
In the current literature a wide range of sustainability indicators, related to different
issues, have been developed from different organisations and research programmes.
Some examples are provided below. In the particular context of bronwfield
regeneration, the European Programme “RESCUE - Regeneration of European Sites
in Cities and Urban Environments” represents the first effort to develop a set of
sustainability indicators for this field .
The OECD has developed a set of indicators to evaluate environmentally relevant
services and political action on an international level and to standardise complex
information on the environment3. The set has limited its focus on environmental
problems, their triggers and human reaction to simple cause-effect relations excluding
further social and economic impacts. The focus of the national and international
research level makes the OECD indicator set unsuitable for issues of brownfield
regeneration and decontamination. More specific information on how (e.g. state of the
site, decontamination methods), why (e.g. type of previous use) or on the
consequences (e.g. reuse of brownfields) cannot be obtained with this indicator set.
The United Nations Commission on Sustainable Development (UNCSD) established
to control the implementation of Agenda 21, released a set of 134 indicators for
testing on the national level5. The commission’s objective is to develop a global wide
applicable set of indicators in order to harmonise international activities aiming at
19
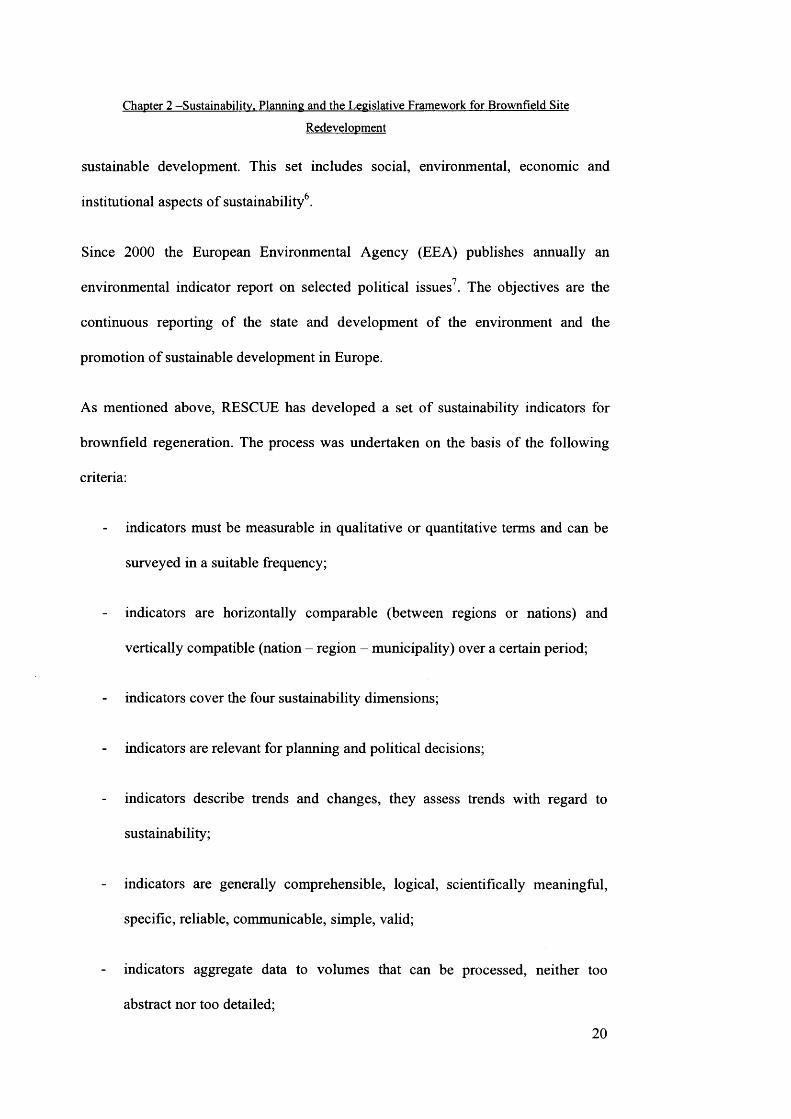
Chapter 2 -Sustainability. Planning and the Legislative Framework for Brownfield Site
Redevelopment
sustainable development. This set includes social, environmental, economic and
institutional aspects of sustainability6.
Since 2000 the European Environmental Agency (EEA) publishes annually an
environmental indicator report on selected political issues7. The objectives are the
continuous reporting of the state and development of the environment and the
promotion of sustainable development in Europe.
As mentioned above, RESCUE has developed a set of sustainability indicators for
brownfield regeneration. The process was undertaken on the basis of the following
criteria:
indicators must be measurable in qualitative or quantitative terms and can be
surveyed in a suitable frequency;
indicators are horizontally comparable (between regions or nations) and
vertically compatible (nation - region - municipality) over a certain period;
indicators cover the four sustainability dimensions;
indicators are relevant for planning and political decisions;
indicators describe trends and changes, they assess trends with regard to
sustainability;
indicators are generally comprehensible, logical, scientifically meaningful,
specific, reliable, communicable, simple, valid;
indicators aggregate data to volumes that can be processed, neither too
abstract nor too detailed;
20

Chapter 2 -Sustainability. Planning and the Legislative Framework for Brownfield Site
Redevelopment
- development, deduction, selection and weighting of indicators are transparent;
indicators are precautionary, and not reactive.
2.2 UK Planning and Legislation Framework
The processes of brownfield redevelopment are governed by complex regulatory
frameworks that can act as drivers and barriers to sustainable urban regeneration.
These barriers and drivers are both legal and financial in nature. In order to tackle the
financial barriers to brownfield redevelopment, a range of fiscal incentives have been
made available, by the government to private developers, to encourage them to view
brownfields as potentially profitable opportunities. These fiscal incentives have been
backed-up by changes to the principles and practices underpinning the institutions of
the British spatial planning system with a greater emphasis on increasing brownfield
development at the expense of greenfield sites.
The system of Town and Country Planning Act 1990 promotes brownfield
redevelopment largely by inhibiting or preventing development projects on greenfield
sites, and by making brownfield land available for development. This is brought about
by a hierarchy of:
national planning policy (set out by national government in Planning Policy
Guidance notes);
regional planning policy (set collectively by local government bodies in the
region and the Regional Development Agency), which also includes overall
“structure” planning for the region;
21
Chapter 2 -Sustainability. Planning and the Legislative Framework for Brownfield Site
Redevelopment
local structure and development plans (set by the county and district councils)
which make zoning decisions for the future use of particular areas of land in
the area, and
individual decisions on applications for planning permission (made by local
planning authorities) which normally should conform with the relevant
development plan.
In 1991 the Government introduced the concept of the plan led planning system.
Local Authorities are required to produce development plans for how they see their
area being developed. This means that in making planning decisions it is necessary to
decide whether the proposal is in accordance with the ‘Development Plan’ for the
area and then to take into account other material considerations.
The objectives of the plan-led system are to ensure rational and consistent decisions,
to achieve greater certainty, to secure public involvement in shaping local planning
policies, to facilitate quicker planning decisions, to reduce the number of
inappropriate planning applications and unnecessary appeals.
Local Planning Authorities decide whether applications are approved. Refusals can
result in public inquiries where evidence is heard by a Planning Inspector. The
Secretary of State can “call in” applications in certain circumstances for direct
determination.
At the top of the plan led-system is national guidance from the former DETR and
DTLR (now the Office of the Deputy Prime Minister - ODPM), which consists of
Planning Policy Guidance Notes (PPGs), Minerals Policy Guidance Notes (MPGs),
22
Chapter 2 -Sustainability. Planning and the Legislative Framework for Brownfield Site
Redevelopment
and Ministerial Circulars. The PPGs give ‘guidance’, the Secretary of State has a
range of sanctions to ensure that Local Planning Authorities follow the advice, and of
course Planning Inspectors will decide appeals in the light of PPGs. It should be
noted that the said PPGs are continuously being updated and revised and there are a
number of consultation drafts and recent decisions at any one moment in time.
Below national policy comes Regional Policy. This was issued by the former DETR
in July 1994 (RPG10). The current guidance covers the period up to 2011. RPG was
in the past criticised for being a reiteration of national policy, so a new system has
been introduced. This involves a wider range of policies and more specific ‘spatial’
policies on the physical distribution of development. RPG will also form the
framework for Local Transport Plans and Regional Development Agencies Strategies.
In consequence it will need to more directly address regional issues than was
previously the case.
The government, through the Planning and Policy Guidance 3: Housing (PPG3) has
increased the targets for regional/local planning authorities to reach in respect to
redeveloping brownfield land from 50% to 60%8. This means that before allocating
any greenfield land for new housing projects, a local planning authority has first to
satisfy itself that there are no suitable and available sites in the area which have been
previously developed.
In November 2006 this guidance was replaced by Planning and Policy Statement 3:
Housing (PPS3). PPS3 puts in place a new national policy framework for planning for
housing at the local and regional levels9. It provides an enabling framework for local
planning authorities, working with their stakeholders, including developers, to deliver
23

Chapter 2 -Sustainability. Planning and the Legislative Framework for Brownfield Site
Redevelopment
both the right quantity of housing to address need and demand in their areas, and the
right quality and mix of housing for their communities. In the context of brownfield
sites, PPS3 restate that the national annual target is that at least 60 per cent of new
housing should be provided on previously developed land. This includes land and
buildings that are vacant or derelict as well as land that is currently in use but which
has potential for re-development.
The UK Government has identified areas of growth in areas such as the Thames
Gateway and Milton Keynes where considerable brownfield and contaminated land
exists alongside economic deprivation and housing shortages. In order to address this,
it has given its main regeneration body, English Partnerships, a lead role in
identifying and supporting development activities that will bring these sites back into
productive use.
In September 2003, English Partnerships published Towards a National Brownfield
Strategy. This report assessed the state of England’s brownfield land supply and
highlighted that there is a huge potential to recycle brownfield land to meet
government housing growth targets, while reducing the pressure to develop on our
countryside10.
One of the most important findings of the report is that as much as a third of the
66,000 ha of brownfield land identified in the National Land Use Database (NLUD)
could be readily available for development - contributing significantly to government
targets of developing 60 per cent of housing on brownfield land11.
Other key findings of the report are:
24

Chapter 2 -Sustainability. Planning and the Legislative Framework for Brownfield Site
Redevelopment
• Nearly one-third of the brownfield or previously developed land (PDL)
identified is contained within the key "growth area" regions (i.e. Greater
London, South East and East of England).
• Only one-sixth of the total hardcore PDL (i.e. land that has been vacant or
derelict for nine years or more) is to be found in these growth regions,
suggesting fewer barriers to the long-term regeneration of brownfield land.
• The target of achieving 60 per cent, or more, of new homes on brownfield
land should continue to be achievable in the foreseeable future.
The findings, along with a series of recommendations, were the basis for the National
Brownfield Strategy for England, which was outlined in the Sustainable Communities
Plan12.
In February 2003, the government produced Sustainable Communities: Building for
the Future which set out the government’s plans for tackling housing shortages in the
South East and low demand in Northern areas of London12. This plan reaffirmed the
government’s commitment to using the planning system as a key instrument in
delivering on brownfield regeneration.
Another driver - and at the same time a possible barrier - to brownfield regeneration,
is the development in recent years within the UK of legislation with the aim of
providing clearer regulation of contaminated, the Part IIA policy13. The current policy
regime for dealing with contaminated land in the UK is geared towards operating
along the grain of the development cycle by which British planning system operates.
It provides a clearer definition of the distinction between ‘brownfield land’ and
25
Chapter 2 -Sustainability. Planning and the Legislative Framework for Brownfield Site
Redevelopment
‘contaminated land’ and sets out a system regulating their remediation. In practice,
the system offers considerable scope for discretion and flexibility to local actors to
ensure that brownfield regeneration proceeds at a steady rate. However, the system, if
operated rigidly, can impose significant costs upon developers, and the exchequer,
posing a threat to the successful regeneration of economically unproductive areas as
private developers push for more greenfield land on which to develop.
26
Chapter 2 -Sustainability. Planning and the Legislative Framework for Brownfield Site
Redevelopment
REFERENCES:
1. World Commission on Environment and Development (WCED 1987) - The
Report of Brundtland Commission, Our Common Future - published by
Oxford University Press
2. RESCUE (2005) - Development of an Analytical Sustainability Framework
for the context of Brownfield Regeneration in France, Germany, Poland and
UK. Available from: http://www.rescue-
europe.com/download/reports/1 Analvtical%20sustainabilitv%20framework.p
df
3. Organisation for Economic Co-operation and Development (OECD 2005) -
Key Environmental Indicators - Environment Directorate
4. CLARINET Contaminated Land Rehabilitation Network for Environmental
Technologies (2002) - Brownfield and Redevelopment o f Urban Areas.
Available from: http://www.clarinet.at/librarv/brownfields.pdf
5. United Nations Commission on Sustainable Development (UNCSD 2001) -
Indicators of Sustainable Development. Avaialbe from:
http ://www.un. org/esa/sustdev/natlinfo/indicators/isdms2001/ table4 .htm
6. United Nations Commission on Sustainable Development (UNCSD 2006) -
Global Trends and Status of the Indicators for Sustainable Development.
Available from: http://www.ec.gc.ca/soer-
ree/English/resource network/bg paperl e.cfin?StrPrint=true&
27

Chapter 2 -Sustainability. Planning and the Legislative Framework for Brownfield Site
Redevelopment
7. Smeets E. and Weterings R. (TNO Centre for Strategy, Technology and
Policy, The Netherlands 1999) - Technical report No 25 - Environmental
Indicators: Typology and Overview - European Environmental Agency (EEA)
8. Communities and Local Government (2000) - Planning and Policy Guidance
3: Housing (PPG3) - DETR (London: The Stationery Office)
9. Communities and Local Government (2006) - Planning Policy Statement 3:
Housing (PPS3) - London: The Stationery Office
10. English Partnerships, The National Regeneration Agency (2003) - Towards a
National Brownfield Strategy. Available from:
http://www.englishpartnerships.co.uk/brownfieldstrategy.htm
11. National Land Use Database (2002) - NLUD Previously Developed Land
(PDL): Data Specification v2.2. Available from:
http://www.nlud.org.uk/draft one/kev docs/nlud pdl pubs.htm
12. Office of the Deputy Prime Minister (2003) - Sustainable Communities:
building for the future - ODPM (London: The Stationery Office)
13. Department of Environment, Food and Rural Affairs (DEFRA 1994) -
Environmental Protection Act 1990: Part IIA - Available from:
http://www.opsi.gov.uk/acts/actsl990/Ukpga 19900043 en l.htm
28
Chapter 3
Literature Review
3.1 Introduction
The existing literature focuses on specific areas related to brownfield regeneration for
example urban land management.
Below a general overview is given of the use of fuzzy logic and artificial neural
networks, this also includes their application to issues related to the brownfield
regeneration problem.
In addition an overview is provided of existing software and decision support
systems. Finally the literature review has identified a range of research projects and
programmes that have been funded in order to tackle the problem at national and
international level. See references for general review1.
3.2 Artificial Neural Networks
The current literature highlights that Artificial Neural Networks have been mainly
used in the brownfield regeneration problem for issues related to land cover and land
use.
Some examples are presented below.
29
Chapter 3 - Literature Review
3.2.1 Examples of use of Artificial Neural Networks
One of the areas where Artificial Neural Networks are frequently used is mapping
land cover. Accurate and frequently updated land cover maps of environmentally
protected areas are necessary for the management of legislation programs governed
by the EU, national authorities and local environmental schemes.
A study undertaken by the University of Newcastle Upon Tyne3 has analysed the
suitability of ANN for mapping and monitoring land cover over regional areas, such
as National Parks, using both hard and soft classification approaches together with the
high spatial resolution of multispectral CarterraTM Geo IKONOS imagery. The study
aimed to examine the transferability of remote sensing mapping algorithms over
Northumberland National Park (NNP) located in Northern England.
The ANNs were trained using ground data of eight different upland vegetation classes
and applied to a multispectral IKONOS image of NNP. The ANNs applied consisted
of a Multiple Layer Perceptron (MLP), using a conjugate gradient descent, and one
hidden layer with a varying number of hidden nodes and combinations of weights.
The transferability of ANNs was found to depend on the ability to generalise, which
could be improved by applying early stopping in the training process, improving the
accuracy of the validation data by an average of 15%. Limitations and issues
regarding the transferability of MLP ANNs were observed to be significant.
Advanced ANN algorithms such as Support Vector Machines were required to enable
the use of ANNs for mapping and monitoring land cover.
Another example is the use of Artificial Neural Networks for Multi-objective land use
optimization that has been developed at the Department of Geography, Friedrich-
30
Chapter 3 - Literature Review
Schiller-University Jena, Germany4. Managing a catchment for drinking water supply
with a high proportion of agricultural land use typically requires the maintenance of a
reasonable balance between water quality demands and the costs for the resulting
restrictions for the farming industry. A core part of this task therefore is multi
criterion decision making. Approaches to multi-criterion decision analysis often
assume either a small number of alternative solutions to the decision problem or a
simply structured solution space. For catchment management problems none of these
properties can be assumed: the consideration of lateral flows of substances affecting
the water quality in the catchment results in highly complex solution spaces that have
to be explored. Searching for an optimal solution of the problem in addition requires
the consideration of a large number of solution candidates for the problem. This
makes finding an optimal decision a practically intractable task. The method
developed is based on artificial neural networks (ANN) that are able to find good
approximations to the optimal decision. For this purpose an ANN was computed to
represent the hydrological topology of the catchment. A modified ANN learning
procedure was then used to find farming restrictions for the single fields of the
catchment area that guarantee the desired water quality at near minimal costs. These
restrictions can be used to produce justifiable land use management decisions.
3.3 Use of a Belief Function and Artificial Neural Network in
Brownfield Redevelopment Decision Making
Decision making in brownfield infrastructure regeneration necessitates the
consideration of a multiplicity of complex, interrelated issues. The use of belief
function integrated with ANN can help to combine independent evidence from
various issues to determine the overall uncertainty in redevelopment decision making.
31
Chapter 3 - Literature Review
The belief function is the representation of uncertain knowledge in the form of basic
probability assignments in which probabilities can be assigned to directly form
subsets of states of nature.
The system takes into consideration the main issues related to brownfield
redevelopment: technical, liability, financial, community concerns, and
redevelopment prospects.
Then an artificial neural network is constructed on the basis of the final output
requested. For example it is assumed that the overall payoff (economic benefit from
redevelopment) of the final decision with regard to brownfield infrastructure depends
on site remediation and site redevelopment. The system builds the artificial neural
network with the arrows showing the dependencies and nodes representing the
relationships and items representing the objectives.
Using the Dempster’s rule of combination5 the system is processed adding the
judgments made by the decision maker about the level of support obtained from the
procedures for the respective nodes.
The output is represented by tables with a measure of the uncertainty and it is
achieved by using the Dempster-Shafer theory5. The values can change when more
information and data are added. This makes the methodology more dynamic and a
form of sensitivity analysis tool in brownfield infrastructure redevelopment processes.
32
Chapter 3 - Literature Review
3.4 Integrated Simulation System of GIS and ANN for Land
Price Appraisal
This paper describes an automatic simulation system implemented to forecast the
change of parcel-based land price caused by urban planning alteration. The system
integrates forecasting knowledge-based urban model, artificial neural network
(ANN), and visual geo-referencing tool, GIS, within Visual Basic framework.
A land price simulation system (LPSS)6 is developed combining two sub-systems,
ANN and GIS. After training the ANN model with the data taken from Chinju City in
Korea, the impacts of ‘new road plan’, ‘park’, ‘height control district’ and ‘beauty
district’ on land price are simulated. The simulation results are visualized with Esri’s
Map Objects.
Most of the input variables regarding to land attributes, public land regulation, land
use and topology were selected from the Land Price Calculation Table. All the
variables are categorized and preprocessed through equation (1) to fasten the training
speed and raise model’s accuracy.
p n = 2 • (P — min P) /(max P - min P) -1 (1)
where P is primary input vector, m in , max is minimum and maximum value of
whole primary input data and Pn is adjusted value of input vector.
If the output is correct within acceptable error range, the ANN stops training and
becomes able to forecast the land price of that area. The knowledge gained during the
training is stored in the link weight ( W ) of ANN.
33
Chapter 3 - Literature Review
The network was trained firstly with whole study area of about 12,000 parcels.
However, in this case, training did not converge even after running over 24 hours on
Pentium 11-400. For the substantial application to real world, the sample size was
reduced to the ‘Dong’ that is basic administrative unit in Korea. Among nine ‘Dongs’,
where all four type of simulation items are applied to, Namsung was selected for
demonstration. Namsung has 348 parcels including 42 parcels of new road
construction plan and 171 parcels of park, 147 parcels of maximum height control
district and 30 parcels of beauty district. The network was trained as changing the
learning iteration time or learning rate.
Results and performance of the system are considered over expectancy therefore the
system has been utilised by other municipalities.
3.5 Fuzzy Logic and Brownfield Regeneration
The current literature highlights that Fuzzy Logic has been mainly used in the
brownfield regeneration problem for issues related to mapping, in particular urban
land use mapping, multiscale representation of brownfield sites and the detection of
urban brownfields by means of high resolution satellite imagery.
Some examples are presented below.
3.5.1. Exam pies of Fuzzy Logic integrated to Brown field Regeneration
In 2002 the Ministry of Environment and Energy, Denmark undertook a research to
develop a fuzzy logic approach to urban land use mapping7. Traditionally, urban land-
use mapping is based on orthophotos and satellite images, but deriving land-use from
remote-sensing alone is not satisfactory.
34
Chapter 3 - Literature Review
The use of fuzzy logic to monitor, analyse and model the urban environment was
developed on the basis of data available from the Danish Building & Dwelling
Register, which is a database containing detailed information like year of
construction, use, area etc. This database provides a useful foundation for urban land-
use mapping. Generally, land cover and land-use mapping are based on crisp
classification, but the innovation was to apply a fuzzy modelling approach to land-use
mapping. The approach consisted in the calculation of fuzzy membership values for
each urban land-use class and to group individuals into fuzzy sets or classes. This was
based on the so-called Semantic Import model where a membership function is pre
defined without any reference to the data. The class limits were specified based on
experiences or definitions before individuals were allocated on the basis of how close
they matched the requirements of the classes.
Fuzzy classification offers a better choice in urban land-use mapping, because it can
indicate the primary, secondary etc. land-use simultaneously. This offers more
meaningful information for planners and a more detailed understanding of the land-
use patterns. As result of this research and based on these principles, a nation wide
urban land-use database for the year 1997 was established.
Another application of fuzzy logic to brownfield sites was developed by the
Environmental Protection Agency in US8 under the Brownfield Land Recycling
Program that aimed to create a Brownfield Sites Inventory database listing
environmentally impaired vacant and abandoned or under used land. The emphasis of
the project was to launch the detection of potential brownfield sites and to provide the
specific spatial data for communities.
35
Chapter 3 - Literature Review
On this basis a multispectral Ikonos imagery was used (Space Imaging, LLC). Three
overlapping flight paths were taken on the very same day to cover the entire City of
Baltimore. In order to orthorectify the images the cubic convolution algorithm was
applied. The innovation was the use of object oriented classification method as any
multispectral classification scheme would fail to detect such a highly heterogenic
object class. Image segmentation, fuzzy classification, and structure type assignment
was performed by means of eCogniton software. This software follows a new, object
oriented approach towards image analysis.
The concept behind this software program was that important semantic information
necessary to interpret an image was not represented in single pixels, but in meaningful
image objects and their mutual relationships. So first the image was structured into
user-defined homogeneous segments in any desired resolution, then the classification
procedure could follow.
The segmentation algorithm entailed the simultaneous representation of image
information on different scales. This procedure detected local contrasts and was
especially designed to work with highly textured data, such as Ikonos, Quickbird, or
digital orthophotos. The classification process was based on fuzzy logic, to allow the
integration of a broad spectrum of different object features such as spectral values,
shape, or texture.
This fuzzy logic approach led to the characterisation and description of distinct urban
land use categories. The resulting information was integrated in a rule based system
on a higher level of image analysis on which classified land use objects were
combined to semantic structure groups, in this case potential brownfield sites.
36

Chapter 3 - Literature Review
The assumption underlying this approach was that potential brownfields sites are a
land use type that follows a certain pattern (i.e. consisting of buildings, roads or road
access, impervious surface and neglected green spaces) so that each object can first be
classified and then be composed to a variation of structure groups).
The system developed presented some advantages such as the possibility of assigning
potential brownfield sites for entire city, the possibility of modifying the approach for
specific characteristics and the possibility of comparing information with GIS data.
However disadvantages were identified too, such as the fact that remote sensing only
offers a bird’s eye perspective and that very high resolution data sets need to be
available.
3.6 Software and decision support systems
The sustainable brownfield regeneration problem is a complex, multi-parameter field
where it is unlikely that any single person will have the knowledge to perform all the
analysis required in supporting the overall decisions.
For this reason, decision support systems and software have been developed at
National and International level from a wide range of sources (Universities,
Corporation, Governments and so on).
In general these systems provide user friendly toolkits for the decision makers. Some
of the ones identified in the literature review are only focused on a certain area of the
brownfield regeneration problem (e.g. contamination, public participation, land use).
Others provide useful databases of information for defined sites that can be use by the
players in making decisions.
37
Chapter 3 - Literature Review
Geographical Information Systems (GIS) and mathematical models have been used to
enhance the performance of the software or decision support system in order to
include various elements of the regeneration process and provide a sustainable system
able to support and advise final decision makers.
Corporations and companies have developed software that uses GIS to solve a
particular issue related to brownfield regeneration. For example Kleinfelder has
developed a GIS-based brownfield analysis for the environmental issue where all the
site characteristics are stored and then an analysis is performed for the site selection
based on certain criteria (such as zoning, location, environmental issues, acreage and
so on).
In the following paragraphs an overview of the systems developed to date is provided.
3.6.1 GIS for brownfield TOOLKIT
Environmental Systems Research Institute, Inc (ESRI), the world leader in geographic
information system (GIS) technology, and International City/County Management
Association (ICMA), a US premier local government leadership and management
organization, have teamed together to produce a new virtual library with resources for
using geographic information systems (GIS) for brownfield redevelopment. GIS can
assist brownfield redevelopment professionals in many facets of their work, from
conducting brownfield site inventories to collecting data for environmental
remediation to marketing properties for redevelopment. The ESRI-ICMA GIS for
Brownfields Toolkit contains conference presentations, reports and articles, and an
extensive list of Web resources for communities wanting to use GIS in their
brownfields redevelopment.
38
Chapter 3 - Literature Review
Original case studies produced specifically for the toolkit share the experiences of
three communities— Hillsborough County, Florida; Spokane, Washington; and
Worcester, Massachusetts—in using GIS for brownfields redevelopment.
Hillsborough County uses GIS maps to help citizens understand the potential impacts
of brownfields efforts and involve them in future planning discussions1.
Spokane found GIS helpful in planning and setting priorities for its brownfields
program, and Worcester developed a special GIS application— the brownfields
redevelopment inventory query—to help manage its brownfields redevelopment
efforts.
BRIQ (the brownfields revedevelopment inventory query) is a database that
catalogues all potential sites along with other factors such as major roads, sewer and
water infrastructure, environmental zones, Massachusetts DEP (Department of
Environmental Protection) records, and tax records.
BRIQ has mainly two applications:
Cross reference between DEP, City Assessing zoning and other records in one
database
Ability to produce reports on completed brownfield projects in City
In particular BRIQ organizes disparate information using location, provides quick
information look-up, and allows custom searching to fit the needs.
Through the system, city planners have access to local, state, and federal information
regarding the characteristics of land parcels in Worcester.
39
Chapter 3 - Literature Review
3.6.2 London’s Brownfield Resource Pilot Project: the Wandle Valley
The Centre for Advanced Spatial Analysis, University College London developed a
short term pilot study to evaluate the contribution of a GIS for decision support and
for “discussion support”9.
The project developed a system for the Wandle Valley, covering the London
boroughs of Wandsworth, Merton, Sutton and Croydon. The ArcView GIS was used
to assemble, store, manipulate and display geographically referenced information
relating to brownfield sites and their locality such as shopping areas, public transport
routes.
This project does not appear as a decision support system able to provide suggestions
but only as a survey of the current state of the brownfield sites in that area.
The system has been created to encourage more sustainable and environmentally
friendly development of brownfield sites. This was done using an iterative
development approach supported by a series of four seminars and a public
participation workshop.
The Brownfield system allows the integration of diverse environmental, social and
economic datasets relating to brownfield sites such as urban areas, areas of nature
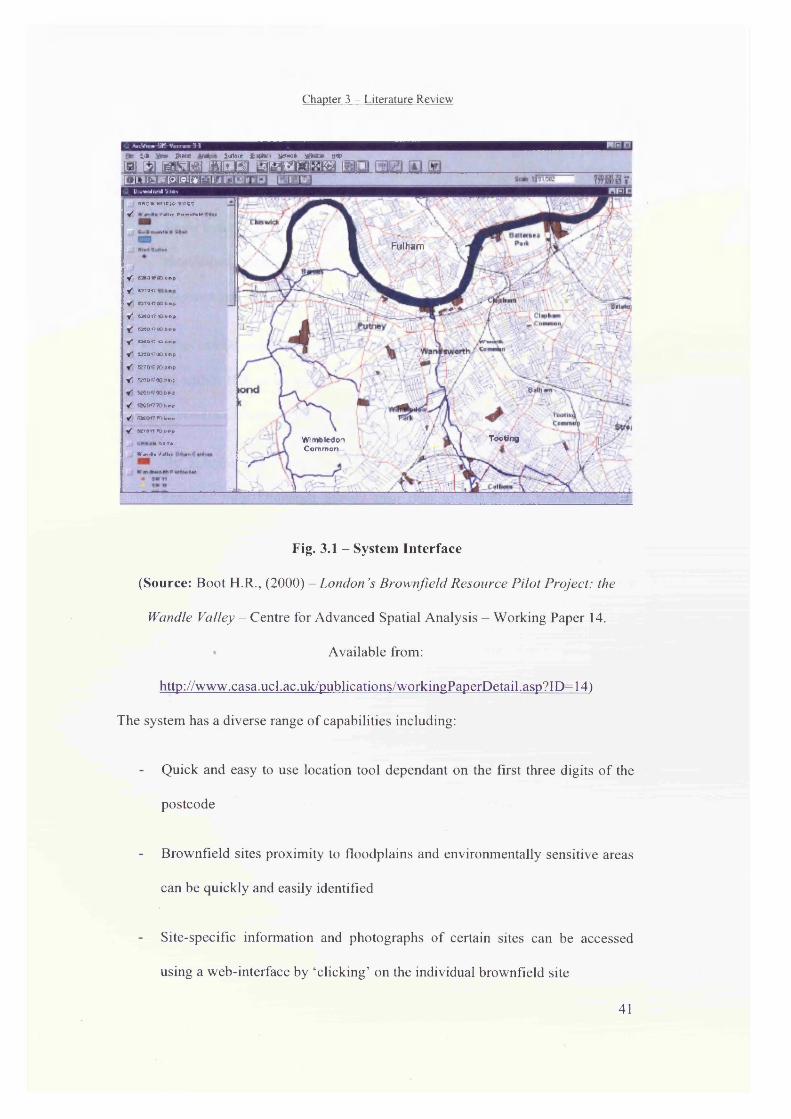
conservation, and archaeology and transport networks as shown in Figure 3.1. These
different layers of information were integrated with an Ordnance Survey Meridian
backdrop.
40
Chapter 3 - Literature Review
in i i i>Hi i i i W|L 3 U I 3 K { S > I S H - * iL) .VHiIi.mJ 'j l e t
t i IhMt autott filmic, Itfwofc w t» H<*>h si asm mata umzmsm i
Fulham
■*\5ew
ToottngWimbledonCom m on
o n o » « r iE U ? i i r e sV K*i«r c . - . n . w
y E a g w o a b n p
• f i 62701?
y 9S?D f?aat.i>p
if O t D f f U b f t p
i f a a a n o O L b n p
if n t f l i P M i i
V 4M D1?0& t»ip
y ce7o<7»»«pY) S f l O f l t t P f t P
Y S M O ffflO frrip
y swoato wy EMDPIObrp y «ron«Sb»>p
t>*Th
J W a n d le P4l«r
Fig. 3.1 - System Interface
(Source: Boot H.R., (2000) - London’s Brownfield Resource Pilot Project: the
Wandle Valley - Centre for Advanced Spatial Analysis - Working Paper 14.
Available from:
http://www.casa.ucl.ac.uk/publications/workingPaperDetail.asp?ID=14)
The system has a diverse range of capabilities including:
Quick and easy to use location tool dependant on the first three digits of the
postcode
Brownfield sites proximity to floodplains and environmentally sensitive areas
can be quickly and easily identified
Site-specific information and photographs of certain sites can be accessed
using a web-interface by ‘clicking’ on the individual brownfield site
41
Chapter 3 - Literature Review
Easy to understand graphics as they are based on familiar, well-labelled
Ordnance survey data
From individual brownfield site web pages, other hypertext links have been
established such as to the Local authority pages, Wandsworth Planning
Register and independent community groups
Sites can be identified that meet certain criteria through network analysis, such
as within 1km of an underground station or shopping area, within 400m of a
green area, but not in the predicted flood one
By zooming into certain ‘high priority’ areas, the display of the system
changes from Ordnance Survey map data to 50x50 cm resolution aerial
photography10
In my opinion the completed system provides a useful tool that demonstrates the
advantages that GIS has over more traditional mapping methods; its ease of
integrating diverse datasets, updating and Internet links to name a few.
3.6.3 A GIS-based decision support system for brownfield
redevelopment
The Department of Resource Development, Michigan State University developed in
1999 a GIS-based decision support system for brownfield redevelopment.
The DSS provides access to state, regional and local geospatial databases, several
informational and visualisation tools, and assumptions useful in providing a better
understanding of issues, options, and alternatives in redeveloping brownfields.
42

Chapter 3 - Literature Review
The purpose of the project was to build a prototype brownfield decision support
system that could be applied statewide in making siting decisions. Such a system took
advantage of existing state, regional, and local geospatial databases; web-based tool
that creates an inventory of brownfield sites; GIS-based visualisation models and
decision criteria; and extensive public interaction.
The information system uses an innovative resource-modelling application called
Smart Places that provides different scenarios. These are used to compile the data,
integrate sitting objectives and constraints, and assess impacts of various land-use
options.
The study area used was Jackson County Brownfield Redevelopment Zone, which
included 19 townships in Jackson County, Michigan. Although the site is
geographically isolated from other major population centres in Michigan, it is being
influenced by expansion from Washtenaw County to the east, Ingham County to the
north and Kalamazoo-Battle Creek to the west.
To develop the system, site selection criteria were developed by a series of facilitated
workshops attended by the representatives of local units of government in Jackson
County. Participants identified a systematic approach and agreed that the site
screening criteria needed to reflect several factors:
Factors that are generally used in the art and science of locating commercial
real estate
Incorporation of local conditions such as infrastructure, site characteristics,
and financial incentives
43
Chapter 3 - Literature Review
Local restrictions including zoning ordinances, master plans, and community
acceptance.
These criteria were added to the decision support system. The toolset also included
site attributes for the inventoried brownfields site study areas and selected brownfield
site characterization and environmental, social, and economic development indicators.
The process by which site information was compiled in this decision support system
and alternative site development options evaluated includes input in the GIS
(ArcView) and Smart Places of the data layers, indicators, and measurements
assumptions. In particular several factors like legal restrictions, environmental
regulatory requirements, physical restrictions, community desires, brownfield site
selection and weighting factors were taken into consideration.
These factors are then reviewed based on an evaluation of similar proposals and an
assessment of environmental effects. A preliminary analysis is provided to the
developer and to municipal decision-makers. Over 90 individual brownfields in
Jackson County were identified, characterized and ranked for redevelopment
(industrial or commercial one).
This project represented a testbed for decision makers11 and policy analysts at all
levels of government to establish urban land use policy and development guidelines
that may be applicable to related land use issues in a variety of urban and urbanising
settings.
44
Chapter 3 - Literature Review
3.6.4 DESYRE - Decision support system for rehabilitation of
contaminated sites
A DEcision Support sYstem for the REqualification of contaminated sites (DESYRE)
has been developed for the identification of the most effective rehabilitation
interventions. The DSS is based on a Geographic Information System (GIS)
framework and integrates environmental and technological databases, risk assessment
models, and multi criteria procedures.
DESYRE tries to solve the problems related to contaminated macro-sites
rehabilitation in three main fields: site characterization and data processing,
evaluation of the risk, choice of proper remediation technologies12. The aim is to
support the expert to gain a comprehensive view of the rehabilitation process and to
choose the best solution.
The system is composed of five modules: characterisation, risk, socio-economical and
technological analysis, and decision. The characterisation module provides all the
available information on the site (e.g. chemical and hydrogeological data). It can be
explored by means of GIS tools and its database is available as input to statistical and
geo-statistical software, as well as to hydrogeological and contaminant fate and
transport models. Moreover, it provides the definition of efficient sampling strategies,
definition of contaminant distribution, prediction of transport processes and input
parameters for the risk assessment module.
The risk assessment module includes exposure and risk assessment models and
provides outputs such as risk maps. The main goal of this module is to integrate the
environmental evaluations into the decisional process or the rehabilitation of
45
Chapter 3 - Literature Review
contaminated sites. The risk analysis applied to contaminated sites is a technical
procedure carried out to define risks posed by the site contamination to the human
health and the land remediation interventions on the basis of the site characterisation,
the qualification of human receptors exposure to the contaminants, and the
contaminants toxicity assessment. The socio-economical assessment module
addresses socio-economical constraints and benefits.
The technological assessment module allows feasibility, advantages, limits and costs
of different techniques to be assessed. This is developed to a stepwise structure: the
first step selects suitable technologies, the second one finds out where it is necessary
to remediate and how.
The information from the three assessment modules, mainly in the form of indicators,
are integrated in the final decisional module by means of the multi-criteria analysis
(MCDA), which can play a key-role to simplify effectively this process.
In the DESYRE framework, the MCDA tools appear twice. At the beginning, when a
pool of suitable technologies is to be defined, a MCDA module assigns a score to
each technology on the basis of key-criteria like cost, development time, efficiency,
reliability and so on. This method is applied to each set of technologies chosen by the
expert. In a second level, each remediation scenario proposed by the Expert is
evaluated by the Decision Makers in a Group Decision Making context.
DESYRE requires an active role of the Expert in order to avoid any simplifications
triggered by a non user oriented application to the DSS13.
46
Chapter 3 - Literature Review
3.6.5 Conceptual Framework for Understanding Brownfields
Redevelopment Issues (Bayesian Influence Diagrams)
The Department of Civil and Environmental Engineering at Florida International
University demonstrates the use of Bayesian influence diagrams, a formal decision
analytic tool, as a qualitative tool for modelling the complex relationships that exist
among fundamental brownfield redevelopment issues.
These models are powerful tools for clarifying and communicating the significant
relationships that exist between important issues and variables in brownfield
redevelopment14.
Brownfield redevelopment decision making must deal with the following fundamental
issues: technical (relating to the availability of feasible remediation technologies),
legal liability (relating to uncertainties over the types and extents of legal liability
associated with a site), financial (relating to the availability of viable options for
financing site assessment, remediation, and redevelopment), community concerns
(relating to public health and environmental resource protection), and site
redevelopment prospects.
The Bayesian influence diagrams are graphical tools for representing decision
problems as shown in Figure 3.2 and they contain all the components of a decision
problem, that is, the decision objectives, decision options, values, uncertainties, and
the relationship among them.
47
Chapter 3 - Literature Review
Chance
Node A
Decision Value
Node Node
Chance
Node B
Fig. 3.2 - Simple influence Diagram
(Source: Attoh-Okine N. O., Gibbons J., (2001) - Use o f belieffunction in brownfield
infrastructure redevelopment decision making — Journal of Urban Planning
and development Vol. 127, No.3)
Through the use of influence diagram software packages such as InDia (influence
diagram processor) the system builds a separate single-attribute influence diagram
model to capture the redevelopment potential of brownfields from the perspective of
the five major issues: technical, legal, financial, community concerns and site
redevelopment prospect.
Then the system combines all the single-issue influence diagrams in a comprehensive
multiple-issue brownfield decision model that is undoubtedly complex and depicts the
important relationships among competing objectives, values and uncertainties in
brownfield redevelopment.
In my opinion this model demonstrates the strengths of influence diagram modelling
as the problem becomes larger. Despite the size of the problem, the model remains
48
Chapter 3 - Literature Review
compact and clearly highlight the existing qualitative interrelationships among
variables through probabilistic and value dependencies.
3.6.6 Multicriteria Analysis and GIS for Territory - MAGISTER
MAGISTER is a decision support model suited for land planning. Its main objective
is to help land planners translate general policy statements into concrete localisation
decisions.
MAGISTER is similar to a decision support system and it includes three main
components: a database management system, a set of models, and a module for the
evaluation and selection of the alternative solutions. The database management
system is a GIS, which manages the geographical database describing the study area.
The tool allows simulations with hydrologic models, air quality models or
demographic models depending on the decision-making domain.
Multicriteria Decision Analysis (MCDA) is used to sort and select the alternatives
provided by spatial analysis.
The system is a conceptual combination of tools to assist land-planners and facilitate
social acceptance of the decision support process. The involved actors are not faced
with a predefined system, but can control choices related to the models and the
software. In this way the decision support procedure is specifically adapted to the
context (geographical region and scale) and to the given problem (e.g. water
management and highway planning).
Another important feature of MAGISTER is that it enables and promotes the
participation of all actors and experts in the decision process.
49
Chapter 3 - Literature Review
A procedure that uses MAGISTER in land suitability assessment has been developed
and this procedure could be applied by a land planning department to produce land
suitability maps for the most important land-uses (e.g. housing, manufacturing,
agriculture). Once the maps are available, land planners could analyse any new
project by using a simple operation like map overlay or statistical analysis.
In developing this application eight selecting criteria were identified:
impacts on a nature reserve, landscape;
- air pollution;
- noise due to traffic;
- accessibility;
local climate;
risk of landslide
distance to public facilities
Each criteria is evaluated using a different set of data, at an appropriate scale, and
with a specific model. For most of the criteria, spatial analysis procedures using a
raster GIS are elaborated. The criteria modelling produces a set of maps, one for each
criterion, on which the score for each elementary surface is indicated.
The next step is the aggregation of the partial suitability indexes into a holistic
suitability index. This aggregation is realized with a multicriteria decision analysis
method using a partial aggregation (called outranking methods). Outranking methods
50
Chapter 3 - Literature Review
are well suited for land planning purposes since they can handle simultaneously
qualitative and quantitative criteria.
The method compares possible alternatives on a criterion by criterion basis and
computes an index (called the degree of credibility) for each pair of alternatives that
qualifies or ranks one alternative relative to another. If a comparison is made between
alternative A and B the index is calculated twice. The outranking degree of credibility
(which has a value between 0 and 1) of A over B is first calculated and then of B over
A. The degree of credibility is estimated and used to assess whether the hypothesis: A
is at least as good as B, is true. It is the product of two factors: the concordance -
computed with the criteria where the score of A is at least as good as the score of B,
the discordance - is based only on the criterion with the most important difference in
favour of B. On the basis of these results, the procedure classifies the alternatives (the
zones) in favourable, doubtful and unfavourable.
All data are then stored in GIS (Mapinfo) tables. The alternatives and reference zones
are in tables linked with spatial objects. The weights and the thresholds associated
with each criterion are stored in a non-spatial table. The reference zones can also be
directly selected from the maps describing the study area.
Land suitability study can imply a large number of alternatives to compare and
unfortunately the outranking methods are not able to compare a lot of alternatives. So
the system is mainly utilised where the study area is divided into zones that are fewer
than elementary surfaces or pixels15.
51
Chapter 3 - Literature Review
3.6.7 Sustainable City - GIS software for urban management
Global Vision Corporation, a Non Governmental Organisation accredited to the
United Nations Commission on Sustainable Development (CSD) is developing a
project about the sustainable city.
This is part of the international follow-up to Habitat II - the Second United Nations
Conference on Human Settlements (June 1996), where it was nominated as a
Corporate Best Practice at the World Business Forum on Enterprise, the City, and
Sustainable Development.
Sustainable City is an international collaborative research endeavour to develop the
world’s first GIS (Geographical Information Systems) computer simulation
programme for any town or city to see itself - and its surrounding environment - as a
whole system.
Sustainable City is designed as a practical tool for sustainable development planning.
Its 48 applications will help urban stakeholders to understand and balance their
community, economic, and ecosystem development needs, and will enable them to:
identify problems, visualise solutions, and increase management effectiveness;
carry out scenario planning to measure and compare the environmental, social,
and economic risks and benefits of various development and management
alternatives;
formulate the community vision needed to implement Local Agenda 21;
save money by greater efficiency in energy, water and other resource
consumption
52
Chapter 3 - Literature Review
create jobs and identify new markets for environmentally-sound products and
services;
perform annual environmental audits, measure the load which a city’s
metabolism places on the carrying capacity of the surrounding
local/regional/global ecosystem, quantify its sustainability index, and evaluate
its progress towards sustainability.
The whole system model is a user friendly 2D or 3D generic computer simulation
program capable of modelling any town or city - and its surrounding environment - as
a whole system. The system has the capacity to simulate problems, measure costs,
create scenarios, visualise solutions, and calculate untapped benefits.
The system includes:
object-oriented 2 or 3D Geographic Information Systems (GIS) mapping of
the urban centre and surrounding environment with parameters such as
infrastructure, buildings, energy, water, materials, thermodynamics,
population, transportation, industry, markets, real-estate, economics,
employment, health, crime, homelessness, pollution, recycling, and
opportunities for synergetic solutions;
- mapping of the city's ecological footprint (sources and sinks) on the
surrounding eco-social environment, both locally and globally;
the use of remote sensing satellite imaging to model infrastructure, buildings,
individual cars, landfills, individual trees, and other environmental data. Better
than maps, and updatable every day;
53
Chapter 3 - Literature Review
data input such as topographical, geological, hydrological, ecological and
meteorological maps; aerial photography; urban heat island analysis; census
data; population densities; urban planning info; zoning; building codes;
building HVACS (heating, ventilation and air-conditioning systems)
information; tax maps; vehicular and pedestrian transportation; building age
and ownership; land use; electricity and fuel consumption;
a particular focus on the city's local bioregion (watershed, ocean basin,
biogeographical zone, etc);
sustainability indicators of a city's progress towards sustainability, including
social, economic, and environmental parameters. The system uses the core set
of 46 indicators developed by the United Nations Center for Human
Settlements (UNCHS) / World Bank Indicators Programme. In addition, it will
provide some 1,500 built-in indicators which users can choose to meet the
specific needs of their local city.
The software is still under construction and Global Vision hopes to beta test the
software on the city of Geneva, Switzerland, which is currently launching a major
Local Agenda 21 initiative16.
3.6.8 Sustainable Development Indicators - The Dashboard
The Consultative Group on Sustainable Development Indicators at the International
Institute for Sustainable Development (Canada) has developed a Dashboard of
Sustainability.
54
Chapter 3 - Literature Review
The Dashboard is an instrument panel designed to inform decision-makers, the media
and the general public on the status of a nation's progress toward, or away from,
sustainability.
The Dashboard presents sets of indicators in a simple pie chart format based on three
principles:
the size of a segment reflects the relative importance of the issue described by
the indicator;
a colour code signals performance relative to others: green means “good”, red
means “bad”;
the central circle (PPI, Policy Performance Index) summarizes the information
of the component indicators.
The Dashboard was made functional by using forty-six indicators to compose the
three main clusters for over one hundred countries. Aggregation algorithms and
graphic presentation software have been developed. An animated version of the
Dashboard presents data on each component indicator, as well as on the three cluster
indices and the overall sustainability index.
In this system the data of any one country and any one indicator and index can be
compared to that of any other country. The specification has a built in flexibility and
the clusters can be modified according to the end-users' specific needs, without
changing the functioning of the Dashboard.
The systems also allows presentation of complex relationships in a format that is
digestible for decision-makers and other persons who might specialise in one field
55

Chapter 3 - Literature Review
(e.g. environment or social issues or economics), but need to integrate policy fields in
which they are not experts, into their work.
The Dashboard presents, through its colour code, the weak and strong points by
country and for each indicator relative to the other 100+ countries contained in the
database. For each indicator, the performance colour can be displayed relative to the
value one would expect for the given level of income (this gives Developing
Countries a chance to compete)17.
Two or three countries can be displayed side by side for a given policy field, thus
allowing a quick look at their relative performance. For example, the social indicators
for France, Belgium and Germany can be displayed next to each other. For each
indicator, the distribution can be displayed, allowing the user to assess the
meaningfulness of the indicator and to identify outliers, etc.
For each pair of indicators, a scatter plot presents the correlation. A list of indicators,
sorted by "best fit," allows identification of the most relevant linkages. In particular,
these functions allow identification of synergies (indicators whose "desirable" values
are positively correlated) and potential conflicts (e.g. environment vs. many economic
and social variables).
The Dashboard is currently under enhancement and will include the following
features:
1. Support the work of participating NGOs and organisations in the developing
countries and provide co-ordination throughout the work
56

Chapter 3 - Literature Review
2. Disseminate the first tested version of the detailed Dashboard and reach out to
the media to help influence key decision-makers and the public discourse in a
variety of audiences, including regional and municipal level decision-makers
3. Test the Dashboard in selected local communities and municipalities, linking
it to sustainable development and Local Agenda 21 strategies and action plans.
3.6.9 Global System for Sustainable Development
The Consortium of Global Accords for Sustainable Development, Massachusetts
Institute of Technology developed a Global System for Sustainable Development.
The Global System for Sustainable Development (GSSD) is a multi-dimensional
knowledge networking system of public and private networks, based on an integrated
framework and an evolving quality controlled cross-referenced knowledge base.
The system explores innovative responses to sustainability challenges at all levels of
development, in all parts of the world. The GSSD provides networking facilities
across stakeholder communities to help identify innovative approaches, enabling
technologies, as well as new institutional, financial and regulatory mechanisms for
meeting sustainability challenges that confront us all, in both rich and poor
countries18.
The system provides evolving, dynamic, interactive, contextual, and distributed meta
networking facilities focused on one issue of major importance for decision makers
across the world: dilemmas of sustainability.
57

Chapter 3 - Literature Review
The GSSD is designed to:
Make evolving knowledge about sustainability more accessible to agents of
change for public policy, business strategy and creative ventures by
facilitating access to cutting-edge analysis, innovative technologies, and
multidisciplinary knowledge
Facilitate knowledge-sharing through customised search engines, quality-
controlled knowledge-mining tools, multilingual capacities, and decision-tools
to identify options available in technologies, policies and strategies
Provide leadership and vision in the use of advanced information and
communication technologies by strengthening capacities for knowledge access
and informed decision-making and providing tools.
The GSSD is a computer implemented method for facilitation identification and
storage of data and the communication of information among a plurality of
geographically separated entities working to solve problems related to global
sustainability.
The sustainability issue areas considered in this system are: energy use and resources,
trade and finance, industry and manufacturing, mobility, agriculture, forest and land
use, water use, conflicts, urbanisation, consumption, unmet basic needs, population,
migration and governance and institutions.
The system organizes knowledge and data related to global sustainability problems
into several hierarchies of interrelated sub-concepts stored on a several computer
systems interconnected by a number of communication links. Each sub-concept of
58

Chapter 3 - Literature Review
hierarchies belongs to a category and has a t least one attribute and one sub-attribute.
At this level the system provides access of plurality of entities, to data within any of
sub-concepts stored in pluralities of remote locations in response to mapping
specifications.
3.7 Research Projects for Brownfield Regeneration
At European, International and Local level there are different research projects and
programme that have been undertaken to provide guidelines, advice, and support in
sustainable brownfield regeneration.
Most of these projects utilise case studies to highlight best practice in regeneration
that can be easily transferred to different social, economic and institutional contexts.
In the following paragraphs an overview of National and International research
projects is provided.
3.7.1 RESCUE Regeneration of European Sites in Cities and Urban
Environments
RESCUE was a research project in the framework of key action IV "Cities of
tomorrow and cultural heritage" of the specific programme "Energy, environment and
sustainable development" within the 5th Framework Programme of the European
Community in the field of research, technological development and demonstration.
The project started in March 2002 as a 36-month research project integrating the
concept of sustainability into brownfield regeneration. Based on an analysis and
evaluation of current practice in industrial core regions in France (Nord-Pas de
Calais), United Kingdom (Derbyshire, North-East of England), Poland (Silesia) and
59
Chapter 3 - Literature Review
Germany (Ruhr Area, Southern District of Leipzig), RESCUE attempted to distil best
practice approaches at reduced costs and integrate its results into a holistic system
approach containing new methodologies, procedures and instruments for the
sustainable regeneration of European industrial brownfield sites.
RESCUE developed tools for the practical work of real estate owners, planners,
architects, engineers and public authorities involved in the complex processes of
brownfield regeneration projects. By reducing the costs of land rehabilitation,
RESCUE addressed current obstacles in regeneration projects, contributed to reduce
the demand for greenfield development and therefore saved natural resources19.
The regeneration process was broken down into the main steps of decision making
and analysed along transnational work packages such as:
management of contamination and reuse of soil and debris
management of existing buildings and infrastructures
sustainable land use and urban design on brownfield sites
sustainable planning processes and methods for citizen participation
tools for management of brownfield projects
virtual training centre
The main result is a “Best Practice Guidance for Sustainable Brownfield
Regeneration”. This Manual provides both scientifically and practically tested
guidance and substantial decision making tools for stakeholders, public administration
60
Chapter 3 - Literature Review
and financial funding bodies. The Manual gives a flavour of all the substantial tools
that RESCUE has produced:
- the RESCUE Sustainability Assessment Tool (SAT) which provides a
methodology for a site specific ex ante evaluation of intended brownfield
projects in terms of sustainability which should be used as a precondition for
planning permissions and public funding;
Administrative Tools and Incentives for sustainable brownfield regeneration
which suggest a framework to support sustainable brownfield regeneration
End-user tools for sustainable brownfield regeneration which enlarge the
practical toolbox to support sustainable outcomes
VTC Virtual Training Centre which provides web based training resources for
sustainable brownfield regeneration.
3.7.2 CABERNET Concerted Action on Brown field and Economic
Regeneration Network
CABERNET, is a multidisciplinary network funded by the EU (in 2002) comprising 6
expert Working Groups that aim to facilitate new practical solutions for urban
brownfields and examine ways to encourage sustainable management of brownfield
or previously-developed land20. Its vision is to enhance rehabilitation of brownfield
sites, within the context of sustainable development of European cities, by the
provision of an intellectual framework for coordinated research and development of
tools.
61

Chapter 3 - Literature Review
The Network applies an innovative multi-stakeholder approach to achieve its key
objectives, listed below:
Better awareness and shared understanding of brownfield issues across
stakeholder groups
A conceptual model for brownfield issues
Coordinated research activities across different sectors and countries
Identification of best practice approaches and other tools
The work programme moves through three key stages of interaction, with the
Members starting in their respective stakeholder groups:
During the first stage of the programme of work (stage 1) the groups define
their roles and characterise their influence on the redevelopment process, as
well as collating baseline information and developing the conceptual model.
The second stage (stage 2) focusses on specific integrated issues. The
Stakeholder Groups will 'mix' to form Working Groups. These groups
examine the complexity of the issues from a multi-stakeholder perspective in
order to enhance shared understanding and ensure integrated solutions.
In the final stage (stage 3), members draw together the findings of stages 1 and
2 to produce overviews and targeted outputs to meet the key objectives of the
network.
62
Chapter 3 - Literature Review
3.7.3 SUBR:IM Sustainable Urban Brownfield Regeneration: Integrated
Management
SUBR:IM is a consortium funded by EPSRC under its Sustainable Urban
Environments initiative and the Environment Agency21. It is a four-year programme
which draws together ten major academic and research institutions in a programme
designed to improve the quality of urban environments. It comprises 18 projects
linking science and social science to tackle brownfield research problems.
The Consortium aims to develop technical solutions and tools for restoring
brownfield land in urban areas, whilst at the same time increasing the knowledge base
of all stakeholders involved in such development. This includes investors, developers,
planning bodies and local authorities, but also the general public and engineers who
work with such problems.
The projects undertaken by SUBR:IM includes a wide range of aspects such as:
project and portfolio management, the role of the development industry, multi-level
decision making processes, metrics, robust technical solutions, integrated remediation
and greening, quality in land remediation, brownfields flooding and climate change,
designing and managing wetland habitat systems on brownfield land.
3.7.4 REVITRevitalising Industrial Sites
REVIT receives 10 million Euro from European Regional Development Funding
(ERDF), allocated under the European Community Initiative INTERREG III B (2000
- 2006) which supports transnational co-operation in the field of spatial development
between national, regional and local authorities and a wide range of non
governmental organisations. Six partners (Landeshauptstadt Stuttgart - Germany,
63
Chapter 3 - Literature Review
Conurbation of Nantes - France, City of Tilburg - The Netherlands, City of Hengelo
- The Netherlands, Torfaen County Borough Council - UK, Medway Council - UK,)
are involved in the REVIT project and they confront problems in the context of
brownfield regeneration that are in essence very similar and need to be tackled more
effectively by improved co-operation within the North West European region22.
The overall goal of REVIT is to significantly increase the efficiency and wider
sustainability of applied brownfield regeneration policy through transnational co
operation among the 6 North-West Europe partners. This cooperation increases the
“efficiency” and “wider sustainability” of applied brownfield regeneration policies.
“Efficiency” of brownfield regeneration policies is improved through promoting a
stronger integration / co-ordination of policy instruments and a greater participatory
dimension of regeneration processes. “Wider sustainability” of brownfield
regeneration policies is improved through better linking multi-functional development
/ re-use designs for currently existing brownfield sites (including a preservation of
industrial heritage potentials) with an elimination of site-specific environmental
damages and a protection of other natural assets on or around revitalised brownfields.
In order to realise the overall project goal the six partners focus on three “Common
Cooperation Issues” (CCIs):
Formal and informal brownfield regeneration instruments and methods that
stimulate participation and community involvement.
New financing techniques, public private partnership models and re-use
marketing concepts in the context of brownfield regeneration.
64

Chapter 3 - Literature Review
Multi-functional development, preservation/intelligent re-use of industrial
heritage potentials and elimination of environmental damages/protection of
natural assets.
Until August 2007, the transnational working teams will develop new approaches for
different aspects of brownfield regeneration. To ensure the practical realisability of
the new approaches the teams will be testing the new tools in each partner area before
publishing final guidelines and recommendations.
65
Chapter 3 - Literature Review
REFERENCES:
1. a) Schrenk V., Schlicher T., Barczewski B. - Interdisciplinary Research
Activities in Brownfield Redevelopment in the Federal State of Baden-
Wurttemberg, Germany
b) Johnson K.L., Dixson C.E., Tochterman S.C., (2002) - Brownfield
redevelopment and transportation planning in the Philadelphia region -
Institute of Transportation Engineers ITE Journal Vol. 72, Issue 7, pp 26-31
c) Nijkamp P., Rodenburg C.A., Wagtendonk A.J., (2002) - Success factors
for sustainable urban brownfield development: a comparative case study
approach to polluted sites - Ecological Economics Vol.40, pp 235-252
2. Christos Stergiou and Dimitrios Siganos, (1996) - Neural Networks - Surveys
and Presentations in Information System Engineering (SURPRISE),
Department of Computing, Department of Electrical and Electronic
Engineering, Imperial College of Science Technology and Medicine, London,
Vol.4
3. Mehner, H. Fairbaim, D. Csaplovics, E. Cutler, M.E. (2004) - Transferability
of Artificial Neural Networks for Mapping Land Cover o f Regional Areas
With High Spatial Resolution Imagery - International Archives of the
Photogrammetry, Remote Sensing and Spatial Information Sciences 35(7):
910-915
4. S. Kralisch, M. Fink and C. Beckstein (2003) - Multi-Objective land use
optimization with artificial neural networks - Geophysical Research Abstracts,
Vol. 5, 10067, 2003
66
Chapter 3 - Literature Review
5. Attoh-Okine N. O., Gibbons J., (2001) - Use of belief function in brownfield
infrastructure redevelopment decision making - Journal of Urban Planning
and development Vol. 127, No.3
6. Moon Tae Heon (2000) - GIS Integrated Simulation System of Land Price for
Appraisa and ANN - United States Geographical Information Society, Issue
2000, pp.31-41
7. Henning Sten Hansen (2002) - A fuzzy logic approach to urban land-use
mapping - National Environmental Research Institute, Ministry of
Environment & Energy. Available from:
www.scangis.org/scangis2003/papers/25.pdf
8. E. Banzhaf and M. Netzband (2003) — Detecting urban brownfields by means
of high resolution satellite imagery - Commission VII, WG VII/4. Available
from: www.ufz.de/data/Banzhaf-Netzband-20043376.pdf
9. Boot H.R., (2000) - London ’s Brownfield Resource Pilot Project: the Wandle
Valley - Centre for Advanced Spatial Analysis - Working Paper 14. Available
from: http://www.casa.ucl.ac.uk/publications/workingPaperDetail.asp?ID= 14
10. Boot H.R., Heppell K., Haklay M., Morley J., (2001) - The use o f GIS in
brownfield redevelopment - Centre for Advanced Spatial Analysis, University
College of London
11. Thomas M.R., (2002) — A GIS-based decision support system for brownfield
redevelopment - Landscape and Urban Planning 58, pp 7-23
12. Critto A., Nadal N., Samiolo M., Carlon C., Silvoni S., Foramti, S., and
Marcomini A., Petruzzelli, (2002) - “DESYRE- Decision Support sYstem for
REHabilitation of contaminated sites: objectives and structure ” - Proceedings
of the Integrated Assessment and Decision Support - Conference, Lugano,
Switzerland
67
Chapter 3 - Literature Review
13. Carlon C., Giove S., Agostini P., Critto A., Marcomini A., (2004) - The role
of Multicriteria Decision Analysis in a Decision Support System for
Rehabilitation of contaminated sites (the DESYRE software) - International
Environmental Modelling and Software Society (iEMSs) - Complexity and
Integrated Resources management transactions on the 2nd Biennial meeting of
the iEMSs, Vol. 2, pp 629-634
14. Amekudzi A.A, Attoh-Okine N.O., (1997) - Conceptual Frameworks for
Understanding Brownfields Redevelopment Issues — Infrastructure, Vol.2,
No.2, pp 45-59
15. Joerin F., Theriault M., Musy A., (2001) - Using GIS and outranking
multicriteria analysis for land-use suitability assessment — International
Journal Geographical Information Science, Vol. 15, No.2, pp 153-174
16. Sustainable City, GIS Software for urban Management - Available from:
http ://www. global-vision, org/citv/ index. html
17. Sustainable Development Indicators - The Dashboard - Available from:
http://esl.irc.it/dc/
18. Global System for Sustainable Development - Available from:
http://web.mit.edu/gssd/consortium/index.html
19. RESCUE, The Project - Available from: http://www.rescue-
europe.com/html/proj ect.html
20. Contaminated Rehabilitation Network for Environmental Technologies
(CLARINET) 2002 - Review of Decision Support Tools for Contaminated
Land Management and their use in Europe - Available from:
http://www.clarinet.at/librarv/final report 1102.pdf
68

Chapter 3 - Literature Review
21. SUBR.IM Sustainable Urban Brownfield Regeneration: Integrated
Management - Available from: http://www.subrim.org.uk/contact/contact.php
22. Revitalising Industrial Sites - Available from: http://www.revit-
nweurope.org/about.php
69
Chapter 4
Methodology
4.1 Methodology
The methodology used to develop the Decision Support System includes the
integration of fuzzy logic and artificial neural networks within a Geographical
Information System.
4.2 Fuzzy Logic
Fuzzy Logic (FL) is a problem-solving control system methodology that provides a
simple way to arrive at a definite conclusion based upon vague, ambiguous,
imprecise, noisy, or missing input information. Fuzzy Logic's approach to control
problems mimics how a person would make decisions, only much faster1.
FL incorporates a simple, rule-based IF X AND Y THEN Z approach to solving a
control problem rather than attempting to model a system mathematically. The FL
model is empirically-based, relying on an operator's experience rather than their
technical understanding of the system. For example, rather than dealing with
temperature control in terms such as "SP =500F", "T <1000F", or "210C <TEMP
<220C", terms like "IF (process is too cool) AND (process is getting colder) THEN
(add heat to the process)" or "IF (process is too hot) AND (process is heating rapidly)
THEN (cool the process quickly)" are used. These terms are imprecise and yet very
descriptive of what must actually happen.
70
Chapter 4 - Methodology
FL requires some numerical parameters in order to operate, such as what is
considered significant error and significant rate-of-change-of-error, but exact values
of these numbers are usually not critical unless very responsive performance is
required in which case empirical tuning would determine them.
Fuzzy Logic offers several unique features that make it a particularly good choice for
many control problems:
It is inherently robust since it does not require precise, noise-free inputs. The
output control is a smooth control function despite a wide range of input
variations.
Since the system processes user-defined rules, it can be modified easily to
improve and drastically alter the performance.
To create a fuzzy controlled machine there are three main steps that needs to be
undertaken: rule evaluation (application of fuzzy rules), fuzzification (using
membership functions to graphically describe a situation), defuzzification (obtaining
the crisp or actual results)2.
4.2.1 Rule evaluation and the fuzzy associative memory
The rules to represent all the combinations of inputs are set up in the fuzzy associative
memory matrix (rule matrix). The matrix can have a different number of rows than
columns. This occurs when numerous degrees of inputs are needed. The maximum
number of possible rules is simply the product of the number of rows and columns,
but definition of all of these rules may not be necessary since some input conditions
may never occur in practical operation. The primary objective of this construct is to
71
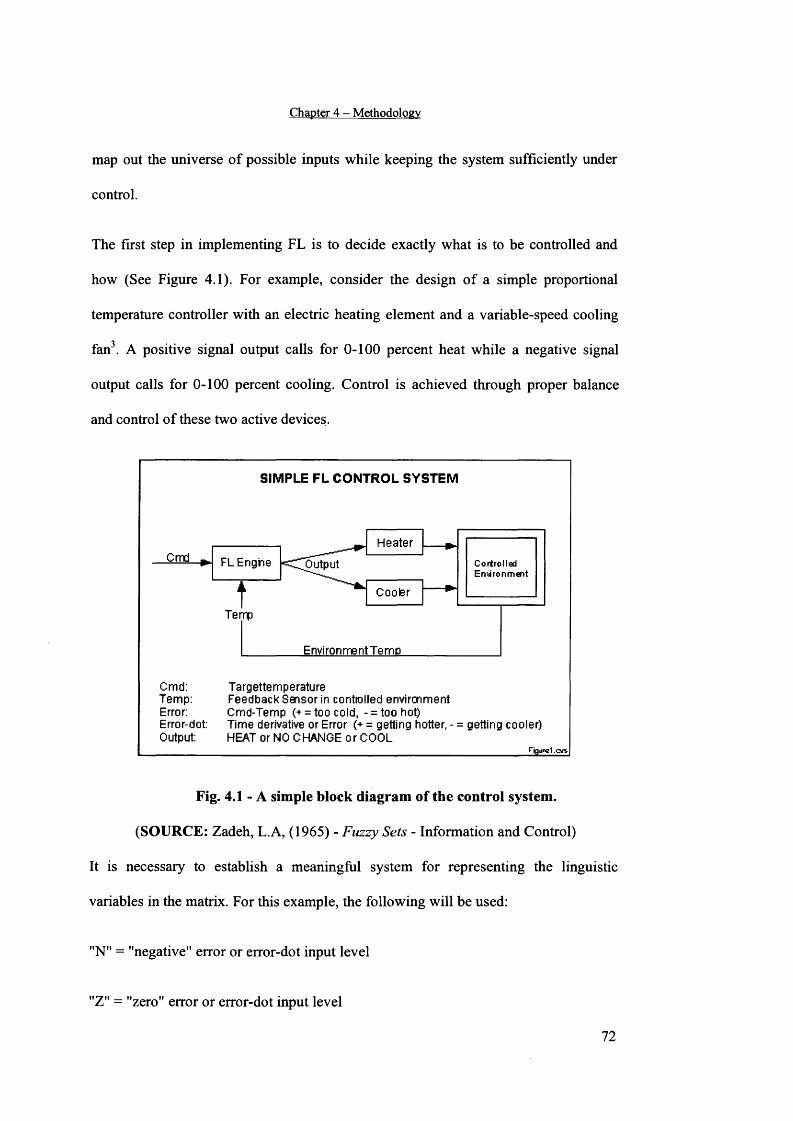
Chapter 4 - Methodology
map out the universe of possible inputs while keeping the system sufficiently under
control.
The first step in implementing FL is to decide exactly what is to be controlled and
how (See Figure 4.1). For example, consider the design of a simple proportional
temperature controller with an electric heating element and a variable-speed cooling
fan3. A positive signal output calls for 0-100 percent heat while a negative signal
output calls for 0-100 percent cooling. Control is achieved through proper balance
and control of these two active devices.
SIMPLE FL CONTROL SYSTEM
C o r t r o l l e d E n v i r o n m e n t
Temp
j_________ Environment Temp_______________
Cmd: TargettemperatureTemp: Feedback Sensor in controlled environmentError: Cmd-Temp (+ = too cold, - = too hot)Error-dot: Time derivative or Error (+ = getting hotter, - = getting cooler)Output: HEAT or NO CHANGE or COOL
rjgunal.CT*
Fig. 4.1 - A simple block diagram of the control system.
(SOURCE: Zadeh, L.A, (1965) - Fuzzy Sets - Information and Control)
It is necessary to establish a meaningful system for representing the linguistic
variables in the matrix. For this example, the following will be used:
"N" = "negative" error or error-dot input level
"Z" = "zero" error or error-dot input level
72
Cmd Output
Cooler
Heater
FLEnghe
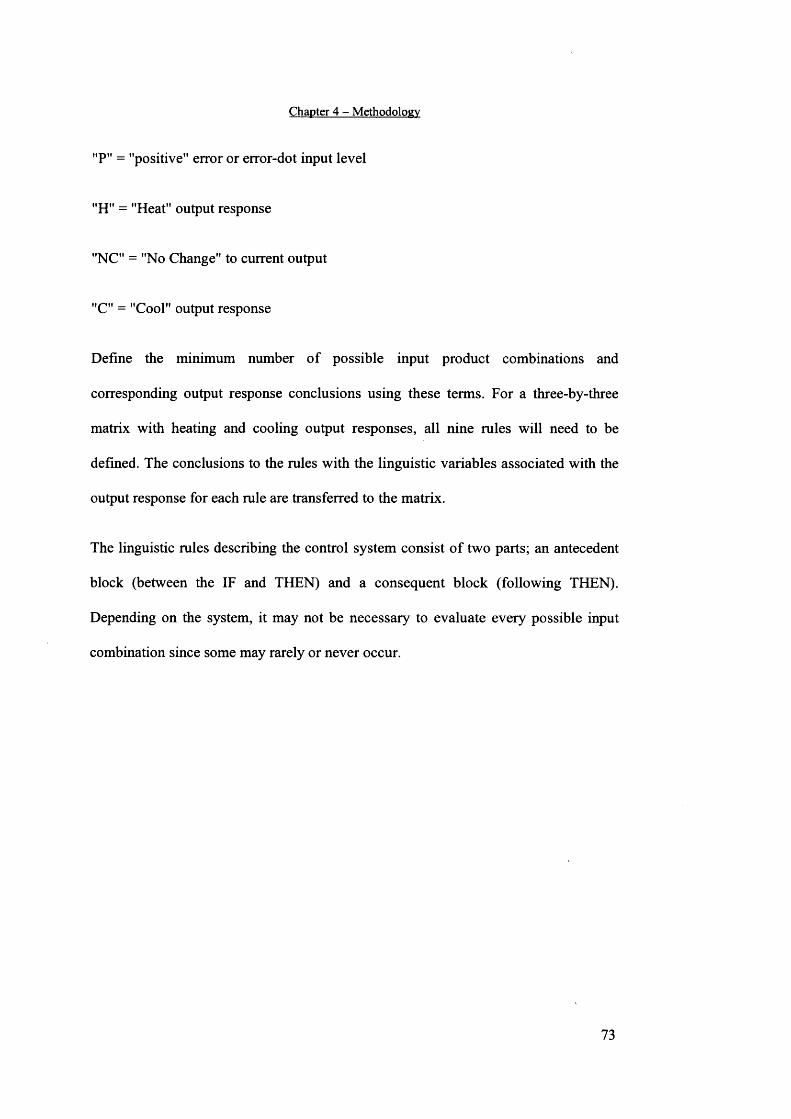
Chapter 4 - Methodology
"P" = "positive" error or error-dot input level
"H" = "Heat" output response
"NC" = "No Change" to current output
"C" = "Cool" output response
Define the minimum number of possible input product combinations and
corresponding output response conclusions using these terms. For a three-by-three
matrix with heating and cooling output responses, all nine rules will need to be
defined. The conclusions to the rules with the linguistic variables associated with the
output response for each rule are transferred to the matrix.
The linguistic rules describing the control system consist of two parts; an antecedent
block (between the IF and THEN) and a consequent block (following THEN).
Depending on the system, it may not be necessary to evaluate every possible input
combination since some may rarely or never occur.
73
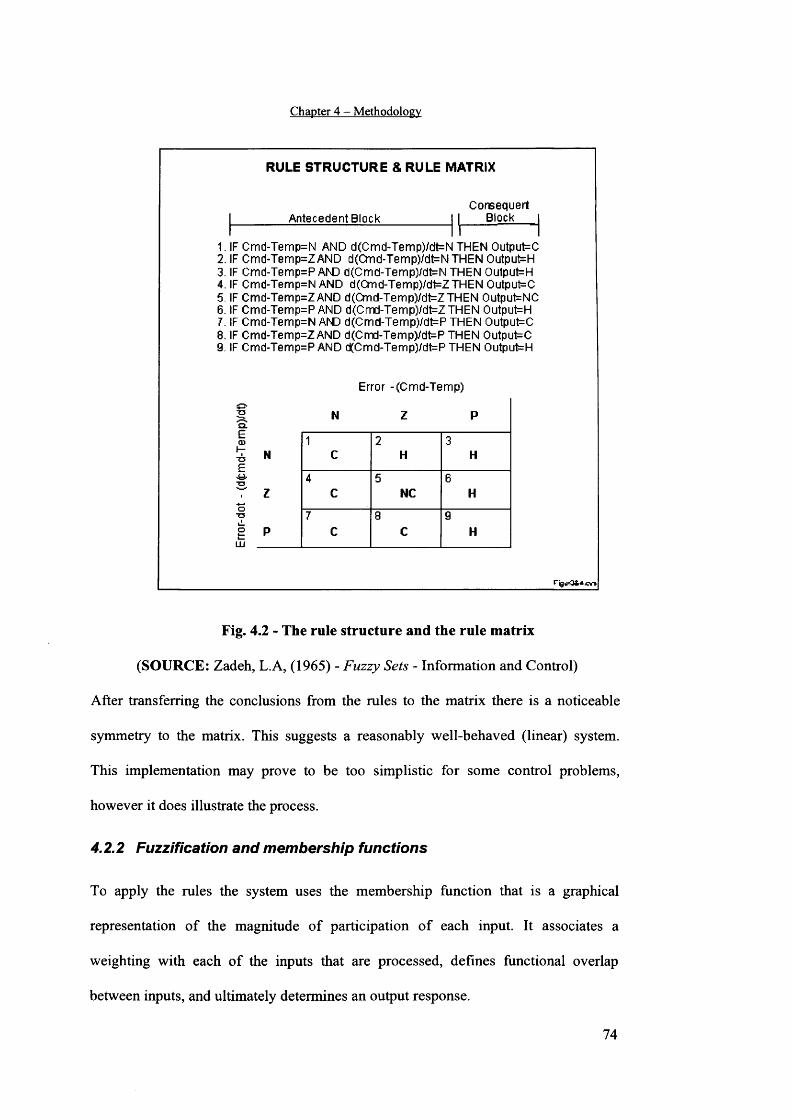
Chapter 4 - Methodology
RULE STRUCTURE & RULE MATRIX
Antecedent BlockConsequert
Block
1. IF Cmd-Temp=N AND d(Cmd-Temp)/dt=N THEN Output=C2. IF Cmd-Temp=Z AND d(Cmd-Temp)/dt^NTHEN Output=H3. IF Cmd-Temp=P AND d(Cmd-Temp)/dt=N THEN Output=H4. IF Cmd-Temp=N AND d(Cmd-Temp)/dt=ZTHEN Output=C5. IF Cmd-Temp=ZAND d(Cmd-Temp)/dt=ZTHEN Output=NC6. IF Cmd-Temp=P AND d(Cmd-Temp)/dt=ZTHEN Output=H7. IF Cmd-Temp=N AND d(Cmd-Temp)/dt=P THEN Output=C8. IF Cmd-Temp=Z AND d(Cmd-Temp)/d^P THEN Output=C9. IF Cmd-Temp=P AND d(Cmd-Temp)/dt=P THEN Output=H
Error -(Cmd-Temp)
O LECDI-i
T5
N Z P
N1
C2
H3
H
Z4
C5
NC6
H
P7
C8
C9
H
Fig. 4.2 - The rule structure and the rule matrix
(SOURCE: Zadeh, L.A, (1965) - Fuzzy Sets - Information and Control)
After transferring the conclusions from the rules to the matrix there is a noticeable
symmetry to the matrix. This suggests a reasonably well-behaved (linear) system.
This implementation may prove to be too simplistic for some control problems,
however it does illustrate the process.
4.2.2 Fuzzification and membership functions
To apply the rules the system uses the membership function that is a graphical
representation of the magnitude of participation of each input. It associates a
weighting with each of the inputs that are processed, defines functional overlap
between inputs, and ultimately determines an output response.
74
Chapter 4 - Methodology
There is a unique membership function associated with each input parameter. The
membership functions associate a weighting factor with values of each input and the
effective rules. These weighting factors determine the degree of influence or degree of
membership (DOM) each active rule has. By computing the logical product of the
membership weights for each active rule, a set of fuzzy output response magnitudes
are produced.
The shape of membership functions can be different. In general, the triangular is
common (see Figure 4.3), but bell, trapezoidal, haversine and, exponential have been
used. More complex functions are possible but require greater computing overhead to
implement4.
MEMBERSHIP FUNCTIONS
I tQ )2 (B v - o O Q . <D ,>s
Shoddered
Centers
/ Negative Zero Positive
Z & P
[4 Width » |
EngheeringUnits (Typically lbs, deg F, or deg/m, ftfsec, etc.)
Fig. 4.3 - The features of a membership function
(SOURCE: Mitsuishi T., Endou T., Shidama Y., (2003) - The concept of fuzzy set
and membership function and basic properties of fuzzy set operation - Journal
of formalized mathematics, Vol. 12)
75
Chapter 4 - Methodology
The degree of membership (DOM) is determined by plugging the selected input
parameter into the horizontal axis and projecting vertically to the upper boundary of
the membership function(s).
4.2.3 Defuzzification
Once the functions are inferred, scaled, and combined, they are defuzzified into a
crisp output which drives the system.
Before undertaking the defuzzification process for crisp output generation, the logical
products for each rule must be combined or inferred. There are several inference
methods:
The MAX-MIN method tests the magnitudes of each rule and selects the
highest one. The horizontal coordinate of the "fuzzy centroid" of the area
under that function is taken as the output. This method does not combine the
effects of all applicable rules but does produce a continuous output function
and is easy to implement.
The MAX-DOT or MAX-PRODUCT method scales each member function to
fit under its respective peak value and takes the horizontal coordinate of the
"fuzzy" centroid of the composite area under the fimction(s) as the output.
Essentially, the member fimction(s) are shrunk so that their peak equals the
magnitude of their respective function ("negative", "zero", and "positive").
This method combines the influence of all active rules and produces a smooth,
continuous output.
- The AVERAGING method is another approach that works but fails to give
increased weighting to more rule votes per output member function. For
76
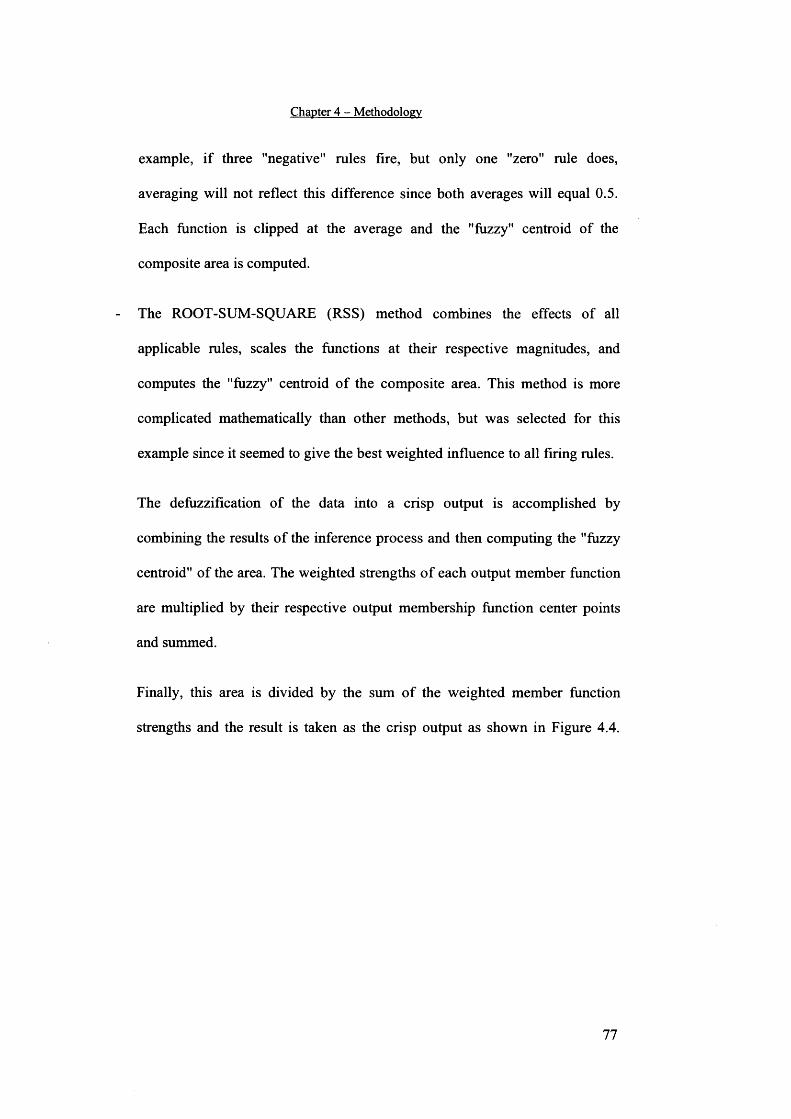
Chapter 4 - Methodology
example, if three "negative" rules fire, but only one "zero" rule does,
averaging will not reflect this difference since both averages will equal 0.5.
Each function is clipped at the average and the "fuzzy" centroid of the
composite area is computed.
The ROOT-SUM-SQUARE (RSS) method combines the effects of all
applicable rules, scales the functions at their respective magnitudes, and
computes the "fuzzy" centroid of the composite area. This method is more
complicated mathematically than other methods, but was selected for this
example since it seemed to give the best weighted influence to all firing rules.
The defuzzification of the data into a crisp output is accomplished by
combining the results of the inference process and then computing the "fuzzy
centroid" of the area. The weighted strengths of each output member function
are multiplied by their respective output membership function center points
and summed.
Finally, this area is divided by the sum of the weighted member function
strengths and the result is taken as the crisp output as shown in Figure 4.4.
77
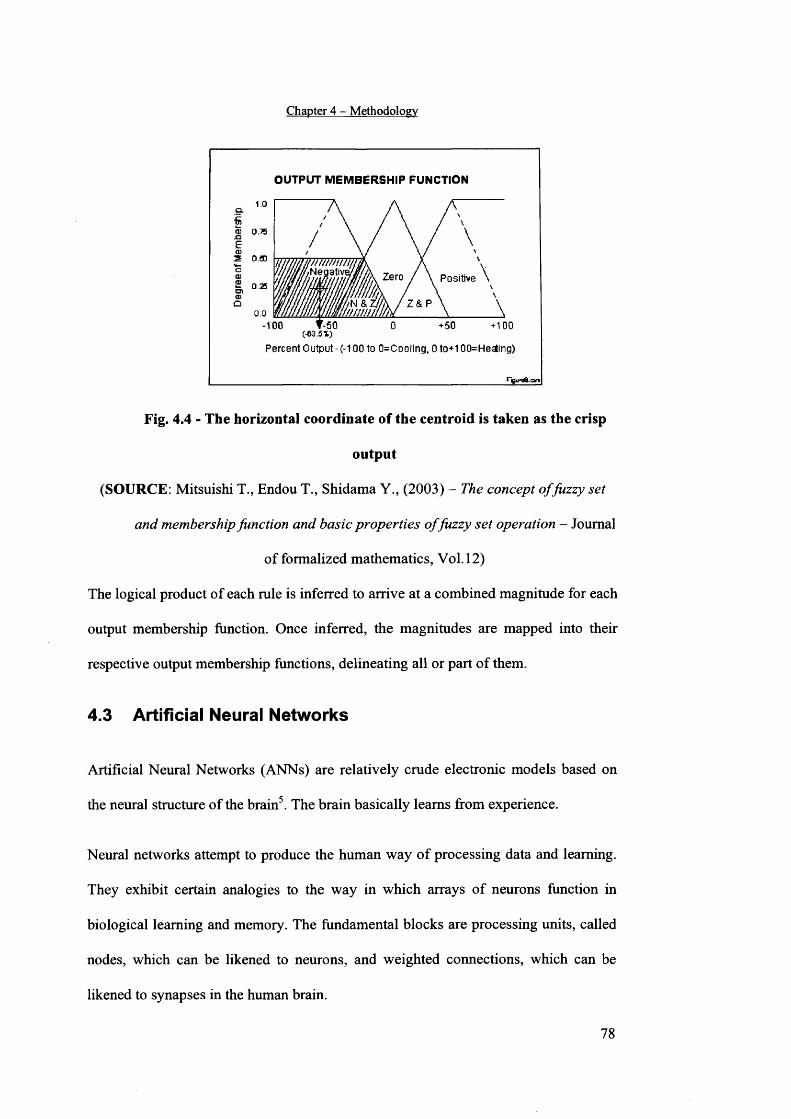
Chapter 4 - Methodology
OUTPUT M EM BERSHIP FUNCTION
Positive
-100 t - 5 0 0 +50 +100(-63.5%)
Percen t Output - (-100 to 0=Cooling, 0 to+100=H e^ing)
Fig. 4.4 - The horizontal coordinate of the centroid is taken as the crisp
output
(SOURCE: Mitsuishi T., Endou T., Shidama Y., (2003) - The concept of fuzzy set
and membership function and basic properties o f fuzzy set operation - Journal
of formalized mathematics, Vol. 12)
The logical product of each rule is inferred to arrive at a combined magnitude for each
output membership function. Once inferred, the magnitudes are mapped into then-
respective output membership functions, delineating all or part of them.
4.3 Artificial Neural Networks
Artificial Neural Networks (ANNs) are relatively crude electronic models based on
the neural structure of the brain5. The brain basically learns from experience.
Neural networks attempt to produce the human way of processing data and learning.
They exhibit certain analogies to the way in which arrays of neurons function in
biological learning and memory. The fundamental blocks are processing units, called
nodes, which can be likened to neurons, and weighted connections, which can be
likened to synapses in the human brain.
78
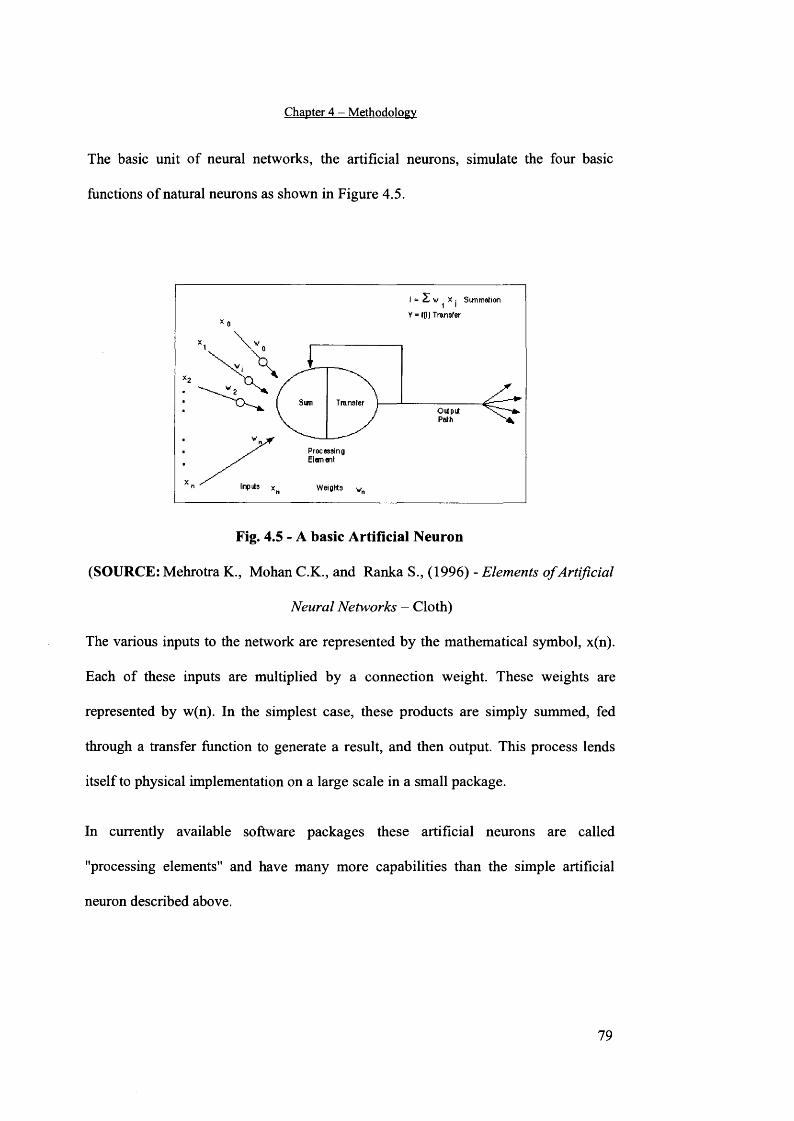
Chapter 4 - Methodology
The basic unit of neural networks, the artificial neurons, simulate the four basic
functions of natural neurons as shown in Figure 4.5.
Sun T ransfer
Wei a r ts
Fig. 4.5 - A basic Artificial Neuron
(SOURCE: Mehrotra K., Mohan C.K., and Ranka S., (1996) - Elements of Artificial
Neural Networks — Cloth)
The various inputs to the network are represented by the mathematical symbol, x(n).
Each of these inputs are multiplied by a connection weight. These weights are
represented by w(n). In the simplest case, these products are simply summed, fed
through a transfer function to generate a result, and then output. This process lends
itself to physical implementation on a large scale in a small package.
In currently available software packages these artificial neurons are called
"processing elements" and have many more capabilities than the simple artificial
neuron described above.
79
Chapter 4 - Methodology
SimmadcnFinction
TransferFunction
Inputs
Learning and Recall Schedule
Learning Cycle
Hyperbolic Tangent
Linear
Sgmoid
etc.And
Min
etc.
Max
Sum
Outputs
Fig. 4.6 - A model of a “Processing Element”
(SOURCE: Mehrotra K., Mohan C.K., and Ranka S., (1996) - Elements o f Artificial
Neural Networks — Cloth)
In Figure 4.6, inputs enter into the processing element from the upper left. The first
step is for each of these inputs to be multiplied by their respective weighting factor
(w(n)). Then these modified inputs are fed into the summing function, which usually
just sums these products. Yet, many different types of operations can be selected.
These operations could produce a number of different values which are then
propagated forward; values such as the average, the largest, the smallest, etc.
Sometimes the summing function is further complicated by the addition of an
activation function which enables the summing function to operate in a time sensitive
way. The output of the summing function is then sent into a transfer function. This
function then turns this number into a real output via some algorithm. It is this
80
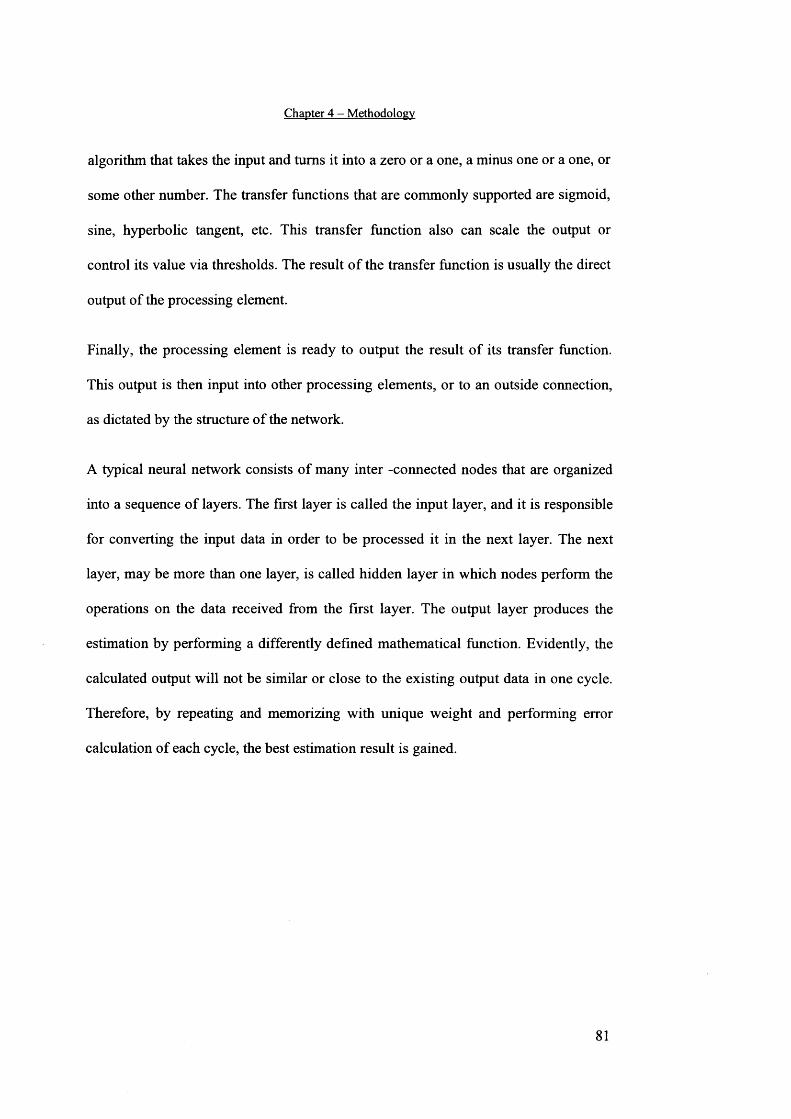
Chapter 4 - Methodology
algorithm that takes the input and turns it into a zero or a one, a minus one or a one, or
some other number. The transfer functions that are commonly supported are sigmoid,
sine, hyperbolic tangent, etc. This transfer function also can scale the output or
control its value via thresholds. The result of the transfer function is usually the direct
output of the processing element.
Finally, the processing element is ready to output the result of its transfer function.
This output is then input into other processing elements, or to an outside connection,
as dictated by the structure of the network.
A typical neural network consists of many inter -connected nodes that are organized
into a sequence of layers. The first layer is called the input layer, and it is responsible
for converting the input data in order to be processed it in the next layer. The next
layer, may be more than one layer, is called hidden layer in which nodes perform the
operations on the data received from the first layer. The output layer produces the
estimation by performing a differently defined mathematical function. Evidently, the
calculated output will not be similar or close to the existing output data in one cycle.
Therefore, by repeating and memorizing with unique weight and performing error
calculation of each cycle, the best estimation result is gained.
81
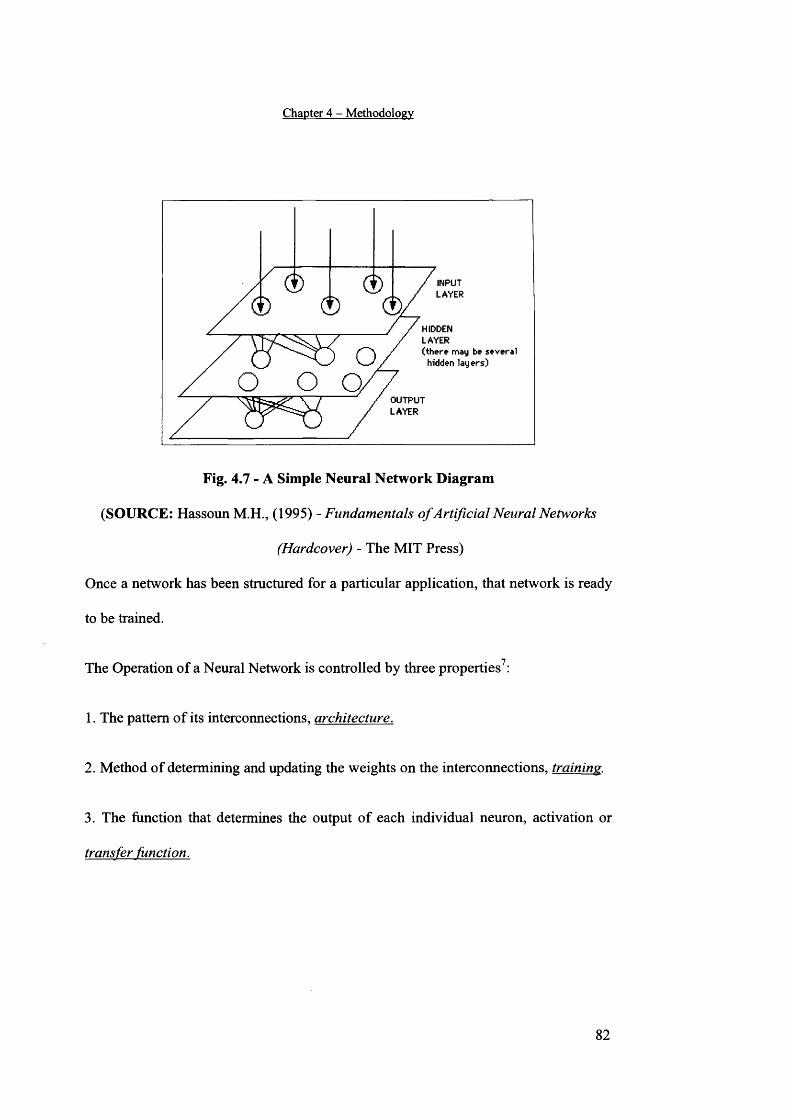
Chapter 4 - Methodology
INPUTLAYER
HIDDENLAYER(there may be several
hidden layers)
OUTPUTLAYER
Fig. 4.7 - A Simple Neural Network Diagram
(SOURCE: Hassoun M.H., (1995) - Fundamentals o f Artificial Neural Networks
(Hardcover) - The MIT Press)
Once a network has been structured for a particular application, that network is ready
to be trained.
nThe Operation of a Neural Network is controlled by three properties :
1. The pattern of its interconnections, architecture.
2. Method of determining and updating the weights on the interconnections, training.
3. The function that determines the output of each individual neuron, activation or
transfer function.
82
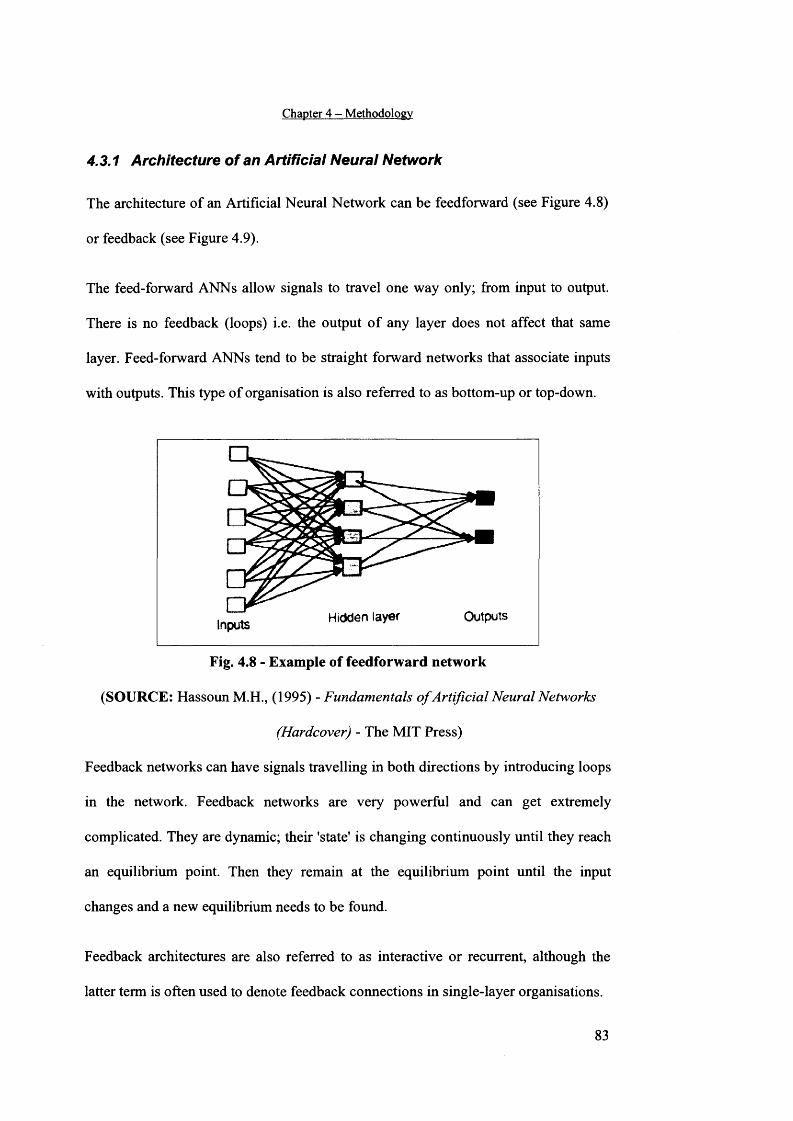
Chapter 4 - Methodology
4.3.1 Architecture of an Artificial Neural Network
The architecture of an Artificial Neural Network can be feedforward (see Figure 4.8)
or feedback (see Figure 4.9).
The feed-forward ANNs allow signals to travel one way only; from input to output.
There is no feedback (loops) i.e. the output of any layer does not affect that same
layer. Feed-forward ANNs tend to be straight forward networks that associate inputs
with outputs. This type of organisation is also referred to as bottom-up or top-down.
OutputsHidden layerInputs
Fig. 4.8 - Example of feedforward network
(SOURCE: Hassoun M.H., (1995) - Fundamentals o f Artificial Neural Networks
(Hardcover) - The MIT Press)
Feedback networks can have signals travelling in both directions by introducing loops
in the network. Feedback networks are very powerful and can get extremely
complicated. They are dynamic; their 'state' is changing continuously until they reach
an equilibrium point. Then they remain at the equilibrium point until the input
changes and a new equilibrium needs to be found.
Feedback architectures are also referred to as interactive or recurrent, although the
latter term is often used to denote feedback connections in single-layer organisations.
83
Chapter 4 - Methodology
Fig. 4.9 - Example of feedback network
(SOURCE: Hassoun M.H., (1995) - Fundamentals of Artificial Neural Networks -
The MIT Press)
4.3.2 Training an Artificial Neural Network
There are two approaches to training - supervised and unsupervised. The vast bulk of
networks utilize supervised training. Unsupervised training is used to perform some
initial characterization on inputs.
Supervised training involves a mechanism of providing the network with the desired
output either by manually "grading" the network's performance or by providing the
desired outputs with the inputs. In supervised training, both the inputs and the outputs
are provided. The network then processes the inputs and compares its resulting
outputs against the desired outputs. Errors are then propagated back through the
system, causing the system to adjust the weights which control the network. This
process occurs over and over as the weights are continually tweaked. The set of data
which enables the training is called the "training set." During the training of a
network the same set of data is processed many times as the connection weights are
ever refined.
84
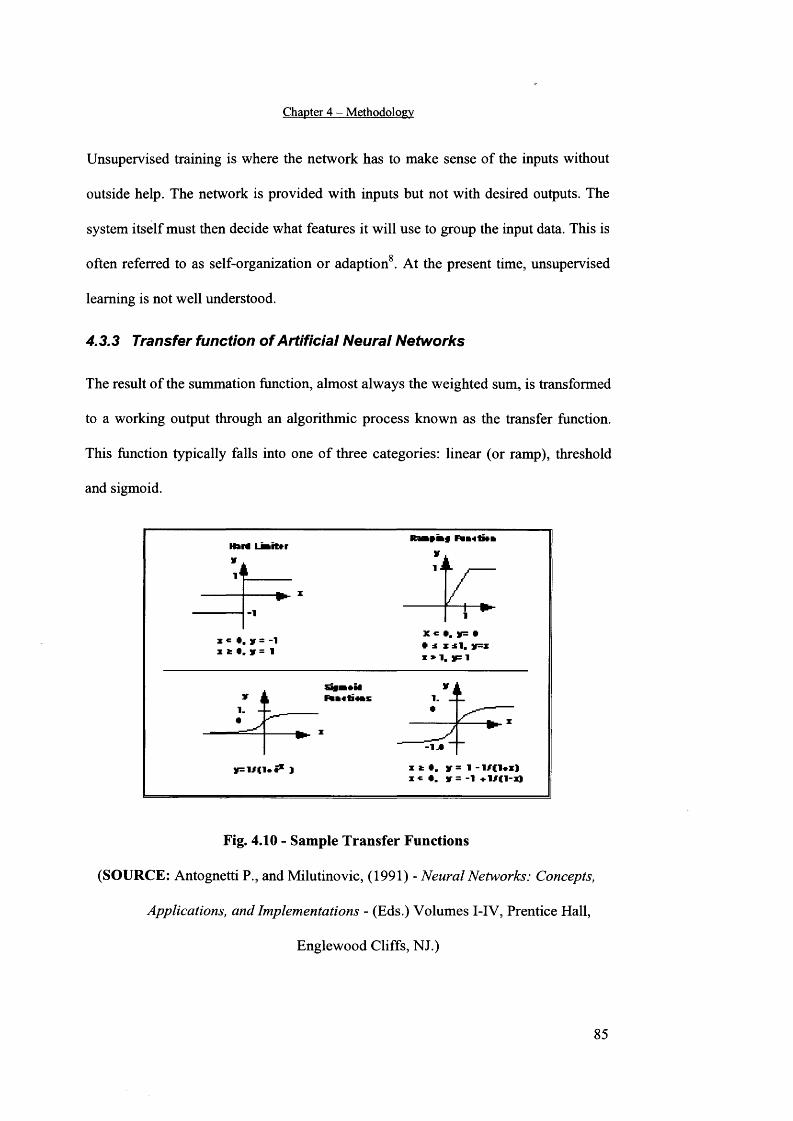
Chapter 4 - Methodology
Unsupervised training is where the network has to make sense of the inputs without
outside help. The network is provided with inputs but not with desired outputs. The
system itself must then decide what features it will use to group the input data. This is
often referred to as self-organization or adaption8. At the present time, unsupervised
learning is not well understood.
4.3.3 Transfer function of Artificial Neural Networks
The result of the summation function, almost always the weighted sum, is transformed
to a working output through an algorithmic process known as the transfer function.
This function typically falls into one of three categories: linear (or ramp), threshold
and sigmoid.
• i x dii. y=x I * 1. JF 1
i« *. V =
- 1 j *
i t * . V = 1 - l / ( l * x ji « *. If = -1
Fig. 4.10 - Sample Transfer Functions
(SOURCE: Antognetti P., and Milutinovic, (1991) - Neural Networks: Concepts,
Applications, and Implementations - (Eds.) Volumes I-IV, Prentice Hall,
Englewood Cliffs, NJ.)
85
Chapter 4 - Methodology
The transfer function is generally non-linear. Linear (straight-line) functions are
limited because the output activity is simply proportional to the total weighted input.
Linear functions are not very useful. The transfer function could be something as
simple as depending upon whether the result of the summation function is positive or
negative.
For threshold units the output is set at one of two levels, depending on whether the
total input is greater than or less than some threshold value. The threshold or ramping
function could mirror the input within a given range and still act as a hard limiter
outside that range. It is a linear function that has been clipped to minimum and
maximum values, making it non-linear.
For sigmoid units, the output varies continuously but not linearly as the input
changes. Sigmoid units bear a greater resemblance to real neurones than do linear or
threshold units, but all three must be considered rough approximations.
The curve approaches a minimum and maximum value at the asymptotes. It is
common for this curve to be called a sigmoid when it ranges between 0 and 1, and a
hyperbolic tangent when it ranges between -1 and 1. Mathematically, the exciting
feature of these curves is that both the function and its derivatives are continuous.
This option works fairly well and is often the transfer function of choice9.
86
Chapter 4 - Methodology
4.4 Integration of Fuzzy Logic and Artificial Neural Networks
to GIS
GIS information can be increasingly more valuable for decision making when
matched to Artificial Neural Networks (ANN) and other mathematical model such as
fuzzy logic (FL)10.
When linked to GIS, neural networks and fuzzy logic can be useful for evaluating,
monitoring and decision-making since these two models are directed towards
decision-making functionality.
It is anticipated that many future spatial applications will incorporate elements of
ANN since these networks have many applications in GIS including: land use,
oceanography, forestry, pattern analysis, transportation, environmental analysis.
The integration of GIS with ANN and FL allows another dimension to be added to the
spatial capabilities of the system itself.
See general review11 for more information on the mathematical integration between
ANN, Fuzzy Logic and GIS.
87
Chapter 4 - Methodology
REFERENCES:
1. Kaehler S.D.(1998) - Fuzzy Logic Tutorial - Seattle Robotics Society
2. Zadeh L.A., (1987) - Fuzzy Sets and Applications: Selected Papers by L.A.
Zadeh - ed. R.R. Yager (John Wiley, New York)
3. Zadeh, L.A, (1965) - Fuzzy Sets - Information and Control
4. Mitsuishi T., Endou T., Shidama Y., (2001) - The concept o f fuzzy set and
membership function and basic properties o f fuzzy set operation - Journal of
formalized mathematics, Vol. 9(2), pp 351-356,
5. Mehrotra K., Mohan C.K., and Ranka S., (1996) - Elements o f Artificial
Neural Networks - Cloth
6. Bosque M., (2002) - Understanding 99% o f Artificial Neural Networks:
Introduction & Tricks - Writers Club Pr (2002/3/31)
7. Hassoun M.H., (1995) - Fundamentals o f Artificial Neural Networks - The
MIT Press
8. Antognetti P., and Milutinovic, (1991) - Neural Networks: Concepts,
Applications, and Implementations - (Eds.) Volumes I-IV, Prentice Hall,
Englewood Cliffs, NJ.
9. Nelson M., McCord and Illingworth, W. T., (1991) - A Practical Guide to
Neural Nets - Addison-Wesley, Reading, MA
10. Thurston J., (2002) - GIS & Artificial Neural Networks: Does Your GIS
Think? - Available from:
88
Chapter 4 - Methodology
http://wwwlO.giscafe.com/link/displav links.php?categorv id=4114&order=ti
tle&sd=a
11. a) Aarts E., and Korst J., (1989) - Simulated Annealing and Boltzmann
Machines, A Stochastic Approach to Combinatorial Optimization and Neural
Computing - Wiley, Tiptree Essex GB
b) Baba N., (1989) - A New Approach for Finding the Global Minimum of
Error Function of Neural Networks - Neural Networks, Vol. 2
c) Eberhart, Russell C., and Dobbins, Roy W., (1990) - Neural Network PC
Tools: A Practical Guide - Academic Press, ISBN 0-12-228640-5
d) Bart K., (1992) - Neural Networks and Fuzzy Systems - Prentice Hall,
Englewood Cliffs, NJ
e) D’Aquila R.O., Crespo C.,. Mate J.L, Pazos J., (2002) - An inference
engine based on fuzzy logic for uncertain and imprecise expert reasoning -
Fuzzy Sets and Systems 129 pp 187-202
f) German G. and Gahegan M., (1996) — Neural networks architectures for the
classification of temporal image sequences - Computer and Geosciences Vol.
22, No.9, pp 969-979
g) Bouille F., (1994) - Principles of automated learning in a GIS, using an
illimited set of object-oriented persistent neurons - ISPRS-III-SSIDPCVN,
Munchen, Proceed - Ebner-Heipke-Eder Editors Vol.30, Part 3/1, pp 69-76
89
Chapter 5
The Decision Support System for
Brownfield Sites Sustainable
Regeneration
5.1 The Decision Support System - generalities
The Decision Support System (DSS) developed provides the decision maker with a
tool that selects the “optimal” redevelopment process on the basis of a set of
sustainability indicators that have been developed within the European Programme
“RESCUE - Regeneration of European Sites in Cities and Urban Environments”.
The system is based on the application and integration of the mathematical
techniques of artificial neural networks and fuzzy logic. The programming language
Mapbasic has been used to develop the relevant procedures, writing the codes and
integrate them.
Fuzzy Logic is used to evaluate the indicators, compare them and assess their
sustainability. The Artificial Neural Network is the core of the DSS that performs a
process to identify and compare the alternative scenarios (type of regeneration) on the
basis of the input information. The use of the GIS allows an easy and friendly
interface and also enables the output information to be easily visualised.
90
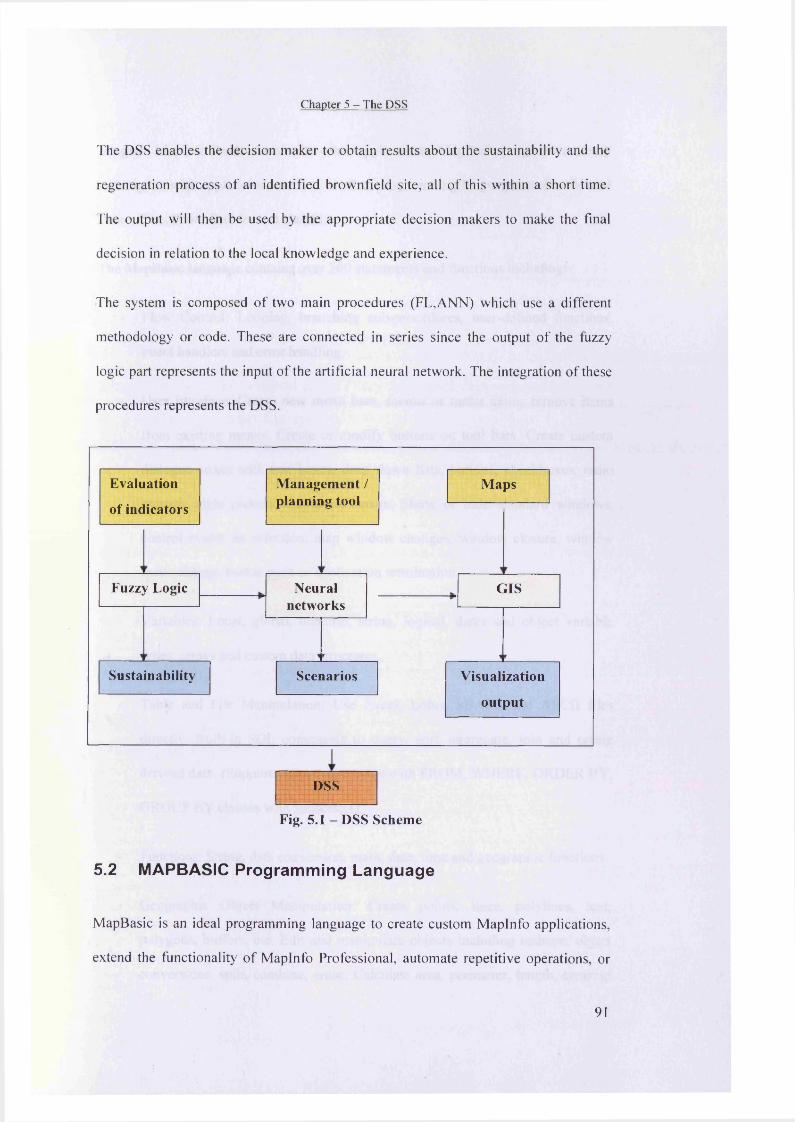
Chapter 5 - The DSS
The DSS enables the decision maker to obtain results about the sustainability and the
regeneration process o f an identified brownfield site, all o f this within a short time.
The output will then be used by the appropriate decision makers to make the final
decision in relation to the local knowledge and experience.
The system is composed o f two main procedures (FL,ANN) which use a different
methodology or code. These are connected in series since the output o f the fuzzy
logic part represents the input o f the artificial neural network. The integration o f these
procedures represents the DSS.
Fuzzy Logic
Scenarios
DSS
Maps
GIS
Sustainability
Neuralnetworks
Evaluation
of indicators
Management / planning tool
Visualization
output
Fig. 5.1 - DSS Scheme
5 . 2 M A P B A S I C P r o g r a m m i n g L a n g u a g e
MapBasic is an ideal programming language to create custom Maplnfo applications,
extend the functionality o f Maplnfo Professional, automate repetitive operations, or
91
Chapter 5 - The DSS
integrate Maplnfo Professional with other applications. MapBasic programs are easy
to integrate with applications written in other programming languages such as Visual
Basic, C++, PowerBuilder and Delphi.
The MapBasic language contains over 300 statements and functions including:
- Flow Control: Looping, branching sub-procedures, user-defined functions,
event handlers and error handling.
- User Interface: Create new menu bars, menus or menu items, remove items
from existing menus. Create or modify buttons on tool bars. Create custom
dialogue boxes with text boxes, drop down lists, buttons, checkboxes, radio
buttons, style pickers and select boxes. Show or hide standard windows,
control events on selection, map window changes, window closure, window
focus change, button push or application termination.
- Variables: Local, global, numeric, string, logical, dates and object variable
types: arrays and custom data structures.
Table and File Manipulation: Use Excel, Lotus, xBASE and ASCII files
directly. Built-in SQL commands to query, sort, aggregate, join and create
derived data. (Supports select statements with FROM, WHERE, ORDER BY,
GROUP BY clauses with subselects).
Functions: String, data conversion, math, date, time and geographic functions.
- Geographic Object Manipulation: Create points, lines, polylines, text,
polygons, buffers, etc. Edit and manipulate objects including reshape, object
conversions, split, combine, erase. Calculate area, perimeter, length, centroid
92
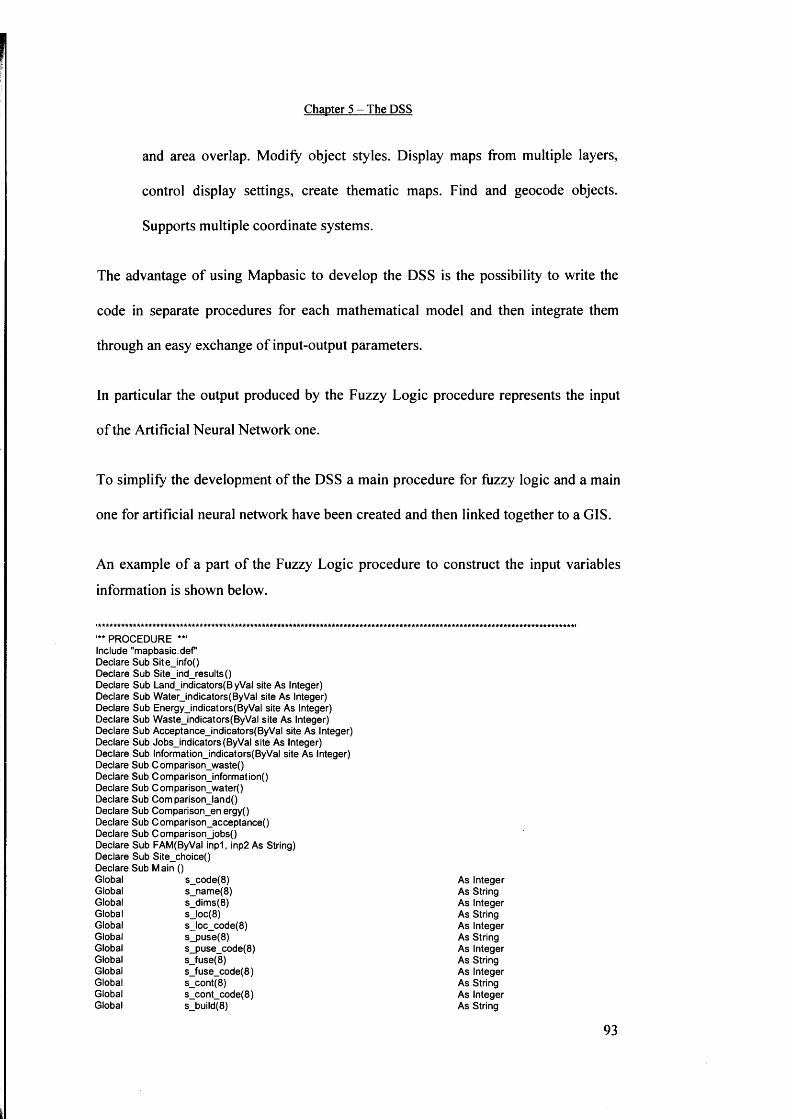
Chapter 5 - The DSS
and area overlap. Modify object styles. Display maps from multiple layers,
control display settings, create thematic maps. Find and geocode objects.
Supports multiple coordinate systems.
The advantage of using Mapbasic to develop the DSS is the possibility to write the
code in separate procedures for each mathematical model and then integrate them
through an easy exchange of input-output parameters.
In particular the output produced by the Fuzzy Logic procedure represents the input
of the Artificial Neural Network one.
To simplify the development of the DSS a main procedure for fuzzy logic and a main
one for artificial neural network have been created and then linked together to a GIS.
An example of a part of the Fuzzy Logic procedure to construct the input variables
information is shown below.
PROCEDURE **'Include "mapbasic. def'Declare Sub Site_info()Declare Sub Site_ind_results()Declare Sub Land_indicators(ByVal site As Integer) Declare Sub W ater_indicators(ByVal site As Integer) Declare Sub Energy_indicators(ByVal site As Integer) Declare Sub W aste_indicators(ByVal site As Integer) Declare Sub Acceptance_indicators(ByVal site As Integer) Declare Sub Jobs_indicators(ByVal site As Integer) Declare Sub lnformation_indicators(ByVal site As Integer) Declare Sub C om parison_w aste()Declare Sub Comparison_information()Declare Sub Com parison_w ater()Declare Sub C om parisonJand()Declare Sub Com parison_en ergy()Declare Sub C om parison_acceptance()Declare Sub C om parisonJobs()Declare Sub FAM(ByVal in p l, inp2 As String)Declare Sub Site_choice()Declare Sub Main ()GlobalGlobalGlobalGlobalGlobalGlobalGlobalGlobalGlobalGlobalGlobalGlobal
s_code(8)s_nam e(8)s_dim s(8)s_loc(8)s_loc_code(8)s_puse(8)s_puse_code(8)s_fuse(8)s_fuse_code(8)s_cont(8)s_cont_code(8)s_build(8)
As Integer As String As Integer As String As Integer As String As Integer As String As Integer As String As Integer As String
93
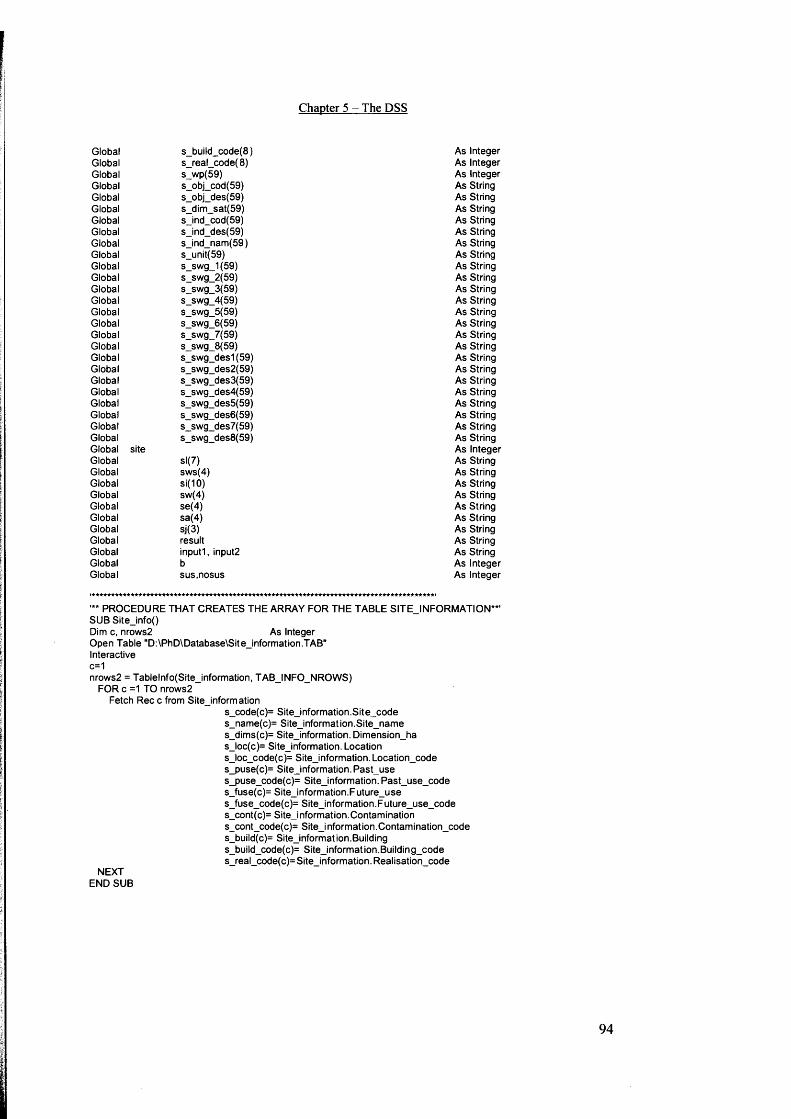
Chapter 5 - The DSS
Global s_build_code(8) As IntegerGlobal s_real_code( 8) As IntegerGlobal s_wp(59) As IntegerGlobal s_obj_cod(59) As StringGlobal s_obj_des(59) As StringGlobal s_dim _sat(59) As StringGlobal sJnd_cod(59) As StringGlobal sjn d _ d e s(5 9 ) As StringGlobal s jn d _ n a m (5 9 ) As StringGlobal s_unit(59) As StringGlobal s_swg_1(59) As StringGlobal s_swg_2(59) As StringGlobal s_swg_3(59) As StringGlobal s_swg_4(59) As StringGlobal s_swg_5(59) As StringGlobal s_swg_6(59) As StringGlobal s_swg_7(59) As StringGlobal s_swg_8(59) As StringGlobal s_sw g_des1(59) As StringGlobal s_sw g_des2(59) As StringGlobal s_sw g_des3(59) As StringGlobal s_sw g_des4(59) As StringGlobal s_sw g_des5(59) As StringGlobal s_sw g_des6(59) As StringGlobal s_sw g_des7(59) As StringGlobal s_sw g_des8(59) As StringGlobal site As IntegerGlobal sl(7) As StringGlobal sw s(4) As StringGlobal si(10) As StringGlobal sw(4) As StringGlobal se(4) As StringGlobal sa(4) As StringGlobal sj(3) As StringGlobal result As StringGlobal inputl, input2 As StringGlobal b As IntegerGlobal sus.n o su s As Integer
'** PROCEDURE THAT CREATES THE ARRAY FOR THE TABLE SITEJNFORM ATION**' SUB Site_info()Dim c, nrows2 As IntegerOpen Table "D:\PhD\Database\Site_information.TAB"Interactivec=1nrows2 = Tablelnfo(Site_information, TAB_INFO_NROWS)
FOR c =1 TO nrows2Fetch Rec c from Sitejn form ation
s_code(c)= Site_inform ation.Site_code s_nam e(c)= Site_inform ation.Site_nam e s_dim s(c)= S itejnform ation . D im ension_ha sJo c (c )= S itejnform ation . Location sJo c_ co d e(c )= S itejn form ation . L o ca tio n co d e s _puse(c)= S itejn form ation . P ast_ u se s_puse_code(c)= S itejn form ation . P ast_use_code s ju s e ( c )= S ite jn fo rm ation .F u tu re_use s Ju se _ c o d e (c )= S iteJnform ation .F u ture_use_code s_cont(c)= S itejnform ation.C ontam ination s_cont_code(c)= S ite J nform ation .C ontam inationcode s_build(c)= Sitejnform ation.Building s_build_code(c)= SiteJnform ation.B uilding_code s_real_code(c)= S itejn form ation . Realisation_code
NEXT END SUB
Chapter 5 - The DSS
5.3 Input variables
The input to the system is the set of variables related to the sustainability indicators
developed in the European Programme RESCUE (Regeneration of European sites in
Cities and Urban Environments). These indicators are represented by a qualitative or
quantitative measure of the site considered. Data for the sites are presented in
Appendix C.
These data have been taken according to the sectors defined below by the RESCUE
project as main work packages:
- contamination and the reuse of soil and debris, that may include immediate
reuse on site, reuse after treatment or final cost effective disposal. The
indicators belonging to this sector are related to air, noise, pollutant,
contamination. Example: number of solid waste, soil and debris recycled per
time unit/volumes of solid waste, soil and debris produced per time unit
- existing building and infrastructures - in many cases brownfield sites are
particularly characterised by the existence of old buildings and infrastructures
that are often dismantled rather than retained in a more sustainable way.
Indicators cover information related to use of renewable sources, reuse of
existing infrastructure. Example: percentage of solid buildings reused
compared to all buildings on the regenerated site
land use and urban design - the sustainable regeneration of urban brownfield
sites requires both the identification of suitable use options and their
implementation in an environmentally, economically and socially sound way.
Indicators cover aspects such as promotion of land use that match demands
and needs, job creation, resources saving. Example: does the site development
accord to the integrated urban development strategy?
planning processes and methods for citizen participation - brownfield
redevelopment is a complex matter with many actors and stakeholders who
often pursue contrasting aims in the development process. To meet the
demands of sustainability, a socially balanced planning process which offers
participation opportunities for all interested parties should not aim at
systematic consensus but is a prerequisite for each brownfield project.
Indicators cover aspects such as information flow, complaints, transparency.
Example: satisfaction/contestation of results
management of brownfield projects - the achievement of a smooth, cost-
efficient and low-risk realisation of brownfield redevelopment projects is the
main responsibility of project managers . The project management function
must integrate different philosophies and disciplines from both social and
engineering sciences who take part in the regeneration process. Indicators
cover aspects such as adoption of an interdisciplinary approach, existence of
documents. Example: number and content of public progress reports made
during the project.
Then these packages have been redistributed in 7 main sectors such as water, waste,
land, contamination, building and infrastructure, energy and public participation to
enable an easier allocation within the system.
In addition to these set of indicators, there are some other input variables for the area
considered such as:
Chapter 5 - The DSS
- location, the site could be located in the inner city, on the border or out of town;
- , size of the area considered;
- past use, that could be a harbour, coal mine, coke plant, etc.
A particular focus is given to the variable future/current use that represents the type of
redevelopment undertaken or to be considered in the study area, such as industrial,
commercial, mixed etc.
This variable is an important input to the system since it can be an input and also an
output depending on the type of simulation performed by the system.
Detailed description of each indicator can be found in Appendix A. The indicators
have been developed within the RESCUE project1 and also the data collected have
been provided under the same programme and are available in Appendix C.
97
Chapter 5 - The DSS
5.4 Architecture of DSS
The mathematical model developed elaborates the input data by using first the fuzzy
logic procedure, and then artificial neural networks procedure in order to obtain the
output of the DSS as shown in Figure 5.2.
The DSS architecture contains two different procedures:
1) PROACTIVE: the user does not know the type of redevelopment
(commercial, residential, mixed, industrial etc) for the site and the output is in
fact the sustainable regeneration scheme. The system also enables the user to
run more than one simulation by modifying the input variables (in particular
the importance of these) and therefore obtaining different scenarios with a
measure of their sustainability. The interface requires the user to insert only
the indicators related to the site and the site characteristics.
2) REACTIVE: the type of redevelopment has already been decided and the user
can check the sustainability of the regeneration scheme chosen. The interface
requires the user to insert the indicators related to the site and the expected
output (that is the type of redevelopment is known).
98
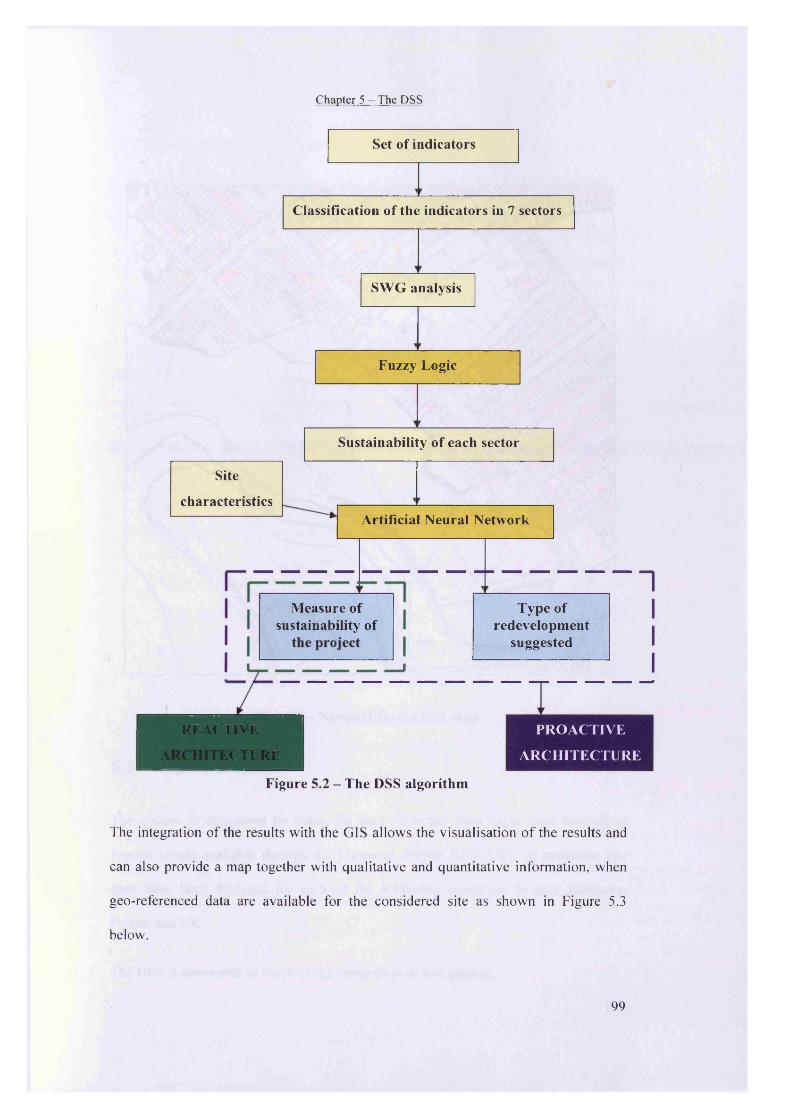
Chapter 5 - The DSS
Set of indicators
Classification of the indicators in 7 sectors
SWG analysis
Fuzzy Logic
Sustainability of each sector
Site
characteristics
* Artificial Neural Network
Measure of sustainability of
Type of redevelopment
suggested
REACTIVE
CTURE
PROACTIVE
ARCHITECTURE
Figure 5.2 - The DSS algorithm
The integration o f the results with the GIS allows the visualisation o f the results and
can also provide a map together with qualitative and quantitative information, when
geo-referenced data are available for the considered site as shown in Figure 5.3
below.
99
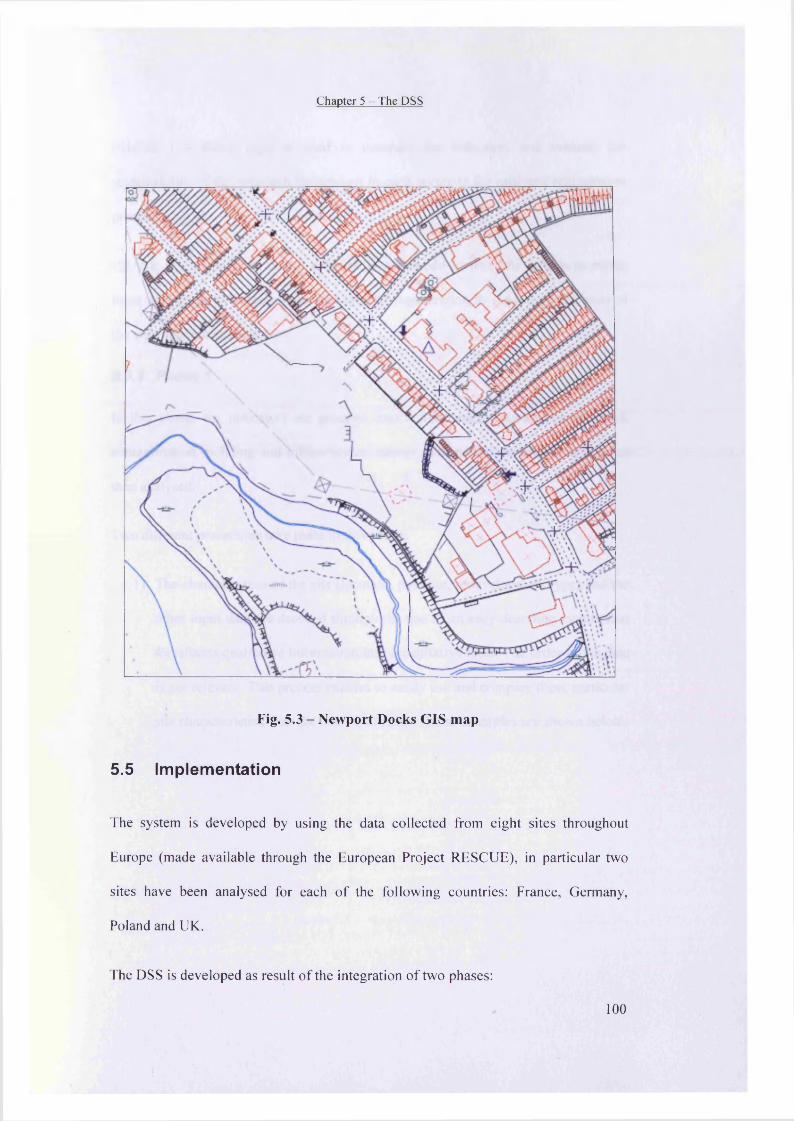
Chapter 5 - The DSS
Fig. 5.3 - Newport Docks GIS map
5.5 Implementation
The system is developed by using the data collected from eight sites throughout
Europe (made available through the European Project RESCUE), in particular two
sites have been analysed for each o f the following countries: France, Germany,
Poland and UK.
The DSS is developed as result o f the integration o f two phases:
100
Chapter 5 - The DSS
PHASE 1 - fuzzy logic is used to compare the indicators and evaluate the
sustainability of the approach undertaken in each sector in the analysed regeneration
process.
PHASE 2 - an artificial neural network is developed to train the system to match
input with grade of sustainability and type of regeneration as output, on the basis of
the existing case studies.
5.5.1 Phase 1
In this phase, the indicators are grouped into 7 main sectors (water, waste, land,
contamination, building and infrastructure, energy, and public participation) and are
then analysed.
Two different procedures take place in this phase:
l) The characteristics of the site (location, past use, redevelopment type) and the
other input data are decoded through the use of an easy decoding system that
transforms qualitative information into quantitative ones. The order of the data
is not relevant. This process enables to easily use and compare these particular
site characteristics with the other indicators. Some examples are shown below.
101
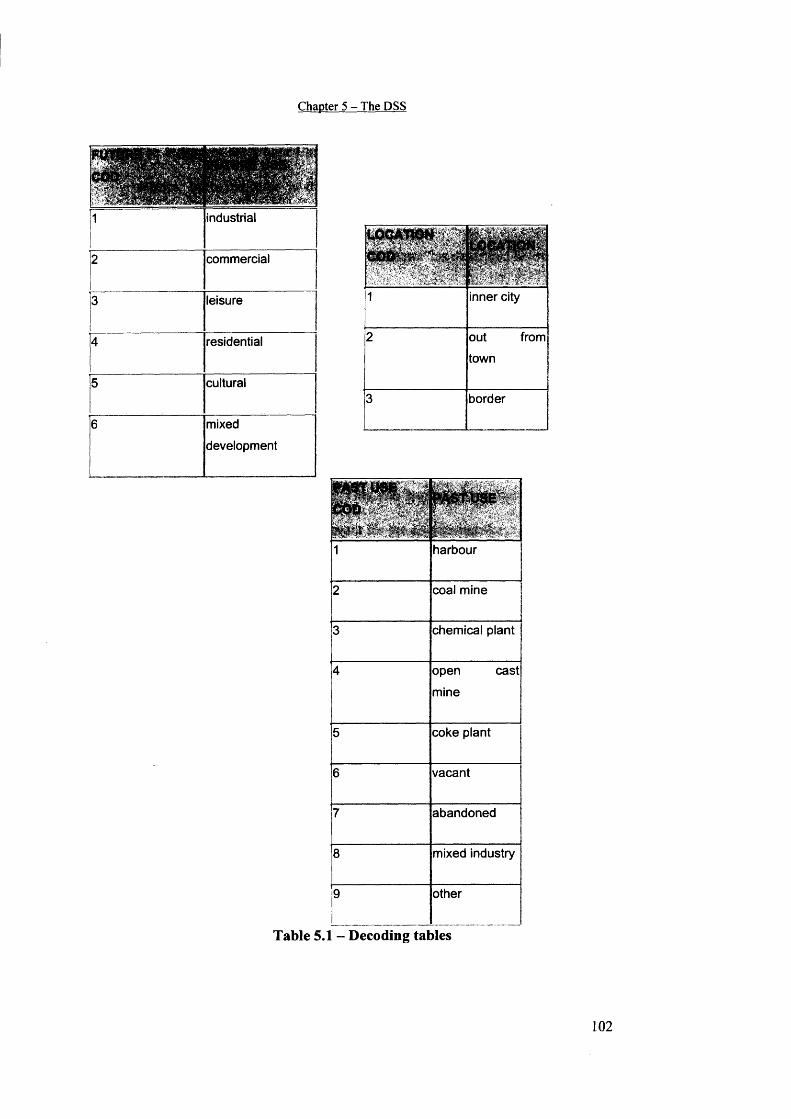
Chapter 5 - The DSS
1 industrial
2 commercial
3 leisure
4 residential
5 cultural
6 mixed
development
1 inner city
2 out from
town
3 border
^66 • '
7y\»M ■
*ASTU$E
* r :
1 harbour
2 coal mine
3 chemical plant
4 open cast
mine
5 coke plant
6 vacant
7 abandoned
8 mixed industry
9 other
Table 5.1 - Decoding tables
Chapter 5 - The DSS
2) The indicators are grouped in the 7 main sectors listed above and within these
sectors, each indicator is then subject to Strength/Weakness/Gap analysis
(SWG) on the basis of the available information for each site. The SWG
follows the rule of “satisfaction of the indicator” as described below:
STRENGTH (S).This refers to when the indicator is satisfied. This means
that the information available is satisfactory, valuable and the issue related
to the indicator has been taken into consideration;
WEAKNESS (W). This refers to when the indicator is not considered and it
means that the regeneration process does not take into consideration the
issue related to the indicator. This can happen when the issue has been
forgotten or when it is not relevant for the considered site;
GAP (G). This refers to when no information is available.
The SWG for the 8 sites considered is presented in the table below and this has
been developed on the basis of the available information for each site.
103

Chapter 5 - The DSS
Ind ica to r nam e L oisinordL esT ertia les R adbod E spenha in Bytom
S o sn o w iec
M arkhamW illows G ate sh ead N ew port
Different expert opinions for urban design G G G S G S S G SSecondary uses of buildings G W G S W W G G SEqual access to information W S S S S S S S SAlternative information W W S S S S S S GBudget allocated for participation W W S W W W W W WSymmetry of information flow W S S S S S S W SPublicity and documentation S S G G W W S S STransparency of the process management G S G G G G G G GInvolvement of stallholders W S W W S S S W SPractical methods in the process management W G S S S S S S WRepresentativeness W S S S S S S S GSatisfaction G G G G G G G G GExistence of community information G G S G G G G G SLowest budget control level W W W W S S S W WQuality management W W S S G S S S SProject management plan W W G G G G S S GCost development G G G G G G S S GMarketing structure W W G G G G S S SEconomic viability G G G G G G S S GRecords of decisions W W S S G W S S SHealth and safety plan W W S G G G S S SCosts benefits analysis W W G G S S S S GPressure on neighbourhood G G S G G G G G WAmbient noise level W G S G W W G G WAir and dust quality impact W W S G G G G G WSurface and groundwater quality control G G W S W G W G GRisk management framework W S W S S S S S GWaste, soils and debris management S G S S S S S S W
104
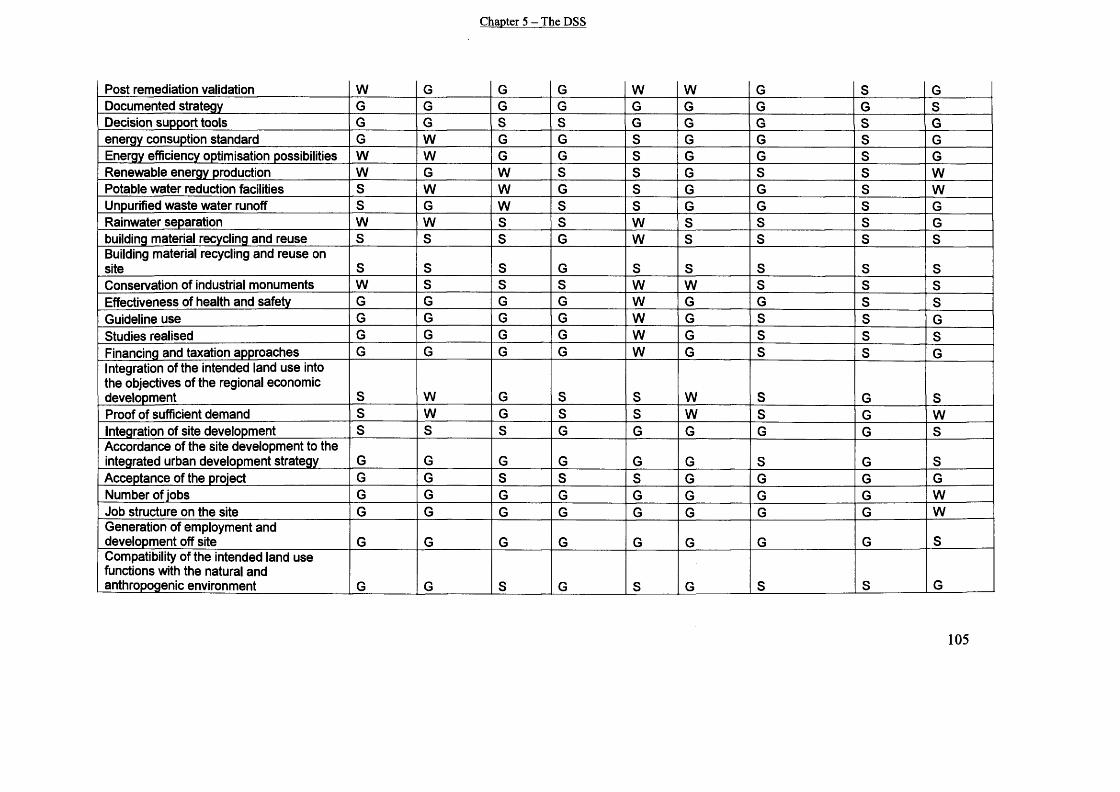
Chapter 5 - The DSS
Post remediation validation W G G G W W G S GDocumented strategy G G G G G G G G SDecision support tools G G S S G G G S Genergy consuption standard G W G G S G G S GEnergy efficiency optimisation possibilities W W G G S G G S GRenewable energy production W G W S S G S S WPotable water reduction facilities S W W G S G G S WUnpurified waste water runoff S G W S S G G S GRainwater separation W W S S W S S S Gbuilding material recycling and reuse S S S G W S S S SBuilding material recycling and reuse on site S S S G S S S S SConservation of industrial monuments W S S S W W S S SEffectiveness of health and safety G G G G W G G S SGuideline use G G G G W G S S GStudies realised G G G G W G S S SFinancing and taxation approaches G G G G W G S S GIntegration of the intended land use into the objectives of the regional economic development S W G S S W S G SProof of sufficient demand S W G S S W S G WIntegration of site development S S S G G G G G SAccordance of the site development to the integrated urban development strategy G G G G G G S G SAcceptance of the project G G S S S G G G GNumber of jobs G G G G G G G G WJob structure on the site G G G G G G G G WGeneration of employment and development off site G G G G G G G G SCompatibility of the intended land use functions with the natural and anthropogenic environment G G S G S G S S G
105
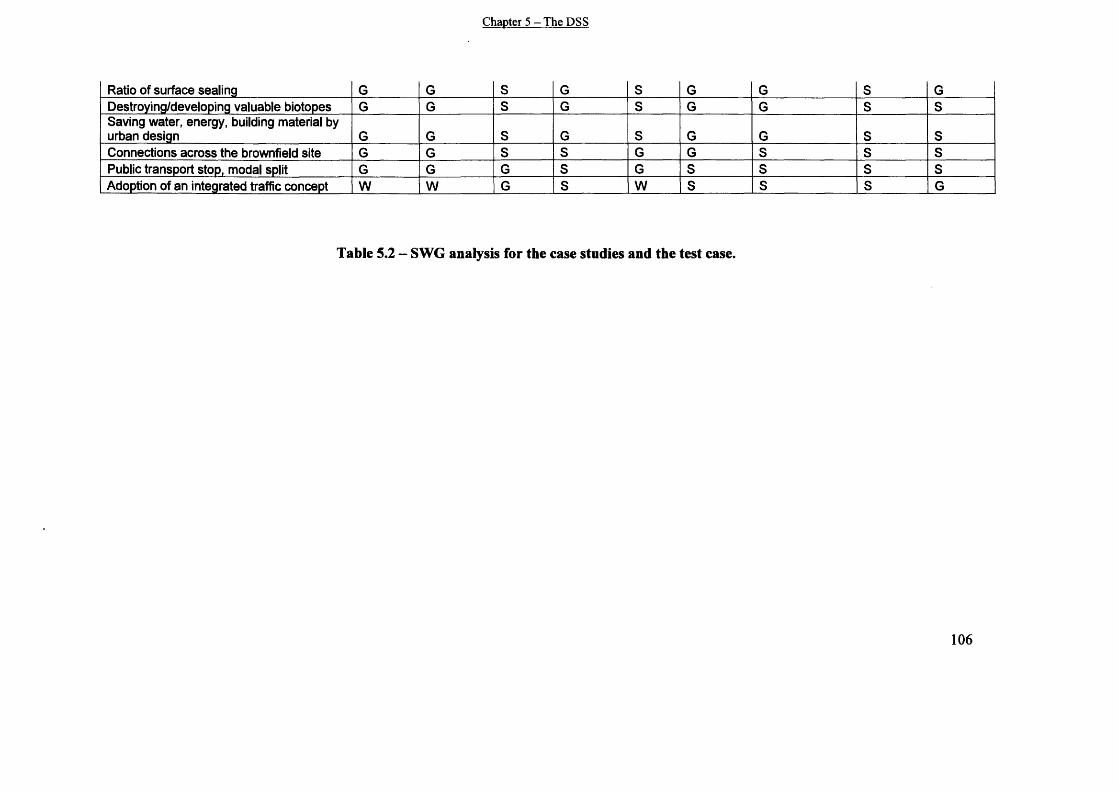
Chapter 5 — The DSS
Ratio of surface sealing G G S G S G G S GDestroying/developing valuable biotopes G G S G S G G S SSaving water, energy, building material by urban design G G S G S G G S SConnections across the brownfield site G G S S G G S S SPublic transport stop, modal split G G G S G S S S SAdoption of an integrated traffic concept W W G S W S S S G
Table 5.2 - SWG analysis for the case studies and the test case.
106
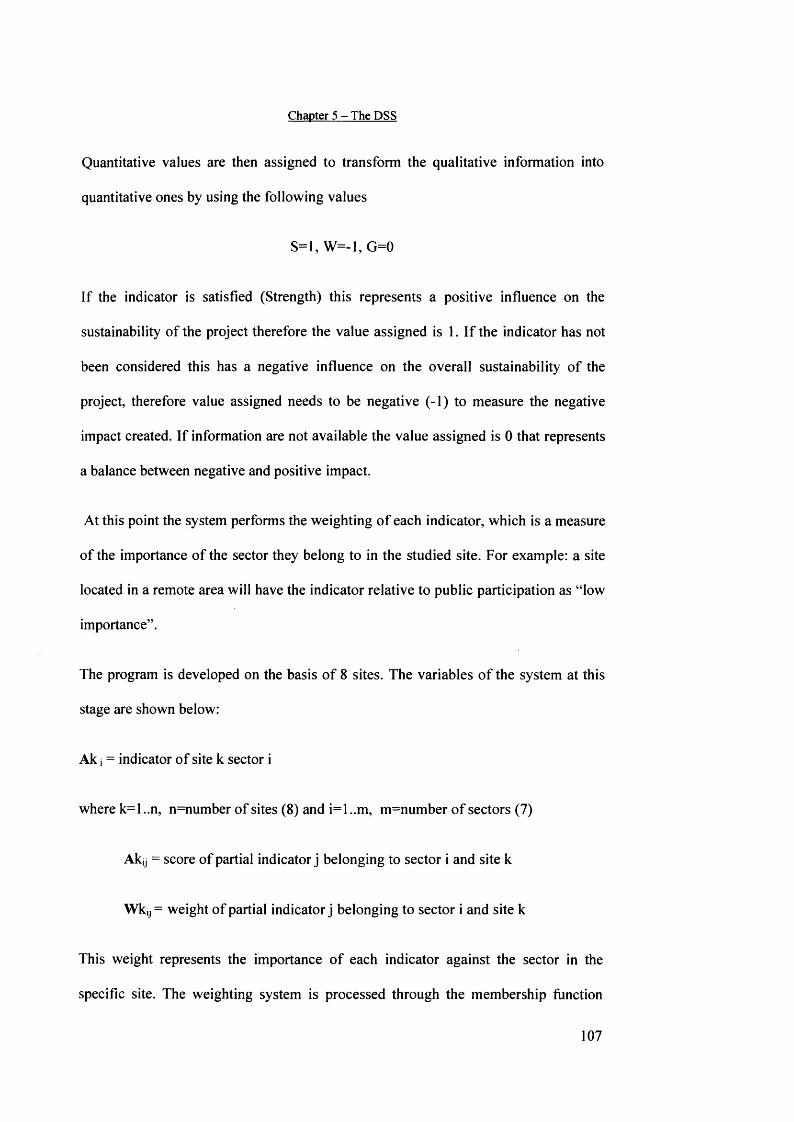
Chapter 5 - The DSS
Quantitative values are then assigned to transform the qualitative information into
quantitative ones by using the following values
S=l, W=-1,G=0
If the indicator is satisfied (Strength) this represents a positive influence on the
sustainability of the project therefore the value assigned is 1. If the indicator has not
been considered this has a negative influence on the overall sustainability of the
project, therefore value assigned needs to be negative (-1) to measure the negative
impact created. If information are not available the value assigned is 0 that represents
a balance between negative and positive impact.
At this point the system performs the weighting of each indicator, which is a measure
of the importance of the sector they belong to in the studied site. For example: a site
located in a remote area will have the indicator relative to public participation as “low
importance”.
The program is developed on the basis of 8 sites. The variables of the system at this
stage are shown below:
Ak i = indicator of site k sector i
where k=l ..n, n=number of sites (8) and i=l ..m, m=number of sectors (7)
Aky = score of partial indicator j belonging to sector i and site k
Wkjj = weight of partial indicator j belonging to sector i and site k
This weight represents the importance of each indicator against the sector in the
specific site. The weighting system is processed through the membership function
107
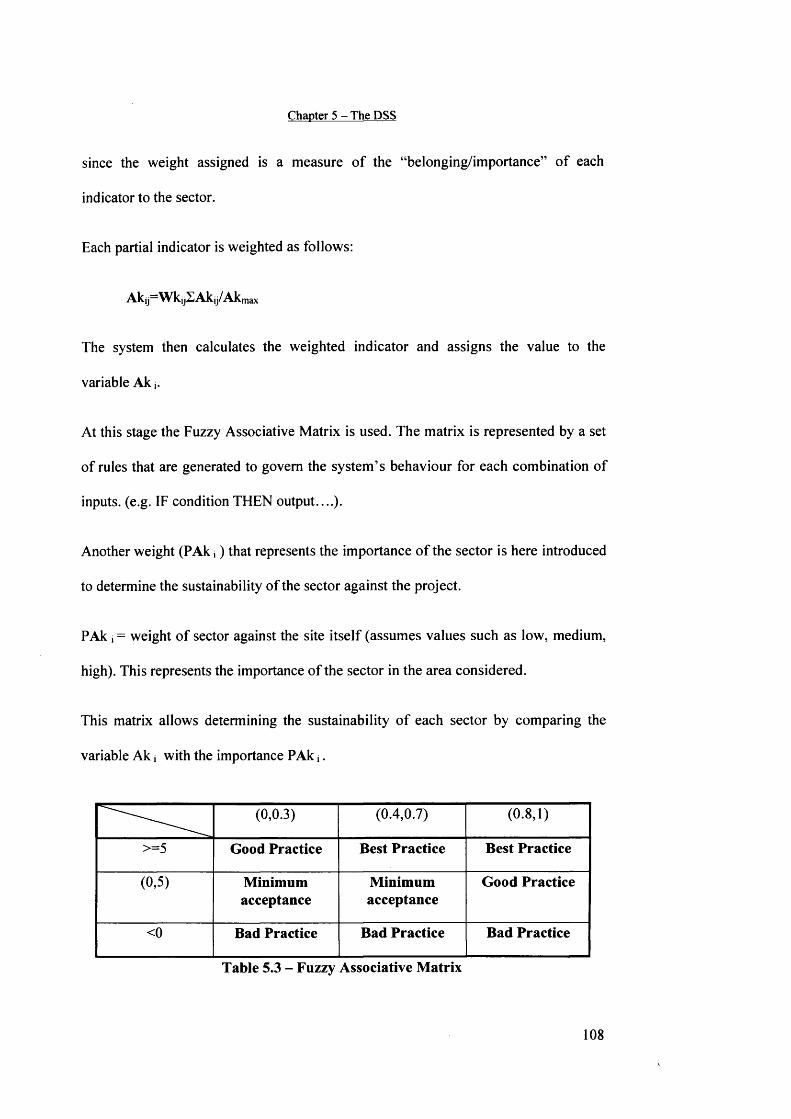
Chapter 5 - The DSS
since the weight assigned is a measure of the “belonging/importance” of each
indicator to the sector.
Each partial indicator is weighted as follows:
Akjj=WkjjE Aky/Akmax
The system then calculates the weighted indicator and assigns the value to the
variable Ak j .
At this stage the Fuzzy Associative Matrix is used. The matrix is represented by a set
of rules that are generated to govern the system’s behaviour for each combination of
inputs, (e.g. IF condition THEN output....).
Another weight (PAk j ) that represents the importance of the sector is here introduced
to determine the sustainability of the sector against the project.
PAk i = weight of sector against the site itself (assumes values such as low, medium,
high). This represents the importance of the sector in the area considered.
This matrix allows determining the sustainability of each sector by comparing the
variable Ak j with the importance PAk j .
(0,0.3) (0.4,0.7) (0.8,1)
>=5 Good Practice Best Practice Best Practice
(0,5) Minimumacceptance
Minimumacceptance
Good Practice
<0 Bad Practice Bad Practice Bad Practice
Table 5.3 - Fuzzy Associative Matrix
108
Chapter 5 - The DSS
The output of this phase is the sustainability of each sector in terms of bad practice,
minimum practice, good practice, best practice (e.g sector waste= good practice;
sector water=minimum acceptance and etc). These variables are the input of Phase 2
where the artificial neural network analyses the characteristics of the site and the
sustainability in order to determine the type of regeneration that results sustainable.
5.5.2 Phase 2
In this phase the artificial neural network is developed. The ANN is used to learn and
understand the relationship between the sustainability of the eight sectors (output of
the fuzzy logic part), the site characteristics and the type of sustainable redevelopment
(commercial, industrial, residential, mixed use..etc).
On the basis of the variables involved in the procedure, the ANN chosen for the DSS
has the following characteristics:
- architecture: feedforward, allow signals to travel one way only from input to
output. This architecture has been chosen since the system only requires to
analyse the input variables and not change them automatically.
Training algorithm: supervised, training examples comprise input vectors x and
output y desired. The algorithm has been chosen on the basis that the input data
and the output data are known for all the case studies and are entered to the
system to support and facilitate the learning process.
- Hidden layers: one in relation to the number of operations required since the
system requires to perform only one operation between input and output.
109
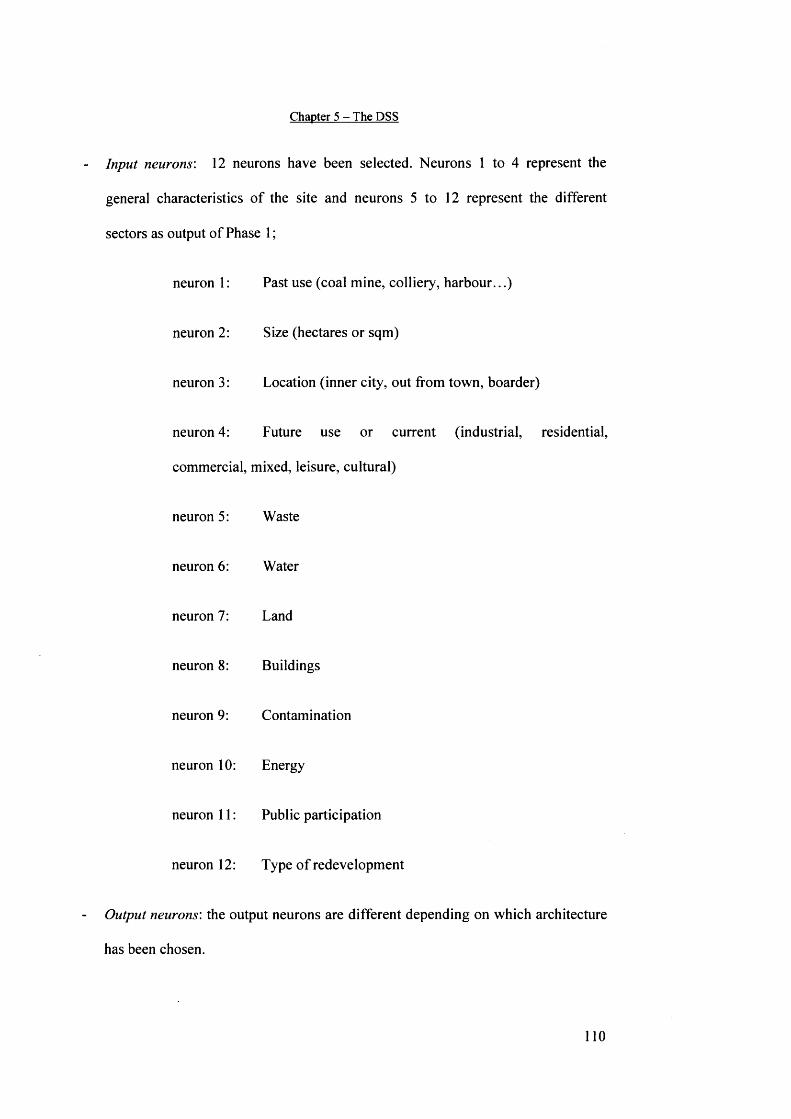
Chapter 5 - The DSS
Input neurons: 12 neurons have been selected. Neurons 1 to 4 represent the
general characteristics of the site and neurons 5 to 12 represent the different
sectors as output of Phase 1;
neuron 1: Past use (coal mine, colliery, harbour...)
neuron 2: Size (hectares or sqm)
neuron 3: Location (inner city, out from town, boarder)
neuron 4: Future use or current (industrial, residential,
commercial, mixed, leisure, cultural)
neuron 5: Waste
neuron 6: Water
neuron 7: Land
neuron 8: Buildings
neuron 9: Contamination
neuron 10: Energy
neuron 11: Public participation
neuron 12: Type of redevelopment
Output neurons: the output neurons are different depending on which architecture
has been chosen.
110
Chapter 5 - The DSS
For the proactive architecture the output neurons are:
neuron 1: Type of redevelopment
neuron 2: Sustainability of the project
For the reactive architecture the output neuron is only:
neuron 2: Sustainability of the project
The network is trained with the eight case studies. For each case study the values
related to each neuron, as obtained in phase 1 are entered directly through a
procedure.
To avoid issues and duplications with the name of the variables used within the
programming language features, the output of Phase I are re-named in the following
way:
Xj = A k, = value of the sector (sustainability)
Wj = PAk i = weight of Xj
where i=(l..n) n=12
Each of these inputs is multiplied by its respective weighting factor (1 to 10) as a first
step in the process. The weights specify the strength of the influence and importance
of the sector in the regeneration process.
I l l
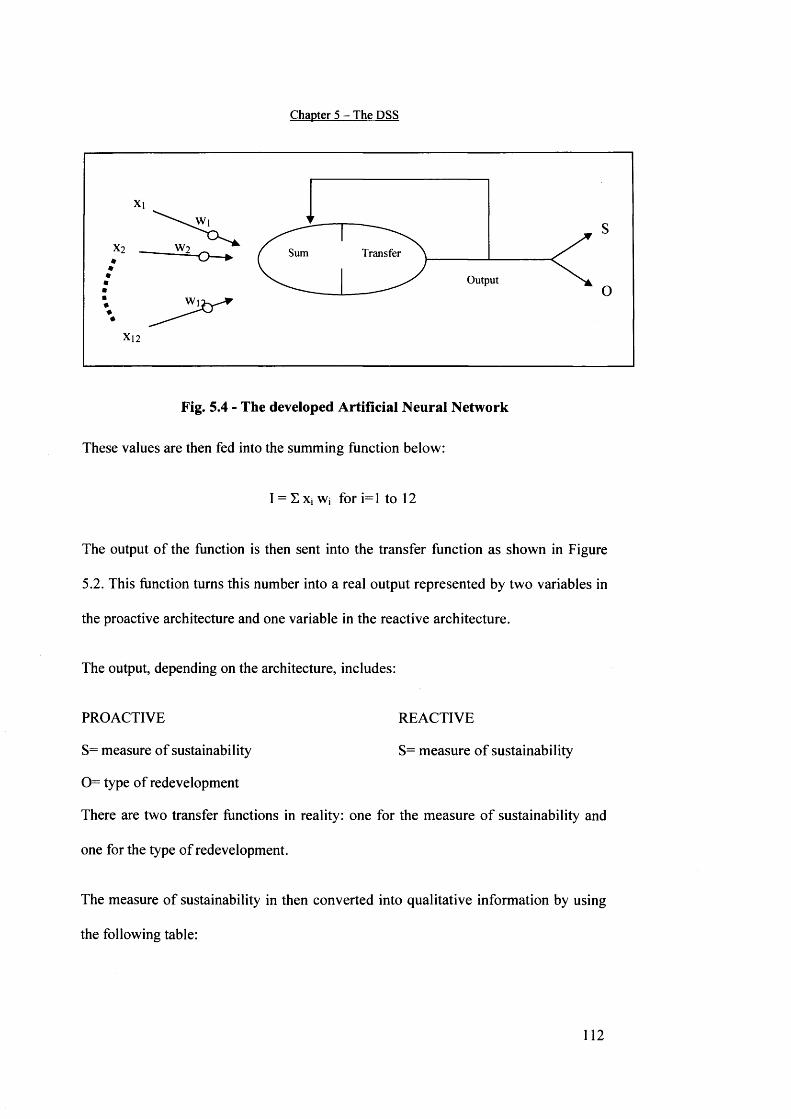
Chapter 5 - The DSS
Transfer
Fig. 5.4 - The developed Artificial Neural Network
These values are then fed into the summing function below:
I = £ Xj Wj for i=l to 12
The output of the function is then sent into the transfer function as shown in Figure
5.2. This function turns this number into a real output represented by two variables in
the proactive architecture and one variable in the reactive architecture.
The output, depending on the architecture, includes:
PROACTIVE REACTIVE
S= measure of sustainability S= measure of sustainability
0= type of redevelopment
There are two transfer functions in reality: one for the measure of sustainability and
one for the type of redevelopment.
The measure of sustainability in then converted into qualitative information by using
the following table:
112

Chapter 5 - The DSS
S Grade of sustainability
<25 Not sustainable
<=60 Sustainable
>60 Best Practice
Table 5.3 - Grade of Sustainability
At this stage the system uses the supervised learning process which is a process of
approximating a set of data by undertaking the following sequence of operations:
1) set n=number of neurons and m=number of output and set the initial values of
the connection weights of the network;
2) the input vector x (where x=xi,X2. . .Xj) is supplied to the network
3) the output vector o (where 0=01,02) is calculated as produced by the network
4) the output vector o is compared with the desired output vector y (where
y=yi>y2)
5) the connection weights are corrected in such a way that the next time that x is
presented to the network, the produced output o becomes closer to the desired
output y
6) if necessary, step 2 and 5 are repeated until the network reaches a convergence
state.
The network stops learning when the error calculated as follows is minimised2:
p * m
113
Chapter 5 - The DSS
where:
o(jk) = output value of the j th output of the network when the kth training examples is presented;
y? = desired result for the j* output for the kth training examples
p = number of training examples (in this case 8 as the case studies submitted)
m = dimension of the output space (in this case 2 as the two desired output)
The training process is repeated until the combination input neurons-type of
redevelopment presents the minimum error.
The entire process is repeated for each of the eight case studies. This allows the
network to be trained. During the learning process and for each of the case studies the
ANN keeps memory of the following information: input variables, O, I.
The variable O at this stage is still a number that will be converted to the
correspondent type of redevelopment at the end of the process.
To summarise the procedure followed by the DSS is different depending on the
chosen options: the reactive architecture proceeds with undertaking the above
described operations (sum function, transfer function, error minimisation); the
proactive system analyses the input neurons following the same procedure as the
reactive one but assigning a different value to the type of redevelopment for each
cycle.
5.6 Testing
The DSS and in particular the artificial neural network have been tested to check the
performance in terms of time to provide results and to verify the results.
114
Chapter 5 - The DSS
The testing of the interface includes the introduction of wrong characters or nil
information to check that the system does not crash but provides an intelligent
message to the user indicating which type of variables are accepted.
The testing of the artificial neural network is the most important because it enlightens
the validity and consistency of the results. This procedure has been undertaken in two
ways:
1) The information related to each of the eight case studies is re-introduced in the
system without providing the current regeneration scheme undertaken in each
site. This verifies that the system has learnt the existing interrelationships
between the characteristics of the site, the sectors, the grade of sustainability
and the type of redevelopment provided as output;
2) The information related to a new case study Newport Docks (Wales - UK) is
used to test the functionality and performance of the system.
5.7 Interface
The interface allows the user to easily enter the information and visualise the results.
The first step is the request to the user about the following:
- Number of sites to be evaluated
- Type of architecture required (proactive or reactive)
Once the architecture has been chosen the user is asked to enter the information about
the indicators for each sector, their weights plus the general characteristics of the site.
A table is provided to the user to be easily filled and entered into the system. For
115

Chapter 5 - The DSS
reactive architecture there is also the request to introduce the type of redevelopment
scheme already chosen.
The ideal situation to maximise the potential of the DSS is for the user to provide an
electronic map of the site considered. By introducing this to the GIS, the system will
be able to provide graphical information together with qualitative and quantitative
ones.
116

Chapter 5 - The DSS
REFERENCES:
1. RESCUE (2004) - Sustainable Assessment Tool. Available from:
http://www.rescue-
europe.com/download/reports/2 5 2 Administrative%20tools%20and%20inc
entives%20-%20SAT.pdf
2. Hassoun M.H., (1995) - Fundamentals of Artificial Neural Networks - The
MIT Press
117
Chapter 6
Case Studies
6.1 Case Studies
The DSS analyses 8 case studies in four European countries (France, Germany,
Poland and UK). The sites considered are at different redevelopment phases and they
present different social, economic, environmental and geographical characteristics.
The case studies have been used in two different ways:
1) To train the neural network. From the cases the system learnt how to treat the
information in input and transform these into an appropriate output
2) To check the performance of the DSS. After training the networks, the cases
have been submitted to the DSS as a test to check that the results obtained
where compatible with the real ones.
The case studies have been chosen on the basis of considering a wide and
differentiated range of sustainable regeneration processes in European Countries1.
The breadth of this approach is desired to ensure an almost complete representation of
the different approaches to brownfield redevelopment. It is also desired to provide a
wide range of relevant decision factors that may lead to the success and / or to the
failure of the projects.
118
Chapter 6 - Case Studies
In France, the sites are:
1. Loisinord - located in the outside of the city on the border of four
municipalities. The previous use was as a coal extraction site and coke plant.
The regeneration process provides a new use as leisure facilities.
2. Les Tertiales - located near the city centre. There is presence of
contamination. The regeneration process provides a new use as mixed
redevelopment.
In Germany, the sites are:
1. Radbod - located in the city. The previous use was as a coalmine and cokery.
There is presence of contamination, and also few listed buildings. The
regeneration process provides a new use such as industrial.
2. Espenhain - located outside the city. The area included a few former
chemical plants and two power stations. There is presence of contamination,
and one industrial monument. The regeneration process provides a new use
as industrial and Science Park.
In Poland, the sites are:
1. The Dolomites sports valley - located peripheral to the city. The previous use
was as a dolomite open cast mine. There is no presence of contamination, and
no listed buildings. The regeneration process provides a new use as a leisure
and recreational centre.
119
Chapter 6 - Case Studies
2. Sosnowiec coalmine - located in the inner city. There is presence of
contamination, and presence of some infrastructures. The regeneration process
provides a new use as mixed redevelopment.
In the UK, the sites are:
1. Markham - located outside the city. The previous use was coal mine and tip.
There is presence of contamination, and no listed buildings. The regeneration
process provides a new use as commercial redevelopment.
2. Gateshead Quay - located in the inner city. There is presence of
contamination, and some major structures are retained. The regeneration
process provides a new use as mixed redevelopment.
6.1.1 French Case Studies
Loisinord
Loisinord is situated in the Nord-Pas de Calais Coalfield that is the largest in France
(206,372 hectars), 100 kilometres long and only 15 to 5 kilometres wide. The
coalmining industry started in 1720. 1960 is the symbolic starting point of the planned
decline of coal production in the Nord/Pas de Calais. Two famous National Programs
- "Plan Jeanneney 1960 - 1965" and "Plan Bettencourt 1968"2 - drastically reduced
coal production and led to the closing of the least competitive sites. Despite desperate
attempts to strenghten coal production in the early eighties, the coal decline was
inexorable in the Nord-Pas de Calais, and in Europe. It stopped in December 1990 in
Oignies.
120
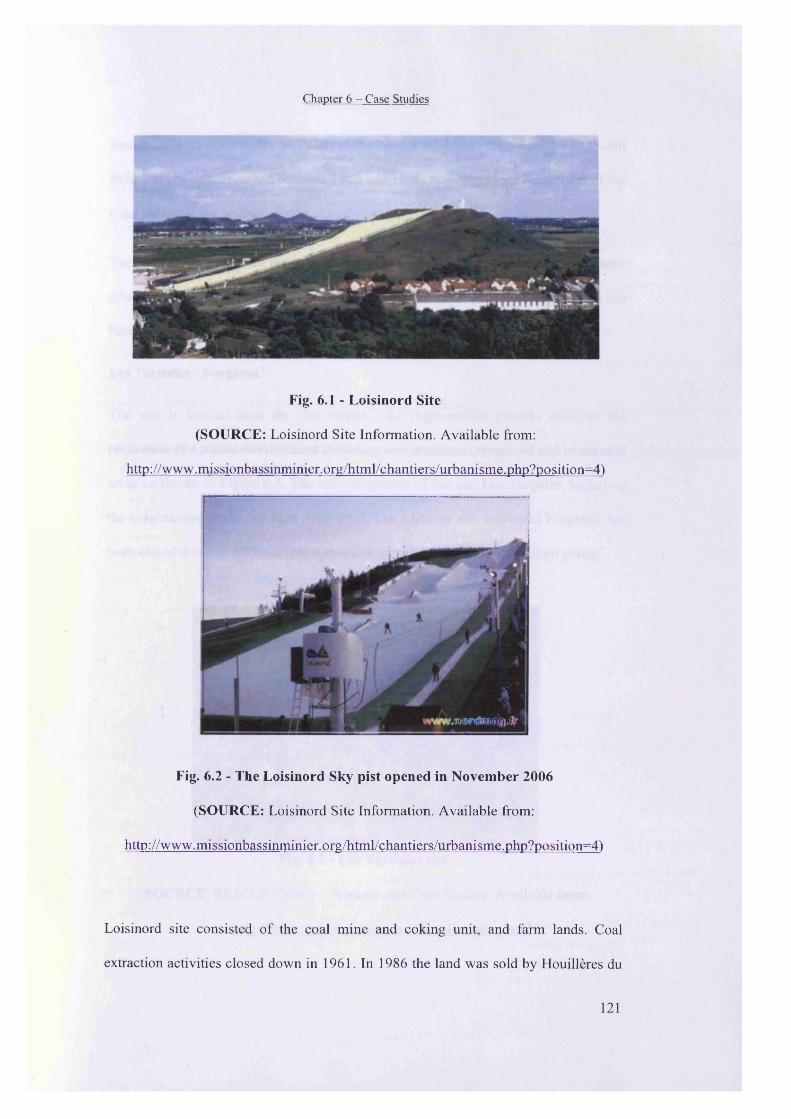
Chapter 6 - Case Studies
Fig. 6.1 - Loisinord Site
(SOURCE: Loisinord Site Information. Available from:
http://www.missionbassinminier.org/html/chantiers/urbanisme.php?position=4)
wwwj*orcb<$sx!!.lXr
Fig. 6.2 - The Loisinord Sky pist opened in November 2006
(SOURCE: Loisinord Site Information. Available from:
http://www.missionbassinminier.Org/h tml/chantiers/urbanisme.php?position=4)
Loisinord site consisted o f the coal mine and coking unit, and farm lands. Coal
extraction activities closed down in 1961. In 1986 the land was sold by Houilleres du
121
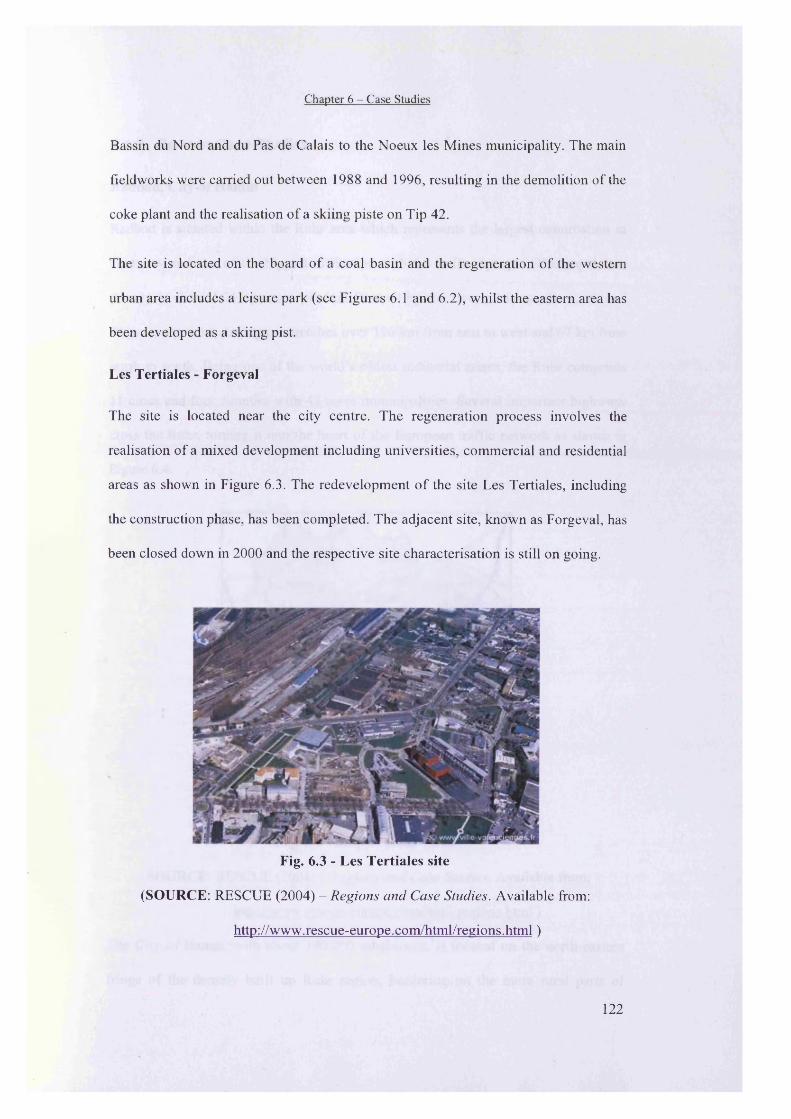
Chapter 6 - Case Studies
Bassin du Nord and du Pas de Calais to the Noeux les Mines municipality. The main
fieldworks were carried out between 1988 and 1996, resulting in the demolition of the
coke plant and the realisation o f a skiing piste on Tip 42.
The site is located on the board o f a coal basin and the regeneration o f the western
urban area includes a leisure park (see Figures 6.1 and 6.2), whilst the eastern area has
been developed as a skiing pist.
Les Tertiales - Forgeval
The site is located near the city centre. The regeneration process involves the
realisation of a mixed development including universities, commercial and residential
areas as shown in Figure 6.3. The redevelopment o f the site Les Tertiales, including
the construction phase, has been completed. The adjacent site, known as Forgeval, has
been closed down in 2000 and the respective site characterisation is still on going.
Fig. 6.3 - Les Tertiales site
(SOURCE: RESCUE (2004) - Regions and Case Studies. Available from:
http://www.rescue-europe.com/html/regions.html)
122
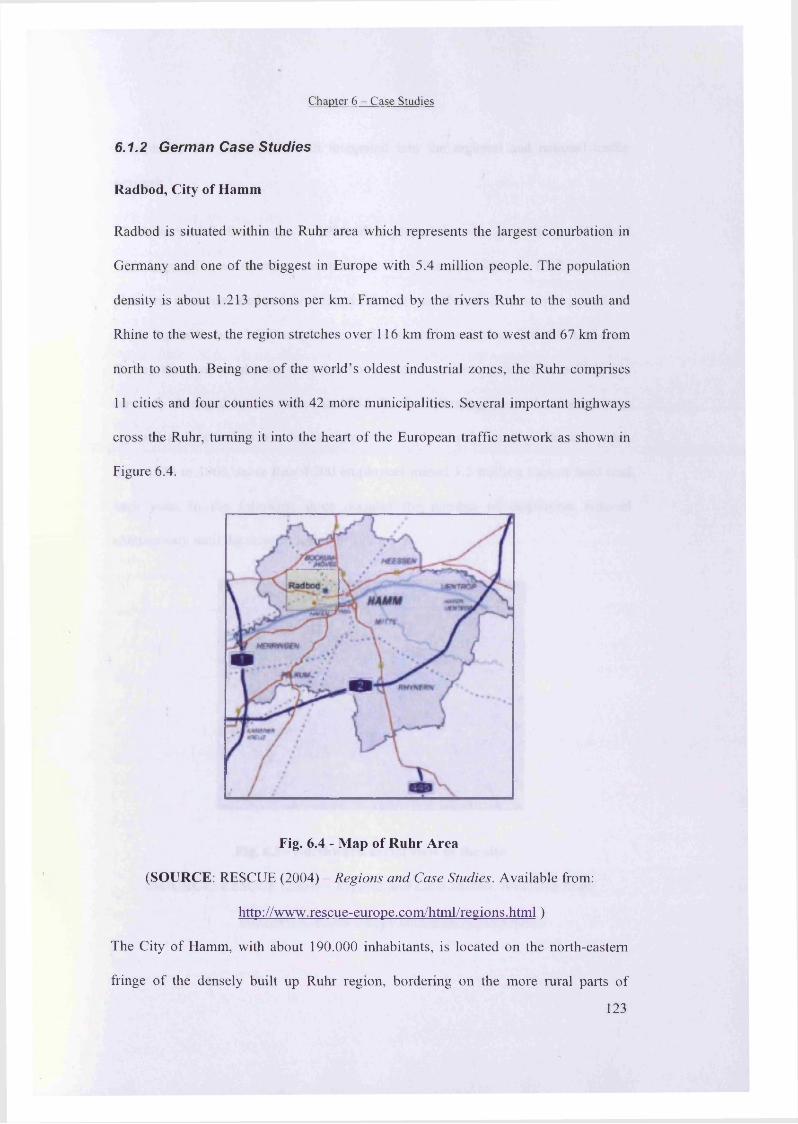
Chapter 6 - Case Studies
6.1.2 German Case Studies
Radbod, City of Hamm
Radbod is situated within the Ruhr area which represents the largest conurbation in
Germany and one o f the biggest in Europe with 5.4 million people. The population
density is about 1.213 persons per km. Framed by the rivers Ruhr to the south and
Rhine to the west, the region stretches over 116 km from east to west and 67 km from
north to south. Being one of the world’s oldest industrial zones, the Ruhr comprises
11 cities and four counties with 42 more municipalities. Several important highways
cross the Ruhr, turning it into the heart o f the European traffic network as shown in
Figure 6.4.
Fig. 6.4 - Map of Ruhr Area
(SOURCE: RESCUE (2004) - Regions and Case Studies. Available from:
http://www.rescue-europe.com/html/regions.html)
The City o f Hamm, with about 190.000 inhabitants, is located on the north-eastern
fringe of the densely built up Ruhr region, bordering on the more rural parts of
123
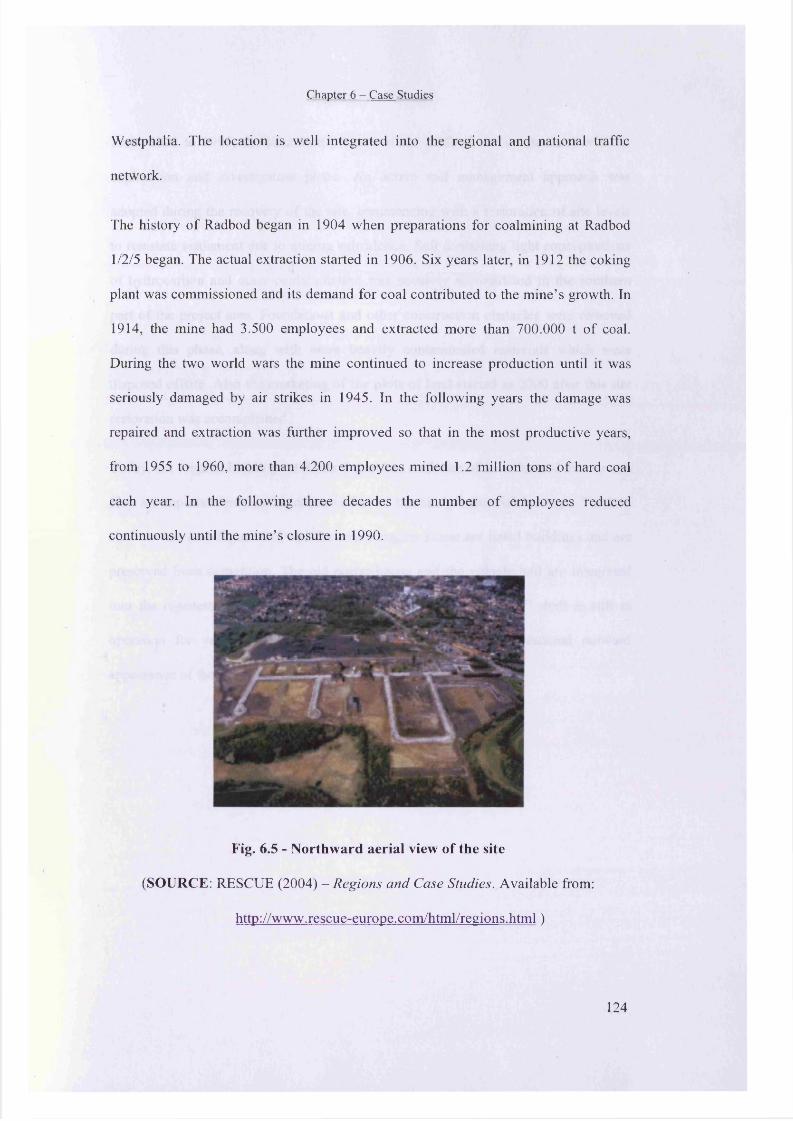
Chapter 6 - Case Studies
Westphalia. The location is well integrated into the regional and national traffic
network.
The history o f Radbod began in 1904 when preparations for coalmining at Radbod
1/2/5 began. The actual extraction started in 1906. Six years later, in 1912 the coking
plant was commissioned and its demand for coal contributed to the m ine’s growth. In
1914, the mine had 3.500 employees and extracted more than 700.000 t o f coal.
During the two world wars the mine continued to increase production until it was
seriously damaged by air strikes in 1945. In the following years the damage was
repaired and extraction was further improved so that in the most productive years,
from 1955 to 1960, more than 4.200 employees mined 1.2 million tons o f hard coal
each year. In the following three decades the num ber o f employees reduced
continuously until the m ine’s closure in 1990.
Fig. 6.5 - Northward aerial view of the site
(SOURCE: RESCUE (2004) - Regions and Case Studies. Available from:
http ://www .rescue-europe. com/html/regions. h tm l)
124
Chapter 6 - Case Studies
From 1992 to 1995, the sanitation process of the Radbod site commenced with an
exploration and investigation phase. An active soil management approach was
adopted during the recovery of the site, commencing with a restoration of site levels
to reinstate settlement due to mining subsidence. Soil containing light concentrations
of hydrocarbon and other contamination was securely accumulated in the southern
part of the project area. Foundations and other construction obstacles were removed
during this phase, along with more heavily contaminated materials which were
disposed offsite. Also the marketing of the plots of land started in 2000 after this site
restoration was accomplished.
Today, six original buildings at Radbod stand as evidence of its industrial history and
play an important role in the conservation of the site’s industrial heritage: The two
shaft towers (see Figure 6.6) and the steam engine house are listed buildings and are
preserved from demolition. The old porter-house and the vehicle hall are integrated
into the regeneration scheme and will be reused. The “Winkhaus” shaft is still in
operation for ventilation purposes, helping to preserve the traditional outward
appearance of the site.
125

Chapter 6 - Case Studies
Fig. 6.6 - Listed shaft towers (view to the north-east)
(SOURCE: RESCUE (2004) - Regions and Case Studies. Available from:
http://www.rescue-europe.com/html/regions.html)
Although Radbod is surrounded by green spaces on three sides, it is located directly
south o f the Hamm Bockum-Hovel urban area. The location is well linked to the
regional and national traffic network. The railway station o f Hamm offers high speed
train connections; the site itself is serviced by bus. The size o f Radbod is
approximately 21 ha o f which 15 ha will be re-used, 8.5 ha for commercial users and
6.5 ha for industrial purposes.
The regeneration concept is based on a diverse and flexible design. Important aspects
are the integration o f the historical buildings, existing greens, and the diverse design
o f streets, including soft and hard landscaped squares (see Figure 6.7).
126
Chapter 6 - Case Studies
Fig. 6.7 - Detail of the 3D-model of the planned future use (view to the south
east)
(SOURCE: RESCUE (2004) - Regions and Case Studies. Available from:
http://www.rescue-europe.com/html/regions.html)
To achieve this objective a legally binding land use and building plan was created.
The regeneration scheme implements a public-private partnership mode. The
“Radbod” development agency, which was set up for the regeneration o f the site,
consists o f the two site owners (STEAG AG (Steinkohlen-Elektrizitats AG) and MGG
(Montan-Grundstiicksgesellschaft mbH), both corporations being subsidiaries o f the
RAG AG corporation), and the City of Hamm which holds majority control. The
regeneration scheme prioritises employment and training opportunities for local
citizens. In this context, a special qualification scheme for landscape gardeners was
integrated into the design of the open space on the site.
Espenhain
Espenhain lies in the former lignite basin of the “Siidraum Leipzig”(see Figure6.8).
After political change in 1989/90, the economic monostructure o f Siidraum Leipzig
proved to be no longer economically or environmentally viable. What followed was a
structural change, unmatched in its speed and impact in the history o f the central
European region.
127
Chapter 6 - Case Studies
DtoKOon to M tf M u i fAM
A »
1 ESPtNMAM
A73
Otof l lto to C ll to H lOtractton to Mfiodwfi
Fig. 6.8 - Map location of Espenhain
(SOURCE: RESCUE (2004) - Regions and Case Studies. Available from:
http://www.rescue-europe.com/html/regions.html)
Espenhain’s lignite chemical plant, briquette factory and power station were built and
commissioned between 1937 and 1942. As Germany had no access to major oil
resources, carbon chemistry was developed very strongly in this location in order to
produce fuel and lubricant during World War II.
After hostilities ended, lignite remained the main energy base o f the economy o f the
German Democratic Republic (GDR).
Due to the enormous level o f pollution caused by the plant, Espenhain became the
catalyst for the GDR’s environmental movement. This was especially evident in the
village o f Molbis, located downwind of Espenhain, which suffered the highest level
of pollution in the GDR. In 1983 the environmental movement held a religious
service for the environment which began a campaign, in which money was collected
for environmental improvement in Espenhain (“eine Mark fur Espenhain”).
The industrial activities ended in 1990, with power station closure following in 1999.
128
Chapter 6 - Case Studies
With an area o f approximately 300 ha Espenhain is one o f the largest former
industrial sites in “Siidraum Leipzig” (see Figure 6.9). The regional stakeholders are
co-operating in a stepwise redevelopment to create a new economic and technological
profile for the site.
The future use o f the site is planned as a regional-scale industrial and science park.
“Campus Espenhain”, founded by diverse regional stakeholders, opened in 1998 as a
science and business centre and the industrial park is currently being developed.
Within “Campus Espenhain”, research is carried out to create concepts for regional
structural change and to implement the results in development projects.
Fig. 6.9 - Eastward aerial view of the site
(SOURCE: RESCUE (2004) - Regions and Case Studies. Available from:
http://www.rescue-europe.com/html/regions.html)
Major demolition and decontamination works have been undertaken in recent years.
The local plan (Bebauungsplan) , as shown in Figure 6.10, for the central part o f the
site was realised in 2004. Closely linked to the project is the restoration o f the former
lignite mine and the waste tip of Espenhain (Trages-heep). In addition leisure centres
are planned in the neighbourhood of the site.
129

Fig. 6.10 - Concept for the site and its surroundings
(SOURCE: RESCUE (2004) - Regions and Case Studies. Available from:
http://www.rescue-europe.com/html/regions.html)
6.1.3 Polish Case Studies
The Dolomites Sport Valley
The Dolomites site is located in the Silesia Region (voivodship) that is situated in
south part o f Poland and consists of 19 cities, 17 districts and 166 communities.
The Silesia Region takes 12,294 square kilometres o f area (that is about 3.9 % o f the
total Poland area), where live 4,882,400 inhabitants (that is 12.6 % o f the total Poland
inhabitants). The density o f population in this region is equal to 397 persons per
square kilometres and it is 3.2 times greater then the average in Poland.
Silesia region is the most degraded environmentally area in Poland as can be noted by
the following basic indicators (1998):
- 21,5 % o f dust emission from mines to air in Poland
21,7 % o f emission of gasses in Poland
Chapter 6 - Case Studies
130
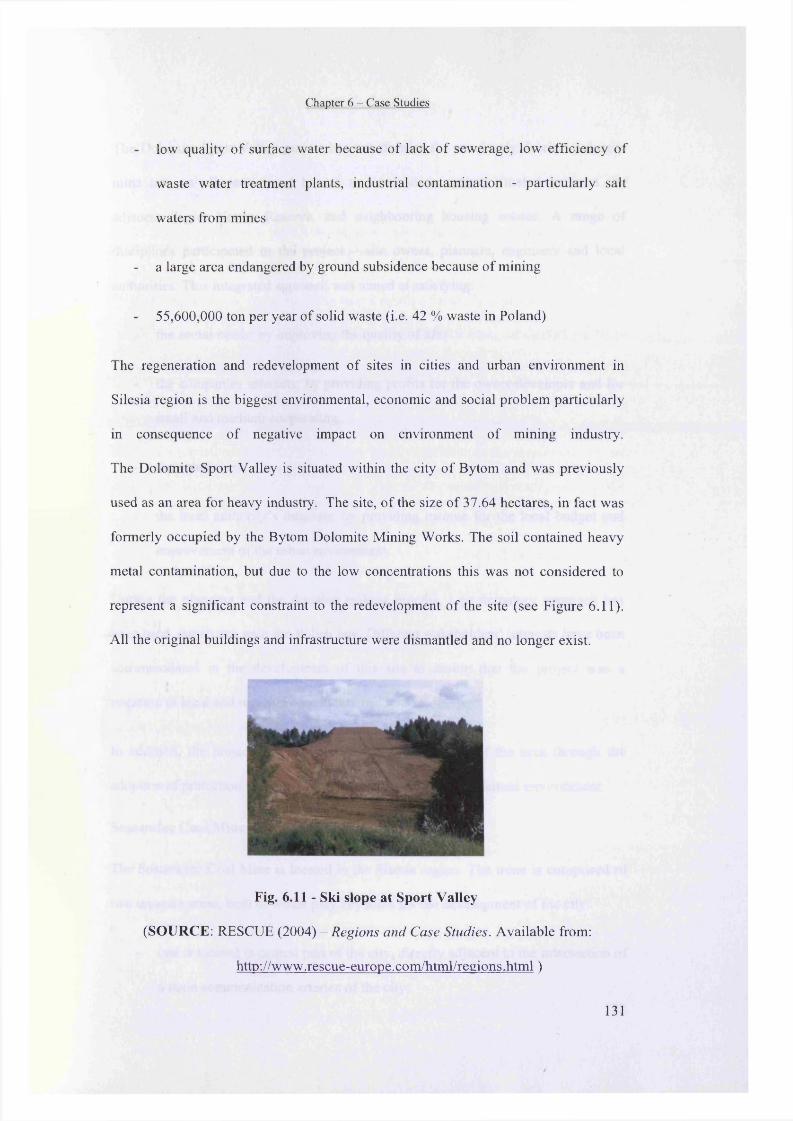
Chapter 6 - Case Studies
low quality o f surface water because o f lack o f sewerage, low efficiency o f
waste water treatment plants, industrial contamination - particularly salt
waters from mines
- a large area endangered by ground subsidence because o f mining
55,600,000 ton per year of solid waste (i.e. 42 % waste in Poland)
The regeneration and redevelopment o f sites in cities and urban environment in
Silesia region is the biggest environmental, economic and social problem particularly
in consequence o f negative impact on environment o f mining industry.
The Dolomite Sport Valley is situated within the city o f Bytom and was previously
used as an area for heavy industry. The site, o f the size o f 37.64 hectares, in fact was
formerly occupied by the Bytom Dolomite Mining Works. The soil contained heavy
metal contamination, but due to the low concentrations this was not considered to
represent a significant constraint to the redevelopment o f the site (see Figure 6.11).
All the original buildings and infrastructure were dismantled and no longer exist.
Fig. 6.11 - Ski slope at Sport Valley
(SOURCE: RESCUE (2004) - Regions and Case Studies. Available from:
http://www.rescue-europe.com/html/regions.html)
131
Chapter 6 - Case Studies
The Dolomite Sport Valley project has transformed the previously derelict dolomite
mine into an all year round leisure and recreation centre, situated between the
adjacent Segiet Nature Reserve, and neighbouring housing estates. A range o f
disciplines participated in the project - site owner, planners, engineers and local
authorities. This integrated approach was aimed at satisfying:
the social needs: by improving the quality o f life;
the companies interests: by providing profits for the owner/developer and for
small and medium cooperating;
the enterprises;
the local authority’s interests: by providing income for the local budget and
improvement o f the urban environment.
During the planning and the decision making process, a participatory approach has
been used, consistent with the Polish law. Different stakeholders’ interests have been
accommodated in the development o f this site to ensure that the project was a
response to local and regional community needs.
In addition, the project has improved the ecological state o f the area through the
adoption o f protection measures to preserve the neighbouring natural environment.
Sosnowiec Coal Mine
The Sosnowiec Coal Mine is located in the Silesia region. The mine is comprised o f
two separate areas, both o f which play key roles for the developm ent o f the city:
one is located in central part o f the city, directly adjacent to the intersection o f
a main communication arteries o f the city;
132
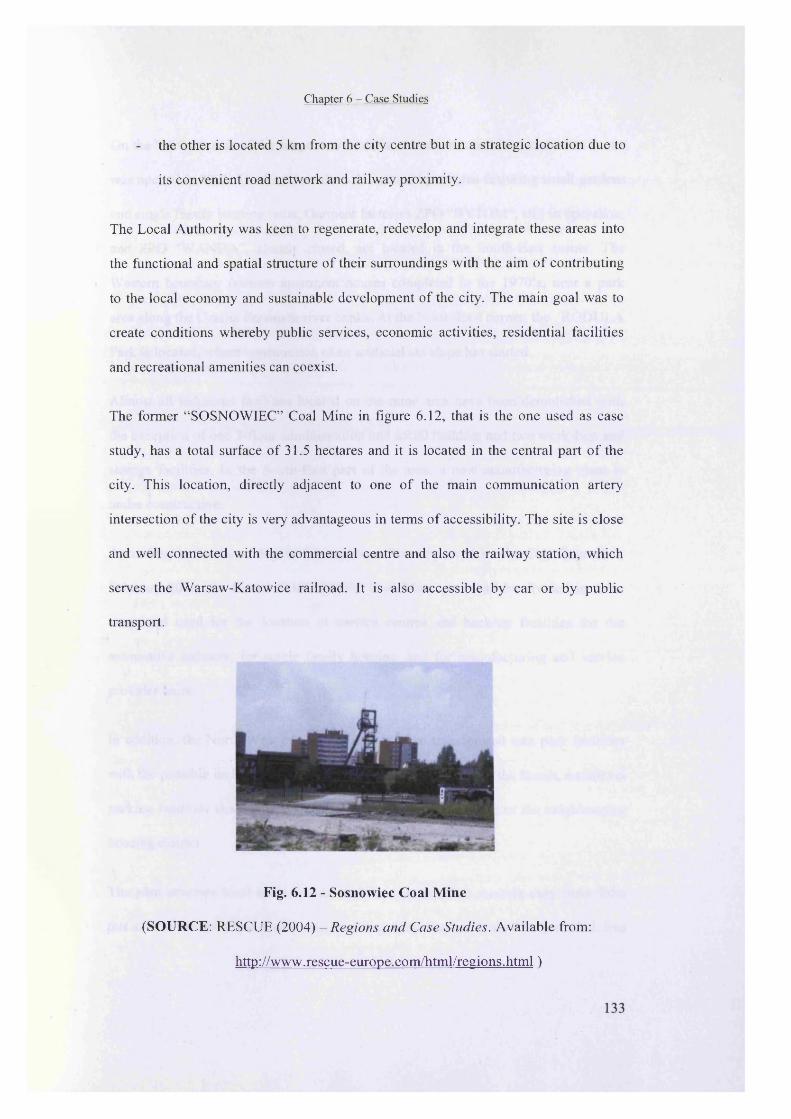
Chapter 6 - Case Studies
the other is located 5 km from the city centre but in a strategic location due to
its convenient road network and railway proximity.
The Local Authority was keen to regenerate, redevelop and integrate these areas into
the functional and spatial structure of their surroundings with the aim o f contributing
to the local economy and sustainable development of the city. The main goal was to
create conditions whereby public services, economic activities, residential facilities
and recreational amenities can coexist.
The former “SOSNOWIEC” Coal Mine in figure 6.12, that is the one used as case
study, has a total surface of 31.5 hectares and it is located in the central part o f the
city. This location, directly adjacent to one of the main communication artery
intersection o f the city is very advantageous in terms o f accessibility. The site is close
and well connected with the commercial centre and also the railway station, which
serves the Warsaw-Katowice railroad. It is also accessible by car or by public
transport.
(SOURCE:
Fig. 6.12 - Sosnowiec Coal Mine
RESCUE (2004) - Regions and Case Studies. Available from:
http://www.rescue-europe.com/html/regions.html)
Chapter 6 - Case Studies
On the Northern side o f the site, a new multifunctional commercial and service centre
was opened in 2001. The Eastern side is delineated by an area featuring small gardens
and single family housing units. Garment factories ZPO “BYTOM ”, still in operation,
and ZPD “W ANDA”, already closed, are located in the South-East comer. The
Western boundary features apartment houses completed in the 1970’s, near a park
area along the Czama Przemsza river banks. At the North-East comer, the RODULA
Park is located, where construction o f an artificial ski slope has started.
Almost all industrial facilities located on the mine area have been demolished with
the exception o f one 3-floor administration and social building and two workshop and
storage facilities. In the South-East part o f the area, a new manufacturing plant is
under constmction.
According to the Local Spatial Management Plan approved by the City Council in
February 2001, the former SOSNOWIEC Coal Mine area shall be divided in three
areas and used for the location o f service centres and back-up facilities for the
automotive industry, for single family housing, and for manufacturing and service
provider units.
In addition, the North-W est part o f the area is to be transformed into park facilities
with the possible inclusion o f supplementary service centres. To the South, multilevel
parking facilities shall be provided for the use o f citizens living in the neighbouring
housing district.
The plan assumes local access roads shall be completed to provide easy links from
this area to the main two streets. Also walking & cycling paths shall be provided, free
134
Chapter 6 - Case Studies
from traffic, linking this area with the Commercial & Service Centre and the
residential district.
The Spatial Management Plan o f the former coal mine area also assumes one existing
pit shaft hoist tower should be kept as an example o f mining excavation history.
Moreover, an historic building originating from the early years o f the last century,
located at Narutowicz Street, within which electrical equipment o f the coal mine has
been installed, should be included in the national monument preservation policy.
On the Eastern side o f the mine area, along Kombajnistow Street, a spoil bank has
been reclaimed in order to reinstate the environmental conditions as they were before
mining excavation started.
All industrial facilities o f the mine, including the rail tracks, have been dismantled,
and the reclaimed area has been levelled. The office buildings and the storage yard
have remained and may be reused.
6.1.4 UK Case Studies
Markham Willows (part of Markham Colliery)
The former Markham colliery is situated to the north-eastern com er o f the county o f
Derbyshire, England, within the District o f Bolsover3. M ining work began at this site
about 1882 and continued until its closure in 1993.
Markham was one o f the last three collieries closed within the county ending more
than 150 years o f deep mining in Derbyshire - an industry which, fifty years ago, had
employed more than 60,000 at 100 collieries across the County. It was estimated at
the time that two jobs in coal industry related jobs would be lost for every one lost in
the mining industry.
135
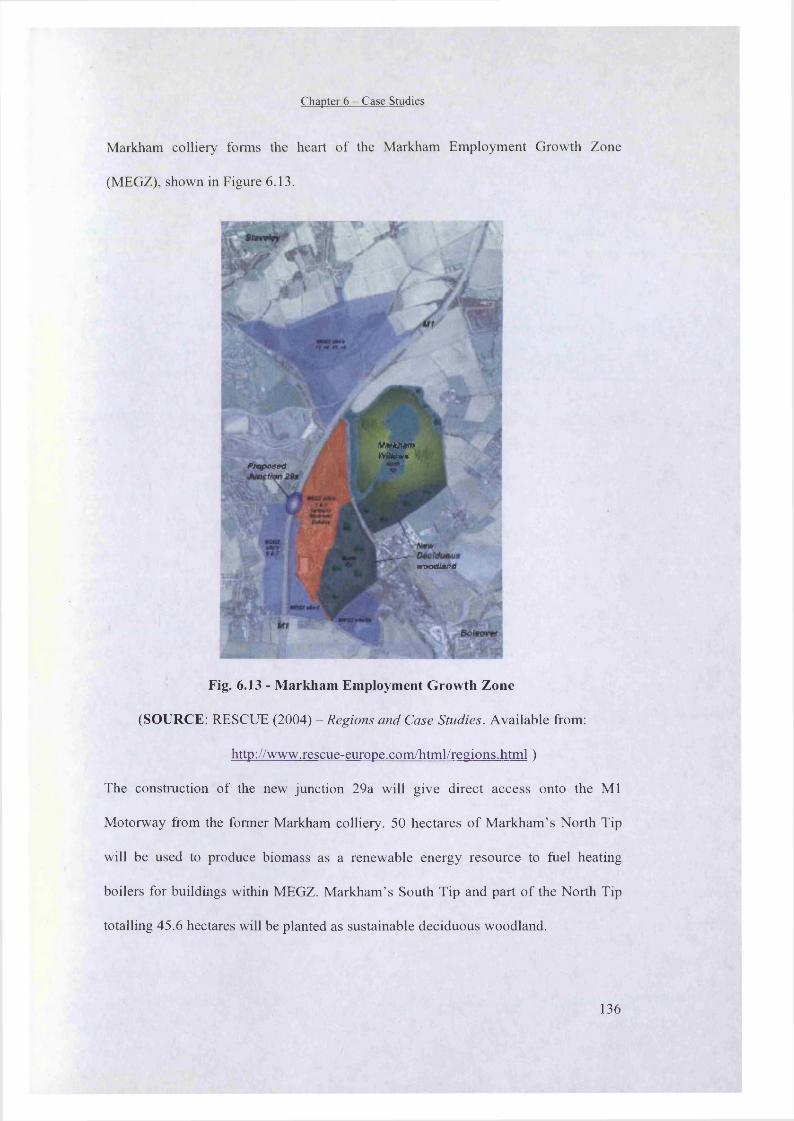
Chapter 6 - Case Studies
Markham colliery forms the heart o f the Markham Employment Growth Zone
(MEGZ), shown in Figure 6.13.
MSflWWfnWNcrw*
Ptapettixa
mxKtifLnri
Fig. 6.13 - Markham Employment Growth Zone
(SOURCE: RESCUE (2004) - Regions and Case Studies. Available from:
http://www.rescue-europe.com/html/regions.html)
The construction o f the new junction 29a will give direct access onto the M l
Motorway from the former Markham colliery. 50 hectares o f M arkham ’s North Tip
will be used to produce biomass as a renewable energy resource to fuel heating
boilers for buildings within MEGZ. M arkham’s South Tip and part o f the North Tip
totalling 45.6 hectares will be planted as sustainable deciduous woodland.
136
Chapter 6 - Case Studies
The concept o f the Markham Employment Growth Zone (MEGZ) originated as a
response to the Coalfields Task Force Report "Making the Difference - A New Start
for England's Coalfield Communities" June 1998. At the heart o f this proposal is the
need to reverse the decline in the North Derbyshire/North Nottinghamshire Coalfield
resulting from the legacy o f pit closures and more recent job losses. In order to
provide the social, economic and environmental improvements needed the Task Force
Report recognised the fundamental need for improved access to such areas and
identified this project as a key coalfield regeneration scheme. In December 2001 the
Government also recognised the importance o f the project when they gave financial
approval, subject to the necessary statutory procedures, to the highway infrastructure
through the Local Transport Plan.
One o f the objectives of MEGZ is to create a sustainable development. This will be
achieved by the following methods:
- using renewable energy to heat buildings
- recycling waste produced within the site
- planting woodland as a carbon sink and sustainable resource.
- provide community transport to service the site and local workforce.
- provide a direct link with the rail network
Markham Willows (see Figure 6.14) is a project within M EGZ designed to utilise the
spoil heap known as the North Tip o f the former M arkham colliery to grow primarily
willow as short rotation coppice (SRC) to be used as a renewable energy resource.
137
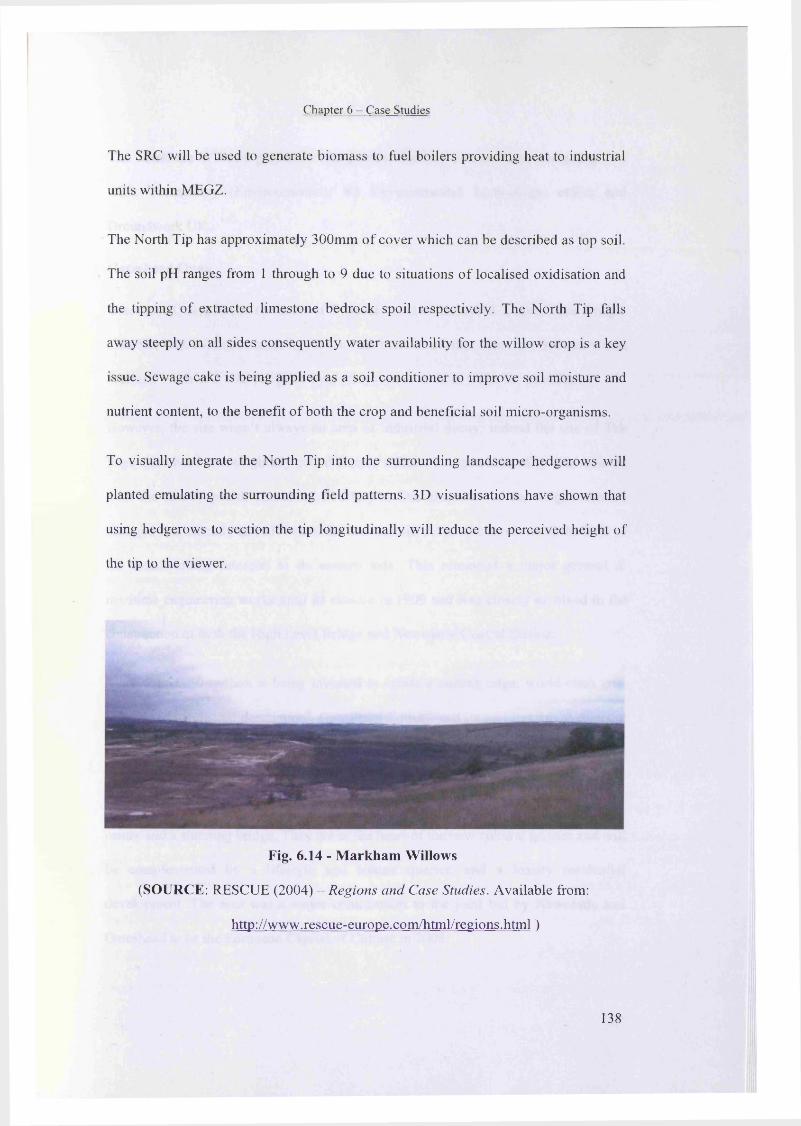
Chapter 6 - Case Studies
The SRC will be used to generate biomass to fuel boilers providing heat to industrial
units within MEGZ.
The North Tip has approximately 300mm o f cover which can be described as top soil.
The soil pH ranges from 1 through to 9 due to situations o f localised oxidisation and
the tipping o f extracted limestone bedrock spoil respectively. The North Tip falls
away steeply on all sides consequently water availability for the willow crop is a key
issue. Sewage cake is being applied as a soil conditioner to improve soil moisture and
nutrient content, to the benefit o f both the crop and beneficial soil micro-organisms.
To visually integrate the North Tip into the surrounding landscape hedgerows will
planted emulating the surrounding field patterns. 3D visualisations have shown that
using hedgerows to section the tip longitudinally will reduce the perceived height of
the tip to the viewer.
Fig. 6.14 - M arkham Willows
(SOURCE: RESCUE (2004) - Regions and Case Studies. Available from:
http://www.rescue-europe.com/html/regions.html)
138
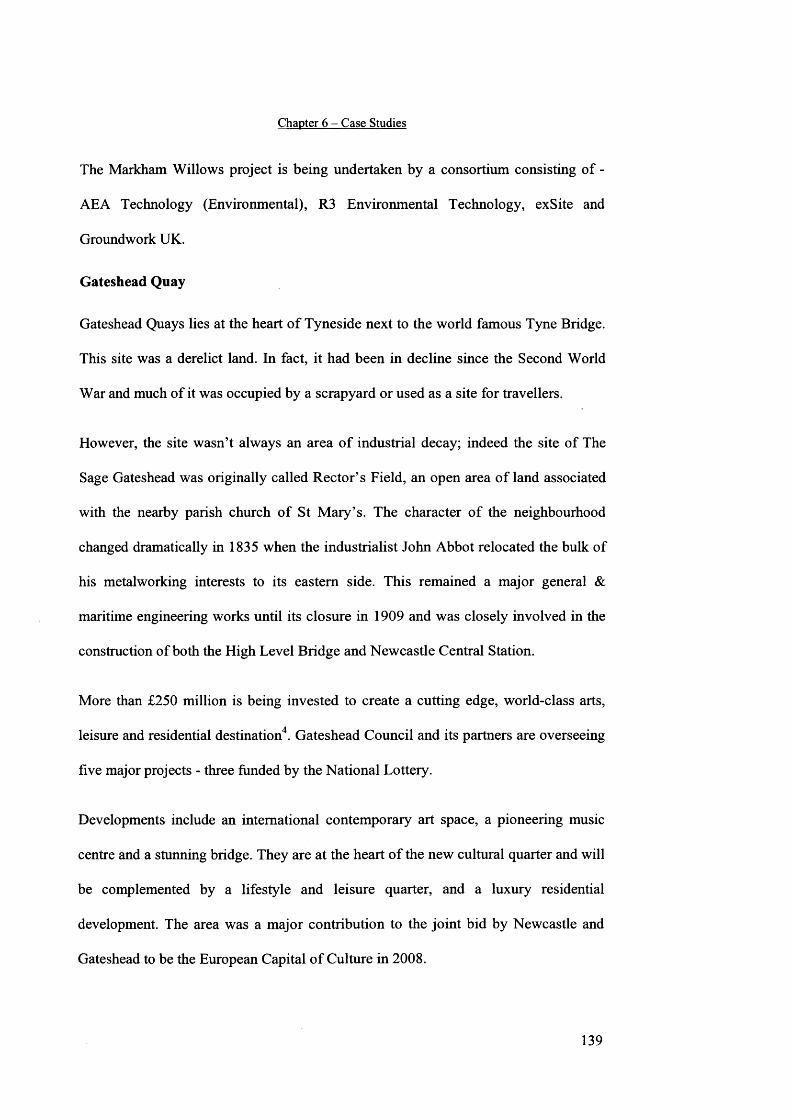
Chapter 6 - Case Studies
The Markham W illows project is being undertaken by a consortium consisting o f -
AEA Technology (Environmental), R3 Environmental Technology, exSite and
Groundwork UK.
Gateshead Quay
Gateshead Quays lies at the heart o f Tyneside next to the world famous Tyne Bridge.
This site was a derelict land. In fact, it had been in decline since the Second World
W ar and much o f it was occupied by a scrapyard or used as a site for travellers.
However, the site w asn’t always an area o f industrial decay; indeed the site o f The
Sage Gateshead was originally called R ector’s Field, an open area o f land associated
with the nearby parish church o f St M ary’s. The character o f the neighbourhood
changed dramatically in 1835 when the industrialist John Abbot relocated the bulk o f
his metalworking interests to its eastern side. This remained a major general &
maritime engineering works until its closure in 1909 and was closely involved in the
construction o f both the High Level Bridge and New castle Central Station.
More than £250 million is being invested to create a cutting edge, world-class arts,
leisure and residential destination4. Gateshead Council and its partners are overseeing
five major projects - three funded by the National Lottery.
Developments include an international contem porary art space, a pioneering music
centre and a stunning bridge. They are at the heart o f the new cultural quarter and will
be complemented by a lifestyle and leisure quarter, and a luxury residential
development. The area was a m ajor contribution to the jo in t bid by Newcastle and
Gateshead to be the European Capital o f Culture in 2008.
139

Chapter 6 - Case Studies
Fig. 6.15 - The Gateshead Quay
(SOURCE: RESCUE (2004) - Regions and Case Studies. Available from:
http://w w w .rescue-europe.com /htm l/regions.htm l)
The first part o f Gateshead Quays (see Figure 6.15) opened for business in summer
1999. Tyneside's most offbeat nightclub - the Baja Beach Club - opened along with a
new restaurant in the Pipewellgate area.
The Gateshead M illennium Bridge was the first opening bridge to be built across the
River Tyne for more than 100 years and has attracted worldwide attention because o f
its unique design. The world-first design is the latest addition to the Tyne's famous
collection o f bridges - which have given the area one o f the most instantly
recognisable skylines in Europe. The £22 million Gateshead M illennium Bridge
provides a footpath and cycle-way linking ambitious new arts and cultural
developments at Gateshead Quays on the south bank with Newcastle Quayside.
The Baltic Centre for Contem porary Art, shown in Figure 6.16, is the major new
centre for international contem porary art, which opened in July 2002. Baltic has a
premier site on the south bank o f the river Tyne and lies right at the heart o f the
regeneration area o f Gateshead Quays. This £46m project has transformed the former
140
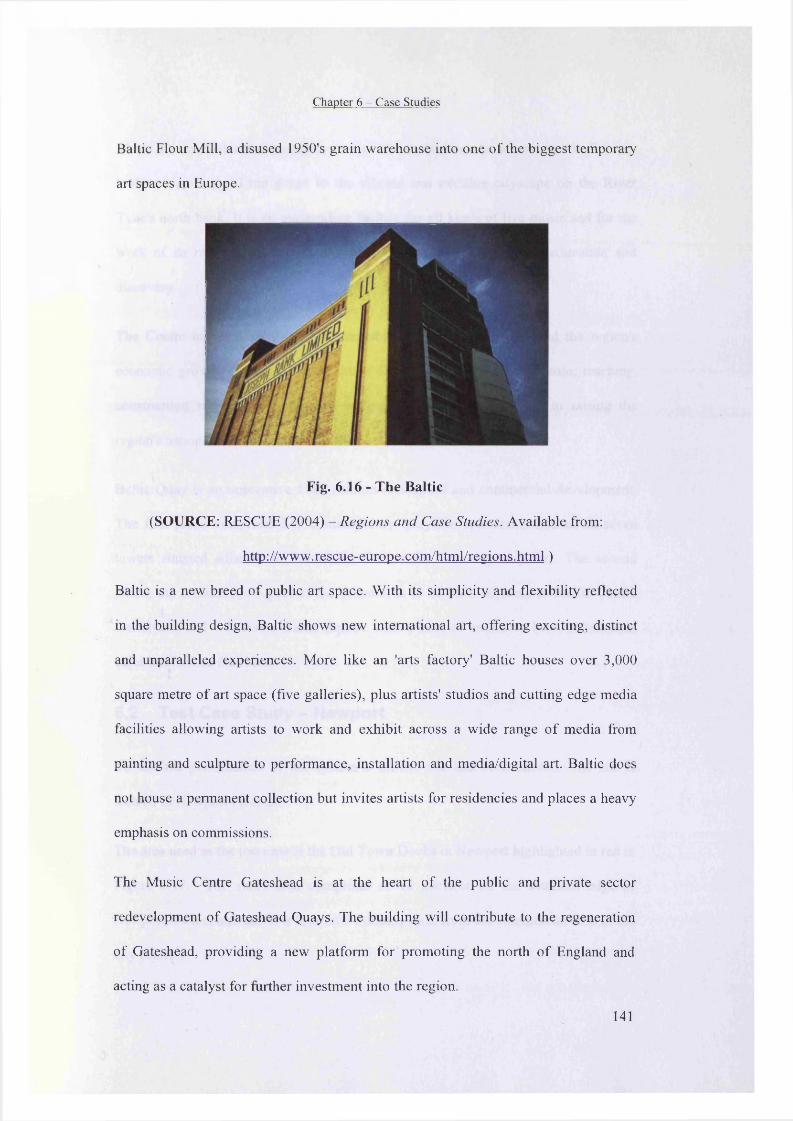
Chapter 6 - Case Studies
Baltic Flour Mill, a disused 1950's grain warehouse into one o f the biggest temporary
art spaces in Europe.
Fig. 6.16 - The Baltic
(SOURCE: RESCUE (2004) - Regions and Case Studies. Available from:
http://www. rescue-europe. com/htm l/regions. h tm l)
Baltic is a new breed o f public art space. W ith its simplicity and flexibility reflected
in the building design, Baltic shows new international art, offering exciting, distinct
and unparalleled experiences. More like an 'arts factory' Baltic houses over 3,000
square metre o f art space (five galleries), plus artists' studios and cutting edge media
facilities allowing artists to work and exhibit across a wide range o f media from
painting and sculpture to performance, installation and media/digital art. Baltic does
not house a permanent collection but invites artists for residencies and places a heavy
emphasis on commissions.
The Music Centre Gateshead is at the heart o f the public and private sector
redevelopment o f Gateshead Quays. The building will contribute to the regeneration
of Gateshead, providing a new platform for promoting the north o f England and
acting as a catalyst for further investment into the region.
141
Chapter 6 - Case Studies
Music Centre Gateshead occupies one o f the most dramatic urban sites in Europe,
looking across the Tyne gorge to the vibrant and exciting cityscape on the River
Tyne's north bank. It is an outstanding facility for all kinds o f live music and for the
work o f its resident musicians, and a pioneering centre for music education and
discovery.
The Centre makes a substantial, sustainable input to Gateshead's and the region's
economic growth, bringing a wide range o f local jobs in tourism, music, teaching,
construction and administration, as well as contributing decisively to raising the
region's national and international profile.
Baltic Quay is an impressive £100 m illion residential and commercial development.
The first phase comprises 241 contemporary quayside apartments housed in seven
towers situated adjacent to Baltic The Centre for Contemporary Art. The second
phase, the commercial aspect o f the scheme, is to be built adjacent to Music Centre
Gateshead, and will frame Baltic Square with a host o f exclusive bars, restaurants,
cafes and leisure facilities.
6.2 Test Case Study - Newport
To test the performance o f the system a further site has been chosen. The site is
located in Newport (Wales).
The area used as the test case is the Old Town Docks in Newport highlighted in red in
Figure 6.17. The study area comprises o f 16 hectares on the southern edge o f
Newport town centre and it is located 5 minutes walk from the commercial core o f the
city centre5.
142
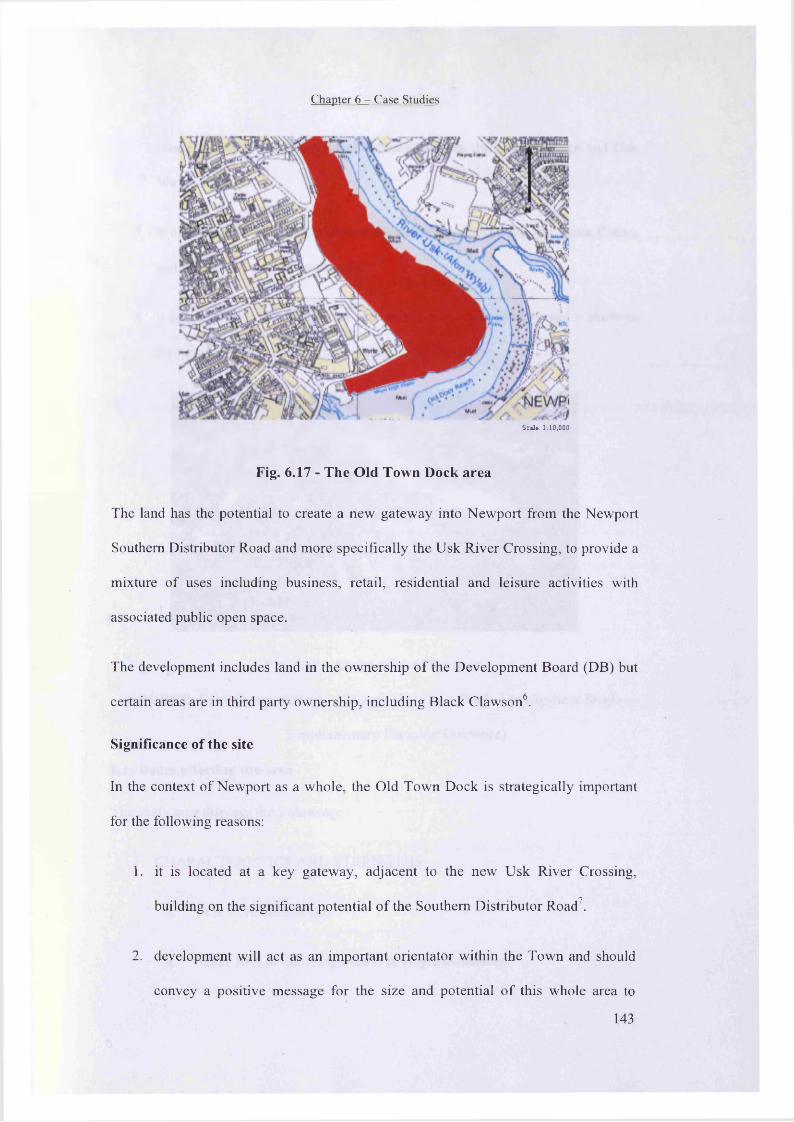
Chapter 6 - Case Studies
S:al»: 2:10,000
Fig. 6.17 - The Old Town Dock area
The land has the potential to create a new gateway into Newport from the Newport
Southern Distributor Road and more specifically the Usk River Crossing, to provide a
mixture o f uses including business, retail, residential and leisure activities with
associated public open space.
The development includes land in the ownership o f the Development Board (DB) but
certain areas are in third party ownership, including Black Clawson6.
Significance of the site
In the context o f Newport as a whole, the Old Town Dock is strategically important
for the following reasons:
1. it is located at a key gateway, adjacent to the new Usk River Crossing,
building on the significant potential o f the Southern Distributor Road7.
2. development will act as an important orientator within the Town and should
convey a positive message for the size and potential o f this whole area to
143

Chapter 6 - Case Studies
create a series o f flagship developments between the river frontage and Usk
Way.
3. it offers the potential to establish critical linkages between the Town Centre
and the Southern Distributor Road
4. it is critical that the study area establishes an image, identity and a platform
for new investments in and the marketing o f Newport.
Fig. 6.18 - Aerial view of the area
(SOURCE: LDA Design (2005) - Newport Old Town Dock: Development Brief -
Supplementary Planning Guidance)
Key issues affecting the area
The study area displays the following:
- CHARACTERISTICS AND STRENGTHS
i. It is a brownfield site
ii. Over 50% o f the study area is in single ownership
144

Chapter 6 - Case Studies
iii. It has Newport County Borough / National Assembly for Wales
support
iv. It has the flexibility to be developed in phases
v. Its proximity to the Town Centre, the southern distributor road and the
M4 is important
vi. It is recognised as a priority location by Newport County Borough
- WEAKNESSES
i. There are various key ownerships which could affect progress
ii. It is not the only brownfield opportunity in Newport
iii. The image o f the location is weak and the surrounding area is
depressed
iv. The site might be affected by various degrees o f contamination
v. The site suffers from weak gateways
- OPPORTUNITIES
i. Waterfront location with key listed building
ii. Links to the Town Centre need to be developed and enhanced
iii. The DB (Development Board) are keen to progress development
opportunities along the riverfront corridor
145
Chapter 6 - Case Studies
iv. The D B ’s economic strategy for Newport views the Usk River
frontage as a focus for business
v. There is an opportunity for linking promotion with the town retail core
- THREATS
i. There will be competition from Greenfield and other brownfield sites
ii. Land releases need to be limited to maintain values
iii. Confused interpretation o f the opportunities for this whole site
iv. Any delays in bringing forward the site for development could
prejudice the programme and progress
v. Image
General Characteristics
An archaeological assessment o f the Old Tow n D ock8 was carried out in 2003 and the
study reported no medieval or earlier archaeological sites within or the immediate
t hvicinity o f the study area. Also, any archaeological sites o f 18 century or earlier are
likely to have been damaged or destroyed by 19th and 20th century activity. Any
surviving archaeological resource is likely to have been buried under 19th century
overburden associated with the raising o f the ground level in the area with spoil from
the excavation o f the Old Town Dock. The same cannot be said about the margins of
the river where the remains o f the medieval ocean going ship were discovered in
Town Pill to the north.
146
Chapter 6 - Case Studies
For this reason the Old Town Dock is itself an object o f historical interest. There are
two listed buildings in the area: The Old Lock (listed Grade II) and the Makings
(listed Grade II)9.
The Maltings was built c. 1898 on the site o f the former Penner and Tilley wharves. It
is a 3 storeys, plus 3 loft storeys for growing and storing barley. This building is listed
as a very good example o f a substantial late 19th century maltings o f a rare type in
Wales, retaining much o f its original form and character.
The area has also a very poor townscape character at present10. The site itself is
largely derelict and the major road along its edge, Usk Way, is lined by low-grade
industrial uses. It comprises areas o f hard standings and derelict land. The site
investigations carried out indicate that the varied site history has left a legacy of
physical and chemical development constraints11.
In addition to hardstandings, below ground structures and foundations are likely to
exist. The investigations have also demonstrated that elevated concentrations o f heavy
metals, sulphates and organics are present, although the extent o f gross contamination
is limited.
Community engagement represents a focus in the redevelopment o f the area12.
Workshops, exhibitions and public consultations have taken place and four options
were established for the redevelopment o f the area. All the options have a river side
park and all propose the development o f the site for a mix o f uses including small
retail, food and drink offices leisure hotel and community use as well as residential.
147
Chapter 6 - Case Studies
REFERENCES:
1. RESCUE (2004) - Regions and Case Studies. Available from:
http://www.rescue-europe.eom/h tml/regions.html
2. Loisinord Site Information. Available from:
http://www.missionbassinminier.org/html/chantiers/urbanisme.php?position:=4
3. Markham Growth Zone. Available from:
http://www.derbvshire.gov.uk/business/economic/markham/
4. Gateshead Quay Development. Available from:
http://www.gateshead.gov.uk/Building%20and%20Development/Regeneratio
n/GOII/Home.aspx
5. LDA Design (2005) - Newport Old Town Dock: Development Brief —
Supplementary Planning Guidance
6. Newport Urban Regeneration Com pany (2002) - Designation Report -
Submitted by Shared Intelligence
7. a) Quadrant Consulting Limited (2001) - Old Town Dock/ South Pillgwenlly
Newport, Supplementary Review of infrastructure — Volume 1/2 201110
b) Quadrant Consulting Limited (2001) - Old Town Dock/South Pillgwenlly
Newport, Review of Engineering Issues - Volume 2/2 - Appendices 201110
8. WSP Environmental (2003) - Archaeological Assessment Report, Old Town
Dock Newport
148
Chapter 6 - Case Studies
9. Newport City Council (2002/2003) - Lower Dock Street, Townscape Heritage
Initiative - Annual Report
10. Knight Frank, RPS, David Langdon & Everest (2002) - Land Use Old Town
Dock Newport - Report Draft
11. Integral Geotechmque (Wales) Limited (2002) - Site Investigation Factual
Report, Proposed Redevelopment Old Town Dock Newport - Report N.
8418/LD/02
12. MacGregor Smith (2001) — Design Brief for Proposed Retail Development,
Newport Old Dock -R evision A
149
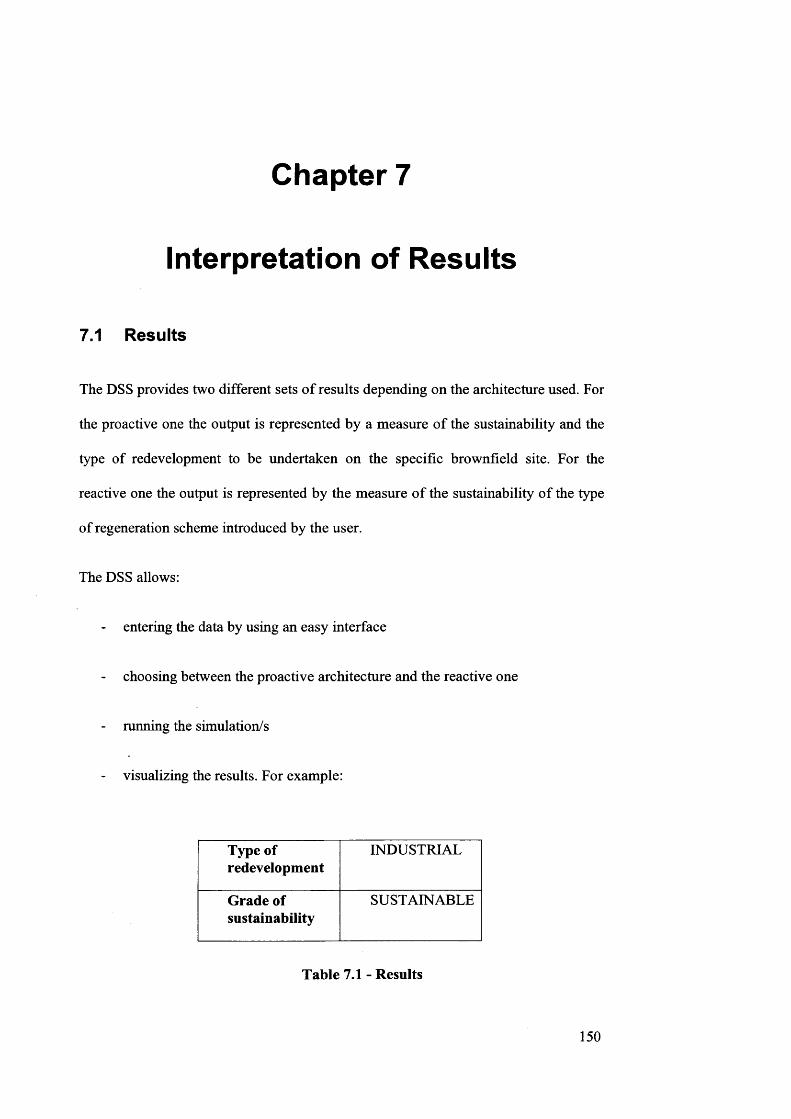
Chapter 7
Interpretation of Results
7.1 Results
The DSS provides two different sets o f results depending on the architecture used. For
the proactive one the output is represented by a measure o f the sustainability and the
type o f redevelopment to be undertaken on the specific brownfield site. For the
reactive one the output is represented by the measure o f the sustainability o f the type
o f regeneration scheme introduced by the user.
The DSS allows:
entering the data by using an easy interface
choosing between the proactive architecture and the reactive one
- running the simulation/s
- visualizing the results. For example:
Type of redevelopment
INDUSTRIAL
Grade of sustainability
SUSTAINABLE
Table 7.1 - Results
150
Chapter 7 - Interpretation o f results
The interpretation o f the results obtained is assessed at two levels. The first
interpretation is related to the case studies used to train the artificial neural network,
the second interpretation is related to the test case study and the output obtained by
the DSS as potential sustainable type o f redevelopm ent type for the site considered.
7.1.1 Interpretation of results from case Studies
The artificial neural network developed within the DSS has been trained by using
existing case studies in four European countries (France, Germany, Poland, and
U.K)1.
The available information on each site included the results o f each indicator and the
final use chosen as potential regeneration scheme for the site considered.
This information has been introduced in the DSS to allow the system to learn from the
real examples. Once this operation was concluded, the artificial neural network was
submitted to an evaluation o f the performance through the following procedure:
- the set o f information for each case study is re-input in the system without
entering the type o f redevelopm ent (expected output)
the system runs the simulations again
the result obtained is compared w ith the initial value o f the redevelopment
type for each case study.
The information entered and obtained after the training are shown in the tables below.
151
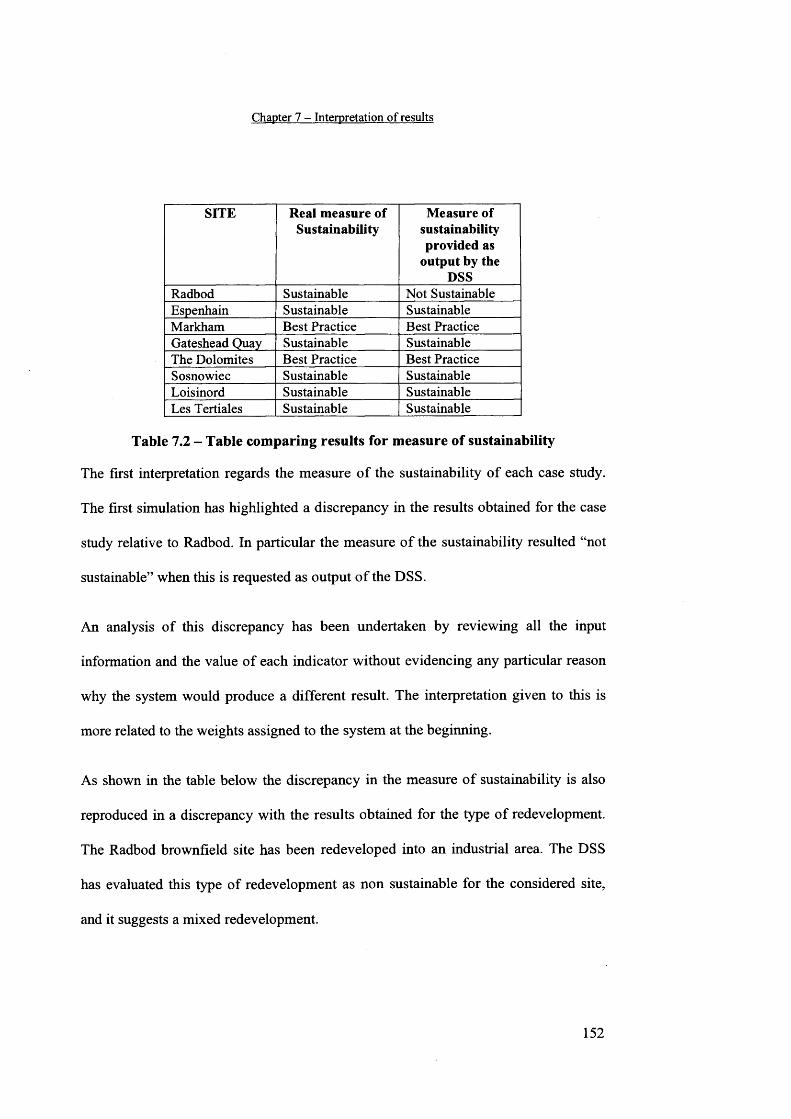
Chapter 7 - Interpretation o f results
SITE Real measure of Sustainability
Measure of sustainability provided as
output by theDSS
Radbod Sustainable Not SustainableEspenhain Sustainable SustainableMarkham Best Practice Best PracticeGateshead Quay Sustainable SustainableThe Dolomites Best Practice Best PracticeSosnowiec Sustainable SustainableLoisinord Sustainable SustainableLes Tertiales Sustainable Sustainable
Table 7.2 - Table comparing results for measure of sustainability
The first interpretation regards the measure o f the sustainability o f each case study.
The first simulation has highlighted a discrepancy in the results obtained for the case
study relative to Radbod. In particular the m easure o f the sustainability resulted “not
sustainable” when this is requested as output o f the DSS.
An analysis o f this discrepancy has been undertaken by reviewing all the input
information and the value o f each indicator without evidencing any particular reason
why the system would produce a different result. The interpretation given to this is
more related to the weights assigned to the system at the beginning.
As shown in the table below the discrepancy in the measure o f sustainability is also
reproduced in a discrepancy with the results obtained for the type o f redevelopment.
The Radbod brownfield site has been redeveloped into an industrial area. The DSS
has evaluated this type o f redevelopment as non sustainable for the considered site,
and it suggests a mixed redevelopment.
152
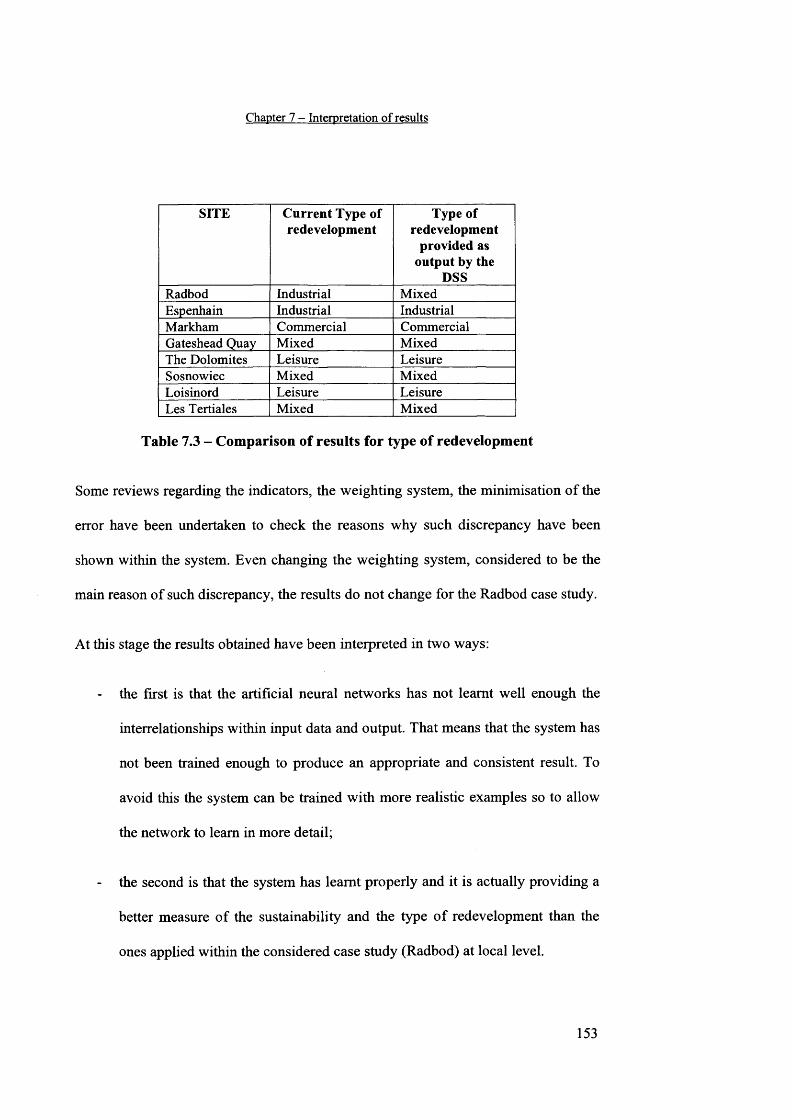
Chapter 7 - Interpretation o f results
SITE Current Type of redevelopment
Type of redevelopment
provided as output by the
DSSRadbod Industrial MixedEspenhain Industrial IndustrialMarkham Commercial CommercialGateshead Quay Mixed MixedThe Dolomites Leisure LeisureSosnowiec Mixed MixedLoisinord Leisure LeisureLes Tertiales Mixed Mixed
Table 7.3 - Comparison of results for type of redevelopment
Some reviews regarding the indicators, the weighting system, the minimisation of the
error have been undertaken to check the reasons why such discrepancy have been
shown within the system. Even changing the weighting system, considered to be the
main reason of such discrepancy, the results do not change for the Radbod case study.
At this stage the results obtained have been interpreted in two ways:
- the first is that the artificial neural networks has not learnt well enough the
interrelationships within input data and output. That means that the system has
not been trained enough to produce an appropriate and consistent result. To
avoid this the system can be trained with more realistic examples so to allow
the network to learn in more detail;
- the second is that the system has learnt properly and it is actually providing a
better measure of the sustainability and the type of redevelopment than the
ones applied within the considered case study (Radbod) at local level.
153

Chapter 7 - Interpretation o f results
The discrepancy shown between results is represented only by one case on eight. This
means that the system has a performance of around 87% that is acceptable for the
scope of this work. The performance of the system increases when the information
entered is more detailed, therefore fewer gaps enable the system to run simulations in
a more consistent way.
7.1.2 Interpretation of the resuits from the test case - Newport
The DSS completed and trained with the case studies has then been tested with a new
case study - Newport. The architecture chosen is the proactive one to obtain a
measure of the sustainability and also a type of redevelopment suggested.
The DSS performed the simulation without knowing the final type of redevelopment.
The result obtained on the basis of the inserted information is represented by the type
of redevelopment commercial.
The Planning Guidance provided to the Newport City Council in 2005 suggested a
mixed use as type of redevelopment on the basis of a detailed analysis undertaking by
different consultants2.
The discrepancy between the results of the DSS and the actual type of redevelopment
chosen by the Newport City Council does not mean that the system is not performing
or providing a consistent result. It is important to consider that this concept is the
result of a long and onerous process that the Newport City Council authority has
undertaken for few years. This has involved the participation of different stakeholders
at various levels. In addition the site is located in a strategic position at political level.
Unfortunately, often sustainability is not considered as main goal when approaching a
brownfield site with the intention of regenerating the area.
154
Chapter 7 - Interpretation o f results
Institutional control aspects, economic constraints can play a key role in the decision
made by the stakeholders with regard to a regeneration process. Unfortunately, at this
stage this type of information is not considered within the DSS.
The type of redevelopment chosen by Newport City Council (mixed use) has been
entered into the DSS under the reactive architecture to obtain a measure of the
sustainability. The output highlighted that the proposed redevelopment, is actually
sustainable.
7.2 Considerations
It is important to take into consideration that by definition the decision support system
helps the user to make the appropriate decision by providing a platform of
information on which the user can further assess and evaluate the issues involved in
the complex brownfield regeneration problem.
The DSS does not provide an optimal solution to be applied as it is, but it performs
simulations to allow the user to understand the different scenarios and compare them.
The comparison and analysis of the different potential solutions provide a great
support to the actors involved in the process since it gives a real time view of the
potential issues related to the different type of regeneration schemes.
The optimal type of redevelopment for a certain brownfield site is also related to
common sense and the local knowledge of the key players involved in the process.
This knowledge comes from years of experience and common sense that are difficult
to quantify and therefore cannot be entered into a tool such as the DSS.
155

Chapter 7 - Interpretation o f results
Some brownfield site regeneration processes might represent best practice but due to
their particular characteristics and local context might not be replicable at other sites.
The main aim of a decision support system is to provide results to be used as a
platform for decision makers. The final solution shall be a mix between the one
produced by the DSS and the knowledge and experience of the decision maker.
156
Chapter 7 - Interpretation o f results
REFERENCES:
1. Sustainable Assessment Tool (2004). Available from: http://www.rescue-
europe.com/download/reports/2 5 2 Administrative%20tools%20and%2
0incentives%20-%20SAT.pdf
2. Shared Intelligence (King Sturge, David Lock Associates, Oscar Faber,
Newidiem, 2002) - Five Counties Regeneration Framework: Final Report
- Revised Draft
157
Chapter 8
Conclusions
8.1 Critique of the work
The BSSR-DSS developed for this project represents a useful tool for decision
makers to assess a brownfield site regeneration scheme and identify the sustainability
of the project. The system also allows the decision maker to evaluate potential
regeneration schemes for an identified brownfield site and obtain a sustainable type of
redevelopment for the area studied.
During the development of the DSS the following tasks have been undertaken:
Design of methods for comparing the indicators: the indicators have been
divided in 7 sectors (water, waste, land, contamination, building and
infrastructure, energy and public participation) to facilitate the management of
the large amount of information and to ensure that data are realistic.
- Adaptation of the criteria for sustainability, developed by RESCUE, in the
developed system: existing criteria have been analysed and restructured in an
appropriate way allowing conversion of the indicators into the required code
for the utilised programming language - Mapbasic. No alterations to the
meaning, value or unit of measurement of the indicators has been undertaken,
therefore the integrity of the system has been retained.
158
Chapter 8 - Conclusions
Elaboration of a mathematical model that measures the regeneration process:
further to reviewing relevant existing literature, it was determined that the
integration of fuzzy logic and artificial neural networks for brownfield
regeneration process was an innovative approach.
Application, use and development o f the code for fuzzy logic and artificial
neural networks: the sustainability of the 7 sectors (water, waste, land,
contamination, building and infrastructure, energy and public participation)
has been measured through input of the indicators into the fuzzy logic. The
output of this represent the input of the artificial neural network. The code for
both the mathematical models has been developed using the programming
language - Mapbasic.
Development of a simulation process based on the developed mathematical
model to compare different scenarios for the regeneration projects suitable for
that area: the artificial neural network processes the input data and provides a
measure of the sustainability and the suitable redevelopment type for the area
studied. Comparisons of different available scenarios have been made by
assessing the sustainability of each scenario.
The visualization in the GIS of the results has encountered some problems in terms of
data and information available therefore this has not been included in the current
thesis.
Some final general considerations are shown below.
159
Chapter 8 - Conclusions
8.2 Final Considerations
The Decision Support System for brownfield site sustainable regeneration has been
developed to support the key players and decision makers involved in the complex
and multidimensional problem of brownfield regeneration.
The legislation in UK has encouraged a sustainable approach in different sectors and
in particular within the regeneration of brownfield sites, sustainability represents one
of the key aspects to be considered whilst redeveloping a derelict area.
There is a lack of integrated and comprehensive knowledge on the condition, location
and management of brownfield sites throughout the UK and little attention has been
given to the contribution that brownfield sites make to biodiversity, nature
conservation and amenity.
Typically, when developers, stakeholders, and decision makers have an interest in a
brownfield site, they must perform an extensive information search to determine its
planning and environmental status. In addition to this, UK legislation now enforces
the application of sustainability criteria to the regeneration of brownfield sites.
An information search of this type could take days, weeks, or even months to
compile. With the DSS developed here, this search could take a matter of minutes,
and be displayed in an easy to understand graphical or map form. The sustainability
can be easily assessed and then utilise to make appropriate decisions at the different
phase of the regeneration process.
The DSS can be used for any type of brownfield site and in the different phases of the
regeneration process, independently of the location and the size. The results provided
160
Chapter 8 - Conclusions
represent an ideal basis for the decision maker to assess potential alternatives and
make the appropriate relevant decisions.
The innovative step taken by developing this DSS is that a large number of variables
(land, water, waste etc) involved in the complex problem of brownfield site
regeneration have been analysed, evaluated and elaborated in order to produce a result
that takes into consideration the various important aspects of sustainability within a
regeneration process. Some issues have been identified during the development of the
DSS and these are explained in the following paragraph.
8.3 Issues
During the development and testing of the decision support system some issues have
been identified.
The issues are related to the data, the test case, the mathematical model and the
visualization, the results.
DATA - the artificial neural network has been trained on the basis on eight real case
studies. In general this type of networks does not present a rule with regard to the
number of cases that need to be utilised to train the network itself. The main concern
is that eight case studies might be not enough to represent all the possible
combinations in such a complex problem as brownfield regeneration.
To avoid giving inconsistency to the system developed, ideal cases have been created
by randomly associating values to the indicators in input to the system. This helped to
allow the network to perform more trainings cycles. The results obtained by creating
these ideal cases have been analysed and assess against the real case studies.
161
Chapter 8 - Conclusions
TEST CASE - the case study used to test the system is Newport (Wales - UK) and at
current time not all the information regarding the different sustainability indicators
are available. The available information have been collected from Newport County
Council and the lack of information in certain sectors is due to the current phase of
the project.
To overtake this issue the missing information have been introduced as “gaps” in the
list of indicators but these can be updated once further detailed information about the
site are released by the relevant bodies.
MATHEMATICAL MODEL - artificial neural networks present the limitation of not
being able to consider constraints. In reality the redevelopment of a brownfield site
might be subject to constraints related to planning issues, legislation, etc. At this stage
it has been assumed that the constraints are actually taken into consideration by the
decision maker whilst introducing the parameters for each sustainability indicator or
at the end of process as additional information to the output given by the decision
support system in order to make the final decision.
VISUALISATION - during the development of the system an attempt to input the
electronic maps of each case study to enhance the visualisation part has been
undertaken, unfortunately there was no potential to obtain the electronic maps for the
eight case studies. Consequently the visualisation of the results is not possible in these
cases.
For the test case there is an electronic format. The visualization part is still under
construction to assure that the best result is obtained. Due to lack of information the
visualization will not be detailed to size and location.
162
Chapter 8 - Conclusions
8.3 Potential Future Developments
At this stage the developed DSS has some limitations in the input variables and the
information provided as output. The features of this system can be improved in
different ways: by enhancing some internal procedures or some features.
The visualization of the variables in input and the way this is requested to the decision
maker could be enhanced if internally linked with an existing map in electronic
format including specific characteristics of the site. For example: the presence on site
of contamination could be highlight in the GIS with different colors or symbols
depending on the type of contamination. If detailed maps are available the sustainable
regeneration process provided as an output by the system could be graphically
represented on the map. For example: exact and convenient location of residential
houses within the considered area of study.
In addition the issues (waste, water, participation etc) related to the brownfield
regeneration problem could be analyzed in more detail by developing a sub-system to
evaluate the sector and provide more output information. This could help the decision
maker to assess a particular important issue related to the specific brownfield site.
From the point of view of the mathematical techniques used to develop the system,
the artificial neural networks utilized could be enhanced by developing a parallel
process for the integration of constraints such as legislation, timescale and so on. The
integration of constraints will require the development of functions that stop the
artificial neural network when a desired variable reaches a certain value. This
enhancement would provide a more realistic output, in terms of sustainability, for the
163
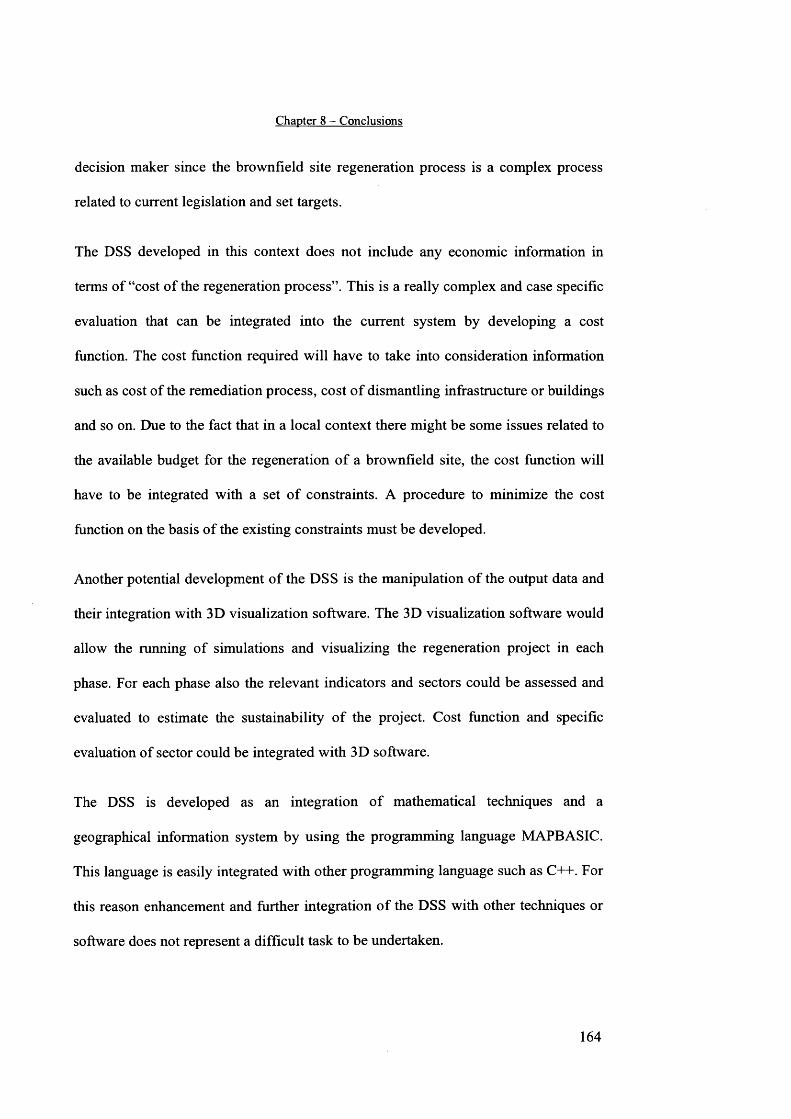
Chapter 8 - Conclusions
decision maker since the brownfield site regeneration process is a complex process
related to current legislation and set targets.
The DSS developed in this context does not include any economic information in
terms of “cost of the regeneration process”. This is a really complex and case specific
evaluation that can be integrated into the current system by developing a cost
function. The cost function required will have to take into consideration information
such as cost of the remediation process, cost of dismantling infrastructure or buildings
and so on. Due to the fact that in a local context there might be some issues related to
the available budget for the regeneration of a brownfield site, the cost function will
have to be integrated with a set of constraints. A procedure to minimize the cost
function on the basis of the existing constraints must be developed.
Another potential development of the DSS is the manipulation of the output data and
their integration with 3D visualization software. The 3D visualization software would
allow the running of simulations and visualizing the regeneration project in each
phase. For each phase also the relevant indicators and sectors could be assessed and
evaluated to estimate the sustainability of the project. Cost function and specific
evaluation of sector could be integrated with 3D software.
The DSS is developed as an integration of mathematical techniques and a
geographical information system by using the programming language MAPBASIC.
This language is easily integrated with other programming language such as C++. For
this reason enhancement and further integration of the DSS with other techniques or
software does not represent a difficult task to be undertaken.
164

Appendix A
Sustainability Indicators

SUSTAINABILITY INDICATORS
MANAGEMENT OF CONTAMINATION AND REUSE OF SOIL AND DEBRIS
Objective 1: To reduce negative environmental impacts on the site and on the neighbourhood including human health risks
1. ID 2.1
2. Indicator Number of complaints (and incidents) per year before / after site redevelopment (or opinion poll before and after redevelopment)
3. Name Pressure on Neighbourhood
4. Objective To describe the impact(s) of the site on the neighbourhood.
5. Definition The indicator is the comparison of the amount of public complaints to local authorities before and after site redevelopment (or comparison of opinion polls before and after redevelopment)
6. Justification This indicator will allow evaluating the sustainability of the management of the contamination and wastes from a global point of view.
7. Unit of measurement Ratio
1. ID 2.2
2. Indicator Number of measures exceeding the legal level on a 24 hour duration measurement
3. Name Ambient Noise level
4. Objective To evaluate the impact of noise of the new project on the population
5. Definition The level of ambient noise will be measured at the closest housing fa9ade.
6. Justification This indicator is one of the indicators allowing to evaluate the effective reduction of impacts on the neighbourhood.
7. Unit of measurement Number in decibels

1. ID 2.3
2. Indicator Number of days air pollutants and dust exceed healthful levels
3. Name Air emission control
4. Objective To measure changes in air quality.
5. Definition Air emission control consists in the analysis of air quality and dust
6. Justification This indicator is one of the environmental indicators allowing to measure progress in the redevelopment.
7. Unit of measurement days
1. ID 2.4
2. Indicator Area of land treated / Area of land affected by contamination
3. Name Land treated
4. Objective To assess the effectiveness of site clean up.
5. Definition This is a measure of the amount of land affected by contamination and its proportion to the total area
6. Justification This indicator is one of the environmental indicators allowing to measure the progress in the clean up process
7. Unit of measurement %
1. ID 2.5
2. Indicator Existence of hydrological drainage and treatment
3. Name Surface water
4. Objective To assess surface water quality running off from the site.
5. Definition The hydrological drainage pattern can be defined as the collection of surface water and its conveyance to a location where it receives treatment (if needed) to permit its discharge to the environment without negative impact
6. Justification This indicator is one of the environmental indicators allowing to assess the quality of the water system available on the site
7. Unit of measurement Yes/No and check list
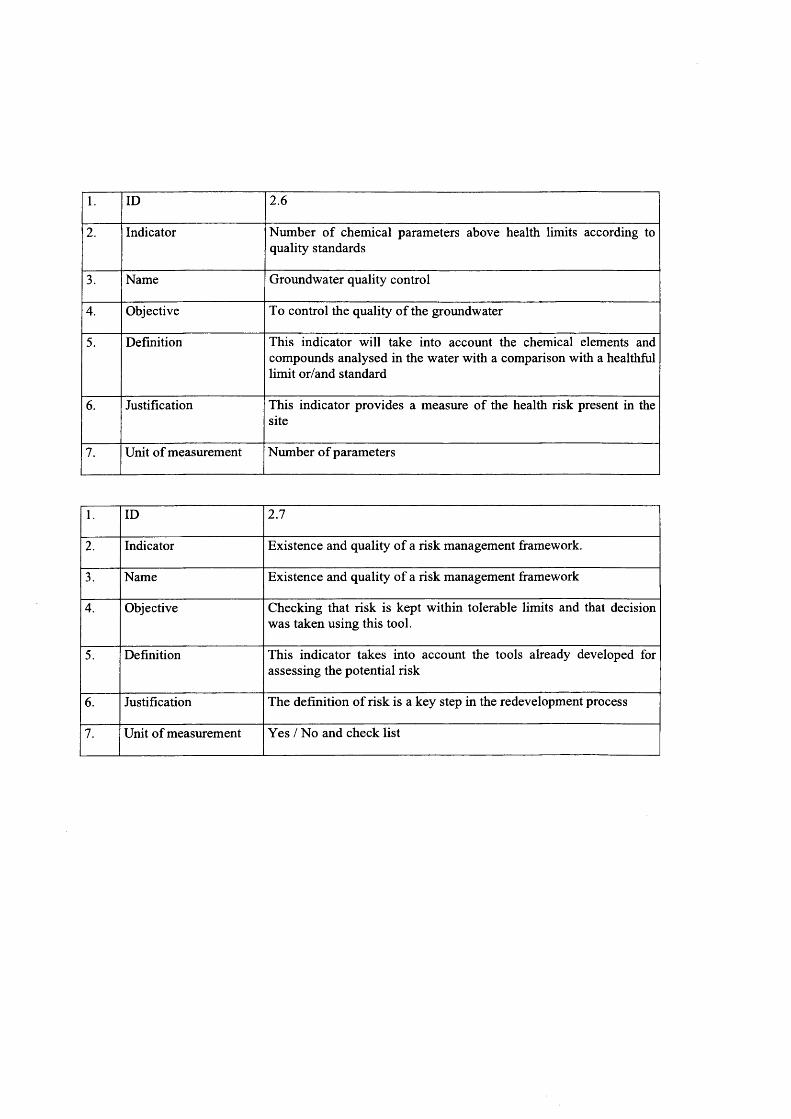
1. ID 2.6
2. Indicator Number of chemical parameters above health limits according to quality standards
3. Name Groundwater quality control
4. Objective To control the quality of the groundwater
5. Definition This indicator will take into account the chemical elements and compounds analysed in the water with a comparison with a healthful limit or/and standard
6. Justification This indicator provides a measure of the health risk present in the site
7. Unit of measurement Number of parameters
1. ID 2.7
2. Indicator Existence and quality of a risk management framework.
3. Name Existence and quality of a risk management framework
4. Objective Checking that risk is kept within tolerable limits and that decision was taken using this tool.
5. Definition This indicator takes into account the tools already developed for assessing the potential risk
6. Justification The definition of risk is a key step in the redevelopment process
7. Unit of measurement Yes / No and check list

Objective 2: To minimise waste and maximise recycling and reuse of soil and debris
1. ID 2.8
2. Indicator Amount of wastes treated / Total amount of wastes
3. Name Waste generation
4. Objective To provide a measure of the extent of hazardous and non hazardous wastes which could have a direct impact on health and the environment
5. Definition The total amount of hazardous and non hazardous wastes generated and treated per year
6. Justification This indicator provides a measure of the effectiveness of the waste strategy
7. Unit of measurement %
1. ID 2.9
2. Indicator Volumes of solid waste, soil and debris recycled per time unit / Volumes of solid waste, soil and debris produced per time unit
3. Name Proportion of solid waste, soil and debris recycling and reuse on site and off site
4. Objective To measure the proportion of solid waste, soil and debris which is reused or recycled
5. Definition Volume of solid waste, soil and debris which is reused or recycled based on the volume actually generated at the source
6. Justification This indicator provides a measure of the effectiveness of the recycling strategy
7. Unit of measurement %

Objective 3: To ensure cost effectiveness and technical feasibility
1. ID 2.10
2. Indicator Land value/ cost of remediation
3. Name Land value
4. Objective To give an indication of the value of the site.
5. Definition This indicator relates to the new value of site and its cost effectiveness .
6. Justification This indicator provides a measure of the need to remediate the area
7. Unit of measurement %
1. ID 2.11
2. Indicator Existence of a “Post-Remediation validation reporting”
3. Name Remediation Post validation
4. Objective To evaluates if contaminated site has been successfully remediated (for its intended or current use) and that the objectives of the site management plan have been achieved
5. Definition The post validation study is capital in the evaluation of the technical feasibility and effectiveness
6. Justification This indicator represents the success or failure in the regeneration process
7. Unit of measurement Yes/no and Check list

Objective 4: To improve social acceptance through identification of all stakeholders and risk communication
1. ID 2.12
2. Indicator Existence of a documented strategy
3. Name Existence of a public approach strategy including education
4. Objective To verify that the public is informed about the process that is taking place
5. Definition The involvement of the public during the regeneration process by means of educational approach
6. Justification During the field works it is important to explain the meaning of the activity and to educate about risks
7. Unit of measurement Yes/no check list
Objective 5: To provide decision support tools for risk based land management
1. ID 2.13
2. Indicator Existence of decision support tools
3. Name Existence of decision support tools
4. Objective To check if the techniques of for example risk assessment, GIS, etc. have been applied. To evaluate the validity of this use.
5. Definition Presence of a set of tools to be used in the process in order to facilitate and enrich it.
6. Justification To understand and evaluate the decision making process.
7. Unit of measurement Yes/no, and check lis t, cf. CABERNET

Objective 6: To reduce natural mineral resource consumption
1. ID 2.14
2. Indicator Volume of previously unused natural minerals consumed by the project expressed as a proportion of total volumetric project mineral resource demand.
3. Name Conservation of natural mineral resources
4. Objective To describe the relative impact of the project on reserves of nonrenewable natural mineral resources.
5. Definition The indicator links mineral resource use with mineral resource consumption
6. Justification This indicator will allow the evaluation of the sustainability of mineral resource use from a local, regional, national and European perspective
7. Unit of measurement ratio

MANAGEMENT OF EXISTING BUILDINGS AND INFRASTRUCTURE
Objective 1: To minimise energy demand and produce renewable energy on the site
1. ID 3.1
2. Indicator kWh/m3/a
3. Name Specific Energy Demand
4. Objective To minimise energy demand and to replace non-renewable energy sources by renewable ones on the retrofitted buildings or on the site
5. Definition This parameter indicates the usage of natural resources, as well as indirect impact on environment.
Energy demand is related to:
type of building usage
type of construction of the building, namely basic parts of the building
roof
outside walls
windows
doors
etc.
total volume of the building
basic data of the building ventilation
type of lighting of the building
6. Justification The energy demand by the existing building is the one of the most important indicators for the influence on air and land surface contamination during the period of building exploitation resulting from energy demand.
7. Unit
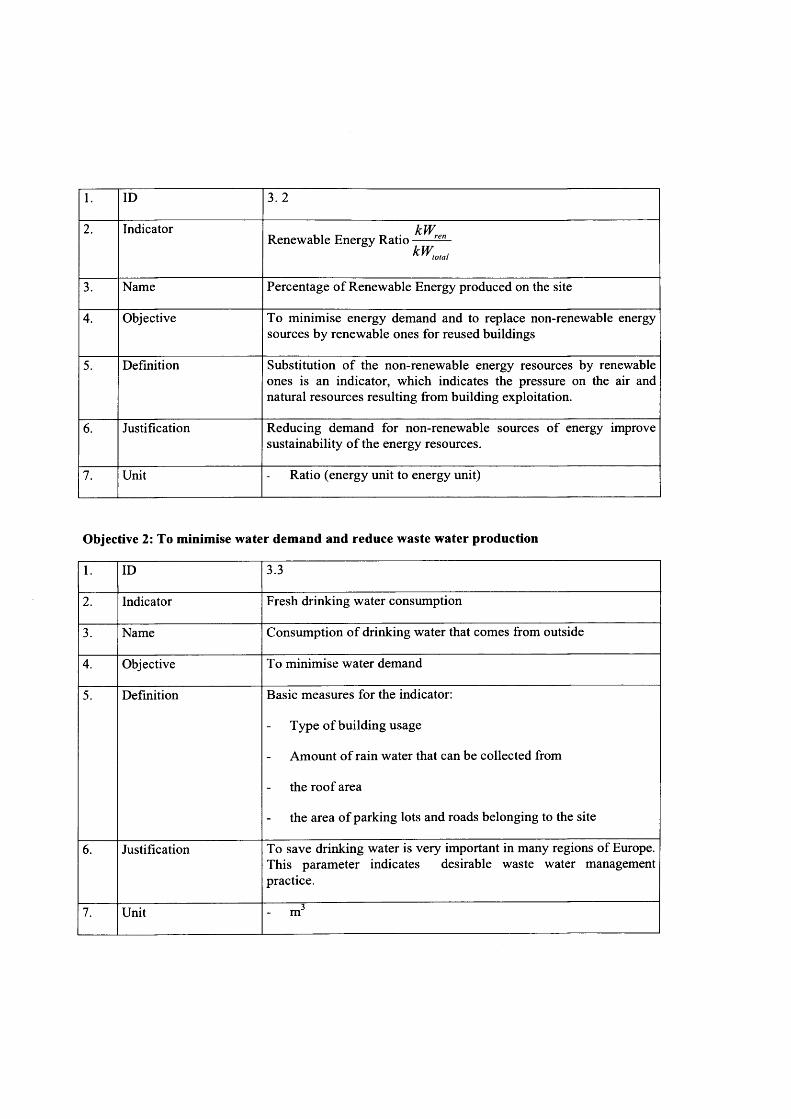
1. ID 3.2
2. Indicator kWRenewable Energy Ratio-----C£n-
kWK V V total
3. Name Percentage of Renewable Energy produced on the site
4. Objective To minimise energy demand and to replace non-renewable energy sources by renewable ones for reused buildings
5. Definition Substitution of the non-renewable energy resources by renewable ones is an indicator, which indicates the pressure on the air and natural resources resulting from building exploitation.
6. Justification Reducing demand for non-renewable sources of energy improve sustainability of the energy resources.
7. Unit Ratio (energy unit to energy unit)
Objective 2: To minimise water demand and reduce waste water production
1. ID 3.3
2. Indicator Fresh drinking water consumption
3. Name Consumption of drinking water that comes from outside
4. Objective To minimise water demand
5. Definition Basic measures for the indicator:
Type of building usage
Amount of rain water that can be collected from
the roof area
the area of parking lots and roads belonging to the site
6. Justification To save drinking water is very important in many regions of Europe. This parameter indicates desirable waste water management practice.
7. Unit m
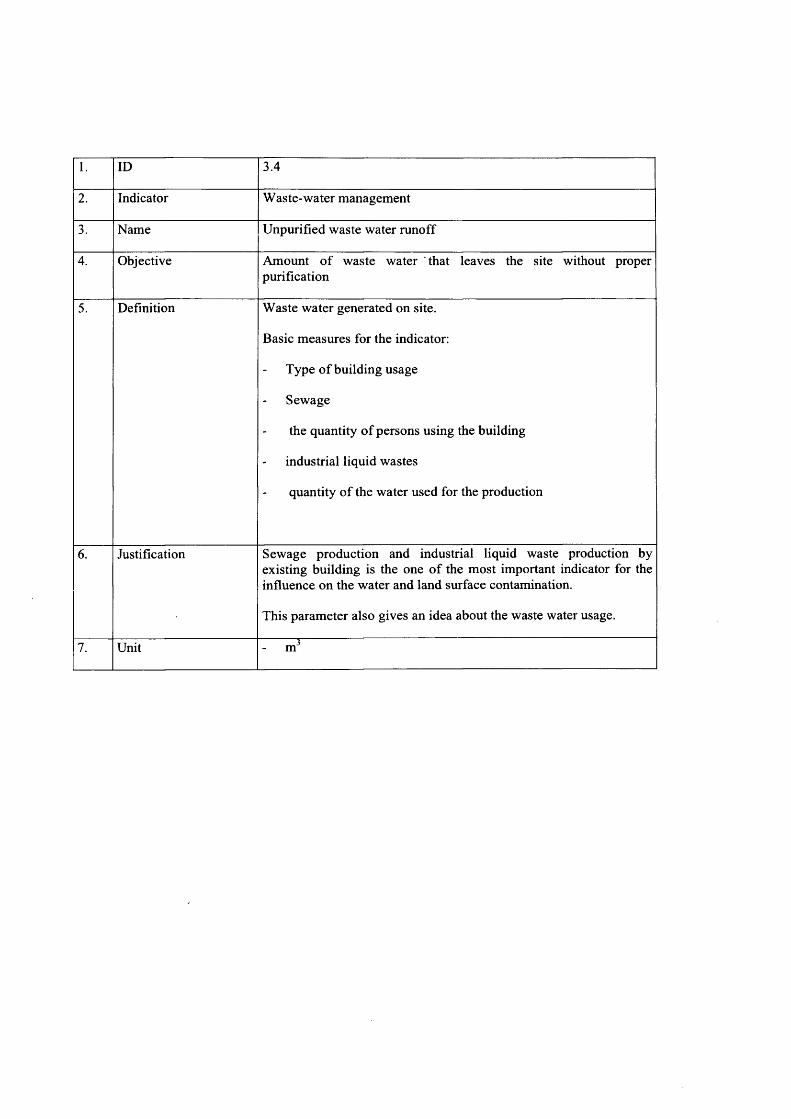
1. ID 3.4
2. Indicator Waste-water management
3. Name Unpurified waste water runoff
4. Objective Amount o f waste water that leaves the site without proper purification
5. Definition Waste water generated on site.
Basic measures for the indicator:
Type o f building usage
Sewage
the quantity o f persons using the building
industrial liquid wastes
quantity o f the water used for the production
6. Justification Sewage production and industrial liquid waste production by existing building is the one o f the most important indicator for the influence on the water and land surface contamination.
This parameter also gives an idea about the waste water usage.
7. Unit 3m
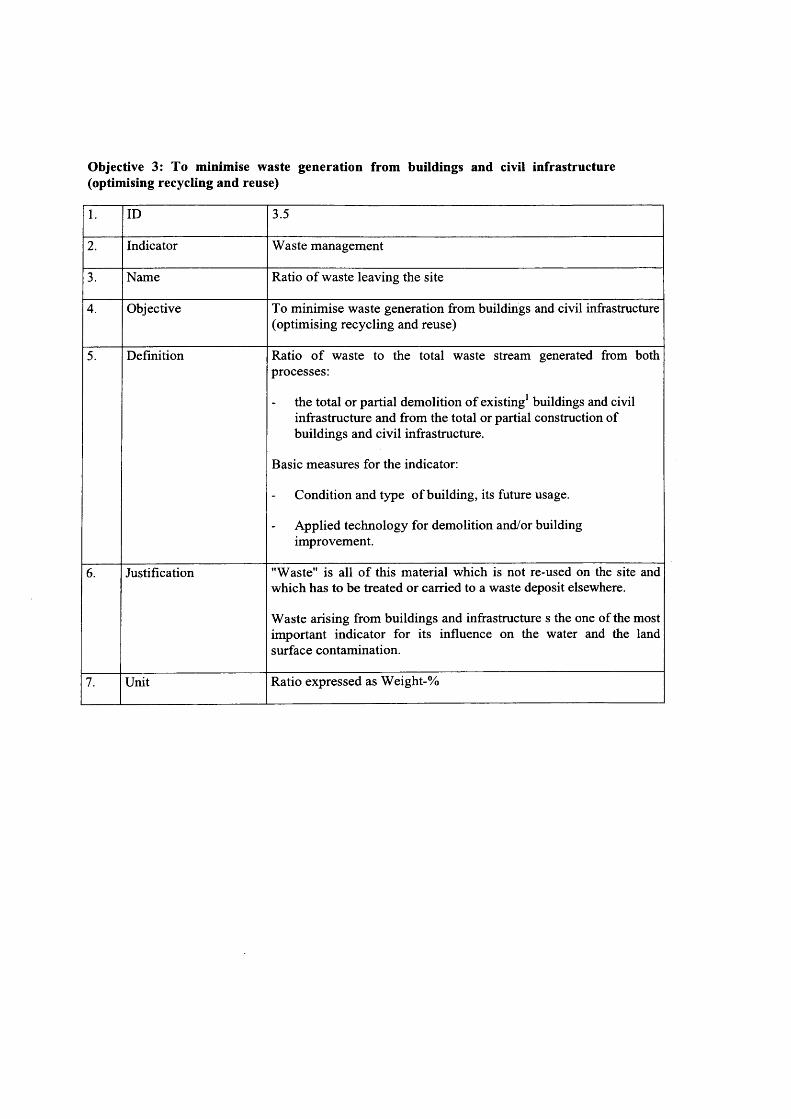
Objective 3: To minimise waste generation from buildings and civil infrastructure (optimising recycling and reuse)
1. ID 3.5
2. Indicator Waste management
3. Name Ratio o f waste leaving the site
4. Objective To minimise waste generation from buildings and civil infrastructure (optimising recycling and reuse)
5. Definition Ratio o f waste to the total waste stream generated from both processes:
the total or partial demolition o f existing1 buildings and civil infrastructure and from the total or partial construction of buildings and civil infrastructure.
Basic measures for the indicator:
Condition and type o f building, its future usage.
Applied technology for demolition and/or building improvement.
6. Justification "Waste" is all o f this material which is not re-used on the site and which has to be treated or carried to a waste deposit elsewhere.
Waste arising from buildings and infrastructure s the one of the most important indicator for its influence on the water and the land surface contamination.
7. Unit Ratio expressed as Weight-%

1. ID 3.6
2. Indicator Waste management
3. Name Ratio o f waste recycling and reuse
4. Objective To minimise mineral resources use mineral resources use
5. Definition / To describe the relative impact o f the project on reserves of nonrenewable natural mineral resources
Basic measures for the indicator is type technique applied for site an building remodelling
6. Justification Waste generated on site or by other site development might be acceptable as substitute o f construction materials or other application while complying by standards. It results in saving of global resources. It might be recognised as redundant to next indicator (conservation o f natural resources) but refers to wider context because also count the reuse o f waste outside of the site.
7. Unit Weight-%
Objective 4: To reduce natural mineral resource consumption
1. ID 3.7
2. Indicator Volume o f previously unused natural minerals consumed by the project expressed as a proportion o f total volumetric project mineral resource demand.
3. Name Conservation o f natural mineral resources
4. Objective To describe the relative impact o f the project on reserves of nonrenewable natural mineral resources.
5. Definition The indicator links mineral resource use with mineral resource consumption
6. Justification This indicator will allow the evaluation of the sustainability of mineral resource use from a local, regional, national and European perspective
7. Unit of measurement ratio

Objective 5: To convert deteriorated surfaces to natural soil
1. ID 3.8
2. Indicator Surface management
3. Name Regeneration o f natural surface
4. Objective To improve deteriorated surfaces by breaking up sealed surfaces and restore a natural soil and vegetation as far as possible.
5. Definition Surface improved to total surface o f the site
Basic measures for the indicator:
Type and area size o f surface covers on the site
Quality and area size o f (natural) soil below (if known)
Possibilities and area size o f surfaces to be improved
6. Justification To restore natural soil and space is a rising political issue in many countries. It is strongly encouraged to substitute sealed surfaces by permeable ones and to allow natural vegetation within used areas as much as possible.
7. Unit Ratio - Area-%
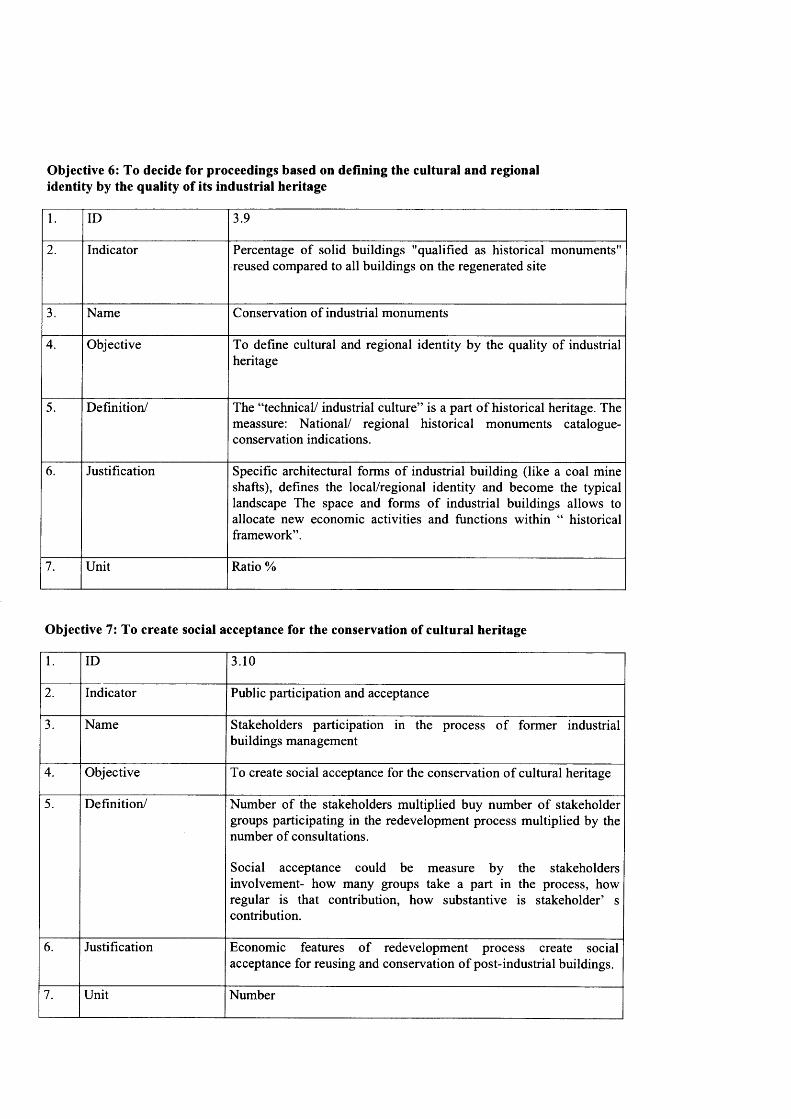
Objective 6: To decide for proceedings based on defining the cultural and regional identity by the quality of its industrial heritage
1. ID 3.9
2. Indicator Percentage of solid buildings "qualified as historical monuments" reused compared to all buildings on the regenerated site
3. Name Conservation of industrial monuments
4. Objective To define cultural and regional identity by the quality of industrial heritage
5. Definition/ The “technical/ industrial culture” is a part o f historical heritage. The meassure: National/ regional historical monuments catalogue- conservation indications.
6. Justification Specific architectural forms o f industrial building (like a coal mine shafts), defines the local/regional identity and become the typical landscape The space and forms o f industrial buildings allows to allocate new economic activities and functions within “ historical framework”.
7. Unit Ratio %
Objective 7: To create social acceptance for the conservation of cultural heritage
1. ID 3.10
2. Indicator Public participation and acceptance
3. Name Stakeholders participation in the process o f former industrial buildings management
4. Objective To create social acceptance for the conservation of cultural heritage
5. Definition/ Number of the stakeholders multiplied buy number o f stakeholder groups participating in the redevelopment process multiplied by the number o f consultations.
Social acceptance could be measure by the stakeholders involvement- how many groups take a part in the process, how regular is that contribution, how substantive is stakeholder’ s contribution.
6. Justification Economic features o f redevelopment process create social acceptance for reusing and conservation o f post-industrial buildings.
7. Unit Number

Objective 8: To improve the image of the site and its neighbourhood
1. ID 3.11
2. Indicator Improvement o f site attractiveness
3. Name Image change o f the site and neighbourhood
4. Objective To improve the image o f the site and its neighbourhood in order to attract investors, tourists, skilled employees etc.
5. Definition There are number of aspects o f image o f site witch are important for attraction o f site developers - environmental, social and economical.
6. Justification Improvement o f site image in environmental, social and economical dimensions contributes to regional development
7. Unit % of positive statements (taken from WP 5 data opinion polls, newspaper articles, public participation)
Objective 9: To make economically viable the reuse or dismantling of buildings and infrastructure respecting regional public demands
1. ID 3.12
2. Indicator Social effectiveness o f development
3. Name Cost o f reuse or dismantling
4. Objective To make economically viably the reuse or dismantling o f buildings and infrastructure
5. Definition Cost - benefit ratio determines rate o f return o f investment to
authorities; investors; promoters/developers and gives the base for making decision.
6. Justification Social benefits might overcome reluctance to invest while only financial aspects are considered.
7. Unit Ratio, Cost( in EURO) /Benefit( in EURO)

Objective 10: To find better ways to comply with health and safety regulation for reused buildings and infrastructure
1. ID 3.13
2. Indicator Effectiveness o f health and safety regulation complying
3. Name Comply with health and safety regulation for reused buildings and infrastructure
4. Objective To find better ways to comply with health and safety regulation for reused buildings and infrastructure
5. Definition Cost - benefit ratio o f different option determines acceptance for decision.
6. Justification Complying with health and safety regulation is prerequisite for site development. Effectiveness o f such process is crucial point for decision making.
7. Unit Ratio, Cost( in EURO) /Benefit( in EURO)

SUSTAINABLE LAND USE AND URBAN DESIGN ON BROWNFIELD
SITES
Objective 1: To promote land use functions that match regional socio-economic demands and needs
1. ID 4.1
2. Indicator Has the intended land use been integrated into the objectives of the regional development strategy?
3. Name Integration of the intended land use into the objectives of the regional development strategy
4. Objective To promote land use functions that match regional socio-economic demands and needs
5. Definition The indicator intends to show if the planned land use fits into the regional development
6. Justification The strategy can guarantee a concerted resource saving regional development and avoid not used or under used land uses.
A standard for regional development strategies will be included in the best-practice guide as a checklist.
7. Unit Yes / No-indicator
1. ID 4.2
2. Indicator Has an analysis of the demand (e.g. market analysis, feasibility study, etc.) been carried out to justify a sufficient socio-economic / commercial demand and have the results been taken into account in drawing up the land use concept?
3. Name The fact if an analysis of the demand has carried out
4. Objective To promote land use functions that match regional socio-economic demands and needs
5. Definition The indicator intends to show if the future land use meets the demands and needs
6. Justification A not used or under used development can be avoided if there is sufficient demand for the intended land use. Analysing the demand is an important precondition for a good management of the project.
7. Unit Yes / No-indicator

Objective 2: To integrate the reuse of brownfield sites into a regional land management
1. ID 4.3
2. Indicator Percentage of the development sites taken from the regional land management pool of the entirety of development sites in the region.
3. Name Portion of the development sites in the regional land management pool, compared to the entirety of development sites in the region
4. Objective To integrate the reuse of brownfield sites into a regional land management
5. Definition The indicator intends to show how many development sites in the region are part of a regional land management pool
6. Justification In order to realize a coherent, balanced and resource saving regional development, the regional land management pool should content as many sites in the region as possible.
A standard for regional land management will be included in the best-practice guide as a checklist.
7. Unit %
Objective 3: To integrate the reuse of brownfield sites into the urban development
1. ID 4.4
2. Indicator Does the site development accord to the integrated urban development strategy?
3. Name Accordance of the site development to the integrated urban development strategy
4. Objective To integrate the reuse of brownfield sites into the urban development
5. Definition The indicator intends to show if the future land use accords to the integrated development strategy on the local level.
6. Justification The intended land use should not only fit into the regional but particularly into the urban development in order to reach balanced and stable urban structures
7. Unit Yes / No-indicator

Objective 4: To make projects tolerable for the local neighbourhood
1. ID 4.5
2. Indicator Number of initiatives for or against the project;
Number of critical suggestions within the formal planning process
3. Name Acceptance of the project: Initiatives for or against the project / Critical suggestions within the formal planning process
4. Objective To make projects tolerable for the local neighbourhood
5. Definition The indicator intends to show the acceptance of the project on the neighbourhood level
6. Justification The intended land use must fit into the spatial, social, economic and ecological conditions of the neighbourhood in order to develop a good coexistence. Therefore the acceptance of the population should be as high as possible.
7. Unit Absolute number
Objective 5: To generate and safeguard employment and economic development
1. ID 4.6
2. Indicator Total number of long-term jobs created on the site
Total number of long-term jobs per ha
3. Name Number of created long-term jobs resp. job intensity on the site
4. Objective To generate and safeguard employment and economic development
5. Definition The indicator intends to show the amount of created long-term jobs on the site by establishing new companies
6. Justification As the closedown of the industry on the brownfield site was mostly connected with an immense job loss for the region, the future land use should create as many new and long-term jobs as possible.
7. Unit Absolute number and absolute number per ha

1. ID 4.7
2. Indicator Ratio of jobs that require training of the entirety of all created jobs resp. ratio of unqualified jobs of the entirety of all created jobs
3. Name Job structure on the site
4. Objective To generate and safeguard employment and economic development
5. Definition The indicator intends to show the amount of created jobs on the site for which an training is necessary
6. Justification The intended land use should create as many as qualified jobs as possible. Jobs that require training are regarded as potentially longer-term and thus more sustainable than unqualified and unskilled jobs.
7. Unit %
1. ID 4.8
2. Indicator Economic multiplier effects of the site development on regional scale
3. Name Economic multiplier effects of the site development on regional scale relating to the intended land use function (multiplier effects in the region)
4. Objective To generate and safeguard employment and economic development
5. Definition The indicator intends to show the positive economic effect of the site-development on a regional scale.
6. Justification Not only the users of the site itself but also the region should economically benefit from the site development, e.g. by follow-up investments
7. Unit €

1. ID 4.9
2. Indicator Does the site development accords to the regional economic strategy?
3. Name Accordance of the site development to the regional economic strategy
4. Objective To generate and safeguard employment and economic development
5. Definition The indicator intends to show if the land use will fit into the regional economical development
6. Justification The intended land use should meet the objectives of the regional economic strategy in order to realize a balanced regional development, orientated on the economical and social needs. A standard for regional economic strategies (can be part of a regional development strategy) will be included in the best-practice guide as a checklist.
7. Unit Yes / No-Indicator
Objective 6: To promote land use functions that suit the natural and man-made environment of the site
1. ID 4.10
2. Indicator Has an integrated potential- and restriction-analysis (like a site diagnosis dealing with natural and landscape features, e.g. topography, protected species, vegetation according to type, quantity and quality, (ground-) water, contamination and soil conditions) of the site been carried out?
3. Name The fact if an integrated potential- and restriction-analysis of the site has been carried out.
4. Objective To promote land use functions that suit the natural and man-made environment of the site
5. Definition The indicator intends to show if the land use will consider the local natural and man-made conditions on the site and the surroundings
6. Justification The intended land use should consider the existing conditions of the site and the surroundings in order to avoid a development in the opposite direction
7. Unit Yes / No-Indicator

1. ID 4.11
2. Indicator Have the results of the integrated potential- and restriction-analysis been taken into account in drawing up the planned use?
3. Name The fact if the results of the integrated potential- and restriction- analysis were taken into account in drawing up the planned use.
4. Objective To promote land use functions that suit the natural and man-made environment of the site
5. Definition The indicator intends to show if the land use will consider the local natural and man-made conditions on the site and the surroundings
6. Justification The intended land use should consider the existing conditions of the site and the surroundings in order to avoid a development in the opposite direction
7. Unit Yes / No-Indicator
Objective 7: To save resources
1. ID 4.12
2. Indicator Ratio surface sealing
3. Name Ratio of the surface being sealed compared to the whole site
4. Objective To save resources
5. Definition The indicator intends to show how much of the site surface will be sealed for the planned land use
6. Justification The planned land use and urban concept should follow the sustainability objective of saving space and protecting the climate. It is necessary to develop a balanced concept in order to achieve the optimal results for both environment media.
7. Unit %
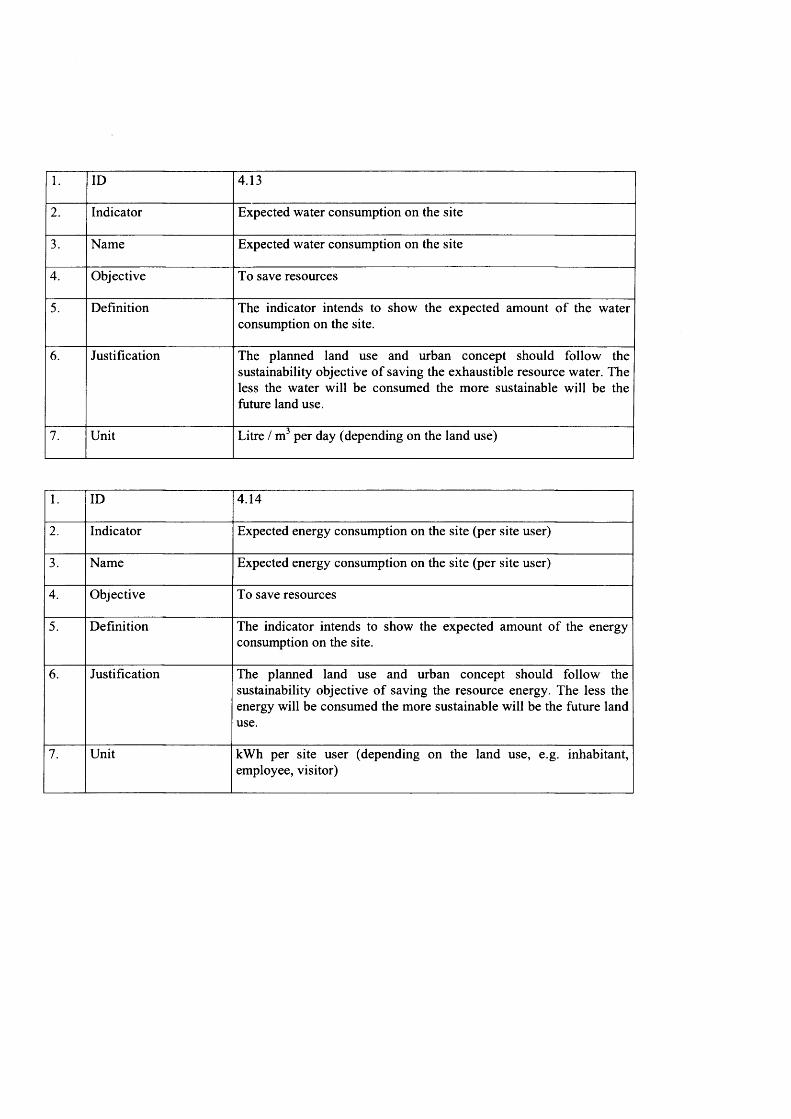
1. ID 4.13
2. Indicator Expected water consumption on the site
3. Name Expected water consumption on the site
4. Objective To save resources
5. Definition The indicator intends to show the expected amount of the water consumption on the site.
6. Justification The planned land use and urban concept should follow the sustainability objective of saving the exhaustible resource water. The less the water will be consumed the more sustainable will be the future land use.
7. Unit Litre / m3 per day (depending on the land use)
1. ID 4.14
2. Indicator Expected energy consumption on the site (per site user)
3. Name Expected energy consumption on the site (per site user)
4. Objective To save resources
5. Definition The indicator intends to show the expected amount of the energy consumption on the site.
6. Justification The planned land use and urban concept should follow the sustainability objective of saving the resource energy. The less the energy will be consumed the more sustainable will be the future land use.
7. Unit kWh per site user (depending on the land use, e.g. inhabitant, employee, visitor)

1. ID 4.15
2. Indicator Expected ratio of renewable energy sources to the total energy consumption on the site
3. Name Expected ratio of renewable energy sources to the total energy consumption on the site
4. Objective To save resources
5. Definition The indicator intends to show the expected ratio of those energy resources that are renewable, compared to the total energy consumption on the site.
6. Justification The planned land use and urban concept should follow the sustainability objective of saving the resource energy. The higher the ratio of the consumption of renewable energy resources will be, in comparison to the total energy consumption, the more sustainable will be the future land use.
7. Unit % of renewable energy resources in kWh to total energy consumption on kWh
1. ID 4.16
2. Indicator Expected ratio of recycled waste to total waste generation on the site
3. Name Expected ratio of recycled waste to total waste generation on the site
4. Objective To save resources
5. Definition The indicator intends to show the expected part of the waste that can be recycled, compared to the total waste generation on the site.
6. Justification The planned land use and urban concept should follow the sustainability objective of avoiding waste and of saving material flows. The higher the ratio of the recycled waste will be, in comparison to the total waste generation, the more sustainable will be the future land use.
7. Unit % of the recycled waste in t to the total waste generation in t

Objective 8: To connect different city districts
1. ID 4.17
2. Indicator Have connections across the brownfield site, according to the demand, been created in the urban design concept?
3. Name The fact if the urban design concept has included connections across the brownfield site, according to the demand.
4. Objective To connect different city districts
5. Definition The indicator intends to show if the urban design concept has included connections across the brownfield site.
6. Justification This indicator assumes that connections (like foot- or bicycle paths, streets, etc.) can improve the relation between formerly separated city districts
7. Unit Yes / No-Indicator
Objective 9: To provide access for all means of transport
1. ID 4.18
2. Indicator Ratio of users of the site who will be connected to public transport within the catchment area of a public transport stop that is standard practice in the analysed region
3. Name Ratio of site users within the in the analysed region typically used catchment area of a public transport stop
4. Objective To provide access for all means of transport
5. Definition The indicator intends to show the amount of site users connected to the public transport. Users of the site that should be defined site specifically, can be e.g. inhabitants living, employees working, customers shopping or visitors amusing themselves on the site.
6. Justification The more users will be connected to the public transport the more the site is accessible for many population groups by an environment- friendly means of transport and the more sustainable will be the planned land use.
7. Unit %

1. ID 4.19
2. Indicator Has an integrated traffic concept for the site development been adopted?
3. Name The fact if an integrated traffic concept for the site development has been adopted.
4. Objective To provide access for all means of transport
5. Definition The indicator intends to show if there has been an integrated traffic concept for the site development has been carried out and if its results were included into the urban design concept. This integrated traffic concept should make the site accessible for all means of transport in a well-balanced manner.
6. Justification The accessibility of the site should be made possible for all population groups in an adequate measure. In this regard, the integrated traffic concept is a possibility to co-ordinate all demands of the different means of transport in a sustainable manner.
7. Unit Yes / No-Indicator
Objective 10: To achieve high design quality
1. ID 4.20
2. Indicator Has an open competition procedure taken place to develop the urban design concept, calling in different expert opinions?
3. Name The fact if an open competition procedure has taken place to develop the urban design concept.
4. Objective To achieve high design quality
5. Definition The indicator intends to show if there has been taken place an open competition procedure to develop the urban design concept in order to call in as many different expert opinions as possible. The competition should take place in an early project phase. Experts can be architects, planners, designers, technical engineers, social, economic and environmental consultants, etc.
6. Justification An open competition to elaborate the urban design concept by as many different experts as possible can enhance and improve the quality and the longevity of the concept and its content.
7. Unit Yes / No-Indicator

1. ID 4.21
2. Indicator Has this urban design concept, elaborated by an open competition procedure, been adopted for the site development?
3. Name The fact if the urban design concept, elaborated by an open competition procedure, has been adopted for the site development.
4. Objective To achieve high design quality
5. Definition The indicator intends to show if the results of the open competition (see above) are effectively considered in the planned urban design concept.
6. Justification An open competition to elaborate the urban design concept by as many different experts as possible can enhance and improve the quality and the longevity of the concept and its content.
7. Unit Yes / No-Indicator
Objective 11: To create and maintain flexibility, flexible construction forms / design
1. ID 4.22
2. Indicator Does the urban design concept allow secondary or even third uses of buildings and building plots?
3. Name The fact if the urban design concept allows secondary or even third uses of buildings and building plots.
4. Objective To create and maintain flexibility, flexible construction forms / design
5. Definition The indicator intends to show if urban design concept makes possible not only the directly planned use of buildings and plots but also second or more subsequent uses that are not known yet. This can be realized by using e.g. flexible forms of design and construction for buildings.
6. Justification The possibility to use buildings or plots several times is more sustainable as high planning and rebuilding expenses can be avoided resp. exhaustible natural resources can be saved.
7. Unit Yes / No-Indicator

1. ID 4.23
2. Indicator Is a step by step-realization of the project possible?
3. Name The fact if a step by step-realization of the project is possible.
4. Objective To create and maintain flexibility, flexible construction forms / design
5. Definition The indicator intends to show if the realization of the land use and urban design concept can be made in several phases, according to the demand.
6. Justification If the concept can be realized in a step-by-step procedure, according to the demand, investment ruins can be avoided and the economic efficiency of the whole project can be improved.
7. Unit Yes / No-Indicator

SUSTAINABLE PLANNING PROCESSES AND METHODS FOR CITIZEN
PARTICIPATION
1. ID 5.1
2. Indicator Equal access to information
3. Name Equal access to information
4. Objective 1. To obtain a better quality of the information
2. To obtain a better quality of the information flow
3. To have a more efficient use of information
7. To empower citizens, especially
those representing non-organised
interests
5. Definition / Justification
An equal access to information is a key-condition for empowering citizens and improving democratic practices. All Citizens should have access to relevant, available and understandable information to become actors in every step of the process management.
6. Unit - time necessary for obtaining information (real time ?)
- regularity and continuity of information given to citizens (number of newsletters per year)
7. Data Base / Source - available documents used for public meetings: diagnosis, progress reports, communication tools: newsletter etc.
- National/Regional/local press
- existence of a website

1. ID 5.2
2. Indicator Symmetry of information flow
3. Name Symmetry of information flow
4. Objective 1. To obtain a better quality of the information
2. To obtain a better quality of the information flow
3. To have a more efficient use of information
7. To empower citizens, especially those representing non-organised interests
5. Definition / Justification
The symmetry of the information flow among all involved stakeholders is necessary to the global legitimacy of the process : a choice is socially acceptable if it is explained, well-argued, and understood, and if stakeholders who will be impacted on have the power to question and improve it. Stakeholders should be on equal terms.
6. Unit - time necessary for obtaining information (real time ?)
- free access to sources of information
- regularity and continuity of information given to citizens (number of newsletters per year . . . )
interactivitystakeholders/decision-makers
- access to intemet/e-mail : forums
7. Data Base / Source - available documents used for public meetings diagnosis, progress reports, communication tools newsletter etc.
- National/Regional/local press
- existence of a website

1. ID 5.3
2. Indicator Good preparation and organization of the whole process
3. Name Good preparation and organization of the whole process
4. Objective 5. To increase the legitimacy of the decision-making process
6. To improve the efficiency of the process in terms of duration and costs
5. Definition / Justification
The process has to be well-managed from the beginning to the end : indeed, the person(s) in charge of the management should set clear rules and respect them, especially in the case of public meetings : respect of schedules, clear and understandable diagnosis, regulation of positions and opinions. All these conditions are necessary to avoid frustrations and stimulate a collective acceptance of mediation and search for solutions.
6. Unit - time schedule (respect of the general schedule and deadlines)
- feasibility (formulation of achievable targets : duration, milestones)
- regularity and continuity (communication o f advantages for the different stakeholders)
7. Data Base / Source - Analysis of documentation used for public debates (diagnosis, progress reports etc)
- Authorities’information and communication Program

1. ID 5.4
2. Indicator Number and profile of persons accountable for process and results
3. Name Number and profile of persons accountable for process and results
4. Objective 6. To improve the efficiency of the process in terms of duration and costs
8. To delegate responsibility to lower decision level and to stimulate a sense of ownership
5. Definition / Justification
6. Unit - number of persons involved actively on lowest level and in the different steps of process management (planning, decisionmaking, executing, controlling, monitoring and evaluating)
7. Data Base / Source - mailing list (for invitation): wide or limited
- attendance sheets (public meetings)

1. ID 5.5
2. Indicator Transparency about the selection and circulation of information and about process management
3. Name Transparency about the selection and circulation of information and about process management
4. Objective 1. To obtain a better quality of the information
2. To obtain a better quality of the information flow
3. To have a more efficient use of information
5. To increase the legitimacy of the decision-making process
7. To empower citizens, especially those representing non-organised interests
5. Definition / Justification
Transparency about information and the process management is a key-condition for the global legitimacy of the process. The person(s) in charge of managing the process should inform stakeholders about the different sources of information (subjective/objective/contradictory expertise) used for decisionmaking ; they should present the rules o f process management clearly (schedules, costs etc) and discuss them with stakeholders. Stakeholders should be informed regularly and continuously and have the possibility to react and express themselves.
6. Unit - time necessary for obtaininginformation (real time ?)
alternativeexpertise
7. Data Base / Source
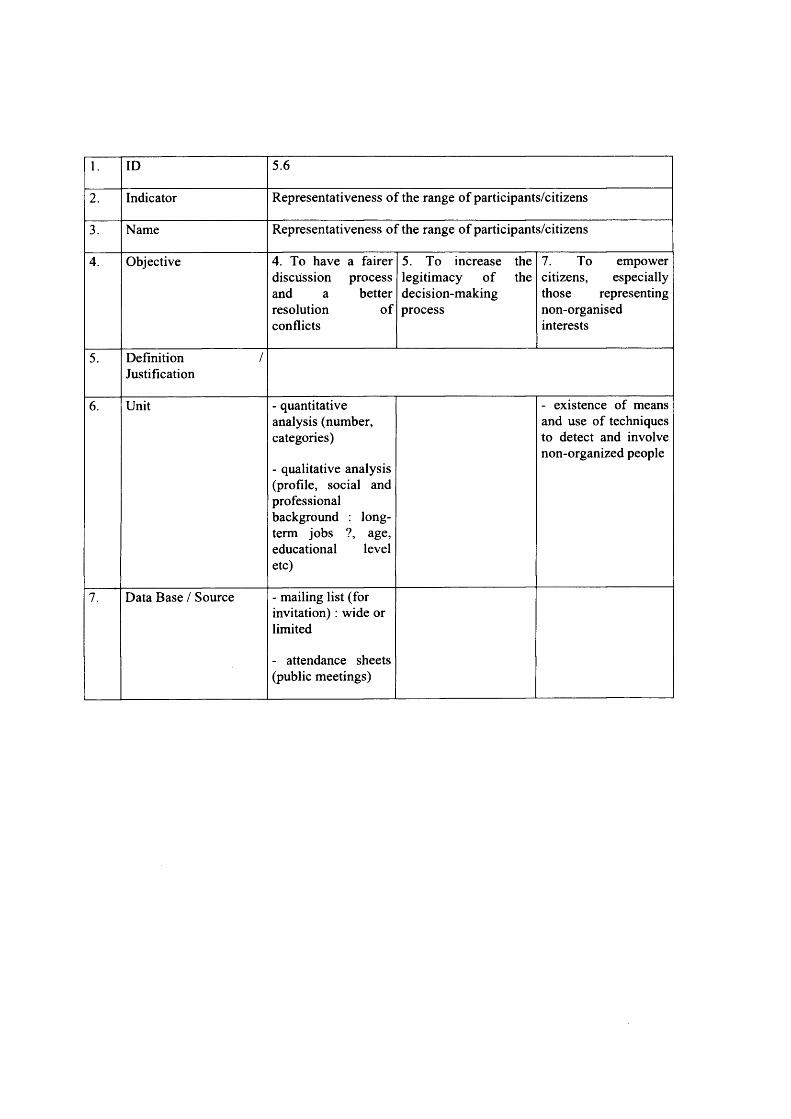
1. ID 5.6
2. Indicator Representativeness of the range of participants/citizens
3. Name Representativeness of the range of participants/citizens
4. Objective 4. To have a fairer discussion process and a better resolution of conflicts
5. To increase the legitimacy of the decision-making process
7. To empower citizens, especially those representing non-organised interests
5. Definition / Justification
6. Unit - quantitative analysis (number, categories)
- qualitative analysis (profile, social and professional background : longterm jobs ?, age, educational level etc)
- existence of means and use of techniques to detect and involve non-organized people
7. Data Base / Source - mailing list (for invitation): wide or limited
- attendance sheets (public meetings)

1. ID 5.7
2. Indicator Publicity and documentation of debates and (intermediate) results
3. Name Publicity and documentation of debates and (intermediate) results
4. Objective 4. To have a fairer discussion process and a better resolution of conflicts
5. To increase the legitimacy of the decision-making process
6. To improve the
efficiency of the
process in terms of
duration and costs
5. Definition / Justification
Citizens should have an equal and symmetric access to information since the beginning of the process to the end. They will find the process legitimate if they have a regular, continuous and interactive information on the intermediate and final results of the process. This indicator which is strongly linked to the transparency of the process management is a key-condition for a progressive and collective acceptance of solutions.
6. Unit - time necessary for obtaining information (real time ?)
7. Data Base / Source available documents used for public meetings diagnosis, progress reports (downloaded on internet ?), communication tools : newsletter etc.
National/Regional/lo cal press

1. ID 5.8
2. Indicator Satisfaction / contestation of results
3. Name Satisfaction / contestation of results
4. Objective 5. To increase the legitimacy of the decision-making process
6. To improve the efficiency of the process in terms of duration and costs.
8. To delegate responsibility to lower decision level and to stimulate a sense of ownership
5. Definition / Justification
explanation of indicator and expected results, sustainability context of the indicator
6. Unit - number of cases brought to court (complaints)
- continuity of the process after an election period ;
- use of techniques to measure the degree of involvement and satisfaction of stakeholders (polls, enquiries etc.)
- use of techniques to measure and satisfaction of stakeholders (polls, enquiries etc.) with results and process
7. Data Base / SourceNational/Regional/lo cal press articles
- Analysis of polls results (if used)

1. ID 5.9
2. Indicator Resources (time and money) allocated by authorities
3. Name Resources (time and money) allocated by authorities
4. Objective 1. To obtain a better quality of information
4. To have a fairer discussion process and a betterresolution of conflicts
7. To empower citizens,especially those representing non-organised interests
8. To delegate responsibility to lower decision level and to stimulate a sense of ownership
5. Definition / Justification
Participation needs time and money to be effective. Empowering citizens means gathering a certain number of conditions information, education, communication, mediation etc., which need to pervade each step of the process.
6. Unit alternativeexpertise(sometimescontradictory)
time and resources necessary to found initiatives, pressure groups, NGOs//altemativ e expertise, animation of debates, mediation, communication
- existence of means to detect and involve nonorganized people
resources allocated by authorities to lowest level
7. Data Base / Source Authorities’bucIget
1. ID 5.10
2. Indicator Early Involvement of stakeholders and power of influence in the different steps of the process management
3. Name Early Involvement of stakeholders and power of influence in the different steps of the process management
4. Objective 4. To have a fairer discussion process and a better resolution of conflicts
5. Definition / Justification
The legitimacy of the whole process cannot stem from the final step of a process but should pervade each step of it. Involving citizens since the beginning of the process and at every step of it is necessary to create a collective sense of ownership and responsibility and reinforce active democratic practices.
6. Unit - before the process is launched, nature of the mailing lists, elaboration of an information and communication program ; time schedules (milestones, duration)
- during the process, regularity of information (number of press articles)
7. Data Base / Source National/Regional/Local press
1. ID 5.11
2. Indicator Collective willingness to participate and to search for solutions
3. Name Collective willingness to participate and to search for solutions
4. Objective 4. To have a fairer discussion process and a better resolution of conflicts
5. Definition / Justification
Citizens should accept to respect a certain number of common rules concerning process management. Indeed, general interest should be respected, which can be represented by a neutral mediator who regulates positions and opinions. This mediator helps also to have the schedule respected, which avoids frustrations and conflicts and prolongation of duration (and costs).
6. Unit consensus on the existence of a problem
collective acceptance of common mediator and use of neutral mediator (trust)
documentation : a clear and understandable diagnosis (avoiding technical terms)//
7. Data Base / Source Analysis of documentation used for public debates (diagnosis, progress reports etc)
1. ID 5.12
2. Indicator Transparency and perception of costs of process for all stakeholders
3. Name Transparency and perception of costs of process for all stakeholders
4. Objective 6. To improve the efficiency of the process in terms of duration and costs
5. Definition / Justification
explanation of indicator and expected results, sustainability context of the indicator
6. Unit used unit to measure the indicator
7. Data Base / Source source of information, rules for exploration, time frame, considered area and groups
1. ID 5.13
2. Indicator Education level with regard to process management
3. Name Education level with regard to process management
4. Objective 7. To empower citizens, especially those representing non-organised interests
5. Definition / Justification
explanation o f indicator and expected results, sustainability context of the indicator
6. Unit used unit to measure the indicator
7. Data Base / Source source o f information, rules for exploration, time frame, considered area and groups
1. ID 5.14
2. Indicator Lowest level, where control over budgets and process (binding decisions) exists
3. Name Lowest level, where control over budgets and process (binding decisions) exists
4. Objective 8. To delegate responsibility to lower decision level and to stimulate a sense of ownership
5. Definition / Justification
explanation o f indicator and expected results, sustainability context of the indicator
6. Unit used unit to measure the indicator
7. Data Base / Source source o f information, rules for exploration, time frame, considered area and groups

TOOLS FOR MANAGEMENT OF BRO WNFI ELDS PROJECTS
Objective 1: To adopt an interdisciplinary approach
1. ID 6.1
2. Indicator Does a Quality Assurance and Quality Control Procedures Plan exist?
3. Name Existence o f a Quality Assurance and Quality Control Procedures Plan
4. Objective To check and evaluate the existence and quality o f a team approach and planning
5. Definition The quality assurance is an integrated system o f management activities involving planning, assessment, reporting, etc.
6. Justification Such document is a key document for an optimal management and quality control o f the project
7. Unit o f measurement Yes / No, check list
Objective 2: To facilitate efficient project delivery and to develop a management plan for the whole site, and start to monitor, control and revise the schedule and the budget on a regular basis
1. ID 6.2
2. Indicator Does a Project Management Plan exist?
3. Name Existence o f a Project Management Plan updated on a regularly basis
4. Objective To evaluate and check the existence o f a Project Management Plan
5. Definition The elements o f a management plan will document the design o f all the operations and that results meet specified objectives
6. Justification The existence o f a project management plan well structured is a good tool to reach the above mentioned objective.
7. Unit o f measurement Yes / No, check list

1. ID 6.3
2. Indicator Market price before development/ market price after development
3. Name Economic viability
4. Objective To evaluate the efficiency of the economical approach taken for the project
5. Definition Appraisal of the financial processes
6. Justification The potential for long-term private sector investment is directly related to this indicator
7. Unit of measurement %
Objective 3: To promote and manage stakeholders participation
1. ID 6.4
2. Indicator Does a Community Information and Participation Plan exist?
3. Name Existence of a Community Information and Participation Plan
4. Objective To evaluate and check the existence of a Community Information and Participation Plan
5. Definition Appropriate information is communicated to the appropriate people at the right time
6. Justification Social acceptance and smooth development of the project
7. Unit of measurement Yes / No, checklist

1. ID 6.5
2. Indicator Number and content of public progress reports made during the project
3. Name Public information progress reports
4. Objective To check the continuity and efficiency of the public information
5. Definition Public progress reports are the presentations of the status of the public communication and information at a given time of the project
6. Justification Social acceptance is directly related to the quality and frequency of the public information
7. Unit of measurement Number of reports and checklist
Objective 4: To provide a frame-work for transparency in decisions, flow of information and improved communication structures
1. ID 6.6
2. Indicator Existence of documents
3. Name Record of decisions
4. Objective To check the availability and quality of documents recording the flow of decisions
5. Definition Documentary evidence of the decisions and the reasons behind those decisions for the reuse options, the need for risk management action and the satisfactory performance of that action.
6. Justification Much redevelopment effort leaves no visible result - eg remediation or demolition. Stakeholders require written evidence that they can assess and evaluate before deciding whether or not to occupy land, give necessary permissions etc.
7. Unit of measurement Yes / No

1. ID 6.7
2. Indicator Existence of a communication strategy and related documents
3. Name Communication structure
4. Objective To check the existence of an effective communication strategy with a balance between the frequency and the appropriate level of communication.
5. Definition The strategy will document about communication procedures, frequency, controls, etc. Evidence of this strategy should be shown.
6. Justification Many projects suffer from poor communication and being poorly received by their neighbourhoods.
7. Unit of measurement Yes / No, check list
Objective 5: To develop tools for the protection of human health and for safety during field work
1. ID 6.8
2. Indicator Existence of an Health and Safety Plan and records
3. Name Existence of a Health and Safety Plan and number of accidents and incidents
4. Objective To evaluate the existence of a Health and Safety Plan and the safety record of the site
5. Definition The health and safety plan will consider the workers and public as these issues might affect the project completion and the necessity to protect the public.
6. Justification The existence of an health and safety plan is a prerequisite but the number of accidents will allow to check the application of the rules and guidelines of the plan.
7. Unit of measurement Yes / No, number of accidents/nr. working days

Objective 6: To adopt an integrated approach
1. ID 6.9
2. Indicator Does a “Cost Benefit Analysis” exist?
3. Name Costs Benefits analysis
4. Objective To assess the existence and quality o f a “Cost Benefit Analysis”
5. Definition A “Cost Benefit Analysis” indicator allow a metric evaluation of a complex decision (incl. Market research studies)
6. Justification Decisions concerning environment always involve costs and benefits some with monetary values and some without. Ideally decisions are made where the benefits outweight the costs.
7. Unit o f measurement Yes/no and Check list

Appendix B
Case Studies Tables
Sites in France
LOISINORD
1. Location Nord Pais de Calais
2. Site: size / previous use / urban context
Size: 200ha
Location outside the city on the board of 4 municipalities
Previous use:
• Coal extraction and coke plant
3. Contamination and Debris • Presence of contamination
4. Buildings and Infrastructure No Buildings
5. Concept / Future use • Development of new leisure facilities
6. Realization 1998-2004
LES TERTIALES - FORGEVAL
1. Location Nord Pais du Calais
2. Site: size / previous use / urban context
Size: 25ha
Location in the inner city
Previous use:
• Industrial
3. Contamination and Debris No presence
4. Buildings and Infrastructure No building retain
5. Concept / Future use Mixed redevelopment including universities, commercial and housing
6. Realization 1997-2002
Sites in Germany
RADBOD
1. Location Hamm-Bockum-Hovel, in the north-east of the Ruhr Area
2. Site: size / previous use / urban context
Size: 21 ha
Location in the city and surrounding land uses
• Directly south of the urban area of Hamm-Bockum-Hovel
• Green spaces to the west, south and east
Traffic access/connection
• Motorway A1 (to Bremen / Cologne) approx 8km
• Motorway A2 (to Berlin/ Oberhausen) approx 11km
• High speed train stop at the railway station of Hamm
Previous use:
• Coal mine named Radbod 1/2/5, including the cookery Radbod
• Started 1904
• Extraction since 1906
• 1976 closure of the cookery
• 1990 closure of the coal mine
3. Contamination and Debris
• 1992 to 1995 exploration/ investigation phase with an historical inquiry
• 1997 to 1998 development of the sanitation and preparation concept
• 1999 start of preparation and coverage of the project area
Remediation/soil management
• necessity to partly fill up the area
• soil with light concentrations of hydrocarbon and others were safely accumulated in the southern part of the project area
• removal of constructional barriers/ obstacles, also in the underground
• disposal of heavy contaminated materials
4. Buildings and Infrastructure
Buildings
• the old porter house
• the vehicle hall
• shaft towers (2x): listed buildings
• steam engine house: listed building
• shaft Winkhaus (shaft n° 5), this one is still in operation
5. Concept / Future use
• Industry
• The concept bases on a divers and flexible design. Important facts are the integration of historical buildings, existing greens, the divers design of streets, including green and different squares. The concept should be flexible to react on and integrate the ideas and desires of the investors. The so called "module plan" with its special raster offers a very flexible partitioning of the lots. The objective is to create a harmonically urban overall picture.
• Legally binding land use and building plan ("Bebauungsplan") has been elaborated
6. Realization 1995-2002
ESPENHAIN
1. Location Central location in the former lignite basin "Siidraum Leipzig" between the city of Leipzig and Boma
2. Site Former chemical plant, briquette factory and 2 power stations
3. Contamination and Debris
• Organic pollutants, metals
• Waste tip from lignite mining
4. Buildings and Infrastructure
Demolition works since 1990, remaining industrial monument, power station, and administrative buildings
5. Concept / Future use Industrial- and Science park, cultural uses in the former briquette factory
6. Realization Industrial Park 2002 -2004

Sites in Poland
THE DOLOMITES SPORTS VALLEY
1. Location Bytom, Silesia
2. Site Size 38 ha
Dolomite open cast mine
3. Contamination and Debris
• Low concentrations of heavy metals
• No significant constraint for redevelopment
4. Buildings and Infrastructure
Original buildings and infrastructure have been dismantled
5. Concept / Future use
All year leisure and recreation centre including an artificial ski slope, equestrian centre, mountain biking tracks, climbing wall, minigolf
6. Realization Opened in December 2002
SOSNOWIEC COAL MINE
1. Location Sosnowiec, Silesia
2. Site Size 31 ha
Coal mine
3. Contamination and Debris • Spoil bank (high max 8,0 m over the adjacent area)
• Coal mining wastes
4. Buildings and Infrastructure Office building (3-floor administration and social building)
Two workshops and storage facilities
New manufacturing plant
Pit shaft hoist tower
5. Concept / Future use • Industry
• Services
• Housing
6. Realization Beginning in the year 2001
Sites in UK
MARKHAM
1. Location Bolsover, Derbyshire, East Midlands Region of England
2. Site Coal Mine
Tip
3. Contamination and Debris
Dioxins
Metals
4. Buildings and Infrastructure
Most of the structures were demolished in 19900s. This was normal practice at the time
5. Concept / Future use
• Commercial use of the colliery site; the tip will be used to produce biomass (willow trees) to provide heat and energy for the new uses on the colliery site;
• Project design includes job creation, training, education, waste management, renewable energy, risk management, public amenity, wildlife habitat
6. Realization 2002 - 2004
GATESHEAD QUAYS
1. Location Gateshead, Tyne and Wear, North East Region of England
2. Site Harbour
3. Contamination and Debris Oil
Metal
4. Buildings and Infrastructure Major structures retains
5. Concept / Future use Social, cultural and economic regeneration
6. Realization 1999-2005

Appendix C
Data
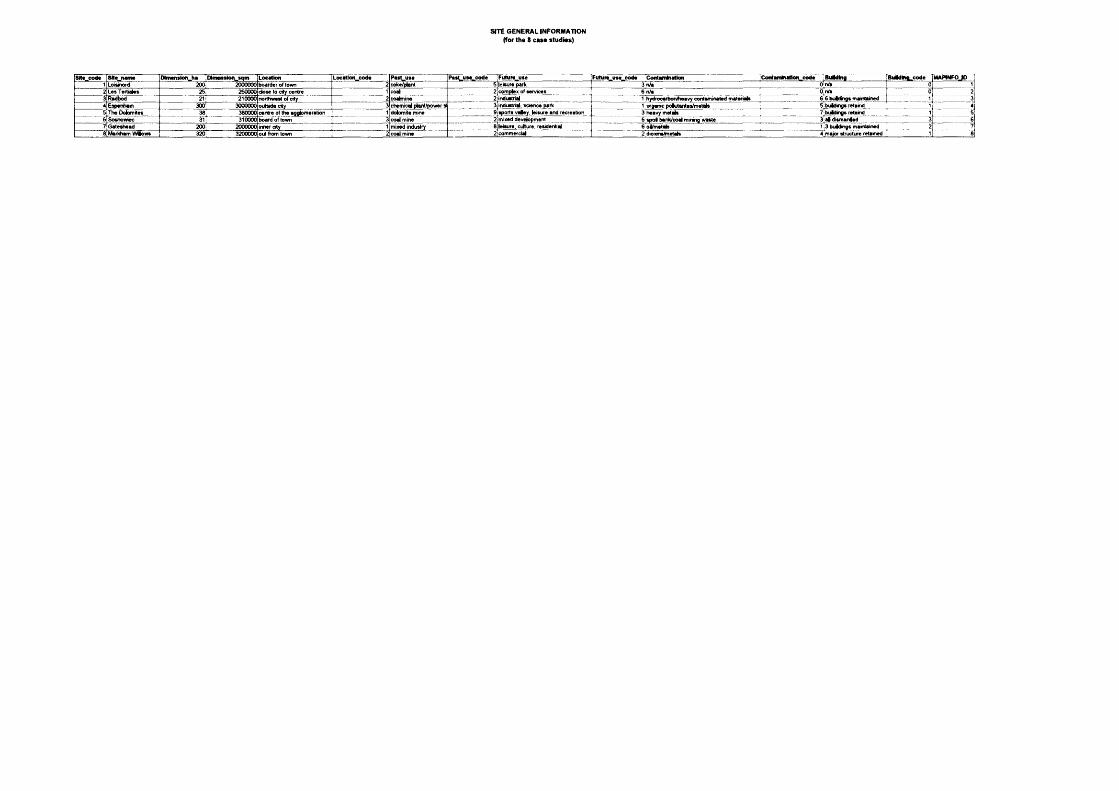
SITE GENERAL INFORMATION (for the S case studies)
SK« cod* She name Dim ension ha ! Dim ension sqm Location Locatton_code P a st_use Past_use__code ■ Future use Future u se code Contamination Contam liudion_code Budding BuM toft_code MAPfNFOJD1 Lotsinord 200 2000000 boarder of town 2 coke/plant 5j|eisure park 3 n/a O n/a Oj 12 Les Tertiales 25 250000 d o se to city centre 1 c o d 2jcomplex of services 6 n/a 0;n/a 0 23 Radbod 21 210000 northwest of city 2 coalmine 2]induetria| 1 hydrocarbonftteavy contaminated materials 6 6 buidings maaitained 1 34 E spenhan 300 3000000 outside city 3 chemical plant/power s 3 industrial, science park 1 organic poAutenta s/m etals 5 b u Jd n g s retamd 1 45 The Dolomites 38 380000 centre of the agglomeration 1 dolomite mine 9isports vaiey. leisure and recreation 3 heavy metals 7: buidings retaind 1 56 Sosnowiec 31 310000 board of town 3 coal mine 2<mixed development 6 spof bank/coal mining waste 3 a |d is m a n |e d 3 67 G ateshead 200 2000000 innef city 1 mixed industry Sjleisure, culture, residential 6 oi/m etab ; 3 buddings maintained 2 7l8 Markham VWows 320 3200000 out from town 2 coal mine 2|commercia| 2 dioans/metals 4 major structure retained 1 8
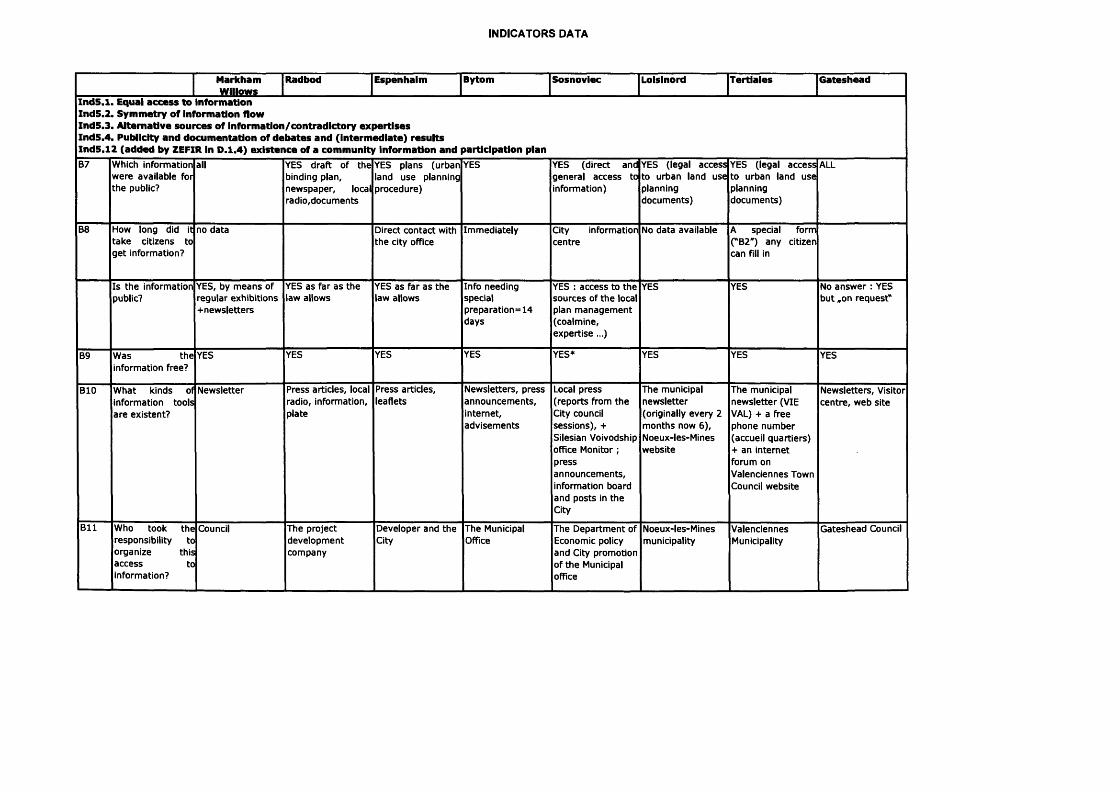
INDICATORS DATA
MarkhamW illow s
Radbod Espenhaim Bytom S osn o v iec Loisinord T ertia les G ateshead
Xnd5.1. Equal a c c e s s to Inform ation In d 5 .2 . Sym m etry o f in form ation flowIn d 5 .3 . A lternative so u rc es o f in form ation /contrad ictory e x p er tise sIn d 5 .4 . Publicity and d ocu m entation o f d e b a te s and (in term ed ia te ) resu ltsIn d 5 .1 2 (ad d ed by ZEFIR in D .1 .4 ) e x is te n c e o f a com m unity inform ation and participation planB7 Which information
were available for the public?
all YES draft of the binding plan, newspaper, local radio,docum ents
YES plans (urban land use planning procedure)
YES YES (direct and general access to information)
YES (legal access to urban land use planning docum ents)
YES (legal access to urban land use planning docum ents)
ALL
B8 How long did it take citizens to get information?
no data Direct contact with the city office
Immediately City information centre
No data available A special form ("62") any citizen can fill in
Is the information public?
YES, by m eans of regular exhibitions +new sletters
YES as far as the law allows
YES as far as the law allows
Info needing specialpreparation=14 days
YES : access to the sources of the local plan m anagem ent (coalmine, expertise ...)
YES YES No answ er : YES but „on request*
B9 Was the information free?
YES YES YES YES YES* YES YES YES
BIO W hat kinds of information tools are existent?
Newsletter Press articles, local radio, information, plate
Press articles, leaflets
Newsletters, press announcem ents, internet, advisem ents
Local press (reports from the City council sessions), + Silesian Voivodship office Monitor ; pressannouncem ents, information board and posts in the City
The municipal new sletter (originally every 2 m onths now 6), Noeux-les-Mines website
The municipal new sletter (VIE VAL) + a free phone num ber (accueil quartiers) + an internet forum onValenciennes Town Council website
Newsletters, Visitor centre, web site
B l l Who took the responsibility to organize this access to information?
Council The projectdevelopm entcompany
Developer and the City
The Municipal Office
The D epartm ent of Economic policy and City promotion of the Municipal office
Noeux-les-Minesmunicipality
ValenciennesMunicipality
G ateshead Council
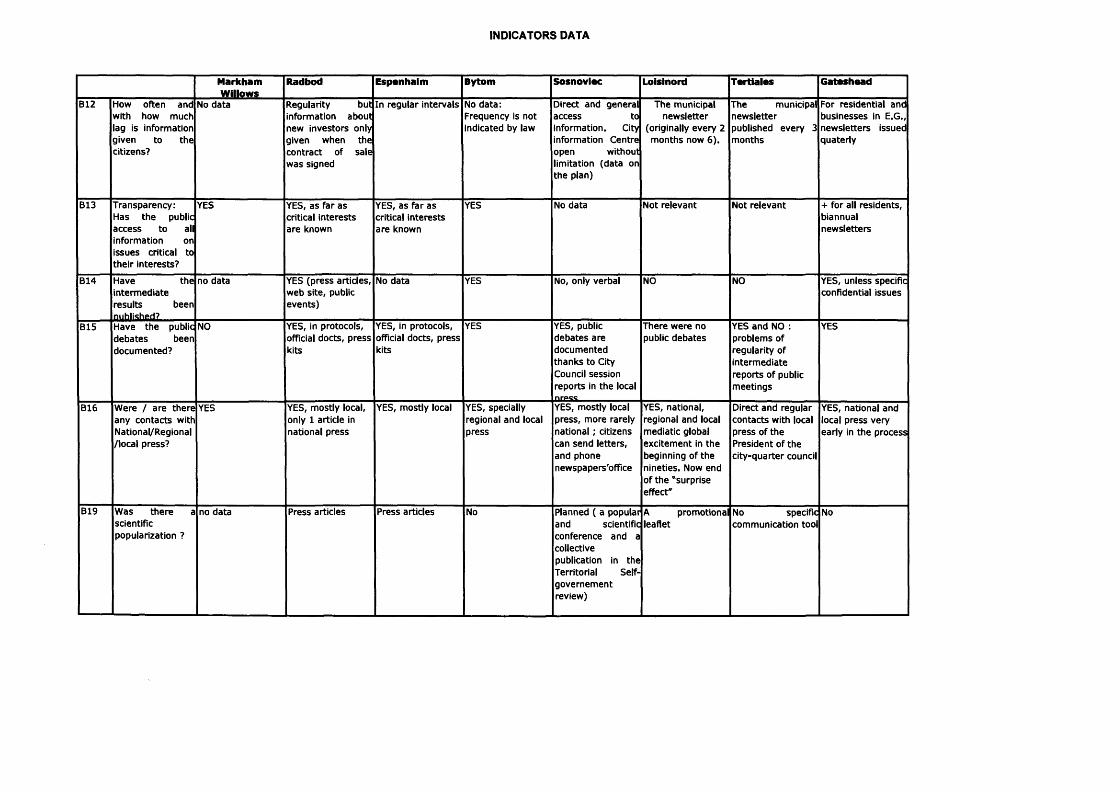
INDICATORS DATA
MarkhamW illow s
Radbod Espenhalm Bytom S osn o v lec Loisinord T ertia les G ateshead
B12 How often and with how much lag is information given to the citizens?
No data Regularity but information about new investors only given when the contract of sale was signed
In regular intervals No data: Frequency is not indicated by law
Direct and general access to information. City information Centre open without limitation (data on the plan)
The municipal new sletter
(originally every 2 m onths now 6).
The municipal new sletter published every 3 m onths
For residential and businesses in E.G., new sletters issued quaterly
B13 Transparency:Has the public access to all information on issues critical to their interests?
YES YES, as far as critical interests are known
YES, as far as critical interests are known
YES No data Not relevant Not relevant + for all residents,biannualnew sletters
B14 Have the interm ediate results been nuhlished?
no data YES (press articles, web site, public events)
No data YES No, only verbal NO NO YES, unless specific confidential issues
B15 Have the public debates been docum ented?
NO YES, in protocols, official docts, press kits
YES, in protocols, official docts, press kits
YES YES, public debates are docum ented thanks to City Council session reports in the local
There were no public debates
YES and NO : problems of regularity of interm ediate reports of public m eetings
YES
B16 Were / are there any contacts with National/Regional /local press?
YES YES, mostly local, only 1 article in national press
YES, mostly local YES, specially regional and local press
YES, mostly local press, more rarely n a tio n a l; citizens can send letters, and phone newspapers'office
YES, national, regional and local mediatic global excitem ent in the beginning of the nineties. Now end of the "surprise effect"
Direct and regular contacts with local press of the President of the city-quarter council
YES, national and local press very early in the process
B19 Was there a scientific popularization ?
no data Press articles Press articles No Planned ( a popular and scientific conference and a collectivepublication in the Territorial Self- governem ent review)
A promotional leaflet
No specific communication tool
No

INDICATORS DATA
MarkhamW illow s
Radbod Espenhalm Bytom S osn o v iec Lolslnord T ertia les G ateshead
B17 Was / is the information flow sym m etric (betweenstakeholders and local community) or one-way (local community informing stakeholders)?
Symmetric Symmetric if stakeholders = developers
Symmetric Symmetric Symmetric One-way One-way Symmetric
B18 Was / is the information flow continuous/punct ual/limited in time?
As soon as som ething new happens, the local community is informed.Information will increase during the life of the project (which is in the planning stage) : a t the m om ent, it is logically quite low
YES regular YES continuous YES continuous No data Punctual YES regular YES continuous
In d 5 .5 . T ransparency o f th e p ro cess m anagem en t In d 5 .6 . Practical m eth od s in th e p ro cess m anagem en t
B3 Which time m anagem ent tools have been used?
Not applicable until now
Not applicable until now
No information Time framework defined by law
No data NO NO Not applicable until now
How long did the global process of participation, communication and alternative expertise last?
Not applicable unti now
Not applicable until now
Formalparticipation along official previous acts by law
The global process lasted 6 years (includes marketing researches)
No data Not applicable Not applicable A continuous process
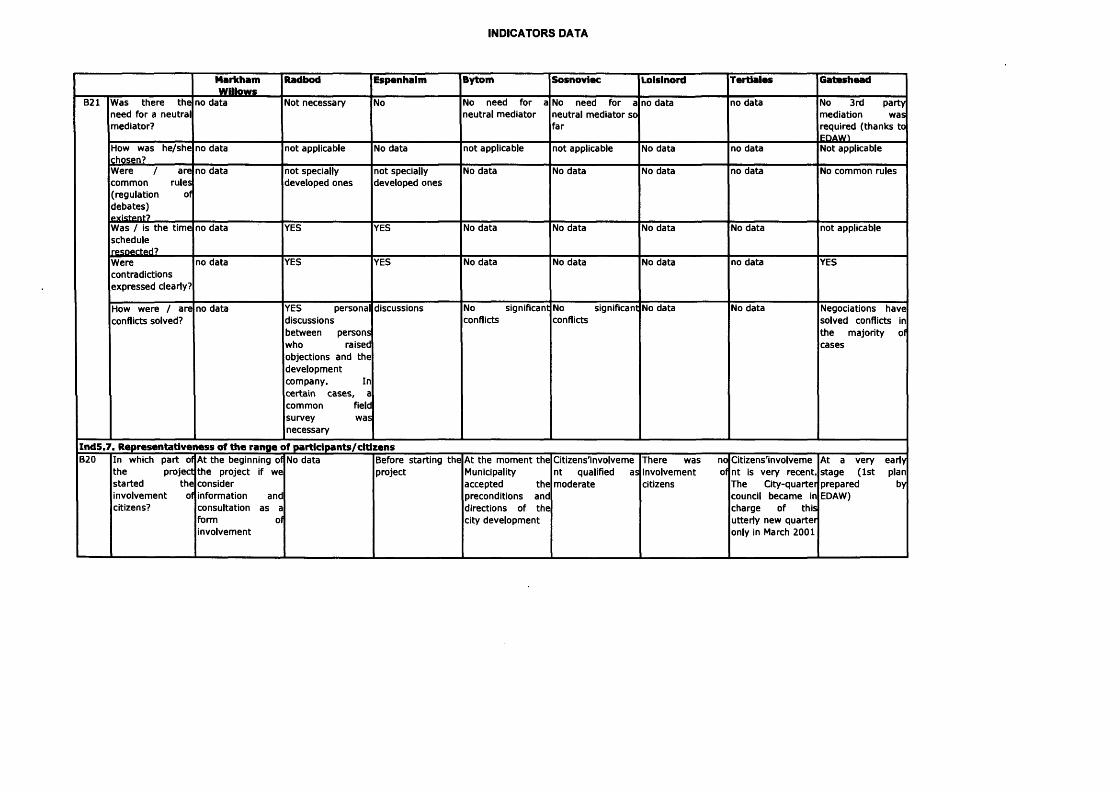
INDICATORS DATA
MarkhamW illow s
Radbod Esponhalm Bytom S o sn o v iec Loislnord T ertia les G ateshead
B21 Was there the need for a neutral m ediator?
no data Not necessary No No need for a neutral m ediator
No need for a neutral m ediator so far
no data no data No 3rd party mediation was required (thanks to EDAW1
How was he/she chosen?
no data not applicable No data not applicable not applicable No data no data Not applicable
Were / are common rules (regulation of debates) e x is te n t?
no data not specially developed ones
not specially developed ones
No data No data No data no data No common rules
Was / is the timescheduleresDected?
no data YES YES No data No data No data No data not applicable
Werecontradictions expressed clearly?
no data YES YES No data No data No data no data YES
How were / are conflicts solved?
no data YES personal discussions between persons who raised objections and the developm ent company. In certain cases, a common field survey was necessary
discussions No significant conflicts
No significant conflicts
No data No data Negociations have solved conflicts in the majority of cases
In d 5 .7 . R ep resen ta tiv en ess o f th e ran ge o f p a rtic ip a n ts/c it izen sB20 In which part of
the project started the involvement ol citizens?
At the beginning of the project if we considerinformation and consultation as form ol involvement
No data Before starting the project
At the m om ent the Municipality accepted the preconditions and directions of the city developm ent
Citizens'involveme nt qualified as m oderate
There was no involvement of citizens
Citizens'involveme nt is very recent. The City-quarter council becam e in charge of this utterly new quarter only in March 2001
At a very early stage (1st plan prepared by EDAW)
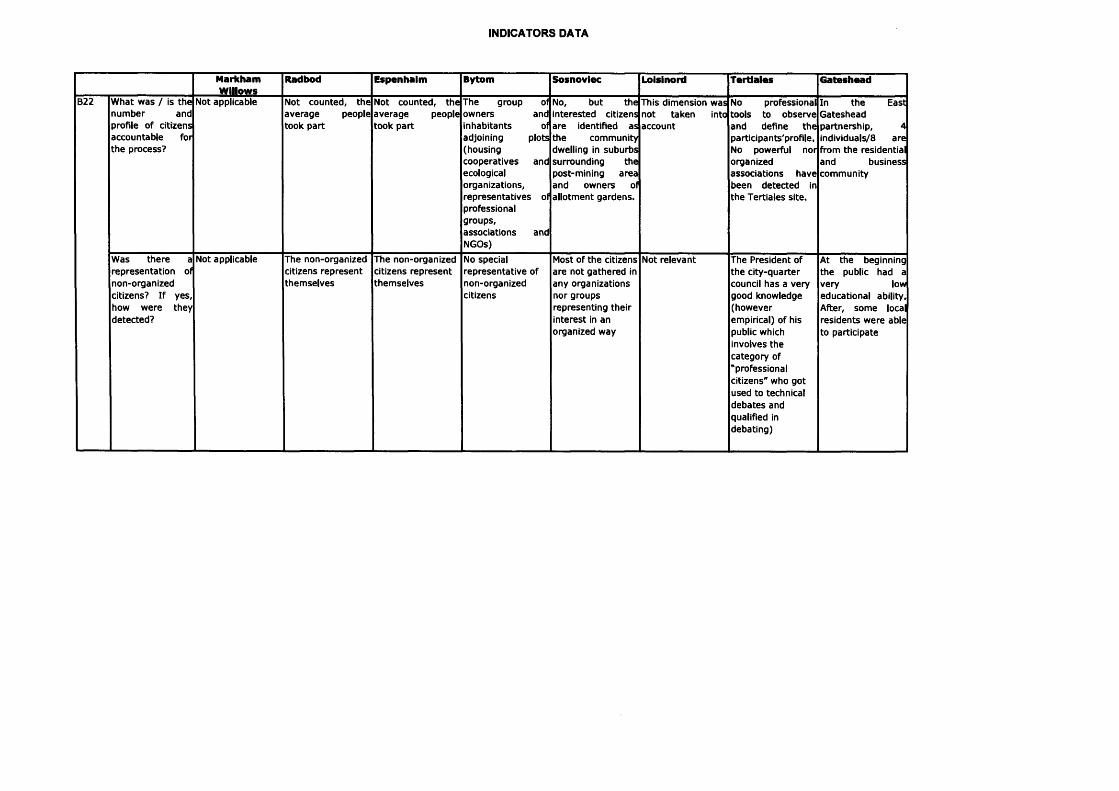
INDICATORS DATA
MarkhamW illow s
Radbod E spenhalm Bytom S o sn o v iec Loisinord T ertia les G ateshead
B22 W hat was / is the num ber and profile of citizens accountable for the process?
Not applicable Not counted, the average people took part
Not counted, the average people took part
The group of owners and inhabitants of adjoining plots (housingcooperatives andecologicalorganizations,representatives ofprofessionalgroups,associations and NGOs)
No, but the interested citizens are identified as the community dwelling in suburbs surrounding the post-mining area and owners of allotm ent gardens.
This dimension was not taken into account
No professional tools to observe and define the participants'profile. No powerful nor organizedassociations have been detected in the Tertiales site.
In the East G ateshead partnership, 4 individuals/8 are from the residential and business community
Was there a representation of non-organized citizens? If yes, how were they detected?
Not applicable The non-organized citizens represent them selves
The non-organized citizens represent them selves
No special representative of non-organized citizens
Most of the citizens are not gathered in any organizations nor groups representing their interest in an organized way
Not relevant The President of the city-quarter council has a very good knowledge (however empirical) of his public which involves the category of "professional citizens" who got used to technical debates and qualified in debating)
At the beginning the public had a very low educational ability. After, som e local residents were able to participate
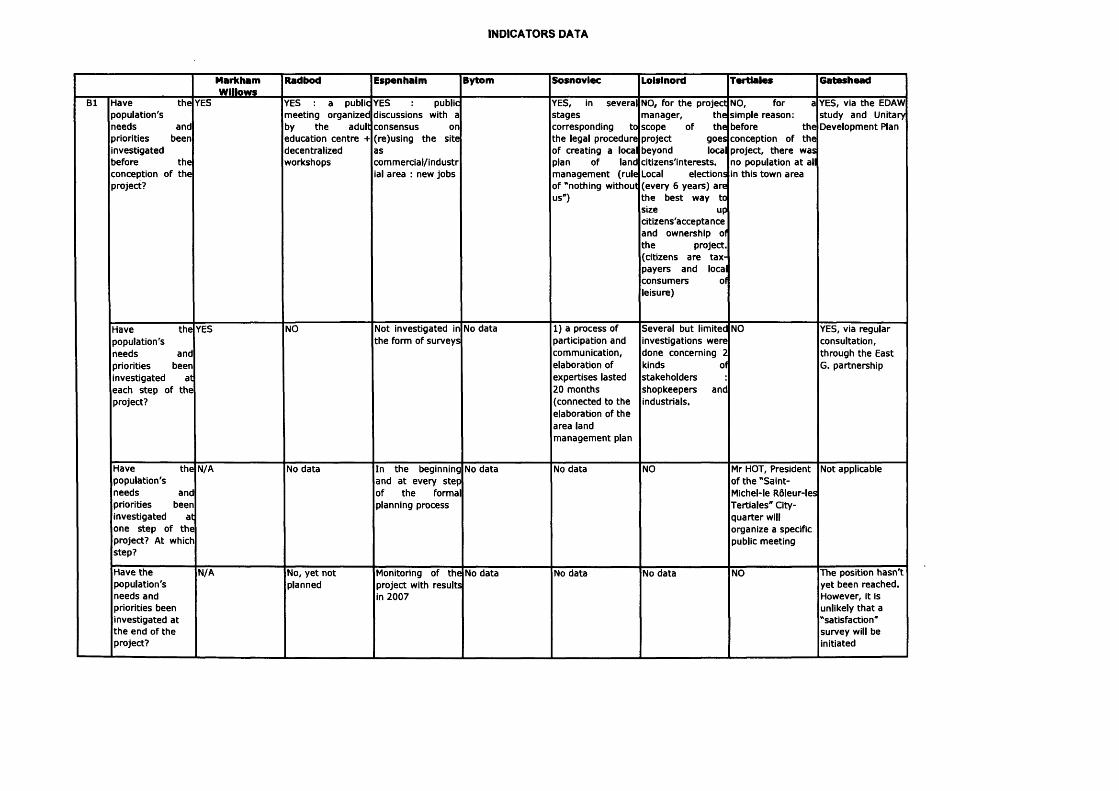
INDICATORS DATA
MarkhamW illow s
Radbod Espenhaim Bytom S osn o v iec Lolsinord T ertia les G ateshead
B1 Have the population's needs and priorities been investigated before the conception of the project?
YES YES a public m eeting organized by the adult education centre + decentralized workshops
YES public discussions with a consensus on (re)using the site ascom m ercial/industr ial area : new jobs
YES, in several stagescorresponding to the legal procedure of creating a local plan of land m anagem ent (rule of "nothing without us")
NO, for the project m anager, the scope of the project goes beyond local citizens'interests. Local elections (every 6 years) are the best way to size up citizens'acceptance and ownership of the project, (citizens are taxpayers and local consum ers of leisure)
NO, for a simple reason: before the conception of the project, there was no population a t all in this town area
YES, via the EDAW study and Unitary Development Plan
Have the population's needs and priorities been investigated at each step of the project?
YES NO Not investigated in the form of surveys
No data 1) a process of participation and communication, elaboration of expertises lasted 20 m onths (connected to the elaboration of the area land m anagem ent plan
Several but limited investigations were done concerning 2 kinds of stakeholders shopkeepers and industrials.
NO YES, via regular consultation, through the East G. partnership
Have the population's needs and priorities been investigated at one step of the project? At which step?
N/A No data In the beginning and a t every step of the formal planning process
No data No data NO Mr HOT, President of the "Saint- Michel-le Roleur-les Tertiales" City- quarter will organize a specific public meeting
Not applicable
Have the population's needs and priorities been investigated at the end of the project?
N/A No, yet not planned
Monitoring of the project with results in 2007
No data No data No data NO The position hasn 't yet been reached. However, it is unlikely th a t a "satisfaction" survey will be initiated
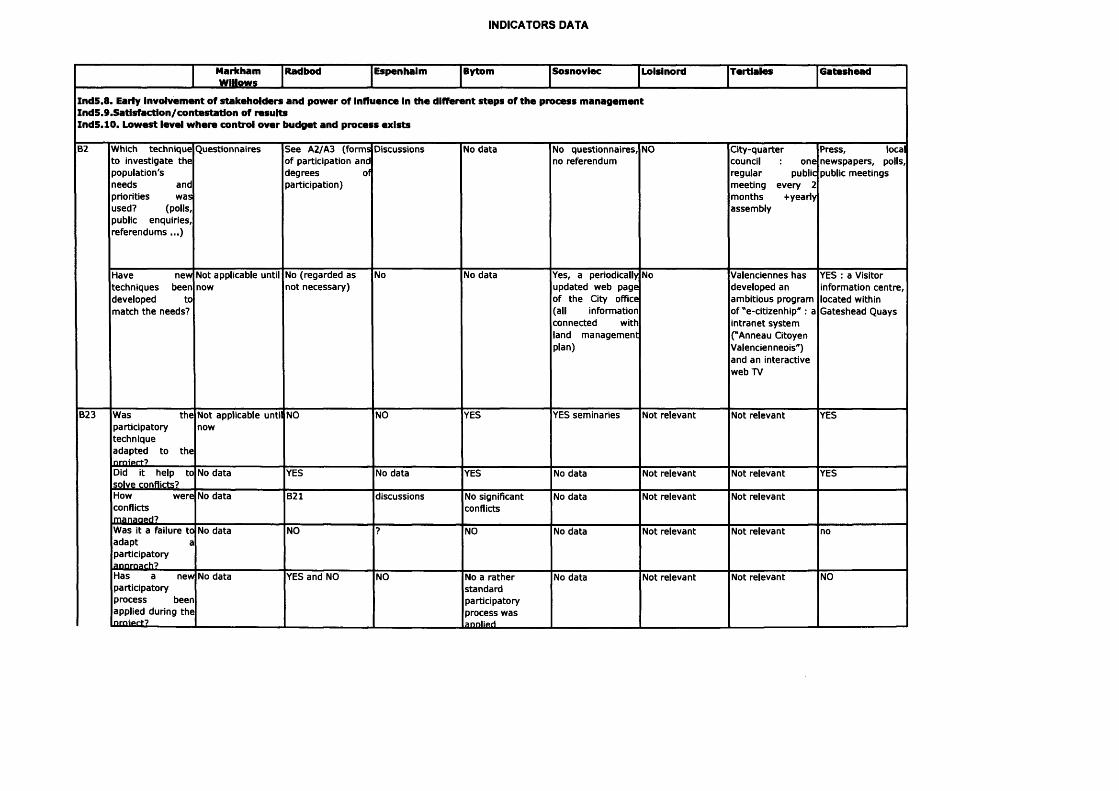
INDICATORS DATA
MarkhamW illow s
Radbod Espenhalm Bytom S osn o v iec Loisinord T ertia les G ateshead
In d 5 .8 . Early in vo lvem en t o f sta k eh o ld ers and pow er o f in flu en ce In th e d ifferen t s te p s o f th e p ro cess m an agem en t In d 5 .9 .S a tisfa c tio n /c o n te sta tio n o f resu ltsIn d 5 .1 0 . L ow est lev e l w h ere control ov er b u d get and p ro cess e x is ts
B2 Which technique to investigate the population's needs and priorities was used? (polls, public enquiries, referendum s ...)
Questionnaires See A2/A3 (forms of participation and degrees of participation)
Discussions No data No questionnaires, no referendum
NO City-quarter council one regular public m eeting every 2 m onths +yeariy assem bly
Press, local new spapers, polls, public m eetings
Have new techniques been developed to match the needs?
Not applicable until now
No (regarded as not necessary)
No No data Yes, a periodically updated web page of the City office (all information connected with land m anagem ent plan)
No Valenciennes has developed an am bitious program of ”e-citizenhip" : a intranet system ("Anneau Citoyen Valencienneois") and an interactive web TV
YES : a Visitor information centre, located within G ateshead Quays
B23 Was the participatory technique adapted to thenroiert?
Not applicable until now
NO NO YES YES sem inaries Not relevant Not relevant YES
Did it help to solve conflicts?
No data YES No data YES No data Not relevant Not relevant YES
How wereconflictsm anaaed?
No data B21 discussions No significant conflicts
No data Not relevant Not relevant
Was it a failure to adap t a participatory aDoroach?
No data NO ? NO No data Not relevant Not relevant no
Has a new participatory process been applied during the nm iect?
No data YES and NO NO No a rather standard participatory process was aoolied
No data Not relevant Not relevant NO
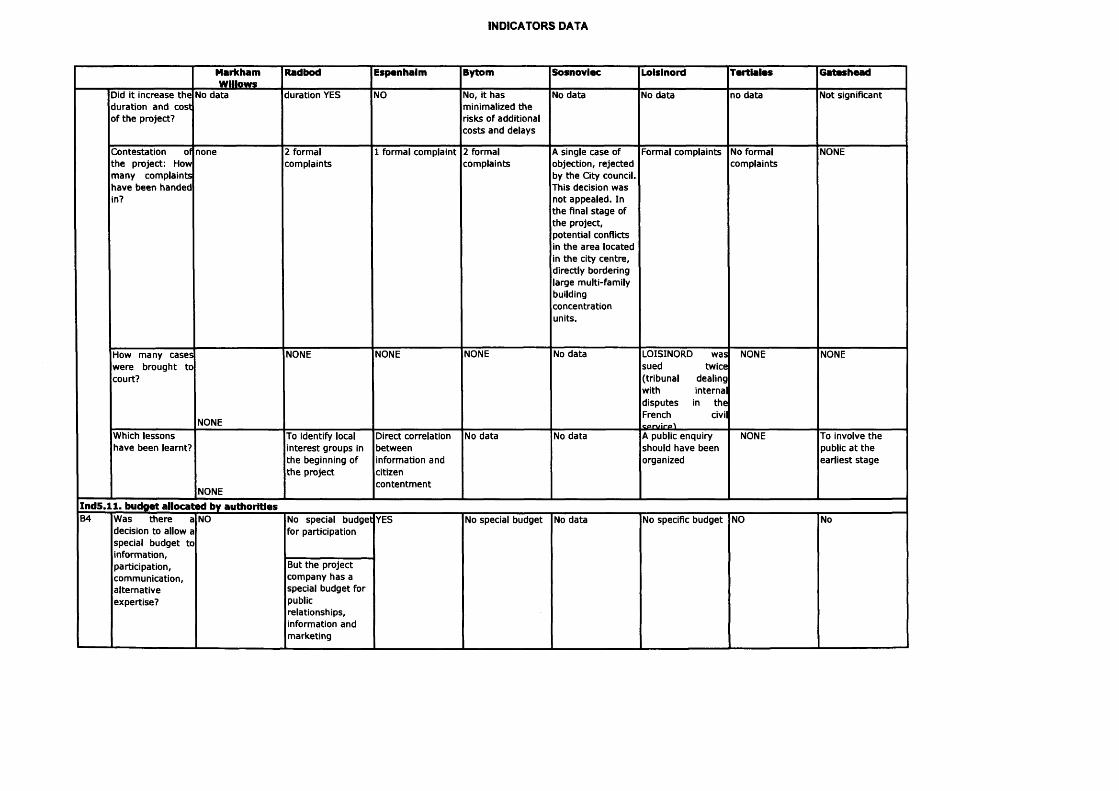
INDICATORS DATA
MarkhamW illow s
Radbod Espenhaim Bytom S osn o v iec Lolsinord T ertia les G ateshead
Did it increase the duration and cost of the project?
No data duration YES NO No, it has minimalized the risks of additional costs and delays
No data No data no data Not significant
Contestation of the project: How m any complaints have been handed in?
none 2 formal complaints
1 formal complaint 2 formal complaints
A single case of objection, rejected by the City council. This decision was not appealed. In the final stage of the project, potential conflicts in the area located in the city centre, directly bordering large multi-family building concentration units.
Formal complaints No formal complaints
NONE
How many cases were brought to court?
NONE
NONE NONE NONE No data LOISINORD was sued twice (tribunal dealing with internal disputes in the French civil
NONE NONE
Which lessons have been learnt?
NONE
To identify local interest groups in the beginning of the project
Direct correlation between information and citizencontentm ent
No data No data A public enquiry should have been organized
NONE To involve the public a t the earliest stage
In d 5 .1 1 . b u d get a lloca ted by au th oritiesB4 Was there a
decision to allow a special budget to information, participation, communication, alternative expertise?
NO No special budget for participation
But the project company has a special budget for publicrelationships, information and m arketing
YES No special budget No data No specific budget NO No

INDICATORS DATA
MarkhamW illow s
Radbod Espenhalm Bytom S osn o v iec Loisinord T ertia les G ateshead
B5 How much w as / is the special budget to information, participation, communication, alternative expertise?
Not applicable until now
Not applicable until now
No information No data No data Recently, Noeux- les-Mines hired a project m anager in charge of public relations but not focussed on LOISINORD specifically
Not applicable Not applicable until now
B6 Was the budget for participation, communication and alternative expertiseadequate for the needs?
Not applicable until now
YES but not for participation
YES The expenditures for public participation = necessary and adequate
No data Not applicable Not applicable Not applicable until now
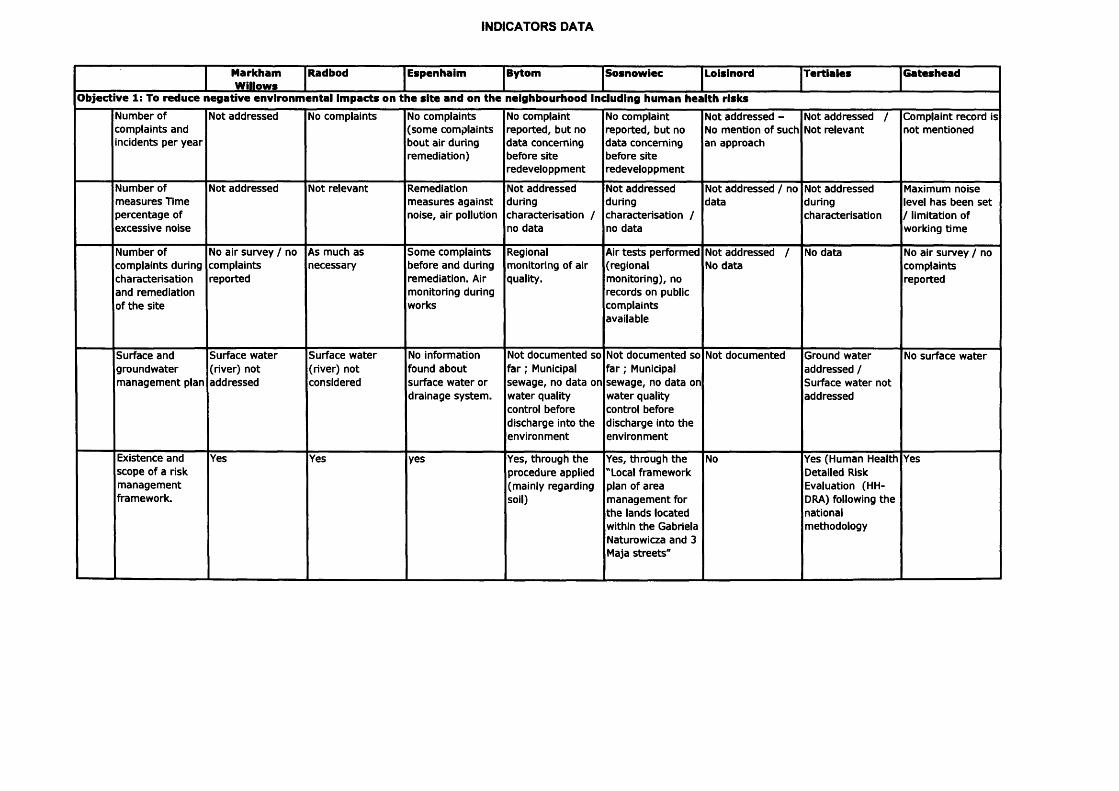
INDICATORS DATA
M arkhamW illow s
R adbod E spenhaim Bytom S osnow iec Loisinord T e rtia le s G a te sh ead
O b jective 1: To re d u c e n e g a tiv e en v iro n m en ta l im p ac ts on th e s i te an d on th e n e ig h b o u rh o o d including h u m an h e a lth r isk s
Number of complaints and incidents per year
Not addressed No complaints No complaints (some complaints bout air during remediation)
No complaint reported, but no data concerning before site redeveloppment
No complaint reported, but no data concerning before site redeveloppment
Not addressed - No mention of such an approach
Not addressed / Not relevant
Complaint record is not mentioned
Number of m easures Time percentage of excessive noise
Not addressed Not relevant Remediation m easures against noise, air pollution
Not addressed duringcharacterisation / no data
Not addressed duringcharacterisation / no data
Not addressed / no data
Not addressed duringcharacterisation
Maximum noise level has been se t / limitation of working time
Number of complaints during characterisation and remediation of the site
No air survey / nocomplaintsreported
As much as necessary
Some complaints before and during remediation. Air monitoring during works
Regional monitoring of air quality.
Air tes ts performed (regional monitoring), no records on public complaints available
Not addressed / No data
No data No air survey / nocomplaintsreported
Surface and groundwater managem ent plan
Surface water (river) not addressed
Surface water (river) not considered
No information found about surface water or drainage system.
Not documented so f a r ; Municipal sewage, no data on water quality control before discharge into the environment
Not documented so f a r ; Municipal sewage, no data on water quality control before discharge into the environment
Not documented Ground water addressed / Surface water not addressed
No surface water
Existence and scope of a risk m anagem ent framework.
Yes Yes yes Yes, through the procedure applied (mainly regarding soil)
Yes, through the "Local framework plan of area m anagem ent for the lands located within the Gabriela Naturowicza and 3 Maja streets"
No Yes (Human Health Detailed Risk Evaluation (HH- DRA) following the national methodology
Yes
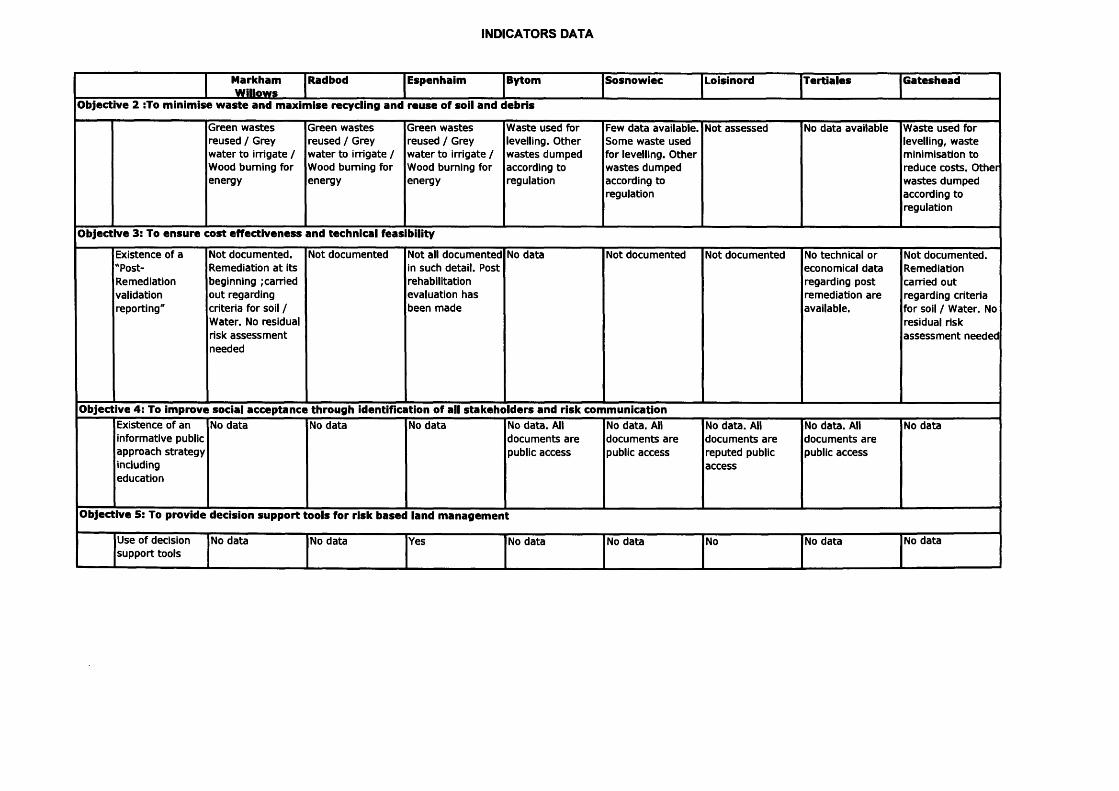
INDICATORS DATA
M arkhamW illow s
R adbod E spenhaim B ytom S osnow iec Loisinord T e rtia le s G a te sh ead
O b jective 2 :To m in im ise w a s te an d m ax im ise recycling an d re u s e o f so il an d d e b ris
Green w astes reused / Grey w ater to irrigate / Wood burning for energy
Green w astes reused / Grey w ater to irrigate / Wood burning for energy
Green w astes reused / Grey w ater to irrigate / Wood burning for energy
Waste used for levelling. Other wastes dumped according to regulation
Few data available. Some waste used for levelling. Other w astes dumped according to regulation
Not assessed No data available Waste used for levelling, waste minimisation to reduce costs. Other w astes dumped according to regulation
O bjective 3: To e n su re c o s t e f fe c tiv e n e ss an d te ch n ica l feas ib ility
Existence of a "Post-Remediationvalidationreporting"
Not documented. Remediation a t its beginning ;carried out regarding criteria for soil / Water. No residual risk assessm ent needed
Not documented Not all documented in such detail. Post rehabilitation evaluation has been made
No data Not documented Not documented No technical or economical data regarding post remediation are available.
Not documented. Remediation carried out regarding criteria for soil / Water. No residual risk assessm ent needed
O bjective 4 : To im prove soc ia l a c c e p ta n c e th ro u g h iden tifica tion o f all s ta k e h o ld e rs an d risk com m un icationExistence of an informative public approach strategy including education
No data No data No data No data. All documents are public access
No data. All documents are public access
No data. All documents are reputed public access
No data. All documents are public access
No data
O b jective 5: To p rov ide dec is ion su p p o r t to o ls fo r risk b a sed land m a n a g e m e n t
Use of decision support tools
No data No data Yes No data No data No No data No data
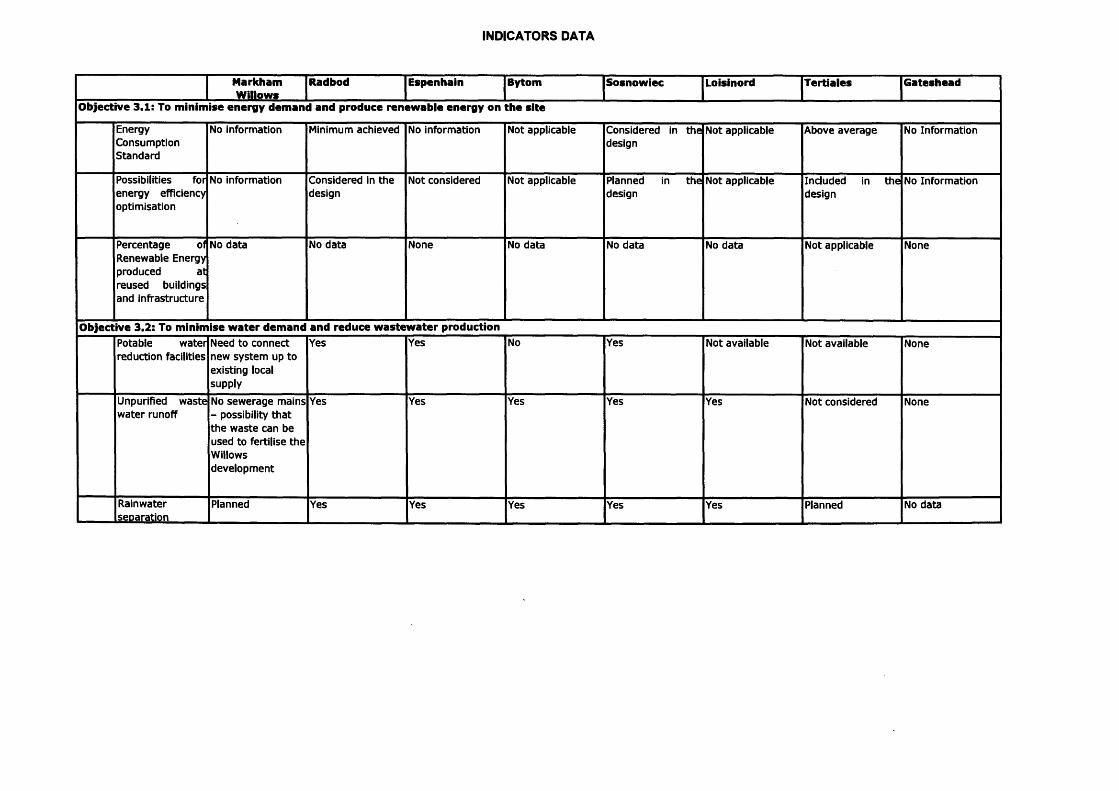
INDICATORS DATA
M arkhamW illow s
R adbod E spenhain Bytom Sosnow iec Loisinord T e rtia le s G a te sh ead
O b jective 3 .1 : To m in im ise e n e rg y d em an d an d p ro d u ce re n e w a b le e n e rg y on th e s i te
EnergyConsumptionStandard
No information Minimum achieved No information Not applicable Considered in the design
Not applicable Above average No Information
Possibilities for energy efficiency optimisation
No information Considered in the design
Not considered Not applicable Planned in the design
Not applicable Included in the design
No Information
Percentage of Renewable Energy produced at reused buildings and infrastructure
No data No data None No data No data No data Not applicable None
O bjective 3 .2 : To m in im ise w a te r d em an d an d red u ce w a s te w a te r p roduc tionPotable water reduction facilities
Need to connect new system up to existing local supply
Yes Yes No Yes Not available Not available None
Unpurified waste water runoff
No sewerage mains - possibility tha t the waste can be used to fertilise the Willows development
Yes Yes Yes Yes Yes Not considered None
Rainwaterseparation
Planned Yes Yes Yes Yes Yes Planned No data
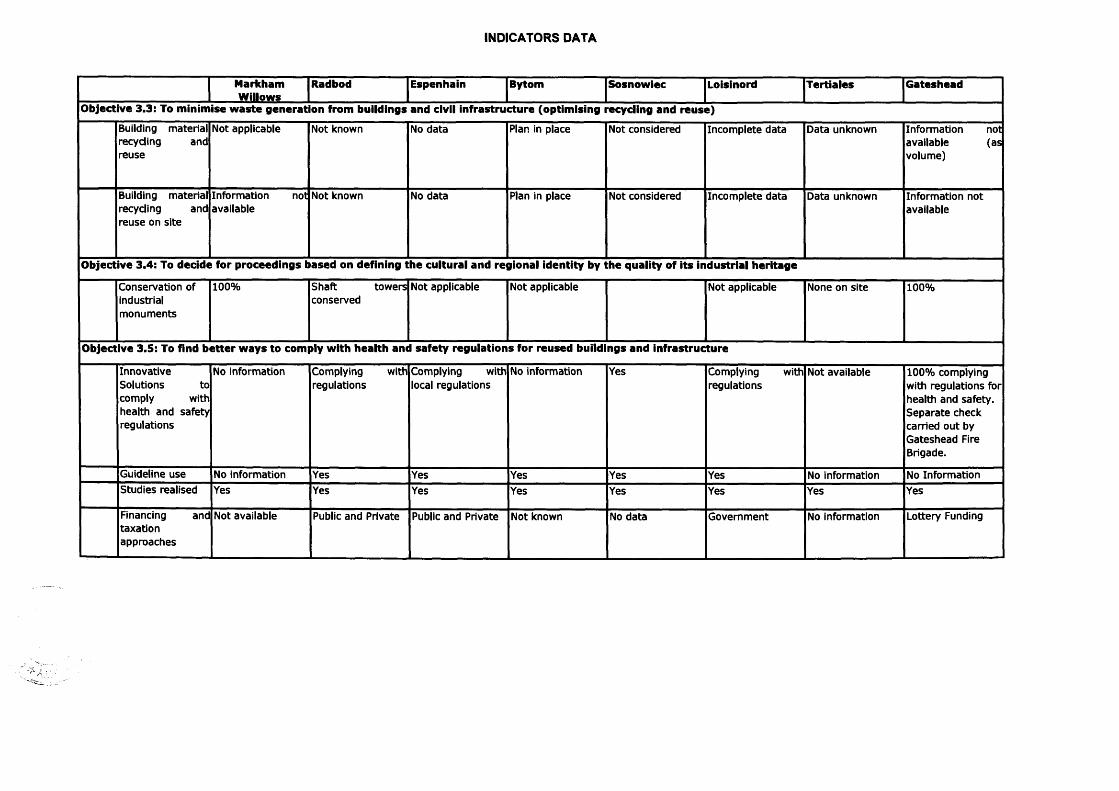
INDICATORS DATA
M arkhamW illow s
R adbod E spenhain Bytom S osnow iec Loisinord T e rtia le s G a te sh ead
O bjective 3 .3 : To m in im ise w a s te g e n e ra tio n from bu ild ings an d civil in f ra s tru c tu re (o p tim ising recycling an d re u s e )
Building material recycling and reuse
Not applicable Not known No data Plan in place Not considered Incomplete data Data unknown Information not available (as volume)
Building material recycling and reuse on site
Information not available
Not known No data Plan in place Not considered Incomplete data Data unknown Information not available
O b jective 3 .4 : To d ec id e fo r p ro ceed in g s b a sed on defin ing th e cu ltu ra l an d reg io n a l id en tity by th e qu a lity o f its in d u s tria l h e ri ta g e
Conservation ofindustrialmonuments
100% Shaft towers conserved
Not applicable Not applicable Not applicable None on site 100%
O bjective 3 .5 : To find b e t te r w a y s to com ply w ith h e a lth an d s a fe ty re g u la tio n s fo r re u se d bu ild ings an d in f ra s tru c tu re
Innovative Solutions to comply with health and safety regulations
No information Complying with regulations
Complying with local regulations
No information Yes Complying with regulations
Not available 100% complying with regulations for health and safety. Separate check carried out by Gateshead Fire Brigade.
Guideline use No information Yes Yes Yes Yes Yes No information No InformationStudies realised Yes Yes Yes Yes Yes Yes Yes Yes
Financing andtaxationapproaches
Not available Public and Private Public and Private Not known No data Government No information Lottery Funding