Embed Size (px)
Citation preview

UNIVERSITY OF CAPE COAST
EFFECTS OF WORKING CAPITAL MANAGEMENT POLICIES ON
SHAREHOLDERS’ VALUE: EVIDENCE FROM LISTED
MANUFACTURING FIRMS IN GHANA
BY
EDWARD QUANSAH
Thesis submitted to the Department of Finance of the School of Business,
College of Humanities and Legal Studies, University of Cape Coast, in partial
fulfilment of the requirements for the award of Master of Commerce degree in
Finance
MAY 2016
© University of Cape Coast https://erl.ucc.edu.gh/jspui
Digitized by Sam Jonah Library
ii
DECLARATION
Candidate’s Declaration
I hereby declare that this thesis is the result of my own original research and
that no part of it has been presented for another degree in this university or
elsewhere.
Candidate’s Signature: ........ ............................ Date: .............................
Name: Edward Quansah
Supervisors’ Declaration
We hereby declare that the preparation and presentation of the thesis were
supervised in accordance with the guidelines on supervision of thesis laid down
by the University of Cape Coast.
Principal Supervisor’s Signature ...... ...... .................. Date: ... .................
Name: Dr. Anokye Mohammed Adam
Co-Supervisor’s Signature ..................................... Date: ....................
Name: Mr. Seyram Kawor
© University of Cape Coast https://erl.ucc.edu.gh/jspui
Digitized by Sam Jonah Library
iii
ABSTRACT
Although working capital management decisions concern short-term
assets and liabilities, they have both short-term and long-term implications on
the profitability and shareholder value. The study sought to examine the effects
of working capital management policies on shareholder value creation for six
manufacturing firms listed at Ghana Stock Exchange for a period of 2000-2013.
Data were gathered from the annual reports of the firms and the publication of
Ghana Stock Exchange. Descriptive statistics, One-way ANOVA, panel fully
modified ordinary least square and dynamic panel ARDL methodologies were
used for analyzing the data. The results revealed that the firms were following
moderate working capital management policies. The study found significant
differences among the current asset investment policies across different firms.
However, no significant differences were observed for financing policies.
The grouped Fully Modified OLS and Panel ARDL regression results indicated
that conservative current asset investment policies increase ROE and EVA
while aggressive current asset investment policies enhance market-to-book ratio
and Tobin’s Q in the long-run. On the other hand, aggressive current asset
financing policies increase ROE while conservative current asset financing
policies enhance market-to-book ratio, Tobin’s Q and EVA in the long-run.
Thus, a firm pursuing aggressive current asset investment policy should balance
it with conservative current asset financing policy and vice versa in order to
enhance profitability and create value for their investors.
© University of Cape Coast https://erl.ucc.edu.gh/jspui
Digitized by Sam Jonah Library

iv
KEY WORDS
Current asset financing policy
Current asset investment policy
Fully modified
Panel ARDL
Panel cointegration
Shareholder value
© University of Cape Coast https://erl.ucc.edu.gh/jspui
Digitized by Sam Jonah Library

v
ACKNOWLEDGEMENTS
I would like to thank all those who made this thesis a success,
especially, my principal supervisor and co-supervisor Dr. Anokye Mohammed
Adam and Mr. Seyram Kawor respectively for their unselfish dedication and
effectively supervising this work.
I also want to express my heartfelt appreciation to Prof. Peter Pedroni
of Williams College, USA for his invaluable contribution on Panel Fully
Modified Least Squares.
I am also grateful to the entire 2013/2014 MBA/MCOM (Finance)
batch for the times and moment we shared together, especially, Mr. J. B.
Coomson for the brotherly love you showed to me during my course of study.
Finally, I wish to thank my family and friends for their support and
encouragement, especially, my uncle Mr. Evans B. Selby and Mrs. Freda
Obeng.
© University of Cape Coast https://erl.ucc.edu.gh/jspui
Digitized by Sam Jonah Library

vi
DEDICATION
To my lovely wife, Alice and daughters, Gracelyn, Lawrencia, Esther and
Sophelia.
© University of Cape Coast https://erl.ucc.edu.gh/jspui
Digitized by Sam Jonah Library

vii
TABLE OF CONTENTS
Page
DECLARATION ii
ABSTRACT iii
KEY WORDS iv
ACKNOWLEDGEMENTS v
DEDICATION vi
LIST OF TABLES xi
LIST OF FIGURES xiii
LIST OF ACRONYMS xiv
CHAPTER ONE: INTRODUCTION
Background to the Study 1
Statement of the Problem 7
Purpose of the Study 11
Research Objectives 11
Research Hypotheses 11
Significance of the Study 12
Delimitations 13
Limitation 13
Organization of the Study 14
CHAPTER TWO: LITERATURE REVIEW
Introduction 15
Overview of Working Capital Management 15
Concept of Working Capital 16
Theoretical Foundation of the Study 16
Main Theme of the Theory of Working Capital Management 21
Current Assets Investment Policies 21
© University of Cape Coast https://erl.ucc.edu.gh/jspui
Digitized by Sam Jonah Library

viii
Permanent and Temporary Current Assets 23
Sources of Current Assets Financing 24
Policies of Financing Current Assets 25
Overall Working Capital Management Policy 28
Empirical Literature Review 30
Relative Relationship of Working Capital Management Policies 30
Working Capital Management Policies and Firm’s Profitability 33
Working Capital Management Policies and Shareholder Value Creation 43
Working Capital Management and Cointegration 48
Conceptual Framework 50
Chapter Summary 51
CHAPTER THREE: RESEARCH METHODS
Introduction 52
Research Design 52
Study Area 53
Population 54
Sampling Procedure 54
Data Collection Instruments 55
Data Collection Procedures 56
Description and Justification of Variables Used in the Study 56
Data Analysis 62
Model Specification 63
Panel Unit Root Test 65
Panel Cointegration Test 67
Estimation of Long-Run Cointegrating Relationship 69
Chapter Summary 74
© University of Cape Coast https://erl.ucc.edu.gh/jspui
Digitized by Sam Jonah Library

ix
CHAPTER FOUR: RESULTS AND DISCUSSION
Introduction 75
Descriptive Statistics 75
Analysis of Variance (ANOVA) 87
Results of Panel Unit Root Tests 91
Presentation and Analysis of Panel Cointegration Tests Results 93
Analysis of Cointegration Regression Results 97
Presentation and Analysis of Grouped-FMOLS Results 98
Presentation and Analysis of Panel ARDL/PMG Results 113
CHAPTER FIVE: SUMMARY, CONCLUSIONS AND
RECOMMENDATIONS
Introduction 126
Summary of Research Findings 126
Conclusions 130
Recommendations 132
REFERENCES 135
APPENDICES 152
Appendix A: List of Manufacturing Firms on GSE 152
Appendix B-1: T-Test for the Differences in the Means of (TCA/TA) 153
Appendix B-2: ANOVA Test Results for (TCA/TA) 153
Appendix B-3: Current Asset Investment Policies (TCA/TA) – LSD 154
Appendix B-4: Current Asset Investment Policies (TCA/TA) - HSD 155
Appendix B-5: ANOVA Test Results for (TCL/TA) 156
Appendix C-1: Pedroni Cointegration Test Results for ROE 156
Appendix C-2: Pedroni Cointegration Test Results for MBR 157
Appendix C-3: Pedroni Cointegration Test Results for Tobin’s Q 157
Appendix C-4: Pedroni Cointegration Test Results for EVA 158
© University of Cape Coast https://erl.ucc.edu.gh/jspui
Digitized by Sam Jonah Library

x
Appendix D-1: Grouped FMOLS Results for ROE without dummy 159
Appendix D-2: Grouped FMOLS Results for ROE with dummy 159
Appendix D-3: Grouped FMOLS Results for MBR without dummy 160
Appendix D-4: Grouped FMOLS Results for MBR with dummy 160
Appendix D-5: Grouped FMOLS Results for Tobin’s Q without dummy 161
Appendix D-6: Grouped FMOLS Results for Tobin’s Q with dummy 161
Appendix D-7: Grouped FMOLS Results for EVA without dummy 162
Appendix D-8: Grouped FMOLS Results for EVA with dummy 162
Appendix E-1: ARDL/PMG Results for ROE without Leverage 163
Appendix E-2: ARDL/PMG for ROE with Leverage 164
Appendix E-3: ARDL/PMG Results for MBR without Leverage 165
Appendix E-4: ARDL/PMG Results for MBR with Leverage 166
Appendix E-5: ARDL/PMG Results for Tobin’s Q without Leverage 167
Appendix E-6: ARDL/PMG Results for Tobin’s Q with Leverage 168
Appendix E-7: ARDL/PMG Results for EVA without Leverage 169
Appendix E-8: ARDL/PMG Results for EVA with Leverage 170
© University of Cape Coast https://erl.ucc.edu.gh/jspui
Digitized by Sam Jonah Library

xi
LIST OF TABLES
Table Page
1 List of firms included in the Study 55
2 Descriptive Statistics for ROE 76
3 Descriptive Statistics for MBR 78
4 Descriptive Statistics for Tobin’s Q 79
5 Descriptive Statistics for EVA 80
6 Descriptive Statistics for TCA/TA 81
7 Descriptive Statistics for TCL/TA 83
8 Descriptive Statistics for CCC 84
9 Descriptive Statistics for Size 85
10 Descriptive Statistics for Debt-to-Equity Ratio 86
11 ANOVA Test Result for TCA/TA 87
12 ANOVA Test Results for TCA/TA – LSD 88
13 ANOVA Test Results for TCA/TA – HSD 89
14 ANOVA Test Results for TCL/TA 90
15 Panel Unit Root Test Results- Level 91
16 Panel Unit Root Test Results- 1st Difference 93
17 Panel Cointegration Test Results-ROE 94
18 Panel Cointegration Test Results-MBR 95
19 Panel Cointegration Test Results-Tobin’s Q 96
20 Panel Cointegration Test Results-EVA 97
21 Grouped FMOLS Results-ROE 100
22 Grouped FMOLS Results-MBR 104
23 Grouped FMOLS Results-Tobin’s Q 107
24 Grouped FMOLS Results-EVA 111
25 ARDL/PMG Results-ROE 114
© University of Cape Coast https://erl.ucc.edu.gh/jspui
Digitized by Sam Jonah Library

xii
26 ARDL/PMG Results-MBR 117
27 ARDL/PMG Results-Tobin’s Q 120
28 ARDL/PMG Results-EVA 123
© University of Cape Coast https://erl.ucc.edu.gh/jspui
Digitized by Sam Jonah Library

xiii
LIST OF FIGURES
Figure Page
1 Alternative Current Assets Investment Policies 22
2 Permanent and Temporary Current Assets Levels 23
3 Moderate Current Asset Financing Policy 26
4 Conservative Current Asset Financing Policy 27
5 Aggressive Current Asset Financing Policy 28
6 Conceptual Framework 51
© University of Cape Coast https://erl.ucc.edu.gh/jspui
Digitized by Sam Jonah Library
xiv
LIST OF ACRONYMS
ALUWKS Aluworks Limited
ANOVA Analysis of Variance
ARDL Autoregressive Distribution Lag
CCC Cash Conversion Cycle
CMLT Camelot Ghana Limited
EVA Economic Value Added
F&B Food and Beverages Manufacturing Firms
FML Fan Milk Ghana Limited
FMOLS Fully Modified Ordinary Least Square
GGBL Guinness Ghana Breweries Limited
GSE Ghana Stock Exchange
HSD Honestly Significant Difference
ISIC International Standard Industrial Classification
LSD Least Significance Difference
MBR Market-to-Book Ratio
O. MFG Other Manufacturing Firms
PMG Pooled Mean Group
PZC PZ Cussons Ghana Limited
© University of Cape Coast https://erl.ucc.edu.gh/jspui
Digitized by Sam Jonah Library

xv
ROE Return on Equity
TA Total Assets
TCA Total Current Assets
TCL Total Current Liabilities
UNIL Unilever Ghana Limited
© University of Cape Coast https://erl.ucc.edu.gh/jspui
Digitized by Sam Jonah Library

1
CHAPTER ONE
INTRODUCTION
Shareholder wealth maximization has become a widely accepted
normative criterion to judge the financial decisions of corporate executives.
These decisions include long-term investment, capital structure, dividend policy
as well as working capital management. However, literature on corporate
finance tends to focus attention on the long-term financial decisions to the
neglect of working capital management even though working capital
management affects profitability and shareholder value. There are scant
empirical studies which had been undertaken in the area of working capital
management and shareholder wealth creation albeit its importance hence
creating a gap. Additionally, available empirical evidence suggests that earlier
studies on the subject employed static Ordinary Least Squares (OLS)
regressions without checking for stationarity or cointegration in their data
series. Hence, the results obtained may be biased or spurious. This study
therefore seeks to fill this gap by employing a recently developed econometric
methodology in order to correct some of these methodological flaws.
Background to the Study
Following Rappaport’s seminal paper on shareholder value over the past
two decades, attention has now been focused on corporate managers to create a
sustainable shareholder value by taking decisions that will maximize the firms’
value. Gross (2006) argues that shareholder value has become the pre-eminent
performance indicator for companies worldwide, and that maximizing
shareholder value represents the ultimate directive for managerial decisions.
© University of Cape Coast https://erl.ucc.edu.gh/jspui
Digitized by Sam Jonah Library

2
Narang and Kaur (2014) also stress that maximizing the shareholder value has
become the widely accepted corporate objective the world over and thus, its
enhancement has become the key responsibility of corporate executives and
finance managers.
Corporate finance decisions that finance managers are required to make
are investment decisions (capital budgeting), financing decisions (capital
structure), dividend decisions (profit allocation) and short-term financial
decisions such as working capital management. Onwumere, Ibe and Ugbam
(2012) opine that none of these four decisions is more important than the other;
hence a good financial manager should pay equal attention to each of these
decisions as the firm strives to maximize its value. However, the corporate
finance literature has traditionally focused on the study of long-term financial
decisions particularly investments, capital structures, dividends and firm
valuation decisions (Nazir & Afza, 2009).
Nevertheless, short-term financial decisions are an integral part of the
overall corporate and financial strategy and thus among the short-term financial
strategies, working capital plays an important role in increasing profitability and
creating shareholder value (Pouraghajan & Emamgholipourachi, 2012; Shin &
Soenen, 1998). Although working capital management decisions concern short-
term assets and liabilities, they have both short-term and long-term implications
on the profitability and shareholder value which warrant careful attention.
Watson and Head (2007) argue that long-term investment and financing
decisions will only yield their expected benefits for a company if attention is
also paid to short-term decisions regarding current assets and liabilities.
Decisions relating to working capital involve managing relationships between a
© University of Cape Coast https://erl.ucc.edu.gh/jspui
Digitized by Sam Jonah Library
3
firm’s short-term assets and liabilities to ensure a firm is able to continue its
operations, and have sufficient cash flows to satisfy both maturing short-term
debts and upcoming operational expenses at minimal cost thereby increasing
corporate profitability (Barine, 2012).
The management of working capital is an important component of
corporate financial management because it directly affects the profitability of
firms. Smith (1980) concluded that working capital management is important
because of its effect on firm’s profitability and risk, and consequently its value.
Similarly, Deloof (2003) suggests that the way in which working capital is
managed will have significant impact on the profitability of the firms. Agarwal
and Mishra (2007) also posit that proper management of working capital is
necessary both to maintain profitability and liquidity. Improper management of
working capital has been cited as one of the factors of corporate failure
(Berryman, 1983). Sathyamoorthi and Wally-Dima (2008) stressed that a
company that neglects its working capital will soon run out of cash and may
even have to close down. Similarly, Singh (2008) argues that a firm will have
to face serious problems relating to its long-term profitability and shareholders’
wealth and may even fail to survive if it neglects the management of its
inventories. For a firm to survive and avoid insolvency and consequently
bankruptcy, it needs to pay particular attention to its working capital
management.
According to Emery and Finnerty (1991), working capital management
involves selecting the appropriate levels of cash, marketable securities,
receivables and inventories, and the appropriate level and mix of short-term
indebtedness. Working capital can be said to be the life blood of every business
© University of Cape Coast https://erl.ucc.edu.gh/jspui
Digitized by Sam Jonah Library

4
entity and hence its efficient management is essential for the survival of the
business (Padachi, Howorth & Narasimhan, 2012). As postulated by Watson
and Head “working capital management is a key factor in the company’s long-
term success: without the ‘oil’ of working capital, the ‘engine’ of non-current
assets will not function” (Watson & Head, 2007, p 68). Filbeck and Krueger
(2005) opine that business success depends heavily on the financial manager’s
ability to manage the components of working capital effectively and efficiently.
It is for this reason that financial managers spend considerable time and effort
in bringing non-optimal levels of current assets and liabilities back toward
optimal levels (Gitman & Zutter, 2012; Lamberson, 1995). According to
Rahman (2011), the management of working capital plays an important role in
maintaining the financial health of a firm during normal course of business. In
the same vein, Marfo-Yiadom and Agyei (2011) noted that working capital
management directly affects the firms’ long-term growth and survival. This is
due to the fact that higher levels of working capital are needed to support sales
growth or production.
Efficient management of working capital means management of all the
components of working capital so as to ensure that adequate amount of working
capital is available for the smooth running of the business. According to Eljelly
(2004), efficient working capital management involves planning and controlling
current assets and current liabilities in a manner that eliminates the risk of
inability to meet due short-term obligations on one hand and avoid excessive
investment in these assets on the other hand. This means efficient and effective
management of working capital will ensure that unnecessary cash and other
currents assets are not tied up, nor inability to meet short-term obligations when
© University of Cape Coast https://erl.ucc.edu.gh/jspui
Digitized by Sam Jonah Library

5
they fall due. There is the need for corporate finance managers to maintain the
right amount of current assets as well as current liabilities.
The components of working capital are inventory, account receivable,
marketable securities and cash on one hand and account payable and other short
term obligations on the other hand. These components account for a substantial
investment of a firm’s asset and financial structure. Kieschnicks, Laplante and
Moussawi (2013) note that the median percentage of total asset accounted for
by either operating working capital (accounts receivable plus inventories) or net
operating working capital (accounts receivable plus inventories minus accounts
payable) was 37.6% and 27.7% respectively and stressed the importance of
working capital management for a firm’s performance since they account for a
substantial portion of their assets. Pandey (2010) is of the view that the
consideration of the level of investment in current assets should avoid two
danger points- excessive and inadequate investment in current assets. Pandey
stressed that investment in current assets should just be adequate, not more, not
less to the needs of the business firm. In this regard, when a firm has excessive
investment in current asset, it reduces its profitability because idle investment
earns no return. On the other hand, inadequate investment in current asset will
increase profitability but increases the firm’s liquidity risk as well. In the same
line of thought, Van Horne and Wachowicz (2009) postulate that excessive
levels of current assets may have a negative effect on the firm’s profitability and
hence firm’s value, whereas a low level of current assets may lead to a lower
level of liquidity and stock-outs, resulting in difficulties in maintaining smooth
operations.
© University of Cape Coast https://erl.ucc.edu.gh/jspui
Digitized by Sam Jonah Library
6
Shin and Soenen (1998) posit that efficient working capital management
is an integral part of the overall corporate strategy to create shareholder value.
Thus, shareholder value can be created if corporate financial managers
efficiently manage the short-term assets and liabilities by adopting appropriate
working capital management policies. Working capital management policies
are guidelines that are helpful to direct businesses; the policies aim to manage
the current assets, generally cash and cash equivalents, inventories and debtors,
and to manage the short-term financing so that the cash flows and returns are
acceptable (Kumar, 2010 as cited in Padachi et al., 2012). In order to deal with
the twin problem of risk and reward, firms need to adopt an appropriate working
capital management policy.
Alternative Policies for Managing Working Capital
Studies such as (Nazir & Afza, 2009; Salawu, 2007; Weinraub &
Visscher, 1998) suggest that the concept of working capital management policy
is based on a firm’s current assets investing and financing decisions. Current
assets investing decisions can be approached in three ways, such as
conservative, moderate and aggressive current assets investing policies. On the
other hand, current assets financing decisions can also be conservative,
moderate (hedging or matching) and aggressive current assets financing
policies. In the views of Weinraub and Visscher (1998), the use of conservative
and aggressive are relative terms, which indicate the extent to which the total
current assets and total current liabilities are being applied to acquire a portion
of total assets of a firm. According to Jose, Lancaster and Stevens (1996), a
company can use Cash Conversion Cycle (CCC) as a comprehensive measure
of its working capital management, where a shorter cash conversion cycle
© University of Cape Coast https://erl.ucc.edu.gh/jspui
Digitized by Sam Jonah Library

7
means an aggressive working capital management policy. This means minimum
investment in current assets (inventory and account receivables) as well as high
proportion of trade payables while a longer cash conversion cycle suggests
conservative working capital management policy indicating a high proportion
in stock of inventory and trade receivable whereas less delay in paying trade
payables.
Firms can choose one of the three main strategies of working capital
management regarding their relative benefits. A company is categorized as
having a conservative working capital management policy if it has high
proportion of its total asset as current asset and low proportion of its current
liability relative to its total capital. On the other hand, an aggressive working
capital management policy is where a company has low proportion of its current
asset as a percentage of its total asset and high proportion of its current liability
relative to its total capital. Therefore, more aggressive working capital
management policies are associated with higher return and higher risk while
conservative working capital management policies are concerned with the lower
risk and return (Carpenter & Johnson, 1983; Gardner, Mills, & Pope, 1986;
Weinraub &Visscher, 1998).
Statement of the Problem
Working capital management has become a major issue following the
2007-2009 financial crises that hit the world economy. A research conducted by
CFO magazine in 2010 to find out the impact that the recession had on the
working capital management revealed that, in Europe, effective management of
working capital has assumed greater urgency as market demand was slow to
© University of Cape Coast https://erl.ucc.edu.gh/jspui
Digitized by Sam Jonah Library

8
return and short-term credit remained both difficult to access and expensive.
Similarly, in US finance executives are taking much more conservative
approaches to managing working capital. According to Ernst & Young’s
working capital management report (2013), a high level comparative analysis
indicates that the leading 2,000 U.S and Europeans companies still have up to
US$1.3 trillion of cash unnecessarily tied up. This amount is equivalent to
nearly 7% of their combined sales. Van Horne and Wachowicz (2009) posit that
the management of working capital is important for several reasons. For one
thing, the current assets of a typical manufacturing firm account for over half of
its total assets and even more for a distribution company. Watson and Head
(2007) opine that, profitability is related to the goal of shareholder wealth
maximization, so investment in current assets should be made only if an
acceptable return is obtained.
In an emerging economy like Ghana, efficient management of working
capital cannot be over-emphasized. For example, the percentage of total current
asset to total assets for Sam Woode Limited, a listed manufacturing firm in 2009
was 93% (2009 Annual Report). Similarly, the percentages of total current
liabilities to total assets for Pioneer Kitchenware Limited, also a listed
manufacturing firm in Ghana in 2011 and 2012 were 108% and 139%
respectively (2012 Annual Report). A study conducted by Eleke-Aboagye
(2014) in 2001 to compare key financial ratios that relate to working capital
management of two firms within the food and beverages listed companies in
Ghana revealed that, some differences exist among the way they manage their
working capital. Majority of listed manufacturing firms in Ghana have exhibited
dwindling returns as well as poor stock performance in the last few years.
© University of Cape Coast https://erl.ucc.edu.gh/jspui
Digitized by Sam Jonah Library

9
On September 6, 2013, African Champion Industries Ltd, one of the
listed manufacturing companies in Ghana closed down its manufacturing line
as a result of persistent losses the company has been battling with over the years
and consequently disposed of its assets (2013 company’s annual report).
According to Deloof (2003), the way in which a firm manages its working
capital can have significant effect on its profitability and consequently its value.
Can this development be attributed to the way in which working capital is being
managed? There are inconclusive results with regard to working capital
management policy and profitability as well as shareholder value creation.
In Ghana, it is also evident that in the manufacturing sector, the issue of
working capital management policies and profitability as well as shareholder
value has been significantly under-researched although this is not the case in
other countries. Studies on the working capital management and profitability in
Ghana mainly concentrated on the relationship between the working capital
management components (inventory conversion days, account receivable days,
account payable days and CCC) and firm’s performance (Agyemang & Asiedu,
2013; Akoto, Awunyo-Vitor, & Angmor 2013; Korankye & Adarquah, 2013)
without looking at the specific policies being pursued and their effects on firms’
return and value. Furthermore, available empirical evidence suggests that earlier
studies on the subject employed static Ordinary Least Squares (OLS)
regressions without checking for stationarity or cointegration in their data series
(see for example, Al-Shubiri, 2011; Deloof, 2003; Eljelly, 2004; Mohamad &
Saad, 2010; Nazir & Afza, 2009; Shin & Soenen, 1998, etc.). Hence, the results
obtained may be biased or spurious.
© University of Cape Coast https://erl.ucc.edu.gh/jspui
Digitized by Sam Jonah Library

10
Several authors have identified theoretical drivers that are likely to affect
shareholder value creation, namely: sales growth rates, operating profit margin,
income tax rate, working capital investment, fixed capital investments, costs of
capital, and period of competitive advantage (Black, Wright, Bachman &
Davies, 1998; Rappaport, 1986). In the finance literature, studies empirically
testing the other drivers of shareholder value creation abounds with the
exception of working capital management practices (see for example Atiyet,
2012; Naccur & Goaied, 1999; Pandey, 2005).
Even though, a lot of academicians and practitioners have argued that
efficient working capital management leads to profitability and an increase in
firm’s value and consequently shareholder value creation (Deloof, 2003;
Eljelly, 2004; Gitman & Zutter, 2012; Kieschnick et al., 2013; Shin & Shoenen,
1998; Smith, 1980), not much empirical work have been undertaken in this
regard. As submitted by Baños-Caballero, García-Teruel, and Martínez-Solano
(2014), it is generally accepted that working capital management affects firm’s
value, there are scarce empirical evidence on the valuation effects of investment
in working capital, hence creating a gap.
Additionally, previous empirical studies had focused on industrial level
characteristics (Afza & Nazir, 2008; Filbeck & Kruenger, 2005; Salawu, 2007;
Weinraub & Visscher, 1998). This is due to the fact that there are differences in
industry setting. However, firms within the same industry may also have
differences due to firm specific characteristics which might drive its working
capital policy (Akinlo, 2012) as well as individual financial manager’s risk
preferences. A financial manager with a high appetite for risk and return would
prefer aggressive policy. On the other hand, a risk averse manager would take
© University of Cape Coast https://erl.ucc.edu.gh/jspui
Digitized by Sam Jonah Library

11
conservative approach with low risk and profitability. It is for these reasons that
this study was undertaken to investigate whether there are differences in the
working capital management policies being pursued by the selected listed
manufacturing firms and their effects on shareholders’ value creation.
Purpose of the Study
The purpose of the study was to determine the effects of working capital
management policies on shareholders’ value of the manufacturing firms listed
on the Ghana Stock Exchange.
Research Objectives
The objectives of the study were to:
1. Determine if differences exist among the firms with regard to their
current asset investment and financing policies.
2. Determine the effect of aggressive/conservative current assets
investment policy on shareholder value of manufacturing firms listed on
the Ghana Stock Exchange.
3. Determine the effect of aggressive/conservative current assets financing
policy on shareholder value of manufacturing firms listed on the Ghana
Stock Exchange.
Research hypotheses
The following hypotheses were tested in the study.
© University of Cape Coast https://erl.ucc.edu.gh/jspui
Digitized by Sam Jonah Library

12
1. H01: There are no differences in the current asset investment and
financing policies amongst the manufacturing firms listed on the Ghana
Stock Exchange.
2. H02: Aggressive/conservative current assets investment policies have no
significant effects on shareholder value of the manufacturing firms listed
on the Ghana Stock Exchange.
3. H03: Aggressive/conservative current assets financing policies have no
significant effects on shareholder value of the manufacturing firms listed
on the Ghana Stock Exchange.
An alpha level of .05 was used for all statistical tests.
Significance of the Study
The outcome of the study would;
Help finance managers of the sampled firms to know the industry’s working
capital management policy benchmark when setting their individual working
capital management policies as there is currently no known benchmark as far as
working capital management policy is concerned in Ghana.
Help financial managers of the manufacturing firms in Ghana to make
informed decisions with regard to working capital management.
Benefit existing and potential investors of the study firms greatly by
highlighting on the impact working capital management decisions have on their
wealth creation.
Contribute to the literature on working capital management in
manufacturing companies in Ghana in particular and the extant finance
literature generally, on the effects working capital management policies have
© University of Cape Coast https://erl.ucc.edu.gh/jspui
Digitized by Sam Jonah Library

13
on shareholder value creation using recently developed econometrics
methodology.
Delimitations
The study was restricted to only manufacturing firms listed on the Ghana
Stock Exchange (GSE) from 2000 to 2013. Non listed manufacturing firms as
well as other listed firms were not considered. Additionally, the study
population consisted of only six manufacturing firms that reported positive
equity in their statement of financial positions over the study period out of the
total of the 12 manufacturing firms listed on the bourse. Firms listed on the GSE
as at the end of 2013 but were not listed on or before the year 2000 were not
considered for the study. Thus, the findings may not be generalized to all the
manufacturing firms listed on the GSE. Other delimitations of the study were
non-inclusion of other variables, for example, asset tangibility, sales growth,
profitability, level of economic growth etc. which may have effect on the
shareholder value.
Limitation of the Study
The study covers a very small number of firms thereby placing a
limitation on the findings, results, interpretation and generalization of the
findings. Quantitative research design normally requires data disaggregation in
order to replicate the study for the subsamples. The number of observations
required for a reliable estimate for each subsample should be relatively
sufficient. However, this is not the case with the present study. Thus, the
statistical power of the subsamples is limited. Although published financial
© University of Cape Coast https://erl.ucc.edu.gh/jspui
Digitized by Sam Jonah Library

14
statements were subjected to independent verification, they may still be subject
to manipulation to meet industry specific and accounting reporting
requirements.
Organization of the Study
The thesis has been organized into five chapters. The first chapter discusses the
background to the study, the statement of the problem, the purpose of study, the
objectives, hypotheses tested by the researcher, significance of the study, the
delimitations as well as limitations of the study. Chapter two discusses the
relevant literature related to the study. It begins with an overview and concept
of working capital management and also discusses the theories that underpin the
study. Theoretical and previous empirical literature of other authors are also
reviewed. Chapter three deals with the methodology and procedure adopted in
carrying out the study. The data is analyzed and the findings and discussion
presented in chapter four. The final chapter recapitulates the results and draws
conclusion. Recommendations made for policy making and future research are
also presented in this chapter.
© University of Cape Coast https://erl.ucc.edu.gh/jspui
Digitized by Sam Jonah Library

15
CHAPTER TWO
LITERATURE REVIEW
Introduction
This chapter discusses the theoretical foundations that underpin the
study and review of relevant empirical literature that are in line with the study.
It highlights on the overview and concepts of working capital management. The
chapter also discusses the theories that were considered in the study as well as
the conceptual framework. It also reviews previous empirical works that are
relevant to the current study. These empirical studies are discussed under
relative relationship between aggressive/conservative working capital
management policies of firms, working capital management policies and firm’s
profitability, working capital management policies and shareholder value
creation and finally, working capital management and cointegration.
Overview of Working Capital Management
Working Capital Management is the administration of the firm’s current
assets and the financing needed to support current assets (Van Horne &
Wachowicz, 2009). Van Horne and Wachowicz argued that for a sound working
capital management, a firm need to determine the optimal level of investment
in current assets and the appropriate mix of short-term financing used to support
this investment in current assets. Thus, working capital management decisions
involve how to optimize investment in current assets and how to finance these
current assets.
© University of Cape Coast https://erl.ucc.edu.gh/jspui
Digitized by Sam Jonah Library

16
Concept of Working Capital
Srivastava and Misra (2008) argue that the concept of working capital is
perhaps, one of the most misunderstood issues in the finance literature as it is
subject to multiple interpretations. There are basically two main concepts of
working capital (Pandey, 2010). Working capital can be viewed from the
accountant point of view or from the finance manager’s perspective. Based on
these two point of views, working capital concepts are gross working capital
and net working capital. Gross working capital is the firm’s investment in
current assets like cash and marketable securities, trade receivables and
inventory (Van Horne & Wachowicz, 2009). The gross working capital is
referred to as finance manager’s concept of working capital (Srivastava &
Misra, 2008). Net working capital also referred to as accountant’s concept of
working capital (Srivastava & Misra, 2008), on the other hand, is the difference
between the current assets and the current liabilities and it denotes the portion
of current assets which is financed by long-term sources of financing. The gross
working capital concept focuses attention on optimization of investment in
current assets, and effective and economical financing of current assets (Pandey,
2010). This study focuses on the finance manager’s concept of working capital
management by looking at the policies adopted by firms in making investment
in current assets as well as the policies use in financing these current assets.
Theoretical Foundation of the Study
Working capital management is a concept that is gaining much attention all over
the world especially with the current financial situations and the state of the
world economy. However, there are no robust and widely accepted theories
© University of Cape Coast https://erl.ucc.edu.gh/jspui
Digitized by Sam Jonah Library

17
about working capital management (Palombini & Nakamura, 2012).
Nevertheless, several finance and economics theories that apply to long-term
investments and financing decisions can be used to explain the relationship
between working capital management practices and corporate profitability as
well as shareholder value creation. The study considers three of such theories
namely: Fisher Separation Theory, Profitability Liquidity Trade-off Theory and
Pecking Order Theory.
Fisher Separation Theory
The Fisher Separation Theory states that a firm’s investment decision
and financing decision should be made independently of its shareholders’
financial decisions without compromising their wealth, providing that returns
on investment at least equal the shareholder opportunity cost of capital.
Although, these decisions themselves are inseparable. According to McLaney
(2009), this proposition was first identified by Irving Fisher in the 1930s and
was formally set out by Hirshleifer (1958). What this implies in theory is that a
firm should be able to distinguish between decisions relating to an investment
and those relating to financing the investment opportunities. Fisher’s separation
theory has to do with working capital because a firm should always separate
how much they invest in working capital versus how they will finance the
working capital.
Profitability-Liquidity Trade-off Theory
The trade-off theory postulates that firms decide their optimal level of
working capital by considering the marginal costs and benefits of investment in
© University of Cape Coast https://erl.ucc.edu.gh/jspui
Digitized by Sam Jonah Library

18
current assets. Each component of working capital has its own costs and benefits
(Wasiuzzaman & Arumugam, 2013). Additional investment in inventory,
granting of trade credits to customers and holding cash is expected to have
positive effect especially for firms with low level of current assets (Aktas, Croci,
& Petmezas, 2015). Thus, larger inventories can reduce supply costs and price
fluctuations, prevent interruption in the production process, loss of business as
a result of unavailability of products and high production costs, allows firms
better service for their customers, minimize loss of sales due to potential stock-
outs, and achieves economies of scale by running large batch sizes (Blinder &
Maccini, 1991; Corsten & Gruen, 2004; Fazzari & Petersen, 1993; Schiff &
Lieber, 1974). Granting trade credit to customers among others also increase
firm’s sale as it can be used as a price discrimination, entice customers to
acquire merchandise in periods of low demand, allows customers to verify
products quality, and foster long-term buyer-seller relationships (Brennan,
Maksimovic, & Zechner, 1988; Long, Malitz, & Ravid 1993; Wilner, 2000).
Similarly, cash holdings reduce the likelihood of financial distress as it acts as
a buffer which permits firms to avoid the costs of raising external funds or
liquidating existing assets and which allows firms to finance their growth
opportunities, allow the pursuance of the optimal investment policy even when
financial constraints are met (Ferreira & Vilela, 2004; Ogundipe, Ogundipe, &
Ajao, 2012). Additionally, compensating cash balances can reduce financing
cost, and adequate cash stocks allow firms to take advantage of discounts for
prompt payment which often can result in high rate of return (Fazzari &
Petersen, 1993).
© University of Cape Coast https://erl.ucc.edu.gh/jspui
Digitized by Sam Jonah Library

19
However, there are also possible adverse effects of investment in current
assets which may lead to a negative impact on shareholders’ value (Aktas et al.,
2015; Baños-Caballero et al. 2014). This is because increasing the investment
in current assets involves financing and opportunity cost, firms that hold high
working capital potentially face high interest expenses and bankruptcy risk as
well as cash tied up in working capital might also prevent firms from
undertaking value-enhancing investment projects in the short-run (Aktas et al.,
2015; Baños-Caballero et al., 2014; Deloof, 2003; Ek & Guerin, 2011;
Kieschnick et al. 2013). According to Ogundipe et al. (2012), if managers
decide to make decisions that are in line with shareholders’ interest, then the
only cost for holding cash is the lower return that are earned by shareholders
relative to other investments with the same risk.
Aminu and Zainudin (2015) stressed that one of the cardinal decisions
regarding working capital management is the trade-off between liquidity and
profitability. As firms adopt conservative approach to the management of their
working capital by way of increasing the investment in current assets, the
liquidity improves at the expense of its profitability and vice versa. Thus, more
aggressive working capital management policies are associated with higher
return and risk while conservative working capital management policies are
associated with lower return and risk (Carpenter & Johnson, 1983; Gardner et
al., 1986; Weinraub & Visscher, 1998).
Pecking Order Theory
The pecking order theory (Myers & Majluf, 1984) has been applied to
explain financial managers’ financing preferences. The pecking order theory
© University of Cape Coast https://erl.ucc.edu.gh/jspui
Digitized by Sam Jonah Library

20
postulates that firms finance their investments first with retained earnings, then
with safe debt and risky debt, and finally with equity. Padachi et al. (2012) argue
that this hierarchical ranking is due to the fact that the relationship between the
financier and the financial manager is characterized by information asymmetry.
Ferreira and Vilela (2004) suggest that the purpose of this order of financing is
to minimize asymmetric information cost and other financing cost. According
to Palombini and Nakamura (2012) companies choose conservative working
capital financing policy in order to have easy access to the debt market and lead
potential investors to see them as a safe investment. On the other hand,
Palombini and Nakamura contend that managers of both less and highly
profitable firms might adopt an aggressive working capital policy, pressuring
for lower levels of current assets and higher levels of financing from suppliers,
resorting to internal sources for the necessary funds to finance their companies
and to avoid issuing long term debt and equity.
The implication of the pecking order theory to the financing of working
capital is that firms consider spontaneous liabilities (trade payables and
accruals) and other short term debts as safe financing option and would choose
a high proportion of current liabilities relative to long term debt and equity when
internal funds have been exhausted. According to Van Horne and Wachowicz
(2009) insofar as the explicit cost of short-term financing are lower than the
medium and long-term sources of financing, an aggressive financing strategy
will ensure profitability and shareholder value.
© University of Cape Coast https://erl.ucc.edu.gh/jspui
Digitized by Sam Jonah Library
21
Main Theme of the Theory of Working Capital Management
The main theme of the theory of working capital management is the interaction
between current assets and current liabilities (Pandey, 2010). This section
briefly reviews these interactions by looking at the current assets investment
and financing policies of firms.
Current Assets Investment Policies
Long-term investment and financing decisions generate future cash
flows which when discounted by an appropriate cost of capital determine the
firm’s value. Similarly, investment in current assets should only be made if the
required return will be lower than the expected returns (Watson & Head, 2007).
However, unlike the long-term investment which generates cash inflows over a
long periods of time, current assets have cash-to-cash conversion cycle of less
than one year (Cheatham, 1989 as cited in McInnes, 2000). The finance manager
must therefore determine the optimum level of current assets so that the wealth
of shareholders is maximized. In determining the appropriate level of current
assets finance managers must take into consideration the trade-off between the
cost of liquidity and the cost of being illiquid (McLaney, 2009; Srivastava &
Misra, 2008).
A firm need both non-current and current assets to support a particular
level of output or sales. However, to support the same level of output or sales
the firm can have a different level (policies) of current assets (Pandey, 2010;
Van Horne & Wachowicz, 2009). A firm should have working capital policies
on the management of inventory, trade receivables, cash and short-term
investments in order to minimize the possibility of managers making decisions
© University of Cape Coast https://erl.ucc.edu.gh/jspui
Digitized by Sam Jonah Library

22
which are not in the best interests of the firm (Watson & Head, 2007). The level
of current assets (policies) can be measured by relating total current assets to
total assets (Gitman & Zutter, 2012; Nazir & Afza, 2009; Salawu, 2007;
Weinraub & Visscher, 1998). Assuming a constant level of total assets and
dividing total current assets by total assets (TCA/TA), three alternative current
asset policies can be identified. A relatively higher TCA/TA ratio (i.e. greater
than 50%) indicates a conservative current assets policy and a lower TCA/TA
ratio (i.e. less than 50%) means an aggressive current asset policy holding other
factors constant. A conservative policy suggests relatively large amounts of
cash and marketable securities and inventories are carried and sales are
stimulated by a liberal credit policy that results in a high level of receivables
(Brigham & Houston, 2009). Thus, this policy implies greater liquidity and
lower return. Figure 1 depicts these three alternative current asset policies.
Figure 1: Alternative current asset investment policies.
Adapted from Brigham & Houston, 2009
C
UR
RE
NT
A
SS
ET
S
TOTAL ASSETS
Conservative Policy
Moderate Policy
Aggressive Policy
© University of Cape Coast https://erl.ucc.edu.gh/jspui
Digitized by Sam Jonah Library

23
The aggressive or restricted current asset investment policy implies low level of
cash and marketable securities, trade receivables, and inventories (Van Horne
& Wachowicz, 2009; Brigham & Houston, 2009). In between the conservative
and aggressive investment policies is moderate investment policies. The current
asset policy of most firms may fall between these two extreme policies (Pandey,
2010).
Permanent and Temporary Current Assets
The current assets can be classified as permanent or fixed current assets
and temporary or fluctuating current assets based on the variability of needs.
Permanent or fixed current assets are those current assets held by a firm to meet
its long term requirement (Pike & Neale, 2009). Figure 2 illustrates permanent
and temporary current asset level.
Figure 2: Permanent and temporary current asset levels.
Adapted from Brigham & Houston, 2009; Pike & Neale, 2009
TIME
Temporary/Fluctuating Current Assets
Permanent Current Assets
C
UR
RE
NT
A
SS
ET
S
© University of Cape Coast https://erl.ucc.edu.gh/jspui
Digitized by Sam Jonah Library

24
It is the minimum level of inventories, account receivables, cash and cash
equivalent which is always maintained even when sales are reduced to minimum
(Brigham & Houston, 2009). It is permanent in the same way as the firm’s non-
current assets are (Pandey, 2010). Temporary or fluctuating current assets are
those current assets that change with seasonal or cyclical variations (Pike &
Neale, 2009). Depending upon the changes in production and sales, the need for
working capital, over and above permanent working capital, will fluctuate. For
example, extra inventory of finished goods will have to be maintained to support
the peak periods of sale, and investment in receivable may also increase during
such periods. On the other hand, investment in raw material, work-in-progress
and finished goods will fall if the market is slack (Pandey, 2010).
Sources of Current Assets Financing
Generally, a firm may finance its investment in current assets from
short-term and long-term sources. Each source may have its benefits and
limitations.
Long-term Financing: The source of long-term funding includes ordinary share
capital, income surplus, capital surplus, reserves, preference share capital,
debentures, medium and long-term loans.
Short-term Financing: The short-term funding is taken for a time less than one
year. Short-term financing can be divided into spontaneous short-term financing
and other short-term or non-spontaneous financing.
Spontaneous Financing: Spontaneous financing refers to the short-term
financing arising from the firm’s day to day operations. Trade payables and
outstanding expenditures are examples of spontaneous financing. Although,
© University of Cape Coast https://erl.ucc.edu.gh/jspui
Digitized by Sam Jonah Library

25
spontaneous liabilities do not have an explicit cost, they do have an implicit cost
(Gitman & Zutter, 2012; Pandey, 2010) where especially cash discount is
offered. A firm is likely to make use of these sources of financing to the fullest
level. The usual option of financing current assets, once the spontaneous means
of financing have been entirely used, is between the other short-term and long-
term sources of funding (Pandey, 2010).
Other Short-term Financing: This normally arises from an arrangement
a firm makes with its bankers and other financiers. Short-term sources include
short-term bank loan, overdraft, commercial papers, factoring of accounts
receivables, lines of credit etc.
Policies for Financing Current Assets
The policies for financing current assets can be categorized as Moderate,
Aggressive or Conservative current assets financing policies.
Moderate (Hedging/Maturity Matching) Approach: If a firm adopts a moderate
approach to financing, each asset would be offset with a financing instrument
of the same approximate maturity (Van Horne & Wachowicz, 2009). Thus, a
long-term loan of, say 10 years, may be raised to finance a property, plant and
equipment with an anticipated life of 10 years. On the other hand, current asset
to be sold during a short period may be financed with a short-term source like
commercial paper or a bank borrowing (Brigham & Houston, 2009). When a
firm adopts maturity matching approach also known as hedging approach, long-
term finance will be used to finance non-current assets and permanent current
assets while fluctuating or temporary current asset needs would be financed with
short-term debts.
© University of Cape Coast https://erl.ucc.edu.gh/jspui
Digitized by Sam Jonah Library

26
Figure 3: Moderate current asset financing policy.
Adapted from Brigham & Houston, 2009
The reason for the exact matching is that, because the rationale of
financing is to pay for assets, the method of funding and the asset should be
relinquished at the same time (Pandey, 2010). Utilizing short-term funding for
long-term assets will not only be expensive but also may cause inconveniencies
as short-term sources must regularly be sought. Moreover, if long-term debt is
used to finance short-term needs, the firm will be paying interest for the use of
funds during times when these funds are not needed (Van Horne & Wachowicz,
2009). Figure 3 illustrates moderate current asset financing policy.
Conservative Financing Policy
A company in practice may apply a conservative approach in financing its
current and non-current assets. The financing policy of the firm is said to be
conservative when it relies more on long-term sources for current assets
requirement. Under a conservative approach, the firm finances its non-current
Non-current Assets
Temporary Current Assets
Permanent Current Assets Long-term
Debt plus
Equity
Capital
Short-term
Financing
TIME
T
OT
AL
A
SS
ET
S
© University of Cape Coast https://erl.ucc.edu.gh/jspui
Digitized by Sam Jonah Library

27
T
OT
AL
A
SS
ET
S
and permanent current assets as well as part of its temporary current assets with
long-term funds. Thus, the firm uses a small amount of short-term credit to meet
its peak requirements, but also meets part of its seasonal needs by investment in
marketable securities (Brigham & Houston, 2009; Pandey, 2010). Nazir and
Afza (2009) opine that this current asset financing policy indicates less current
liabilities as a proportion to the total assets of the firm. The conservative policy
depends a lot on long-term finance and is relatively safe. Figure 4 illustrates the
conservative current assets financing policy.
Figure 4: Relative conservative current asset financing policy.
Adapted from Brigham & Houston, 2009
Aggressive Financing Policy
A firm is said to be following an aggressive current asset financing
policy when it finances all its fluctuating or temporary current asset, permanent
current asset and some non-current asset with short-term debt (Nazir & Afza,
2009). When a greater proportion of the permanent asset needs of a firm is
Permanent Current Assets
Non-Current Assets
TIME
Short-term
Financing
Long-term
Debt plus
Equity
Capital
Temporary Current Assets
© University of Cape Coast https://erl.ucc.edu.gh/jspui
Digitized by Sam Jonah Library

28
financed with short-term debt, the firm is seen to be more aggressive in
financing its current assets (Van Horne & Wachowicz, 2009). To some extent,
exceptionally aggressive firms may still finance part of their non-current assets
with short-term funds (Brigham & Houston, 2009). More utilization of short-
term funds puts the firm into severe risk zone. Figure 5 illustrates an aggressive
current asset financing policy.
Figure 5: Relative aggressive current asset financing policy.
Adapted from Brigham & Houston, 2009
Overall Working Capital Management Policy
Working capital management policies are guidelines aimed to manage
the current assets, generally cash and cash equivalents, inventories and trade
receivables, and to manage the short-term financing so that the cash flows and
returns are acceptable (Kumar, 2010 as cited in Padachi et al., 2012).
In determining the appropriate level and mix of the investment in current
assets and the financing of the current assets, a firm may adopt conservative,
TIME
Permanent Current Assets
Non-Current Assets
Short-term
Financing
Long-term
Debt plus
Equity
Capital
Temporary Current Assets
T
OT
AL
A
SS
ET
S
© University of Cape Coast https://erl.ucc.edu.gh/jspui
Digitized by Sam Jonah Library
29
aggressive or moderate approaches as its overall working capital management
policy. The conservative approach to managing working capital is characterized
by the management of large amounts of inventories, accounts receivable, cash,
marketable securities, and uses long-term capital to finance all non-current
assets and permanent current asset requirements. Thus, the firm carries a high
proportion of current assets relative to total asset with a high percentage of long-
term funds relative to total asset. Nazir and Afza (2009) postulate that
conservative working capital management policy is the use of more current
assets as a proportion to total asset or the use of less current liabilities as a
proportion to total capital.
The aggressive approach to managing working capital management on
the other hand carries smaller holdings of inventories, accounts receivable, cash,
marketable securities, and uses short-term capital to finance all non-current
assets and permanent current asset requirements. Thus, an aggressive working
capital management policy is the use by firms of less current asset relative to
total asset or higher proportion of current liabilities relative to total capital
(Nazir & Afza, 2009).
The moderate approach lies between the aggressive and conservative
approaches where temporary current assets are financed with short-term loans,
while noncurrent assets and the permanent level of current assets are financed
with long-term loans (Brigham & Ehrhardt, 2011; Brigham & Houston, 2009;
Gitman & Zutter, 2012; Mclaney, 2009; Pike & Neale, 2009).
Using the CCC as an integrated approach to the management of working
capital (Jose et al., 1996; Deloof, 2003), a firm adopting a conservative policy,
the CCC may be allowed to increase by means of increasing the investment in
© University of Cape Coast https://erl.ucc.edu.gh/jspui
Digitized by Sam Jonah Library

30
inventories, trade receivables and reducing the amount of trade payables. On the
other hand, an aggressive policy may mean that trade payables would be
stretched as a source of finance while investments in inventory and trade
receivables are decreased.
Empirical Literature Review
Relative Relationship of Working Capital Management Policies of Firms
In corporate finance literature, most of the studies are conducted around
the relationship between working capital management and corporate
profitability. Many researchers have studied financial ratios as a part of working
capital management; however, very few of them have discussed the working
capital policies specifically (Nazir & Afza, 2009). Pandey and Perera (1997),
provided an empirical evidence of working capital management policies and
practices of the private sector manufacturing companies in Sri Lanka. The
required data for the study were obtained through interviews and questionnaires
with chief financial officers of a sample of manufacturing companies listed on
the Colombo Stock Exchange. The authors found that most companies in Sri
Lanka had an informal working capital policy and company size had an
influence on the overall working capital policy and approach (conservative,
moderate or aggressive).
Koury, Smith and Mackay (1998) compared the working capital
management policies among Canada, the United States, and Australia and found
that 28.5 per cent of Canadian companies follow the conservative policies, while
only 10.2 per cent pursue aggressive policies.
© University of Cape Coast https://erl.ucc.edu.gh/jspui
Digitized by Sam Jonah Library

31
In a wider perspective, Weinraub and Visscher (1998) discussed the
issue of aggressive and conservative working capital management policies of
US firms by using quarterly data for the period 1984-1993. Their study
examined 10 diverse industry groups to analyze the relative relationship
between their aggressive/conservative working capital policies. The authors
concluded that the industries had distinctive and significantly different working
capital management policies. Moreover, the relative nature of the working
capital management policies exhibited a remarkable stability over the 10-year
study period. The study also showed a high and significant negative correlation
between industry asset and liability policies. It was found that when relatively
aggressive working capital asset policies are followed, they are balanced by
relatively conservative working capital financial policies.
Similarly, Filbeck and Krueger (2005) highlighted the importance of
efficient working capital management by analyzing the working capital
management policies of 32 non-financial industries in the US. Their findings
reveal that significant differences exist among industries in working capital
practices over time. Moreover, these practices, themselves, change significantly
within industries over time.
In a regional study, Salawu (2007) investigated fifteen diverse industrial
groups over an extended period in order to establish a relationship between
aggressive and conservative working capital practices among firms listed on the
Nigeria Stock Exchange over the period 1994- 2003. The results of the study
strongly showed that firms in differing industries have significantly different
current asset management policies. The study also found a significant negative
correlation between industry asset and liability policies. The study indicated that
© University of Cape Coast https://erl.ucc.edu.gh/jspui
Digitized by Sam Jonah Library

32
relatively aggressive current asset management seems balanced by relatively
conservative working capital financial management. Thus, moderate working
capital management policies seem to be practiced in Nigeria.
Confirming the results of Salawu (2007), Afza and Nazir (2008)
investigated the relationship between the aggressive and conservative working
capital policies for 17 industrial groups of public entities listed at Karachi Stock
Exchange between the periods 1998-2003. Their study found significant
differences among working capital investment and financing policies across
different industries in Pakistan. They also found that these significant
differences were stable over the six-year period. However, their study further
indicated that firms that adopt aggressive investment working capital policies
simultaneously pursue aggressive working capital financing policies. This
suggests that firms in Pakistan are following aggressive working capital
management.
Contrary to this assertion, Sathyamoorthi and Wally-Dima (2008) found
that retail domestic companies that are listed on Botswana stock exchange
adopted a conservative approach in the management of working capital. Their
findings also suggest that the working capital is not static overtime but varies
with the changes in the state of economy. Whereas companies tend to adopt a
conservative approach in times of high volatility, they resort to an aggressive
approach in times of low volatility. Similarly, Raheman, Afza, Qayyum and
Bodla (2010) analyzed the impact of working capital management on firm’s
performance using a balanced panel of 204 manufacturing firms listed on the
Karachi Stock Exchange for the period 1998 to 2007. Their study concluded
© University of Cape Coast https://erl.ucc.edu.gh/jspui
Digitized by Sam Jonah Library

33
that firms in Pakistan are following conservative working capital management
policy.
On the other hand, Bhutto, Abbas, Rehman, and Shah (2011) conducted
a cross sectional study to investigate the relationship between the length of Cash
Conversion Cycle, firm size, firm profitability and aggressive/conservative
working capital policies of 157 public limited companies made up of 12
industrial groups that are listed in the Karachi Stock Exchange (KSE) for the
year 2009. Pearson correlation and Analysis of Variance (ANOVA) with post-
hoc test (Least Significant Differences) were used for the empirical
investigation. The authors found that significant differences lie among the mean
values of CCC across the industries and more specifically, the Oil and Gas
industry is significantly different from all the other industries in terms of its
length of CCC. Findings of the study show that there is a significant and positive
relationship between firms’ aggressive investing policies and conservative
financing policies. It is concluded that length of CCC has negative relationship
with sales revenue, return on equity (ROE) and financing policies of the firms
and has positive relationship with total assets, return on assets (ROA) and
investing policies.
Working Capital Management Policies and Firm’s Profitability
The review of empirical literature suggests mixed findings with regard
to the working capital management policies and profitability as well as
shareholder wealth. Some authors found that aggressive working capital
investment policies have positive relationship with profitability (Jose et al.
1996; Onwumere et al., 2012). Contrary, conservative working capital
© University of Cape Coast https://erl.ucc.edu.gh/jspui
Digitized by Sam Jonah Library

34
investment policies significantly enhance profitability and shareholder value
(Mohamad & Saad, 2010; Mwangi, Makau, & Kosimbei, 2014; Nazir & Afza,
2009; Raheman et al., 2010). On the financing of working capital, Al-Shubiri
(2011), Onwumere et al. (2012) and Mwangi et al. (2014) found that an
aggressive working capital financing policies better enhance profitability
whereas (Nazir & Afza, 2009; Raheman et al., 2010; Mohamad & Saad, 2010
concluded that conservative working capital financing policies increase
profitability and create shareholder value. Ogundipe, Idowu, and Ogundipe
(2012) as well as Pirashanthini, Tharmila, and Velnampy (2013) found no
significant relationship between working capital investment and financing
policies with profitability in Nigeria and Sri Lanka respectively. Bandara and
Weerakoon (2014) found that conservative working capital management
practice has significant negative impact on shareholder value while an
aggressive working capital management practices also significantly destroy
shareholder wealth.
Using the Cash Conversion Cycle (CCC) as a measure of working
capital management policy, where a shorter CCC represents the aggressiveness
of working capital management, Jose et al. (1996) examined the relationship
between profitability measures and management of ongoing liquidity needs for
a large cross-section of US firms over a twenty-year period. Using both
nonparametric and multiple regression analysis, the authors tested the long-run
equilibrium relationships between the cash conversion cycle and alternative
measures of profitability. Their results indicated a significant negative
relationship between the cash conversion cycle and profitability, indicating that
more aggressive working capital management is associated with higher
© University of Cape Coast https://erl.ucc.edu.gh/jspui
Digitized by Sam Jonah Library

35
profitability. Thus, shareholder value can be enhanced if firms adopt an
aggressive approach toward working capital management.
On the contrary, Nasir and Afza (2009) found out that managers can
create value if they adopt a conservative approach toward working capital
investment and working capital financing policies. They studied the traditional
relationship between working capital management policies and a firm’s
performance using a panel data set from the period 1998- 2005. The study
evaluated the impact of working capital investment and financing policies using
return on assets as well as Tobin’s Q while the ratio of total current asset to total
asset and total current liability to total asset ratio represented working capital
investment and financing policies respectively.
Raheman et al. (2010) analyzed the impact of working capital
management on firm’s performance for the period 1998 to 2007 using a
balanced panel data of 204 manufacturing firms listed on Karachi Stock
Exchange in Pakistan. Performance was measured as net operating profitability
while different measures of working capital management variables including
CCC, NTC, and Inventory Turnover in Days, Average Collection Period and
Average Payment Period were used. To check the working capital investment
policy and financing policy, the authors used current assets to total assets ratio
and current liabilities to total assets ratio in their regression. Their fixed effect
model results showed that CCC has significant negative effect on firm
performance. However, the ratio of total current assets to total assets (investing
policy) was found to have a significant positive relationship with the
profitability. On the other side total current liabilities to total assets ratio
(financing policy) also indicated a significant negative relationship with
© University of Cape Coast https://erl.ucc.edu.gh/jspui
Digitized by Sam Jonah Library

36
profitability. Based on their empirical findings, the authors concluded that firms
would be better if they finance the working capital by medium-term loans rather
than short-term loan in order to enhance their profitability.
Mohamad and Saad (2010) offered empirical evidence about working
capital management and its effect to the performance of Malaysian listed
companies by using secondary data of 172 listed firms for five-year period from
2003 to 2007. Employing linear multiple regression, they found that there are
significant negative associations between working capital variables (TCL/TA
and CCC) and firm’s financial performance (ROA, ROIC and Tobin’s Q),
whilst TCA/TA ratio showed a positive significant relationship with ROA,
ROIC and Tobin’s Q. Their study emphasized the importance of proper
management of working capital as it affects firm's market value and
profitability. They also suggested that working capital management should be
part of the company's strategic and operational processes in order to be
effective.
Al-Shubiri (2011) investigated the relationship between aggressive/
conservative working capital policies and profitability as well as risk for 59
industrial companies and 14 banks listed on the Amman Stock Exchange in
Jordan for a period of 2004-2008. Return on Asset (ROA) and Return on Equity
(ROE) as well as market value (Tobin’s Q) were used as dependent variables
while independent variable used were: Aggressive Investment Policy (AIP) and
Aggressive Financing Policy (AFP). The author found that aggressive
investment policy is negatively related to market value (Tobin’s Q) and
aggressive financing policy is positively related to Tobin’s Q.
© University of Cape Coast https://erl.ucc.edu.gh/jspui
Digitized by Sam Jonah Library

37
In Nigeria, Onwumere et al. (2012) investigated the impact of working
capital policies of Nigerian firms on profitability for the period, 2004-2008.
Adopting the aggressive investment working capital policies and aggressive
financing policies as independent variables and return on assets as dependent
variable and controlling for size and leverage, the study revealed that aggressive
investment working capital policies of Nigerian firms have a positive significant
impact on profitability while aggressive financing policies have a positive non-
significant impact on profitability. According to the authors the findings from
their study suggest that firms pursuing aggressive investment working capital
policy will become risky in the long-run because as profitability increases; the
firm grows and the amount of outsiders’ contributions also increases. The result
also indicates that as the firm grows and outsiders’ contribution increases; the
use of aggressive financing working capital policy decreases the profitability of
the firm. Appropriate management of working capital is therefore essential if
the firms are to achieve their objective of improved profitability and value
creation for shareholders.
In another related study, Vahid, Mohsen and Mohammadreza (2012)
conducted a study to investigate the impact of working capital management
policies (aggressive and conservative policies) on the firms’ profitability and
value. A sample of 28 Iranian Companies listed on Tehran Stock Exchange for
a period of 5 years from 2005 to 2009 were selected. The results showed that
following conservative investment policy by having high level of short-term
investment have negative effect on the firm’s profitability and value, while
following aggressive investment policy using long-term investment have
positive effect on the firm profitability and value. Regarding the financing
© University of Cape Coast https://erl.ucc.edu.gh/jspui
Digitized by Sam Jonah Library

38
Policies (aggressive and conservative policies), the results showed that
following aggressive financing policy by using more current liabilities to
finance firm activities will affect negatively the firm’s profitability and value,
while following conservative financing policy by using more long-term debt to
finance the firm operating activities have a positive effect on the firm
profitability and value. Finally, the authors found that firm size and firm growth
have positive impact on the firm’s profitability and value, while firm leverage
showed negative impact.
Furthermore, Ogundipe et al. (2012) examined the impact of working
capital management on firms’ performance and market value of the firms by
using a sample of 54 non-financial quoted firms on the Nigeria Stock Exchange
for the period 1995-2009. The variables used were cash conversion cycle,
current ratio, current asset to total asset ratio, current liabilities to total asset
ratio and debt ratio as independent variables while ROA, ROI and Tobin’s Q
represented firm’s performance and market valuation. Their result showed that
there is a significant negative relationship between cash conversion cycle and
market valuation and firm’s performance. It also showed that debt ratio is
positively related to market valuation and negatively related firm’s
performance. However, the multiple regression results showed that there was
no significant relationship between TCA/TA ratio and ROA, ROI and Tobin’s
Q. Based on their findings the authors concluded that firms should ensure
adequate management of working capital especially cash conversion cycle
components of account receivables, account payables and inventories, as
efficiency in working capital management is expected to contribute positively
to the firms’ market value.
© University of Cape Coast https://erl.ucc.edu.gh/jspui
Digitized by Sam Jonah Library

39
Niresh (2012) observed the relationship between working capital
management and financial performance of 30 manufacturing firms listed on the
Colombo Stock Exchange in Sri Lanka for the period of 2008 -2011. Using
return on assets and return on equity as a performance measure while cash
conversion cycle, current assets to total assets and current liabilities to total
assets were used as measures of working capital management. Employing
Pearson correlation and univariate regression analysis, the study revealed that,
there is no significant relationship between cash conversion cycle and
performance measures. To check the working capital investment and financing
policy, the author used Total Current Assets to Total Assets (TCA/TA) and
Total Current Liabilities to Total Assets (TCL/TA) in the regression. Firms’
working capital investment policy showed positive association with the
performance measures. On the other hand, working capital financing policy
showed negative relationship with ROA and positive relationship with ROE.
The study also concluded that, manufacturing firms in Sri Lanka follow
conservative working capital management policy.
Contrary to the findings of Niresh (2012), Pirashanthini et al. (2013)
found that there was no relationship between the profitability measures of firms
and working capital investment and financing policies. In addition, the working
capital aggressive investment and financing policies had no impact on
profitability measures of ROA and ROE. The authors conducted a study to find
out the relationship between the aggressive working capital policies and
profitability, and to identify the impact of working capital policies on
profitability with the samples of 20 manufacturing companies listed under
Colombo Stock Exchange (CSE). Data representing the period of 2008-2012
© University of Cape Coast https://erl.ucc.edu.gh/jspui
Digitized by Sam Jonah Library

40
were used for the survey. The authors employed correlation and regression
model to investigate the relationship among variables and impact of working
capital approaches on returns of firms.
More recently, Hassani and Tavosi (2014) investigated the relationship
between aggressive/ conservative working capital policies and profitability risk
in the Tehran Stock Exchange for a sample of 274 listed companies for the
period 2006-2012. Their empirical results in all industries indicated a negative
relationship between working capital investment policy and profitability risk
measures. They also found a positive relationship between working capital
financing policy and profitability measures.
Osundina and Osundina (2014) examined the effect of working capital
management on market value of quoted food and beverages manufacturing
firms in Nigeria. Working capital management was proxied by Account
Collection Period (ACP), Inventory Conversion Period (ICP), Account Payment
Period (APP), Cash Conversion Cycle (CCC) and Aggressive Investment Policy
(AIP) while market value was proxy by Tobin’s Q. Survey research design was
employed using primary data. Pearson Product Moment Correlation and
multiple regression analysis were used to determine the effect. The study found
out that working capital management had significant positive effect on market
value of food and beverages manufacturing firms in Nigeria. Also, their study
revealed that Cash Conversion Cycle, Account Collection Period, Inventory
Conversion Period, Account Payment Period, and Aggressive Investment
Policy had significant effect on market value of food and beverages
manufacturing firms in Nigeria.
© University of Cape Coast https://erl.ucc.edu.gh/jspui
Digitized by Sam Jonah Library
41
The study by Khajehpour, Khodamipour and Sadeghi (2014) analyzed
the impact of aggressive working capital management policy on profitability of
71 nonfinancial firms listed on Tehran Stock Exchange. Research hypotheses
were tested using multiple regression models in the form of panel data. The
result indicated that when more current assets fund working capital investment,
the profitability of the company increases. However, the authors found that the
relation between working capital financing policy ratio and return on assets ratio
was not statistically significant but increasing working capital financing policy
ratio will increase Tobin’s Q ratio (market value). Hence the authors asserted
that investors are found to be more disposed to firms that have an aggressive
approach to working capital financing because they feel the stock value of such
a firm is more rewarding in the market.
Javid and Zita (2014) also examined the relationship between working
capital management policy and firm’s profitability using 20 cement companies
listed in Karachi Stock Exchange during the period of 2006-2011 in Pakistan.
Profitability was measured in terms of market as well as in accounting terms.
The dependent variables were Tobin’s Q, return on equity (ROE), return on
asset (ROA) and net operating profitability (NOP) while Working capital policy
(TCA/TA and TCL/TA) represent the main independent variable and
controlling for growth of firm, size of firm and debt. Adopting ordinary least
square regression method, the result of the study showed that there is significant
negative relationship between working capital policies on profitability of the
firms.
Mwangi et al. (2014) investigated the effect of working capital
management on the performance of 42 non-financial companies listed in the
© University of Cape Coast https://erl.ucc.edu.gh/jspui
Digitized by Sam Jonah Library

42
Nairobi Securities Exchange (NSE), Kenya, for the period 2006-2012. The
study employed an explanatory non-experimental research design and panel
data models (random effects). Their Feasible Generalized Least Square (FGLS)
regression results revealed that an aggressive financing policy had a significant
positive effect on return on assets and return on equity while a conservative
investing policy was found to affect performance positively. The study
recommended that managers of listed non-financial companies should adopt an
aggressive financing policy and a conservative investing policy should be
employed to enhance the performance of non-financial companies listed in the
NSE, Kenya.
In Ghana, the researcher found scant empirical study linking working
capital management policies and firm’s profitability as well as shareholder
value. The study by Akoto et al. (2013) examined the relationship between
working capital management practices and profitability of listed manufacturing
firms in Ghana. The study used secondary data collected from all the 13 listed
manufacturing firms in Ghana covering the period from 2005-2009 in a panel
data framework methodology. Profitability of firms was measured as return on
equity (ROE). Using the Ordinary Least Square (OLS) regression technique, the
study found a significantly negative relationship between profitability and
accounts receivable days. However, the firms’ cash conversion cycle, current
asset ratio, size, and current asset turnover significantly positively influence
profitability. The study suggests that managers can create value for their
shareholders by creating incentives to reduce their accounts receivable to 30
days.
© University of Cape Coast https://erl.ucc.edu.gh/jspui
Digitized by Sam Jonah Library
43
Similarly, Korankye and Adarquah (2013) analyzed working capital
management and its impact on firm profitability of six out of seven traditional
manufacturing firms listed on the Ghana Stock Exchange from 2004 to 2011.
The study used working capital cycle and gross operating profit margin as
proxies for working capital management and profitability respectively, whiles
leverage, interest cover and the ratio of current assets to total assets were used
as control variables. By employing descriptive statistics, Pearson correlation
and ordinary least squares regression analyses, the results reveal that working
capital cycle significantly affects firm profitability negatively. From the
correlation analysis, the study also found that inventory turnover period,
account receivables collection period and account payables payment period
each negatively correlates with profitability. Finally, while leverage negatively
but significantly relates to profitability, interest cover and the ratio of current
asset to total assets have significantly positive relation with profitability.
Working Capital Management and Shareholder Value Creation
In the area of working capital management and shareholder value
creation the researcher found not much empirical studies. Most of these studies
analyzing the impact of corporate financial decisions on shareholder value
creation mainly concentrate on the long-term perspective (Atiyet, 2012; Naccur
& Goaied, 1999; Pandey, 2005).
Shin and Soenen (1998) highlighted that efficient working capital
management is very important for creating value for the shareholders. The way
working capital was managed had a significant impact on both profitability and
liquidity. The relationship between the length of net trading cycle, corporate
© University of Cape Coast https://erl.ucc.edu.gh/jspui
Digitized by Sam Jonah Library

44
profitability and risk adjusted stock return was examined by the authors using
correlation and regression analysis, by industry and capital intensity. The results
indicated that shorter net trade cycles were associated with higher risk adjusted
stock returns.
Similarly, Garcia-Teruel and Martinez-Solano (2007) studied the effects
of working capital management on the profitability of a sample of small and
medium-sized Spanish firms. They found that managers can create value by
reducing their inventories and the number of days for which their accounts are
outstanding.
In another study, Karadagli (2012), examines the impact of working
capital management on firm performance for a sample of 169 Turkish listed
companies for the period of 2002-2010 by using pooled panel analysis with
annual data. The dependent variable was stock return as a proxy for profitability
while independent variables were NTC and CCC. Firm size, financial leverage,
and GDP growth rate were used as control variables along with an industry
dummy. The findings indicated that CCC and NTC have positive relationship
at 1% significance levels on firm performance, as measured by stock market
returns for the whole sample. Thus, shareholder wealth can be enhanced if firms
adopt less restrictive policies in the management of inventories and account
receivables.
Much of the earlier studies concentrated on the components of working
capital management and value creation as well as profitability. However, the
study by Kieschnick et al. (2013) provided the first comprehensive study as far
as the relationship between working capital management and shareholder
wealth is concerned despite the fact that corporate financial executives consider
© University of Cape Coast https://erl.ucc.edu.gh/jspui
Digitized by Sam Jonah Library

45
net operating working capital management to be an important determinant of
firm value. Consequently, they provided the first such examination by
examining net working capital investments in a comprehensive sample of U.S.
corporations between 1990 through 2006. Based on their evidence the following
conclusions were drawn by the authors. First, for the average firm, the
incremental dollar invested in net operating capital is worth less than on the
incremental dollar held in cash. Second, conditional on current levels of
investment, the value of an additional dollar invested in net operating working
capital is worth less than the dollar so invested for the average firm. Third, the
value of an additional dollar invested in net operating working capital is
significantly influenced by a firm’s future sales expectations, its debt load, its
financial constraints, and its bankruptcy risk. This evidence implies that an
additional dollar is worth much less in financially unconstrained firms with high
debt loads and poor sales growth prospects. Fourth, for the average firm, the
incremental dollar invested in credit to one’s customers has a much greater
effect on shareholder wealth than incremental dollar invested in inventories, and
so suggests that a firm’s trade credit policies are very important part of its
working capital management. Altogether their evidence illuminates the
importance of working capital management to shareholders and the subtle
effects of financing on its wealth effects.
More recently, Bandara and Weerakoon (2014), investigated the impact
of working capital management practices (WCMP) on firm value in Sri Lanka
using a sample of 74 companies listed in the Colombo Stock Exchange covering
seven business sectors for a period of 2005 to 2009. Firm value measured in
terms of Economic Value Added (EVA) and Market Value Added (MVA) as
© University of Cape Coast https://erl.ucc.edu.gh/jspui
Digitized by Sam Jonah Library

46
dependent variable and firm’s Aggressive Working Capital Management
Practice (AWCMP), Moderate Working Capital Management Practice
(MWCMP) and Conservative Working Capital Management Practice
(CWCMP) were used as independent variables. Using a panel regression
methodology, the authors find a statistically significant negative relationship
between CWCMP and MVA. Moreover, the study further indicated that there
is statistically significant negative relationship between AWCMP and EVA.
Their result indicated that firms that follow MWCMP yield higher MVA than
the firms following CWCMP. Similarly, firms that follow AWCMP generate
lower EVA than the firms with MWCMP. Hence, the authors concluded that
the firms following MWCMP improved both MVA and EVA of the firms in Sri
Lanka.
Additionally, Ankudinov and Lebedev (2014) empirically examined the
impact investments in different kinds of assets have on shareholder value
creation. The study which was based on panel data covers the period from 2004-
2012 for the largest public companies representing nonfinancial sector of
Russian economy. The results obtained show that companies most actively
increasing investment in working capital are traded with certain discount while
no statistically significant influence of investment in short-term financial assets
over company value was also discovered.
Duggal and Budden (2015) tested the hypothesis of a negative
relationship between a firm’s net working capital and returns to its shareholders
by using a sample of 363 non-financial firms grouped under nine industrial
sectors and belonging to S & P 500 firms for the period 2009-2012. The Treynor
index was used to estimate risk-adjusted shareholder returns. The main
© University of Cape Coast https://erl.ucc.edu.gh/jspui
Digitized by Sam Jonah Library
47
independent variable for their study was net working capital estimated as the
difference between current assets and current liabilities. The authors also used
cash, accounts receivable, inventory, and notes payable deflated by the sales
revenue as additional independent variables in their regressions in order to
discover how these variables affect shareholder wealth. The result shows a
negative relationship between risk-adjusted shareholder returns and net working
capital. Further, while cash holdings reduce shareholder wealth, investments in
inventory and vendor financing create shareholder value. However, investments
in accounts receivable do not affect shareholder returns.
To confirm their earlier study, Bandara (2015) used different time frame
and independent variables to investigate the impact of working capital
management policy on firm value from 74 companies listed in the Colombo
Stock Exchange (CSE) in Sri Lanka for the period 2009/10 to 2013/14. Firm
value was measured in terms of Market Value Added (MVA) as dependent
variable while firms’ working capital investment policy (WCIP) and working
capital financing policy (WCFP) were used as independent variables. The panel
regression results indicated significant negative relationship between the firms’
degree of aggressiveness of WCIP and MVA. However, no statistically
significant relationship was found between WCFP and MVA at the
conventional level albeit the negative relationship. Based on this evidence, the
author concluded that minimum level of investment in current assets leads to
have higher MVA of the firms in Sri Lanka.
© University of Cape Coast https://erl.ucc.edu.gh/jspui
Digitized by Sam Jonah Library
48
Working Capital Management and Cointegration
Prior studies mostly done on this subject test the relationship between
working capital management and its components on profitability. However,
cointegrating relationships between working capital management and
profitability as well as liquidity recently begin to be tested by researchers. A
few studies found in literature, provide empirical results regarding cointegrating
relationships.
Akinlo (2011) investigated the long-run relationship and causality issues
between working capital and profitability in 66 firms in Nigeria by using the
panel cointegration method for the period 1999-2007. By applying LLC, IPS
and Hadri panel unit root tests to ensure the stationarity of the data, which was
found stationary at first difference and using Pedroni (1999) panel residual
based cointegration approach to detect the long-run relationship. The result
revealed that there is a long-run equilibrium relationship between working
capital and profitability for a cross section of firms after allowing for a firm
specific effect. The author further used a panel based error correction model to
account for the long-run relationship using the two step procedure from Engle
and Granger (1987). The empirical results indicate that there was long-run and
short-run causal relationship between working capital and profitability with
short-run causal relationship moving from working capital to profitability. The
author concluded that if mangers manage working capital inefficiently, that will
lead to a reduction in profits.
Ani, Okwo and Ugwunta (2012) also investigated the influence of
working capital management measured by cash conversion cycle and its
components on the profitability for top five world leading beer brewery firms
© University of Cape Coast https://erl.ucc.edu.gh/jspui
Digitized by Sam Jonah Library

49
over a period of 2000-2011. Return on assets (ROA) was used as a measure of
profitability to represent the dependent variable, while cash conversion cycle
(CCC), current ratio (CR), debt ratio (DR), and sales growth (SGR) represented
the independent variables in their study. To avoid spurious regression, the
authors applied Augmented Dickey Fuller (ADF) test to check the order of
integration for the data, their test indicated that there was no unit root problem.
Using the Johansen cointegration methodology, the cointegration test results
indicated that there exists a cointegration relationship between the measure of
profitability (ROA) and the explanatory variables. Multiple linear regression
revealed that cash conversion cycle has a significantly positive and direct effect
on profitability. The study concluded that working capital management not only
has a positive relationship with profitability, but also has a significant long-run
impact on profitability.
Shakoor, Khan and Nawab (2012) also sought to establish a relationship
between working capital and profitability based on a sample of 25 Pakistani
manufacturing companies listed on Karachi Stock Exchange over the period
2001-2010. To check the stationary of the data, Augmented Dickey Fuller
(ADF) test was used and Johansen’s co-integration test was also used for the
long-run relationship. Then they established a linear regression model with OLS
techniques to analyze the data, which the analysis revealed that quick ratio, days
inventory outstanding, debt equity ratio and return on equity have a positive
association with return on assets as a measure of profitability, whereas current
ratio, and days sale outstanding showed a negative association with return on
assets.
© University of Cape Coast https://erl.ucc.edu.gh/jspui
Digitized by Sam Jonah Library
50
In another study, Awad and Jayyar (2013) studied the directional effect
of working capital management and liquidity on profitability. The authors
employed econometric techniques of the unit root tests, co-integration and two-
step Engle and Granger method with error correction model on a panel data for
11 Palestine manufacturing firms listed in the PEX over the period from 2007
to 2012. Using gross operating profit as a measure of profitability and cash
conversion cycle as a measure of working capital management with size, debt
ratio and financial ratio as control variables, the result of a unit root test for all
the variables in their study stated that all variables except financial asset ratio
were stationary at first difference. Their cointegration results based on Kao
(1999) showed that there is a long-run relationship between profitability,
working capital management, firm size and debt ratio. Their findings also
indicated that there is a bi-directional causal relationship between working
capital management and profitability. Accordingly, the paper concludes, in its
attempt to investigate the directional long-run relationship between gross
operating profit, cash conversion cycle and current ratio, that managers should
concentrate on managing working capital efficiently in order to generate cash
and profits to their firms.
Conceptual Framework for the Study
The conceptual framework depicts the relationship between the working
capital management policies and shareholder value creation of the
manufacturing firms listed on the Ghana Stock Exchange. From the literature
review, the following conceptual framework is developed to show the effect of
© University of Cape Coast https://erl.ucc.edu.gh/jspui
Digitized by Sam Jonah Library

51
working capital management policies on shareholder value. Figure 6 shows the
relationship between the dependent and the explanatory variables.
Independent Variables Control Variables Dependent Variables
Figure 6: Conceptual framework
Chapter Summary
From the literature review, it is evident that the issue of working capital
management policies and corporate profitability has received considerable
attention within the academic cycles. However, most of these studies
concentrated on firm performance with less attention on shareholder value
thereby creating a gap. Additionally, empirical literature reviewed revealed that
these prior studies applied static Ordinary Least Squares or Generalized Least
Squares as estimation techniques without checking whether the data series were
stationary or not. Thus, this present study sought to correct this.
Source: Quansah, 2016
Investment Policy
(TCA/TA)
Financing Policy
(TCL/TA)
Cash Conversion
Cycle (CCC)
Create Shareholder
value
ROE
M/B ratio
Tobin’s Q
EVA
Leverage
Size
© University of Cape Coast https://erl.ucc.edu.gh/jspui
Digitized by Sam Jonah Library

52
CHAPTER THREE
RESEARCH METHODS
Introduction
The primary aim of this study was to determine the effects of working
capital management policies on shareholder value of manufacturing firms listed
on the Ghana Stock Exchange. This chapter discusses the research methods
adopted. It discusses the research design, the population, the sample and the
sampling procedure. It also discusses the data collection procedures, study
variables, the panel cointegration estimation models and the data analyses.
Research Design
This study follows an objective assumption and positivist approach
because the researcher believes that positivist approach will enable the study to
be independently carried out in order to objectively determine the effects
working capital management policies have on shareholder value. This study
adopted a longitudinal, explanatory non-experimental research study applied in
panel framework to analyze the effects of working capital management policies
on shareholder value of manufacturing firms listed on the Ghana Stock
Exchange. An explanatory non-experimental research design is appropriate
where the researcher is trying to test a theory about a phenomenon or attempting
to explain how the phenomenon operates by identifying the causal factors that
produce the change whereby there is no manipulation of the independent
variables (Johnson, 2001; Kerlinger & Lee, 2000). In their study, Mwangi et al.
(2014) adopted an explanatory non-experimental research design to analyze the
© University of Cape Coast https://erl.ucc.edu.gh/jspui
Digitized by Sam Jonah Library

53
effects of financing decisions on performance of non-financial companies listed
in the NSE, Kenya.
Study Area
This study examined manufacturing companies that are listed on the
Ghana Stock Exchange. As at 31st December, 2013, there were 34 firms that
have been listed on the bourse. Out of these, 12 companies were manufacturing
firms (see appendix A for the list of manufacturing firms as of 31st December,
2013). These manufacturing companies are made up food and beverages,
pharmaceuticals, wood and paper converters and traditional manufacturing
firms. The choice of the manufacturing firms was due to the fact that these firms
contribute greatly to the socio-economic development in Ghana through
employment creation, economic stability and GDP as well as capital
mobilization. For example, in 2013, food & beverage and the traditional
manufacturing concerns contributed a total of GHS145 million representing
about 32% of total market capitalization for the year ended 31st December,
2013. Furthermore, the manufacturing companies represent an appropriate
sample in order to analyze working capital management. This is because all the
three major components of working capital (inventory, account receivable and
account payable) usually play important roles in the manufacturing sector.
Again, most of the previous studies in relation to the subject were conducted on
manufacturing companies (See for example, Agyemang & Asiedu, 2013; Akoto
et al., 2013; Deloof, 2003; Korankye & Adarquah, 2013; Raheman & Nasr,
2007). For this reason, the researcher believed that manufacturing companies
would be suitable for the problem under study.
© University of Cape Coast https://erl.ucc.edu.gh/jspui
Digitized by Sam Jonah Library

54
Population
According to the United Nations’ (2008) International Standard
Industrial Classification (ISIC) of economic activities, manufacturing
enterprises involve industrial groups or business types such as:
Manufacture of food products: vegetable and animal oils and fats, dairy
products, bakery products, cocoa, chocolate and sugar confectionary;
Manufacture of textiles;
Manufacture of leather, luggage, hand bags and foot wear;
Manufacture of wood and products of wood and cork;
Manufacture of paper and paper products, publishing, printing;
Manufacture of chemicals and chemical products;
Hence, the population for the study comprised all the manufacturing companies
which fell within the definition of manufacturing enterprise by United Nations’
ISIC (2008) as revised and were listed on the Ghana Stock Exchange on or
before the year 2000 and were actively trading on the bourse as of 31st
December, 2013 with no recording of negative equity in their statement of
financial positions during the study period (see appendix A). Based on this, the
target population was made up of six manufacturing firms listed on the Ghana
Stock Exchange.
Sampling Procedure
Sampling could be described as the process of selecting a sufficient
number of cases from the population, so that a study of the sample and an
understanding of its properties or characteristics would enable the researcher to
generalize such properties or characteristics to the population as a whole
© University of Cape Coast https://erl.ucc.edu.gh/jspui
Digitized by Sam Jonah Library
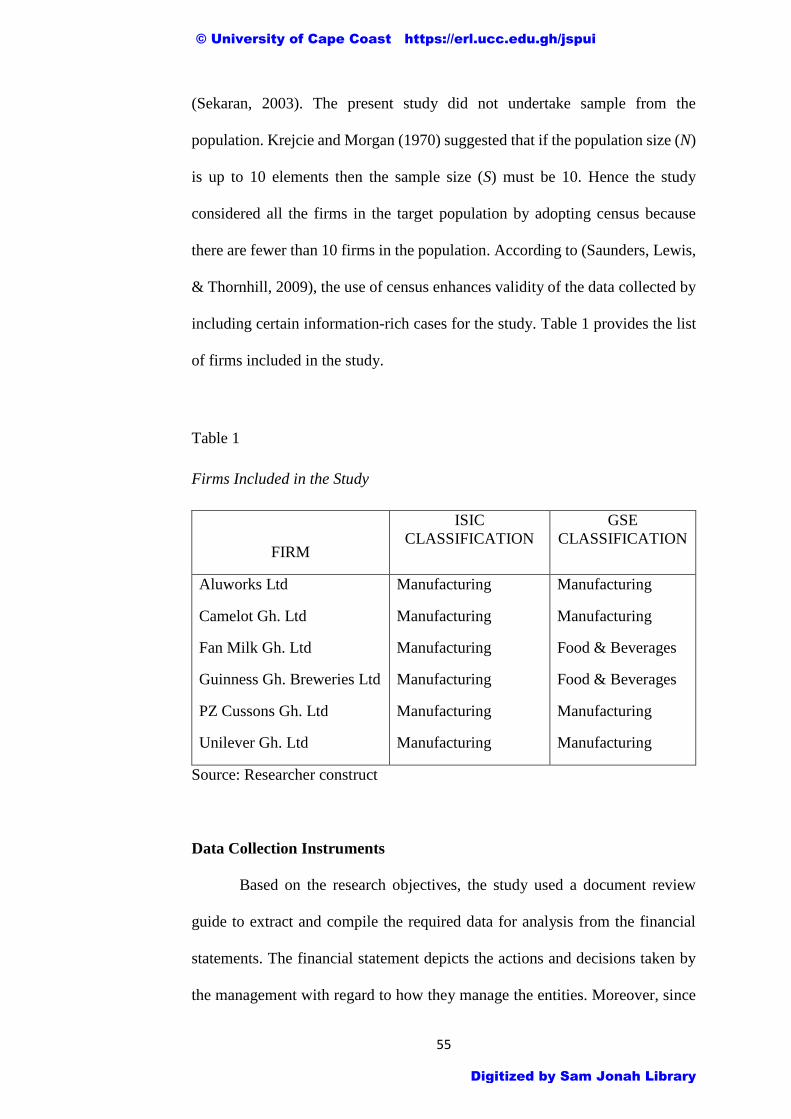
55
(Sekaran, 2003). The present study did not undertake sample from the
population. Krejcie and Morgan (1970) suggested that if the population size (N)
is up to 10 elements then the sample size (S) must be 10. Hence the study
considered all the firms in the target population by adopting census because
there are fewer than 10 firms in the population. According to (Saunders, Lewis,
& Thornhill, 2009), the use of census enhances validity of the data collected by
including certain information-rich cases for the study. Table 1 provides the list
of firms included in the study.
Table 1
Firms Included in the Study
FIRM
ISIC
CLASSIFICATION
GSE
CLASSIFICATION
Aluworks Ltd
Camelot Gh. Ltd
Fan Milk Gh. Ltd
Guinness Gh. Breweries Ltd
PZ Cussons Gh. Ltd
Unilever Gh. Ltd
Manufacturing
Manufacturing
Manufacturing
Manufacturing
Manufacturing
Manufacturing
Manufacturing
Manufacturing
Food & Beverages
Food & Beverages
Manufacturing
Manufacturing
Source: Researcher construct
Data Collection Instruments
Based on the research objectives, the study used a document review
guide to extract and compile the required data for analysis from the financial
statements. The financial statement depicts the actions and decisions taken by
the management with regard to how they manage the entities. Moreover, since
© University of Cape Coast https://erl.ucc.edu.gh/jspui
Digitized by Sam Jonah Library

56
these financial statements undergo verification by independent bodies, it is
believed to give more reliable and objective data due to the nature of the study
than the use of survey instruments such as questionnaires and interview guide
which can be biased. Lee (2000) and Sekaran (2003) suggest that unobtrusive
methods of data collection such as its extraction from company records have the
advantage of accuracy.
Data collection procedures
The data for all the variables in the study were extracted from published
annual reports and financial statements of the study firms covering the years
2000 to 2013.The data were obtained from the GSE fact books, Annual Report
Ghana database and African financial market websites for the period of
reference. The specific financial statements from which data were extracted
include the statement of profit or loss and other comprehensive income,
statement of financial position, statement of cash flows and notes to the
accounts.
Description and Justification of Variables Used in the Study
Dependent Variables
Chari and Mohanty (2009) posit that there are two approaches to
measuring shareholder value. Financial market price based measures which are
used for companies that are listed and whose shares are traded in the capital
market and intrinsic value measures which are used for non-listed companies.
Prior empirical studies have used various metrics to represent shareholder value
creation such as Market Value Added, Market-to-Book Ratio, Shareholder
© University of Cape Coast https://erl.ucc.edu.gh/jspui
Digitized by Sam Jonah Library

57
Value Added, Tobin’s Q, Stock Market Returns, Return on Equity and
Economic Value Added. There is no single metric which is superior in
measuring shareholder value.
De Wet and Du Toit (2007) indicated that neither ROE nor EVA could
be seen as a reliable performance measure and hence reliance on a single
measure is not warranted (Bhasin, 2013). In order to complement and account
for possible weaknesses or flaws of each metric, it is appropriate to use a number
of them than to rely on only one metric in making decisions. This study
therefore, considers four metrics – two financial market price based measures
(Market-to-Book Ratio and Tobin’s Q) and two intrinsic value based measures
(EVA and ROE) as proxies for shareholder value.
Return on Equity (ROE)
According to Watson and Head (2007), profitability is related to the goal
of shareholder wealth maximization. Previous studies used different measures
as proxies for profitability. For instance, gross operating profitability (Awad &
Jayyar, 2013; Deloof, 2003); Return on Asset (Nazir & Afza, 2009). This study
measures profitability by using return on equity. Following Abor (2005);
Addae, Nyarkoh-Baasi and Hughes (2013); Gatsi and Akoto (2010) and
Mwangi et al. (2014), return on equity is calculated as
𝑅𝑂𝐸 = 𝑃𝑟𝑜𝑓𝑖𝑡 𝐵𝑒𝑓𝑜𝑟𝑒 𝐼𝑛𝑡𝑒𝑟𝑒𝑠𝑡 & 𝑇𝑎𝑥𝑒𝑠
𝑇𝑜𝑡𝑎𝑙 𝐸𝑞𝑢𝑖𝑡𝑦
© University of Cape Coast https://erl.ucc.edu.gh/jspui
Digitized by Sam Jonah Library

58
Market-to-Book Ratio
According to Pandey (2005), shareholder value creation can be
measured by comparing the market value per share and book value per share. A
ratio higher than one means that shareholder value is created. On the other hand,
a ratio less than one means that shareholder value is destroyed.
Market-to-Book ratio (MBR) is calculated by the following formula:
𝑀
𝐵=
𝑀𝑎𝑟𝑘𝑒𝑡 𝑉𝑎𝑙𝑢𝑒 𝑜𝑓 𝐸𝑞𝑢𝑖𝑡𝑦
𝐵𝑜𝑜𝑘 𝑉𝑎𝑙𝑢𝑒 𝑜𝑓 𝐸𝑞𝑢𝑖𝑡𝑦
Where market value of equity is obtained by multiplying the year end stock
price by the number of shares outstanding.
Tobin’s Q
According to Tobin and Brainard (1968), Tobin’s Q approximates the
market estimation of net present value of firms. Boasson and Boasson (2005)
argue that Tobin's Q is the most appropriate measure of value creation. Tobin’s
Q is calculated as
𝑇𝑜𝑏𝑖𝑛′𝑠 𝑄 = 𝑀𝑎𝑟𝑘𝑒𝑡 𝑣𝑎𝑙𝑢𝑒 𝑜𝑓 𝑒𝑞𝑢𝑖𝑡𝑦 + 𝐵𝑜𝑜𝑘 𝑣𝑎𝑙𝑢𝑒 𝑜𝑓 𝑇𝑜𝑡𝑎𝑙 𝐷𝑒𝑏𝑡𝑠
𝐵𝑜𝑜𝑘 𝑉𝑎𝑙𝑢𝑒 𝑜𝑓 𝑇𝑜𝑡𝑎𝑙 𝐴𝑠𝑠𝑒𝑡𝑠
Economic Value Added (EVA)
Economic Value Added (EVA) is a measure that focuses on firm
internal performance over a given period and it aims to be a measure that tells
what has happened to the wealth of shareholders (Bandara & Weerakoon, 2014;
Chari & Mohanty, 2009). Hall (1999) found that EVA correlates well with the
market value of a company and it is arguably one of the best methods to express
and quantify shareholder value creation (Hall, 2000). A firm creates value for
© University of Cape Coast https://erl.ucc.edu.gh/jspui
Digitized by Sam Jonah Library

59
its shareholders if it earns a return greater than the cost of capital and earning
less destroys value (Chari & Mohanty, 2009). Thus, creating a sustainable
improvement in EVA is tantamount to increasing shareholder wealth (Bandara
& Weerakoon, 2014). Traditionally, it is calculated as:
𝐸𝑉𝐴 = (𝑁𝑂𝑃𝐴𝑇 − [𝐼𝑛𝑣𝑒𝑠𝑡𝑒𝑑 𝑐𝑎𝑝𝑖𝑡𝑎𝑙 × 𝑊𝐴𝐶𝐶])
Where NOPAT is net operating profit after taxes but before interest expense.
WACC= Weighted average cost of capital.
Measuring EVA in this way depicts wealth created for both equity
shareholders and other capital providers. However, the present study sought to
calculate EVA targeting only equity shareholders. This is consistent with Fraker
(2006) and Bandara and Weerakoon (2014).
Accordingly, EVA is calculated as:
𝐸𝑉𝐴 = (𝑃𝐴𝑇 − [𝐾𝑒 × 𝑇𝑜𝑡𝑎𝑙 𝐼𝑛𝑣𝑒𝑠𝑡𝑒𝑑 𝑒𝑞𝑢𝑖𝑡𝑦 𝐶𝑎𝑝𝑖𝑡𝑎𝑙𝑡−0])
Where PAT = profit after tax attributable to equity holders
Ke = Cost of equity capital i.e. required return
Total Invested Equity Capital (t-0) = Shareholders Fund at the beginning of the
year.
The cost of equity was calculated by the use of market model under the standard
Capital Asset Pricing Model (CAPM) with constant beta assuming that the beta
is stable over time (Acheampong & Agalega, 2013). The study used average 91-
day treasury bill rate as a surrogate for risk-free rate. The average market return
is the return from the market portfolio (GSE Composite index). The betas of the
firms were estimated using the Ordinary Least Squares Method.
© University of Cape Coast https://erl.ucc.edu.gh/jspui
Digitized by Sam Jonah Library

60
Independent Variables
Aggressive/Conservative Current Assets Investing and Financing Policies
This study used aggressive current asset investment policy and
conservative current asset investment policy as used by Weinraub and Visscher
(1998) and aggressive current asset financing policy and conservative current
asset financing policy as used by Nazir and Afza (2009) as well as Cash
Conversion Cycle (Jose et al., 1996) as measuring variables of working capital
management policies. Aggressive Current Asset Investment Policy (ACIP)
results in minimal level of investment in current assets versus non-current
assets. In contrast, a Conservative Current Asset Investment Policy (CCIP)
places a greater proportion of capital in current assets with the opportunity cost
of less profitability. In order to measure the degree of
aggressiveness/conservativeness of current asset investment policy, the
following ratio was calculated:
𝑇𝐶𝐴/𝑇𝐴 = 𝑇𝑜𝑡𝑎𝑙 𝐶𝑢𝑟𝑟𝑒𝑛𝑡 𝐴𝑠𝑠𝑒𝑡𝑠 (𝑇𝐶𝐴)
𝑇𝑜𝑡𝑎𝑙 𝐴𝑠𝑠𝑒𝑡𝑠 (𝑇𝐴)
Where a lower ratio (i.e. less than 0.5) means a relatively aggressive investment
policy whereas a higher ratio (more than 0.5) means relatively conservative
investment policy. On the other hand, an Aggressive Current Asset Financing
Policy (ACFP) utilizes higher levels of current liabilities and less long-term debt
and equity. In contrast, a Conservative Current Asset Financing Policy (CCFP)
uses more long-term debt and capital and less current liabilities. The degree of
aggressiveness/conservativeness of a financing policy adopted by a firm is
measured by current assets financing policy, and the following ratio is used:
𝑇𝐶𝐿/𝑇𝐴 = 𝑇𝑜𝑡𝑎𝑙 𝐶𝑢𝑟𝑟𝑒𝑛𝑡 𝐿𝑖𝑎𝑏𝑖𝑙𝑖𝑡𝑖𝑒𝑠 (𝑇𝐶𝐿)
𝑇𝑜𝑡𝑎𝑙 𝐴𝑠𝑠𝑒𝑡𝑠 (𝑇𝐴)
© University of Cape Coast https://erl.ucc.edu.gh/jspui
Digitized by Sam Jonah Library

61
Where a lower ratio (i.e. less than 0.5) means a relatively conservative financing
policy whereas a higher ratio (more than 0.5) means relatively aggressive
financing policy.
Cash Conversion Cycle (CCC)
According to Jose et al. (1996), a firm can use Cash Conversion Cycle
(CCC) as a comprehensive measure of its working capital management policy,
where a shorter cash conversion cycle means aggressive working capital
management policy while longer cash conversion cycle means conservative
working capital management policy. The CCC is calculated as:
Average Inventory Conversion Days (ICD) plus Average Trade Receivables
Days (TRD) minus Average Trade Payable Days (TPD)
Where, ICD = daysX 365Sales ofCost
Inventory Average
TRD = daysX 365Revenue
Receivable Trade Average
TPD = daysX 365*Sales ofCost Adjusted
Payable Trade Average
*Adjusted Cost of Sales = Cost of Sales – Depreciation/Amortization
Control Variables
Previous studies have used the control variables along with the main
variables of shareholder value creation in order to have an apposite analysis (see
for example Atiyet, 2012; Naccur & Goaied, 1999; Pandey, 2005). The study
considered two control variables relating to firms such as the size of the firm
and financial leverage.
© University of Cape Coast https://erl.ucc.edu.gh/jspui
Digitized by Sam Jonah Library
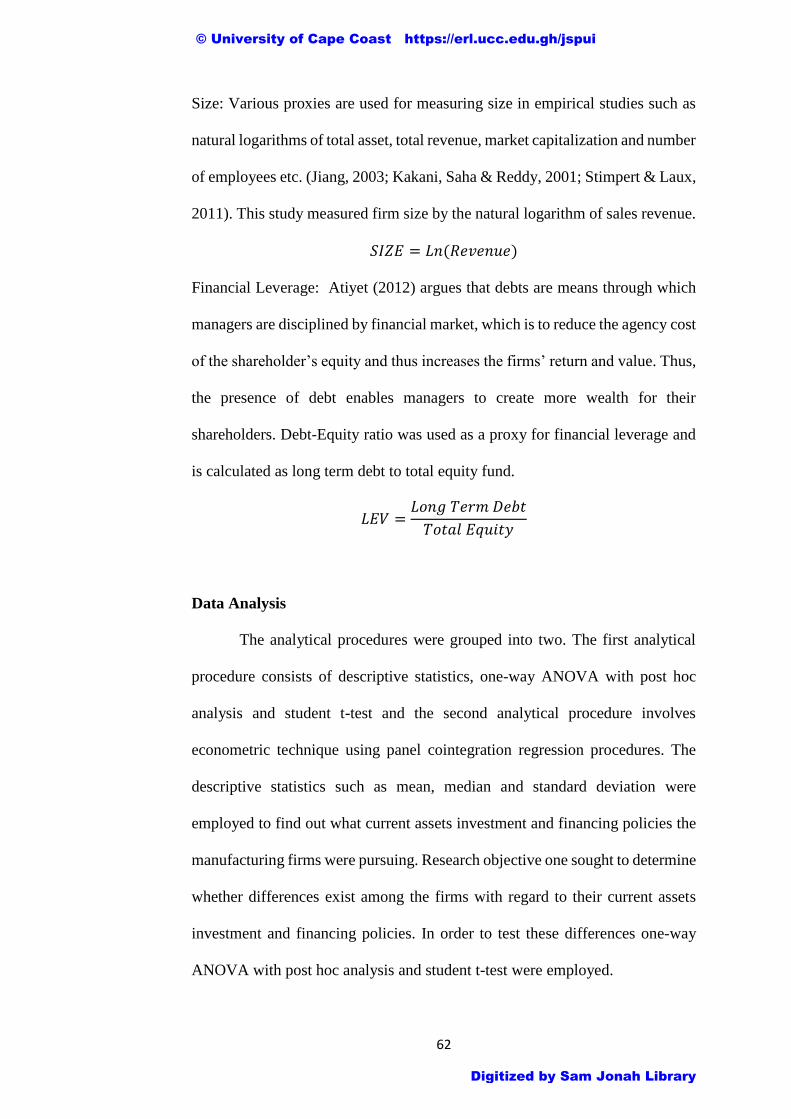
62
Size: Various proxies are used for measuring size in empirical studies such as
natural logarithms of total asset, total revenue, market capitalization and number
of employees etc. (Jiang, 2003; Kakani, Saha & Reddy, 2001; Stimpert & Laux,
2011). This study measured firm size by the natural logarithm of sales revenue.
𝑆𝐼𝑍𝐸 = 𝐿𝑛(𝑅𝑒𝑣𝑒𝑛𝑢𝑒)
Financial Leverage: Atiyet (2012) argues that debts are means through which
managers are disciplined by financial market, which is to reduce the agency cost
of the shareholder’s equity and thus increases the firms’ return and value. Thus,
the presence of debt enables managers to create more wealth for their
shareholders. Debt-Equity ratio was used as a proxy for financial leverage and
is calculated as long term debt to total equity fund.
𝐿𝐸𝑉 =𝐿𝑜𝑛𝑔 𝑇𝑒𝑟𝑚 𝐷𝑒𝑏𝑡
𝑇𝑜𝑡𝑎𝑙 𝐸𝑞𝑢𝑖𝑡𝑦
Data Analysis
The analytical procedures were grouped into two. The first analytical
procedure consists of descriptive statistics, one-way ANOVA with post hoc
analysis and student t-test and the second analytical procedure involves
econometric technique using panel cointegration regression procedures. The
descriptive statistics such as mean, median and standard deviation were
employed to find out what current assets investment and financing policies the
manufacturing firms were pursuing. Research objective one sought to determine
whether differences exist among the firms with regard to their current assets
investment and financing policies. In order to test these differences one-way
ANOVA with post hoc analysis and student t-test were employed.
© University of Cape Coast https://erl.ucc.edu.gh/jspui
Digitized by Sam Jonah Library
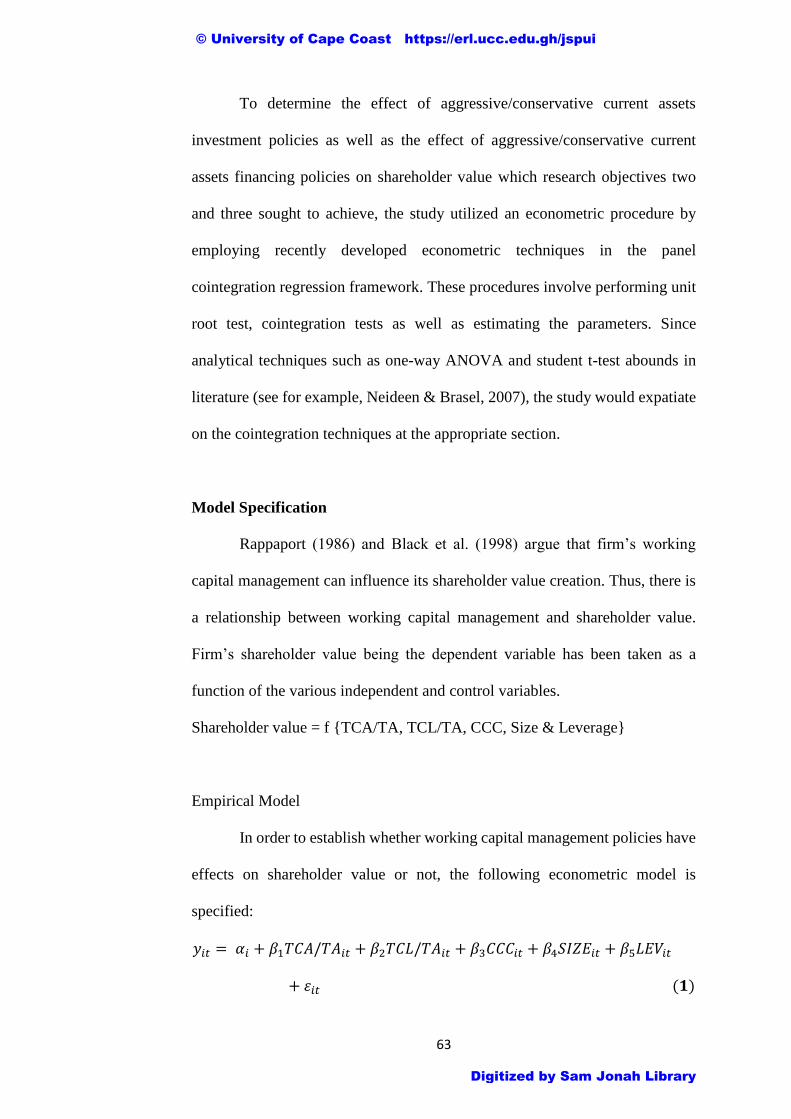
63
To determine the effect of aggressive/conservative current assets
investment policies as well as the effect of aggressive/conservative current
assets financing policies on shareholder value which research objectives two
and three sought to achieve, the study utilized an econometric procedure by
employing recently developed econometric techniques in the panel
cointegration regression framework. These procedures involve performing unit
root test, cointegration tests as well as estimating the parameters. Since
analytical techniques such as one-way ANOVA and student t-test abounds in
literature (see for example, Neideen & Brasel, 2007), the study would expatiate
on the cointegration techniques at the appropriate section.
Model Specification
Rappaport (1986) and Black et al. (1998) argue that firm’s working
capital management can influence its shareholder value creation. Thus, there is
a relationship between working capital management and shareholder value.
Firm’s shareholder value being the dependent variable has been taken as a
function of the various independent and control variables.
Shareholder value = f {TCA/TA, TCL/TA, CCC, Size & Leverage}
Empirical Model
In order to establish whether working capital management policies have
effects on shareholder value or not, the following econometric model is
specified:
𝑦𝑖𝑡 = 𝛼𝑖 + 𝛽1𝑇𝐶𝐴/𝑇𝐴𝑖𝑡 + 𝛽2𝑇𝐶𝐿/𝑇𝐴𝑖𝑡 + 𝛽3𝐶𝐶𝐶𝑖𝑡 + 𝛽4𝑆𝐼𝑍𝐸𝑖𝑡 + 𝛽5𝐿𝐸𝑉𝑖𝑡
+ 𝜀𝑖𝑡 (𝟏)
© University of Cape Coast https://erl.ucc.edu.gh/jspui
Digitized by Sam Jonah Library

64
Where 𝑦𝑖𝑡 is the shareholder value proxied by Return on Equity, Market-to-
Book ratio, Tobin’s Q and EVA for firm i in period t.
TCA/TA= Total current assets to total assets ratio
TCL/TA= Total current liabilities to total assets ratio
CCC= Cash Conversion Cycle
SIZE = Natural log of total revenue
LEV = Financial leverage of firms measured as long-term debt to total equity
αi = individual specific intercept
β1- β5= are parameters to be estimated
ε = Error term of the model and
it= firm i at time period t
Estimation Techniques
It has long been recognized that economic and financial data especially
at the aggregate level exhibit some unit root processes i.e. are not stationary.
When time series are nonstationary, performing ordinary least square (OLS)
regression on them will produce spurious results (Brooks, 2008; Engle &
Granger, 1987). These regressions often tend to have high R2 and correlation
which in actual fact there will be no such correlation (Granger & Newbold,
1974). Therefore, it is always important to first test for the presence of units root
or otherwise to enable the researcher choose the appropriate estimator to
estimate the parameters.
© University of Cape Coast https://erl.ucc.edu.gh/jspui
Digitized by Sam Jonah Library

65
Panel Unit Root Test
In conventional time series, various unit root tests have been proposed
such as Augmented Dickey-Fuller test (ADF) and Philip-Perron (PP) test.
However, in panel setting, testing for unit root is recent. These tests include
common unit root processes such as Breitung (2000), Hadri (2000), and Levin,
Lin and Chu (2002) and those that allow for individual specific effect such as
Choi (2001), Im, Pesaran and Shin (2003), Maddala and Wu (1999).
According to Baltagi (2005), Panel unit root tests lead to a statistic with
a normal distribution in the limit than the conventional time series unit root tests
which have complicated limiting distributions. Levin, Lin and Chu (2002)
herein referred to as LLC, Breitung, and Hadri tests are based on the assumption
that there is a common unit root process so that is identical across cross-
sections. The LLC and Breitung test employ a null hypothesis of a unit root
while the Hadri test uses a null hypothesis of no unit root. LLC consider the
following basic Augmented Dickey–Fuller (ADF) specification
pi
j
titjitijit Xyyy it
1
'1 (2)
Where yit refers to the pooled variable, itX ' are the exogenous variables and t
is the error terms assumed to be mutually independent disturbance terms. It is
assumed that = -1 is constraint to be the same across the cross sectional
dimensions but the lag order term pi can be permitted to vary across the cross
sectional dimension.
The null and alternative hypotheses can be written as:
H0: = 0
H1: < 0
© University of Cape Coast https://erl.ucc.edu.gh/jspui
Digitized by Sam Jonah Library
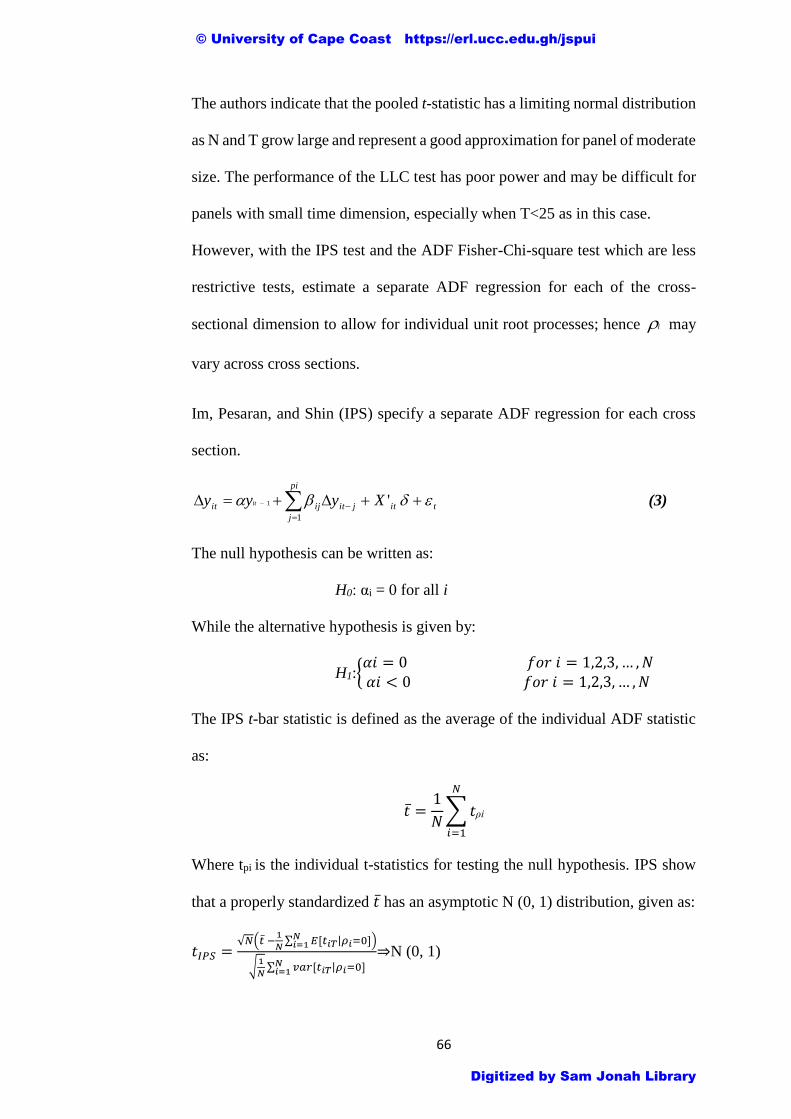
66
The authors indicate that the pooled t-statistic has a limiting normal distribution
as N and T grow large and represent a good approximation for panel of moderate
size. The performance of the LLC test has poor power and may be difficult for
panels with small time dimension, especially when T<25 as in this case.
However, with the IPS test and the ADF Fisher-Chi-square test which are less
restrictive tests, estimate a separate ADF regression for each of the cross-
sectional dimension to allow for individual unit root processes; hence i may
vary across cross sections.
Im, Pesaran, and Shin (IPS) specify a separate ADF regression for each cross
section.
pi
j
titjitijit Xyyy it
1
'1 (3)
The null hypothesis can be written as:
H0: αi = 0 for all i
While the alternative hypothesis is given by:
H1:{𝛼𝑖 = 0 𝑓𝑜𝑟 𝑖 = 1,2,3, … , 𝑁𝛼𝑖 < 0 𝑓𝑜𝑟 𝑖 = 1,2,3, … , 𝑁
The IPS t-bar statistic is defined as the average of the individual ADF statistic
as:
𝑡̅ =1
𝑁∑ 𝑡ρi
𝑁
𝑖=1
Where tpi is the individual t-statistics for testing the null hypothesis. IPS show
that a properly standardized 𝑡̅ has an asymptotic N (0, 1) distribution, given as:
𝑡𝐼𝑃𝑆 =√𝑁(�̅� −
1
𝑁∑ 𝐸[𝑡𝑖𝑇|𝜌𝑖=0]𝑁
𝑖=1 )
√1
𝑁∑ 𝑣𝑎𝑟[𝑡𝑖𝑇|𝜌𝑖=0]𝑁
𝑖=1
⇒N (0, 1)
© University of Cape Coast https://erl.ucc.edu.gh/jspui
Digitized by Sam Jonah Library

67
as T→ ∞ followed by N → ∞ sequentially. IPS indicate that if a large enough
lag order is selected for the underlying ADF regressions, then the small sample
performance of the t-bar test is reasonably satisfactory and generally better than
the LLC test (Baltagi, 2005)
Maddala and Wu (1999) and Choi (2001) proposed an alternative
approach to panel unit root test which uses Fisher’s (1932) results to derive tests
that combine the p-values from unit root tests for each cross-section i to test for
unit root in panel data.
𝑃 = −2 ∑ ln 𝑃𝑖
𝑁
𝑖=1
(𝟒)
Their proposed Fisher-type test has a χ2 distribution with 2 degrees of freedom.
This means that P is distributed as χ2 with 2N degrees of freedom as Ti→ ∞ for
finite N.
Both IPS and Fisher test combine information based on the individual units root
tests and therefore have the same null and alternative hypotheses.
Panel Cointegration Test
When the panel data exhibit nonstationarity, it is possible to test whether
there is a cointegrating relationship existing between them in the long-run. That
is whether there is long-run association between the variables. In order to test
for possible cointegration, the study used Pedroni (1999, 2004) panel
cointegration technique and is briefly discussed here.
Following Pedroni (1999), the study considers the following fixed-effect model:
𝑦𝑖𝑡 = 𝛼𝑖 + 𝛽1𝑖𝑇𝐶𝐴/𝑇𝐴𝑖𝑡 + 𝛽2𝑖𝑇𝐶𝐿/𝑇𝐴𝑖𝑡 + 𝛽3𝑖𝐶𝐶𝐶𝑖𝑡 + 𝛽4𝑖𝑆𝐼𝑍𝐸𝑖𝑡 + 𝛽5𝑖𝐿𝐸𝑉𝑖𝑡
+ 𝑒𝑖𝑡 (5)
© University of Cape Coast https://erl.ucc.edu.gh/jspui
Digitized by Sam Jonah Library

68
where i = 1,2,…,N for each firm; t = 1,2,…, T observations over time; αi
represents the individual-specific (fixed) effect intercept that is allowed to vary
across individual firms and β1i, β2i,…, β5i are the slope coefficients which are also
permitted to vary across individual firms; 𝑦𝑖𝑡 represents the dependent variables
(ROE, Market-to-Book ratio, Tobin’s Q and EVA) and 𝑒𝑖𝑡= 𝜌𝑖𝑒𝑖𝑡−1 + 𝜀𝑖𝑡
Pedroni (1999, 2004) developed seven panel cointegration test statistics to
determine the existence of cointegration. Four within-dimension test statistics
which assume homogeneity of the AR term and three group between-dimension
test statistics which allow for heterogeneity of the AR term to test the null
hypothesis of no cointegration against the alternative hypothesis of
cointegration. Within-dimension based statistics are referred as panel
cointegration statistics, while between-dimension statistics are termed as group-
mean cointegration statistics.
The first panel cointegration statistic (panel v-statistic) is similar to the
long-run non-parametric variance ratio statistic for time series. The second
statistic (Panel ρ statistic) is analogous to Phillips and Peron (1988) semi-
parametric ‘rho’ statistic while the third statistic (panel PP) and fourth statistic
(panel ADF) are analogous to Phillips-Peron non-parametric t-statistic and the
ADF t-statistic respectively. The other three panel cointegration statistics are
based on a group mean. The within-dimension statistics are based on the
estimators that effectively pooled the autoregressive coefficient across different
members for the unit root test on the estimated residuals while the between-
dimension simply averages the individually estimated residuals for each cross
section i. However, these tests are only valid when all the variables are I(1).
Wagner and Hlouskova (2009) recommend that the panel statistics based on the
© University of Cape Coast https://erl.ucc.edu.gh/jspui
Digitized by Sam Jonah Library

69
ADF are the best to test for the cointegration when the time series dimension is
small. Therefore, the present study relied on the ADF t -statistics since the study
sample was small.
Estimation of Long-Run Cointegrating Relationship
In order to estimate the long-run relationship between the dependent
variables and the cointegrating regressors after evidence of cointegration is
established, the study used recently developed Grouped Fully-Modified
Ordinary Least Square (FMOLS) and Pooled Mean Group (PMG) cointegrating
estimators proposed by Pedroni (2000, 2001) and Pesaran, Shin and Smith
(1999) respectively. These estimators are robust to serial correlation and
heterogeneity and hence preferable to simple OLS estimation.
Grouped Fully Modified Ordinary Least Squares
Pedroni (2000, 2001) proposes a grouped FMOLS estimator which
averages over the individual cross section FMOLS estimates. This method takes
into consideration heterogeneity across firms. One of the merits of using
between-dimension estimator as opposed to within-dimension is that the mode
in which the data is pooled allows for greater flexibility in the presence of
heterogeneity of the cointegrating vectors. Pedroni (2000, 2001) argues that the
grouped mean test statistics are found to do extremely well in small samples
provided the time series dimension is not smaller than the cross sectional
dimension. According to Pedroni (2000), the point estimate for the between
dimension estimator can be interpreted as the mean value of the cointegrating
vectors. Thus, consider the regression:
© University of Cape Coast https://erl.ucc.edu.gh/jspui
Digitized by Sam Jonah Library

70
𝑦𝑖𝑡 = 𝛼𝑖 + 𝛽1𝑖𝑇𝐶𝐴/𝑇𝐴𝑖𝑡 + 𝛽2𝑖𝑇𝐶𝐿/𝑇𝐴𝑖𝑡 + 𝛽3𝑖𝐶𝐶𝐶𝑖𝑡 + 𝛽4𝑖𝑆𝐼𝑍𝐸𝑖𝑡 + 𝛽5𝑖𝐿𝐸𝑉𝑖𝑡
+ 𝑢𝑖𝑡 (𝟔)
Where yit is the dependent variable (ROE, Market-to-Book ratio, Tobin’s Q and
EVA); TCA/TA, TCL/TA, CCC, Size and LEV are cointegrating regressors
with slopes β1i, β2i, β3i, β4i and β5i which may or may not be homogeneous across
i; αi denotes individual specific effect and uit is the disturbance term. The
expression for the between-dimension group-mean panel FMOLS estimator as
outlined in Pedroni (2001) is given as:
�̂�𝐺𝐹𝑀 ∗ =
1
𝑁∑ �̂�𝐹𝑀,𝑖
∗𝑁𝑖=1 (7)
Where �̂�𝐹𝑀,𝑖 is the time series FMOLS estimator which is applied to each firm
member. The associated t-statistic for the between-dimension estimator is given
as:
𝑡�̂�𝐺𝐹𝑀∗ =
1
𝑁√𝑁 ∑ 𝑡�̂�𝐹𝑀,𝑖
∗𝑁𝑖=1 (8)
𝑡�̂�𝐹𝑀𝑖 ∗ is the associated t value from the individual FMOLS estimators.
Erdem, Ucler and Bulul (2014) (as cited in Demirgunes, 2015) opine that panel
fully modified ordinary least squares estimator is appropriate if all the
cointegrating variables are integrated of order 1 i.e. I (1).
Thus, the empirical models are specified as
𝑅𝑂𝐸𝑖𝑡 = 𝛼𝑖 + 𝛽1𝑖𝑇𝐶𝐴/𝑇𝐴𝑖𝑡 + 𝛽2𝑖𝑇𝐶𝐿/𝑇𝐴𝑖𝑡 + 𝛽3𝑖𝐶𝐶𝐶𝑖𝑡 + 𝛽4𝑖𝑆𝐼𝑍𝐸𝑖𝑡
+ 𝑢𝑖𝑡 … … … … … … … … … … … … … … … … … … … … … … (𝟏)
𝑙𝑛𝑀𝐵𝑅𝑖𝑡 = 𝛼𝑖 + 𝛽1𝑖𝑇𝐶𝐴/𝑇𝐴𝑖𝑡 + 𝛽2𝑖𝑇𝐶𝐿/𝑇𝐴𝑖𝑡 + 𝛽3𝑖𝐶𝐶𝐶𝑖𝑡 + 𝛽4𝑖𝑆𝐼𝑍𝐸𝑖𝑡
+ 𝑢𝑖𝑡 … … … … … … … … … … … … … … … … … … … … … … … (𝟐)
𝑙𝑛𝑇𝑂𝐵𝐼𝑁′𝑆𝑄𝑖𝑡 = 𝛼𝑖 + 𝛽1𝑖𝑇𝐶𝐴/𝑇𝐴𝑖𝑡 + 𝛽2𝑖𝑇𝐶𝐿/𝑇𝐴𝑖𝑡 + 𝛽3𝑖𝐶𝐶𝐶𝑖𝑡 + 𝛽4𝑖𝑆𝐼𝑍𝐸𝑖𝑡
+ 𝑢𝑖𝑡 … … … … … … … … … … … … … … … … … … … … … … … (𝟑)
© University of Cape Coast https://erl.ucc.edu.gh/jspui
Digitized by Sam Jonah Library

71
𝐸𝑉𝐴𝑖𝑡 = 𝛼𝑖 + 𝛽1𝑖𝑇𝐶𝐴/𝑇𝐴𝑖𝑡 + 𝛽2𝑖𝑇𝐶𝐿/𝑇𝐴𝑖𝑡 + 𝛽3𝑖𝐶𝐶𝐶𝑖𝑡 + 𝛽4𝑖𝑆𝐼𝑍𝐸𝑖𝑡
+ 𝑢𝑖𝑡 … … … … … … … … … … … … … … … … … … … … … … (𝟒)
The variables are as already defined. These models were also used to estimate
the coefficients for the individual firms and the subsample firms. The basic
models were also re-estimated for the panel by the inclusion of a common time
dummy D1. However, the individual and subsample estimates did not include
the common time dummy D1.
Thus, the re-estimated models are specified as
𝑅𝑂𝐸𝑖𝑡 = 𝛼𝑖 + 𝛽1𝑖𝑇𝐶𝐴/𝑇𝐴𝑖𝑡 + 𝛽2𝑖𝑇𝐶𝐿/𝑇𝐴𝑖𝑡 + 𝛽3𝑖𝐶𝐶𝐶𝑖𝑡 + 𝛽4𝑖𝑆𝐼𝑍𝐸𝑖𝑡
+ 𝛽5𝑖𝐷1 + 𝑢𝑖𝑡 … … … … … … … … … … … … … … … … … (𝟏𝒂)
𝑙𝑛𝑀𝐵𝑅𝑖𝑡 = 𝛼𝑖 + 𝛽1𝑖𝑇𝐶𝐴/𝑇𝐴𝑖𝑡 + 𝛽2𝑖𝑇𝐶𝐿/𝑇𝐴𝑖𝑡 + 𝛽3𝑖𝐶𝐶𝐶𝑖𝑡 + 𝛽4𝑖𝑆𝐼𝑍𝐸𝑖𝑡
+ 𝛽5𝑖𝐷1 + 𝑢𝑖𝑡 … … … … … … … … … … … … … … … … (𝟐𝒂)
𝑙𝑛𝑇𝑂𝐵𝐼𝑁′𝑠𝑄𝑖𝑡 = 𝛼𝑖 + 𝛽1𝑖𝑇𝐶𝐴/𝑇𝐴𝑖𝑡 + 𝛽2𝑖𝑇𝐶𝐿/𝑇𝐴𝑖𝑡 + 𝛽3𝑖𝐶𝐶𝐶𝑖𝑡 + 𝛽4𝑖𝑆𝐼𝑍𝐸𝑖𝑡
+ 𝛽5𝑖𝐷1 + 𝑢𝑖𝑡 … … … … … … … … … … … … … … … … … … … (𝟑𝒂)
𝐸𝑉𝐴𝑖𝑡 = 𝛼𝑖 + 𝛽1𝑖𝑇𝐶𝐴/𝑇𝐴𝑖𝑡 + 𝛽2𝑖𝑇𝐶𝐿/𝑇𝐴𝑖𝑡 + 𝛽3𝑖𝐶𝐶𝐶𝑖𝑡 + 𝛽4𝑖𝑆𝐼𝑍𝐸𝑖𝑡
+ 𝛽5𝑖𝐷1 + 𝑢𝑖𝑡 … … … … … … … … … … … … … … … … … (𝟒𝒂)
Pooled Mean Group (PMG)/Autoregressive Distributed Lags (ARDL)
To ascertain the robustness of the long-run relationships, the study also
employed Pooled Mean Group due to Pesaran et al. (1999). This model takes
the cointegration form of the simple ARDL model and adapts it for a panel
setting by allowing the intercepts, short-run coefficients and cointegrating terms
to differ across firms. One of the merits of PMG is that of its flexibility that it
can be applied when the variables are of mixed order of integration
(Demirgunes, 2015).
© University of Cape Coast https://erl.ucc.edu.gh/jspui
Digitized by Sam Jonah Library

72
Consider an Autoregressive Distributed Lag (ARDL) (1,1,1,1,1,1) for
shareholder value as in equation (1).
𝑦𝑖𝑡 = 𝛼𝑖 + 𝜆𝑖𝑦𝑖𝑡−1 + 𝛽10𝑖𝑇𝐶𝐴/𝑇𝐴𝑖𝑡 + 𝛽11𝑖𝑇𝐶𝐴/𝑇𝐴𝑖𝑡−1 + 𝛽20𝑖𝑇𝐶𝐿/𝑇𝐴𝑖𝑡
+ 𝛽21𝑖𝑇𝐶𝐿/𝑇𝐴𝑖𝑡−1 + 𝛽30𝑖𝐶𝐶𝐶𝑖𝑡 + 𝛽31𝑖𝐶𝐶𝐶𝑖𝑡−1 + 𝛽40𝑖𝑆𝐼𝑍𝐸𝑖𝑡
+ 𝛽41𝑖𝑆𝐼𝑍𝐸𝑖𝑡−1 + 𝛽50𝑖𝐿𝐸𝑉𝑖𝑡 + 𝛽51𝑖𝐿𝐸𝑉𝑖𝑡−1 + 𝑢𝑖𝑡 (𝟗)
Where the number of groups i = 1, 2, …, N; t is the number of periods 1,2, …,
T; 𝑦𝑖𝑡 is a scalar dependent variable; the coefficients of the lag dependent
variables, 𝜆𝑖𝑡, are scalars; 𝛽10𝑖, 𝛽11𝑖,…,𝛽51𝑖 are the coefficient vectors of the
explanatory variables (regressors); and 𝛼𝑖 denotes group specific effect.
The re-parameterized form of the above equation can be formulated as follows:
∆𝑦𝑖𝑡 = 𝜙𝑖(𝑦𝑖𝑡−1 − 𝜃0𝑖 − 𝜃1𝑖𝑇𝐶𝐴/𝑇𝐴𝑖𝑡 − 𝜃2𝑖𝑇𝐶𝐿/𝑇𝐴𝑖𝑡 − 𝜃3𝑖𝐶𝐶𝐶𝑖𝑡
− 𝜃4𝑖𝑆𝐼𝑍𝐸𝑖𝑡 − 𝜃5𝑖𝐿𝐸𝑉𝑖𝑡) − 𝛽11𝑖∆𝑇𝐶𝐴/𝑇𝐴𝑖𝑡 − 𝛽21𝑖∆𝑇𝐶𝐿/𝑇𝐴𝑖𝑡
− 𝛽31𝑖∆𝐶𝐶𝐶𝑖𝑡 − 𝛽41𝑖∆𝑆𝐼𝑍𝐸𝑖𝑡 − 𝛽51𝑖∆𝐿𝐸𝑉𝑖𝑡 + 𝑢𝑖𝑡 (𝟏𝟎)
Where, 𝜙𝑖 = −(1 − 𝜆𝑖) is the error correction coefficient measuring the speed
of adjustment towards long-run equilibrium and is expected to be negative and
significant.
Besides, 𝜃0𝑖 =𝛼𝑖
1−𝜆𝑖 , 𝜃1𝑖 =
𝛽10𝑖+𝛽11𝑖
1−𝜆𝑖, 𝜃2𝑖 =
𝛽20𝑖+𝛽21𝑖
1−𝜆𝑖, 𝜃3𝑖 =
𝛽30𝑖+𝛽31𝑖
1−𝜆𝑖, 𝜃4𝑖 =
𝛽40𝑖+𝛽41𝑖
1−𝜆𝑖, 𝜃5𝑖 =
𝛽50𝑖+𝛽51𝑖
1−𝜆𝑖 are the long-run coefficients, ∆ is the first difference
operator.
The dependent variables (ROE, Market-to-Book Ratio, Tobin’s Q and EVA)
are used one after the other in the cointegration regression equation. Also the
models are first estimated without the fifth regressor (leverage) in order to check
the robustness of the estimates with the Grouped FMOLS.
Hence empirical models to be estimated are thus stated as:
© University of Cape Coast https://erl.ucc.edu.gh/jspui
Digitized by Sam Jonah Library

73
∆𝑅𝑂𝐸𝑖𝑡 = 𝜙𝑖(𝑅𝑂𝐸𝑖𝑡−1 − 𝜃0𝑖 − 𝜃1𝑖𝑇𝐶𝐴/𝑇𝐴𝑖𝑡 − 𝜃2𝑖𝑇𝐶𝐿/𝑇𝐴𝑖𝑡 − 𝜃3𝑖𝐶𝐶𝐶𝑖𝑡
− 𝜃4𝑖𝑆𝐼𝑍𝐸𝑖𝑡) − 𝛽11𝑖∆𝑇𝐶𝐴/𝑇𝐴𝑖𝑡 − 𝛽21𝑖∆𝑇𝐶𝐿/𝑇𝐴𝑖𝑡
− 𝛽31𝑖∆𝐶𝐶𝐶𝑖𝑡 − 𝛽41𝑖∆𝑆𝐼𝑍𝐸𝑖𝑡 + 𝑢𝑖𝑡 𝑴𝒐𝒅. 𝟓
∆𝑅𝑂𝐸𝑖𝑡 = 𝜙𝑖(𝑅𝑂𝐸𝑖𝑡−1 − 𝜃0𝑖 − 𝜃1𝑖𝑇𝐶𝐴/𝑇𝐴𝑖𝑡 − 𝜃2𝑖𝑇𝐶𝐿/𝑇𝐴𝑖𝑡 − 𝜃3𝑖𝐶𝐶𝐶𝑖𝑡
− 𝜃4𝑖𝑆𝐼𝑍𝐸𝑖𝑡 − 𝜃5𝑖𝐿𝐸𝑉𝑖𝑡) − 𝛽11𝑖∆𝑇𝐶𝐴/𝑇𝐴𝑖𝑡 − 𝛽21𝑖∆𝑇𝐶𝐿/𝑇𝐴𝑖𝑡
− 𝛽31𝑖∆𝐶𝐶𝐶𝑖𝑡 − 𝛽41𝑖∆𝑆𝐼𝑍𝐸𝑖𝑡 − 𝛽51𝑖∆𝐿𝐸𝑉𝑖𝑡
+ 𝑢𝑖𝑡 𝑀𝑜𝑑 𝟓𝒂
∆𝑙𝑛𝑀𝐵𝑅𝑖𝑡 = 𝜙𝑖(𝑙𝑛𝑀𝐵𝑅𝑖𝑡−1 − 𝜃0𝑖 − 𝜃1𝑖𝑇𝐶𝐴/𝑇𝐴𝑖𝑡 − 𝜃2𝑖𝑇𝐶𝐿/𝑇𝐴𝑖𝑡
− 𝜃3𝑖𝐶𝐶𝐶𝑖𝑡 − 𝜃4𝑖𝑆𝐼𝑍𝐸𝑖𝑡) − 𝛽11𝑖∆𝑇𝐶𝐴/𝑇𝐴𝑖𝑡 − 𝛽21𝑖∆𝑇𝐶𝐿/𝑇𝐴𝑖𝑡
− 𝛽31𝑖∆𝐶𝐶𝐶𝑖𝑡 − 𝛽41𝑖∆𝑆𝐼𝑍𝐸𝑖𝑡 + 𝑢𝑖𝑡 𝑀𝑜𝑑 𝟔
∆𝑙𝑛𝑀𝐵𝑅𝑖𝑡 = 𝜙𝑖(𝑙𝑛𝑀𝐵𝑅𝑖𝑡−1 − 𝜃0𝑖 − 𝜃1𝑖𝑇𝐶𝐴/𝑇𝐴𝑖𝑡 − 𝜃2𝑖𝑇𝐶𝐿/𝑇𝐴𝑖𝑡
− 𝜃3𝑖𝐶𝐶𝐶𝑖𝑡 − 𝜃4𝑖𝑆𝐼𝑍𝐸𝑖𝑡 − 𝜃5𝑖𝐿𝐸𝑉𝑖𝑡) − 𝛽11𝑖∆𝑇𝐶𝐴/𝑇𝐴𝑖𝑡
− 𝛽21𝑖∆𝑇𝐶𝐿/𝑇𝐴𝑖𝑡 − 𝛽31𝑖∆𝐶𝐶𝐶𝑖𝑡 − 𝛽41𝑖∆𝑆𝐼𝑍𝐸𝑖𝑡 − 𝛽51𝑖∆𝐿𝐸𝑉𝑖𝑡
+ 𝑢𝑖𝑡 𝑀𝑜𝑑 𝟔𝒂
∆𝑙𝑛𝑇𝑂𝐵𝐼𝑁𝑄𝑖𝑡 = 𝜙𝑖(𝑙𝑛𝑇𝑂𝐵𝐼𝑁𝑄𝑖𝑡−1 − 𝜃0𝑖 − 𝜃1𝑖𝑇𝐶𝐴/𝑇𝐴𝑖𝑡 − 𝜃2𝑖𝑇𝐶𝐿/𝑇𝐴𝑖𝑡
− 𝜃3𝑖𝐶𝐶𝐶𝑖𝑡 − 𝜃4𝑖𝑆𝐼𝑍𝐸𝑖𝑡) − 𝛽11𝑖∆𝑇𝐶𝐴/𝑇𝐴𝑖𝑡 − 𝛽21𝑖∆𝑇𝐶𝐿/𝑇𝐴𝑖𝑡
− 𝛽31𝑖∆𝐶𝐶𝐶𝑖𝑡 − 𝛽41𝑖∆𝑆𝐼𝑍𝐸𝑖𝑡 + 𝑢𝑖𝑡 𝑀𝑜𝑑 𝟕
∆𝑙𝑛𝑇𝑂𝐵𝐼𝑁𝑄𝑖𝑡 = 𝜙𝑖(𝑙𝑛𝑇𝑂𝐵𝐼𝑁𝑄𝑖𝑡−1 − 𝜃0𝑖 − 𝜃1𝑖𝑇𝐶𝐴/𝑇𝐴𝑖𝑡 − 𝜃2𝑖𝑇𝐶𝐿/𝑇𝐴𝑖𝑡
− 𝜃3𝑖𝐶𝐶𝐶𝑖𝑡 − 𝜃4𝑖𝑆𝐼𝑍𝐸𝑖𝑡 − 𝜃5𝑖𝐿𝐸𝑉𝑖𝑡) − 𝛽11𝑖∆𝑇𝐶𝐴/𝑇𝐴𝑖𝑡
− 𝛽21𝑖∆𝑇𝐶𝐿/𝑇𝐴𝑖𝑡 − 𝛽31𝑖∆𝐶𝐶𝐶𝑖𝑡 − 𝛽41𝑖∆𝑆𝐼𝑍𝐸𝑖𝑡 − 𝛽51𝑖∆𝐿𝐸𝑉𝑖𝑡
+ 𝑢𝑖𝑡 𝑀𝑜𝑑 𝟕𝒂
© University of Cape Coast https://erl.ucc.edu.gh/jspui
Digitized by Sam Jonah Library

74
∆𝐸𝑉𝐴𝑖𝑡 = 𝜙𝑖(𝐸𝑉𝐴𝑖𝑡−1 − 𝜃0𝑖 − 𝜃1𝑖𝑇𝐶𝐴/𝑇𝐴𝑖𝑡 − 𝜃2𝑖𝑇𝐶𝐿/𝑇𝐴𝑖𝑡 − 𝜃3𝑖𝐶𝐶𝐶𝑖𝑡
− 𝜃4𝑖𝑆𝐼𝑍𝐸𝑖𝑡) − 𝛽11𝑖∆𝑇𝐶𝐴/𝑇𝐴𝑖𝑡 − 𝛽21𝑖∆𝑇𝐶𝐿/𝑇𝐴𝑖𝑡
− 𝛽31𝑖∆𝐶𝐶𝐶𝑖𝑡 − 𝛽41𝑖∆𝑆𝐼𝑍𝐸𝑖𝑡 + 𝑢𝑖𝑡 𝑀𝑜𝑑 𝟖
∆𝐸𝑉𝐴𝑖𝑡 = 𝜙𝑖(𝐸𝑉𝐴𝑖𝑡−1 − 𝜃0𝑖 − 𝜃1𝑖𝑇𝐶𝐴/𝑇𝐴𝑖𝑡 − 𝜃2𝑖𝑇𝐶𝐿/𝑇𝐴𝑖𝑡 − 𝜃3𝑖𝐶𝐶𝐶𝑖𝑡
− 𝜃4𝑖𝑆𝐼𝑍𝐸𝑖𝑡 − 𝜃5𝑖𝐿𝐸𝑉𝑖𝑡) − 𝛽11𝑖∆𝑇𝐶𝐴/𝑇𝐴𝑖𝑡 − 𝛽21𝑖∆𝑇𝐶𝐿/𝑇𝐴𝑖𝑡
− 𝛽31𝑖∆𝐶𝐶𝐶𝑖𝑡 − 𝛽41𝑖∆𝑆𝐼𝑍𝐸𝑖𝑡 − 𝛽51𝑖∆𝐿𝐸𝑉𝑖𝑡
+ 𝑢𝑖𝑡 𝑀𝑜𝑑 𝟖𝒂
Chapter Summary
This chapter highlights the research methods adopted for this study. The
study employs longitudinal, explanatory non-experimental research design in a
panel cointegration methodology framework to determine the effects working
capital management policies have on shareholder value. The major limitation of
the study was the small number of firms making the unit of analysis. The study
covers a very small number of firms thereby placing a limitation on the findings,
results, interpretation and generalization of the findings.
© University of Cape Coast https://erl.ucc.edu.gh/jspui
Digitized by Sam Jonah Library

75
CHAPTER FOUR
RESULTS AND DISCUSSION
Introduction
The purpose of this study was to determine the effects of working capital
management policies on shareholder value of manufacturing firms listed on the
Ghana Stock Exchange from 2000 to 2013. The analyses are based on the
methodology as discussed in the previous chapter. The chapter is divided into
seven main sections: firstly, the descriptive statistics of the variables are
reported in Tables 2-10. These are followed by Tables 11 to 14 which report the
ANOVA tests results. Panel unit roots tests, panel cointegration tests, Grouped-
FMOLS cointegration regression results and regression results from the Panel
ARDL are also respectively presented from Table 15 through Table 28.
Descriptive Statistics
Before any statistical inferences can be made from a data set, it would
be appropriate to know the underlying pattern in the data set. Essentially,
descriptive statistics use graphical and/or numerical methods to portray the
patterns in a data set (McClave & Sincish, 2000). This section provides a
summary of the descriptive statistics of the dependent and independent
variables. It shows the average indicators of variables computed from the
financial statements of six manufacturing firms listed on the Ghana Stock
Exchange from 2000 to 2013 for the individual firms, the sub-sectors and the
panel as a whole. The study has used nine variables for the analysis purpose
including four dependent variables and five independent variables. The
dependent variables are ROE, Market-to-Book ratio, Tobin’s Q and EVA. The
© University of Cape Coast https://erl.ucc.edu.gh/jspui
Digitized by Sam Jonah Library

76
independent variables are current assets investment policy measured as
TCA/TA, current assets financing policy proxy by TCL/TA and CCC as a
comprehensive measure of working capital management of the selected firms.
Other two independent control variables used were size, measured by the natural
logarithm of total revenue and financial leverage of the firms also proxy by debt-
equity ratio. Table 2 to Table 10 present the descriptive statistics for ROE,
market-to-book ratio, Tobin’s Q, EVA, TCA/TA, TCL/TA, CCC, Size and
debt-to-equity ratio respectively. From Table 2, it can be observed that all the
series are normally distributed as revealed by the Jacque-Berra statistic with the
exception of Guinness Ghana Breweries.
Table 2
Descriptive Statistics for Return on Equity
Company Obs. Mean Median Std. Dev. Quartile Dev. Jacque-Berra Prob.
ALUWKS 14 0.134 0.121 0.264 0.179 1.0475 .5923
CMLT 14 0.521 0.472 0.175 0.094 1.5758 .4686
FML 14 0.548 0.540 0.194 0.118 0.1783 .9147
GGBL 14 0.445 0.423 0.228 0.103 7.1584 .0278
PZC 14 0.214 0.233 0.107 0.079 0.5542 .7579
UNIL 14 0.432 0.421 0.214 0.129 0.2131 .8989
F & B 28 0.497 0.448 0.214 0.094 2.4966 .2869
O. MFG 56 0.325 0.325 0.249 0.145 0.1595 .9233
ALL 84 0.382 0.401 0.251 0.142 0.1974 .9060
Source: Computed from Annual Reports of Study Companies from 2000- 2013
The mean return on equity for all the firms was 38.2% with a standard
deviation of 25.1% (median 40.1%) while the food and beverages
© University of Cape Coast https://erl.ucc.edu.gh/jspui
Digitized by Sam Jonah Library

77
manufacturing firms and other traditional manufacturing subsectors recorded a
mean return on equity of 49.7% (SD 12.4%) and 32.5% (SD 24.5%)
respectively.
The mean return on equity for the individual company’s ranges from
13.4% to 54.8% during the study period with the Fan Milk Limited having the
highest return on equity of 54.8% (SD=19.4%), followed by Camelot Ghana
limited having a mean return on equity of 52.1% with a standard deviation of
17.5%. Guinness Ghana Breweries recorded an average return on equity of
42.3% with a quartile deviation of 10.3% during the study period. Aluworks
Limited was found to have the least return on equity of 13.4% with a standard
deviation of 26% followed by PZC Ltd with an average return of 21.4% (SD =
0.079).
From Table 3, the Jacque-Berra statistic indicates that Unilever,
traditional manufacturing subsector and the panel data are not normally
distributed hence the median values have been selected to be the average
indicator for these data sets. However, all the other data sets are normally
distributed thus the mean is reported as the average indicator. The median
market-to-book ratio is 2.05 with a quartile deviation of 1.54 (Mean value 3.37;
SD 4.44) for all the firms. The average market-to-book ratio for all the selected
firms was above 1. This means that the market value of the firms exceeds the
book value of the equity by 105%. Thus, these companies have created value
for their shareholders. Food and Beverage manufacturing firms recorded an
average market-to-book ratio of 4.17 with a standard deviation of 2.50 while
other manufacturing subsector registered an average market-to-book ratio of
1.39 with a quartile deviation of 1.01 (Mean value 2.97; SD 5.11). Thus, food
© University of Cape Coast https://erl.ucc.edu.gh/jspui
Digitized by Sam Jonah Library

78
and beverages firms created more value than other manufacturing firms. It can
be observed that GGBL, Unilever, FML and CMLT have all created average
market-to-book ratio above the industrial value with average values of 4.49 (SD
2.49), 4.43 (QD 2.42), 3.85 (SD 2.56) and 2.13 (SD 1.15) respectively. The least
value creators were PZ Cussons Ghana Ltd and Aluworks Ghana Ltd having
1.05 and 1.55 with standard deviations of 0.34, 1.29 respectively.
Table 3
Descriptive Statistics for Market-to-Book Ratio
Company Obs. Mean Median Std. Dev. Quartile Dev. Jacque-Berra Prob.
ALUWKS 14 1.545 1.306 1.299 0.601 2.8071 .2457
CMLT 14 2.134 2.046 1.147 0.828 0.9845 .6113
FML 14 3.849 3.432 2.555 1.597 2.0643 .3562
GGBL 14 4.489 4.398 2.486 1.265 3.1465 .2074
PZC 14 1.052 1.177 0.343 0.223 1.2501 .5352
UNIL 14 7.151 4.434 9.046 2.417 25.306 .0000
F & B 28 4.169 3.731 2.495 1.568 4.6707 .0967
O. MFG 56 2.970 1.386 5.115 1.014 1880.7 .0000
ALL 84 3.370 2.046 4.436 1.537 3462.1 .0000
Source: Computed from Annual Reports of Study Companies from 2000- 2013
From Table 4, the mean (median) Tobin’s Q for all the study firms is
1.90 (1.29) with a standard deviation (quartile deviation) of 1.33 (0.64). Since
the data is positively skewed, the median values will be appropriate to represent
the average value. Thus, the selected companies during the study period have
firm value slightly greater than the asset replacement cost. This means that
© University of Cape Coast https://erl.ucc.edu.gh/jspui
Digitized by Sam Jonah Library
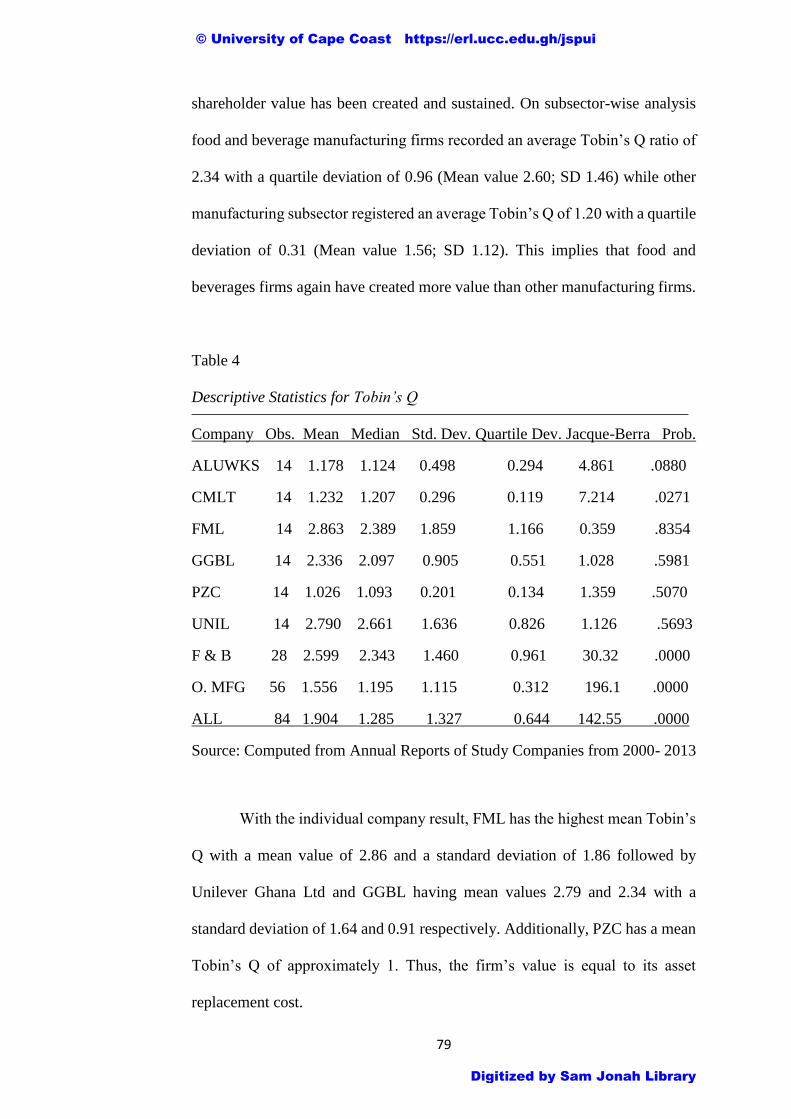
79
shareholder value has been created and sustained. On subsector-wise analysis
food and beverage manufacturing firms recorded an average Tobin’s Q ratio of
2.34 with a quartile deviation of 0.96 (Mean value 2.60; SD 1.46) while other
manufacturing subsector registered an average Tobin’s Q of 1.20 with a quartile
deviation of 0.31 (Mean value 1.56; SD 1.12). This implies that food and
beverages firms again have created more value than other manufacturing firms.
Table 4
Descriptive Statistics for Tobin’s Q
Company Obs. Mean Median Std. Dev. Quartile Dev. Jacque-Berra Prob.
ALUWKS 14 1.178 1.124 0.498 0.294 4.861 .0880
CMLT 14 1.232 1.207 0.296 0.119 7.214 .0271
FML 14 2.863 2.389 1.859 1.166 0.359 .8354
GGBL 14 2.336 2.097 0.905 0.551 1.028 .5981
PZC 14 1.026 1.093 0.201 0.134 1.359 .5070
UNIL 14 2.790 2.661 1.636 0.826 1.126 .5693
F & B 28 2.599 2.343 1.460 0.961 30.32 .0000
O. MFG 56 1.556 1.195 1.115 0.312 196.1 .0000
ALL 84 1.904 1.285 1.327 0.644 142.55 .0000
Source: Computed from Annual Reports of Study Companies from 2000- 2013
With the individual company result, FML has the highest mean Tobin’s
Q with a mean value of 2.86 and a standard deviation of 1.86 followed by
Unilever Ghana Ltd and GGBL having mean values 2.79 and 2.34 with a
standard deviation of 1.64 and 0.91 respectively. Additionally, PZC has a mean
Tobin’s Q of approximately 1. Thus, the firm’s value is equal to its asset
replacement cost.
© University of Cape Coast https://erl.ucc.edu.gh/jspui
Digitized by Sam Jonah Library

80
From Table 5, the mean economic value added was (GHS341820.00)
with a standard deviation of GHS 6,381,923.00 for all the selected companies.
This means that the selected firms have destroyed value altogether. However,
as the Jacque- Berra statistic indicates that the data is not normally distributed,
the mean value may not be an appropriate indicator. Thus, based on the median
value of GHS33, 352.00 (QD, GHS1, 449,561.00), the selected firms have
positively created value for the shareholders. However, it can be observed that
food and beverage firms created shareholder value for their shareholders while
other manufacturing firms destroyed value entirely for their shareholders. This
development may have been occasioned by their high cost of capital. Highest
value destroyer for the individual firms was Guinness Ghana Breweries Ltd,
followed by the Aluworks Ghana Ltd whilst Fan milk Ghana Ltd, Unilever
Ghana Ltd and Camelot Ghana Ltd respectively created value for their
shareholders.
Table 5
Descriptive Statistics for Economic Value Added
Company Obs. Mean Median Std. Dev Quartile Dev. Jacq-Berra Prob.
ALUWKS 14 -3512506 -1329953 4745253 3605834 1.3822 .5010
CMLT 14 4462 7322 88273 27375 1.4363 .4876
FML 14 3720636 1864608 3831269 2115668 2.0925 .3513
GGBL 14 -4534346 -522166 10604289 6901231 1.5630 .4577
PZC 14 -652133 -125710 1893639 541588 9.3375 .0094
UNIL 14 2922969 2857212 6896184 2758843 1.8295 .4006
F & B 28 -406855 1309147 8881311 1929868 13.270 .0013
O. MFG 56 -309302 -4414 4768508 1056700 56.740 .0000
ALL 84 -341820 33352 6381923 1449561 82.225 .0000
Source: Computed from Annual Reports of Study Companies from 2000- 2013
© University of Cape Coast https://erl.ucc.edu.gh/jspui
Digitized by Sam Jonah Library

81
The negative values indicate that the return on equity available for the
shareholders was less than their required return based on the level of risk
assumed. Thus the cost of equity capital was higher than the return from the
invested equity.
The mean value of TCA/TA for all the selected firm was 0.4882 with a
standard deviation of 0.164 as shown in Table 6. Since the mean value is less
than 0.5, this indicates that the selected firms are relatively following aggressive
current asset investment policy. Whereas food and beverages manufacturing
firms were relatively following aggressive current asset investment policy, other
manufacturing firms were seen to be following conservative investment policy
with a mean values of 0.4162 (SD 0.13) and 0.5242 (SD 0.17) respectively.
Table 6
Descriptive Statistics for Total Current Asset/Total Asset
Company Obs. Mean Median Std. Dev Quartile Dev Jacque- Berra Prob.
ALUWKS 14 0.5061 0.6038 0.217 0.194 1.5722 .4556
CMLT 14 0.4169 0.4578 0.097 0.059 1.6049 .4482
FML 14 0.5009 0.5164 0.084 0.070 0.5362 .7648
GGBL 14 0.3316 0.3156 0.113 0.095 1.0243 .5992
PZC 14 0.6755 0.6830 0.099 0.049 0.2915 .8644
UNIL 14 0.4983 0.4749 0.129 0.107 1.1379 .5661
F & B 28 0.4162 0.4257 0.130 0.102 1.3089 .5197
O. MFG 56 0.5242 0.5245 0.169 0.121 2.3438 .3097
ALL 84 0.4882 0.4843 0.164 0.123 2.5178 .2840
Source: Computed from Annual Reports of Study Companies from 2000- 2013
© University of Cape Coast https://erl.ucc.edu.gh/jspui
Digitized by Sam Jonah Library

82
Furthermore, with company-wise analysis, it can be observed that the
mean value for PZC is 0.6755 with a standard deviation of 0.099. Thus, PZC is
relatively more conservative in managing current asset. On the other hand,
Guinness Ghana Breweries Ltd, Camelot Group Ghana Ltd and Unilever Ltd
are relatively being aggressive in their current asset management with a mean
values of 0.3312, 0.4169 and, 0.4983 and standard deviations of 0.113, 0.097
and 0.129 respectively.
From Table 7, the average current asset financing policy measured by
TCL/TA for all the selected firms is 0.4357 with a standard deviation of 0.141.
This means firms are being conservative in the management of current
liabilities. Additionally, it can be observed that all the subsectors also follow
conservative current asset financing policy with a mean values of 0.4313 (SD
0.144) and 0.4378 (SD 0.140) for food and beverage manufacturing firms and
other manufacturing firms respectively. Thus, the overall policy for the
management of working capital by these firms is moderate working capital
management policy. This indicated that the selected firms use relatively low
proportion of current asset as a percentage of total asset as well as low
proportion of current liability to fund total capital. Furthermore, it can be
noticed that whereas food and beverage firms follow moderate working capital
management policy, other manufacturing firms are relatively following
conservative working capital management policy. It can further be observed that
with the exception of Unilever which has TCL/TA ratio of 50.2%, all the other
companies in the sample period were relatively conservative in the management
of the short term liabilities by having TCL/TA ratio of less than 50%. Thus,
these companies rely more on long term funds as a source of finance for their
© University of Cape Coast https://erl.ucc.edu.gh/jspui
Digitized by Sam Jonah Library

83
operations. Additionally, with the exception of PZC which has relatively higher
proportion of total current asset as ratio of total asset and less proportion of
current liability in relation to total asset thereby following conservative policy
in the management of its working capital, and Unilever which is being
aggressive in the asset and liability management, all other firms are relatively
pursuing moderate working capital management policies.
Table 7
Descriptive Statistics for Total Current Liabilities/Total Assets
Company Obs. Mean Median Std. Dev Quartile Dev. Jacque-Berra Prob.
ALUWKS 14 0.4111 0.3695 0.132 0.105 0.9151 .6328
CMLT 14 0.4677 0.4188 0.184 0.162 1.2432 .5371
FML 14 0.3939 0.3367 0.156 0.102 1.1053 .5754
GGBL 14 0.4688 0.4635 0.124 0.072 0.0856 .9581
PZC 14 0.3712 0.3529 0.053 0.036 1.2487 .5356
UNIL 14 0.5015 0.4998 0.137 0.072 1.4227 .4910
F & B 28 0.4313 0.4179 0.144 0.101 1.0802 .5826
O. MFG 56 0.4378 0.3929 0.140 0.099 3.2663 .1953
ALL 84 0.4357 0.4130 0.141 0.101 3.1454 .2075
Source: Computed from Annual Reports of Study Companies from 2000- 2013
The cash conversion cycle (CCC) as reported in Table 8 has a median
of 72 days with a quartile deviation of 35 days (Mean =75 days; SD =62 days)
for all the firms. This means that on average, it takes a cycle of two and half
months for these firms to get cash from their customers and settle their suppliers
after purchase of raw materials. This confirms that the sample firms are
following moderate working capital policies. It can further be seen that, food
© University of Cape Coast https://erl.ucc.edu.gh/jspui
Digitized by Sam Jonah Library

84
and beverages firms have a median of 46 days with a quartile deviation of 27
days (Mean =60 days; SD =48 days) whilst other manufacturing firms have a
median of 87 days with a quartile deviation of 35 days (Mean =82 days; SD =67
days). Thus, using the Cash Conversion Cycle as a comprehensive measure of
working capital management policy, food and beverages firms were relatively
being moderate whereas other manufacturing firms were found to be relatively
conservative in their working capital management.
Table 8
Descriptive Statistics for Cash Conversion Cycle
Company Obs. Mean Median Std. Dev Quartile Dev. Jacque-Berra Prob.
ALUWKS 14 63.90 49.82 30.78 25.37 1.5108 .4698
CMLT 14 114.17 107.12 34.65 18.96 19.7418 .0000
FML 14 34.17 34.89 18.41 6.02 1.0813 .5823
GGBL 14 85.61 85.54 55.14 18.19 0.2494 .8827
PZC 14 137.38 99.27 80.56 51.85 3.0668 .2158
UNIL 14 14.14 18.67 28.07 12.61 4.6776 .0964
F & B 28 59.89 46.22 48.09 27.31 6.1210 .0468
O. MFG 56 82.39 86.61 67.29 34.64 24.877 .0000
ALL 84 74.90 72.07 62.18 35.24 48.256 .0000
Source: Computed from Annual Reports of Study Companies from 2000- 2013
On the company wise, it can be observed that, Unilever has shortest
mean CCC of 14 days with a standard deviation of 28 days whereas PZC has
the longest CCC of 137 days having a standard deviation of 81 days. Thus, using
the CCC as a comprehensive measure of working capital management, PZC and
© University of Cape Coast https://erl.ucc.edu.gh/jspui
Digitized by Sam Jonah Library

85
Unilever are following conservative and aggressive policies as the overall
working capital management policies respectively.
Firm size registered an average value of 17.61 with a quartile deviation
of 0.92 (Mean is 17.19 and SD=1.64) for all the firms as depicted on Table 9.
The smallest company is Camelot Ghana Ltd with firm size of 14.24 whereas
Unilever and GGBL are seen as the bigger firms having 18.65 and 18.23
respectively whilst Aluworks, FML and PZC have relatively the same size as
the bench mark size.
Table 9
Descriptive Statistics for Size
Company Obs. Mean Median Std. Dev Quartile Dev. Jacque-Berra Prob.
ALUWKS 14 17.52 17.66 0.305 0.194 1.4080 .4946
CMLT 14 14.24 14.34 0.792 0.657 0.8994 .6378
FML 14 17.46 17.41 1.018 0.827 0.9316 .6276
GGBL 14 18.23 18.25 1.057 0.820 0.9690 .6160
PZC 14 17.07 17.06 0.930 0.605 0.6316 .7292
UNIL 14 18.65 18.66 0.589 0.356 0.4670 .7918
F & B 28 17.84 17.89 1.091 0.836 1.2878 .5252
O. MFG 56 16.87 17.51 1.772 1.406 5.2066 .0740
ALL 84 17.19 17.61 1.638 0.922 10.661 .0048
Source: Computed from Annual Reports of Study Companies from 2000- 2013
Finally, debt-equity ratio also recorded an average value of 10.3% with
a quartile deviation of 12.5% (Mean is 50.8% and SD=123%) for all the firms.
This means that on average the selected firms are lowly geared. However, food
© University of Cape Coast https://erl.ucc.edu.gh/jspui
Digitized by Sam Jonah Library

86
and beverages firms were found to rely more on equity than long term-debt with
an average value of 9.5% and quartile deviation of 7.5% (mean = 19.9% and SD
= 26.8%) whilst other manufacturing firms have a median ratio higher the
industry average of 10.3% and quartile deviation of 16.5% (mean is 66.2% and
SD is 147.9%). Furthermore, on the company-wise analysis it can be seen that
Camelot Ghana Ltd has mean debt-equity ratio of 197% with standard deviation
of 253% suggesting that it is a highly geared company. The least lowly geared
company is Fan Milk Ltd with an average value of 4.0% and quartile deviation
of 2.5% (mean is 6.8% and SD is 12.3%).
Table 10
Descriptive Statistics for Debt-Equity Ratio
Company Obs. Mean Median Std. Dev Quartile Dev. Jacque-Berra Prob.
ALUWKS 14 0.511 0.278 0.528 0.912 7.6208 .0221
CMLT 14 1.970 0.885 2.530 1.642 3.2882 .1932
FML 14 0.068 0.041 0.123 0.025 58.820 .0000
GGBL 14 0.329 0.165 0.312 0.173 6.3862 .0410
PZC 14 0.072 0.072 0.022 0.007 1.1459 .5639
UNIL 14 0.095 0.074 0.070 0.038 3.3412 .1881
F & B 28 0.199 0.095 0.268 0.075 39.387 .0000
O. MFG 56 0.662 0.103 1.479 0.165 403.87 .0000
ALL 84 0.508 0.103 1.233 0.125 1444.50 .0000
Source: Computed from Annual Reports of Study Companies from 2000- 2013
Based on the descriptive statistics as reported on Tables 6, 7 and, 8 the
listed manufacturing firms were found to be following moderate working capital
management policies. This implies that the selected firms use relatively low
© University of Cape Coast https://erl.ucc.edu.gh/jspui
Digitized by Sam Jonah Library

87
proportion of current asset as a percentage of total asset as well as low
proportion of current liability to fund total capital.
Analysis of Variance (ANOVA)
The first research objective was to determine whether differences exist
among the firms with regard to their current asset investment and financing
policies. The differences in the relative degree of aggressive/conservative
current assets investment and financing policies among firms have been tested
through one-way ANOVA and post hoc tests. Firms’ current asset investment
policy, measured by Total Current Asset/ Total Asset, was first examined and
the results are presented in Table 11. The observed F-ratio of 10.686 is
significant at 1% level of significance, and this indicates that a significant
difference exists between the firm practices relating to aggressive/conservative
current assets investment policies.
Table 11
ANOVA Test for Total Current Asset/Total Asset
Sum of Df Mean F Sig.
Squares Squares
Between groups .914 5 .183 10.686 .000
Within groups 1.334 78 .017
Total 2.248 83
Source: Field Work, Quansah (2016)
© University of Cape Coast https://erl.ucc.edu.gh/jspui
Digitized by Sam Jonah Library

88
To further examine the strength of the differences between firms’
values, Least Significant Difference (LSD) and Tukey’s Honestly Significance
Difference (HSD) tests were performed to compare the firms’ mean values of
TCA/TA on a paired sample basis. Studies such as Weinraub and Visscher
(1998); Salawu (2007); Afza and Nazir (2008) have applied Tukey’s HSD and
LSD tests to examine differences in working capital policies. The results are
presented in Table 12 and Table 13 respectively. As can be observed from Table
12 for Least Significant Difference (LSD), among 15 pairs, eight pairs are
statistically significant at 5 percent level of significance. This left seven pairs of
firms with ratios whose differences were not statistically significant at the
conventional level of significance.
Table 12
Test of Least Significance Differences (LSD) for Total Current Asset/Total Asset
COMPANY ALUWORKS CMLT FML GGBL PZC UNIL
ALUWORKS --
CMLT .089* --
FML .005 -.084* --
GGBL .174*** .085* .169*** --
PZC -.169*** -.256*** -.174*** -.343*** --
UNIL .007 -.081 .002 -.166*** .177*** --
***Significant at 1% level **Significant at 5% level *Significant at 10% level
From Table 13, the Tukey’s HSD test indicated that 8 out of 15 pairs are
statistically significant at 5 percent level of significance while the remaining
seven pairs of firms were found to be homogeneous. It could be observed from
both ANOVA and all post hoc tests for variance that significant differences exist
© University of Cape Coast https://erl.ucc.edu.gh/jspui
Digitized by Sam Jonah Library
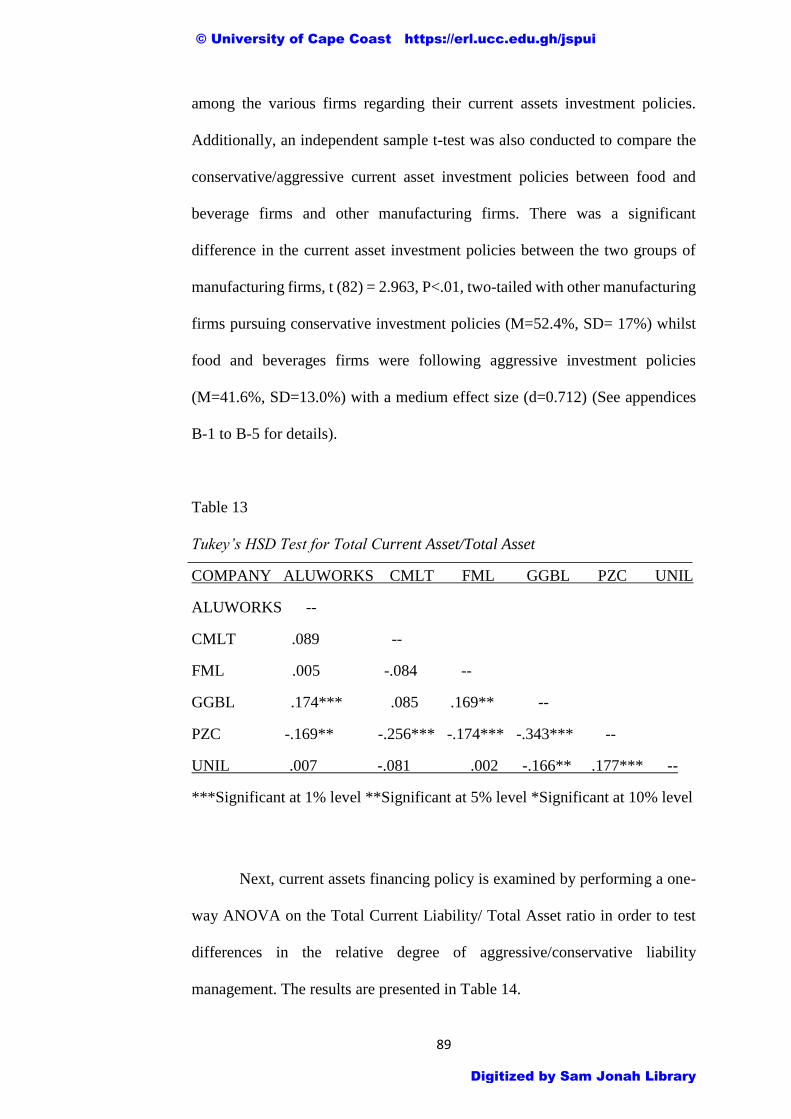
89
among the various firms regarding their current assets investment policies.
Additionally, an independent sample t-test was also conducted to compare the
conservative/aggressive current asset investment policies between food and
beverage firms and other manufacturing firms. There was a significant
difference in the current asset investment policies between the two groups of
manufacturing firms, t (82) = 2.963, P<.01, two-tailed with other manufacturing
firms pursuing conservative investment policies (M=52.4%, SD= 17%) whilst
food and beverages firms were following aggressive investment policies
(M=41.6%, SD=13.0%) with a medium effect size (d=0.712) (See appendices
B-1 to B-5 for details).
Table 13
Tukey’s HSD Test for Total Current Asset/Total Asset
COMPANY ALUWORKS CMLT FML GGBL PZC UNIL
ALUWORKS --
CMLT .089 --
FML .005 -.084 --
GGBL .174*** .085 .169** --
PZC -.169** -.256*** -.174*** -.343*** --
UNIL .007 -.081 .002 -.166** .177*** --
***Significant at 1% level **Significant at 5% level *Significant at 10% level
Next, current assets financing policy is examined by performing a one-
way ANOVA on the Total Current Liability/ Total Asset ratio in order to test
differences in the relative degree of aggressive/conservative liability
management. The results are presented in Table 14.
© University of Cape Coast https://erl.ucc.edu.gh/jspui
Digitized by Sam Jonah Library
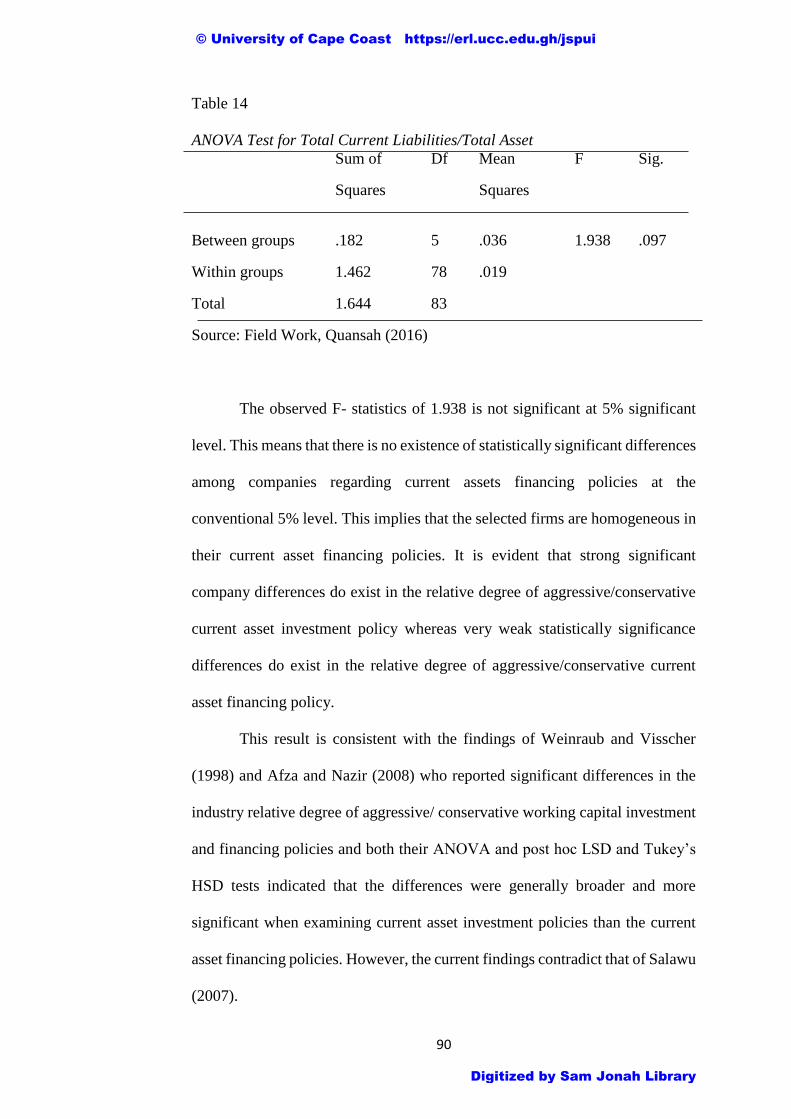
90
Table 14
ANOVA Test for Total Current Liabilities/Total Asset
Sum of Df Mean F Sig.
Squares Squares
Between groups .182 5 .036 1.938 .097
Within groups 1.462 78 .019
Total 1.644 83
Source: Field Work, Quansah (2016)
The observed F- statistics of 1.938 is not significant at 5% significant
level. This means that there is no existence of statistically significant differences
among companies regarding current assets financing policies at the
conventional 5% level. This implies that the selected firms are homogeneous in
their current asset financing policies. It is evident that strong significant
company differences do exist in the relative degree of aggressive/conservative
current asset investment policy whereas very weak statistically significance
differences do exist in the relative degree of aggressive/conservative current
asset financing policy.
This result is consistent with the findings of Weinraub and Visscher
(1998) and Afza and Nazir (2008) who reported significant differences in the
industry relative degree of aggressive/ conservative working capital investment
and financing policies and both their ANOVA and post hoc LSD and Tukey’s
HSD tests indicated that the differences were generally broader and more
significant when examining current asset investment policies than the current
asset financing policies. However, the current findings contradict that of Salawu
(2007).
© University of Cape Coast https://erl.ucc.edu.gh/jspui
Digitized by Sam Jonah Library

91
Results of Panel Unit Root Tests
In order to deal with the issue of spurious regression and choose the appropriate
estimator, the panel unit root test was performed. The results are presented in
Tables 15 and 16. As indicated in the methodology, three panel unit root
methods were applied. Table 15 reports summary panel unit root tests on level
data of the study variables while Table 16 reports the results of the panel unit
root test at their first differences.
Table 15
Results of Panel Unit Root Test in Order Zero (levels)
LLC IPS ADF
Variable Intercept Int. &Trnd Intercept Int. &Trnd Intercept Int. &Trnd
ROE -2.599** -0.6325 -2.7363** -0.7835 27.076** 15.5904
MBR 1.6322 -0.4560 1.7326 1.5148 11.8325 11.9838
LnMBR -2.7929 -3.4678** -0.8861 -0.4422 16.7228 14.4455
TOBINQ -0.8746 -3.8869** 0.2012 -1.3163 12.7060 18.0808
LnTOBINQ -1.8376 -4.7358** -0.3255 -1.5795 10.8393 20.2033
EVA -2.3001 -5.3384** -0.7007 -4.4660** 18.7840 39.745**
TCA/TA -1.9429* -0.7441 -0.9936 0.1632 15.6848 10.2866
TCL/TA -2.6140** -2.3412** -0.6009 0.3651 14.9943 10.8796
CCC 0.3188 -2.4517** 0.8696 -0.7629 14.1795 20.3699
SIZE -4.6941** -4.1861** -.1.4146 -1.2447 18.1416 20.2662
LEV -10.349** -15.197** -5.8977** -6.493** 34.933** 30.223**
Note: **, * indicate a significant level of 1% and 5% respectively. Probabilities
for fisher tests are computed using an asymptotic Chi-square distribution. All
other tests assume asymptotic normality. LLC=Levin, Lin & Chu (2002), IPS=
Im, Pesaran & Shin (2003), ADF=Fisher type Chi square by Maddala & Wu
(1999)
© University of Cape Coast https://erl.ucc.edu.gh/jspui
Digitized by Sam Jonah Library
92
As can be readily seen, both IPS and ADF tests fail to reject the unit root null
for all the variables in the level form except return on equity and debt-equity
ratio when individual intercepts were included. Similarly, both IPS and ADF
tests fail to reject the unit root null for all the variables in the level form except
EVA and debt-equity ratio when individual intercept and time trend were
included. Also, with exception of market-to-book ratio, Tobin’s Q and CCC,
the LLC test did not reject the null of a unit root in the levels when individual
intercept was considered. When intercept and time trend are considered, the
LLC test does reject the null of unit root for all the variables except ROE,
market-to-book ratio and TCA/TA. However, it can be observed from Table 16
that all the tests do reject the null of a unit root in difference form with or without
the inclusion of time trends. Thus, the evidence suggests that the variables are
integrated of order one I (1) and that they exhibit nonstationary processes hence
the direct application of OLS or GLS on them will produce spurious and biased
estimates.
Therefore, it would be appropriate to use cointegration technique to
establish whether a long-run stable relationship exists among the nonstationary
variables in level form.
However, since firms’ gearing ratio is stationary at level as reported by
all the panel unit root tests, it was excluded from the cointegration equation and
the subsequent cointegration regression using the panel fully modified ordinary
least squares estimation but was included in the panel ARDL estimation.
© University of Cape Coast https://erl.ucc.edu.gh/jspui
Digitized by Sam Jonah Library

93
Table 16
Results of Panel Unit Root Test in Order One (First Difference)
LLC IPS ADF
Variable Intercept Int. &Trnd Intercept Int. &Trnd Intercept Int. &Trnd
ROE -7.766** -7.315** -6.834** -5.288** 59.402** 44.262*
MBR -6.908** -5.232** -5.055** -3.180** 52.973** 36.435**
LnMBR -9.203** -8.107** -6.692** -4.943** 58.051** 43.114**
TOBINQ -7.806** -5.4225** -6.1495** -3.465** 54.632** 33.5842**
LnTOBINQ -9.184** -7.283** -6.781** -4.475** 59.307** 40.671**
EVA -7.739** -6.361** -8.491** -6.782** 72.906** 56.821**
TCA/TA -5.912** -5.048** -5.159** -3.307** 46.175** 31.188**
TCL/TA -9.421** -7.569** -6.634** -5.285** 58.236** 45.959**
CCC -8.455** -8.697** -6.392** -5.663** 56.110** 47.632**
SIZE -7.998** -8.109** -5.269** -4.011** 46.168** 35.796**
LEV -21.183** -16.561** -11.908** -9.055** 58.408** 48.283**
Note: **, * indicate a significant level of 1% and 5% respectively
Probabilities for fisher tests are computed using an asymptotic Chi-square
distribution. All other tests assume asymptotic normality. LLC=Levin, Lin &
Chu (2002), IPS= Im, Pesaran & Shin (2003), ADF=Fisher type Chi square by
Maddala & Wu (1999).
Presentation and Analysis of Panel Cointegration Tests Results
The recently developed panel residual based cointegration methodology
proposed by Pedroni (1999, 2004) was employed to each of the dependent
variables of ROE, Market-to-Book ratio, Tobin’s Q and EVA to establish
whether there is a long-run stable relationship between working capital
variables and shareholder value. The results are presented in Tables 17, 18, 19
and, 20 for return on equity, market-to-book ratio, Tobin’s Q and EVA
© University of Cape Coast https://erl.ucc.edu.gh/jspui
Digitized by Sam Jonah Library
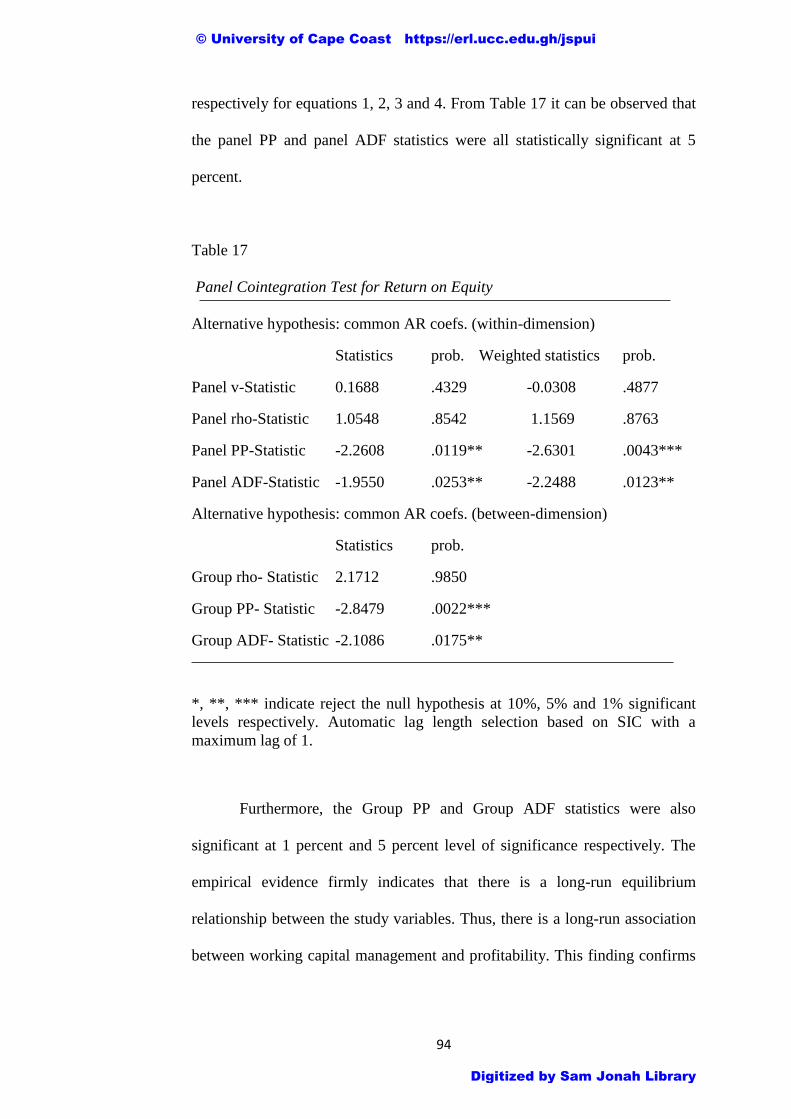
94
respectively for equations 1, 2, 3 and 4. From Table 17 it can be observed that
the panel PP and panel ADF statistics were all statistically significant at 5
percent.
Table 17
Panel Cointegration Test for Return on Equity
Alternative hypothesis: common AR coefs. (within-dimension)
Statistics prob. Weighted statistics prob.
Panel v-Statistic 0.1688 .4329 -0.0308 .4877
Panel rho-Statistic 1.0548 .8542 1.1569 .8763
Panel PP-Statistic -2.2608 .0119** -2.6301 .0043***
Panel ADF-Statistic -1.9550 .0253** -2.2488 .0123**
Alternative hypothesis: common AR coefs. (between-dimension)
Statistics prob.
Group rho- Statistic 2.1712 .9850
Group PP- Statistic -2.8479 .0022***
Group ADF- Statistic -2.1086 .0175**
*, **, *** indicate reject the null hypothesis at 10%, 5% and 1% significant
levels respectively. Automatic lag length selection based on SIC with a
maximum lag of 1.
Furthermore, the Group PP and Group ADF statistics were also
significant at 1 percent and 5 percent level of significance respectively. The
empirical evidence firmly indicates that there is a long-run equilibrium
relationship between the study variables. Thus, there is a long-run association
between working capital management and profitability. This finding confirms
© University of Cape Coast https://erl.ucc.edu.gh/jspui
Digitized by Sam Jonah Library

95
the results of Akinlo (2011) and Awad & Jayyar (2013) who found cointegration
between working capital management and profitability.
From Table 18, it can also be observed that the panel PP and panel ADF
statistics were all statistically significant at 1% level. Furthermore, the Group
PP and Group ADF statistics were also significant at 1% level of significance.
Table 18
Panel Cointegration Test for Market-to-Book Ratio
Alternative hypothesis: common AR coefs. (within-dimension)
Statistics prob. Weighted statistics prob.
Panel v-Statistic -0.4238 .6642 -1.6115 .9465
Panel rho-Statistic 0.9578 .8309 1.7888 .9632
Panel PP-Statistic -6.8323 .0000*** -5.5222 .0000***
Panel ADF-Statistic -6.6510 .0000*** -6.0666 .0000***
Alternative hypothesis: common AR coefs. (between-dimension)
Statistics prob.
Group rho- Statistic 2.0766 .9811
Group PP- Statistic -8.3416 .0000***
Group ADF- Statistic -6.6434 .0000***
*, **, *** indicate reject the null hypothesis at 10%, 5% and 1% significant
levels respectively. Automatic lag length selection based on SIC with a
maximum lag of 1.
The empirical evidence firmly indicates that there is a long-run equilibrium
relationship between the study variables. Thus, there is a long-run association
between working capital management and shareholder value creation as
measured by market-to-book ratio.
© University of Cape Coast https://erl.ucc.edu.gh/jspui
Digitized by Sam Jonah Library

96
The result from Table 19 also revealed that the panel PP and the panel ADF
statistics were significant at 1% level as well as the group PP and group ADF
all indicated 1% significant. This empirical evidence, clearly indicates that there
is a strong long-run association between shareholder value proxy by Tobin’s Q
and working capital management policies adopted. Thus, in the long-run these
policies have a bearing on the shareholder value creation.
Table 19
Panel Cointegration Test for Tobin’s Q
Alternative hypothesis: common AR coefs. (within-dimension)
Statistics prob. Weighted statistics prob.
Panel v-Statistic -1.3954 .9186 -1.7819 .9626
Panel rho-Statistic 1.3181 .9063 1.6990 .9553
Panel PP-Statistic -8.1341 .0000*** -6.5489 .0000***
Panel ADF-Statistic -6.9483 .0000*** -6.0562 .0000***
Alternative hypothesis: common AR coefs. (Between-dimension)
Statistics prob.
Group rho- Statistic 2.1691 .9850
Group PP- Statistic -10.205 .0000***
Group ADF- Statistic -7.3257 .0000***
*, **, *** indicate reject the null hypothesis at 10%, 5% and 1% significant
levels respectively. Automatic lag length selection based on SIC with a
maximum lag of 1.
This suggests that finance managers should attach equal importance to the
working capital management decisions.
The result from Table 20 also showed that the panel PP and the panel
ADF statistics were all significant at 1% level as well as the group PP and group
© University of Cape Coast https://erl.ucc.edu.gh/jspui
Digitized by Sam Jonah Library

97
ADF statistics all indicated 1% significant. Based on these empirical evidence,
it can be firmly concluded that there is a strong long-run relationship between
shareholder value measured by EVA and working capital management.
Table 20
Panel Cointegration Test for Economic Value Added
Alternative hypothesis: common AR coefs. (within-dimension)
Statistics prob. Weighted statistics prob.
Panel v-Statistic -0.0156 .5062 -0.6909 .7552
Panel rho-Statistic 1.0127 .8444 0.6915 .7554
Panel PP-Statistic -2.9161 .0018*** -6.4108 .0000***
Panel ADF-Statistic -2.6334 .0042*** -3.1958 .0007***
Alternative hypothesis: common AR coefs. (between-dimension)
Statistics prob.
Group rho- Statistic 1.6468 .9502
Group PP- Statistic -7.2945 .0000***
Group ADF- Statistic -3.7019 .0001***
*, **, *** indicate reject the null hypothesis in 10%, 5% and 1% significant
levels respectively. Automatic lag length selection based on SIC with a
maximum lag of 1.
Analysis of Cointegration Regression Results
After establishing that there is a stable long-run association between the
study variables, next panel cointegration regression techniques specifically
grouped fully modified ordinary least squares by Pedroni (2000, 2001) and
Pooled Mean Group/ARDL by Pesaran et al. (1999) were adopted to determine
the direction of the association between the cointegrating variables and establish
© University of Cape Coast https://erl.ucc.edu.gh/jspui
Digitized by Sam Jonah Library

98
the effect working capital management policies have on shareholder value
creation. According to Erdem et al. (2014) (as cited in Demirgunes, 2015) panel
fully modified ordinary least squares estimator is appropriate if all the
cointegrating variables are integrated of order 1 i.e. I (1). As indicated in the
panel unit root tests results, the gearing ratio was stationary at levels and
therefore was excluded from the cointegrating regression in FMOLS estimation
but was included in the panel ARDL estimation. The dependent variables
market-to-book ratio and Tobin’s Q were log transformed before they entered
the cointegrating equation as the original panel series data were not normally
distributed. Similarly, EVA models were estimated using standardized variables
by computing the Z scores for EVA and each of the independent cointegrating
regressors. This transformation was necessary as the original EVA values were
huge. The FMOLS results also include a common time dummy D1 for the year
2007. The year 2007 saw the Ghanaian currency undergoing a redenomination
as well as the adoption of International Financial Reporting Standards (IFRSs)
by Ghanaian listed companies for the first time and also marked the beginning
of the global financial meltdown. The inclusion of common time dummies is
intended to capture the issue of shocks from the system and also deal with
potential problem of short-run cross-sectional dependency (Pedroni, 2001).
Presentation and Analysis of grouped FMOLS Results
The results from grouped FMOLS for the panel as well as the sub-
sectors and the individual firms are reported in Tables 21, 22, 23 and, 24 for
models 1, 2, 3 and, 4 respectively. The Tables show two panels A and B. The
© University of Cape Coast https://erl.ucc.edu.gh/jspui
Digitized by Sam Jonah Library

99
individual firm’s results and the results from the sub-sectors are first presented
in panel A. Panel B reports the results of all the firms.
Table 21 presents the results from the grouped FMOLS for return on
equity (ROE) and the regressors with size as a control variable. From the
individual results, current asset investment policy is found to have a positive
and highly significant effect on ROE for Aluworks and PZC at 1 percent and 5
percent level of significance respectively whereas investment policy for FML
and Unilever has positive but an insignificant effect on ROE. On the contrary,
current asset investment policies for CMLT and GGBL have a negative
relationship with return on equity. However, only CMLT has a significant
effect. The positive relationship means that these companies can increase the
profitability by adopting conservative approach in the management of current
assets whilst the negative relationship implies that the more firms become
restrictive in the management of current assets the better. This indicates that, a
unit rise in TCA/TA ratio will lead to 1.1775 units and 1.4044 units increase in
ROE for Aluworks and PZC respectively whereas a unit increase in TCA/TA
ratio will cause 1.0693 units decrease in ROE for CMLT. The individual results
also revealed that current asset financing policy has positive and significant
effect on ROE for FML and CMLT at 1 percent and 5 percent levels respectively
but negative significant effect on ROE for Aluworks and PZC at 1 percent and
10 percent level of significance respectively. This indicates that a unit increase
in the ratio of TCL/TA will cause 1.6881 units rise in ROE for FML and 0.3821
increase in ROE for CMLT but decrease the ROE of Aluworks and PZC by
1.1152 and 1.3193 units respectively.
© University of Cape Coast https://erl.ucc.edu.gh/jspui
Digitized by Sam Jonah Library
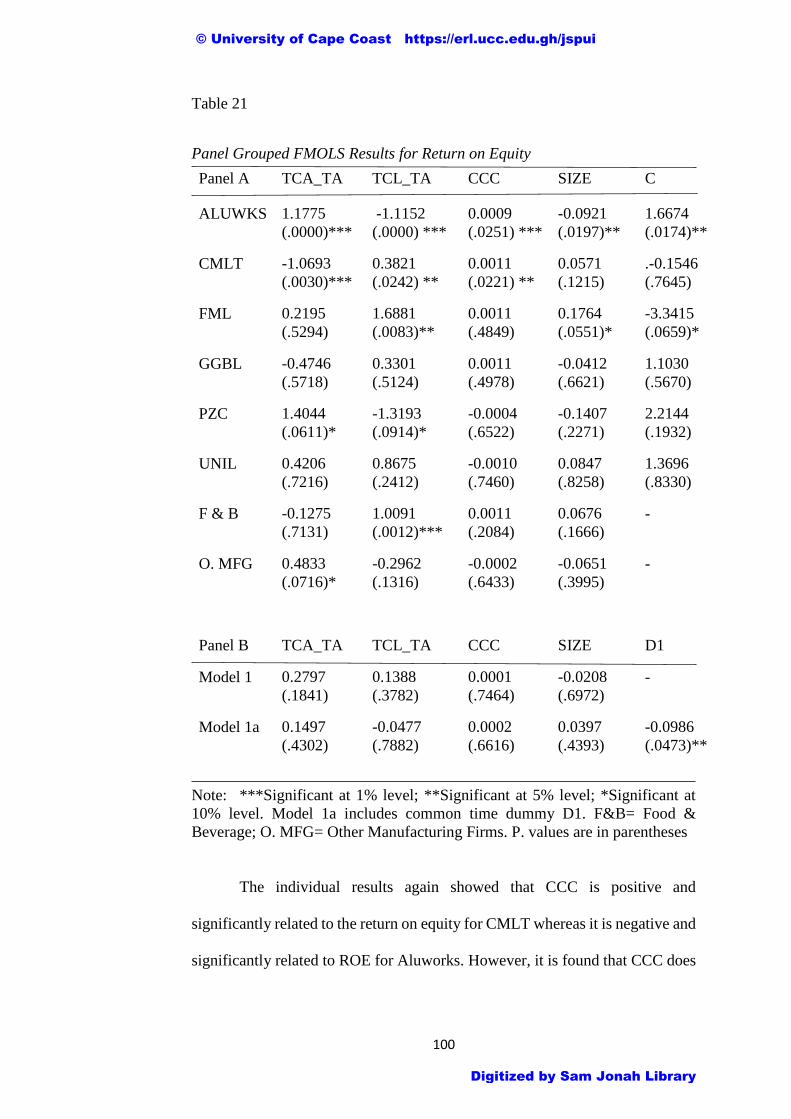
100
Table 21
Panel Grouped FMOLS Results for Return on Equity
Note: ***Significant at 1% level; **Significant at 5% level; *Significant at
10% level. Model 1a includes common time dummy D1. F&B= Food &
Beverage; O. MFG= Other Manufacturing Firms. P. values are in parentheses
The individual results again showed that CCC is positive and
significantly related to the return on equity for CMLT whereas it is negative and
significantly related to ROE for Aluworks. However, it is found that CCC does
Panel A TCA_TA TCL_TA CCC SIZE C
ALUWKS 1.1775
(.0000)***
-1.1152
(.0000) ***
0.0009
(.0251) ***
-0.0921
(.0197)**
1.6674
(.0174)**
CMLT -1.0693
(.0030)***
0.3821
(.0242) **
0.0011
(.0221) **
0.0571
(.1215)
.-0.1546
(.7645)
FML 0.2195
(.5294)
1.6881
(.0083)**
0.0011
(.4849)
0.1764
(.0551)*
-3.3415
(.0659)*
GGBL -0.4746
(.5718)
0.3301
(.5124)
0.0011
(.4978)
-0.0412
(.6621)
1.1030
(.5670)
PZC 1.4044
(.0611)*
-1.3193
(.0914)*
-0.0004
(.6522)
-0.1407
(.2271)
2.2144
(.1932)
UNIL 0.4206
(.7216)
0.8675
(.2412)
-0.0010
(.7460)
0.0847
(.8258)
1.3696
(.8330)
F & B -0.1275
(.7131)
1.0091
(.0012)***
0.0011
(.2084)
0.0676
(.1666)
-
O. MFG 0.4833
(.0716)*
-0.2962
(.1316)
-0.0002
(.6433)
-0.0651
(.3995)
-
Panel B TCA_TA TCL_TA CCC SIZE D1
Model 1 0.2797
(.1841)
0.1388
(.3782)
0.0001
(.7464)
-0.0208
(.6972)
-
Model 1a 0.1497
(.4302)
-0.0477
(.7882)
0.0002
(.6616)
0.0397
(.4393)
-0.0986
(.0473)**
© University of Cape Coast https://erl.ucc.edu.gh/jspui
Digitized by Sam Jonah Library

101
not have any statistical significant effect on profitability at the conventional
level of significance for the rest of the firms.
Additionally, the explanatory power of the cash conversion cycle is
minimal as compared to the other regressors.
The control variable size was also found to impact the return on equity
differently among the various companies. Whereas FML’s size has positive and
significant impact on ROE at 10 percent significant level, the size of Aluworks
has negative and significant effect on ROE at 5 percent significant level. The
results from the sub-samples also show that current asset financing policy has a
positive and highly significant influence on return on equity for food and
beverages manufacturing firms. Thus, a unit increase in the ratio of current
liability to total asset raises food and beverage’s return on equity by 1.009 units.
From the panel results, the study indicated that current asset investment
policy has positive and insignificant effect on profitability measured by return
on equity. The positive coefficient of TCA/TA ratio indicates a negative
relationship between the degree of aggressiveness of investment policy and
return on equity. As the TCA/TA increases, the degree of aggressiveness
decreases, and return on equity increases. Therefore, there is a negative
relationship between the relative degree of aggressiveness of current asset
investment policies of firms and return on equity. This empirical finding implies
that firms can create shareholder value if they adopt conservative approach in
the management of current asset. This result is consistent with the findings of
Javid and Zita (2014) and Mwangi et al. (2014) who found a positive
relationship between the degree of conservative current asset investment policy
and return on equity.
© University of Cape Coast https://erl.ucc.edu.gh/jspui
Digitized by Sam Jonah Library

102
The regression results also revealed that the coefficient for total current
liabilities to total assets ratio is positive and is statistically insignificant at 10
percent level of significance. The results indicate that there was no statistically
significant relationship between total current liabilities to total assets ratio and
profitability of manufacturing firms listed in the GSE as measured by on ROE.
The positive coefficient for TCL/TA also points out the negative relationship
between the degree of conservativeness of current asset financing policy and
return on equity. The higher the TCL/TA ratio, the more aggressive the
financing policy, that that yield positive return. The results is inconsistent with
the findings of Mwangi et al. (2014) and Javid and Zita (2014) who found a
negative relationship between the degree of aggressive current asset financing
policy and return on equity. However, when time dummy is considered, the
results revealed that the coefficient for total current liabilities to total assets ratio
is negative and is statistically insignificant at 10 percent level of significance
which confirms the findings of Mwangi et al. (2014) and Javid and Zita (2014).
The results also show that cash conversion cycle has positive and
statistically insignificant effect on ROE. The control variable, firm size
measured as natural log of total revenue indicated mixed results. The coefficient
of firm size is negative without the time dummy and but turns to be positive
when time dummy is introduced although both coefficients are insignificant at
10 percent significant level. The inclusion of common time dummy D1 revealed
a negative and significant effect on return on equity at 5 percent significant
level. This could possibly suggest that Ghanaian listed manufacturing firms
incurred extra cost in adopting IFRSs coupled with the external financial and
economic shocks that characterized the year 2007.
© University of Cape Coast https://erl.ucc.edu.gh/jspui
Digitized by Sam Jonah Library

103
From Table 22, the individual company’s results indicate that the ratio
of TCA/TA has positive and strong significant effect on shareholder value
measured by market-to-book ratio for Aluworks but has negative and highly
significant effect on market-to-book ratio for CMLT, FML and GGBL.
However, the TCA/TA ratio has negative but insignificant effect on market-to-
book ratio for PZC and Unilever. This means that a percent increase in the ratio
of total current asset to total asset raises market-to-book ratio by approximately
687% for Aluworks whiles it reduces the market-to-book ratio by 89%, 97%
and 97% for CMLT, FML and GGBL respectively.
The result also indicates that the ratio of TCL/TA has positive and
significant effect on market-to-book ratio for Aluworks and Unilever at 1
percent and 5 percent significant levels respectively whereas it has negative and
significant effect on market-to-book ratio for CMLT and PZC at 1 percent and
10 percent significant levels respectively. No statistical significant effect was
established for FML and GGBL. Thus, 1 percent increase in the ratio of Total
Current Liability to Total Asset results in increasing market-to-book ratio by
3022% and 3590% for Aluworks and Unilever respectively but reduces market-
to-book ratio of CMLT by 84% and PZC by 97%. Again, the study also found
that CCC has positive and significant impact on market-to-book ratio for
Aluworks and Unilever but insignificant effect on market-to-book ratio for
GGBL and PZC. However, negative but insignificant effect was found for
CMLT and FML. This suggests that a 1 percent increase in CCC raises MBR
by 0.67% for Aluworks and 1.6% for Unilever. Furthermore, it could be
observed that the TCA/TA and TCL/TA have much effect on MBR than CCC
does in terms of absolute magnitude.
© University of Cape Coast https://erl.ucc.edu.gh/jspui
Digitized by Sam Jonah Library

104
Table 22
Panel Grouped FMOLS Results for Market-to-Book Ratio
Note: ***Significant at 1% level; **Significant at 5% level; *Significant at
10% level. Model 2a includes common time dummy D1. F&B= Food &
Beverage; O. MFG= Other Manufacturing Firms. P. values are in parentheses
The control variable size also has positive and significant effect on MBR
at 1 percent level of significance for FML and Unilever and 5 percent for PZC
but has a positive insignificant effect on MBR for GGBL whiles firm size
revealed a negative but an insignificant effect on MBR for Aluworks and
CMLT. This indicates that the size has a positive elasticity with respect to MBR
Panel A TCA_TA TCL_TA CCC SIZE C
ALUWKS 2.0625
(.0001)***
3.4412
(.0000)***
0.0067
(.0069)***
-0.0739
(.7025)
-1.5366
(.6515)
CMLT -2.2216
(.0035)***
-1.8193
(.0003)***
-0.0009
(.3088)
-0.0664
(.3726)
3.4401
(.0119)**
FML -3.5825
(.0004)***
1.1839
(.2207)
-0.0017
(.5497)
0.6495
(.0020)***
-8.8577
(.0153)**
GGBL -3.5024
(.0092)***
0.0418
(.9474)
0.0006
(.7803)
0.1348
(.2781)
-0.0244
(.9920)
PZC -2.2968
(.1510)
-3.4690
(.0547)*
0.0012
(.5649)
0.8094
(.0100)**
-11.148
(.0128)**
UNIL -3.2755
(.1061)
3.6082
(.0103)**
0.0161
(.0108)**
2.5618
(.0024)***
-46.804
(.0015)***
F & B -3.5424
(.0000)***
0.6128
(.1644)
-0.0005
(.6666)
0.3921
(.0000)***
-
O. MFG -1.4328
(.0038)***
0.4403
(.2560)
0.0058
(.0000)***
0.8077
(.0000)***
-
Panel B TCA_TA TCL_TA CCC SIZE D1
Model 2 -2.1360
(.0000)***
0.4978
(.0925)*
0.0037
(.0001)***
0.6692
(.0000)***
-
Model 2a -1.7524
(.0000)***
1.0174
(.0019)***
0.0036
(.0000)***
0.5141
(.0000)***
0.3395
(.0000)***
© University of Cape Coast https://erl.ucc.edu.gh/jspui
Digitized by Sam Jonah Library

105
for FML, PZC and Unilever. Thus, 10 percent increase in size as measured by
log of revenue raises MBR by 6.5%, 8.1% and 25.6% for FML, PZC and
Unilever respectively whereas it has neutral effect on MBR for Aluworks,
CMLT and GGBL.
The results from the subsampled firms as well as the panel exhibited the
same direction of influence. From the panel test results, current asset investment
policy proxied by TCA/TA ratio has negative and highly significant effect on
MBR in the long-run. The negative coefficient of TCA/TA indicates a positive
relationship between the relative degree of aggressiveness of current asset
investment policy and shareholder value.
However, CCC and size have positive and statistically significant effect
on MBR in the long-run at 1 percent level of significance whiles TCL/TA has
some positive effects on shareholder value although not statistically significant
at the conventional level. This means that 1% increase in TCA/TA ratio would
decrease MBR by 88% while a percent increase in TCL/TA and CCC raises
MBR by 64.5% and 0.37% respectively. The elasticity of size with respect to
MBR variable suggests that holding other variables constant, 100% increase in
size raises MBR by approximately 67% in the long-run.
This result contradicts Korankye (2013) who found a negative but
significant relationship between firm size and shareholder value creation for
listed Ghanaian banks. The negative relationship found between TCA/TA ratio
and MBR indicates that as firms increase investment in current asset, it has the
effect of reducing the shareholders’ value. This finding is in line with the theory
that excessive investment in current asset leads to low profitability and
consequently shareholder value (Pandey, 2010; Van Horne & Wachowicz,
© University of Cape Coast https://erl.ucc.edu.gh/jspui
Digitized by Sam Jonah Library
106
2009). Thus, firms would increase shareholder value by adopting aggressive
approach in the management of total current asset resources. Similarly, positive
relationship between TCL/TA ratio and MBR suggests that as firms become
more conservative in current liability management, the more shareholder value
is destroyed. Thus, shareholder value can be created if firms adopt aggressive
approach towards managing current asset financing. This finding again supports
the theory that aggressive current asset financing policy is associated with
higher return and shareholder value (Weinraub & Visscher, 1998).
The inclusion of a common time dummy in the estimation does not alter
the direction of the results generally. The dummy variable D1 indicating 1 for
the year 2007 and 0 otherwise, was found to have a positive and significant
effect on MBR. Ghana adopted IFRS in January, 2007 for all publicly traded
entities and undertook a currency redenomination in the same year. It seems that
these two accounting and economic restructuring have impacted positively on
shareholder value.
Table 23 presents the individual and the Pedroni’s panel grouped
FMOLS estimation results between the dependent variable Tobin’s Q (firm
value) and cointegrating regressor variables. The results from the individual
companies are mixed. The individual company’s results show a positive and
significant relationship between current assets investment policy and Tobin’s Q
for Aluworks and positive insignificant relationship for CMLT. The positive
coefficient of TCA/TA indicates a negative relationship between the degree of
aggressiveness of current assets investment policy and firm’s value for
Aluworks.
© University of Cape Coast https://erl.ucc.edu.gh/jspui
Digitized by Sam Jonah Library

107
Table 23
Panel Grouped FMOLS Results for Tobin’s Q
Note: ***Significant at 1% level; **Significant at 5% level; *Significant at
10% level. Model 3a includes common time dummy D1. F&B= Food &
Beverage; O. MFG= Other Manufacturing Firms. P. values are in parentheses
This means that as Aluworks increases its investment in current asset,
the more shareholder wealth it creates for its shareholders. This empirical
evidence is against theory that excessive investment in current asset reduces
profitability and shareholder value but agrees with Nazir and Afza (2009) who
Panel A TCA_TA TCL_TA CCC SIZE C
ALUWKS 1.0744
(.0000) ***
0.7294
(.0066)***
0.0017
(.0969)*
0.1816
(.0799)*
-4.0420
(.0347)**
CMLT 0.0387
(.9080)
-0.5916
(.0097)***
-0.0011
(.0642)*
-0.1042
(.0379)**
2.0546
(.0119)**
FML -2.5175
(.0001)***
0.2931
(.5956)
0.0013
(.4263)
0.4913
(.0004)***
-6.6197
(.0048)***
GGBL -1.9668
(.0415)**
-1.0269
(.0671)*
-0.0007
(.6288)
0.0666
(.4868)
0.7565
(.6951)
PZC -1.1899
(.1461)
-1.6722
(.0666)*
0.0002
(.8426)
0.3897
(.0133)**
-5.2475
(.0188)**
UNIL -1.5847
(.2568)
1.3979
(.1129)
0.0126
(.0071)***
1.6403
(.0049)***
-29.826
(.0033)***
F & B -2.2422
(.0000)***
-0.3669
(.2078)
0.0003
(.7373)
0.2789
(.0000)***
-
O. MFG -0.4179
(.1738)
-0.0341
(.8798)
0.0034
(.0000)***
0.5269
(.0000)***
-
Panel B TCA_TA TCL_TA CCC SIZE D1
Model 3 -1.0259
(.0000)***
-0.1451
(.4144)
0.0023
(.0001)***
0.4443
(.0000)***
-
Model 3a -0.8671
(.0001)***
0.1777
(.3846)
0.0025
(.0000)***
0.3649
(.0000)***
0.0948
(.0882)*
© University of Cape Coast https://erl.ucc.edu.gh/jspui
Digitized by Sam Jonah Library

108
indicated that firms can create wealth for their shareholders if they adopt
conservative approach in managing working capital. On the contrary, the results
show a negative and significant relationship between current assets investment
policy and Tobin’s Q for FML and GGBL at 1 percent and 5 percent levels of
significance respectively whereas negative but insignificant relationship was
also found for PZC and UNIL.
The negative and significant relationship implies that these firms can
create wealth for their shareholders if they adopt aggressive policies in the
management of current asset. The study also reported a positive and highly
significant relationship between TCL/TA and Tobin’s Q for Aluworks but
positive and insignificant relationship for FML and Unilever whereas a
significant negative relationship was found between TCL/TA and Tobin’s Q for
CMLT at 1 percent significant level whiles PZC and UNIL were at 10 percent
levels.
The individual results also indicated that CCC has positive and
significant effect on Tobin’s Q for Unilever at 1 percent level of significance
whereas no significant relationships were found between CCC and Tobin’s Q
for the rest of the companies at the conventional level of significance. The
control variable size also revealed an interesting result. The firm size was found
to have positive and significant influence on firm value with elasticity
coefficients of 0.4913 (p. value =.0004), 1.640 (p. value = 0.0049), 0.3897 (p.
value = .0133) and 0.1819 (p. value = 0.0799) for FML, UNIL, PZC and
Aluworks respectively. The positive coefficient implies that the size of a firm
tends to influence its value positively and signifies “bigger is better”. However,
© University of Cape Coast https://erl.ucc.edu.gh/jspui
Digitized by Sam Jonah Library

109
the size of GGBL does not statistically influence its value even though it is seen
as a big size firm.
Similar to the results obtained from the Table 22, the results from the
subsampled firms as well as the panel indicated the same direction of influence.
The panel regression results revealed that current assets investment policy proxy
as TCA/TA has negative and highly significant effect on Tobin’s Q at 1 percent
significant level. The negative coefficient predicts a positive relationship
between the degree of aggressiveness of current asset investment policy and
Tobin’s Q. As the degree of aggressiveness of TCA/TA ratio tends to increase,
the firm’s value rises. This implies that 1 percent decrease in current asset
investment causes firm’s value to increase by 64 percent in the long-run. Thus,
firm’s value increases as investment in current asset is reduced to the optimal
level. This means as firms adopt conservative approach in managing their
current asset by investing more in them, the more shareholder value is
destroyed. This result is in line with theory but contradicts Al-Shubiri (2011),
and Nazir and Afza (2009) who found a negative relationship between relative
degree of aggressiveness of working capital investment policies and firm value
measured by Tobin’s Q.
Current assets financing policy also indicates a negative relationship
between the degree of aggressiveness of financing policy and Tobin’s Q.
However, the relationship is not significant. Thus, working capital financing
policy may not influence the variation in the Tobin’s Q. The panel results also
indicate that CCC has positive and significant influence on the Tobin’s Q at 1
percent significant level. Thus, firms create value by extending the cash
conversion cycle in the long-run. It can further be observed that the coefficient
© University of Cape Coast https://erl.ucc.edu.gh/jspui
Digitized by Sam Jonah Library
110
of CCC is very small in influencing firms’ value hence having little explanatory
power as compared with the TCA/TA ratio. The control variable size also has
positive and highly significant effect on Tobin’s Q, implying that as the size of
firms tends to increase the firms value also increases to the point that can be
sustained. The inclusion of the common time dummy again did not change the
results materially.
Table 24 presents the results from the grouped FMOLS for economic
value added and the regressors with size as a control variable. From the
individual results, current asset investment policy is found to have a positive
and significant effect on EVA for Aluworks, FML and GGBL at 5 percent level
of significance. The positive relationship means that these companies can
increase the economic profitability by adopting conservative approach in the
management of current assets. This implies that, an increase of 1 standard
deviation in TCA/TA ratio on average will result in a 0.6944 standard deviation
increase in EVA for Aluworks. The EVA of FML and GGBL will also increase
by 0.3132 and 0.0943 standard deviations respectively with 1 standard deviation
increase in TCA/TA ratio.
The individual results also revealed that current asset financing policy has
positive and significant effect on EVA for FML at 5 percent but negative
significant effect on EVA for GGBL and PZC at 1 percent and 5 percent level
of significance respectively. This indicates that an increase in the ratio of
TCL/TA will cause the EVA of FML to rise but decreases the EVA of GGBL
and PZC respectively. The individual results again showed that CCC does not
have any statistical significant effect on the shareholder value proxy by EVA.
© University of Cape Coast https://erl.ucc.edu.gh/jspui
Digitized by Sam Jonah Library
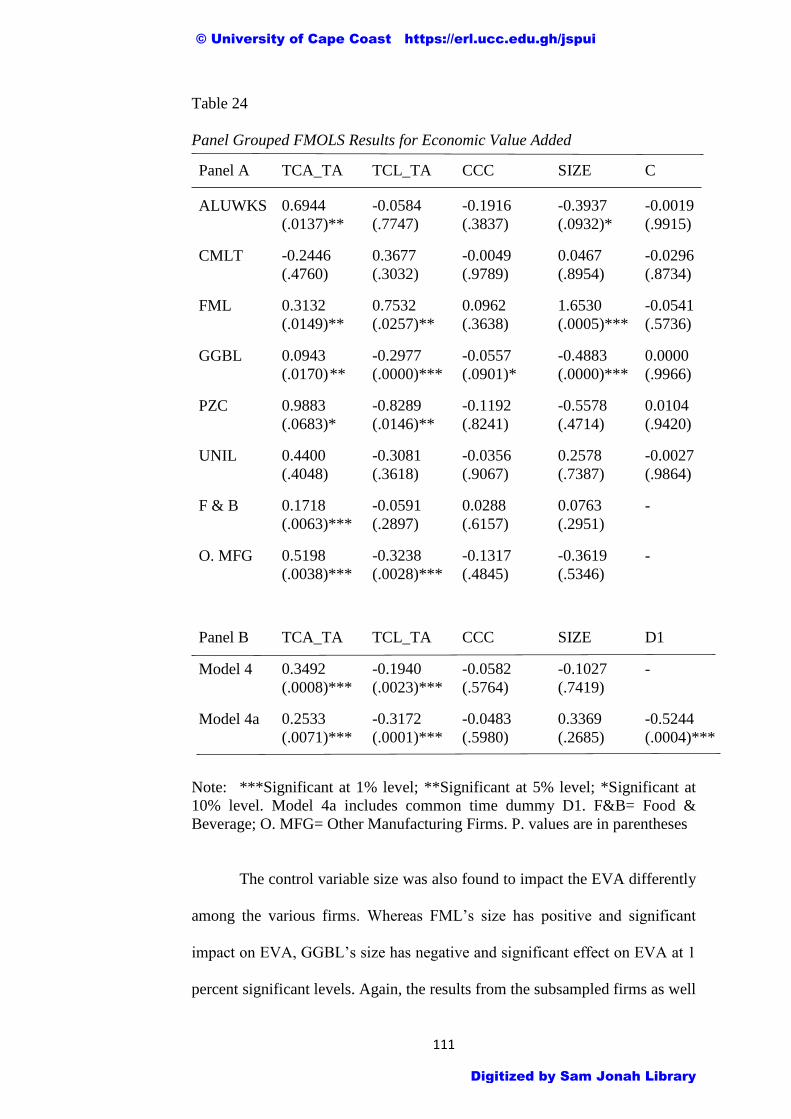
111
Table 24
Panel Grouped FMOLS Results for Economic Value Added
Note: ***Significant at 1% level; **Significant at 5% level; *Significant at
10% level. Model 4a includes common time dummy D1. F&B= Food &
Beverage; O. MFG= Other Manufacturing Firms. P. values are in parentheses
The control variable size was also found to impact the EVA differently
among the various firms. Whereas FML’s size has positive and significant
impact on EVA, GGBL’s size has negative and significant effect on EVA at 1
percent significant levels. Again, the results from the subsampled firms as well
Panel A TCA_TA TCL_TA CCC SIZE C
ALUWKS 0.6944
(.0137)**
-0.0584
(.7747)
-0.1916
(.3837)
-0.3937
(.0932)*
-0.0019
(.9915)
CMLT -0.2446
(.4760)
0.3677
(.3032)
-0.0049
(.9789)
0.0467
(.8954)
-0.0296
(.8734)
FML 0.3132
(.0149)**
0.7532
(.0257)**
0.0962
(.3638)
1.6530
(.0005)***
-0.0541
(.5736)
GGBL 0.0943
(.0170) **
-0.2977
(.0000)***
-0.0557
(.0901)*
-0.4883
(.0000)***
0.0000
(.9966)
PZC 0.9883
(.0683)*
-0.8289
(.0146)**
-0.1192
(.8241)
-0.5578
(.4714)
0.0104
(.9420)
UNIL 0.4400
(.4048)
-0.3081
(.3618)
-0.0356
(.9067)
0.2578
(.7387)
-0.0027
(.9864)
F & B 0.1718
(.0063)***
-0.0591
(.2897)
0.0288
(.6157)
0.0763
(.2951)
-
O. MFG 0.5198
(.0038)***
-0.3238
(.0028)***
-0.1317
(.4845)
-0.3619
(.5346)
-
Panel B TCA_TA TCL_TA CCC SIZE D1
Model 4 0.3492
(.0008)***
-0.1940
(.0023)***
-0.0582
(.5764)
-0.1027
(.7419)
-
Model 4a 0.2533
(.0071)***
-0.3172
(.0001)***
-0.0483
(.5980)
0.3369
(.2685)
-0.5244
(.0004)***
© University of Cape Coast https://erl.ucc.edu.gh/jspui
Digitized by Sam Jonah Library

112
as the panel generally showed the same direction of influence. From the panel
results, the study indicated that current assets investment policy has positive and
highly significant effect on EVA. The positive coefficient of TCA/TA indicates
a negative relationship between the degree of aggressiveness of investment
policy and economic value added. As the TCA/TA increases, the degree of
aggressiveness decreases, and economic value added increases. Therefore, there
is a negative relationship between the relative degree of aggressiveness of
current asset investment policies of firms and economic value added. This
indicates that, 1 standard deviation increase in TCA/TA ratio on average is
predicted to result in a 0.3492 standard deviation increase in EVA. This
empirical finding implies that firms can create shareholder value if they adopt
conservative approach in the management of current asset. This finding is
inconsistent with theory that increasing investment in current assets reduces
profitability and destroys shareholders’ value.
The study also revealed that TCL/TA has negative and strong significant
effect on EVA. The negative coefficient for TCL/TA also points out the
negative relationship between the aggressiveness of current asset financing
policy and economic value added. The higher the TCL/TA ratio, the more
aggressive the financing policy, that destroys shareholder value. This suggests
that in the long-run, more aggressive current asset financing policy will yield
negative return for shareholders. The empirical results support the findings of
Bandara and Weerakoon (2014) that firms with aggressive working capital
management practices generate lower EVA. The results also show that CCC
and firm size have negative and statistically insignificant effect on EVA. The
inclusion of common time dummy in the regression equation did not alter the
© University of Cape Coast https://erl.ucc.edu.gh/jspui
Digitized by Sam Jonah Library

113
direction of the results. However, D1 revealed negative and highly significant
effect on EVA.
Presentation and Analysis of Panel ARDL/Pooled Mean Group results
The basic models were also estimated by using the recently developed
Pooled Mean Group (PMG)/ARDL estimator proposed by Pesaran et al. (1999)
for model 5, 6, 7 and, 8. The results are robust to the results obtained from the
panel Grouped FMOLS.
Table 25 presents the results from the ARDL (1,1,1,1,1) for model 5 and
ARDL (1,1,1,1,1,1) for model 5a for the dependent variable return on equity.
Model 5(a) includes firm’s financial leverage measured as debt-to-equity ratio
as an additional control variable in the equation. The lags order is selected based
on Schwarz information criteria (SIC). The results from model (5) and model
(5a) reveal that current assets investment policy (TCA/TA) is positively related
to profitability in the long-run. The positive coefficient of TCA/TA agrees with
the results obtained from the FMOLS as reported in Table 21 and indicates a
negative relationship between the degree of aggressiveness of investment policy
and return on equity. As the TCA/TA increases, the degree of aggressiveness
decreases, and return on equity increases. Therefore, there is a negative
relationship between the relative degree of aggressiveness of working capital
investment policies of firms and profitability measured as return on equity. This
empirical finding implies that firms can create value for shareholders if they
adopt conservative approach in the management of current asset. This finding
is inconsistent with theory that increasing investment in current assets reduces
© University of Cape Coast https://erl.ucc.edu.gh/jspui
Digitized by Sam Jonah Library

114
profitability and shareholder value but agrees with the findings of Javid & Zita
(2014); Mohamad and Saad (2010) and Mwangi et al. (2014).
Table 25
Panel ARDL Results for Return on Equity
Model 5 Model 5a
Variable Coef. Prob. Coef. Prob.
Long Run Equation
TCA_TA 0.2289 .2178 1.4935 0000***
TCL_TA 1.2794 .0000*** 1.1380 .0000***
CCC 0.0041 .0000*** 0.0005 .0000***
SIZE 0.0537 .0512* -0.0633 .0000***
LEV - - 0.4374 .0004***
Short Run Equation
COINTEQ01 -0.4944 .0246** -0.5087 .0166**
D(TCA_TA) 0.3322 .3088 -0.0351 .8888
D(TCL_TA) -0.6198 .0528* -0.4526 .2179
D(CCC) -0.0017 .0181** 0.0025 .2658
D(SIZE) 0.3132 .2902 0.0671 .8679
D(LEV) - - 1.3680 .1233
C -0.7248 .0229** 0.1882 .3040
Note: ***Significant at 1% level **Significant at 5% level *Significant at 10%
level
However, the results show that current asset investment policy has
positive but insignificant effect on profitability for model 5 as well as negative
and insignificant influence on profitability for model 5a in the short-run
implying that in the short-run period increase investment in non-current assets
enhances profitability. The study also shows that current assets financing policy
(TCL/TA) has positive and significant influence on return on equity in the long-
run at 1 percent level of significance for both models. The positive coefficient
also indicates that as the relative degree of aggressiveness of current asset
financing increases, the more return on equity is yielded. Thus, shareholder
© University of Cape Coast https://erl.ucc.edu.gh/jspui
Digitized by Sam Jonah Library

115
value is created when firms become relatively aggressive in the current liability
management. This empirical evidence is in line with the results from FMOLS
as reported in Table 21 but contradicts the findings of Mwangi et al. (2014);
Javid & Zita (2014); Mohamad and Saad (2010) who reported a negative
relationship between current asset financing policy and profitability. The short-
run equation coefficients of TCL/TA ratio indicated that there is negative
influence of current asset financing policy on ROE at 10 percent significant
level for model 5 but negative and insignificant influence on ROE for model 5a.
The positive significant coefficients for TCA/TA and TCL/TA ratios reveal
clearly that firms pursuing relatively moderate working capital management
policies increase profitability and create shareholder value in the long-run.
The Cash Conversion Cycle also revealed positive and significant
influence on ROE in the long-run whereas it has negative but significant
relationship with profitability in the short-run for model 5. Thus, in the long-
run, firms can create value by being less aggressive in the management of short-
term resources and finances. This finding validates the findings of Akoto et al.
(2013) study which indicated that manufacturing firm’s CCC has positive
significant relationship with return on equity. This means that using cash
conversion cycle as a comprehensive measure of working capital management
policies, firms can create profit for their shareholders by adopting relatively less
restrictive policies in the working capital management. However, it can be
observed that the coefficient of CCC is much smaller than the coefficient from
the TCA/TA and TCL/TA ratios. This therefore suggests that finance managers
should take a holistic approach in the management of current assets and
liabilities.
© University of Cape Coast https://erl.ucc.edu.gh/jspui
Digitized by Sam Jonah Library

116
The long-run equation results also revealed that the size of the firm has
a negative and significant effect on ROE at 1 percent significant level for model
5a whereas in the short-run, there is a positive insignificant relationship between
firm size and ROE for both models. Thus, as firms increase in size in the long-
run, the profitability reduces. This may be due to the fact that firms increase to
a point that may be beneficial beyond which diseconomies of scale may set in
and decrease profit. This assertion is consistent with Stimpert and Laux, (2011)
who argue that bigger is better only up to a point beyond that point additional
scale is not associated with greater profitability.
Finally, debt-equity ratio was found to have positive and significant
effect on profitability in the long-run. This is due to the fact that leverage
increases the profitability of firms and reduces the agency cost, higher leverage
is much more likely to indirectly allow firms to create value for shareholders
through the earnings (Korankye, 2013). The speed of adjustment coefficients
indicates negative and strongly significant at 5 percent level of significance for
both models indicating the study variables will adjust to long-run trend roughly
2 years after a short drift to equilibrium state. Table 26 presents the results from
the ARDL (1,1,1,1,1) for model 6 and ARDL (1,1,1,1,1,1) for model 6(a) for
the dependent variable market-to-book ratio. Model 6(a) includes firm’s
financial leverage measured as debts-to-equity ratio as an additional control
variable in the equation. The lags order is selected based on Schwarz
information criteria (SIC). The results from model 6 indicate that TCA/TA has
negative and statistically significant effect on market-to-book ratio at 1 percent
level of significance in the long-run but the effect is not statistically significant
in the short-run albeit negative effect. This finding confirms the negative
© University of Cape Coast https://erl.ucc.edu.gh/jspui
Digitized by Sam Jonah Library

117
coefficient obtained from the FMOLS as reported in Table 22. The negative
coefficient of TCA/TA indicates a positive relationship between the relative
degree of aggressiveness of current asset investment policy and shareholders’
value.
Table 26
Panel ARDL Results for Market-to-Book Ratio
Model (6) Model 6(a)
Note: ***Significant at 1% level **Significant at 5% level *Significant at 10%
level
This implies that increasing the amount of investment in current assets
leads to a reduction of shareholder value both in the short and long-run with the
long-run having significant effect. Thus, 1 percent increase in the current asset
to total asset ratio reduces market-to-book ratio by 78.4% in the long-run. The
results from model 6 also indicated that TCL/TA ratio has negative but
Variable Coef. Prob. Coef. Prob.
Long Run Equation
TCA_TA -1.5349 .0017*** -0.8443 .0592*
TCL_TA -0.7515 .1219 -1.3730 .0069***
CCC -0.0014 .0769* -0.0019 .0064***
SIZE 0.3767 .0000*** 0.3269 .0000***
LEV - - 0.9505 .0004***
Short Run Equation
COINTEQ01 -0.7172 .0059*** -0.6622 .0286**
D(TCA_TA) -0.5317 .5106 -0.8207 .3729
D(TCL_TA) 1.6666 .0852* 1.1422 .2049
D(CCC) 0.0020 .5119 0.0042 .2525
D(SIZE) -0.2154 .7040 -0.1570 .7905
D(LEV) - - 2.0874 .2937
C -3.2222 .0074*** -2.5774 .0328**
© University of Cape Coast https://erl.ucc.edu.gh/jspui
Digitized by Sam Jonah Library
118
insignificant effect on the shareholders’ value as measured by market-to-book
ratio but has positive significant effect at 10 percent level of significance in the
short-run. This means a percent increase in TCL raises market-to-book ratio by
approximately 429% in the short-term. This implies that following aggressive
financing policy in the management of current liabilities, shareholder value will
be created in the short-run at least.
Similarly, the study revealed that CCC has negative and significant
effect at one percent level in the long-run when debt-equity ratio is considered
as an additional control variable but positive and insignificant effect in the short-
run on market-to-book ratio. The coefficient of CCC from Table 29 also
indicated very small magnitude, thus having less effect on the market-to-book
ratio than TCA/TA and TCL/TA ratios in the long-run. This suggests that
companies should take a holistic approach in the management of working
capital than concentrating on some components such as inventory, account
receivables and account payables alone.
Firm size showed a positive and highly significant effect on shareholder
value creation in the long-run, but negative insignificant effect on market-to-
book ratio in the short-run. The long-run elasticity coefficient of firm size with
respect to market-to-book ratio is 0.376 implying 10 percent increase in size of
the firms raises MBR by 3.8% in the long-run. The Cointeq01 is a short-term
adjustment coefficient and points to the fact that the variables will adjust to
long-run trends. This indicates the speed of adjustment and represents the
proportion by which the long-run disequilibrium in the market-to-book ratio
(shareholder value) is being corrected each short period. From model (6) the
adjustment coefficient has the correct sign and statistically significant at 1
© University of Cape Coast https://erl.ucc.edu.gh/jspui
Digitized by Sam Jonah Library
119
percent. This implies that it takes about 1year 5 months for the disequilibrium
in the system to converge to equilibrium.
The result from model 6a was not generally different from the model 6.
However, TCL/TA showed a negative and highly significant effect on
shareholder value in the long-run and positive insignificant effect in the short-
run. This empirical finding is in line with theory that short-term sources of
financing are cheaper in the short-term thus having positive effect on
shareholder value. However, in the long-run short-term funding tends to be
costly than the long-term sources of funds, hence exerting negative effect on the
shareholder value.
Gearing has positive impact on market-to-book both in the short and the
long-run periods. However, it is only significant in the long-run at 1 percent
level of significance. This implies that 1 percent increase in debt-to-equity ratio
enhances shareholder value by 159%. The level of long-term debt held by the
selected firms positively influences the shareholder value creation of the
companies. This is due to the fact that leverage increases the profitability of
firms and reduces the agency cost, higher leverage is much more likely to
indirectly allow firms to create value for shareholders through the earnings
(Korankye, 2013). The speed of adjustment coefficient also indicates negative
and significant at 5 percent level of significance suggesting the study variables
will adjust to long-run trend roughly 1 ½ years after a short drift to equilibrium
state.
Table 27 presents the results from the ARDL (1,1,1,1,1) for model 7 and
ARDL (1,1,1,1,1,1) for model 7(a) for the dependent variable Tobin’s Q. Model
7(a) includes firms financial leverage measured by debts to equity ratio as an
© University of Cape Coast https://erl.ucc.edu.gh/jspui
Digitized by Sam Jonah Library
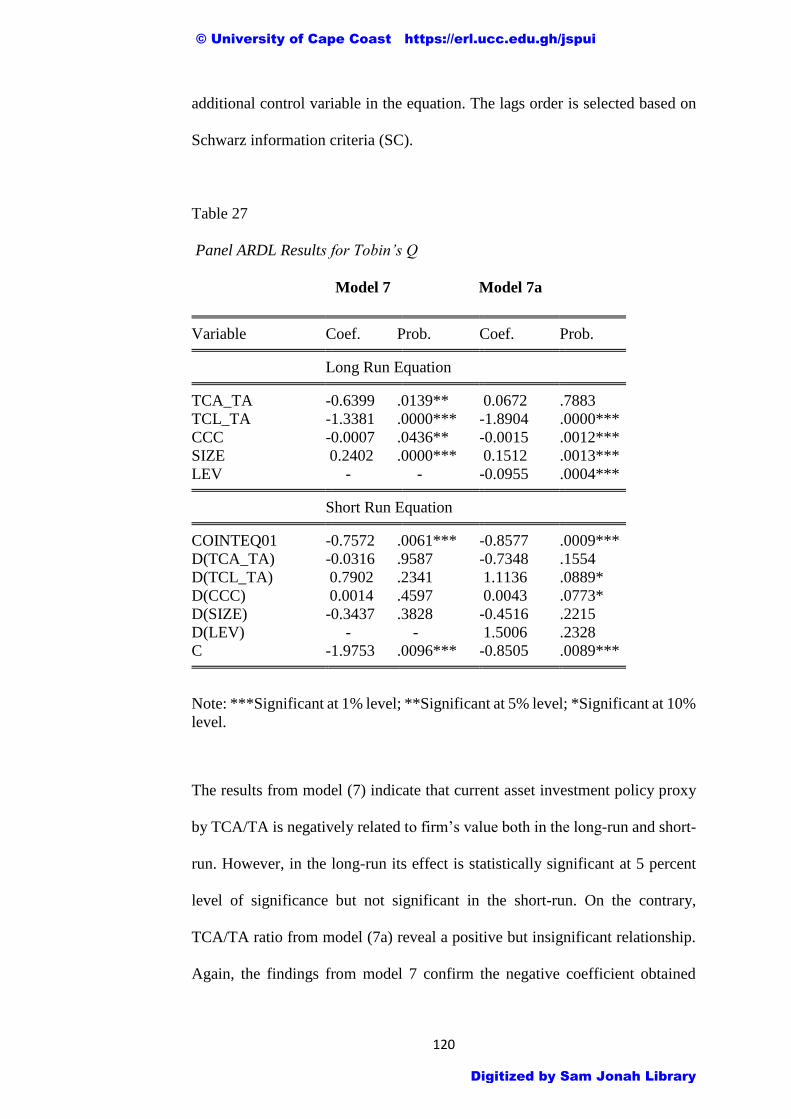
120
additional control variable in the equation. The lags order is selected based on
Schwarz information criteria (SC).
Table 27
Panel ARDL Results for Tobin’s Q
Model 7 Model 7a
Note: ***Significant at 1% level; **Significant at 5% level; *Significant at 10%
level.
The results from model (7) indicate that current asset investment policy proxy
by TCA/TA is negatively related to firm’s value both in the long-run and short-
run. However, in the long-run its effect is statistically significant at 5 percent
level of significance but not significant in the short-run. On the contrary,
TCA/TA ratio from model (7a) reveal a positive but insignificant relationship.
Again, the findings from model 7 confirm the negative coefficient obtained
Variable Coef. Prob. Coef. Prob.
Long Run Equation
TCA_TA -0.6399 .0139** 0.0672 .7883
TCL_TA -1.3381 .0000*** -1.8904 .0000***
CCC -0.0007 .0436** -0.0015 .0012***
SIZE 0.2402 .0000*** 0.1512 .0013***
LEV - - -0.0955 .0004***
Short Run Equation
COINTEQ01 -0.7572 .0061*** -0.8577 .0009***
D(TCA_TA) -0.0316 .9587 -0.7348 .1554
D(TCL_TA) 0.7902 .2341 1.1136 .0889*
D(CCC) 0.0014 .4597 0.0043 .0773*
D(SIZE) -0.3437 .3828 -0.4516 .2215
D(LEV) - - 1.5006 .2328
C -1.9753 .0096*** -0.8505 .0089***
© University of Cape Coast https://erl.ucc.edu.gh/jspui
Digitized by Sam Jonah Library
121
from the FMOLS as reported in Table 23 and indicate a positive relationship
between the degree of aggressiveness of investment policy and Tobin’s Q.
This implies that 1 percent increase in current asset investment causes
firm’s value to decrease by 47 percent in the long-run. Thus, firm’s value
increases as investment in current asset is reduced to the optimal level. This
again is in line with theory that conservative investment policy reduces
corporate profitability and consequently firm’s value. As firms adopt
conservative approach in managing their current asset by investing more in
them, the more shareholder value is destroyed. This result contradicts Nazir and
Afza (2009) who found a negative relationship between relative degree of
aggressiveness of current asset investment policies and Tobin’s Q.
The results also indicate a significantly negative relationship between
firm’s value and current asset financing policy in the long-run for both models
whereas in the short-run it has positive but insignificant effect on firm’s value
for model (7), the effect is significant at 10 percent level of significance with
coefficient of 1.114 (p. value 0.0889) for model (7a). This implies that as the
firms become more aggressive in their current asset financing, the more firm’s
value reduces in the long-run but increases in the short-run. This again support
the theory that short-term debts are cheaper in the short-term than in the long-
run. The findings in the short-run supports Nazir and Afza (2009) findings.
The cash conversion cycle also revealed statistically significant negative
effect on firm’s value in the long-run for both models whereas it has positive
insignificant effect on firm’s value in the short-run for model (7) but significant
at 10 percent level of significance when the firms’ debt-equity ratio is
considered in model (7a). It can be observed that the coefficients from the
© University of Cape Coast https://erl.ucc.edu.gh/jspui
Digitized by Sam Jonah Library
122
results also revealed small magnitude from both models in both long and short-
run periods indicating less explanatory power on the firm’s value albeit its
significance. The control variable firm size is found to be significantly
positively impacted on the firm’s value in the long-run but has negative
insignificant effect in the short-run for both models. Thus, as firms increase in
size in the long-run this positively enhances shareholder value due to economy
of scale. The study also indicated that a significant negative relationship exists
between gearing ratio and Tobin’s Q in the long-run and positive insignificant
relationship in the short-run. Thus, in the short-run leverage may not affect
shareholders’ wealth significantly.
The speed of adjustment coefficient also indicates negative and significant at 5
percent level of significance suggesting the study variables will adjust to long-
run trend roughly 1 ½ years after a short drift to equilibrium state.
Table 28 presents the results from the ARDL (1,1,1,1,1) for model (8)
and ARDL (1,1,1,1,1,1) for model (8a) for the dependent variable Economic
Value Added (EVA). Model (8a) includes firms’ financial leverage measured
by debt-to-equity ratio as an additional control variable in the equation. The lags
order is selected based on Schwarz information criteria (SIC). The results from
model (8) and model (8a) indicate that TCA/TA has positive and statistically
significant effect on EVA at 1 percent level of significance in the long-run. The
positive coefficient of TCA/TA agrees with the results obtained from the
FMOLS as reported in Table 24 and indicates a negative relationship between
the degree of aggressiveness of investment policy and economic value added.
As the ratio of TCA/TA increases, the degree of aggressiveness decreases, and
economic value added increases. Therefore, there is a negative relationship
© University of Cape Coast https://erl.ucc.edu.gh/jspui
Digitized by Sam Jonah Library

123
between the relative degree of aggressiveness of current investment policies of
firms and economic value added.
Thus, 1 standard deviation increase in TCA/TA ratio is predicted to result in a
0.4919 standard deviation increase in economic value added for model (8) and
0.6572 standard deviation increase in EVA for model (8a). This empirical
finding implies that firms can create value for shareholders if they adopt
conservative approach in the management of current assets.
Table 28
Panel ARDL Results for Economic Value Added
Model (8) Model (8a)
Note:***Significant at 1% level **Significant at 5% level *Significant at 10%
level.
This finding is inconsistent with theory that increasing investment in
current assets reduces profitability and shareholder value. On the other hand,
current asset financing policy was found to be a negative relationship with
Variable Coef. Prob. Coef. Prob.
Long Run Equation
TCA_TA 0.4919 .0000*** 0.6572 .0000***
TCL_TA -0.2529 .0176** -0.2143 .0818*
CCC -0.2099 .0015*** -0.3072 .0000***
SIZE -0.8775 .0000*** -1.1633 .0000***
LEV - - 0.5279 .2952
Short Run Equation
COINTEQ01 -0.8900 .0090*** -0.8322 .0028***
D(TCA_TA) 0.0964 .7193 -0.1022 .6662
D(TCL_TA) 0.2022 .1573 0.1416 .4568
D(CCC) 0.0011 .9979 0.4724 .2689
D(SIZE) 3.1348 .0199** 2.5096 .0165**
D(LEV) - - 3.6081 .1548
C -0.3047 .2500 0.1170 .7436
© University of Cape Coast https://erl.ucc.edu.gh/jspui
Digitized by Sam Jonah Library

124
economic profitability. The negative coefficient implies positive relationship
between conservative financing policy and shareholder value. Thus, shareholder
value is created when firms become relatively conservative in the current
liability management. This suggests that in the long-run, short-term sources of
funding are costly. The positive significant coefficient for TCA/TA and the
negative significant coefficient for TCL/TA reveal clearly that relatively
aggressive working capital management policy reduces EVA in the long-run.
This empirical evidence is in line with result from FMOLS as reported in Table
24 and also supports the findings of Bandara and Weerakoon (2014) that firms
with aggressive working capital management practices generate lower EVA.
The short-run equation coefficients indicated that there is positive but no
statistical significant influence on EVA for both models.
Similar to the results from Table 24, Table 28 revealed that CCC has
negative and significant influence on EVA in the long-run whereas it is
positively but insignificantly related to EVA in the short-run for both models.
Thus, in the long-run, firms can create value by shortening the cash conversion
cycle. This suggests that using cash conversion cycle as a comprehensive
measure of working capital management policies, firms can create value for
their shareholders by being relatively aggressive.
The long-run equation results also revealed that the size of the firm has
a negative and significant effect on EVA at 1 percent significant levels for both
models whereas in the short-run, there is a positive significant relationship
between firm size and EVA at 5 percent level of significance for both models.
This implies that in the short-term period one standard deviation increase in
firms’ size leads to a 3.1348 standard deviation increase in EVA for model (8)
© University of Cape Coast https://erl.ucc.edu.gh/jspui
Digitized by Sam Jonah Library

125
whereas one standard deviation increase in firm size is associated with a 2.5096
standard deviation increase in EVA for model (8a) respectively. On the
contrary, as firms increase in size in the long-run, the shareholder value reduces.
This may be due to the fact that firms increase in size to a point that may be
beneficial beyond which diseconomies of scale may set in and destroy
shareholder value. This assertion is consistent with Stimpert and Laux, (2011)
who argue that bigger is better only up to a point beyond that point additional
scale is not associated with greater profitability.
Finally, debt-to-equity ratio was found to have positive but insignificant
effect on EVA both in the long-run and short-run, suggesting that debt-equity
ratio does not influence EVA. The speed of adjustment coefficients indicates
negative and strongly significant at 1 percent level of significance for both
models indicating the study variables will adjust to long-run trend roughly 1
year 3 months and 1 year 1 month for model (8) and (8a) respectively after a
short drift to equilibrium state.
© University of Cape Coast https://erl.ucc.edu.gh/jspui
Digitized by Sam Jonah Library

126
CHAPTER FIVE
SUMMARY, CONCLUSIONS AND RECOMMENDATIONS
Introduction
The present study investigates the effect of working capital management
policies on shareholder value of manufacturing firms listed on Ghana Stock
Exchange for a period of 2000-2013. This research tries to identify the policies
manufacturing firms are pursuing with regard to the current assets investment
and policies being adopted in practice to finance these current assets investment.
It also examines whether significant differences exist among the
aggressive/conservative current assets investment and financing policies of the
firms across the sample companies and confirm whether these aggressive or
conservative current asset investment and financing policies are relatively stable
over the period of time. Finally, the effect of aggressive or conservative current
asset investment and financing policies of firms on shareholder value was
investigated by using various shareholder value metrics.
Summary of Research Findings
The following are the key findings. The mean value for firms’ current
asset investment was less than 50%. Thus, the sample firms were relatively
following aggressive investment policy in managing current assets. On the other
hand, current asset financing policy of the firms was found to be conservative.
The firms rely more on long-term funds to finance their operations with equity
financing being the major source of long-term finance. This implies that the
selected manufacturing firms in Ghana are relatively following moderate
working capital management policies in their current asset investment and
© University of Cape Coast https://erl.ucc.edu.gh/jspui
Digitized by Sam Jonah Library

127
financing. However, Company-wise analysis revealed that PZC and
UNILEVER were following conservative and aggressive working capital
management policies respectively. This finding was confirmed by the CCC.
Whereas average CCC was 72 days, PZC and UNILEVER had 137 days and 14
days respectively.
The study also revealed that significant differences exist among the
various firms regarding current assets investment policies. The nature and
adoption of the current asset investment policies vary from firm to firm. Some
firms are more conservative in managing their current assets while there are
some firms being very much aggressive in their approach. Additionally,
significant differences were also observed between the subsectors. However, no
significant differences were observed with regard to current assets financing
policies among the firms at the conventional level of significance. Thus, these
firms were homogeneous in the current liability management.
The effect of aggressive/conservative current asset investment and
financing policies on shareholder value was examined with the aid of panel
FMOLS and PMG/ARDL estimation techniques. Current assets investment
policy (TCA/TA) was significantly and positively related to return on equity in
the long-run. The positive relationship suggests a negative relationship between
the relative degree of aggressiveness of current asset investment policies of
firms and return on equity. However, the effect was insignificant in the short-
run. Thus, firms can increase shareholder value if they adopt a conservative
approach in the management of current assets in the long-run. Similarly, current
assets financing policy (TCL/TA) has positive and significant influence on
return on equity in the long-run. Thus, shareholder value is created when firms
© University of Cape Coast https://erl.ucc.edu.gh/jspui
Digitized by Sam Jonah Library

128
become relatively aggressive in the current liability management in the long-
run.
In the short-run, working capital financing policy has significant
negative effect on ROE. Hence, firms can yield more return on equity in the
long-run when they follow moderate working capital management policies.
However, the CCC has positive and significant influence on ROE in the long-
run but has significant and negative relationship with profitability in the short-
run. This implies that aggressive working capital management policy increases
return on equity in the short-run but in the long-run as firms become less
aggressive to moderate and finally becoming conservative the better. The size
of the firm indicated a negative and significant effect on ROE in the long-run
whereas in the short-run, the effect was not significant albeit the positive
relationship. Thus, as firms increase in size in the long-run, the profitability
reduces. Also, financial leverage positively influences profitability both in the
long-run and the short-run periods.
Concerning market-to-book ratio, current asset investment policy was
found to have robustly negative and highly significant effect on shareholder
value in the long-run, suggesting a positive relationship between the relative
degree of aggressiveness of current asset investment policy and shareholder
value. Thus, as firms increase investment in current asset in the long-run, it has
the effect of destroying shareholders’ value. However, in the short-run, the
effect is statistically insignificant albeit the negative relationship. The FMOLS
result showed that TCL/TA and CCC have positive and significant effect on
shareholder value. On the other hand, panel ARDL/PMG results indicated that
whereas TCL/TA ratio and CCC have significant negative effect on the
© University of Cape Coast https://erl.ucc.edu.gh/jspui
Digitized by Sam Jonah Library

129
shareholder value in the long-run, only TCL/TA has positive significant effect
on shareholder value in the short-run. The mixed results imply that firms which
follow moderate to aggressive working capital policies create shareholder value
both in the long-run and short-run. Additionally, in the long-run firm size
significantly positively influences shareholder value represented by market-to-
book ratio. Also, financial leverage positively influences shareholder value both
in the long-run and the short-run periods.
Furthermore, current assets investment and financing policies proxied
as TCA/TA and TCL/TA were significantly and negatively related to Tobin’s
Q in the long-run as revealed by both estimators. This finding indicates that as
the degree of aggressiveness of TCA/TA ratio tends to increase in the long-run,
the shareholder value rises. However, the more aggressiveness firms become
toward financing current assets in the long-run, the more shareholder value is
destroyed. Thus, firms adopting moderate working capital management policies
create shareholder value in the long-run. However, in the short-run firms
adopting aggressive current assets financing policies increase shareholder
value. The effect of CCC on shareholders’ value was mixed. Whereas the
FMOLS results indicated that CCC positively influences firm’s value, panel
ARDL/PMG strongly indicated a negative influence on firm’s value in the long-
run. However, in the short-run CCC positively influences firms’ value.
Although, firms’ size has positive effect on firm value in the long-run, the effect
is not significant in the short-run. Similarly, financial leverage has negative
effect on firms’ value in the long-run but positive insignificant effect on firm
value in the short-run.
© University of Cape Coast https://erl.ucc.edu.gh/jspui
Digitized by Sam Jonah Library

130
Finally, conservative current asset investment policy robustly enhances
EVA in the long-run as the coefficient of TCA was positive and significant from
all the estimators. Similarly, conservative current asset financing policy
improves shareholder value in the long-run as the coefficient of TCL/TA was
negative and significant. Thus, as TCL/TA tends to decrease, the more
conservative firms become that enhances shareholder value. However, firms
can create shareholder value if they can reduce the CCC cycle in the long-run.
In the short-run, the effect of current asset and liabilities on EVA is not
significant. Firm size has significant negative effect on the shareholder value in
the long-run but in the short-run the effect is positive. Thus when firms increase
in size through increase revenue beyond certain point diseconomies of scale set
in as incremental cost of sales may outweigh the marginal benefits. Financial
leverage has no significant effect on the shareholder value creation.
It is remarkable to note that the coefficients of CCC from all the models
were small in magnitude, thus having less explanatory power. Hence firms must
take a holistic approach to the management of working capital. The adoption of
IFRS and currency redenomination in 2007 seemed to have negatively impacted
on the profitability and EVA. This could be attributed to the fact that firms must
incur extra cost in complying with the new standards. However, investors’
confidence was boosted and this impacted positively on shareholder value as
measured by market-to-book ratio and Tobin’s Q.
Conclusions
The present study was undertaken to determine the effect working capital
management policies have on shareholder value. Empirical literature suggests
© University of Cape Coast https://erl.ucc.edu.gh/jspui
Digitized by Sam Jonah Library

131
that there is positive relationship between the degree of aggressiveness of
current assets investment and financing policies with profitability and
shareholder value. Thus, the more aggressive management becomes toward
working capital management, the higher the profitability leading to increase in
shareholder value. Using six manufacturing firms listed on the GSE over a
period of 2000-2013, the study sought to ascertain whether significant
differences existed among the selected firms with regard to current assets
investment and financing policies. Also, the effect of working capital
management policies on shareholder value was examined.
The results from the study revealed that the listed manufacturing firms
are following moderate working capital management policies. Whereas the
firms are aggressive in the current asset management, they are found to be
conservative in their current asset financing policies. It was also found that there
were significant differences in the relative degree of aggressiveness in the
current assets investment. However, no significant differences were found
among the firms in their current liabilities management. The cointegration
regression results indicated that firms that follow moderate to conservative
working capital management policies increase profitability and shareholder
value in the long-run.
The effect of CCC on shareholders’ value was mixed. Concerning ROE,
CCC robustly indicated positive effect on ROE by both estimators in the long-
run. Thus, in the long-run conservative working capital management policy
yields higher return on equity. On the other hand, whereas the FMOLS results
indicated that CCC positively influences market-to-book ratio and Tobin’s Q,
panel ARDL/PMG strongly indicated a negative influence on market-to-book
© University of Cape Coast https://erl.ucc.edu.gh/jspui
Digitized by Sam Jonah Library

132
ratio, Tobin’s Q and EVA in the long-run. However, in the short-run CCC
significantly negatively influences ROE but positively influences market-to-
book ratio, Tobin’s Q and EVA although only Tobin’s Q is significant. This
implies that aggressive working capital management policy increases return on
equity in the short-run.
The control variables size and leverage exhibited mixed effects on the
shareholder value. The size of the firm indicated a negative and significant
effect on ROE and EVA in the long-run whereas in the short-run, it has positive
significant effect on EVA. Thus, as firms increase in size in the long-run, both
accounting and economic profitability reduces but market-to-book ratio and
Tobin’s Q increases. Also, financial leverage positively influences ROE and
market-to-book ratio both in the long-run and the short-run periods. However,
as debt/equity ratio increases in the long-run it tends to decrease Tobin’s Q
although, it has positive effect on Tobin’s Q in the short-run. Again, no
statistical significant effect was found regarding debt/equity ratio on EVA both
in the long-run and short-run periods albeit it positive relationships in the short-
run as well as in the long-run.
Recommendations
From the findings, the following recommendations would be useful to the
management of the listed manufacturing firms.
The study revealed a positive relationship between conservative current
asset investment policy and return on equity as well as economic value added.
However, conservative investment policy indicated negative effect on market
based assessment which is an indication that investors do not reward
© University of Cape Coast https://erl.ucc.edu.gh/jspui
Digitized by Sam Jonah Library

133
conservative investment policies. On the other hand, aggressive financing
policy has tendency to destroy shareholders’ value in the long run. In respect
of this, firms would enhance profitability and create value for their investors by
pursuing relatively moderate policies. Thus, firms pursuing aggressive current
asset investment policy should balance it with conservative current asset
financing policy and vice versa in order to enhance profitability and create
shareholder value for their investors.
Additionally, the findings indicated that current assets and liabilities have
long term implications on the shareholders’ value. In order to create wealth for
the existing and potential investors, finance managers of the listed
manufacturing firms in Ghana should pay equal attention and manage
efficiently and effectively the short-term resources and finances as they are one
of the key drivers to create value for shareholders.
The study also revealed that the coefficients of the cash conversion cycle
had weak explanatory power than the other explanatory variables. Hence,
Finance managers should take a holistic approach in the management of
working capital rather than concentrating on some components such as
inventory, trade receivables and trade payables. Cash and cash equivalents and
other short term financing must be prudently managed to enhance investors
wealth.
Areas for Further Study
Since the current study only concentrated on the manufacturing entities,
it would be useful to also consider the following topics for future research:
© University of Cape Coast https://erl.ucc.edu.gh/jspui
Digitized by Sam Jonah Library

134
The effect of working capital management policies on shareholder value
using non-financial firms listed on the Ghana Stock Exchange.
The effect of working capital management policies on shareholder value
using financial firms listed on the Ghana stock exchange.
The effect of working capital management policies on shareholder value
using financial and non-financial firms listed on the Ghana Stock Exchange.
Sectorial analysis of the effect of working capital management policies
on shareholder value using non-financial firms listed on the Ghana Stock
Exchange.
The relationship between aggressiveness/conservativeness of current
asset investment/financing policies of firms and their financial and operating
risks in Ghana.
© University of Cape Coast https://erl.ucc.edu.gh/jspui
Digitized by Sam Jonah Library
135
REFERENCES
Abor, J. (2005). The effect of capital structure on profitability: An empirical
analysis of listed firms in Ghana. The Journal of Risk Finance, 6(5),
438-445.
Acheampong, P., & Agalega, E. (2013). Does the capital asset pricing model
(CAPM) predict stock market return in Ghana? Research Journal of
Finance and Accounting, 4(9), 27-35.
Addae, A. A., Nyarko-Baasi, M., & Hughes, D. (2013). The effects of capital
structure on profitability of listed firms in Ghana. European Journal of
Business and Management, 5 (31), 215-229.
African Champion Industries Limited (2013). 2013 Annual report and financial
statements.
Afza, T., & Nazir, M. S. (2008). Working capital approaches and firm’s return.
Pakistan Journal of Commerce and Social Science, 1(1), 25-36.
Agarwal, N. P., & Mishra, B. K. (2007). Working capital management. Jaipur,
India: RBSA Publishers.
Agyemang, B. E., & Asiedu, K. M. (2013). The relationship between working
capital management and profitability of listed manufacturing companies
in Ghana. International Journal of Business Social Research, 3(2), 25-
34.
Akinlo, O. O. (2011). Does working capital cause profitability? The Nigerian
experience. Journal of Modern Accounting and Auditing, 7(5), 457-462.
Akinlo, O. O. (2012). Determinants of working capital requirement in selected
quoted companies in Nigeria. Journal of African Business, 13(1), 40-50.
© University of Cape Coast https://erl.ucc.edu.gh/jspui
Digitized by Sam Jonah Library

136
Akoto, R. K., Awunyo-Vitor, D., & Angmor, P. L. (2013). Working capital
management and profitability: Evidence from Ghanaian listed
manufacturing firms. Journal of Economics and International Finance,
5(9), 373-379.
Aktas, N., Croci, E., & Petmezas, D. (2015). Is working capital management
value-enhancing? Evidence from firm performance and investments.
Journal of Corporate finance, 30, 98-113.
Doi:10.1016/jcorpfin.2014.12.008
Al-Shubiri, F. N. (2011). The effect of working capital practices on risk
management: Evidence from Jordan. Global Journal of Business
Research, 5(1), 39-54. Available at http://ssrn.com/abstract=1873494
Aminu, Y., & Zainudin, N. (2015). A review of anatomy of working capital
management theories and the relevant linkages to working capital
components: A theoretical building approach. European Journal of
Business and Management, 7(2), 10-18.
Ani, W. U., Okwo, I. M., & Ugwunta, D. O. (2012). Effects of working capital
management on profitability: Evidence from the top five beer brewery
firms in the world. Asian Economic and Financial Review, 2(8), 966-
982.
Ankudinov, A., & Lebedev, O. (2014). Investment drivers of shareholder value
creation in large publicly traded Russian companies. Investment
Management and Financial Innovations, 11(2), 77- 85.
Atiyet, B. A. (2012). The impact of financing decision on the shareholder value
creation. Journal of Business Studies Quarterly, 4(1), 44-63.
© University of Cape Coast https://erl.ucc.edu.gh/jspui
Digitized by Sam Jonah Library

137
Awad, I., & Jayyar, F. (2013). Working capital management, liquidity and
profitability of the manufacturing sector in Palestine: Panel co-
integration and causality. Modern Economy, 4, 662-671. Available
online at http://dx.doi.org/10.4236/me.2013.410072
Baltagi, B. H. (2005). Econometric Analysis of Panel Data (3rd ed.). Chichester,
England: Wiley & Sons
Bandara, R. M. S. (2015). Impact of working capital management policy on
market value addition. Global Journal of Contemporary Research in
Accounting, Auditing and Business Ethics, 1(2), 354-373.
Bandara, R. M. S., & Weeraboon, R. K. (2014). Impact of working capital
management practices on a firm value. Retrieved from
http://www.kln.ac.lk/uokr/ICBI2011/A&F%20140.pdf
Baños-Caballero, S., García-Teruel, P. J., & Martínez-Solano, P. (2014).
Working capital management, corporate performance, and financial
constraints. Journal of Business Research, 67(3), 332-338.
Doi:101016/j.jbusres.2013.01.016
Barine, N. M. (2012). Working capital management efficiency and corporate
profitability: Evidences from quoted firms in Nigeria. Journal of
Applied Finance and Banking, 2(2), 215-237.
Berryman, J. (1983). Small business failure and bankruptcy: A survey of the
literature. European Small Business Journal, 1(4), 47-59.
Bhasin, M. L. (2013). Economic value added and shareholders’ wealth creation:
Evidence from a developing country. International Journal of Finance
and Accounting, 2(4), 185-198.
© University of Cape Coast https://erl.ucc.edu.gh/jspui
Digitized by Sam Jonah Library
138
Bhutto, N. A., Abbas, G., Rehman, M., & Shah, S. M. M. (2011). Relationship
of cash conversion cycle with firm size, working capital approaches and
firm’s profitability: A case of Pakistani industries. Pakistan Journal of
Engineering, Technology and Science, 1(2), 45-64.
Black, A., Wright, P., Bachman, P. E., & Davies, J. (1998). In Search of
Shareholder Value: Managing the drivers of performance (2nd ed.).
London, England: Prentice Hall
Blinder, A. S., & Maccini, L. J. (1991). The resurgence of inventory research:
What have we learned? Journal of Economic survey, 5(4), 291-328. Doi:
10.1111/j.1467-6419.1991.tb00138.x
Boasson, E., & Boasson, V. (2005). IT innovations in IT Industries: Does it pay
off? Proc ISECON, 22, 1-7. Available at:
http://proc.isecon.org/2005/3353/ISECON.2005.Boasson.pdf
Breitung, J (2000). The local power of some unit root tests for panel data, in B.
Baltagi (ed.), Advances in Econometrics, Vol. 15: Nonstationary Panels,
Panel Cointegration, and Dynamic Panels, Amsterdam: JAI Press, 161–
178.
Brennan, M., Maksimovic, V., & Zechner, J. (1988). Vendor financing. Journal
of Finance, 43, 1127-1141.
Brigham, E. F., & Ehrhardt, M. C. (2011). Financial management: Theory and
practice, (13th ed.). Mason, OH: South-Western Cengage Learning.
Brigham, E. F., & Houston, J. F. (2009). Fundamentals of financial
management (12th ed.). Mason, OH: South-Western Cengage Learning.
Brooks, C. (2008). Introductory econometrics for finance (2nd ed.). The ICMA
Centre, University of Reading, Cambridge University Press.
© University of Cape Coast https://erl.ucc.edu.gh/jspui
Digitized by Sam Jonah Library

139
Carpenter, M. D., & Johnson, K. H. (1983). The association between working
capital policy and operating risk. Financial Review, 18(3), 106.
CFO Magazine (2010). Working capital management in a post-recession
environment: The view from Europe. Boston, MA: CFO Publishing.
Chari, L., & Mohanty, R. P. (2009). Understanding value creation: The
shareholder value perspective. LBS Journal of Management &
Research, 7(1&2), 12-26. Retrieved from http:// www.Mimts .org/lbs_
journal/4Understanding%20value%20Creation%20%20The%20Shareh
older%20Value%20Perspective.pdf
Choi, I. (2001). Unit root tests for panel data. Journal of International Money
and Banking, 20, 249-272.
Corsten, D., & Gruen, T. (2004). Stock-outs cause walkouts. Harvard Business
Review, 82, 26-28.
Deloof, M. (2003). Does working capital management affect profitability of
Belgian firms? Journal of Business, Finance and Accounting, 30, 573-
587.
Demirgunes, K. (2015). Determinants of target dividend payout ratio: A panel
Autoregressive Distribution Lag analysis. International Journal of
Economics and Financial Issues, 5(2), 418-426.
De Wet, J. H. V. H., & Du Toit, E. (2007). Return on equity: A popular, but
flawed measure of corporate financial performance. South African
Journal of Business and Management, 38(1), 59-69.
Duggal, R., & Budden, M. C. (2015). Further evidence of the creation of value
through the management of net working capital: An analysis of S&P 500
© University of Cape Coast https://erl.ucc.edu.gh/jspui
Digitized by Sam Jonah Library

140
firms. Journal of Business & Economics Research – First Quarter,
13(1), 79-82.
Ek, R., & Guerin, S. (2011). Is there a right level of working capital? Journal of
Corporate Treasury Management, 4 (2), 137-149.
Eleke-Aboagye, P. Q. (2014). Assessment of the extent to which firms in Ghana
utilize financial ratios analysis and working capital management
techniques. International Journal of Research Management, 4(1), 30-
44.
Eljelly, A. M. A. (2004), Liquidity-profitability tradeoff: An empirical
investigation in an emerging market. International Journal of
Commerce and Management, 14(2), 48-61.
Doi: 10.1108/10569210480000179
Emery, R.D., & Finnerty, D. J. (1991). Principles of Finance with Corporate
Application. Eagan, MN: West Publishing Company.
Engle, R. F., & Granger, C. W. J (1987). Co-integration and error correction:
Representation, estimation, and testing. Econometrica, 55(2), 251-276.
Ernst & Young (2013). All tied up, working capital management report, 2013.
Retrieved from. http://www.ey.com
Fazzari, S. M., & Petersen, B. (1993). Working capital and fixed investment:
New evidence on financing constraints. Rand Journal of Economics, 24,
328-342. http://dx.doi.org/10.2307/2555961
Ferreira, M. A., & Vilela, A. S. (2004). Why do firms hold cash? Evidence from
EMU countries. European Financial Management, 10(2), 295-319.
© University of Cape Coast https://erl.ucc.edu.gh/jspui
Digitized by Sam Jonah Library

141
Filbeck, G., & Krueger, M. T. (2005). An analysis of working capital
management results across industries. Mid-American Journal of
Business, 20(2), 11-18.
Fraker, G. T. (2006). Using Economic Value Added (EVA) to measure and
improve bank performance. 2006 paper writing contest, RMA Arizona
chapter.
http://www.rmaaz.org/pictures/measuringbankperformance.pdf.
downloaded on 13/09/2014.
Garcia-Teruel, P. J., & Martinez-Solano, P. (2007) Effects of working capital
management on SME profitability. International Journal of Managerial
Finance, 3, 164- 177.
Gardner, M. J., Mills, D. L., & Pope, R. A. (1986). Working capital policy and
operating risk: An empirical analysis. Financial Review, 21(3), 31.
Gatsi, J. G., & Akoto, R. K. (2010). Capital structure and profitability in
Ghanaian banks, Social Science Research Network, 1-69.
http://ssrn.com/abstract=1618952
Ghana Stock Exchange (2013). 2013 Market report. http://www.gse.com.gh
Gitman, L. J., & Zutter, C. J. (2012). Principles of managerial finance (13th ed.).
Boston, MA: Prentice Hall.
Granger, C., & Newbold, P. (1974). Spurious regressions in econometrics.
Journal of Econometrics, 2(2), 111-120
Gross, S. (2006). Banks and shareholder value: An overview of bank valuation
and empirical evidence on shareholder value for banks. Wiesbaden: Dt.
Univ.-Verlag/ GWV Fachverlage GmbH
© University of Cape Coast https://erl.ucc.edu.gh/jspui
Digitized by Sam Jonah Library
142
Hadri, K. (2000). Testing for Stationarity in Heterogeneous Panel Data.
Econometric Journal, 3, 148–161.
Hall, J. H. (1999). Correlating internal and external performance yardsticks in
the evaluation of corporate wealth creation. Meditari Accountancy
Research, 7, 123-143.
Hall, J. H. (2000). Dissecting EVA: The value drivers determining the
shareholder value of industrial companies. Available at
http://ssrn.com/abstract=304196
Hassani, M., & Tavosi, A. R. (2014). To survey the effect of working capital
policies (investing & financing) on profitability risk (evidence from
Tehran stock exchange). Journal of Investment and Management, 3(1),
30-36.
Im, K. S., Pesaran, M. H., & Shin, Y. (2003). Testing for unit roots in
heterogeneous panels. Journal of Econometrics, 115, 53–74.
Javid, S., & Zita, V. P. (2014). Impact of working capital policy on firm’s
profitability: A case of Pakistan cement industry. Research Journal of
Finance and Accounting, 5(5), 182-191.
Jiang, T. (2003). Firm size and IT investment: Beyond simple averages. Twenty-
Fourth International Conference on Information Systems. Retrieved
from:http://pages.stern.nyu.edu/~tjiang/docs/IT_Investment_ICIS_200
3.pdf
Johnson, B. (2001). Towards a new classification of nonexperimental
quantitative research, Educational Research, 30(2) 3-13.
Jose, M. L., Lancaster, C., & Stevens, J.L. (1996). Corporate return and cash
conversion cycle. Journal of Economics and Finance, 20, 33-46.
© University of Cape Coast https://erl.ucc.edu.gh/jspui
Digitized by Sam Jonah Library

143
Kakani, R. K., Saha, B., & Reddy, V. N. (2001). Determinants of financial
performance of Indian corporate sector in the post-liberation era: An
exploratory study. National Stock Exchange of India Research Initiative.
Working paper 5, 1-38.
Karadagli, E. C. (2012). The effect of working capital management on the
profitability of Turkish SMEs. British Journal of Economics, Finance
and Management Sciences, 5(2), 36-44.
Kerlinger, F. N., & Lee, H. B. (2000). Foundations of behavioral research
(4th ed.). Fort Worth, TX: Harcourt.
Khajehpour, P., Khodamipour, A., & Sadeghi, Z. (2014). The impact of an
aggressive working capital management policy on profitability of firms
listed in Teran stock exchange. MAGNT Research Report, 2(2), 1-8.
Retrieved from http://brisjast.com/wp-content/uploads/2015/06/Mar-1-
2014.pdf
Kieschnick, R., LaPlante, M., & Moussawi, R. (2013). Working capital
management and shareholder’s wealth. Review of Finance, 17 (5) 1827-
1852. Doi:10.1093/rof/rfs043
Korankye, T. (2013). Determinants of shareholder value creation of listed banks
in Ghana. International Journal of Empirical Finance, 1(1), 7-12.
Available at http://rassweb.com
Korankye, T., & Adarquah, S. R. (2013). Empirical analysis of working capital
management and its impact on the profitability of listed manufacturing
firms in Ghana. Research Journal of Finance and Accounting, 4(1), 124-
131.
© University of Cape Coast https://erl.ucc.edu.gh/jspui
Digitized by Sam Jonah Library

144
Koury, N.T., Smith, K.V., & MacKay, P.I. (1998). Comparing working capital
practices in Canada, the United States, and Australia: A Note. Purdue
CIBER Working Papers. http://docs.lib.purdue.edu/ciberwp/132
Krejcie, R.V., & Morgan, D.W. (1970). Determining sample size for research
activities, Educational and Psychological Measurement, 30(3), 607-
610. Doi: 10.1177/001316447003000308
Lamberson, M. (1995), Changes in working capital of small firms in relation to
changes in economic activity. Mid-American Journal of Business, 10
(2), 45-50.
Lee, R. M. (2000). Unobtrusive methods in social research. Buckingham,
United Kingdom: Open University Press.
Levin, A., Lin, C. F., & Chu, C. (2002). Unit root tests in panel data: Asymptotic
and finite- sample properties. Journal of Econometrics, 108, 1–24.
Long, M. S., Malitz, I. B. & Ravid, S. A. (1993). Trade credit, quality
guarantees, and product marketability. Financial Management, 22, 117-
127.
Maddala, G. S., & Wu, S. (1999). A comparative study of unit root tests with
panel data and a new simple test. Oxford Bulletin of Economics and
Statistics, 61, 631–52.
Marfo-Yiadom, E. & Agyei, S. K. (2011). Working capital management
practices of small scale enterprises in the Central Region of Ghana.
Asian Journal of Business and Management Sciences, 1(4), 29-47.
McClave, J.T., & Sincich, T. (2000). Statistics (8th ed.). Upper Saddle River,
NJ: Prentice Hall.
© University of Cape Coast https://erl.ucc.edu.gh/jspui
Digitized by Sam Jonah Library
145
McInnes, A. N. S. (2000). Working capital management: Theory and evidence
from New Zealand listed liability companies. Unpublished Master
degree thesis, Lincoln University.
McLaney, E. (2009). Business finance: Theory and practice (8th ed.). Harlow,
England: Pearson Education.
Mohamad, N. A. B., & Saad, N. B. M. (2010). Working capital management:
The effect of market valuation and profitability in Malaysia.
International Journal of Business and Management, 5(11), 140-147.
Mwangi, L. W., Makau, M. S., & Kosombe, G. (2014). Effects of working
capital management on performance of nonfinancial companies listed in
NSE, Kenya. European Journal of Business and Management, 6(11),
195-205.
Myers, S. C., & Majluf, N. S. (1984). Corporate financing and investment
decisions when firms have information that investors do not have.
Journal of Financial Economics, 13, 187-221.
Naccur, B. S., & Goaied, M. (1999). The value creation process in the Tunisian
Stock exchange. API working papers series. Retrieved from:
www.arab-api.org/images/publication/pdfs/307/307_wps9903.pdf
Narang, S., & Kaur, M. (2014). Impact of firm-specific attributes on shareholder
value creation of Indian companies: An empirical analysis. Global
Business Review, 15, 847-866.
Nazir, M. S., & Afza, T (2009). Impact of aggressive working capital
management policy on firms’ profitability. The IUP Journal of Applied
Finance, 15(8), 19-31.
© University of Cape Coast https://erl.ucc.edu.gh/jspui
Digitized by Sam Jonah Library
146
Neideen, T., & Brasel, K. (2007). Understanding statistical tests. Journal of
surgical education, 64(2), 93-96. Doi:10.1016/j.jsurg.2007.02.001
Niresh, J. A. (2012). Working capital management & financial performance of
manufacturing sector in Sri Lanka. European Journal of Business and
Management, 4(15), 23- 30.
Ogundipe, L. O., Ogundipe, S. E., & Ajao, S. K. (2012). Cash holding and firm
characteristics: evidence from Nigerian emerging market. Journal of
Business, Economics and Finance, 1(2), 45-58.
Ogundipe, S. E., Idowu, A., & Ogundipe, L. O. (2012). Working capital
management, firms’ performance and market valuation in Nigeria.
International Journal of Social, Management, Economics and Business
Engineering, 6(1), 19-23.
Onwumere, J.U.J, Ibe, G. I., & Ugbam, O.C. (2012). The impact of working
capital management on profitability of Nigerian firms: A preliminary
investigation. European Journal of Business and Management, 4(15),
192-201.
Osundina, J. A., & Osundina, K. C. (2014). The effect of working capital
management on market value of quoted food and beverages
manufacturing firms in Nigeria. International Journal of Business and
Social Science, 58(1), 168-177.
Padachi, K., Howorth, C., & Narasimhan, M. S. (2012). Working Capital
Financing Preferences: The case of Mauritian manufacturing small and
medium-sized enterprises (SMEs). Asian Academy of Management
Journal of Accounting and Finance, 8(1), 125–157.
© University of Cape Coast https://erl.ucc.edu.gh/jspui
Digitized by Sam Jonah Library

147
Palombini, N. V. N., & Nakamura, W. T. (2012). Key factors in working capital
management in the Brazilian market. RAE, 52(1), 55- 69.
Pandey, I. M. (2005). What drives the shareholder value? Asian Academy of
Management Journal of Accounting and Finance, 1, 105-120.
Pandey, I.M. (2010), Financial Management (10th ed.). New Delhi, India: Vikas
Publishers.
Pandey, I.M., & Perera, K.L.W. (1997). Determinants of effective working
capital management – A discriminant analysis approach. IIMA Working
Paper # 1349. Research and Publication Department. Ahmedabad,
India: Indian Institute of Management.
Pedroni, P. (1999). Critical values for cointegration tests in heterogeneous
panels with multiple regressors. Oxford Bulletin of Economics and
Statistics, 61, 653-670.
Pedroni, P. (2000). Fully Modified OLS for heterogeneous cointegrated panels.
Nonstationary Panels, Panel Cointegration and Dynamic Panels, 15,
93-138.
Pedroni, P. (2001). Purchasing power parity tests in cointegrated panels. Review
of Economics and Statistics, 83, 727-731.
Pedroni, P. (2004). Panel cointegration: Asymptotic and finite sample properties
of pooled time series tests with an application to the PPP hypothesis.
Econometric Theory, 20, 597–625.
Pesaran, M. H., Shin, Y., & Smith, R. P. (1999). Pooled mean group estimation
of dynamic heterogeneous panels. Journal of the American Statistical
Association, 94(446), 621-634. Doi: 10.2307/2670182
© University of Cape Coast https://erl.ucc.edu.gh/jspui
Digitized by Sam Jonah Library

148
Phillips, P.C.B., & Perron, P. (1988). Testing for a unit root in time series
regression. Biometrika, 75, 335–346.
Pike, R., & Neale, B. (2009). Corporate finance and investment: Decisions and
strategies (6th ed.). Harlow, England: Prentice Hall.
Pioneer Kitchenware Limited (2012). 2012 Annual report and financial
statements.
Pirashanthini, S., Tharmila, K., & Velnampy, T. (2013). Working capital
approaches and firm’s profitability of manufacturing companies in Sri
Lanka. Comprehensive Research Journal of Management and Business
Studies, 1(2), 24–30.
Pouraghajan, A., & Emamgholipourarchi, M. (2012). Impact of working capital
management on profitability and market evaluation: Evidence from
Tehran Stock Exchange. International Journal of Business and Social
Science, 3 (10), 311-318.
Raheman, A., & Nasr, M. (2007). Working capital management and
profitability: Case of Pakistani firms. International Review of Business
Research Papers, 3(1), 279 – 300.
Raheman, A., Afza, T., Qayyum, A., & Bodla, M. A. (2010). Working capital
management and corporate performance of manufacturing sector in
Pakistan. International Research Journal of Finance and Economics,
47, 151-163.
Rahman, M. M. (2011). Working capital management and profitability: A study
on textiles industry, ASA University Review, 5(1), 115-132.
Rappaport, A. (1986). Creating Shareholder Value: The new standard for
business performance. New York, NY: The Free Press.
© University of Cape Coast https://erl.ucc.edu.gh/jspui
Digitized by Sam Jonah Library
149
Salawu, R. O. (2007). Capital industry practice and aggressive conservative
working capital policies in Nigeria, Global Journal of Business
Research, 1(2), 109-117.
Sam Woode Limited (2009). 2009 annual report and financial statements
Sathyamoorthi, C. R., & Wally-Dima, L. B. (2008). Working capital
management: The case of listed retail domestic companies in Botswana.
Icfaian Journal of Management Research, 6(5), 7-24.
Saunders, M., Lewis, P., & Thornhill, A. (2009). Research methods for business
Students. (5th ed.). Harlow, England: FT/Prentice Hall
Schiff, M., & Lieber, Z. (1974). A model for the integration of credit and
inventory management. The Journal of Finance, 29, 133-140.
Sekaran, U. (2003). Research methods for business: A skill building approach
(4th ed.). New York, NY: John Willy & Sons.
Shakoor, F., Khan, A., & Nawab, S. (2012). The inter-linkage of working capital
and profitability in Pakistan. Academic Research International, 3(2),
562-567.
Shin, H. H., & Soenen, L. (1998). Efficiency of working capital and corporate
profitability. Financial Practice and Education, 8, 37-45.
Singh, P. (2008). Inventory and working capital management: An empirical
analysis. ICFAI Journal of Accounting Research, 7(2), 53-73.
Smith, K. (1980). Profitability versus liquidity tradeoffs in working capital
management. In readings on the management of working capital, St
Paul, MN: West Publishing Company, 549-562.
Srivastava, R., & Misra, A. (2008). Financial Management. New Delhi, India:
Oxford University Press.
© University of Cape Coast https://erl.ucc.edu.gh/jspui
Digitized by Sam Jonah Library

150
Stimpert, J. L., & Laux, J. A. (2011). Does size matter? Economies of scale in
the banking industry. Journal of Business and Economic Research, 9
(3), 47-54.
Tobin, J., & Brainard, W. (1968). Pitfalls in financial model building. American
Economic Review, 58 (2), 99-122.
United Nations (2008). International Standard Industrial Classification of All
Economic Activities (Revision 4). New York. NY: United Nations
Publication.
Vahid, T. K., Mohsen, A. K., & Mohammadreza, E. (2012). The impact of
working capital management policies on firm's profitability and value:
Evidence from Iranian Companies. International Research Journal of
Finance and Economics, 88, 156-162.
Van Horne, J. C., & Wachowicz, J. M. (2009). Fundamentals of Financial
Management (13th ed.). Harlow, England: Pearson Education.
Wagner, M., & Hlouskova, J. (2009). The performance of panel cointegration
methods: Results from a large scale simulation study. Econometric
Reviews, 29(2), 182-223.
Wasiuzzaman, S., & Arumugam, V. C. (2013). Determinants of working capital
investment: A study of Malaysian public listed firms. Australasian
Accounting, Business and Finance Journal, 7(2), 63-83. Available at:
http://ro.uow.edu.au/aabfj/vol7/iss2/5
Watson, D., & Head, A. (2007). Corporate finance: Principles and practice (4th
ed.). Harlow, England: Prentice Hall.
© University of Cape Coast https://erl.ucc.edu.gh/jspui
Digitized by Sam Jonah Library

151
Weinraub, H. J., & Visscher, S. (1998). Industry practice relating to aggressive
conservative working capital policies. Journal of Financial and
Strategic Decision, 11(2), 11-18.
Wilner, B. S. (2000). The exploitation of relationship in financial distress: The
case of trade credit. Journal of Finance, 55, 153-178.
© University of Cape Coast https://erl.ucc.edu.gh/jspui
Digitized by Sam Jonah Library

152
APPENDICES
Appendix A: Manufacturing Firms Listed on GSE as of 31st December, 2013
N
o
Name of
Company
ISIC
Classification
GSE
Classification
Year
listed
on the
GSE
Negative
Equity
Select
ed
1 Aluworks Ltd Manufacturing Manufacturing 1996 No Yes
2 Aryton Drugs
Manuf. Ltd
Manufacturing Manufacturing 2006 No No
3 Camelot Group
Gh. Ltd
Manufacturing Manufacturing 1999 No Yes
4
Cocoa
Processing Co.
Ltd
Manufacturing Food &
Beverage
2003 No No
5 Fan Milk Gh.
Ltd
Manufacturing Food &
Beverage
1991 No Yes
6 Golden Web
Company Ltd
Manufacturing Manufacturing 2005 Yes No
7 Guinness Gh.
Breweries Ltd
Manufacturing Food &
Beverages
1991 No Yes
8 Pioneer
Kitchenware
Co. Ltd
Manufacturing
Manufacturing
1995
Yes
No
9 Pz Cusson Gh.
Ltd
Manufacturing Manufacturing 1991 No Yes
10 Sam Woode
Ltd
Manufacturing Manufacturing 2002 No No
11 Starwin
Product Ltd
Manufacturing Manufacturing 2004 No No
12 Unilever Gh.
Ltd
Manufacturing Manufacturing 1991 No Yes
Note. African Champion Industries Ltd. though still listed on GSE is no more a
manufacturing concern after disposing of its manufacturing plant on 6th
September, 2013.
© University of Cape Coast https://erl.ucc.edu.gh/jspui
Digitized by Sam Jonah Library

153
Appendix B-1: T-Test for the Differences in the Means of Total Current Asset/
Total Asset (TCA/TA)
Group Statistics
SUB-SECTOR N Mean Std.
Deviation
Std. Error
Mean
TCA/TA Other Manufacturing Firms 56 .52418722 .169010507 .022584979
Food & Beverages 28 .41626927 .130395226 .024642381
Independent Samples Test
TCA/TA
Equal
variances
assumed
Equal
variances not
assumed
Levene's Test for
Equality of Variances
F 3.221
Sig. .076
t-test for Equality of
Means
T 2.963 3.229
Df 82 67.893
Sig. (2-tailed) .004 .002
Mean Difference .107917948 .107917948
Std. Error Difference .036418454 .033426460
95% Confidence
Interval of the
Difference
Low
er .035470041 .041214590
Uppe
r .180365855 .174621306
Appendix B-2: ANOVA Test Results for (TCA/TA)
ANOVA
Current Asset Investment Policies
Sum of
Squares
Df Mean Square F Sig.
Between Groups .914 5 .183 10.686 .000
Within Groups 1.334 78 .017
Total 2.248 83
© University of Cape Coast https://erl.ucc.edu.gh/jspui
Digitized by Sam Jonah Library

154
Appendix B-3: Current Asset Investment Policies (TCA/TA) – LSD
Multiple Comparisons.
(I)
COMPANY
(J) COMPANY Mean
Difference (I-J)
Std. Error Sig.
ALUWORK
S
CMLT .089238375 .049425947 .075
PZC -.169394533* .049425947 .001
UNILEVER .007808504 .049425947 .875
FML .005200222 .049425947 .916
GGBL .174461848* .049425947 .001
CMLT
ALUWORKS -.089238375 .049425947 .075
PZC -.258632908* .049425947 .000
UNILEVER -.081429870 .049425947 .103
FML -.084038153 .049425947 .093
GGBL .085223473 .049425947 .089
PZC
ALUWORKS .169394533* .049425947 .001
CMLT .258632908* .049425947 .000
UNILEVER .177203037* .049425947 .001
FML .174594755* .049425947 .001
GGBL .343856381* .049425947 .000
UNILEVER
ALUWORKS -.007808504 .049425947 .875
CMLT .081429870 .049425947 .103
PZC -.177203037* .049425947 .001
FML -.002608283 .049425947 .958
GGBL .166653343* .049425947 .001
FML
ALUWORKS -.005200222 .049425947 .916
CMLT .084038153 .049425947 .093
PZC -.174594755* .049425947 .001
UNILEVER .002608283 .049425947 .958
GGBL .169261626* .049425947 .001
GGBL
ALUWORKS -.174461848* .049425947 .001
CMLT -.085223473 .049425947 .089
PZC -.343856381* .049425947 .000
UNILEVER -.166653343* .049425947 .001
FML -.169261626* .049425947 .001
*. The mean difference is significant at the 0.05 level.
© University of Cape Coast https://erl.ucc.edu.gh/jspui
Digitized by Sam Jonah Library

155
Appendix B-4: Current Asset Investment Policies (TCA/TA) – Tukey’s HSD
Multiple Comparisons.
(I)
COMPANY
(J) COMPANY Mean
Difference (I-J)
Std. Error Sig.
ALUWORK
S
CMLT .089238375 .049425947 .468
PZC -.169394533* .049425947 .012
UNILEVER .007808504 .049425947 1.000
FML .005200222 .049425947 1.000
GGBL .174461848* .049425947 .009
CMLT
ALUWORKS -.089238375 .049425947 .468
PZC -.258632908* .049425947 .000
UNILEVER -.081429870 .049425947 .570
FML -.084038153 .049425947 .536
GGBL .085223473 .049425947 .520
PZC
ALUWORKS .169394533* .049425947 .012
CMLT .258632908* .049425947 .000
UNILEVER .177203037* .049425947 .007
FML .174594755* .049425947 .009
GGBL .343856381* .049425947 .000
UNILEVER
ALUWORKS -.007808504 .049425947 1.000
CMLT .081429870 .049425947 .570
PZC -.177203037* .049425947 .007
FML -.002608283 .049425947 1.000
GGBL .166653343* .049425947 .014
FML
ALUWORKS -.005200222 .049425947 1.000
CMLT .084038153 .049425947 .536
PZC -.174594755* .049425947 .009
UNILEVER .002608283 .049425947 1.000
GGBL .169261626* .049425947 .012
GGBL
ALUWORKS -.174461848* .049425947 .009
CMLT -.085223473 .049425947 .520
PZC -.343856381* .049425947 .000
UNILEVER -.166653343* .049425947 .014
FML -.169261626* .049425947 .012
*. The mean difference is significant at the 0.05 level.
© University of Cape Coast https://erl.ucc.edu.gh/jspui
Digitized by Sam Jonah Library
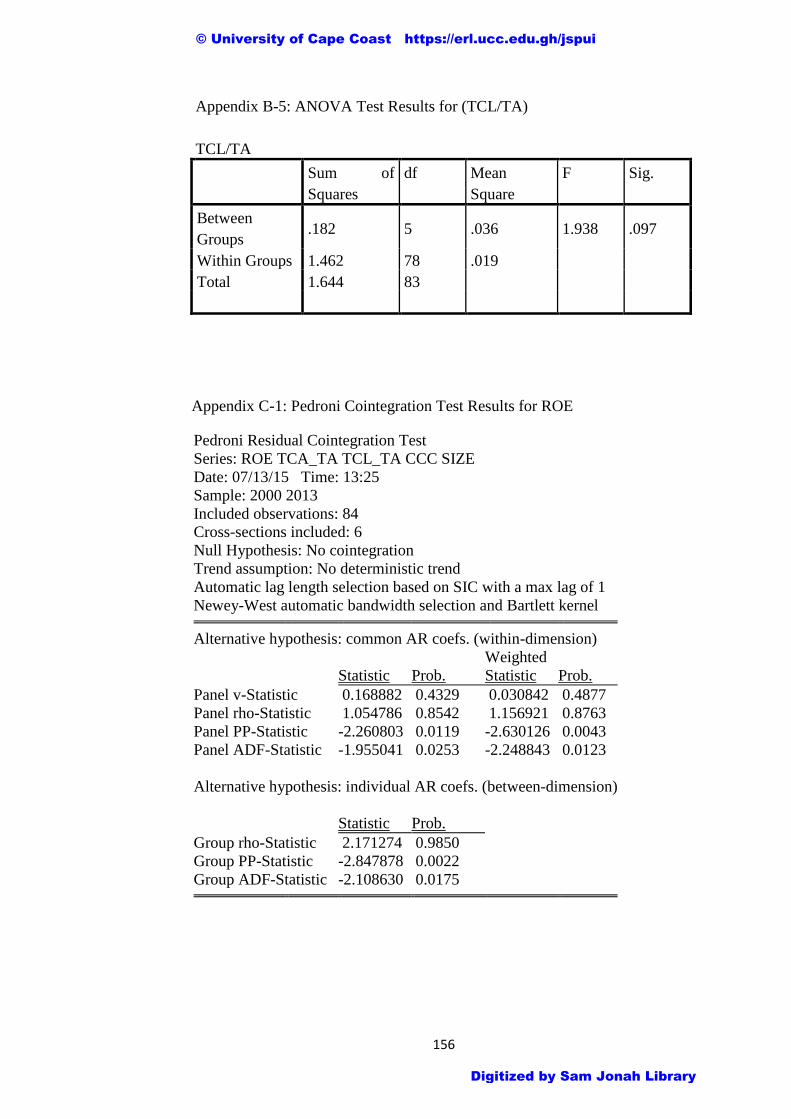
156
Appendix B-5: ANOVA Test Results for (TCL/TA)
TCL/TA
Sum of
Squares
df Mean
Square
F Sig.
Between
Groups .182 5 .036 1.938 .097
Within Groups 1.462 78 .019
Total 1.644 83
Appendix C-1: Pedroni Cointegration Test Results for ROE
Pedroni Residual Cointegration Test
Series: ROE TCA_TA TCL_TA CCC SIZE
Date: 07/13/15 Time: 13:25
Sample: 2000 2013
Included observations: 84
Cross-sections included: 6
Null Hypothesis: No cointegration
Trend assumption: No deterministic trend
Automatic lag length selection based on SIC with a max lag of 1
Newey-West automatic bandwidth selection and Bartlett kernel
Alternative hypothesis: common AR coefs. (within-dimension)
Weighted
Statistic Prob. Statistic Prob.
Panel v-Statistic 0.168882 0.4329 0.030842 0.4877
Panel rho-Statistic 1.054786 0.8542 1.156921 0.8763
Panel PP-Statistic -2.260803 0.0119 -2.630126 0.0043
Panel ADF-Statistic -1.955041 0.0253 -2.248843 0.0123
Alternative hypothesis: individual AR coefs. (between-dimension)
Statistic Prob.
Group rho-Statistic 2.171274 0.9850
Group PP-Statistic -2.847878 0.0022
Group ADF-Statistic -2.108630 0.0175
© University of Cape Coast https://erl.ucc.edu.gh/jspui
Digitized by Sam Jonah Library

157
Appendix C-2: Pedroni Cointegration Test Results for MBR
Pedroni Residual Cointegration Test
Series: LnMBR TCA_TA TCL_TA CCC
SIZE
Date: 07/13/15 Time: 13:04
Sample: 2000 2013
Included observations: 84
Cross-sections included: 6
Null Hypothesis: No cointegration
Trend assumption: No deterministic trend
Automatic lag length selection based on SIC with a max lag of 1
Newey-West automatic bandwidth selection and Bartlett kernel
Alternative hypothesis: common AR coefs. (within-dimension)
Weighted
Statistic Prob. Statistic Prob.
Panel v-Statistic -0.423827 0.6642 -1.611532 0.9465
Panel rho-Statistic 0.957845 0.8309 1.788800 0.9632
Panel PP-Statistic -6.832306 0.0000 -5.522196 0.0000
Panel ADF-Statistic -6.651023 0.0000 -6.066650 0.0000
Alternative hypothesis: individual AR coefs. (between-dimension)
Statistic Prob.
Group rho-Statistic 2.076588 0.9811
Group PP-Statistic -8.341565 0.0000
Group ADF-Statistic -6.643465 0.0000
Appendix C-3: Pedroni Cointegration Test Results for Tobin’s Q
Pedroni Residual Cointegration Test
Series: LnTOBINQ TCA_TA TCL_TA CCC SIZE
Date: 07/13/15 Time: 13:08
Sample: 2000 2013
Included observations: 84
Cross-sections included: 6
Null Hypothesis: No cointegration
Trend assumption: No deterministic trend
Automatic lag length selection based on SIC with a max lag of 1
Newey-West automatic bandwidth selection and Bartlett kernel
Alternative hypothesis: common AR coefs. (within-dimension)
Weighted
Statistic Prob. Statistic Prob.
Panel v-Statistic -1.395492 0.9186 -1.781976 0.9626
Panel rho-Statistic 1.318197 0.9063 1.699035 0.9553
Panel PP-Statistic -8.134130 0.0000 -6.548956 0.0000
© University of Cape Coast https://erl.ucc.edu.gh/jspui
Digitized by Sam Jonah Library
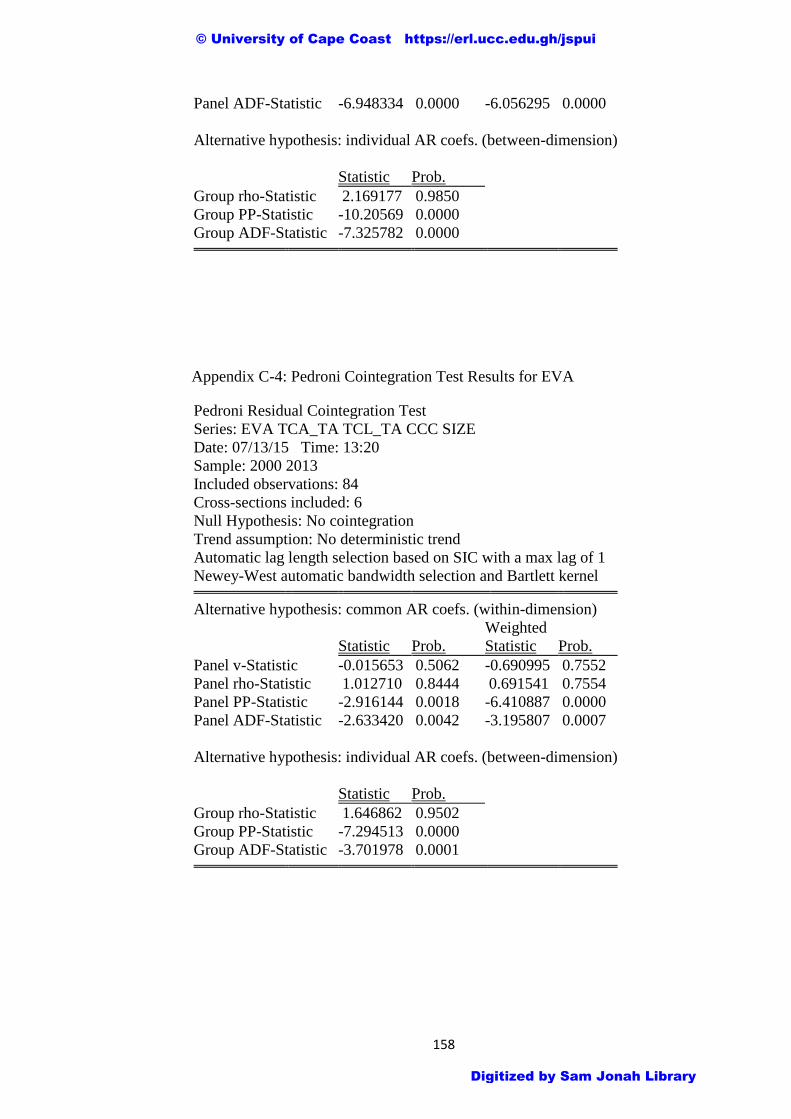
158
Panel ADF-Statistic -6.948334 0.0000 -6.056295 0.0000
Alternative hypothesis: individual AR coefs. (between-dimension)
Statistic Prob.
Group rho-Statistic 2.169177 0.9850
Group PP-Statistic -10.20569 0.0000
Group ADF-Statistic -7.325782 0.0000
Appendix C-4: Pedroni Cointegration Test Results for EVA
Pedroni Residual Cointegration Test
Series: EVA TCA_TA TCL_TA CCC SIZE
Date: 07/13/15 Time: 13:20
Sample: 2000 2013
Included observations: 84
Cross-sections included: 6
Null Hypothesis: No cointegration
Trend assumption: No deterministic trend
Automatic lag length selection based on SIC with a max lag of 1
Newey-West automatic bandwidth selection and Bartlett kernel
Alternative hypothesis: common AR coefs. (within-dimension)
Weighted
Statistic Prob. Statistic Prob.
Panel v-Statistic -0.015653 0.5062 -0.690995 0.7552
Panel rho-Statistic 1.012710 0.8444 0.691541 0.7554
Panel PP-Statistic -2.916144 0.0018 -6.410887 0.0000
Panel ADF-Statistic -2.633420 0.0042 -3.195807 0.0007
Alternative hypothesis: individual AR coefs. (between-dimension)
Statistic Prob.
Group rho-Statistic 1.646862 0.9502
Group PP-Statistic -7.294513 0.0000
Group ADF-Statistic -3.701978 0.0001
© University of Cape Coast https://erl.ucc.edu.gh/jspui
Digitized by Sam Jonah Library

159
Appendix D-1: Grouped FMOLS Results for ROE without dummy
Dependent Variable: ROE
Method: Panel Fully Modified Least Squares (FMOLS)
Date: 07/14/15 Time: 17:51
Sample (adjusted): 2001 2013
Periods included: 13
Cross-sections included: 6
Total panel (balanced) observations: 78
Panel method: Grouped estimation
Cointegrating equation deterministics: C
Long-run covariance estimates (Bartlett kernel, Newey-West
automatic bandwidth, NW automatic lag length)
Variable Coefficient Std. Error t-Statistic Prob.
TCA_TA 0.279695 0.208456 1.341749 0.1841
TCL_TA 0.138864 0.156548 0.887041 0.3782
CCC 0.000165 0.000508 0.324764 0.7464
SIZE -0.020856 0.053372 -0.390771 0.6972
Appendix D-2: Grouped FMOLS Results for ROE with dummy
Dependent Variable: ROE
Method: Panel Fully Modified Least Squares (FMOLS)
Date: 07/14/15 Time: 17:54
Sample (adjusted): 2001 2013
Periods included: 13
Cross-sections included: 6
Total panel (balanced) observations: 78
Panel method: Grouped estimation
Cointegrating equation deterministics: C
Long-run covariance estimates (Bartlett kernel, Newey-West
automatic bandwidth, NW automatic lag length)
Variable Coefficient Std. Error t-Statistic Prob.
TCA_TA 0.149738 0.188675 0.793626 0.4302
TCL_TA -0.047707 0.176906 -0.269673 0.7882
CCC 0.000202 0.000460 0.439718 0.6616
SIZE 0.039670 0.050989 0.778005 0.4393
D1 -0.098629 0.048810 -2.020675 0.0473
© University of Cape Coast https://erl.ucc.edu.gh/jspui
Digitized by Sam Jonah Library

160
Appendix D-3: Grouped FMOLS Results for MBR without dummy
Dependent Variable: LnMBR
Method: Panel Fully Modified Least Squares (FMOLS)
Date: 07/14/15 Time: 16:46
Sample (adjusted): 2001 2013
Periods included: 13
Cross-sections included: 6
Total panel (balanced) observations: 78
Panel method: Grouped estimation
Cointegrating equation deterministics: C
Long-run covariance estimates (Bartlett kernel, Newey-West
automatic bandwidth, NW automatic lag length)
Variable Coefficient Std. Error t-Statistic Prob.
TCA_TA -2.136044 0.349244 -6.116191 0.0000
TCL_TA 0.497807 0.291702 1.706560 0.0925
CCC 0.003652 0.000858 4.254807 0.0001
SIZE 0.669190 0.090343 7.407248 0.0000
Appendix D-4: Grouped FMOLS Results for MBR with dummy
Dependent Variable: LnMBR
Method: Panel Fully Modified Least Squares (FMOLS)
Date: 07/14/15 Time: 17:02
Sample (adjusted): 2001 2013
Periods included: 13
Cross-sections included: 6
Total panel (balanced) observations: 78
Panel method: Grouped estimation
Cointegrating equation deterministics: C
Long-run covariance estimates (Bartlett kernel, Newey-West
automatic bandwidth, NW automatic lag length)
Variable Coefficient Std. Error t-Statistic Prob.
TCA_TA -1.752387 0.313802 -5.584365 0.0000
TCL_TA 1.017438 0.313996 3.240289 0.0019
CCC 0.003561 0.000779 4.571907 0.0000
SIZE 0.514068 0.082528 6.228972 0.0000
D1 0.339456 0.076863 4.416361 0.0000
© University of Cape Coast https://erl.ucc.edu.gh/jspui
Digitized by Sam Jonah Library

161
Appendix D-5: Grouped FMOLS Results for Tobin’s Q without dummy
Dependent Variable: LnTOBINQ
Method: Panel Fully Modified Least Squares (FMOLS)
Date: 07/14/15 Time: 16:50
Sample (adjusted): 2001 2013
Periods included: 13
Cross-sections included: 6
Total panel (balanced) observations: 78
Panel method: Grouped estimation
Cointegrating equation deterministics: C
Long-run covariance estimates (Bartlett kernel, Newey-West
automatic bandwidth, NW automatic lag length)
Variable Coefficient Std. Error t-Statistic Prob.
TCA_TA -1.025982 0.232666 -4.409668 0.0000
TCL_TA -0.145067 0.176636 -0.821278 0.4144
CCC 0.002350 0.000579 4.057843 0.0001
SIZE 0.444262 0.061722 7.197836 0.0000
Appendix D-6: Grouped FMOLS Results for Tobin’s Q with dummy
Dependent Variable: LnTOBINQ
Method: Panel Fully Modified Least Squares (FMOLS)
Date: 07/14/15 Time: 17:04
Sample (adjusted): 2001 2013
Periods included: 13
Cross-sections included: 6
Total panel (balanced) observations: 78
Panel method: Grouped estimation
Cointegrating equation deterministics: C
Long-run covariance estimates (Bartlett kernel, Newey-West
automatic bandwidth, NW automatic lag length)
Variable Coefficient Std. Error t-Statistic Prob.
TCA_TA -0.867121 0.214079 -4.050478 0.0001
TCL_TA 0.177752 0.203115 0.875130 0.3846
CCC 0.002501 0.000528 4.735511 0.0000
SIZE 0.364921 0.059203 6.163898 0.0000
D1 0.094851 0.054815 1.730376 0.0882
© University of Cape Coast https://erl.ucc.edu.gh/jspui
Digitized by Sam Jonah Library

162
Appendix D-7: Grouped FMOLS Results for EVA without dummy
Dependent Variable: EVA
Method: Panel Fully Modified Least Squares (FMOLS)
Date: 07/14/15 Time: 12:37
Sample (adjusted): 2001 2013
Periods included: 13
Cross-sections included: 6
Total panel (balanced) observations: 78
Panel method: Grouped estimation
Cointegrating equation deterministics: C
Long-run covariance estimates (Bartlett kernel, Newey-West
automatic bandwidth, NW automatic lag length)
Variable Coefficient Std. Error t-Statistic Prob.
TCA_TA 0.349225 0.099469 3.510880 0.0008
TCL_TA -0.194023 0.061215 -3.169512 0.0023
CCC -0.058275 0.103817 -0.561327 0.5764
SIZE -0.102796 0.310831 -0.330712 0.7419
Appendix D-8: Grouped FMOLS Results for EVA with dummy
Dependent Variable: EVA
Method: Panel Fully Modified Least Squares (FMOLS)
Date: 07/14/15 Time: 12:40
Sample (adjusted): 2001 2013
Periods included: 13
Cross-sections included: 6
Total panel (balanced) observations: 78
Panel method: Grouped estimation
Cointegrating equation deterministics: C
Long-run covariance estimates (Bartlett kernel, Newey-West
automatic bandwidth, NW automatic lag length)
Variable Coefficient Std. Error t-Statistic Prob.
TCA_TA 0.253376 0.091247 2.776812 0.0071
TCL_TA -0.317284 0.073532 -4.314886 0.0001
CCC -0.048343 0.091244 -0.529818 0.5980
SIZE 0.336980 0.302026 1.115733 0.2685
D1 -0.524464 0.140180 -3.741356 0.0004
© University of Cape Coast https://erl.ucc.edu.gh/jspui
Digitized by Sam Jonah Library

163
Appendix E-1: ARDL/PMG Results for ROE without Leverage
Dependent Variable: D(ROE)
Method: ARDL
Date: 07/14/15 Time: 17:57
Sample: 2001 2013
Included observations: 78
Maximum dependent lags: 1 (Automatic selection)
Model selection method: Schwarz criterion (SIC)
Dynamic regressors (1 lag, automatic): TCA_TA TCL_TA CCC
SIZE
Fixed regressors: C
Number of models evaluated: 1
Selected Model: ARDL(1, 1, 1, 1, 1)
Note: final equation sample is larger than selection sample
Variable Coefficient Std. Error t-Statistic Prob.*
Long Run Equation
TCA_TA 0.228978 0.183139 1.250298 0.2178
TCL_TA 1.279437 0.167628 7.632584 0.0000
CCC 0.004137 0.000737 5.611234 0.0000
SIZE 0.053699 0.026793 2.004237 0.0512
Short Run Equation
COINTEQ01 -0.494359 0.212359 -2.327936 0.0246
D(TCA_TA) 0.332228 0.322631 1.029746 0.3088
D(TCL_TA) -0.619807 0.311442 -1.990118 0.0528
D(CCC) -0.001758 0.000716 -2.455493 0.0181
D(SIZE) 0.313289 0.292660 1.070490 0.2902
C -0.724824 0.307337 -2.358399 0.0229
Mean dependent var 0.008736 S.D. dependent var 0.203881
S.E. of regression 0.135242 Akaike info criterion -1.059618
Sum squared resid 0.804778 Schwarz criterion 0.097914
Log likelihood 84.50396 Hannan-Quinn criter. -0.594300
*Note: p-values and any subsequent tests do not account for model
selection.
© University of Cape Coast https://erl.ucc.edu.gh/jspui
Digitized by Sam Jonah Library

164
Appendix E-2: ARDL/PMG for ROE with Leverage
Dependent Variable: D(ROE)
Method: ARDL
Date: 07/14/15 Time: 18:01
Sample: 2001 2013
Included observations: 78
Maximum dependent lags: 1 (Automatic selection)
Model selection method: Schwarz criterion (SIC)
Dynamic regressors (1 lag, automatic): TCA_TA TCL_TA CCC
SIZE LEV
Fixed regressors: C
Number of models evaluated: 1
Selected Model: ARDL(1, 1, 1, 1, 1, 1)
Note: final equation sample is larger than selection sample
Variable Coefficient Std. Error t-Statistic Prob.*
Long Run Equation
TCA_TA 1.493461 0.030462 49.02635 0.0000
TCL_TA 1.138064 0.012600 90.31937 0.0000
CCC 0.000582 4.74E-05 12.27744 0.0000
SIZE -0.063312 0.001864 -33.96595 0.0000
LEV 0.437486 0.006381 68.56248 0.0000
Short Run Equation
COINTEQ01 -0.508717 0.202627 -2.510606 0.0166
D(TCA_TA) -0.035152 0.249576 -0.140848 0.8888
D(TCL_TA) -0.452629 0.361081 -1.253538 0.2179
D(CCC) 0.002585 0.002288 1.129908 0.2658
D(SIZE) 0.067089 0.400695 0.167432 0.8679
D(LEV) 1.368039 0.867458 1.577066 0.1233
C 0.188238 0.180571 1.042460 0.3040
Mean dependent var 0.008736 S.D. dependent var 0.203881
S.E. of regression 0.115146 Akaike info criterion -2.070971
Sum squared resid 0.490566 Schwarz criterion -0.710871
Log likelihood 133.9808 Hannan-Quinn criter. -1.524223
*Note: p-values and any subsequent tests do not account for model
selection.
© University of Cape Coast https://erl.ucc.edu.gh/jspui
Digitized by Sam Jonah Library
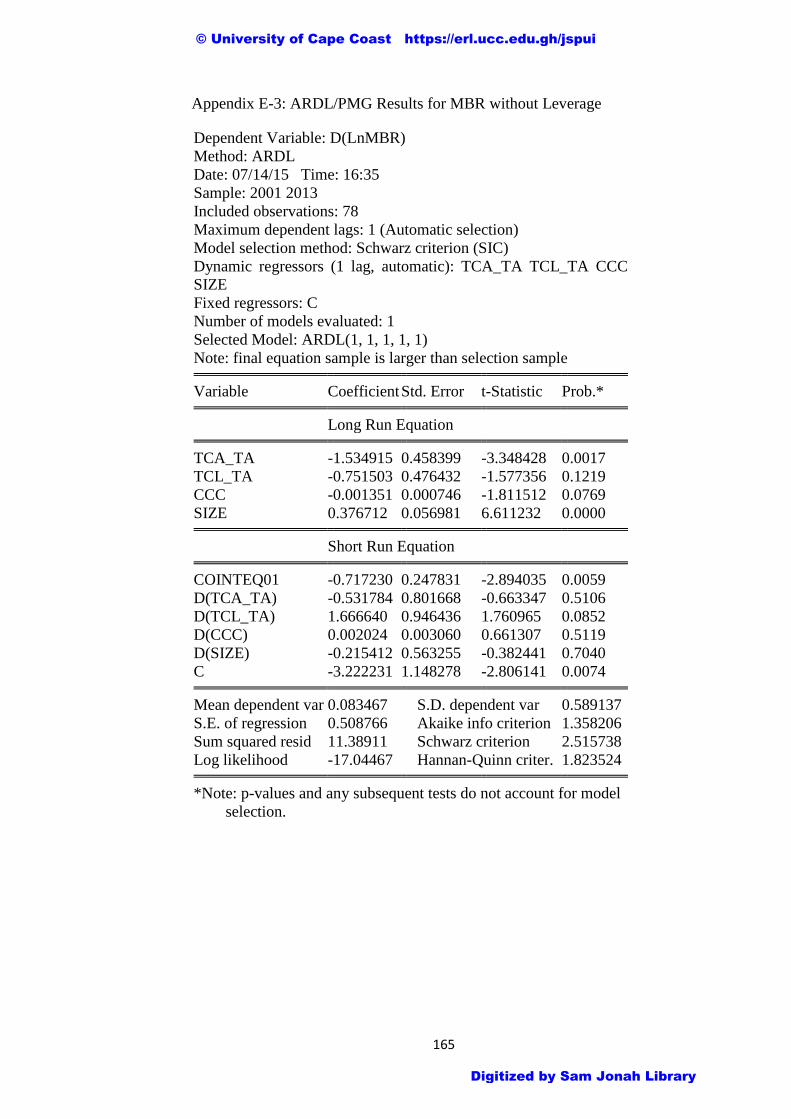
165
Appendix E-3: ARDL/PMG Results for MBR without Leverage
Dependent Variable: D(LnMBR)
Method: ARDL
Date: 07/14/15 Time: 16:35
Sample: 2001 2013
Included observations: 78
Maximum dependent lags: 1 (Automatic selection)
Model selection method: Schwarz criterion (SIC)
Dynamic regressors (1 lag, automatic): TCA_TA TCL_TA CCC
SIZE
Fixed regressors: C
Number of models evaluated: 1
Selected Model: ARDL(1, 1, 1, 1, 1)
Note: final equation sample is larger than selection sample
Variable Coefficient Std. Error t-Statistic Prob.*
Long Run Equation
TCA_TA -1.534915 0.458399 -3.348428 0.0017
TCL_TA -0.751503 0.476432 -1.577356 0.1219
CCC -0.001351 0.000746 -1.811512 0.0769
SIZE 0.376712 0.056981 6.611232 0.0000
Short Run Equation
COINTEQ01 -0.717230 0.247831 -2.894035 0.0059
D(TCA_TA) -0.531784 0.801668 -0.663347 0.5106
D(TCL_TA) 1.666640 0.946436 1.760965 0.0852
D(CCC) 0.002024 0.003060 0.661307 0.5119
D(SIZE) -0.215412 0.563255 -0.382441 0.7040
C -3.222231 1.148278 -2.806141 0.0074
Mean dependent var 0.083467 S.D. dependent var 0.589137
S.E. of regression 0.508766 Akaike info criterion 1.358206
Sum squared resid 11.38911 Schwarz criterion 2.515738
Log likelihood -17.04467 Hannan-Quinn criter. 1.823524
*Note: p-values and any subsequent tests do not account for model
selection.
© University of Cape Coast https://erl.ucc.edu.gh/jspui
Digitized by Sam Jonah Library

166
Appendix E-4: ARDL/PMG Results for MBR with Leverage
Dependent Variable: D(LnMBR)
Method: ARDL
Date: 07/14/15 Time: 16:28
Sample: 2001 2013
Included observations: 78
Maximum dependent lags: 1 (Automatic selection)
Model selection method: Schwarz criterion (SIC)
Dynamic regressors (1 lag, automatic): TCA_TA TCL_TA CCC
SIZE LEV
Fixed regressors: C
Number of models evaluated: 1
Selected Model: ARDL(1, 1, 1, 1, 1, 1)
Note: final equation sample is larger than selection sample
Variable Coefficient Std. Error t-Statistic Prob.*
Long Run Equation
TCA_TA -0.844378 0.433719 -1.946831 0.0592
TCL_TA -1.373038 0.479732 -2.862093 0.0069
CCC -0.001995 0.000690 -2.892302 0.0064
SIZE 0.326990 0.053067 6.161821 0.0000
LEV 0.950533 0.242369 3.921840 0.0004
Short Run Equation
COINTEQ01 -0.662242 0.290681 -2.278240 0.0286
D(TCA_TA) -0.820774 0.909989 -0.901960 0.3729
D(TCL_TA) 1.142202 0.885029 1.290581 0.2049
D(CCC) 0.004241 0.003648 1.162434 0.2525
D(SIZE) -0.157046 0.586974 -0.267551 0.7905
D(LEV) 2.087471 1.959593 1.065257 0.2937
C -2.577450 1.162410 -2.217333 0.0328
Mean dependent var 0.083467 S.D. dependent var 0.589137
S.E. of regression 0.486356 Akaike info criterion 1.258642
Sum squared resid 8.752074 Schwarz criterion 2.618742
Log likelihood -5.862956 Hannan-Quinn criter. 1.805391
*Note: p-values and any subsequent tests do not account for model
selection.
© University of Cape Coast https://erl.ucc.edu.gh/jspui
Digitized by Sam Jonah Library

167
Appendix E-5: ARDL/PMG Results for Tobin’s Q without Leverage
Dependent Variable: D(LnTOBINQ)
Method: ARDL
Date: 07/14/15 Time: 16:41
Sample: 2001 2013
Included observations: 78
Maximum dependent lags: 1 (Automatic selection)
Model selection method: Schwarz criterion (SIC)
Dynamic regressors (1 lag, automatic): TCA_TA TCL_TA CCC
SIZE
Fixed regressors: C
Number of models evaluated: 1
Selected Model: ARDL(1, 1, 1, 1, 1)
Note: final equation sample is larger than selection sample
Variable Coefficient Std. Error t-Statistic Prob.*
Long Run Equation
TCA_TA -0.639987 0.249655 -2.563489 0.0139
TCL_TA -1.338138 0.266017 -5.030272 0.0000
CCC -0.000757 0.000364 -2.078067 0.0436
SIZE 0.240268 0.033241 7.227986 0.0000
Short Run Equation
COINTEQ01 -0.757240 0.262544 -2.884235 0.0061
D(TCA_TA) -0.031689 0.607997 -0.052120 0.9587
D(TCL_TA) 0.790259 0.655057 1.206398 0.2341
D(CCC) 0.001445 0.001937 0.745923 0.4597
D(SIZE) -0.343711 0.389891 -0.881555 0.3828
C -1.975362 0.729462 -2.707971 0.0096
Mean dependent var 0.067549 S.D. dependent var 0.358682
S.E. of regression 0.292813 Akaike info criterion 0.354822
Sum squared resid 3.772547 Schwarz criterion 1.512353
Log likelihood 25.09749 Hannan-Quinn criter. 0.820140
*Note: p-values and any subsequent tests do not account for model
selection.
© University of Cape Coast https://erl.ucc.edu.gh/jspui
Digitized by Sam Jonah Library

168
Appendix E-6: ARDL/PMG Results for Tobin’s Q with Leverage
Dependent Variable: D(LnTOBINQ)
Method: ARDL
Date: 07/14/15 Time: 16:30
Sample: 2001 2013
Included observations: 78
Maximum dependent lags: 1 (Automatic selection)
Model selection method: Schwarz criterion (SIC)
Dynamic regressors (1 lag, automatic): TCA_TA TCL_TA CCC
SIZE LEV
Fixed regressors: C
Number of models evaluated: 1
Selected Model: ARDL(1, 1, 1, 1, 1, 1)
Note: final equation sample is larger than selection sample
Variable Coefficient Std. Error t-Statistic Prob.*
Long Run Equation
TCA_TA 0.067198 0.248415 0.270505 0.7883
TCL_TA -1.890373 0.324291 -5.829257 0.0000
CCC -0.001539 0.000440 -3.500050 0.0012
SIZE 0.151241 0.043610 3.468068 0.0013
LEV -0.095562 0.024345 -3.925344 0.0004
Short Run Equation
COINTEQ01 -0.857753 0.236672 -3.624224 0.0009
D(TCA_TA) -0.734806 0.506658 -1.450298 0.1554
D(TCL_TA) 1.113621 0.637433 1.747039 0.0889
D(CCC) 0.004291 0.002361 1.817424 0.0773
D(SIZE) -0.451638 0.363189 -1.243537 0.2215
D(LEV) 1.500683 1.237075 1.213090 0.2328
C -0.850568 0.307961 -2.761937 0.0089
Mean dependent var 0.067549 S.D. dependent var 0.358682
S.E. of regression 0.296532 Akaike info criterion 0.403018
Sum squared resid 3.253455 Schwarz criterion 1.763118
Log likelihood 30.07323 Hannan-Quinn criter. 0.949767
*Note: p-values and any subsequent tests do not account for model
selection.
© University of Cape Coast https://erl.ucc.edu.gh/jspui
Digitized by Sam Jonah Library

169
Appendix E-7: ARDL/PMG Results for EVA without Leverage
Dependent Variable: D(EVA)
Method: ARDL
Date: 07/14/15 Time: 12:19
Sample: 2001 2013
Included observations: 78
Maximum dependent lags: 1 (Automatic selection)
Model selection method: Schwarz criterion (SIC)
Dynamic regressors (1 lag, automatic): TCA_TA TCL_TA CCC
SIZE
Fixed regressors: C
Number of models evalulated: 1
Selected Model: ARDL(1, 1, 1, 1, 1)
Note: final equation sample is larger than selection sample
Variable Coefficient Std. Error t-Statistic Prob.*
Long Run Equation
TCA_TA 0.491888 0.066851 7.357992 0.0000
TCL_TA -0.252953 0.102508 -2.467640 0.0176
CCC -0.209898 0.061939 -3.388791 0.0015
SIZE -0.877516 0.178746 -4.909290 0.0000
Short Run Equation
COINTEQ01 -0.890098 0.325917 -2.731061 0.0090
D(TCA_TA) 0.096483 0.266747 0.361701 0.7193
D(TCL_TA) 0.202279 0.140578 1.438910 0.1573
D(CCC) 0.001180 0.453181 0.002604 0.9979
D(SIZE) 3.134864 1.297691 2.415726 0.0199
C -0.304784 0.261455 -1.165725 0.2500
Mean dependent var -0.040263 S.D. dependent var 1.128120
S.E. of regression 0.668772 Akaike info criterion 0.741762
Sum squared resid 19.67924 Schwarz criterion 1.899293
Log likelihood 8.846010 Hannan-Quinn criter. 1.207080
*Note: p-values and any subsequent tests do not account for model
selection.
© University of Cape Coast https://erl.ucc.edu.gh/jspui
Digitized by Sam Jonah Library

170
Appendix E-8: ARDL/PMG Results for EVA with Leverage
Dependent Variable: D(EVA)
Method: ARDL
Date: 07/14/15 Time: 12:31
Sample: 2001 2013
Included observations: 78
Maximum dependent lags: 1 (Automatic selection)
Model selection method: Schwarz criterion (SIC)
Dynamic regressors (1 lag, automatic): TCA_TA TCL_TA CCC
SIZE LEV
Fixed regressors: C
Number of models evaluated: 1
Selected Model: ARDL(1, 1, 1, 1, 1, 1)
Note: final equation sample is larger than selection sample
Variable Coefficient Std. Error t-Statistic Prob.*
Long Run Equation
TCA_TA 0.657214 0.111993 5.868348 0.0000
TCL_TA -0.214390 0.119850 -1.788810 0.0818
CCC -0.307287 0.065966 -4.658265 0.0000
SIZE -1.163375 0.185061 -6.286450 0.0000
LEV 0.527958 0.497271 1.061711 0.2952
Short Run Equation
COINTEQ01 -0.832347 0.260238 -3.198405 0.0028
D(TCA_TA) -0.102228 0.235109 -0.434811 0.6662
D(TCL_TA) 0.141610 0.188314 0.751987 0.4568
D(CCC) 0.472451 0.420926 1.122408 0.2689
D(SIZE) 2.509698 0.999040 2.512110 0.0165
D(LEV) 3.608145 2.484252 1.452407 0.1548
C 0.117069 0.355225 0.329563 0.7436
Mean dependent var -0.040263 S.D. dependent var 1.128120
S.E. of regression 0.570113 Akaike info criterion 0.549227
Sum squared resid 12.02608 Schwarz criterion 1.909327
Log likelihood 23.93245 Hannan-Quinn criter. 1.095976
*Note: p-values and any subsequent tests do not account for model
selection.
© University of Cape Coast https://erl.ucc.edu.gh/jspui
Digitized by Sam Jonah Library