Embed Size (px)
Citation preview
Capital management enhances shareholder value
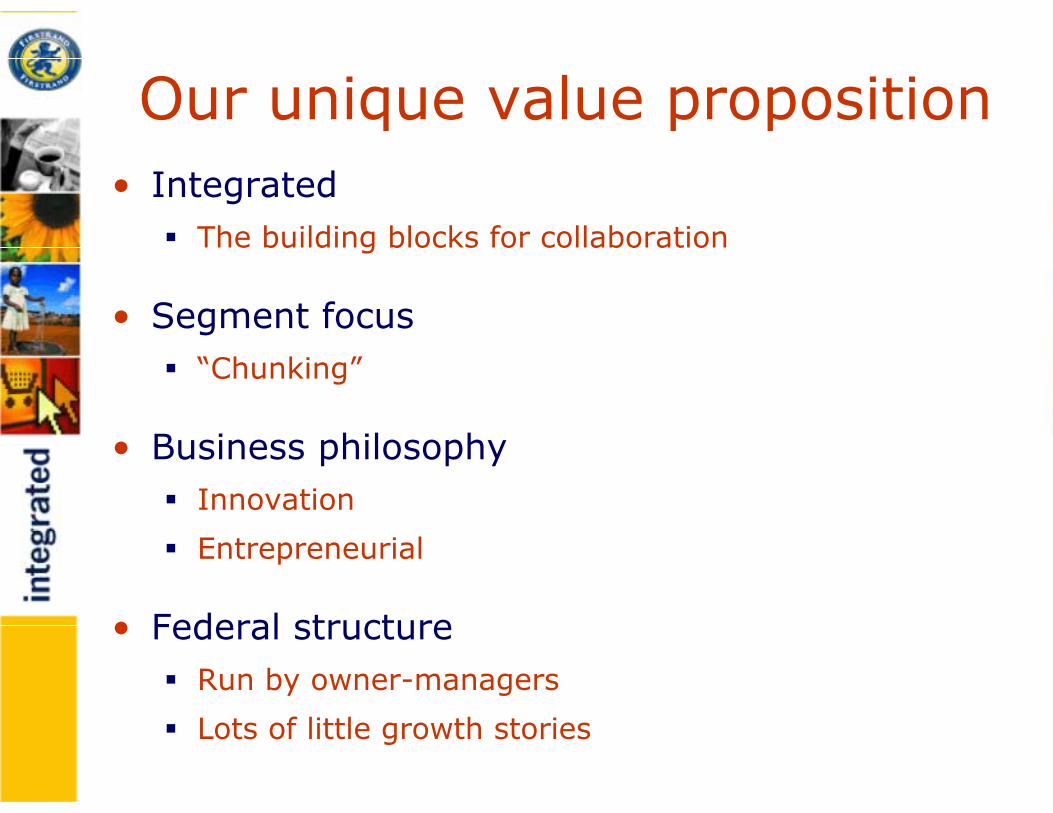
Our unique value proposition• Integrated
The building blocks for collaboration
• Segment focus“Chunking”
• Business philosophyInnovation
Entrepreneurial
• Federal structureRun by owner-managers
Lots of little growth stories
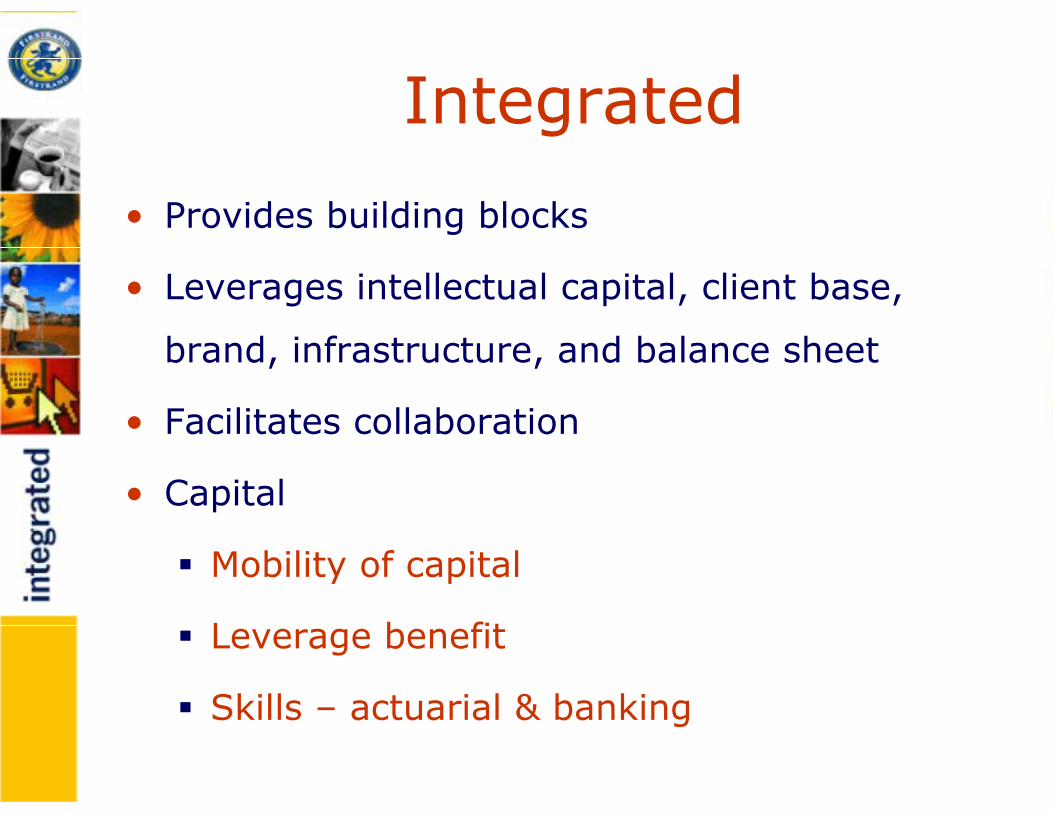
Integrated
• Provides building blocks
• Leverages intellectual capital, client base,
brand, infrastructure, and balance sheet
• Facilitates collaboration
• Capital
Mobility of capital
Leverage benefit
Skills – actuarial & banking
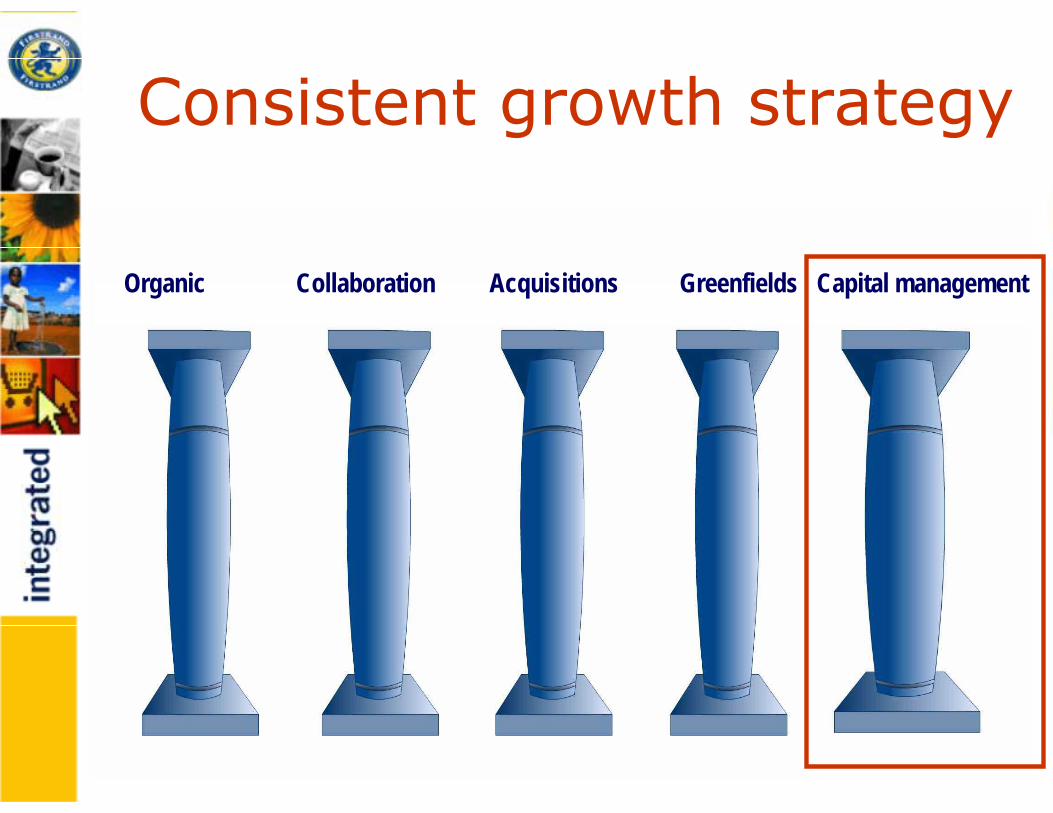
Consistent growth strategy
Organic Collaboration Acquisitions Greenfields Capital management
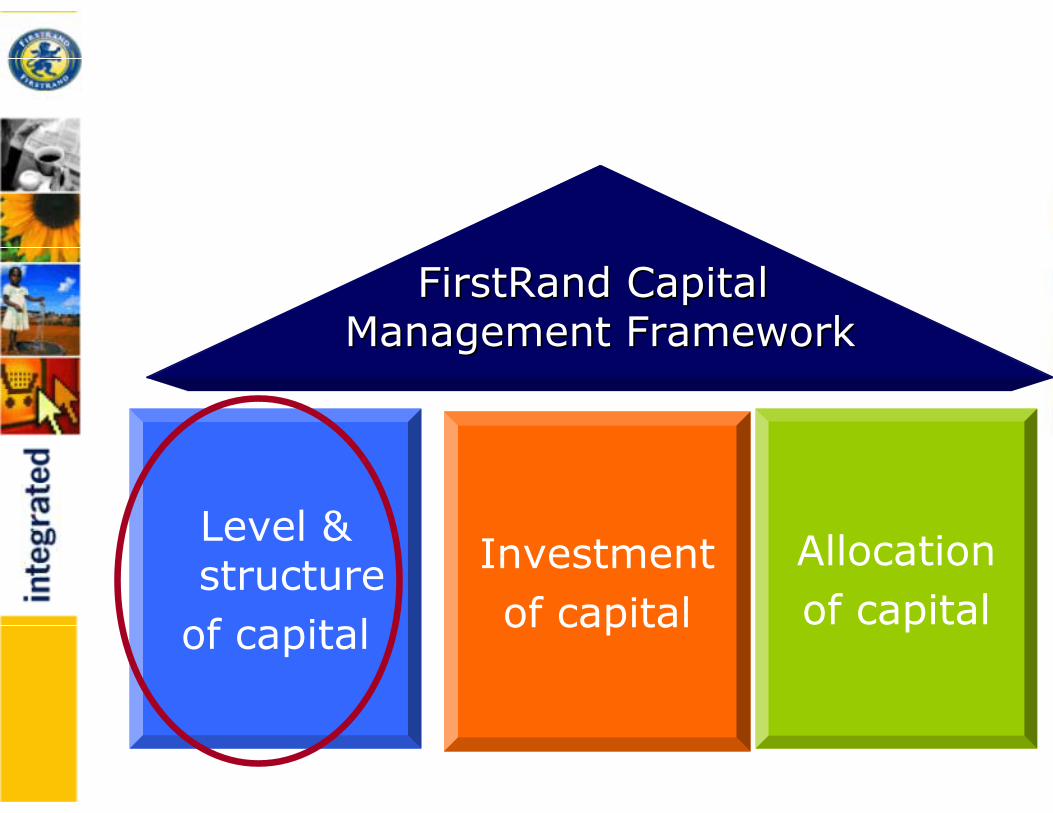
Level & structure
of capital
Investmentof capital
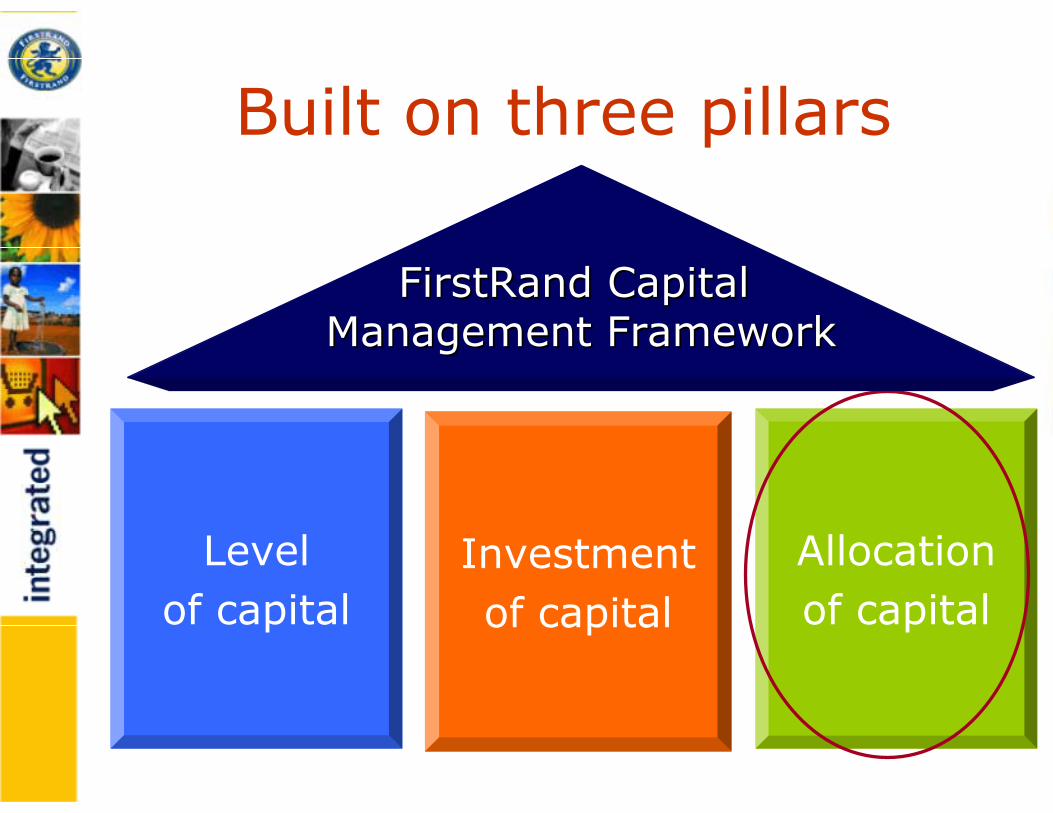
FirstRand Capital FirstRand Capital Management FrameworkManagement Framework
Allocation of capital
What is the optimal level of capital in the Bank?
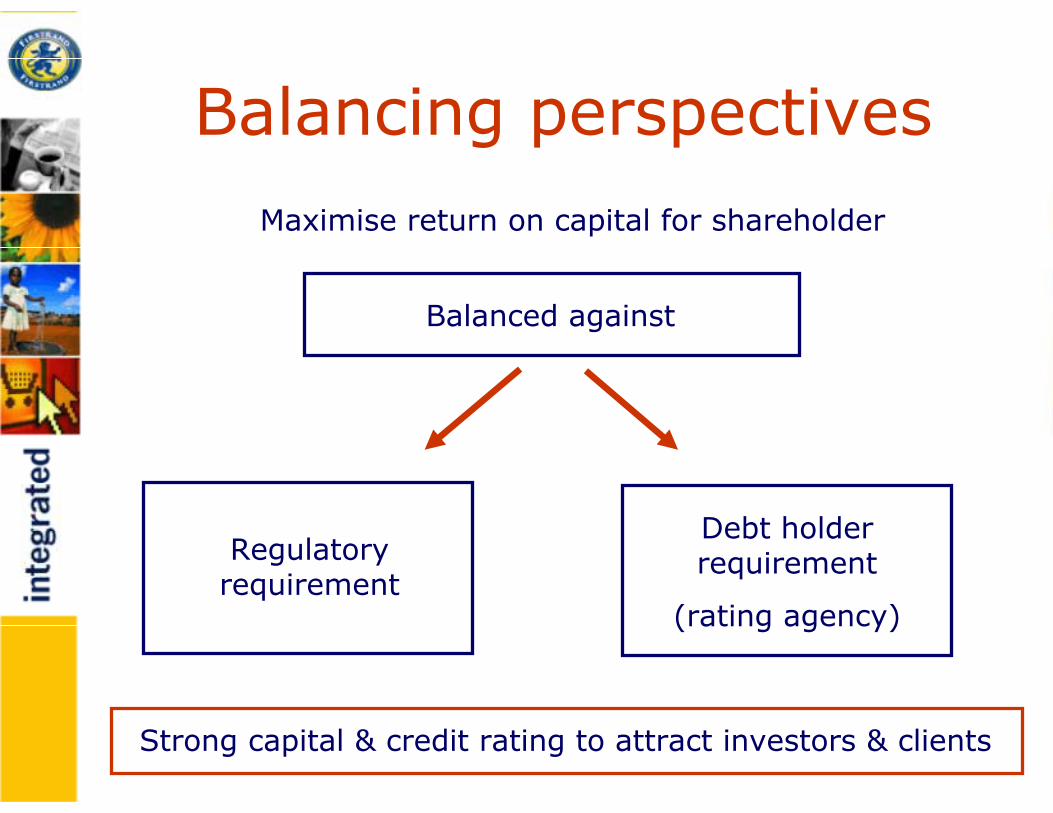
Balancing perspectivesMaximise return on capital for shareholder
Strong capital & credit rating to attract investors & clients
Balanced against
Regulatory requirement
Debt holder requirement
(rating agency)
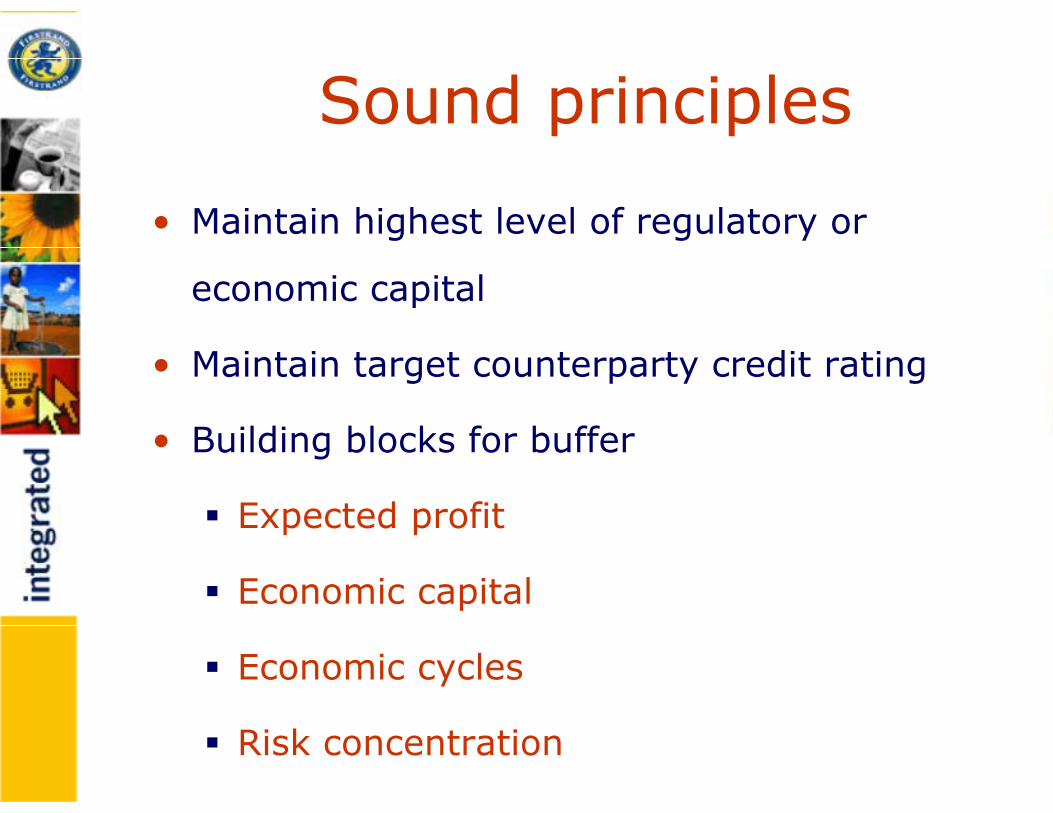
Sound principles
• Maintain highest level of regulatory or
economic capital
• Maintain target counterparty credit rating
• Building blocks for buffer
Expected profit
Economic capital
Economic cycles
Risk concentration
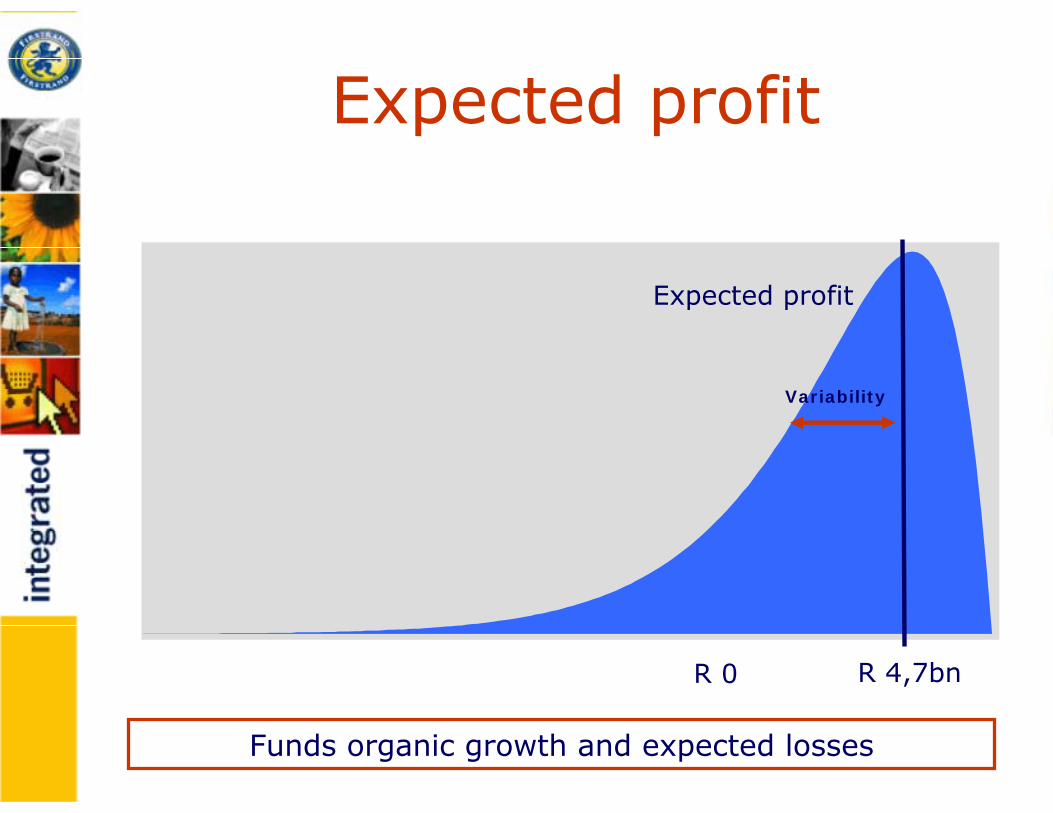
Expected profit
R 4,7bnR 0
Expected profit
Variability
Funds organic growth and expected losses
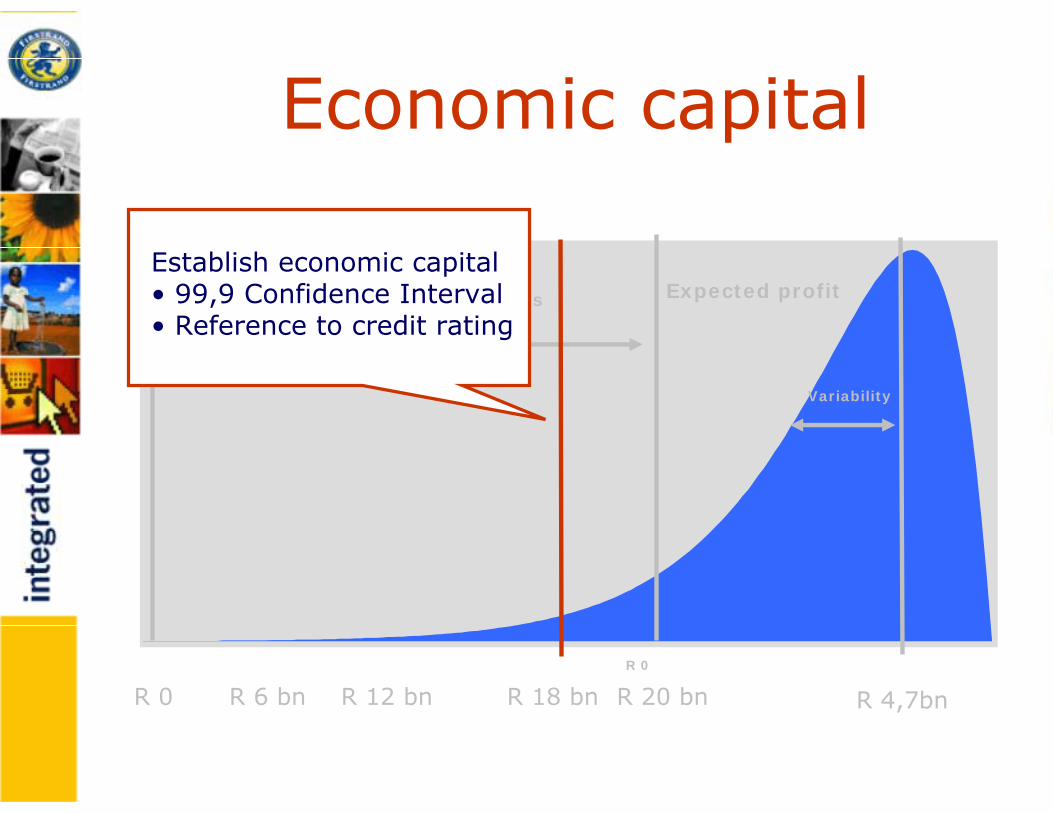
Economic capital
R 4,7bn
R 0
Expected profit
Variability
R 20 bnR 0 R 18 bnR 12 bnR 6 bn
Capital = unexpected losses
Establish economic capital• 99,9 Confidence Interval• Reference to credit rating

Building protection
R 4,7bnR 0
Expected profit
Variability
R 20 bnR 0 R 18 bnR 12 bnR 6 bn
Capital = unexpected losses
Establish buffer over regulatory capital
• Protect against business disruptions
• Volatility of earnings
• AC 133
• Internal capital generation for growth
• Economic downturns
• Interest rate shocks
• Exchange rate volatility
• Risk concentrations
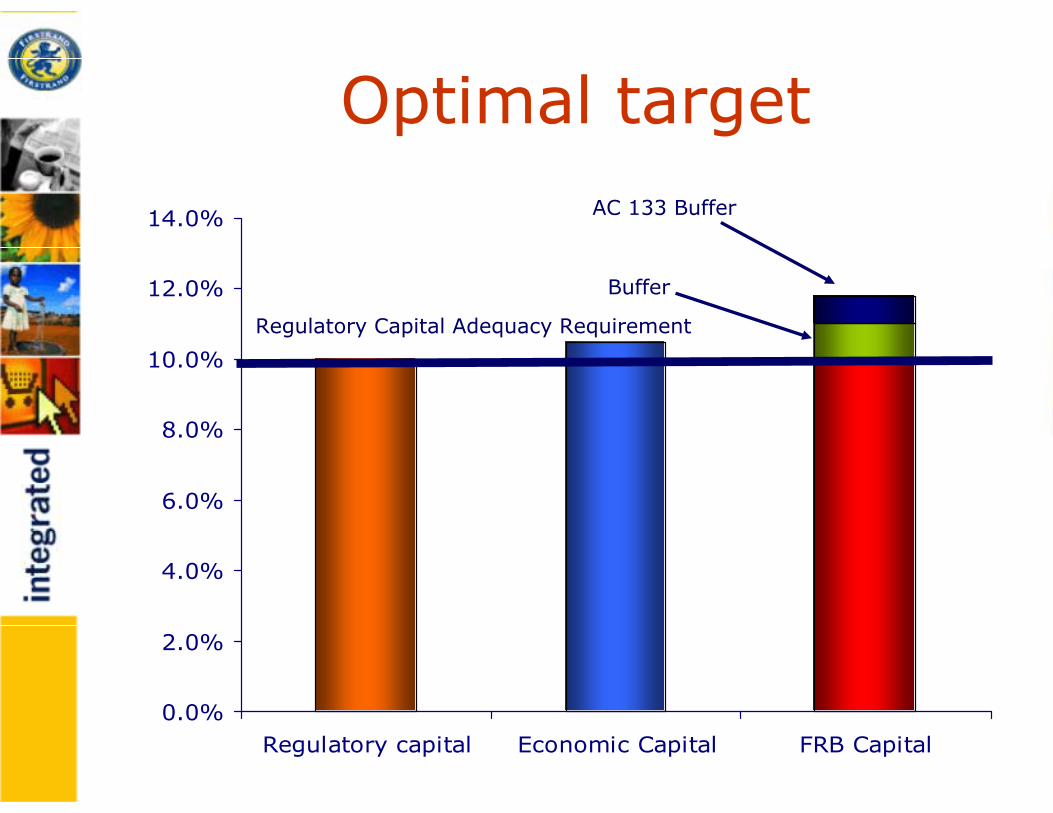
0.0%
2.0%
4.0%
6.0%
8.0%
10.0%
12.0%
14.0%
Regulatory capital Economic Capital FRB Capital
Regulatory Capital Adequacy Requirement
Buffer
AC 133 Buffer
Optimal target
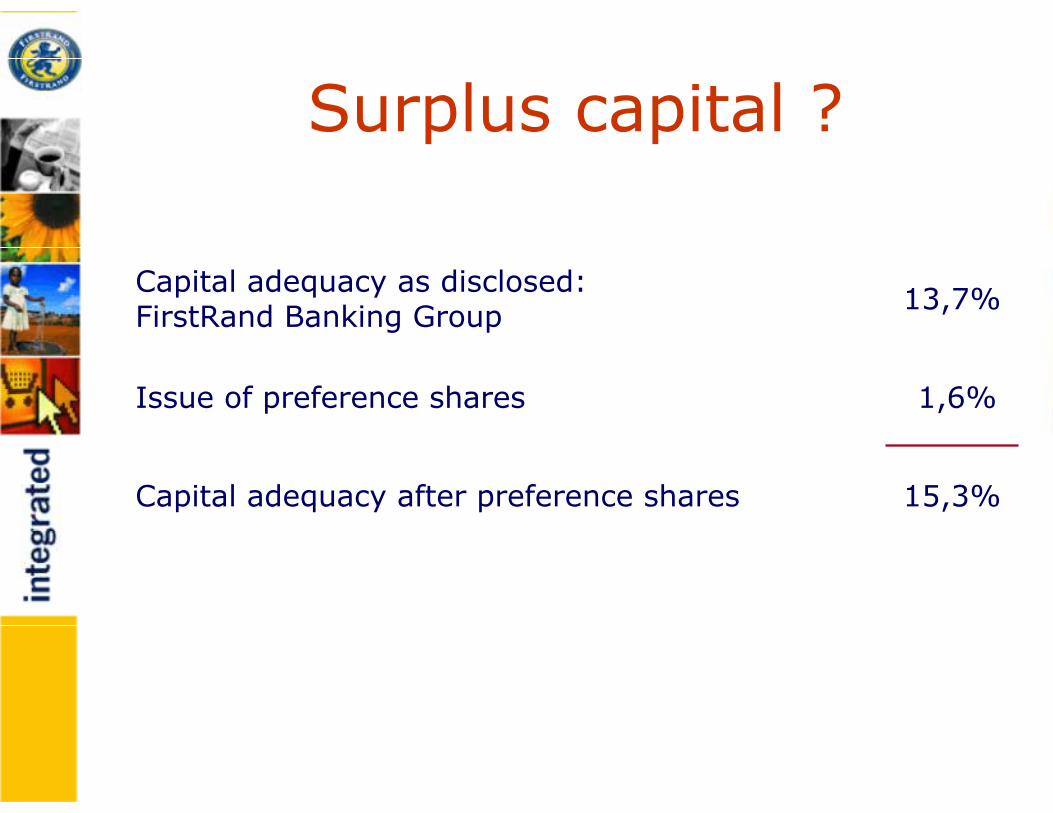
Surplus capital ?
15,3%Capital adequacy after preference shares
1,6%Issue of preference shares
13,7%Capital adequacy as disclosed: FirstRand Banking Group
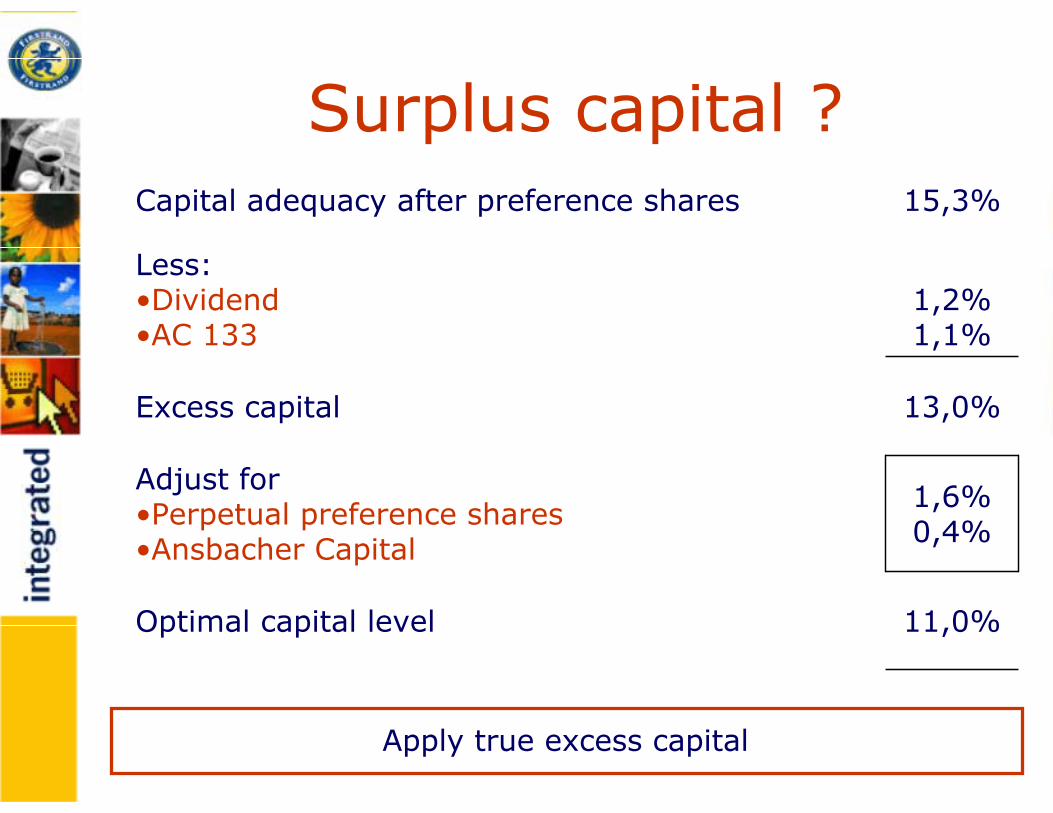
Surplus capital ?
11,0%Optimal capital level
1,6%0,4%
Adjust for•Perpetual preference shares•Ansbacher Capital
13,0%Excess capital
1,2%1,1%
Less:•Dividend•AC 133
15,3%Capital adequacy after preference shares
Apply true excess capital
What is the optimal capital structure for the Bank?
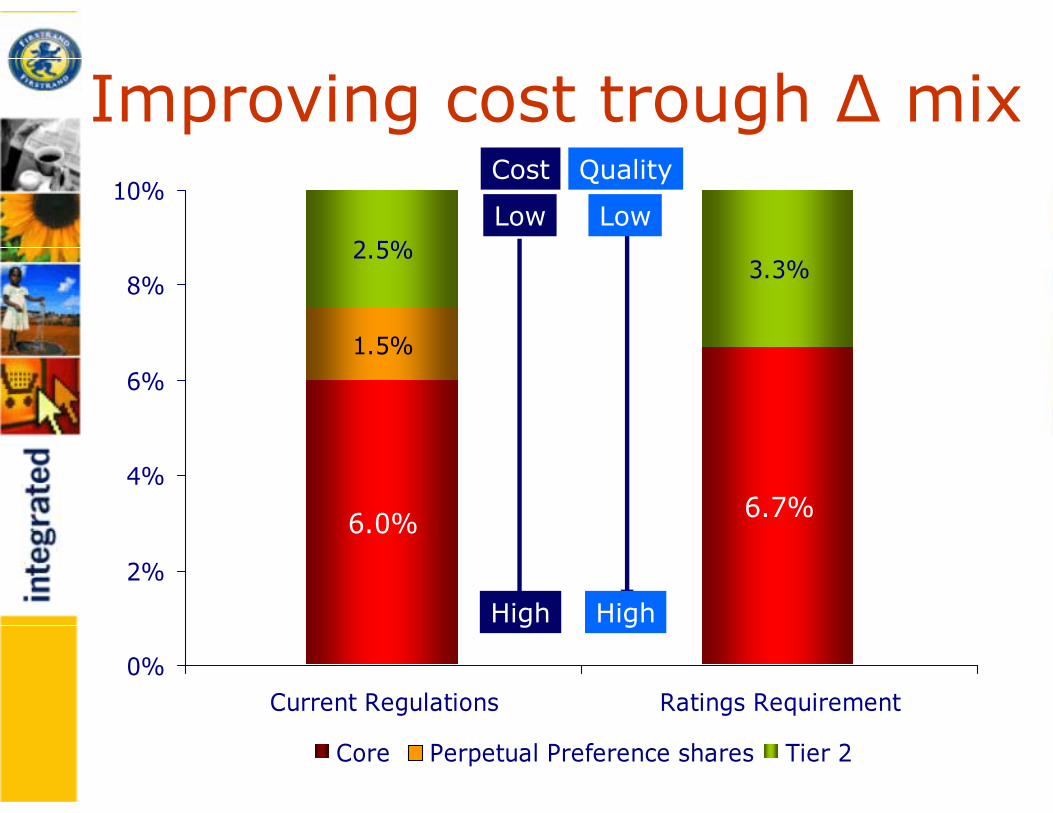
6.7%
3.3%
6.0%
1.5%
2.5%
0%
2%
4%
6%
8%
10%
Current Regulations Ratings Requirement
Core Perpetual Preference shares Tier 2
Improving cost trough ∆ mixQuality
Low
High
Cost
Low
High
• Rank capital instruments in order of cost
i.e. equity vs. subordinated term paper
• Issue capital instruments in order
• Capacity for the lowest cost
Improving cost through ∆ mix
FirstRand raises these instruments on a regular basis
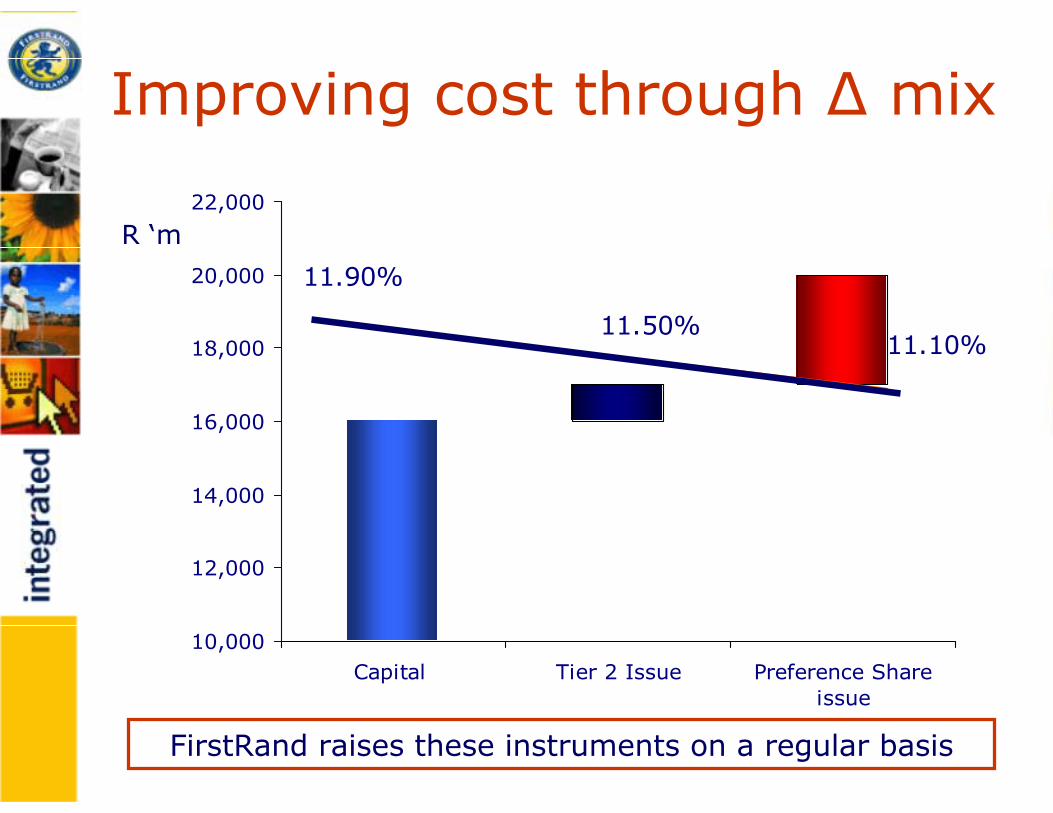
10,000
12,000
14,000
16,000
18,000
20,000
22,000
Capital Tier 2 Issue Preference Shareissue
11.10%
11.90%
11.50%
R ‘m
Improving cost through ∆ mix
FirstRand raises these instruments on a regular basis
What is the optimal level of capital for Momentum?

Balancing perspectivesMaximise return on capital for shareholder
Balanced against
Regulatory requirement
Policy holder requirement

0.50
1.00
1.50
2.00
2.50
Regulatory capital
Regulatory capital
Regulatory capital (1x)
• Do not cover credit risk
Tim
es

0.50
1.00
1.50
2.00
2.50
Regulatory capital
Informal regulatory capital
Informal regulatory capital (1,5x)
• Only 95% Confidence Interval
Tim
es
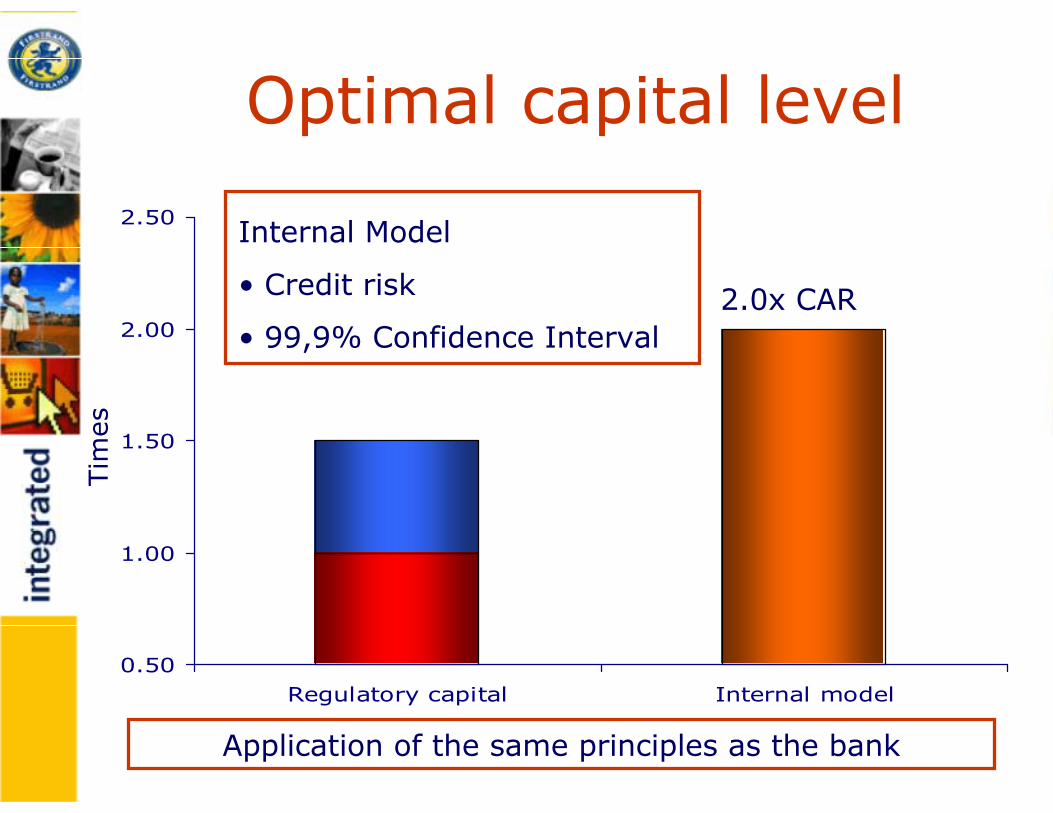
0.50
1.00
1.50
2.00
2.50
Regulatory capital Internal model
Optimal capital level
Internal Model
• Credit risk
• 99,9% Confidence Interval
Tim
es
2.0x CAR
Application of the same principles as the bank

Investmentof capital
Built on three pillars
Level of capital
FirstRand Capital FirstRand Capital Management FrameworkManagement Framework
Allocation of capital
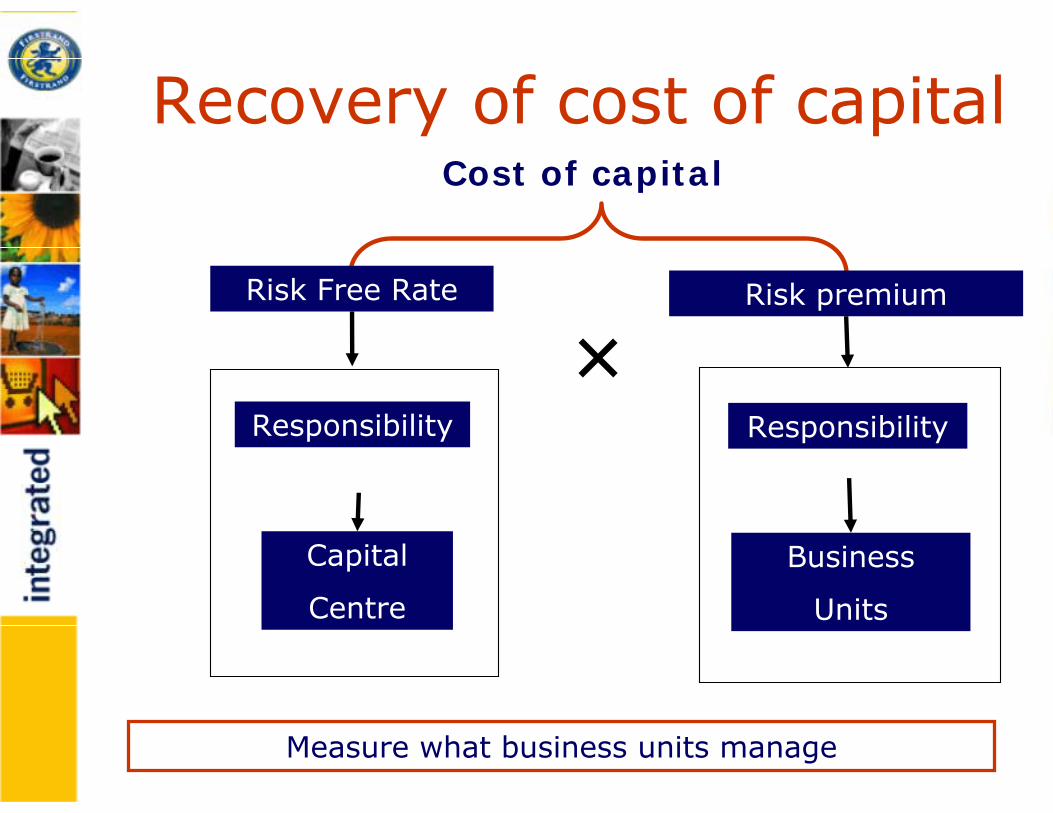
Recovery of cost of capitalCost of capital
Risk premiumRisk Free Rate
Capital
Centre
Business
Units
×Responsibility Responsibility
Measure what business units manage
How do we invest the
capital in the bank?
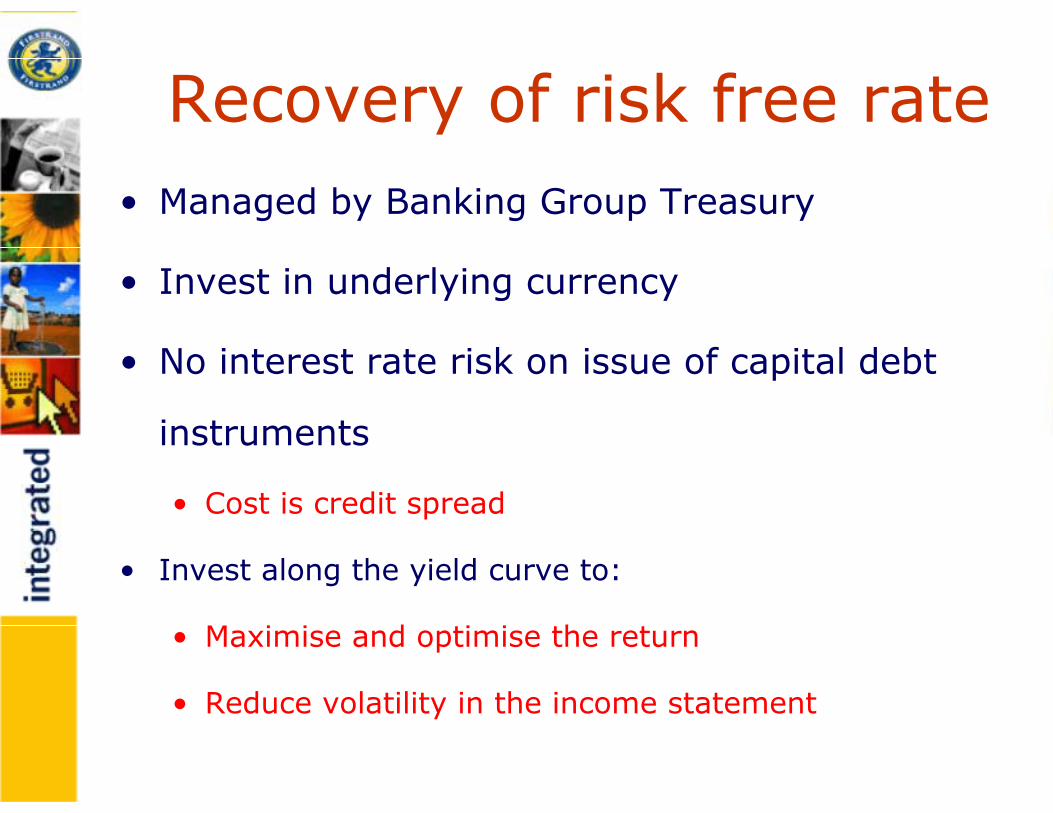
Recovery of risk free rate• Managed by Banking Group Treasury
• Invest in underlying currency
• No interest rate risk on issue of capital debt
instruments
• Cost is credit spread
• Invest along the yield curve to:
• Maximise and optimise the return
• Reduce volatility in the income statement
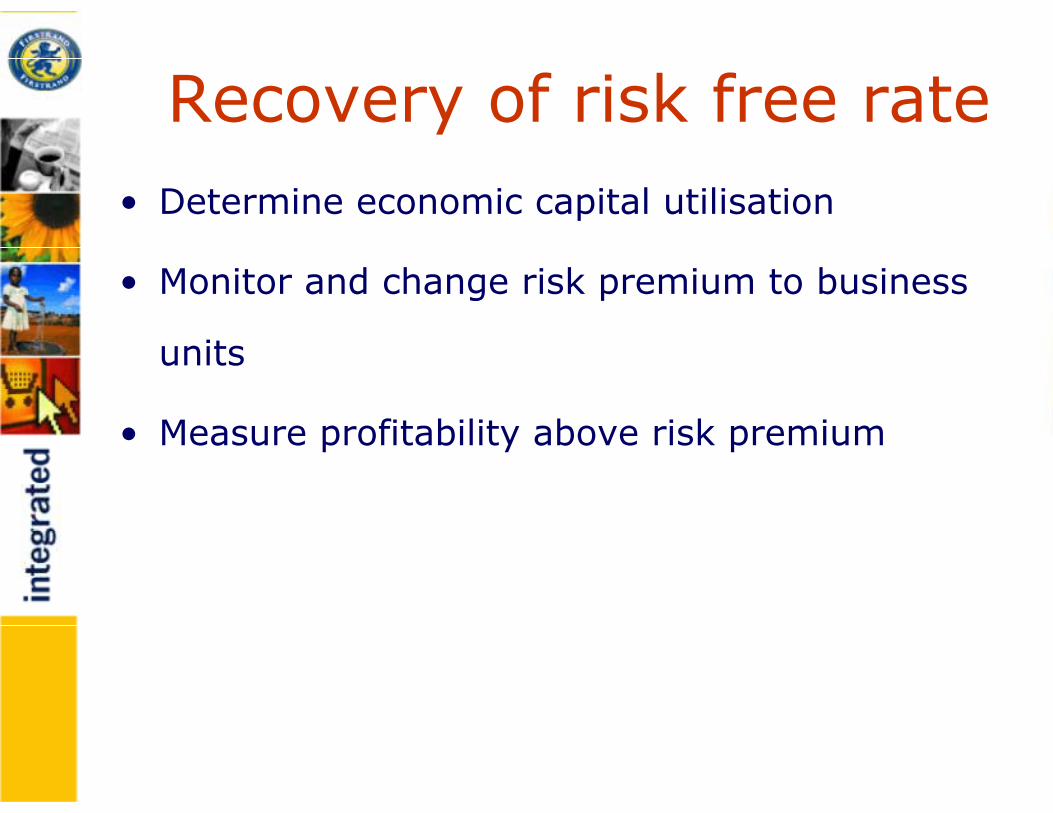
Recovery of risk free rate• Determine economic capital utilisation
• Monitor and change risk premium to business
units
• Measure profitability above risk premium
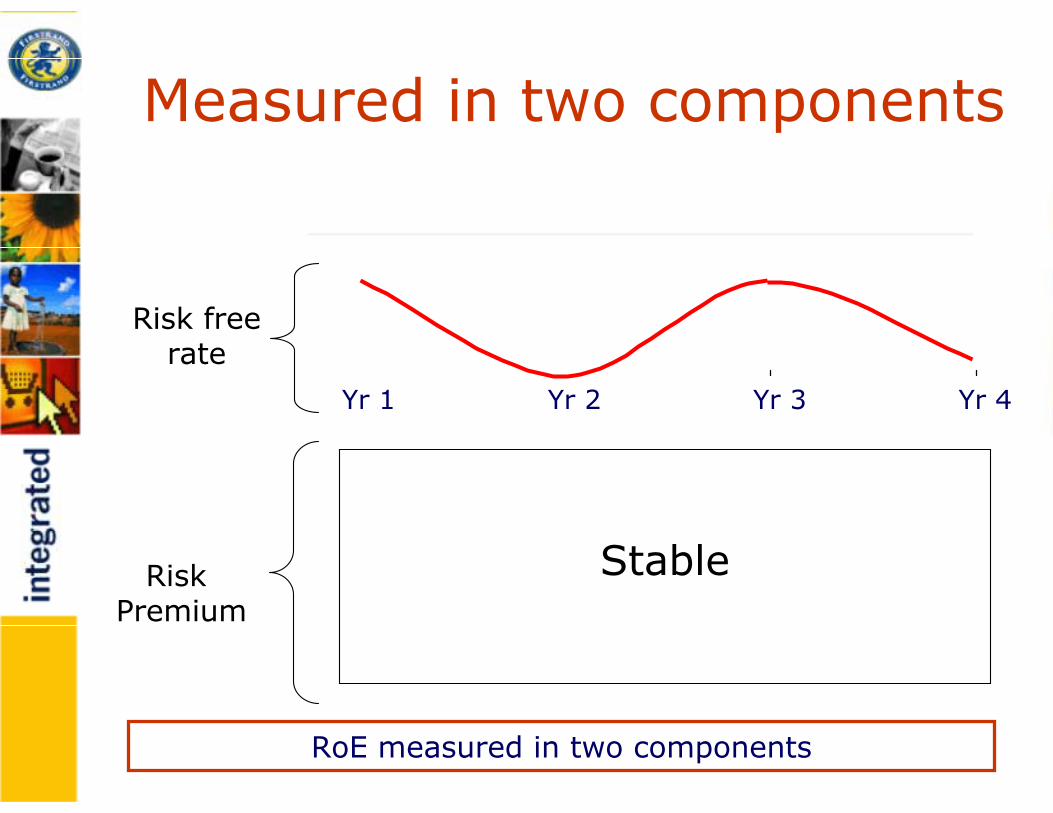
Measured in two components
Yr 1 Yr 2 Yr 3 Yr 4
StableRisk Premium
Risk freerate
RoE measured in two components
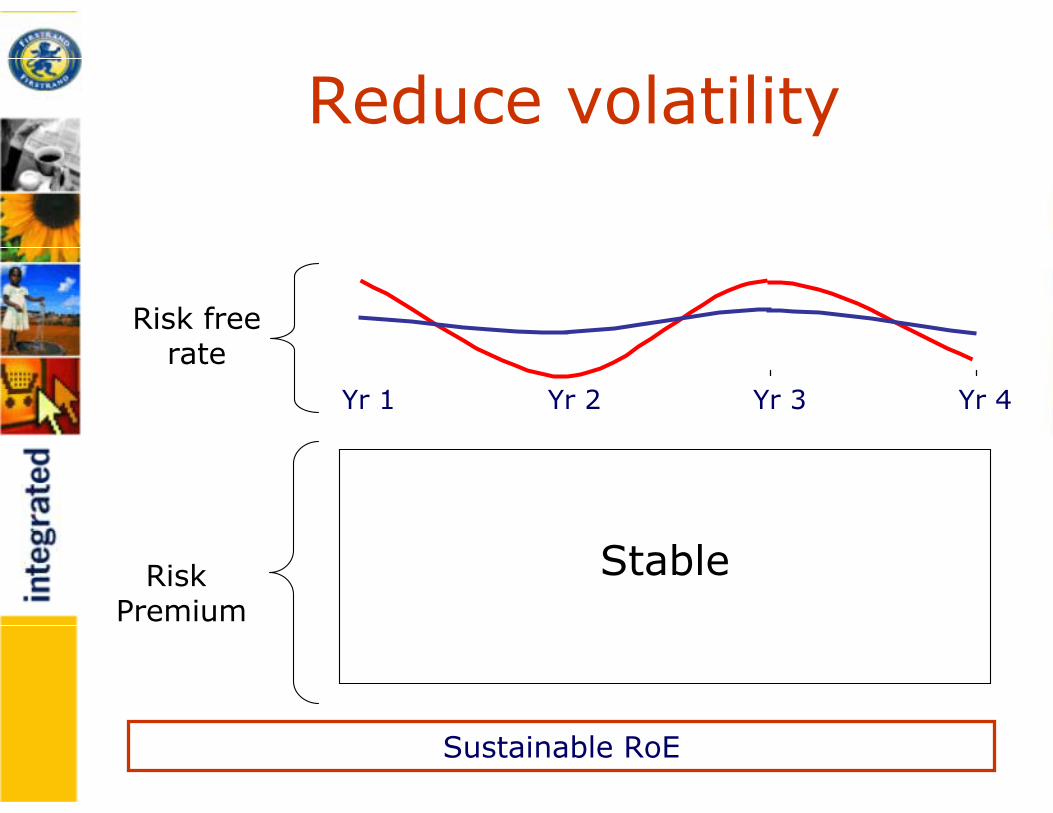
Reduce volatility
Yr 1 Yr 2 Yr 3 Yr 4
Risk freerate
Sustainable RoE
StableRisk Premium
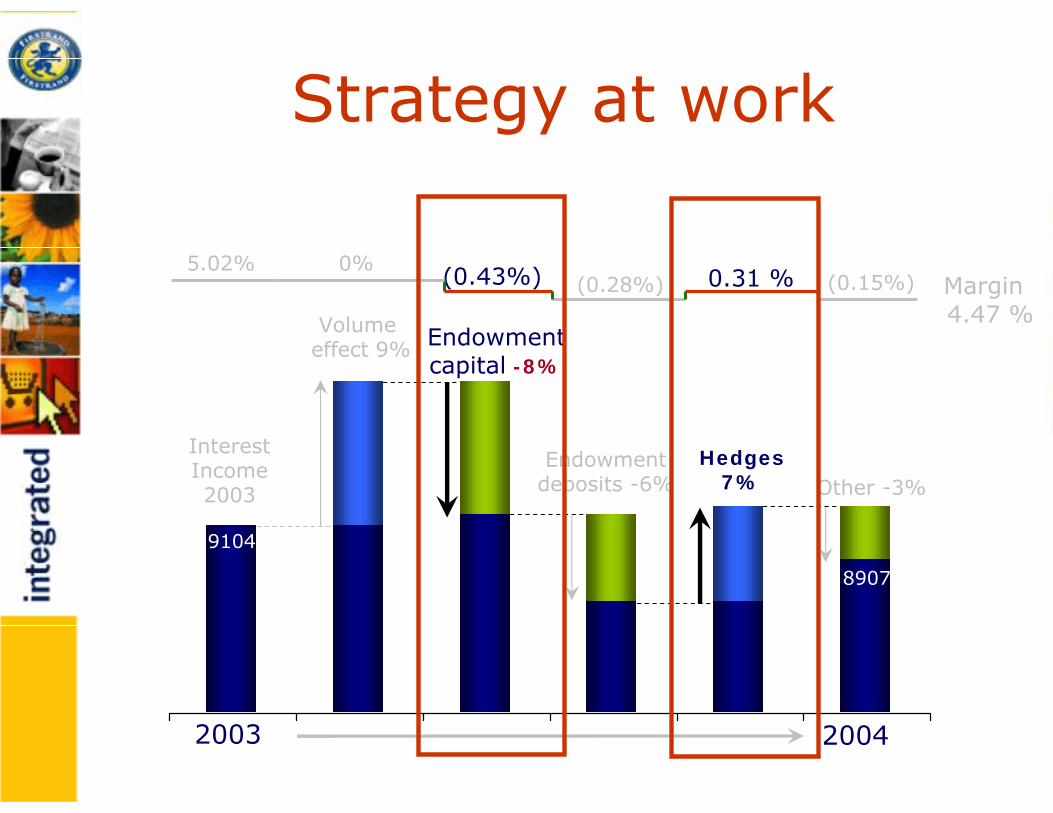
Strategy at work
2003 2004
Interest Income2003
Volumeeffect 9% Endowment
capital -8%
Endowmentdeposits -6%
5.02% 0%(0.43%) (0.28%)
4.47 %Margin
Hedges 7%
0.31 % (0.15%)
Other -3%
9104
8907
How does investment strategy affect level of capital in
Momentum?
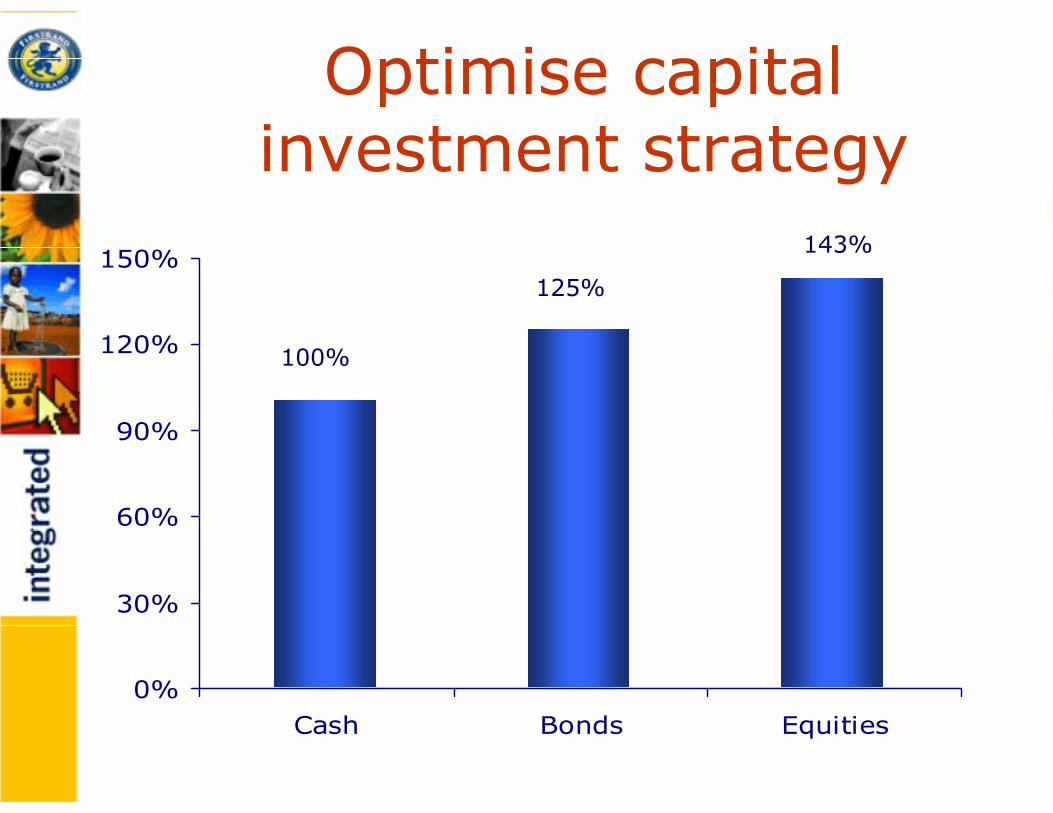
Optimise capital investment strategy
0%
30%
60%
90%
120%
150%
Cash Bonds Equities
100%
125%
143%
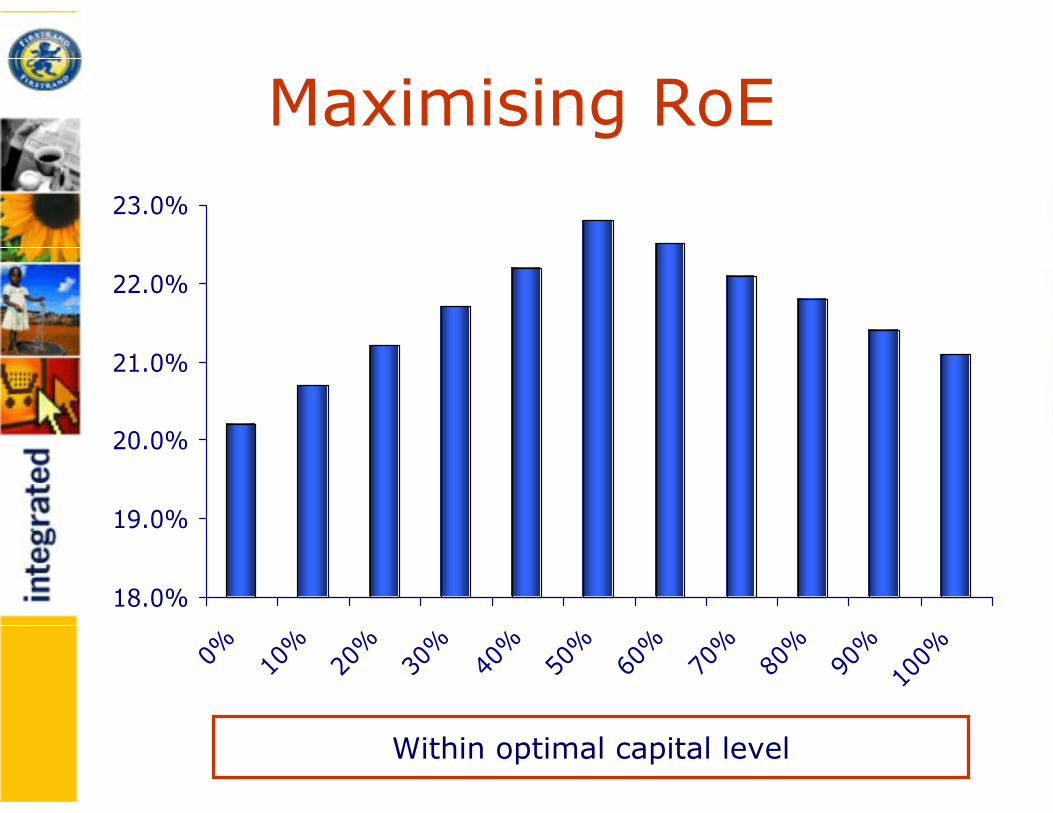
Maximising RoE
Within optimal capital level
18.0%
19.0%
20.0%
21.0%
22.0%
23.0%
0% 10%
20%
30%
40%
50%
60%
70%
80%
90%
100%
Integrated investment approach
• Cash & near cash
Managed by FirstRand Bank (Banking
Group Treasury)
• Actively managed equities
RMB Asset Management
Allocation of capital
Built on three pillars
Level of capital
Investmentof capital
FirstRand Capital FirstRand Capital Management FrameworkManagement Framework

Recovery of cost of capitalCost of capital
Risk premiumRisk Free Rate
Capital
Centre
Business
Units
×Responsibility Responsibility
Measure what business units manage
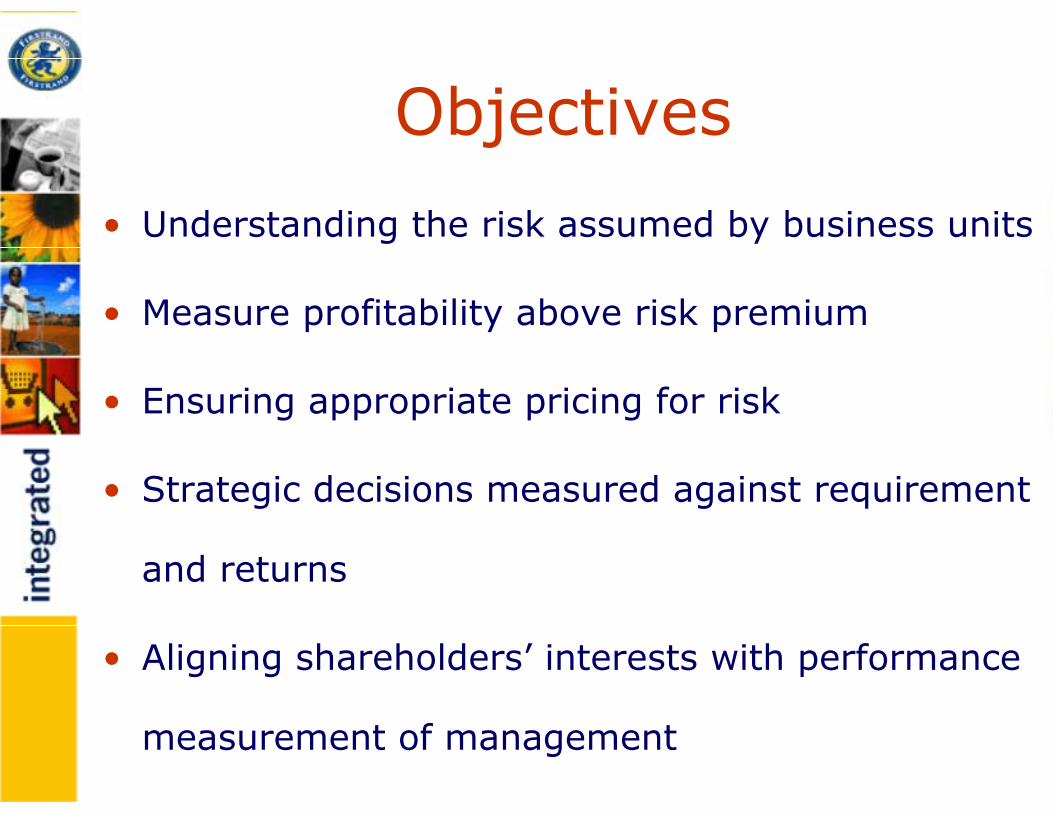
Objectives
• Understanding the risk assumed by business units
• Measure profitability above risk premium
• Ensuring appropriate pricing for risk
• Strategic decisions measured against requirement
and returns
• Aligning shareholders’ interests with performance
measurement of management
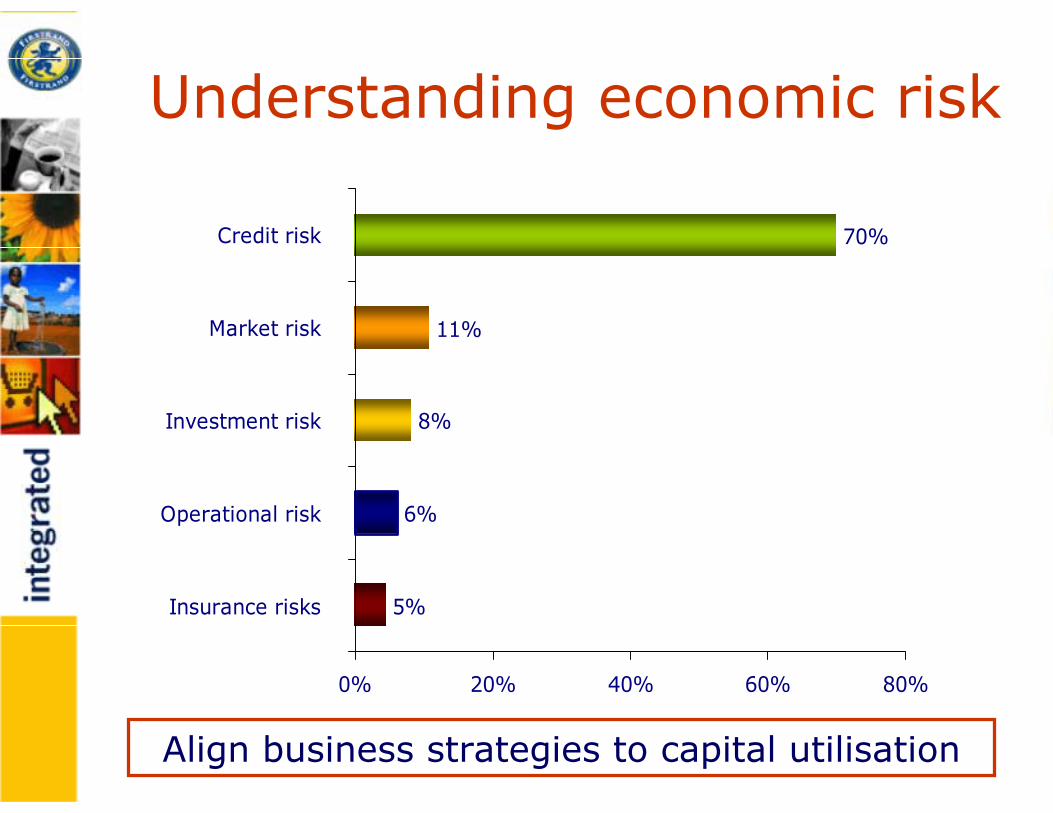
5%
6%
8%
11%
70%
0% 20% 40% 60% 80%
Insurance risks
Operational risk
Investment risk
Market risk
Credit risk
Understanding economic risk
Align business strategies to capital utilisation
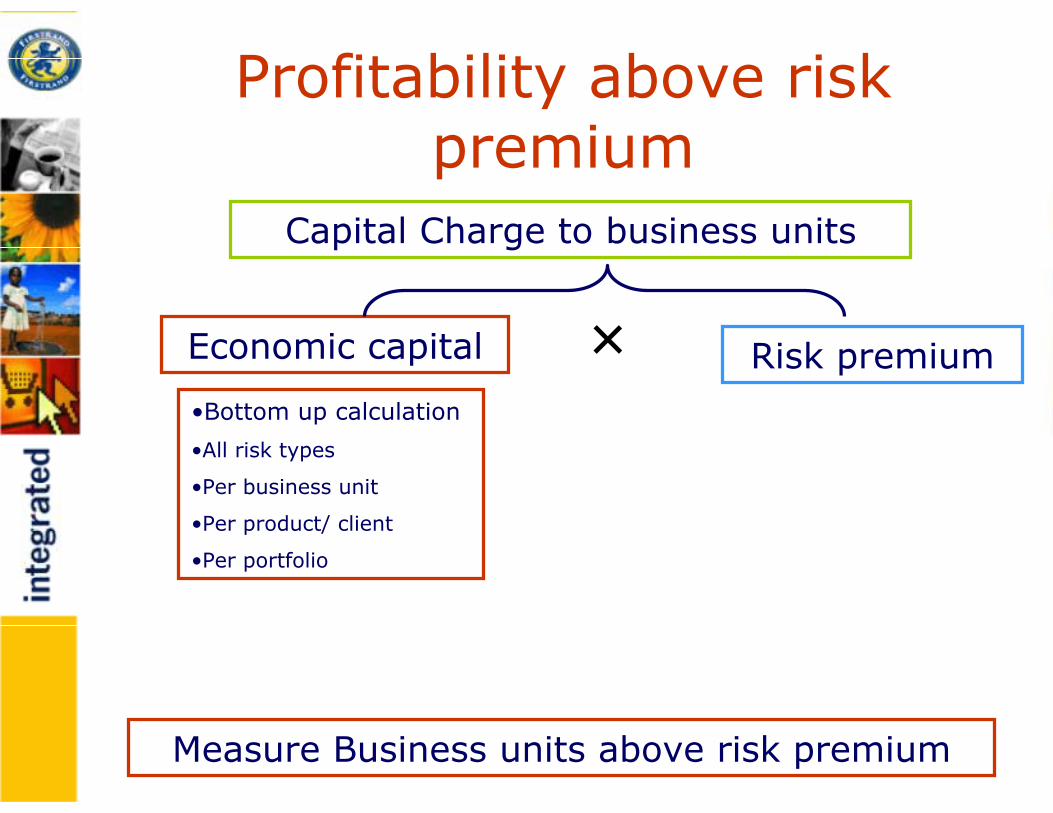
Profitability above risk premium
Capital Charge to business units
Economic capital וBottom up calculation
•All risk types
•Per business unit
•Per product/ client
•Per portfolio
Risk premium
Measure Business units above risk premium
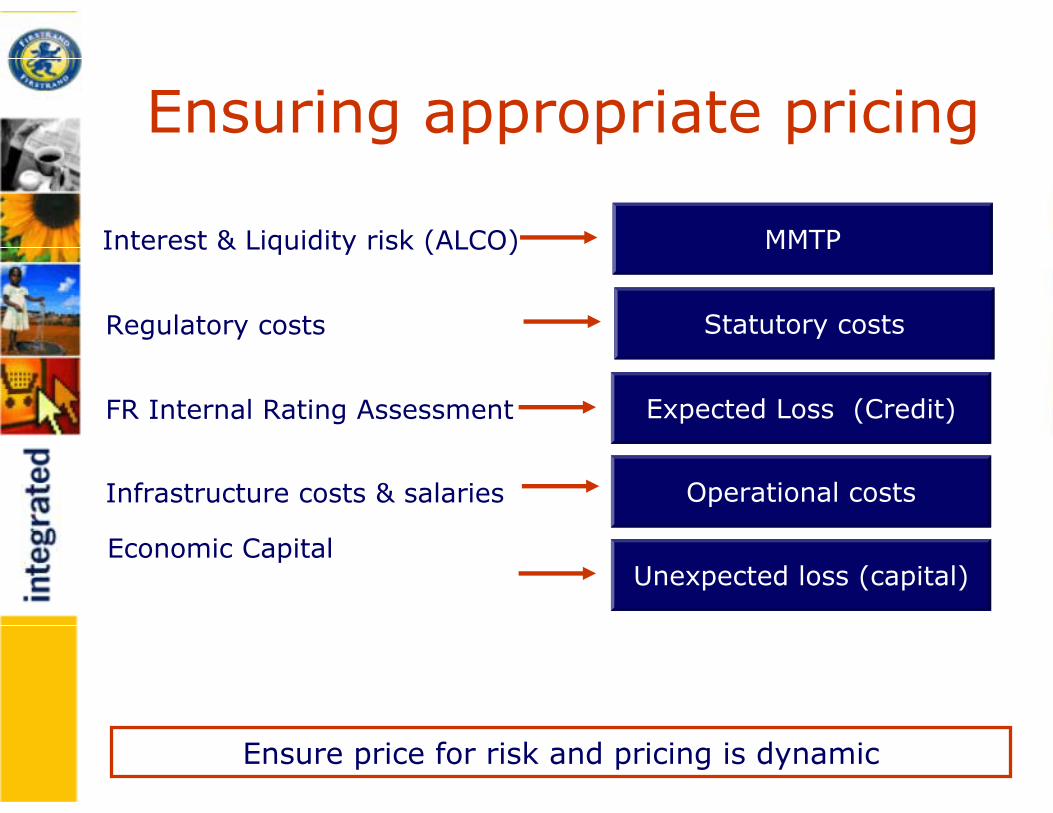
Ensuring appropriate pricing
Statutory costs
Expected Loss (Credit)
Operational costs
Unexpected loss (capital)
MMTP
Ensure price for risk and pricing is dynamic
Regulatory costs
FR Internal Rating Assessment
Infrastructure costs & salaries
Interest & Liquidity risk (ALCO)
Economic Capital
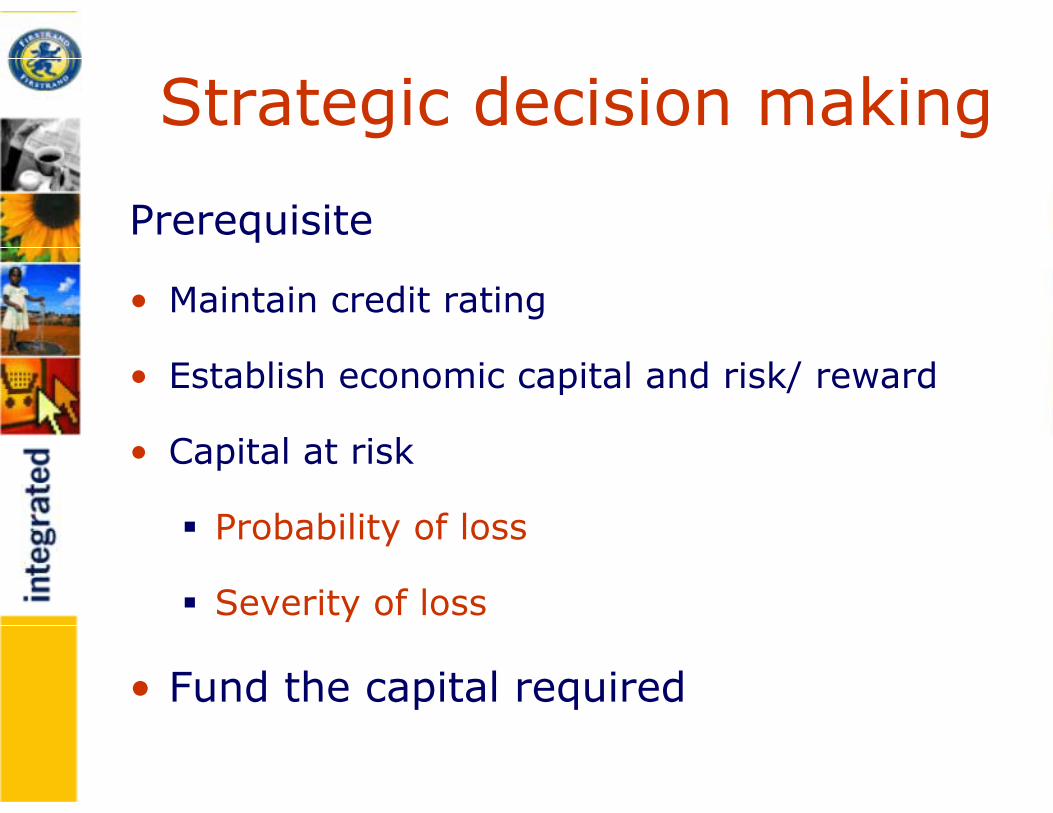
Strategic decision making
Prerequisite
• Maintain credit rating
• Establish economic capital and risk/ reward
• Capital at risk
Probability of loss
Severity of loss
• Fund the capital required
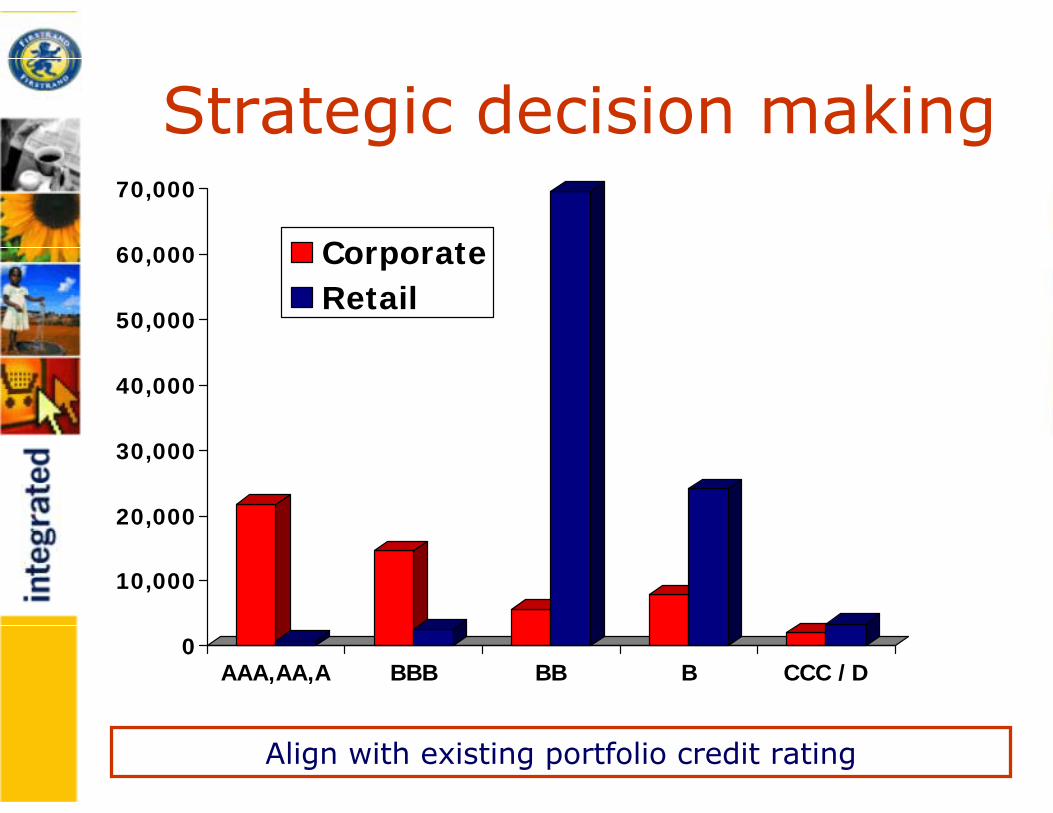
0
10,000
20,000
30,000
40,000
50,000
60,000
70,000
AAA,AA,A BBB BB B CCC /D
CorporateRetail
Strategic decision making
Align with existing portfolio credit rating
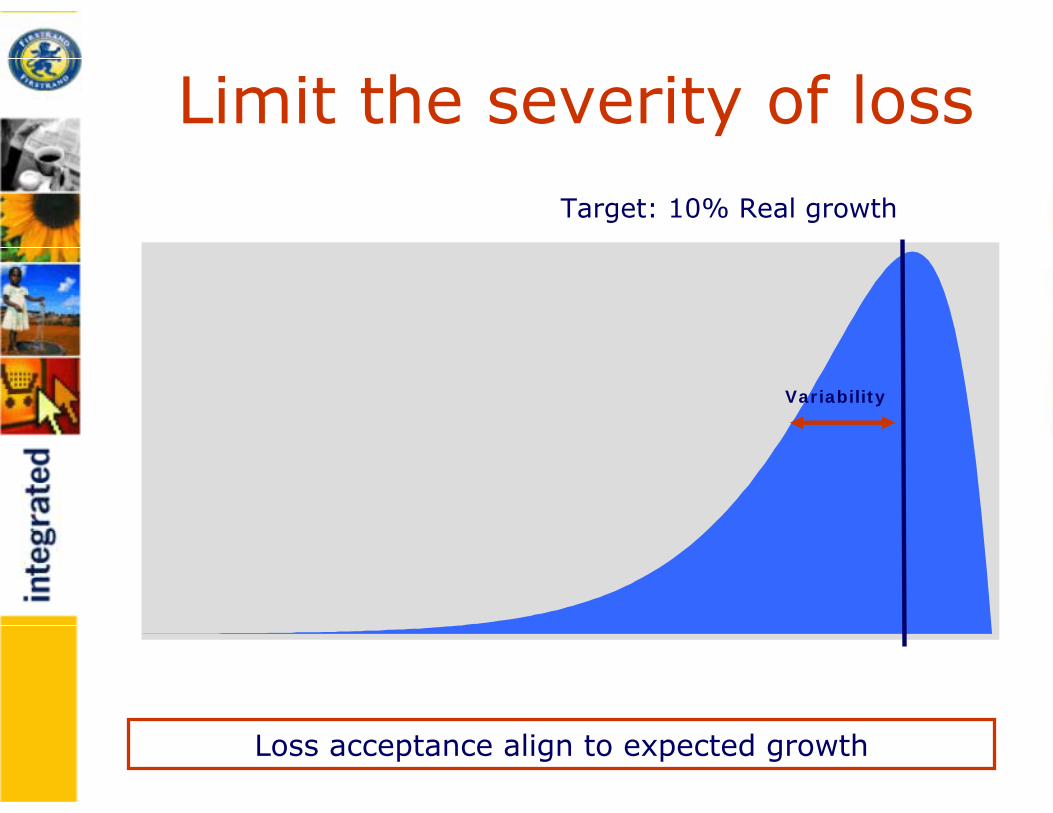
Limit the severity of lossTarget: 10% Real growth
Variability
Loss acceptance align to expected growth
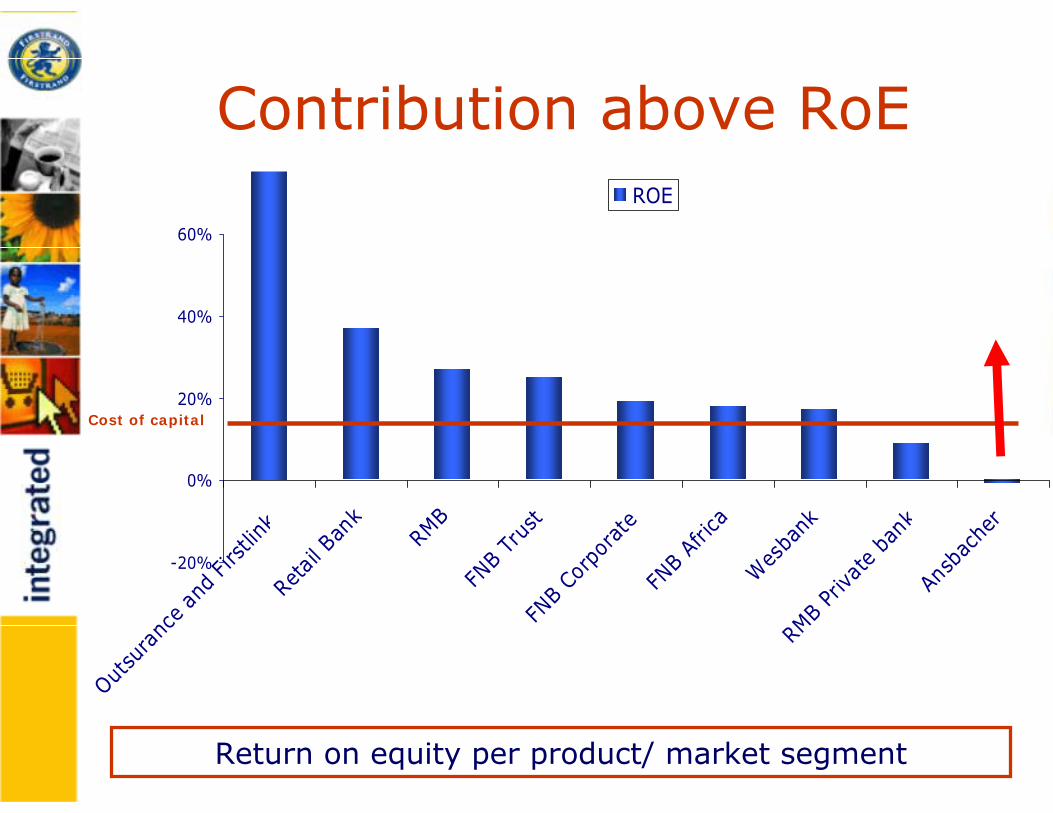
Contribution above RoE
-20%
0%
20%
40%
60%
Outsu
ranc
e an
d Fir
stlin
kRe
tail B
ank
RMB
FNB
Trus
tFN
B Co
rpor
ate
FNB
Afric
a
Wes
bank
RMB
Priva
te b
ank
Ansb
ache
r
ROE
Cost of capital
Return on equity per product/ market segment
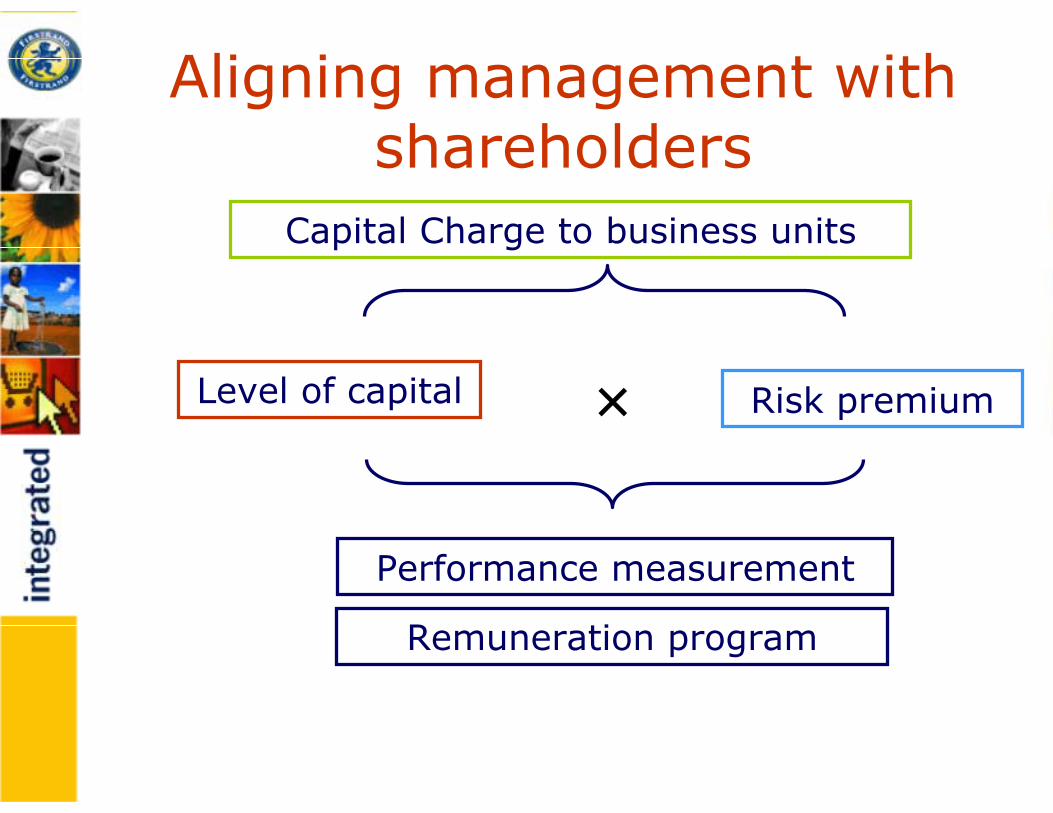
Aligning management with shareholders
Capital Charge to business units
Level of capital
Performance measurement
Remuneration program
× Risk premium
What does it all mean?
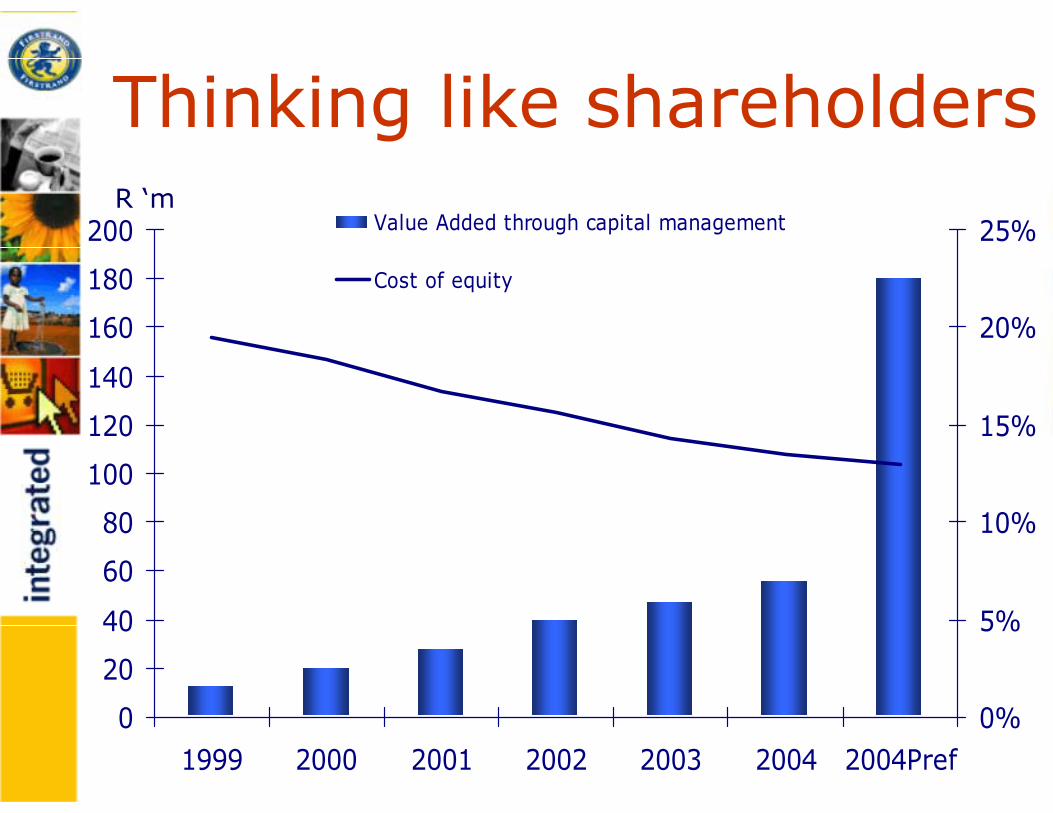
Thinking like shareholders
0
20
40
60
80
100
120
140
160
180
200
1999 2000 2001 2002 2003 2004 2004Pref0%
5%
10%
15%
20%
25%Value Added through capital management
Cost of equity
R ‘m

Simple sum• Optimal capital level
Dividend strategy is important
True excess should be returned to shareholders
• Cost efficient capital structure
• Maximise return over cost of capital
• Ensure capital requirement is embedded in business
unit strategy
• Alignment with remuneration strategy
Business looks for capital and not capital for business
What are the future challenges?
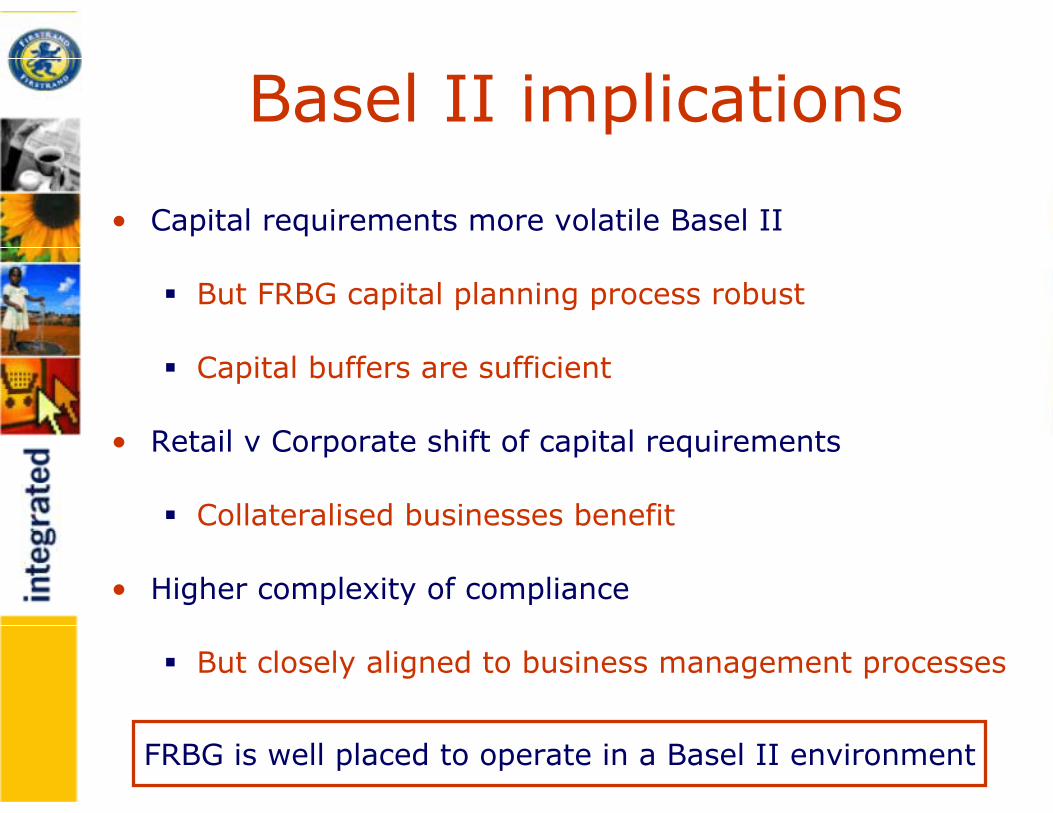
Basel II implications
• Capital requirements more volatile Basel II
But FRBG capital planning process robust
Capital buffers are sufficient
• Retail v Corporate shift of capital requirements
Collateralised businesses benefit
• Higher complexity of compliance
But closely aligned to business management processes
FRBG is well placed to operate in a Basel II environment
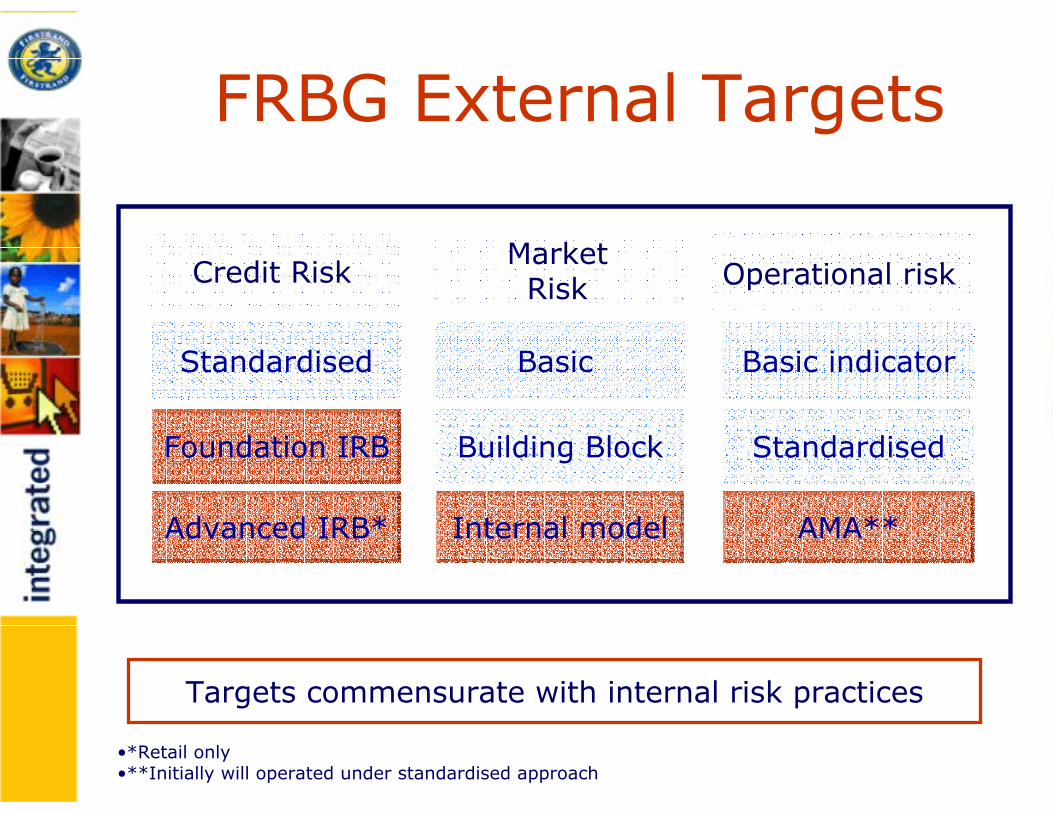
Advanced IRB*
Building Block
AMA**
Foundation IRB
FRBG External Targets
MarketRiskCredit Risk Operational risk
Standardised Basic
Internal model
Basic indicator
Standardised
•*Retail only•**Initially will operated under standardised approach
Targets commensurate with internal risk practices
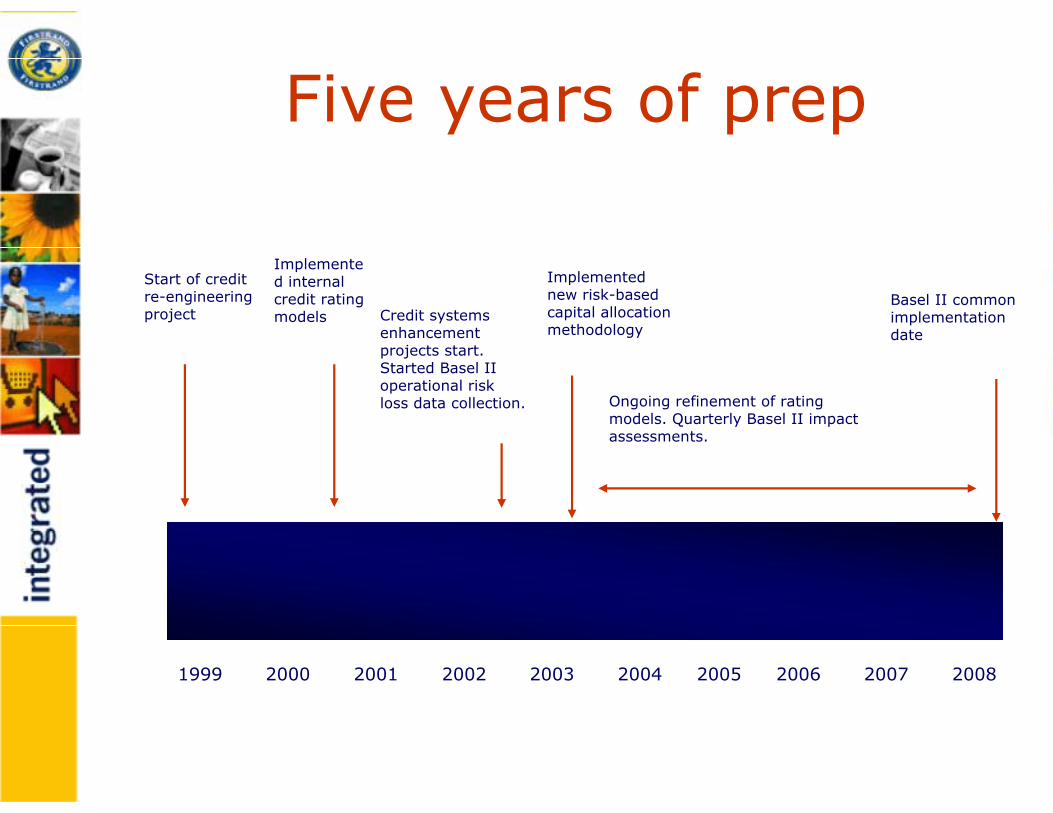
Five years of prep
Start of credit re-engineering project
Implemented internal credit rating models
Ongoing refinement of rating models. Quarterly Basel II impact assessments.
Basel II common implementation date
Implemented new risk-based capital allocation methodology
Credit systems enhancement projects start. Started Basel II operational risk loss data collection.
1999 2000 2001 2002 2003 2004 2005 2006 2007 2008
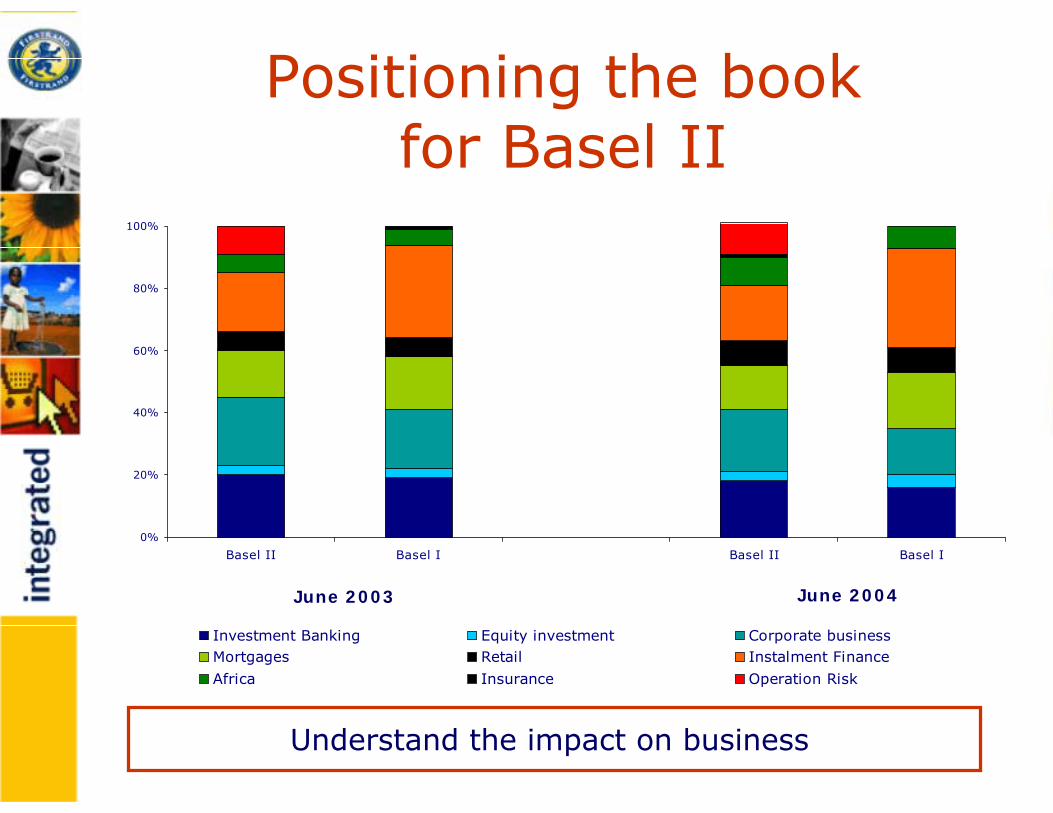
Positioning the book for Basel II
June 2003 June 2004
Understand the impact on business
0%
20%
40%
60%
80%
100%
Basel II Basel I Basel II Basel I
Investment Banking Equity investment Corporate businessMortgages Retail Instalment Finance
Africa Insurance Operation Risk
• Alignment between statutory & economic
capital
• Exploring the use of debt capital instruments
Insurance industry


![Raport Anual / Annual Report 2004 - Allianz-Tiriac · 2018-11-17 · ALTE INFORMA}II OTHER INFORMATION 2004 Varia]ie/Change 2003 2004/2003 Num`r angaja]i (medie anual`) 1.372 15,3%](https://img.pdfslide.us/doc/110x75/5fb9226cfc8b0e11cb28988a/raport-anual-annual-report-2004-allianz-tiriac-2018-11-17-alte-informaii.jpg)