Embed Size (px)
Citation preview

UNIVERSITY OF CALIFORNIA, SAN DIEGO
Microscale habitats and activities of bacteria and their ecological and biogeochemical significance in the ocean
A dissertation submitted in partial satisfaction of the requirements for the degree Doctor of Philosophy
in
Marine Biology
by
Ty James Samo
Committee in charge: Professor Farooq Azam, Chair Professor Eric E. Allen
Professor Lihini I. Aluwihare Professor Peter J.S. Franks Professor Brian Palenik Professor Kit Pogliano
2012

©
Ty James Samo, 2012
All rights reserved.
! iii!
The Dissertation of Ty James Samo is approved, and it is acceptable in quality and form for publication on microfilm and electronically:
Chair
University of California, San Diego
2012

!
! iv!
DEDICATION
To my family and friends. Thank you for your love and support. .

!
! v!
EPIGRAPH
There are the rushing waves Mountains of molecules
Each stupidly minding its own business Trillions apart
Yet forming white surf in unison. -Richard P. Feynman

!
! vi!
TABLE OF CONTENTS
Signature Page……………………………………………………………………............iii Dedication………………………………………………………………………….……..iv Epigraph…………………………………………………...………………………………v Table of Contents……………………………..……………………………………..........vi List of Figures……………………………………………………………………….......viii List of Tables………….…………………………………………………………………..x Acknowledgements………………….…………………………………………………....xi Vita………………………………...……………………………………………………xiii Abstract of the Dissertation…….………………………………………………………..xv Chapter 1 Introduction……..……………….…………………………………………………….......1 References………………………………………………………………………………..11 Chapter 2 A new class of transparent organic particles in seawater visualized by a novel fluorescence approach...……………..………….………………………………………..17 Abstract…...……………………………………………………………………………...18 Introduction..……………………………………………………………………………..18 Materials and Methods…………………………………………………………………...19 Results and Discussion…………………………………………………………………..21 References………………………………………………………………………………..31 Chapter 3 Microbial distribution and activity across a water mass frontal zone in the California Current Ecosystem ……………………………………………………………………....33 Abstract………...……………………………………………………………………..….34 Introduction……..……………………………………………………………………..…34 Method…………………………………………………………………………………...35 Results……………………...……..……………………………………………………...38 Discussion…………………………...…………………………………………………...40 References………………………………………………………………………………..44 Chapter 4
!
! vii!
Rates of single-cell growth, protein, and carbon production in natural marine bacterial populations using the methionine analog homopropargylglycine…..…………………...47 Abstract…...……………………………………………………………………………...48 Introduction..……………………………………………………………………………..49 Materials and Methods…………………………………………………………………...52 Results and Discussion…………………………………………………………………..64 References………………………………………………………………………………..78 Chapter 5 Conclusions & Outlook………………………………………………………………….92 References………………………………………………………………………………..98
!
! viii!
LIST OF FIGURES
Figure 2.1: Filter fluorescing particles (FFP) in Scripps Pier seawater…………......…...22
Figure 2.2: Confocal images of FFP in seawater from Scripps Pier, the California Current, and Antarctica…………………………………………………………………...……….23
Figure 2.3: Seawater density, percent light transmission, chl a, and FFP abundance versus depth for Antarctic shelf and open ocean stations, and the California Current nearshore and offshore stations……………………………………………………………………..24 Figure 2.4: Abundances of FFP in unfixed and fixed seawater samples………………...25 Figure 2.5: Epifluorescent micrographs of FFP………………………………………….26 Figure 2.6: Size frequency charts following treatment with β-glucosidase, pronase, DNase, and lipase………………………………………………………………………...28 Figure 2.7: FFP visualized with concanavalin A lectins…………………………………29 Figure 2.8: Charts of FFP abundances and size frequencies with and without amendments……………………………………………………………………………...30 Figure 3.1: Satellite images of the sea surface temperature with the study area indicated by the red box. The section plot of chlorophyll a concentration across the front with density contours………………………………………………………………………….36 Figure 3.2: Bacterial abundance and bacterial production along the A-Front transect….39 Figure 3.3: Bacteria:nanoflagellate ratios across the front………………………………40 Figure 3.4: Log10 transformed heterotrophic nanoflagellate (HNF) versus log10 transformed bacterial abundance for all stations and depths…………………………….42 Figure 4.1: Chemical structures of methionine (m.w. 149.21) and homopropargylglycine (m.w. 127.14).……………………………………………………………………………82
Figure 4.2: Flow chart of protocols to covalently bond alkyne-containing HPG to azide functionalized Alexa Fluor® 488………………………………………………………..83
Figure 4.3: Percentages of HPG-labeled prokaryotic assemblages from Scripps Pier comparing incubations with the analog and with the analog plus methionine…………..84
Figure 4.4: Michaelis-Menten enzyme kinetics chart displaying HPG competitive inhibition of methionine...………………………………………………………………..84

!
! ix!
Figure 4.5: Measurements of disintegrations per minute in whole seawater samples incubated with 35S-methionine alone and with varying concentrations of cold methionine and HPG………………………………………………………………………………….85
Figure 4.6: Percentages of labeled bacterial cells in seawater incubated with 20 nM homopropargylglycine for 1 hour………………………………………………………..86
Figure 4.7: A representative scene of HPG-labeled bacteria observed on polycarbonate filters and split into DAPI, FITC, and DAPI+FITC channels…………………………...86
Figure 4.8: Magnified image of bacteria from Scripps Pier stained with the nucleic acid stain DAPI next to the same field showing the green AlexaFluor 488® emission of an HPG-positive cell………………………………………………………………………...86
Figure 4.9: Dividing cells observed in the DAPI channel (A) displayed a variety of HPG labeling characteristics as seen in the FITC and DAPI + FITC channels………………..87
Figure 4.10: XY plot of HPG-based cell-specific BPP measured over 24 hours in the presence or absence of 1µM glucose and ammonium chloride………………………….89
Figure 4.11: Bacterial parameters measured for the Scripps Pier monitoring experiment………………………………………………………………………………..90 Figure 4.12: Mean sum intensity values of single bacterial cells incubated in 20 nM or 2 µM HPG and existing in unattached or particle-attached………………………………..90 Figure 4.13: Plots of protein production physiological structure derived from single-cell measurements on seven sampling dates at Scripps Pier…………………………………91

!
! x!
LIST OF TABLES
Table 2.1: Sampling site locations and environmental types and collection dates………22 Table 3.1: Summary values of the nitracline depth and integrated stocks of chlorophyll, bacterial carbon, bacterial carbon production, and calculated bacterial growth rate…….39 Table 3.2: Mean depth integrated values of organic carbon, organic nitrogen, and ratios along the A-Front transect……………………………………………………………….41 Table 4.1: Appropriate mixture of reagents needed to conjugate alkyne-containing HPG to azide functionalized Alexa Fluor® 488……………………………………………….82 Table 4.2: Setup of 35S-methionine incubations conducted in the presence of homopropargylglycine…………………………………………………………………...83 Table 4.3: Comparisons of labeled bacteria percentages cells in seawater incubated with 20 nM homopropargylglycine for 1 hour………………………………………………...85 Table 4.4: Cell concentrations, percentages of HPG positive cells, averages, and ratios of scBCP for 21 dates at Scripps Pier……………………………….……………………...88 Table 4.5: Sum and ratio values of scBCP for 21 dates at Scripps Pier..………………..88 Table 4.6: Averages and ratios for growth rates estimated for 21 dates at Scripps Pier...89

!
! xi!
ACKNOWLEDGEMENTS
I would like to acknowledge my advisor, Professor Farooq Azam, for his acute
insights and unwavering support as the chair of my committee. Special thanks are also
given to my dissertation committee: Drs. Eric Allen, Lihini Aluwihare, Peter Franks,
Brian Palenik, and Kit Pogliano. I greatly appreciate the comments, suggestions, and
assistance they provided throughout my forays into the work described in this dissertation.
I would also like to acknowledge past and current members and visitors of the
Azam laboratory for countless, helpful, and friendly discussions. These people are
Francesca Malfatti, Xavier Mayali, Steve Smriga, Maura Manganelli, Johnny Nguyen,
Jessica Ward, Melissa Garren, Krystal Rypien, Anne-Claire Baudoux, and Byron Pedler.
To my parents, Ron and Georgia Samo, and sister, Haley, thank you for your
unconditional love and respect. I appreciate this so much, and it speaks volumes to each
of your amazing qualities as caring, devoted, curious, and fun individuals. Many thanks
go to my extended family as well for their never-ending love and interest.
All of my closest friends have provided countless discussions, laughs, and
memories. As a result, I have been able to experience a balanced, fun, and intellectually
stimulating life. Thank you to Eric Ball, Katie Barott, Tristan Carland, Santos Cordon,
Cheryl Estoesta-Smith, Zac Hays, Jeff Locke, Bret Loughridge, Francesca Malfatti,
Kristen Marhaver, Dan Mark, Xavier Mayali, Byron Pedler, Ryan Pepin, Matt Read,
Danny Richter, Chris Ritchie, Kevin Smith, Sarah Smith, Steve Smriga, and Tali Vardi.
Chapter 2 appears as a reprint of the version in the journal Aquatic Microbial
Ecology. Samo T.J., Malfatti F., and Azam F. (2008) A new class of transparent organic
particles in seawater visualized by a novel fluorescence approach. Aquatic Microbial

!
! xii!
Ecology, 53, 307-321. The dissertation author was the primary investigator and author of
this material.
Chapter 3 is a reprint of the version published in the Journal of Plankton Research.
Samo T.J., Pedler B.E., Ball G.I., Pasulka A.L., Taylor A.G., Aluwihare L.I., Azam F.,
Goericke R., Landry M.R. (2012) Microbial distribution and activity across a water mass
frontal zone in the California Current Ecosystem. Journal of Plankton Research
doi:10.1093/plankt/fbs048. The dissertation author was the primary investigator and
author of this paper.
Chapter 4, in part, is prepared for submission to the International Society for
Microbial Ecology Journal. The dissertation author was the primary investigator and
author of this paper.

!
! xiii!
VITA
2002 Associate of Art, Liberal Studies, Solano Community College 2002 Associate of Art, General Science, Solano Community College 2004 Bachelor of Science, Cell Biology & Biochemistry, University of
California, San Diego 2004-2005 Staff Research Associate, Scripps Institution of Oceanography, University
of California, San Diego 2005-2012 Graduate Student Researcher, Scripps Institution of Oceanography,
University of California, San Diego 2010 Master of Science, Marine Biology, Scripps Institution of Oceanography,
University of California, San Diego 2012 Doctor of Philosophy, Marine Biology, Scripps Institution of
Oceanography, University of California, San Diego
PUBLICATIONS
Samo TJ, Malfatti F, Azam F (2008) A new class of transparent organic particles in seawater visualized by a novel fluorescence approach. Aquatic Microbial Ecology 53:307-321
Manganelli M, Malfatti F, Samo TJ, Mitchell BG, Wang H, Azam F (2009) Major Role
of Microbes in Carbon Fluxes during Austral Winter in the Southern Drake Passage. PLoS ONE 4:e6941
Malfatti F, Samo TJ, Azam F (2010) High-resolution imaging of pelagic bacteria by
Atomic Force Microscopy and implications for carbon cycling. ISME Journal 4:427-439
Stukel MR, Landry MR, Ohman MD, Goericke R, Samo T, Benitez-Nelson CR (2012)
Do inverse ecosystem models accurately reconstruct plankton trophic flows? Comparing two solution methods using field data from the California Current. Journal of Marine Systems 91:20-33
Samo TJ, Pedler BE, Ball GI, Pasulka AL, Taylor AG, Aluwihare LI, Azam F, Goericke
R, Landry MR (2012) Microbial distribution and activity across a water mass frontal zone in the California Current Ecosystem. Journal of Plankton Research 34:802-814

!
! xiv!
SUBMITTED PUBLICATIONS Samo TJ, Smriga SP, Malfatti F, Azam F (2012) Single-cell protein synthesis and
growth rates in marine bacteria using the methionine analog homopropargylglycine. ISME Journal. In preparation.

!
! xv!
ABSTRACT OF THE DISSERTATION
Microscale habitats and activities of bacteria and their ecological and biogeochemical significance in the ocean
by
Ty James Samo
Doctor of Philosophy in Marine Biology
University of California, San Diego, 2012
Professor Farooq Azam, Chair
The focus of this dissertation is to observe and quantify the contribution
of bacteria and their habitats to the nutrient cycling in marine environments. As a result
of the complex exchanges between ocean physics, chemistry, and biology, the formation
and distribution of microbial communities, their metabolisms, and their
microenvironments is invariably influenced. Current research is beginning to reveal the
heterogeneity of microbial growth, community/species composition, and habitats in the
natural marine environment. However, little is currently know about how the mechanisms
and interactions of these parameters influence each other. These topics were addressed

!
! xvi!
through the application of microscopy and various fluorescence staining techniques, and
following several oceanographic research cruises.
After developing a staining protocol of seawater derived microbes and organic
matter concentrated on a polycarbonate filter, it was found that an abundant and
unclassified type of transparent organic particle exists in coastal and open ocean
environments. These structures were termed filter fluorescing particles (FFP) based on
their staining characteristics. In addition to their small size of a few to hundreds of
micrometers in length, the particles are occasionally associated with heterotrophic
bacteria, cyanobacteria, and phytoplankton. Several oceanographic research cruises
confirmed the widespread presence of these particles, and suggest that these particles are
relatively more abundant in oligotrophic waters containing enhanced concentrations of
refractory organic matter. The discovery of these particles adds to our current knowledge
of transparent exopolymer particles (TEP), DAPI yellow particles (DYP), and Coomassie
stained particles (CSP).
The spatial characteristics and dynamics of a deep-water oceanic frontal zone
made it possible to study the influence of submesoscale processes on the microscale
responses of microbes and organic matter. The strong gradient created at this site created
distinct zones of microbial activity, abundance, and size characterized by elevated
primary and secondary production at the front. Further, the non-living material
comprising the particulate and dissolved organic mater pools was enhanced as well due to
elevated the production of the phyto- and bacterioplankton. The abundance and size of
FFP and TEP were also monitored, and found to coincide with water mass features as
well, presumably due to the physical-biological interactions acting at the front.

!
! xvii!
Lastly, a method was established to simultaneously visualize and quantify the
protein synthesis rates of single heterotrophic bacterial cells in order to identify growth
ranges and relative biogeochemical contributions in natural populations. This approach
relied on the bioorthogonal amino acid homopropargylglycine (HPG), a methionine
analog functionalized with an alkyne group. After incubation of natural seawater with
HPG followed by fixation and cell immobilization on a filter, the HPG incorporated into
the cellular protein of active cells was fluorescently labeled with Alexa Fluor 488® via
click chemistry. A conversion factor to measure single-cell protein synthesis was
generated from laboratory culture grown in natural seawater. Applying this factor to
labeled cells from the Scripps Pier revealed a large range of rates, and highlighted the
sensitivity of the method to measure very low activity cells, growth of cells attached to
particles, and the continuum of activities that characterize natural heterotrophic bacterial
assemblages.

!
1
CHAPTER 1
Introduction
! 2
!
Over the past 30 years, the field of microbial oceanography and ecology has made
progress in elucidating some of the microbial influences on marine biogeochemistry and
climate. On the global scale, phytoplankton and cyanobacteria account for approximately
~0.2% of the photosynthetic biomass on Earth yet they are responsible for one half of the
net primary production that converts inorganic carbon, nitrogen, and phosphorus
compounds in biologically available organic molecules. The vastness of the ocean and
ubiquity of phytoplankton and photosynthetically derived material are major contributors
to oceanic nutrient budgets and cycling (Falkowski et al. 1998). Early studies found that
organic matter released by phytoplankton enables the growth and subsistence of
heterotrophic marine bacteria (Fuhrman et al. 1980, Mague et al. 1980), and that up to
50% of this primary production was consumed by bacteria through secondary production
(Fuhrman & Azam 1982). In the process, bacteria perform the reverse reaction of
photosynthesis, that is, respiration of organic components back to their inorganic state
(del Giorgio & Cole 1998). In doing so, bacteria remineralize these elements to be used
again by primary producers, thereby maintaining these pools in microbial food webs and
potentially moving them up higher trophic levels as bactivorous grazers are then
consumed by larger metazoans and then fish (Azam 1986, Cho & Azam 1988). This
general premise of the microbial loop (Azam et al. 1983) has been continually expanded
upon to more completely account for the role of organic matter in structuring marine
ecosystems and biogeochemical fluxes. However, the relevance of spatial and
observational scales in determining how these mechanisms affect marine elemental
cycles is only beginning to be addressed. This dissertation focuses on the importance of
the microscale (defined here as sub-millimeter ecology and biogeochmistry) as the major

! 3
!
conduit through which individual microbes influence meso- and larger scale trophic and
biogeochemical dynamics in the ocean.
Bacterial incorporation and metabolism of organic matter is largely dictated by
the source, quality, and type of constituents available (Azam 1998, Jiao et al. 2010). As
obligate osmotrophs, bacteria largely rely on the organic matter (OM) released from
phytoplankton to generate energy through catabolism that enables growth and
biochemical functions via anabolism. Organic matter exists as a continuum of sizes and
compositions (Verdugo et al. 2004), and unlike many marine organisms, bacteria utilize it
as both sustenance and habitat (Malfatti & Azam 2009). This duality has important
implications for not only elemental cycling in marine systems, but climate as well.
Depending on the availability of nutrients, phytoplankton fix atmospheric-based CO2 into
biomass, and transform this greenhouse gas into dissolved and particulate organic matter
(DOM and POM) phases that sink or mix into the deep ocean (Eppley & Peterson 1979).
This process significantly influences global CO2 concentrations as sinking particles
potentially sequester the atmosphere-derived carbon on very long timescales (Martin et al.
1987, Raven & Falkowski 1999).
Bacteria are intimately involved with this process as their continuous enzymatic
processing of DOM and POM solubilizes the material for incorporation and metabolism
(Smith et al. 1992). The monomerization of peptides to amino acids by bacterial
ectoenzymes was found to be a significant factor in coupling between hydrolysis and
uptake of organic matter (Hoppe et al. 1988). This concept was expanded to include POC,
specifically marine snow, where high bacterial enzyme activities were responsible for
rapid dissolution, yet did not support enhanced bacterial production (Smith et al. 1992).

! 4
!
Later, the behavior of bacteria on and near organic particles was noted to be a potentially
significant force in structuring organic material distributions and microbial communities
(Kiørboe & Jackson 2001). Using models of flow and concentration fields, the authors
found that solute release from the particles likely supported unattached motile bacteria in
the surrounding water. Taking the model a step further, Azam & Long (2001) suggested
several ecological and climatic scenarios for this phenomena. Not only does enzymatic
hydrolysis create solute plumes, it enables bacterial daughter cells of particle-attached
bacteria to be released into the nutrient rich environment, thus evading low temperatures
and high pressures for an overall benefit. Fast growing cells (released daughter cells and
unattached motile cells) in the plume are more likely to exhibit enhanced growth
efficiency, thereby releasing less CO2 through respiration and contributing to
heterogeneity of microbial activity in the ocean.
It is not surprising, then, that marine microorganisms exist in a matrix of colloids,
polymers, enzymes, and particles (Alldredge & Silver 1988, Wells & Goldberg 1991,
Martinez et al. 1996, Santschi et al. 1998). While these features of the marine
microenvironment have been known for many years, their spatiotemporal distributions,
patterns, and role in structuring microbial communities have been relatively less studied.
To assist with identifying the origin and composition of the organic matter continuum,
several classifications of DOM and POM have been created for points of reference and
comparison. The descriptions have brought about a better understanding of not only the
patterns and dynamics of OM, but also their relationship with marine microbes and
potential influence on global biogeochemistry. Traditionally, DOM and POM are
operationally divided as material that can pass through a 0.45 µm pore size filter (DOM)

! 5
!
and the retentate (POM). DOM has been found to be composed of a wide range of
polysaccharide, lipid, and amino acid compounds, and is further subdivided into labile,
semi-labile, and refractory pools that determine the turnover time and thus accumulation
in the ocean (Hedges 2002, Hansell et al. 2009; and references therein). Although DOM
cannot directly participate in the biological pump through sinking, it is capable of
transport below the euphotic zone and throughout the world ocean through the physical
processes of wind-induced mixing and meridional overturn (Hansell & Carlson 2001,
Carlson et al. 2010).
Under certain physical and chemical conditions, DOM precursors may assemble
and aggregate into larger structures and eventually particles (Chin et al. 1998, Passow
2000, Burd & Jackson 2009). Among the overarching implications for this transformation
is the enhanced transport of carbon to the deep ocean via particles, the potential to
provide food to particle consumers at higher trophic levels (Passow & Alldredge 1999),
and the creation of discrete microhabitats with active and communicating bacteria
(Verdugo et al. 2004, Hmelo & Van Mooy 2009). Furthermore, some of these particles
display specific staining characteristics when exposed to histological and fluorescent dyes.
For example, Alldredge et al. (1993) first described a class of microscopic and
transparent particles in the ocean using the polysaccharide dye Alcian Blue. Distinct from
the macroscopic marine snow described previously, these transparent exopolymer
particles (TEP) are ubiquitous in the ocean, colonized by bacteria, and associated with
phytoplankton. Later, the usefulness of the DNA stain 4',6-diamidino-2-phenylindole
(DAPI) was expanded when it was found to also enable observation of DAPI yellow
particles (DYP; Mostajir et al. 1995). Like TEP, the particles were found in many

! 6
!
different environments, and while the small sized examples did not exhibit bacterial
colonization, the larger ones occasionally did. In a similar approach to Alldredge et al.,
Long and Azam (1996) used the histological protein stain Coomassie Blue to visualize
proteinaceous transparent structures, or Coomassie stained particles (CSP). As with the
other particles, this class was ubiquitous and occasionally colonized by bacteria,
confirming the importance of these features in microbial food webs.
In considering the interplay between microbes and their non-living, organic
microenvironment, it is also necessary to understand microbial physiology in the context
of the microenvironment and the downstream effects on nutrient cycling in the marine
ecosystem. Approaches have been developed to quantitatively or semi-quantitatively
ascertain growth responses of cells in order to determine and constrain their role in
marine geochemical cycles and food web dynamics. The groundwork for this approach
was established by Brock in studies that showed the usefulness and sensitivity
autoradiography as a tool to understand microbial assimilation and processing of
radiolabeled compounds in nature (Brock & Brock 1966). Interestingly, the method was
used to determine the location of bacteria attached to diatoms and red algae in order to
demonstrate colocalizaion of active cells within concentrated cell masses, and to show
that the algae support higher percentages of bacterial cells incorporating thymidine to
enable rapid DNA replication and cell division. Radioisotope labeled amino acids and
sugars were later used to study natural marine bacteria and their influence on carbon
cycling (Azam & Holm-Hansen 1973, Azam & Hodson 1977). Subsequent experimental
and field results using visual/microautoradiographic-based approaches concluded that
marine bacteria were an active and dynamic part of the marine food web (Fuhrman et al.

! 7
!
1980, Hollibaugh et al. 1980). These studies eventually led to bulk/seawater radiotracer-
based measurements of natural communities incorporating tritiated thymidine or leucine
to determine the total amounts of each compound assimilated into the whole bacterial
community (Fuhrman & Azam 1982, Kirchman et al. 1985). Later, carbon cycling
potential and growth rates were assigned to these measurements by determining the
average amount of thymidine or leucine in marine bacteria, normalizing this to the
amount of carbon in the cell, and calculating how quickly bulk communities incorporated
the radiolabels into biomass (Simon & Azam 1989, Ducklow 2000).
As imaging technology improves along with the availability of new stains and
dyes, so does our ability to observe and quantify the particles, interactions, activities, and
eventually the mechanisms underlying the contributions of marine microbial ecology to
biogeochemistry and nutrient cycling. Real-time visualization of microbes in the field or
laboratory is allowing researchers to quantify distributions and activity with minimal
disturbance and bias (Franks & Jaffe 2008, Seymour et al. 2008). These studies
underscore the importance of spatial and temporal scales in structuring microbial
ecosystems and effects on biogeochemistry.
This aspect of scale requires consideration throughout the scientific process.
Many oceanographic cruises observing the distributions of elements and plankton activity
and abundance have done so across wide swaths of the ocean, including gyres and basins,
and employed large spatial samplings in lieu of observing temporal dynamics in a more
confined area (Kirchman et al. 1995, Hansell & Waterhouse 1997, Zubkov et al. 1998,
Kähler & Koeve 2001, Hoppe et al. 2002). In providing an informative overview of a
large region, the approach makes it difficult to document potentially important short-term

! 8
!
processes. More magnified studies have investigated meso- and submesoscale (kilometer
to meters) features on chemical and biological parameters to enable detailed views of
phenomena with shorter timescales (Ducklow & Hill 1985, Morán et al. 2001, Van
Wambeke et al. 2004, Ewart et al. 2008). By looking at the downstream effects of frontal
zones and eddies on production and distribution of organic matter and marine microbes,
these authors explored how such dynamics fluctuated in space and time since both
microbial growth and water mass movements occur on the range of hours to days (these
phenomena can vary from weeks to months as well). As a result, we are gaining a clearer
picture of how these physical-chemical-biological interactions enhance or diminish
microbial activity and thus structure food webs and higher trophic levels. Yet, the
microscale is the most relevant mode of observation to characterize microbial consortia
and eventually obtain a better mechanistic and predictive understanding of the
communities’ effects on elemental cycling and climate (Azam & Smith 1991, Azam
1998). Microbes and the myriad environments with which they interact are, for the most
part, allocated heterogeneously in the water column (Mitchell et al. 1985, Long & Azam
2001, Prairie et al. 2010). Influenced by the physicohemical characteristics of the water
column, non-living dissolved and particulate organic matter shape microbial activities
and abundances through control of elemental distributions and concentrations (Jackson &
Burd 1998). Knowledge of the extent to which such microenvironmental characteristics
alter individual cell activity is currently lacking. However, strategies are being developed
to sample, observe, and quantify the patchy continuum of microbial habitats and activities
to address the contribution of these components in marine ecosystems.

! 9
!
This dissertation aims to study microbial processes on different scales using
several experimental approaches in order to further characterize microbial contribution to
marine carbon cycling and identify effective approaches to forecast these activities and
their implications.
Chapter 2 explains a method used to observe a class of transparent organic
particles in seawater and characterize them as microscale components that act as hotspots
of microbial activity, thus augmenting the currently known classes of transparent
particles (Koike particles, TEP, DYP, CSP). Initially observed at Scripps Pier, they were
later observed in Antarctic waters and the California Current Ecosystem (CCE). Both
bacteria and phytoplankton were associated with FFP. The internal structure was probed
with fluorescently labeled lectins to show that some of the particles contained an
architecture of glucose/mannose and galactose containing molecules, but not N-acetyl-
glucosamine (the major unit of bacterial cell walls and monomer of chitin).
Chapter 3 details the results from an oceanographic research cruise that measured
several microbial parameters across a rapidly sampled deep-water frontal zone in the
California Current Ecosystem. This mesoscale feature was characterized by nitrate
injection from deeper waters into the surface that elicited rapid growth responses from
phytoplankton (high chlorophyll concentration) and very high production rates of bacteria
in comparison to the adjacent oligotrophic and mesotrophic masses (Li et al. 2012, Taylor
et al. 2012). Additionally, bacterial mortality was likely controlled more by viruses than
nanoflagellate grazers that were being consumed by microflagellate predators. The front
also displayed maxima of bacterial cell-specific biovolume, POC and PON, and sizes of
transparent particles. These observations may have biogeochemical implications for the

! 10
!
broader CCE region since the frontal jet velocity approached 0.3 m s-1, enabling the jet to
rapidly transport the elevated organic matter and active microbes to influence elemental
cycling in different water masses further away. This work contributed new knowledge of
how marine microbes respond to sharply defined frontal zones, and constrained how the
microbial food web can influence elemental cycling in the CCE.
Chapter 4 details the establishment of a protocol to observe and quantify protein
synthesis, carbon production, and growth rates of single bacterial cells using the
methionine analog homopropargylglycine. Subsequent microbial ecological experiments
using the method investigated spatiotemporal activity dynamics with time-series
incubations and comparisons between unattached versus particle-attached cells. One of
the novel quantitative measurements from this research include power law distributions
of single-cell activity, as opposed to the Gaussian allocation generally assumed and
applied in bulk measurements of heterotrophic bacterial activity. It was also observed that
particle-attached cells did not exhibit enhanced protein production rates relative to
unattached cells when comparing average values of the fastest growing cells.
Chapter 5 integrates the background, results, and implications of chapters 2 – 4 to
provide an assessment for how the current state of single-cell marine microbiology in
concert with the evolution of multi-scale approaches may represent powerful tools for
identifying how microbial activities and interactions impact marine ecology and
elemental cycling.

! 11
!
References
Alldredge AL, Passow U, Logan BE (1993) The abundance and significance of a class of large, transparent organic particles in the ocean. Deep-Sea Research Part I: Oceanographic Research Papers 40:1131-1140
Alldredge AL, Silver MW (1988) Characteristics, Dynamics and Significance of Marine
Snow. Progress in Oceanography 20:41-82 Azam F (1986) Nutrient cycling and food web dynamics in the Southern California
Bight: The microbial food web. In: Eppley RW (ed) Plankton Dynamics of the Southern California Bight. Springer-Verlag, Berlin, West German; New York, N.Y., U.S.A
Azam F (1998) Microbial control of oceanic carbon flux: The plot thickens. Science
280:694-696 Azam F, Fenchel T, Field JG, Gray JS, Meyer-Reil LA, Thingstad F (1983) The
ecological role of water-column microbes in the sea. Marine Ecology Progress Series 10:257-263
Azam F, Hodson RE (1977) Size Distribution and Activity of Marine Microheterotrophs.
Limnology and Oceanography 22:492-501 Azam F, Holm-Hansen O (1973) Use of tritiated substrates in the study of heterotrophy
in seawater. Marine Biology 23:191-196 Azam F, Long RA (2001) Oceanography - Sea snow microcosms. Nature 414:495-498 Azam F, Smith DC (1991) Bacterial influence on the variability in the ocean's
biogeochemical state: A mechanistic view. In: Demers S (ed) Particle analysis in oceanography, Book 27. Springer-Verlag, Berlin; New York
Brock TD, Brock ML (1966) Autoradiography as a tool in microbial ecology. Nature
209:734-& Burd AB, Jackson GA (2009) Particle aggregation. Annual Review of Marine Science
1:65-90 Carlson CA, Hansell DA, Nelson NB, Siegel DA, Smethie WM, Khatiwala S, Meyers
MM, Halewood E (2010) Dissolved organic carbon export and subsequent remineralization in the mesopelagic and bathypelagic realms of the North Atlantic basin. Deep-Sea Research Part II-Topical Studies in Oceanography 57:1433-1445

! 12
!
Chin WC, Orellana MV, Verdugo P (1998) Spontaneous assembly of marine dissolved organic matter into polymer gels. Nature 391:568-572
Cho BC, Azam F (1988) Major Role of Bacteria in Biogeochemical Fluxes in the Oceans
Interior. Nature 332:441-443 del Giorgio PA, Cole JJ (1998) Bacterial growth efficiency in natural aquatic systems.
Annual Review of Ecology and Systematics 29:503-541 Ducklow HW (2000) Bacterial production and biomass in the oceans. In: Kirchman DL
(ed) Microbial Ecology of the Oceans. Wiley-Blackwell, Hoboken, New Jersey, USA
Ducklow HW, Hill SM (1985) Tritiated-thymidine incorporation and the growth of
heterotrophic bacteria in warm core rings. Limnology and Oceanography 30:260-272
Eppley RW, Peterson BJ (1979) Particulate organic matter flux and planktonic new
production in the deep ocean. Nature 282:677-680 Ewart CS, Meyers MK, Wallner ER, McGillicuddy Jr DJ, Carlson CA (2008) Microbial
dynamics in cyclonic and anticyclonic mode-water eddies in the northwestern Sargasso Sea. Deep-Sea Research Part II: Topical Studies in Oceanography 55:1334-1347
Falkowski PG, Barber RT, Smetacek V (1998) Biogeochemical controls and feedbacks
on ocean primary production. Science 281:200-206 Franks PJS, Jaffe JS (2008) Microscale variability in the distributions of large fluorescent
particles observed in situ with a planar laser imaging fluorometer. Journal of Marine Systems 69:254-270
Fuhrman JA, Ammerman JW, Azam F (1980) Bacterioplankton in the coastal euphotic
zone - Distribution, activity and possible relationships with phytoplankton. Marine Biology 60:201-207
Fuhrman JA, Azam F (1982) Thymidine Incorporation as a Measure of Heterotrophic
Bacterioplankton Production in Marine Surface Waters - Evaluation and Field Results. Marine Biology 66:109-120
Hansell DA, Carlson CA (2001) Biogeochemistry of total organic carbon and nitrogen in
the Sargasso Sea: control by convective overturn. Deep-Sea Research Part II 48:1649-1667

! 13
!
Hansell DA, Carlson CA, Repeta DJ, Schlitzer R (2009) Dissolved Organic Matter in the Ocean: A Controversy Stimulates New Insights. Oceanography 22:202-211
Hansell DA, Waterhouse TY (1997) Controls on the distributions of organic carbon and
nitrogen in the eastern Pacific Ocean. Deep-Sea Research Part I-Oceanographic Research Papers 44:843-857
Hedges JI (2002) Why dissolved organics matter. In: Hansell DA, Carlson CA (eds)
Biogeochemistry of Marine Dissolved Organic Matter Academic Press, San Diego
Hmelo LR, Van Mooy BAS (2009) Kinetic constraints on acylated homoserine lactone-
based quorum sensing in marine environments. Aquatic Microbial Ecology 54:127-133
Hollibaugh JT, Fuhrman JA, Azam F (1980) Radioactively labeling of natural
assemblages of bacterioplankton for use in trophic studies. Limnology and Oceanography 25:172-181
Hoppe H-G, Kim S-J, Gocke K (1988) Microbial Decomposition in Aquatic
Environments: Combined Process of Extracellular Enzyme Activity and Substrate Uptake. Applied and Environmental Microbiology 54:784-790
Hoppe HG, Gocke K, Koppe R, Begler C (2002) Bacterial growth and primary
production along a north-south transect of the Atlantic Ocean. Nature 416:168-171
Jackson GA, Burd AB (1998) Aggregation in the marine environment. Environmental
Science & Technology 32:2805-2814 Jiao N, Herndl GJ, Hansell DA, Benner R, Kattner G, Wilhelm SW, Kirchman DL,
Weinbauer MG, Luo TW, Chen F, Azam F (2010) Microbial production of recalcitrant dissolved organic matter: long-term carbon storage in the global ocean. Nature Reviews Microbiology 8:593-599
Kirchman D, K'Nees E, Hodson R (1985) Leucine incorporation and its potential as a
measure of protein synthesis by bacteria in natural aquatic systems. Applied and Environmental Microbiology 49:599-607
Kirchman DL, Rich JH, Barber RT (1995) Biomass and biomass production of
heterotrophic bacteria along 140W in the equatorial Pacific: Effect of temperature on the microbial loop. Deep-Sea Research Part II-Topical Studies in Oceanography 42:603-619

! 14
!
Kiørboe T, Jackson GA (2001) Marine snow, organic solute plumes, and optimal chemosensory behavior of bacteria. Limnology and Oceanography 46:1309-1318
Kähler P, Koeve W (2001) Marine dissolved organic matter: can its C : N ratio explain
carbon overconsumption? Deep-Sea Research Part I-Oceanographic Research Papers 48:49-62
Li QP, Franks PJS, Ohman MD, Landry MR (2012) Enhanced nitrate fluxes and
biological processes at a frontal zone in the southern California current system. Journal of Plankton Research 34:790-801
Long RA, Azam F (1996) Abundant protein-containing particles in the sea. Aquatic
Microbial Ecology 10:213-221 Long RA, Azam F (2001) Microscale patchiness of bacterioplankton assemblage richness
in seawater. Aquatic Microbial Ecology 26:103-113 Mague TH, Friberg E, Hughes DJ, Morris I (1980) Extracellular release of carbon by
marine phytoplankton; a physiological approach. Limnology and Oceanography 25:262-279
Malfatti F, Azam F (2009) Atomic force microscopy reveals microscale networks and
possible symbioses among pelagic marine bacteria. Aquatic Microbial Ecology 58:1-14
Martin JH, Knauer GA, Karl DM, Broenkow WW (1987) VERTEX: carbon cycling in
the northeast Pacific. Deep-Sea Research Part A - Oceanographic Research Papers 34:267-285
Martinez J, Smith DC, Steward GF, Azam F (1996) Variability in ectohydrolytic enzyme
activities of pelagic marine bacteria and its significance for substrate processing in the sea. Aquatic Microbial Ecology 10:223-230
Mitchell JG, Okubo A, Fuhrman JA (1985) Microzones Surrounding Phytoplankton
Form the Basis for a Stratified Marine Microbial Ecosystem. Nature 316:58-59 Morán XAG, Taupier-Letage I, Vázquez-Domínguez E, Ruiz S, Arin L, Raimbault P,
Estrada M (2001) Physical-biological coupling in the Algerian Basin (SW Mediterranean): Influence of mesoscale instabilities on the biomass and production of phytoplankton and bacterioplankton. Deep-Sea Research Part I-Oceanographic Research Papers 48:405-437
Mostajir B, Dolan JR, Rassoulzadegan F (1995) A simple method for the quantification
of a class of labile marine pico- and nano-sized detritus: DAPI Yellow Particles (DYP). Aquatic Microbial Ecology 9:259-266

! 15
!
Passow U (2000) Formation of transparent exopolymer particles, TEP, from dissolved precursor material. Marine Ecology-Progress Series 192:1-11
Passow U, Alldredge AL (1999) Do transparent exopolymer particles (TEP) inhibit
grazing by the euphausiid Euphausia pacifica? Journal of Plankton Research 21:2203-2217
Prairie JC, Franks PJS, Jaffe JS (2010) Cryptic peaks: Invisible vertical structure in
fluorescent particles revealed using a planar laser imaging fluorometer. Limnology and Oceanography 55:1943-1958
Raven JA, Falkowski PG (1999) Oceanic sinks for atmospheric CO2. Plant, Cell &
Environment 22:741-755 Santschi PH, Balnois E, Wilkinson KJ, Zhang JW, Buffle J, Guo LD (1998) Fibrillar
polysaccharides in marine macromolecular organic matter as imaged by atomic force microscopy and transmission electron microscopy. Limnology and Oceanography 43:896-908
Seymour JR, Ahmed T, Marcos, Stocker R (2008) A microfluidic chemotaxis assay to
study microbial behavior in diffusing nutrient patches. Limnology and Oceanography-Methods 6:477-488
Simon M, Azam F (1989) Protein content and protein synthesis rates of planktonic
marine bacteria. Marine Ecology Progress Series 51:201-213 Smith DC, Simon M, Alldredge AL, Azam F (1992) Intense hydrolytic enzyme activity
on marine aggregates and implications for rapid particle dissolution. Nature 359:139-142
Taylor AG, Goericke R, Landry MR, Selph KE, Wick DA, Roadman MJ (2012) Sharp
gradients in phytoplankton community structure across a frontal zone in the California Current Ecosystem. Journal of Plankton Research 34:778-789
Van Wambeke F, Lefèvre D, Prieur L, Sempéré R, Bianchi M, Oubelkheir K, Bruyant F
(2004) Distribution of microbial biomass, production, respiration, dissolved organic carbon and factors controlling bacterial production across a geostrophic front (Almeria-Oran, SW Mediterranean Sea). Marine Ecology-Progress Series 269:1-15
Verdugo P, Alldredge AL, Azam F, Kirchman DL, Passow U, Santschi PH (2004) The
oceanic gel phase: a bridge in the DOM-POM continuum. Marine Chemistry 92:67-85

! 16
!
Wells ML, Goldberg ED (1991) Occurrence of small colloids in sea water. Nature 353:342-344
Zubkov MV, Sleigh MA, Tarran GA, Burkill PH, Leakey RJG (1998) Picoplanktonic
community structure on an Atlantic transect from 50 degrees N to 50 degrees S. Deep-Sea Research Part I-Oceanographic Research Papers 45:1339-1355
!

!
!17
Chapter!2
A new class of transparent organic particles in seawater visualized by a novel fluorescence approach

! 18
!!!
AQUATIC MICROBIAL ECOLOGYAquat Microb Ecol
Vol. 53: 307–321, 2008doi: 10.3354/ame01251
Printed December 2008Published online December 11, 2008
INTRODUCTION
A challenging goal of microbial oceanography is tounderstand the role of organic matter and its inter-actions with microorganisms in the functioning ofmarine ecosystems. Marine organic matter exhibitsgreat variations in its sources and characteristics, suchas biodegradability, charge, chemical composition,microbial colonization, density, molecular weight, opti-cal characteristics, size, shape, stickiness and viscosity.Further, the organic matter can undergo biological,chemical and physical transformations while also par-ticipating in oceanic biogeochemical processes (Isao etal. 1990, Passow & Alldredge 1994, Aluwihare et al.1997, Chin et al. 1998, Azam & Worden 2004, Orellanaet al. 2007). These processes include the cycling of car-bon, nutrients and trace metals, carbon flux to the deepocean, bloom dynamics, and the formation and dissolu-tion of organic matter mediated by microbial activities.
Marine organic matter is often divided operationallybetween dissolved organic matter (DOM) and particu-late organic matter (POM) on the basis of filterabilitythrough 0.45 to 1.7 µm pore size filters. The POM com-ponents have been characterized by microscopicobservations and the binding specificity of severalstains (Mostajir et al. 1995, Long & Azam 1996,Johnsen et al. 2000). For example, the production oftransparent exopolymer particles (TEP) has beenattributed to phytoplankton, notably diatoms. TEP maybe chemically complex, have a wide range of sizes andmorphologies and may be created and modified by amyriad of biological, chemical and physical inter-actions (Alldredge et al. 1993). TEP may also be colo-nized by bacteria, presumably serving as a niche forthem, but it may also be modified by bacterial activities(Verdugo et al. 2004, Azam & Malfatti 2007). Bacte-ria–organic matter interactions at nanometer to milli-meter scales may play a role in microbial loop dynam-
© Inter-Research 2008 · www.int-res.com*Email: [email protected]
A new class of transparent organic particles in seawater visualized by a novel fluorescence approach
Ty J. Samo*, Francesca Malfatti, Farooq Azam
Marine Biology Research Division, Scripps Institution of Oceanography, University of California San Diego, La Jolla,California 92093, USA
ABSTRACT: A method for visualizing transparent material in seawater, described here, has led to thediscovery of novel particles. The protocol is based on Alcian Blue and SYBR Gold staining of seawatersamples on polycarbonate filters. While the particles detected by our method may have some overlapwith previously described transparent exopolymer particles and Coomassie stained particles, theseparticles largely comprise a previously undetected class. We propose that the particles are detectedbecause they cause spatially explicit inhibition of Alcian Blue quenching of SYBR Gold fluorescenceof the filter. Samples collected from various locations (Ellen Browning Scripps Memorial Pier, Califor-nia, the Palmer Peninsula, Antarctica, and Point Conception, California) revealed particles withabundances on the order of 10 and 105 l–1 and ranging in size from 10 to 105 µm2. The particles var-ied in the types of organisms attached, the internal structure and probable biological sources. Fieldobservations and laboratory experimental manipulations suggest varied sources and mechanisms offormation. These particles are potential hot spots of organic matter, microbial diversity and interac-tions, and, depending on their size and sinking rates, serve as conduits for carbon export to theocean’s interior.
KEY WORDS: Transparent organic particles · Seawater · Alcian Blue · SYBR Gold fluorescence-based visualization
Resale or republication not permitted without written consent of the publisher

!
!
19
!!!
Aquat Microb Ecol 53: 307–321, 2008
ics, affect carbon fluxes and the biological pump andinfluence ecosystem functioning (Azam & Long 2001,Long & Azam 2001, Simon et al. 2002, DeLong & Karl2005). Microbiological studies have yielded insightson the relationship between organic matter and theroles microbes play in structuring the organic matter intheir microenvironments through release, uptake anddegradation of organic matter (Smith et al. 1995,Aluwihare & Repeta 1999, Radic et al. 2006). It is,therefore, important to know the in situ microscalecharacteristics of organic matter and the mechanismsof its formation and degradation, as context for under-standing how the biochemical interactions of bacteriawith organic matter influence their ecology and thefunctioning of marine ecosystems.
Imaging of bacteria and the organic matter in theirmicroenvironment is becoming tractable with theadvent of sensitive labeling and optical techniques.Thus, the proverbial drop of seawater may soon beobserved from the microbial point of view. Just as theuse of fluorescent DNA stains enabled visualization ofmarine bacteria, so too have certain dyes been appliedto seawater to attain glimpses of their microscale en-vironments. TEP is made visible by staining withAlcian Blue (Alldredge et al. 1993) and proteinaceousparticles in seawater are visualized with CoomassieBlue (Coomassie stained particles [CSP]; Long & Azam1996). The current techniques, in conjunction with 4’-6-diamidino-2-phenylindole (DAPI) to stain microbes,suggest that transparent polymeric and suprapoly-meric loci of organic matter represent environments inwhich viruses, prokaryotes and eukaryotes arebrought into close contact (Proctor & Fuhrman 1991).These observations have led to the concept thatorganic matter in seawater occurs as a heterogeneouscontinuum ranging in size from nanometers to milli-meters (Azam et al. 1993, Verdugo et al. 2004), and theproposal that such environmental heterogeneity isimportant in microbial ecology, diversity and biogeo-chemistry (Long & Azam 2001, Kiørboe et al. 2003,Grossart et al. 2006, Azam & Malfatti 2007).
The current staining methods, however, do not stainlipid, cationic or uncharged polysaccharide, DNA orhumic acids, materials that may also be important com-ponents of the transparent particle field. Further, someparticles may be too small to be discerned by opticalmicroscopy. Using transmission electron microscopyWells & Goldberg (1991) discovered highly abundant(108 to 109 ml–1) colloids from 20 nm to hundreds ofnanometers in size. We made a number of unsuccessfulattempts to constrain the hypothesis that the currentlyvisualized organic matter is but a minor fraction of theorganic matter continuum. Based on the results of pos-itive controls, we hypothesized that many componentsof transparent organic matter are too dilute to visualize
by the current protocols. We found that a protocol com-bining prolonged staining with Alcian Blue followedby staining with SYBR Gold revealed a new populationof particles not seen by previous methods. On the basisof their general appearance and proposed mechanismof visualization, we have named them filter fluorescingparticles (FFP). These particles provide new insightsinto our view of the microbial world and microbialbiogeochemical functions.
MATERIALS AND METHODS
Sampling and staining. Seawater was sampled witha polycarbonate flask from Ellen Browning ScrippsMemorial Pier (Scripps Pier), La Jolla, California(32° 52.02’ N, 117° 15.43’ W), USA, at ~1 m depth. Wa-ter was also collected during cruises via deployment ofa CTD rosette at depths up to 750 m. Samples wereprocessed within 10 to 120 min, or stored at in situ tem-perature until used, and fixed with formaldehyde (2%final concentration) unless otherwise noted. Samples, 2to 120 ml in volume, were filtered through white 0.22or 1 µm pore size polycarbonate filters (at !20 kPa) un-til no liquid remained, then stained with 0.5 ml of1" Alcian Blue for 30 s. Suction was re-applied to filterthe stain. Alcian Blue was prepared as an aqueous so-lution containing 0.04% Alcian Blue (w/v) plus 0.12%acetic acid (v/v) in Milli-Q water and diluted 2" and fil-tered (0.22 µm) before use. The filter was then placedon 80 µl of 1" or 5" SYBR Gold (Invitrogen) that wasfirst prepared and filtered (0.22 µm) with Millli-Q wa-ter or seawater. Staining times ranged from 3 to20 min. Filters were then dried on paper towels andmounted on glass slides with Resolve® immersion oil.
Visualization. Samples were examined with anOlympus IX-71 inverted microscope at 200", 600", and1000" magnifications using transmitted light or epiflu-orescence illumination (excitation: 488 nm; emission:long pass filter). Depending on sample location, sec-onds to minutes were needed to find a fluorescing par-ticle. Cyto-Clear slides (GE Osmonics) were placed ontop of the sample slides to allow visualization in trans-mitted light. Images were recorded with an OlympusMicrofire digital camera using PictureFrame software.Additionally, some filters were observed at 1000" mag-nification with a Nikon laser scanning confocal micro-scope. Images were obtained using using EZCI soft-ware coupled to 488 and 543 nm excitation lasers withbroad green and red emission filters.
Counting and sizing. Abundance and size of theparticles were determined at 600" magnification. Fortyrandom fields were visualized on each filter and theparticles in a 10 " 10 ocular grid or the entire field ofview were counted and sized (with the ocular grid).
308
! 20
!
Samo et al.: Transparent organic particles in seawater
Samples with very low abundance of particles werecounted in transects across one-half or a whole filter.Areas were calculated by measuring length and widthto the nearest one-quarter ocular grid square.
Blanks. Negative controls were prepared to deter-mine the potential for SYBR Gold-mediated aggrega-tion of ambient dissolved macromolecules. These con-trols included the standard Alcian Blue and SYBR Goldstaining of the following 10 ml samples: (1) freshly pre-pared and sterilized ZoBell media diluted to 1/1000and 1/10 000 concentrations; (2) supernatant takenfrom 13 ml of whole seawater centrifuged at 16 000 ! gfor 10 min; and (3) filtrate from whole seawater passedthrough a 0.22 µm filter. To mirror the treatment ofnatural samples, formaldehyde was added to each con-trol to a final concentration of 2%. Finally, 10 ml ofunmanipulated, whole seawater used for the filtrateand centrifugation blanks was fixed and stained.
Additional manipulations and staining protocols weredeveloped to fully illustrate that these structures did notresult from an interaction between SYBR Gold and mol-ecules in natural seawater samples. We collected four10 ml seawater samples from the Scripps Pier. Thesewere 0.2 µm filtered and fixed with 0.02 µm filteredformaldehyde (2% final concentration). Approximately450 ml of extra 0.2 µm filtered seawater was then cycledthrough a 100 kDa tangential flow filtration column un-til 300 ml was collected. This volume provided four 10 mlsamples, which were subsequently fixed. From eachfiltration, 2 samples were filtered and stained with thestandard protocol. The remaining 4 samples were incu-bated at room temperature with 1! SYBR Gold for15 min, filtered, stained with Alcian Blue and counted.The role of temperature in the formation of FFP was alsoinvestigated by performing the standard staining proto-col at room temperature or at 4°C. Counts were per-formed at room temperature and 4°C through the useof a cooling stage connected to the microscope.
Fixed versus unfixed samples. We prepared tripli-cate seawater samples with or without formaldehydefixation, but otherwise used the standard protocoldescribed for the samples.
Cell lysis artifacts. We considered that filtrationmight have lysed delicate phytoplankton and thatseparating the phytoplankton from the particles withgentle centrifugation might minimize cell lysis. Sea-water samples were centrifuged slowly (100 ! g), andabundance and size compared between supernatantand pellet. Conical 15 ml tubes, each containing 10 mlseawater, were centrifuged for 5 min. The top 7 ml andbottom 3 ml were filtered and stained.
Phytoplankton artifacts. Non-axenic, stationaryphase phytoplankton cultures of Thalassiosira weiss-flogii, Cylindrotheca, fusiformis, Chaetoceros gracilisand Lingulodinium polyedrum were diluted 1:100 in
0.22 µm filtered seawater, which had been autoclaved.Aliquots of 1 ml were filtered on 1 µm polycarbonatemembranes and the membrane was stained withAlcian Blue and SYBR Gold, as described previously.
Preparations of stains, filters and samples. To under-stand why and how our protocol enabled visualizationof FFP, several variations of the protocol were tested:
(1) Filter seawater; stain with SYBR Gold (0.5 ml, 1!,30 s); stain with Alcian Blue (15 min); while membranestays on the filter base.
(2) Pre-stain the filter 2! with Alcian Blue on thefilter base (1 ml, 1 min), filter, then place the filter on adrop of SYBR Gold.
(3) Pre-stain the filter 5! with 0.5 ml Alcian Blue,filter, then stain with SYBR Gold.
(4) Add SYBR Gold to seawater (1! final), incubate(10 min) then filter.
(5) Stain samples where indicated by the standardSYBR Green protocol of Noble & Fuhrman (1998).
(6) Test different filter types and pore sizes to seewhether they provide better visualization: 0.45 µmwhite cellulose filter (Micron Separations), 0.02 µmwhite AlO2 filters (Whatman), and 0.2 µm white orblack polycarbonate filters (Whatman).
(7) Test several other histological stains to seewhether they help visualize additional features: Ruthe-nium Red (0.001 and 0.02%), Crystal Violet (0.1%),and Coomassie Blue (0.04%). Filter-retained sampleswere stained with 0.5 ml for 30 s, followed by standardSYBR Gold protocol.
(8) Test whether the stained FFP could be resus-pended. Filter-retained samples (vacuum or gravityfiltered) were stained with Alcian Blue, placed on adrop of SYBR Gold for 10 min, then placed in a Petridish and vigorously rinsed (using a pipette) 10 timeswith 2 ml autoclaved 0.22 µm filtered seawater. Thesuspension was filtered and stained once again. Con-trols were prepared by omitting the seawater rinse.
(9) Subject seawater samples to several treatmentsprior to filtration and compare with controls: (1) 50 mM(final) EDTA was added to see whether disruptingdivalent cation cross-linking would disperse the FFPorganic matter; (2) Triton X-100 (1% final) was addedto seawater, which was then sonicated (full power,1 min; Sonic Dismembrator, Fisher Scientific), stainedand visualized; (3) after filtering samples, the filterswere dried (60°C, 30 min in a hybridization oven).
Characterization. We attempted to produce particlesthat might mimic the FFP by adding varying con-centrations of several types of macromolecules(DNA, lipid, protein) and hydrolytic enzymes to thefilters. Samples were then filtered and stained as inour protocol.
(1) Herring sperm DNA (D181B, Promega) wasdiluted in the following solutions: de-ionized water
309

! 21
!!!
Aquat Microb Ecol 53: 307–321, 2008
(Milli-Q) to 1 mg ml–1, 100 µg ml–1, 10 µg ml–1 and 1 µgml–1; 10% bovine serum albumin (BSA) in Milli-Qwater; 1% agarose in autoclaved 0.22 µm filtered sea-water. The solutions were spotted once on the filters,stained and visualized.
(2) BSA was added to an aliquot of agarose at 10%final concentration and DNA was prepared similarly inagarose at 10 µg ml–1. The agarose, BSA, agarose +BSA and agarose + DNA was then spotted on the filterand prepared for visualization.
(3) A spotting experiment with 2 different solutionsof phosphatidylcholine: 5 mg ml–1 in 100% ethanolthen diluted to 2.5 mg ml–1 or 50 µg ml–1 in autoclavedfiltered seawater. Then 100 µl of 5 mg ml–1 phosphat-idylcholine in ethanol was subjected to evaporation toremove the alcohol. A 1 mg ml–1 phosphatidylcholinesolution was prepared by adding 500 µl of autoclavedand filtered seawater to the remaining lipid residue.Solutions were spotted on filters, stained and visual-ized. Ethanol spots served as control.
(4) Treatments with hydrolytic enzymes were doneto infer macromolecular composition of FFP and deter-mine whether the enzymes would cause FFP to disinte-grate into smaller particles: DNase (80 U ml–1, 30 min),lipase (10 U ml–1, 20 min), pronase (5 U ml–1, 20 min)and !-glucosidase (10 U ml–1, 20 min). Samples werefiltered and stained, and the FFP were counted, sizedand compared with untreated samples.
Staining with fluorescently labeled lectins. Tetra-methylrhodamine labeled peanut agglutinin and con-canavalin A were used to target the D-galactose andboth D-glucose and D-mannose residues, respectively,in the FFP. Seawater was filtered and stained withAlcian Blue as per the protocol, but then were stainedfor 3 min with 1" SYBR Gold. The filter was placedback on the filter base and suctioned to dryness, thentransferred to a Petri dish and 100 µl of each lectin(5 µg ml–1 final concentration) was added on top.Samples were incubated in the dark for 20 min.
Nitrogen and phosphorous amendment. We con-sidered that the nutrient status of seawater couldhighlight links between the sources of FFP andmicrobial physiology and metabolism. Since phyto-plankton release large amounts of marine organiccarbon and their health is affected by inorganic nutri-ent availability, we hypothesized that a measurableFFP response would be observed following a pulse oflimiting nutrients. We added KH2PO or NH4Cl andKH2PO at 1 µM final concentrations to 1 l seawater induplicate polycarbonate bottles and incubated at14°C on a shaker at 70 rpm. Unamended seawaterwas stained and analyzed for FFP abundance anddimensions. After 10 d, a subsample was taken fromeach bottle, stained and analyzed for FFP abundanceand dimensions.
RESULTS AND DISCUSSION
Initial observations
Appearance and distribution
Seawater samples filtered on 1 µm polycarbonatemembranes and stained with Alcian Blue followed bySYBR Gold (‘standard protocol’) showed bright regionsof yellow-green fluorescence. At 600" and 1000" mag-nification they appear as fluorescent groupings of filterpores occasionally connected by mucus-like material.(Fig. 1A,B). We first observed them (July 2005) duringa Lingulodinium polyedrum bloom while testingwhether bacterial colonization of TEP previously seenby double staining with Alcian Blue plus DAPI (All-dredge et al. 1993) might be better visualized withAlcian Blue plus SYBR Gold. We have subsequentlydetected FFP in samples from Scripps Pier as well asfrom nearshore and offshore stations in the Drake Pas-sage and Bransfield Strait, Antarctica, in August 2006and waters off of Point Conception, California, duringApril 2007 (Table 1). An excellent fluorescence signalfrom the microbes was obtained in some but not allareas of the filter, and in other regions brightly fluo-rescing shapes were present and occasionally showedan association with bacteria and protozoa.
While FFP were observed in geographically separateand distinct locations, both similarities and differencesin FFP appearance were observed. Samples were visu-alized with confocal microscopy to better observethese subtle characteristics (Fig. 2). The side view ofthe particles suggested that the filter pore fluorescencedoes not extend upward and out from the surface, sup-porting an indirect staining mechanism that does notrely on binding of the stain to the particle. Inspection ofthe side views from several samples suggests that theextension of the fluorescing pores is variable, any-where from 4 to 13 µm deep. This led to the observa-tion that all of the filter pores actually display a smallamount of SYBR Gold fluorescence and can be clearlyseen by increasing the gain function of the confocalmicroscope. Most of these ‘quenched’ pores decreasein intensity and become undetectable below 6 µm intothe filter pores. In some cases it was apparent that theSYBR Gold did attach to some portion of the particleand resulted in a protrusion of a bright yellow-greenstructure. Samples from Scripps Pier could be charac-terized by brightly fluorescing material and chloro-phyll exhibiting a FFP signal while also sometimesassociating with various phytoplankton, protozoa, andbacteria (Fig. 2A). These types of FFP signals couldalso be described as fairly ‘robust’, i.e. the fluorescencewas intense and confined to a discrete area. Initialobservations would suggest that FFP from the Califor-
310

! 22
!
Samo et al.: Transparent organic particles in seawater
nia Current were similar to those from Scripps Pier.Microbial attachment and connections to other fluores-cent structures were again seen, but periodicallyshowed dissimilar morphologies andassociations. For example, a coat ofhazy fluorescence was seen aroundseemingly random FFP regions andwhen the focal plane was adjusted far-ther into the sample, the fluorescingfilter pores could then be easily dis-cerned (Fig. 2D). Antarctic FFP wererarely colonized by microbes and werenot usually seen near or containing flu-orescing material. The pore fluores-cence varied from a ‘typical’ signalobserved in all samples to bright poreslocalizing with a relatively bright filter
surface (e.g. Fig. 2G) to dim pores that seemed tobecome brighter farther within. It remains unclearwhether these differences were a result of SYBR Gold
311
Location Coordinates Environment Collection date
Scripps Pier 32° 52.02’ N, Coastal 28 Feb 2006117° 15.43’ W
Palmer Peninsula, 62° 11.93’ S, Coastal 7 Jul 2006Antarctica 58° 8.28’ W
60° 37.00’ S, Open ocean 21 Jul 200654° 37.48’ W
California Current, 34° 16.30’ N, Near shore 8 Apr 2007near Point Conception 121° 9.95’ W
33° 20.48’ N, Offshore 12 Apr 2007123° 32.07’ W
Table 1. Sampling site locations and environmental types, and collection dates
Fig. 1. (A–C) Filter fluorescing particles (FFP) in Scripps Pier seawater filtered onto 1 µm pore size polycarbonate filters and visu-alized by the staining protocol described in the text. Each fluorescing spot is a single 1 µm diameter pore that emits a bright greenSYBR Gold fluorescence signal. In addition to the roughly circular shape in (A) a wide range of shapes were observed, e.g. (B),which is a FFP associated with high concentrations of bacteria and diatoms. (C) Image of a filter prepared without Alcian Blue.(D) Abundances of FFP determined in waters off Scripps Pier periodically during January to June 2006 (dates given as DD.MM).
Magnification = 600!, scale bars = 50 µm

! 23
!
!
!
Aquat Microb Ecol 53: 307–321, 2008
binding to an organic surface film or whether the prop-erties of the particle caused some alteration in theemitted light. A combination of these explanationsmay also be plausible since the green light emittedfrom SYBR Gold stainable substances shows 2 nm dif-ferences in emission spectra (data not shown). Thus,for the FFP to be visualized, the binding target of thestain may be as important as the environment on thefilter in which it occurs. Additional observations andexperiments are required for further elucidation of themechanism of visualization.
Abundance and dimensions
Abundances from the sampled locations ranged from10 to 5 ! 105 l–1. Abundance in the water from ScrippsPier exhibited nearly 10! variability on timescales ofdays, weeks and months (Fig. 1D). FFP on the same fil-ter and among filters were dispersed randomly anddiffered in brightness and hue of the fluorescence.These differences could be due to variation in SYBRGold staining of filters or the composition of FFP.
The particles occasionally harboredattached microbes, including bacteriaand cyanobacteria, diatoms, dino-flagellates and other protists. How-ever, an approximately equal numbershowed no association with microbes.Associations with other components ofthe particulate organic matter, e.g.SYBR Gold stained material as well asTEP, was also seen.
The samples collected during cruisesin the California Current and Antarc-tica Peninsula generally showed de-creasing trends in abundance withdepth. In some samples, however,abundances reached a maximum thattends to coincide with both chlorophyllincreases and decreases in light trans-mission (Fig. 3). In these environmentswe hypothesize that the densities ofseawater and FFP may result in con-centrated patches due to settling onisopycnal surfaces. These may be sitesof enhanced remineralization by bac-teria as well as influential locales ofcarbon export brought about by abruptchanges in stratification. Cursoryassessments provide support for thisnotion, but additional and more pre-cise samplings are needed.
A variety of shapes and sizes wereobserved at 100!, 200!, 600! and
1000! magnifications. Circular, elongated and irregu-lar shapes were present in all samples, with irregular-shaped material dominating most samples. Areasranged from 1 to 105 µm2. However, it is probable thatfiltration or mounting on slides altered the shapes. Amethod is needed to image them in 3D as they occur inseawater.
Control experiments
SYBR Gold is part of a family of positively charged,asymmetrical cyanine dyes that bind to double andsingle stranded DNA and RNA targets through basepair intercalation as well as attachment to the minorgroove and phosphate backbone via ionic binding(Zipper et al. 2004). We considered that the hydro-phobicity of SYBR Gold for intercalation reactionpotentially caused aggregation of molecules at the fil-ter surface. However, the results of negative controlsdid not support this possibility. The 0.22 µm filteredseawater blanks did not exhibit any FFP, suggestingthat the particles were not due to SYBR Gold medi-
312
Fig. 2. Confocal images of FFP in seawater from (A–C) Scripps Pier, (D–F) theCalifornia Current and (G–I) Antarctica. (A,D,G) Images are scans of the surfaceof the particles and represent what would be seen if observing with regularepifluorescence microscopy. (B,E,H) Image slices taken approximately 3 µmbelow the surface. (C,F,I) Side view images of the particles obtained from a 3D
rendering of the confocal scan. Scale bars = 20 µm

! 24
!Samo et al.: Transparent organic particles in seawater
ated coalescing of <0.22 µm material. This was alsothe case for the Z/1000 and Z/10 000 samplesintended to accentuate the potential for DOM aggre-gation and represents an important observation sincedissolved carbon concentrations in these solutionswere increased by ca. 6 and 0.6 µg ml–1, respectively.The centrifuged sample showed FFP counts of 8.0 !
102 l–1 while the whole seawater sample contained1.8 ! 104 l–1.
Addition of hydrophobic exopolymer substances(EPS) isolated from a bacterial culture induces assem-bly of amphipathic DOM into small gels (~4 µm diam-eter) in a temperature dependent fashion (Ding et al.2008). The results from the 0.2 µm, tangential flow
313
Fig. 3. Seawater density, percent light transmission, chl a and FFP abundance versus depth for the (A) Antarctica shelf and (B) open ocean stations, and the California Current (C) nearshore and (D) offshore stations
! 25
!
!!
!!
Aquat Microb Ecol 53: 307–321, 2008
filtration (TFF) and temperature controlled samplessuggested that the molecular interactions described byDing et al. (2008) did not cause formation of FFP vianetworking of DOM by SYBR Gold. Particles could notbe detected in the 0.2 µm or TFF preparations, in clearcontrast to the 4.8 ! 105 l–1 found in the natural sea-water. The induction of gel formation by EPS wasinhibited at 4°C in the study of Ding et al. (2008), butwe saw no decrease in FFP at this temperature. FFPconcentrations were 1.3 ! 104 and 6.0 ! 104 l–1 for roomtemperature and 4°C treatments, respectively.
Potential experimental artifacts
Cell lysis in natural seawater
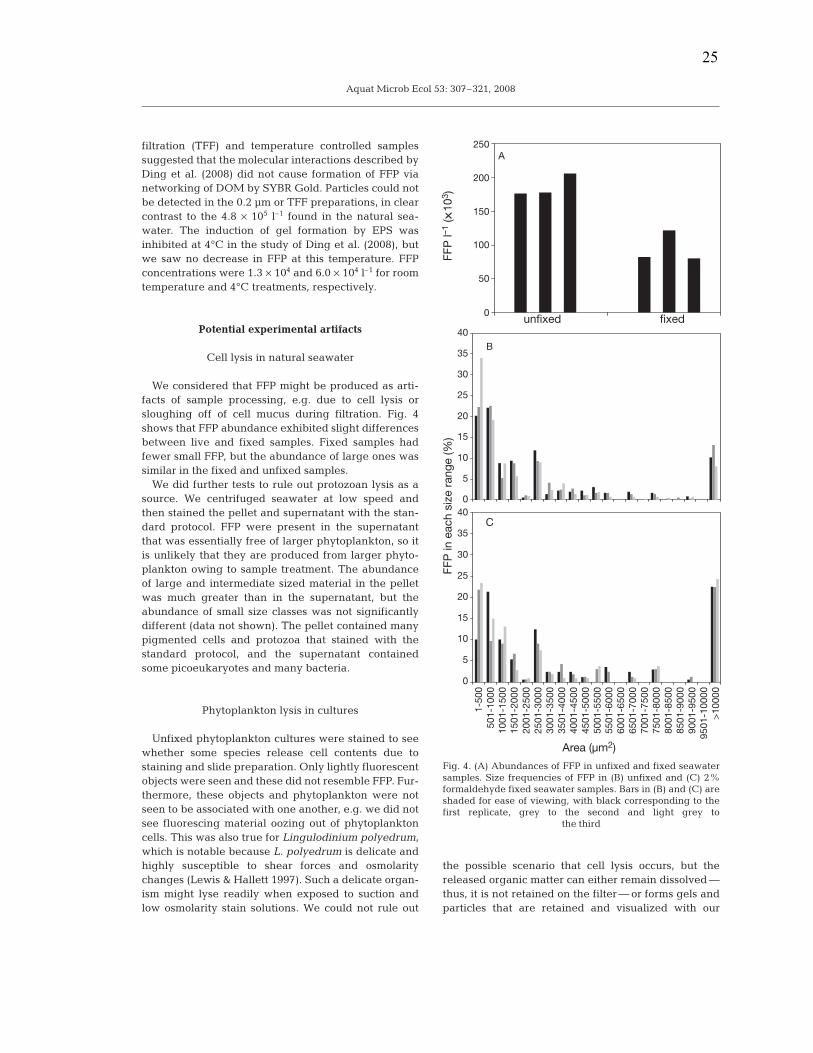
We considered that FFP might be produced as arti-facts of sample processing, e.g. due to cell lysis orsloughing off of cell mucus during filtration. Fig. 4shows that FFP abundance exhibited slight differencesbetween live and fixed samples. Fixed samples hadfewer small FFP, but the abundance of large ones wassimilar in the fixed and unfixed samples.
We did further tests to rule out protozoan lysis as asource. We centrifuged seawater at low speed andthen stained the pellet and supernatant with the stan-dard protocol. FFP were present in the supernatantthat was essentially free of larger phytoplankton, so itis unlikely that they are produced from larger phyto-plankton owing to sample treatment. The abundanceof large and intermediate sized material in the pelletwas much greater than in the supernatant, but theabundance of small size classes was not significantlydifferent (data not shown). The pellet contained manypigmented cells and protozoa that stained with thestandard protocol, and the supernatant containedsome picoeukaryotes and many bacteria.
Phytoplankton lysis in cultures
Unfixed phytoplankton cultures were stained to seewhether some species release cell contents due tostaining and slide preparation. Only lightly fluorescentobjects were seen and these did not resemble FFP. Fur-thermore, these objects and phytoplankton were notseen to be associated with one another, e.g. we did notsee fluorescing material oozing out of phytoplanktoncells. This was also true for Lingulodinium polyedrum,which is notable because L. polyedrum is delicate andhighly susceptible to shear forces and osmolaritychanges (Lewis & Hallett 1997). Such a delicate organ-ism might lyse readily when exposed to suction andlow osmolarity stain solutions. We could not rule out
the possible scenario that cell lysis occurs, but thereleased organic matter can either remain dissolved —thus, it is not retained on the filter — or forms gels andparticles that are retained and visualized with our
314
0
5
10
15
20
25
30
35
40
1-50
050
1-10
0010
01-1
500
1501
-200
020
01-2
500
2501
-300
030
01-3
500
3501
-400
040
01-4
500
4501
-500
050
01-5
500
5501
-600
060
01-6
500
6501
-700
070
01-7
500
7501
-800
080
01-8
500
8501
-900
090
01-9
500
9501
-100
00>1
0000
Area (µm2)
0
5
10
15
20
25
30
35
40
0
50
100
150
200
250
fixedunfixed
FFP
l–1
(x10
3 )FF
P in
eac
h si
ze ra
nge
(%)
B
A
C
Fig. 4. (A) Abundances of FFP in unfixed and fixed seawatersamples. Size frequencies of FFP in (B) unfixed and (C) 2%formaldehyde fixed seawater samples. Bars in (B) and (C) areshaded for ease of viewing, with black corresponding to thefirst replicate, grey to the second and light grey to
the third

! 26
!
!
!!
!!
Samo et al.: Transparent organic particles in seawater
staining protocol. Chin et al. (2004) showed thatPhaeocystis globosa secrete condensed polysaccharideparticles that swell up and form gels when releasedinto seawater.
Support for in situ occurrence
Several lines of evidence support the view that FFPexist in seawater and are not experimental artifacts.FFP were occasionally and to varying degrees colo-nized by bacteria. It is highly unlikely that bacteriamigrated to lysed contents of a cell during or immedi-ately after filtration. Close associations between FFPand non-bacteria/archaea microorganisms were alsoobserved. Individuals of Akashiwo sp. were seen aloneand in association with bacteria or FFP within the samesample. The Akashiwo sp. cells associated with FFPappeared intact and unlysed in unfixed and 2%formaldehyde fixed seawater. Intriguingly, chains ofcyanobacteria occasionally co-localized with FFP(Fig. 5), but these were not randomly distributed on thefilter. Lastly, TEP often appeared to border FFP and,thus, may be previously unseen extensions of thetransparent particle field.
Mechanism of visualization
Interactions of stains
All tested combinations of Alcian Blue plus SYBRGold yielded positive staining for FFP. Visualizationwas optimal when we filtered seawater, stained theretained material with Alcian Blue and placed the filteron a drop of SYBR Gold. Omitting Alcian Blue causedthe entire filter to fluoresce brightly and identically tothe FFP (Fig. 1C). We think that Alcian Blue quenchesthe SYBR Gold induced filter background, exceptwhere the FFP are located. Crystal Violet and Ruthe-nium Red provided similar staining results as AlcianBlue although the images were not as bright or dis-tinct. Chemical quenching by Alcian Blue seemedunlikely since the copper center and complex ringstructure of Alcian Blue is unlike both the carbon cen-tered triphenylmethane structure of Crystal Violet andthe ruthenium center and amine side chains of Ruthe-nium Red. However, all these stains caused apparentfluorescence quenching of the filter. FFP were theregions of high SYBR Gold background. What is visu-alized then are the brightly fluorescing pores of thepolycarbonate filter in the region of the FFP. Thus, wehypothesized that FFP were regions on the filter wheretransparent particles landed and prevented AlcianBlue from quenching SYBR Gold induced fluorescence
by an as yet unknown mechanism. Visualization oftransparent organic matter by our protocol is, thus, dueto inhibition of fluorescence quenching.
Particle–filter interactions
Our tests suggested that FFP could be observedbecause the transparent particles deposited on filtersprevented Alcian Blue from interacting with the filterto quench SYBR Gold fluorescence. We attempted todislodge the transparent particles from the filter withthe prediction that this would allow Alcian Blue toquench SYBR Gold fluorescence and eliminate FFPsignals. This prediction was supported. We filteredseawater by gravity and then rinsed the filter withfiltered seawater to try to dislodge the FFP. Thismanipulation did nearly eliminate FFP while manymicrobes and a few positive signals remained. How-ever, the FFP were not removed if the seawater sample(not the water used for dislodging the FFP) had beenvacuum filtered at 20 kPa, possibly because the mater-ial became pulled into the filter pores and firmlyadsorbed. This entrainment of material into the poresmay be required for Alcian Blue inhibition of SYBR
315
Fig. 5. Epifluorescent micrographs of FFP with extensive pop-ulations of associated (A) bacteria, (C) cyanobacteria and (E)Akashiwo sp. Panel (F) shows a Akashiwo cell not surroundedby an FFP signal. Panels (B) and (D) are transmitted light mi-crographs of (A) and (C), respectively, showing TEP signals
along the particle periphery. Scale bars = 50 µm

! 27
!
!
!
!!
Aquat Microb Ecol 53: 307–321, 2008
Gold fluorescence; it would coat the pores and there-fore prevent Alcian Blue interaction with the SYBRGold-stained filter surface and pores. This result isconsistent with our hypothesis that FFP are visualizeddue the inhibition of fluorescence quenching.
Influence of filters
To test whether fluorescence quenching was onlyapplicable to polycarbonate filters, we tried other filtermaterials as well. FFP were also seen with white0.22 µm polycarbonate and 0.45 µm nitrocellulosefilters and 0.02 µm aluminum oxide filters withoutAlcian Blue treatment. The 0.02 µm filters were notamenable to Alcian Blue staining and produced indis-cernible images. The black 0.22 µm polycarbonatemembranes were negative for FFP, presumably due tothe black color reducing background fluorescencerequired for visualization by fluorescence quenching.Alternatively, the black filter might have interferedwith interaction of the stains on the filter. Despite pos-itive results with several filter types, the 1 µm polycar-bonate filter gave images that were best in definitionand brightness. With the focal plane on the surface ofthe filter, the fluorescing edges of the pores contrastedwell with the non- or slightly fluorescent interior. Thepores of 1 µm polycarbonate filters permit resolution ofSYBR Gold stained microbes attached to the fluoresc-ing FFP; 0.22 µm pore size polycarbonate filter fluores-cence is so intense that it overwhelms the fluorescencesignal of the SYBR Gold stained organisms.
Seawater and filter manipulation
Gel properties
With evidence to support that filter fluorescing par-ticles were present in seawater, we asked whetherthey display gel or gel-like characteristics. Prelimi-nary experiments (results not shown) indicated thatEDTA reduced FFP abundance but not their size dis-tributions, suggesting that cationic bridges bind FFPpolymers, and their disruption caused some particlesto disperse. Other FFP may have lost some, althoughnot all, material, but maintained their definitions.Recent findings show that the integrity of marine gelsis influenced by cationic bridges in a polymer matrix,and that the gels are dispersed by EDTA (Verdugo etal. 2004). The effect of EDTA shows that FFP may becreated and maintained in a similar fashion to that ofother marine gel particles. They may be intermediatein a stepwise formation of POM from some of thesources of organic matter, going from colloid to gel to
filter fluorescing particle to marine snow. We consid-ered that if the FFP material is gel-like it would behighly hydrated, so desiccation might alter its gelcharacteristics and allow Alcian Blue to contact thefilter surface and quench fluorescence. However,attempts to dehydrate the material on the filter actu-ally increased FFP abundance. In addition, the sizedistribution of FFP increased with an increase inabundance of FFP from 5500 to >10 000 µm2 in oneexperiment. We cannot explain this result, but specu-late that dehydration changed the properties of someother types of transparent particles to confer on themthe ability to cause inhibition of fluorescence quench-ing similar to the action of FFP. Alternatively, the ini-tial entrapment of material within the filter poresbefore dehydration may have provided a source ofmolecules that, after dehydration, were capable ofthe inhibitory effect.
Triton X-100 addition followed by sonicationdecreased the abundance of total as well as large FFP.One interpretation would be that FFP are amphipathic,with hydrophobic regions holding an aggregatetogether while the hydrophilic areas are exposed towater. Alternatively, FFP may be sensitive to turbu-lence and shear.
Macromolecular characterization
In an attempt to constrain the composition, we testedhow known macromolecules added to the sampleswould appear in the standard protocol. We testedDNA, carbohydrate, protein and lipid since they areamong the major organic matter pools in marine bio-mass and DOM. Positive staining was seen with DNAat concentrations of 100 and 1 mg ml–1. Also, BSA andDNA mixed in agarose were prepared as mimics ofnatural gels. They produced fluorescence similar toFFP. Phosphatidylcholine, as a model for lipids, alsoyielded FFP-like images. Natural marine gels and par-ticles are probably mixtures of diverse macromolecules(Long & Azam 1996) so our results show that FFPimages may be due to a variety of macromoleculartypes. Further, the requirement for quite high macro-molecular concentrations suggests the possibility thatwe are still missing some transparent gels becausethey contain macromolecules at concentrations toolow to cause detectable inhibition of fluorescencequenching.
Specific hydrolytic enzymes helped further charac-terize the macromolecular makeup of FFP by theirbreakdown or solubilization. !-glucosidase caused themost apparent decrease in abundances, reducingnumbers to 65% of their total and eliminating most ofthe large size classes. DNase and pronase treatments
316

! 28
!
!
Samo et al.: Transparent organic particles in seawater
did not seem to appreciably alter size frequencies andresulted in abundances of 96 and 94% of the total,respectively. Interestingly, lipase resulted in a slightincrease in abundance (104%), but no change in sizefrequency distribution. One possibility is that lipidhydrolysis reduced hydrophobic sites and permittedagglomeration of materials at exposed hydrophilic andpolar surfaces (Fig. 6).
Assessing the presence of sugar moieties withinthe FFP via fluorescently labeled lectins providedintriguing chemical and structural information. Posi-tive signals from concavalin A indicated the presenceof glucose and/or mannose. The absence of signalco-localization with peanut agglutinin fluorescencesuggested that galactose residues were either absentin the FFP or below detection. Sugar-binding moi-eties displayed a striking interior structure of stringsand strands that varied among FFP (Fig. 7). The factthat glucose is a significant fraction of organic matterin FFP would make them a good source of energy for
the colonizing bacteria. It is noteworthy that lectinsignals always remained within the boundaries ofthe SYBR Gold fluorescence image, but in manycases did not uniformly occur over the entire FFP.Other organic polymers may occupy the lectin-negative areas.
Nitrogen and phosphorous amendment
We examined the relationship of FFP with nutrientstatus of the phytoplankton. Nutrient limited phyto-plankton may release gels, so one could predict thatphytoplankton will be found associated with FFP. Insupport of this hypothesis, we consistently noticed thatphytoplankton occurred within FFP and occasionallybacteria also colonized the FFP. We considered that ifnutrient limited phytoplankton produced mucus thatgenerated the FFP, then high rates of nutrient reminer-alization within the FFP, due to high concentrations of
317
0
10
20
30
40
50
1-50
050
1-10
0010
01-1
500
1501
-200
020
01-2
500
2501
-300
030
01-3
500
3501
-400
040
01-4
500
4501
-500
050
01-5
500
5501
-600
060
01-6
500
6501
-700
070
01-7
500
7501
-800
080
01-8
500
8501
-900
090
01-9
500
9501
-100
00>1
0000
untreated Dnase
0
10
20
30
40
50
untreated pronase E
0
10
20
30
40
50
untreated !-glucosidase
A
C
0
10
20
30
40
50
1-50
050
1-10
0010
01-1
500
1501
-200
020
01-2
500
2501
-300
030
01-3
500
3501
-400
040
01-4
500
4501
-500
050
01-5
500
5501
-600
060
01-6
500
6501
-700
070
01-7
500
7501
-800
080
01-8
500
8501
-900
090
01-9
500
9501
-100
00>1
0000
Area (µm2) Area (µm2)
untreated lipase
B
D
FFP
in e
ach
size
rang
e (%
)
Fig. 6. Size frequency charts following treatment with (A) !-glucosidase, (B) pronase, (C) DNase and (D) lipase
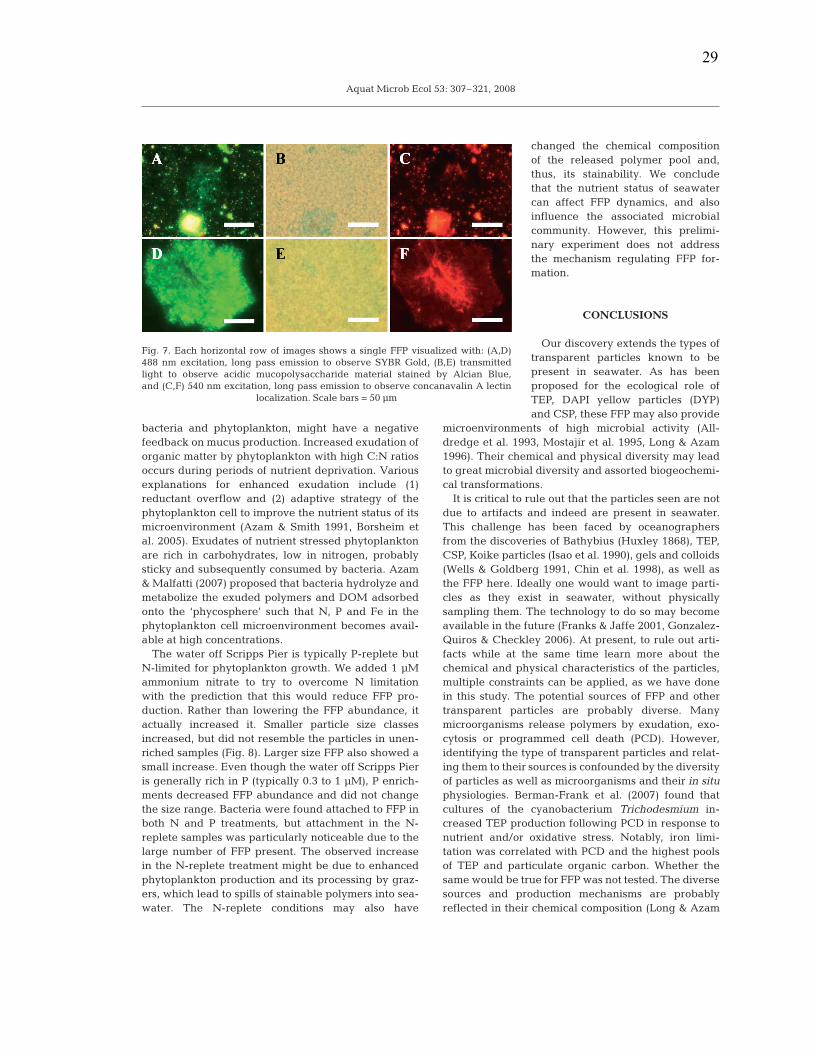
! 29
!
!
Aquat Microb Ecol 53: 307–321, 2008
bacteria and phytoplankton, might have a negativefeedback on mucus production. Increased exudation oforganic matter by phytoplankton with high C:N ratiosoccurs during periods of nutrient deprivation. Variousexplanations for enhanced exudation include (1)reductant overflow and (2) adaptive strategy of thephytoplankton cell to improve the nutrient status of itsmicroenvironment (Azam & Smith 1991, Borsheim etal. 2005). Exudates of nutrient stressed phytoplanktonare rich in carbohydrates, low in nitrogen, probablysticky and subsequently consumed by bacteria. Azam& Malfatti (2007) proposed that bacteria hydrolyze andmetabolize the exuded polymers and DOM adsorbedonto the ‘phycosphere’ such that N, P and Fe in thephytoplankton cell microenvironment becomes avail-able at high concentrations.
The water off Scripps Pier is typically P-replete butN-limited for phytoplankton growth. We added 1 µMammonium nitrate to try to overcome N limitationwith the prediction that this would reduce FFP pro-duction. Rather than lowering the FFP abundance, itactually increased it. Smaller particle size classesincreased, but did not resemble the particles in unen-riched samples (Fig. 8). Larger size FFP also showed asmall increase. Even though the water off Scripps Pieris generally rich in P (typically 0.3 to 1 µM), P enrich-ments decreased FFP abundance and did not changethe size range. Bacteria were found attached to FFP inboth N and P treatments, but attachment in the N-replete samples was particularly noticeable due to thelarge number of FFP present. The observed increasein the N-replete treatment might be due to enhancedphytoplankton production and its processing by graz-ers, which lead to spills of stainable polymers into sea-water. The N-replete conditions may also have
changed the chemical compositionof the released polymer pool and,thus, its stainability. We concludethat the nutrient status of seawatercan affect FFP dynamics, and alsoinfluence the associated microbialcommunity. However, this prelimi-nary experiment does not addressthe mechanism regulating FFP for-mation.
CONCLUSIONS
Our discovery extends the types oftransparent particles known to bepresent in seawater. As has beenproposed for the ecological role ofTEP, DAPI yellow particles (DYP)and CSP, these FFP may also provide
microenvironments of high microbial activity (All-dredge et al. 1993, Mostajir et al. 1995, Long & Azam1996). Their chemical and physical diversity may leadto great microbial diversity and assorted biogeochemi-cal transformations.
It is critical to rule out that the particles seen are notdue to artifacts and indeed are present in seawater.This challenge has been faced by oceanographersfrom the discoveries of Bathybius (Huxley 1868), TEP,CSP, Koike particles (Isao et al. 1990), gels and colloids(Wells & Goldberg 1991, Chin et al. 1998), as well asthe FFP here. Ideally one would want to image parti-cles as they exist in seawater, without physicallysampling them. The technology to do so may becomeavailable in the future (Franks & Jaffe 2001, Gonzalez-Quiros & Checkley 2006). At present, to rule out arti-facts while at the same time learn more about thechemical and physical characteristics of the particles,multiple constraints can be applied, as we have donein this study. The potential sources of FFP and othertransparent particles are probably diverse. Manymicroorganisms release polymers by exudation, exo-cytosis or programmed cell death (PCD). However,identifying the type of transparent particles and relat-ing them to their sources is confounded by the diversityof particles as well as microorganisms and their in situphysiologies. Berman-Frank et al. (2007) found thatcultures of the cyanobacterium Trichodesmium in-creased TEP production following PCD in response tonutrient and/or oxidative stress. Notably, iron limi-tation was correlated with PCD and the highest poolsof TEP and particulate organic carbon. Whether thesame would be true for FFP was not tested. The diversesources and production mechanisms are probablyreflected in their chemical composition (Long & Azam
318
Fig. 7. Each horizontal row of images shows a single FFP visualized with: (A,D)488 nm excitation, long pass emission to observe SYBR Gold, (B,E) transmittedlight to observe acidic mucopolysaccharide material stained by Alcian Blue,and (C,F) 540 nm excitation, long pass emission to observe concanavalin A lectin
localization. Scale bars = 50 µm

! 30
!Samo et al.: Transparent organic particles in seawater
1996, Passow 2002, Verdugo et al. 2004). Our resultsindicate that a variety of macromolecules — carbohy-drates, DNA, lipids and proteins — can elicit positivesignals in our protocol. It would be of interest to seewhether the standard Alcian Blue/SYBR Gold protocolmay also be applied to staining for other types of trans-parent particles and sources.
If we consider that FFP and other transparent parti-cles behave in a fashion similar to polymer gels, thenlocal changes in the chemistry of seawater will resultin shrinking and swelling of the material. The effects ofpressure, temperature and pollutants may cause agel to become a highly compact and dense structure,capable of excluding or entrapping anything lessthan 500 Da (Chin et al. 1998). Alcian Blue has anatomic weight of approximately 1200 Da, and it mayfollow that the use of histological stains greater than1200 Da will permit staining of more diffuse and/orporous particles. Observing this material and associ-
ated microbes may aid in linking microbial physiologyand diversity to the state of the organic matter fieldin seawater. This may be especially important inunderstanding carbon export and the fates of organicparticles.
Whether some dissolved polymers, colloids and gelsmight sink out of the euphotic zone will depend onmany factors, such as the speed and degree of sub-strate hydrolysis, the chemical composition and sticki-ness of the material, the consortia of organisms presentand the local physical and chemical characteristics ofthe water column, and whether respiration will convertmost of the fixed carbon back to its oxidized state. Acommon theme among these parameters is the pheno-menon of aggregation and its relation to export flux,with implications for global climate. As a particle ishydrolyzed and colonized by the microbial communityand comes into contact with other particles and mole-cules, the resulting changes in density may have direct
319
0
100
200
300
400
500
600
700
Day 0
Day 10 KH 2PO 4 #
1
Day 10 NH 4CI +
KH 2PO 4 #
1
Day 10 NH 4CI +
KH 2PO 4 #
2
Day 10 KH 2PO 4 #
2
FFP
l–1
(x10
3 )
0
10
20
30
40
50
60
1-50
050
1-10
0010
01-1
500
1501
-200
020
01-2
500
2501
-300
030
01-3
500
3501
-400
040
01-4
500
4501
-500
050
01-5
500
5501
-600
060
01-6
500
6501
-700
070
01-7
500
7501
-800
080
01-8
500
8501
-900
090
01-9
500
9501
-100
00>1
0000
Area (µm2)
Area (µm2)Area (µm2)
0
10
20
30
40
50
60
1-50
050
1-10
0010
01-1
500
1501
-200
020
01-2
500
2501
-300
030
01-3
500
3501
-400
040
01-4
500
4501
-500
050
01-5
500
5501
-600
060
01-6
500
6501
-700
070
01-7
500
7501
-800
080
01-8
500
8501
-900
090
01-9
500
9501
-100
00>1
0000
#1 #2 #1 #2
0
10
20
30
40
50
60
1-50
050
1-10
0010
01-1
500
1501
-200
020
01-2
500
2501
-300
030
01-3
500
3501
-400
040
01-4
500
4501
-500
050
01-5
500
5501
-600
060
01-6
500
6501
-700
070
01-7
500
7501
-800
080
01-8
500
8501
-900
090
01-9
500
9501
-100
00>1
0000
A
DC
BFF
P in
eac
h si
ze r
ange
(%)
FFP
in e
ach
size
ran
ge (%
)FF
P in
eac
h si
ze r
ange
(%)
Fig. 8. (A) Abundances at Days 0 and 10 with and without amendments. Size frequencies of FFP at (B) Day 0, (C) Day 10 followingamendment with phosphorus and (D) Day 10 following amendment with nitrogen plus phosphorus. Black and gray bars in (C)
and (D) display the first and second replicates, respectively
! 31
!
!
Aquat Microb Ecol 53: 307–321, 2008
connections to carbon export. However, it is currentlyunclear whether the net biological, chemical andphysical effects enable carbon drawdown. These pro-cesses are not necessarily limited to microscale envi-ronments, as a variety of metazoans may also signifi-cantly affect the particulate carbon pool. The copepodCalanus pacficus consumes significant amounts of TEPunder starved and diatom-replete conditions (Ling &Alldredge 2003). FFP may represent another pathwayby which higher trophic levels are able to consumeviruses, prokaryotes and small eukaryotes located onor within the organic matrix. Further characterizationof marine organic matter, its interactions with marinemicrobes and its behavior in a microecological frame-work would advance our knowledge of the mecha-nisms operating at the microscale that contribute tooceanic biogeochemical cycles.
Acknowledgements. This research was supported by grantsfrom the US-NSF (OCE04-28900 and ANT04-44134) and theGordon and Betty Moore Foundation to F.A. Additional sup-port was provided by US-NSF funding for the California Cur-rent Ecosystem Long Term Ecological Research (CCE-LTER)to Dr. M. D. Ohman (OCE04-17616). We thank the Captainsand crews of the RV/IB ‘Nathaniel B. Palmer and R/V ThomasG. Thompson’ for excellent shipboard support. We appreci-ate the assistance of J. V. Nguyen and Drs. M. Manganelli andJ. R. Ward in sample collection.
LITERATURE CITED
Alldredge AL, Passow U, Logan BE (1993) The abundanceand significance of a class of large, transparent organicparticles in the ocean. Deep-Sea Res I 40:1131–1140
Aluwihare LI, Repeta DJ (1999) A comparison of the chemicalcharacteristics of oceanic DOM and extracellular DOMproduced by marine algae. Mar Ecol Prog Ser186:105–117
Aluwihare LI, Repeta DJ, Chen RF (1997) A major biopoly-meric component to dissolved organic carbon in surfacesea water. Nature 387:166–169
Azam F, Long RA (2001) Oceanography: sea snow micro-cosms. Nature 414:495–498
Azam F, Malfatti F (2007) Microbial structuring of marineecosystems. Nat Rev Microbiol 5:782–791
Azam F, Smith DC (1991) Bacterial influence on the variabil-ity in the ocean’s biogeochemical state: a mechanisticview. In: Demers S (ed) Particle analysis in oceanography,Vol 27. Springer-Verlag, Berlin, p 213–236
Azam F, Worden AZ (2004) Microbes, molecules, and marineecosystems. Science 303:1622–1624
Azam F, Martinez J, Smith DC (1993) Bacteria-organic mattercoupling on marine aggregates. In: Guerrero R, Pedrós-Alió C (eds) Trends in microbial ecology. Spanish Societyfor Microbiology, Barcelona, p 410–414
Berman-Frank I, Rosenberg G, Levitan O, Haramaty L, MariX (2007) Coupling between autocatalytic cell death andtransparent exopolymeric particle production in themarine cyanobacterium Trichodesmium. Environ Micro-biol 9:1415–1422
Borsheim KY, Vadstein O, Myklestad SM, Reinertsen H,
Kirkvold S, Olsen Y (2005) Photosynthetic algal produc-tion, accumulation and release of phytoplankton storagecarbohydrates and bacterial production in a gradient indaily nutrient supply. J Plankton Res 27:743–755
Chin WC, Orellana MV, Verdugo P (1998) Spontaneousassembly of marine dissolved organic matter into polymergels. Nature 391:568–572
Chin WC, Orellana MV, Quesada I, Verdugo P (2004) Secre-tion in unicellular marine phytoplankton: demonstrationof regulated exocytosis in Phaeocystis globosa. Plant CellPhysiol 45:535–542
DeLong EF, Karl DM (2005) Genomic perspectives in micro-bial oceanography. Nature 437:336–342
Ding YX, Chin WC, Rodriguez A, Hung CC, Santschi PH,Verdugo P (2008) Amphiphilic exopolymers from Sagittulastellata induce DOM self-assembly and formation ofmarine microgels. Mar Chem 112:11–19
Franks PJS, Jaffe JS (2001) Microscale distributions of phyto-plankton: initial results from a two-dimensional imagingfluorometer, OSST. Mar Ecol Prog Ser 220:59–72
Gonzalez-Quiros R, Checkley DM (2006) Occurrence of frag-ile particles inferred from optical plankton counters usedin situ and to analyze net samples collected simultane-ously. J Geophys Res-Oceans 111:C05S06
Grossart HP, Kiorboe T, Tang KW, Allgaier M, Yam EM, PlougH (2006) Interactions between marine snow and hetero-trophic bacteria: aggregate formation and microbialdynamics. Aquat Microb Ecol 42:19–26
Huxley TH (1868) On some organisms living at great depthsin the North Atlantic Ocean. Q J Microsc Sci 8:203–212
Isao K, Hara S, Terauchi K, Kogure K (1990) Role of sub-micrometre particles in the ocean. Nature 345:242–244
Johnsen AR, Hausner M, Schnell A, Wuertz S (2000) Evalu-ation of fluorescently labeled lectins for noninvasivelocalization of extracellular polymeric substances inSphingomonas biofilms. Appl Environ Microbiol 66:3487–3491
Kiørboe T, Tang K, Grossart HP, Ploug H (2003) Dynamics ofmicrobial communities on marine snow aggregates: colo-nization, growth, detachment, and grazing mortality ofattached bacteria. Appl Environ Microbiol 69: 3036–3047
Lewis J, Hallett R (1997) Lingulodinium polyedrum a bloom-ing dinoflagellate. In: Ansell AD, Gibson RN, Barnes M(eds) Oceanography and marine biology: an annualreview, Vol 35. UCL Press, London, p 97–161
Ling SC, Alldredge AL (2003) Does the marine copepodCalanus pacificus consume transparent exopolymer parti-cles (TEP)? J Plankton Res 25:507–515
Long RA, Azam F (1996) Abundant protein-containing parti-cles in the sea. Aquat Microb Ecol 10:213–221
Long RA, Azam F (2001) Microscale patchiness of bacterio-plankton assemblage richness in seawater. Aquat MicrobEcol 26:103–113
Mostajir B, Dolan JR, Rassoulzadegan F (1995) Seasonal vari-ations of pico- and nano-detrital particles (DAPI YellowParticles, DYP) in the Ligurian Sea (NW Mediterranean).Aquat Microb Ecol 9:267–277
Noble RT, Fuhrman JA (1998) Use of SYBR Green I for rapidepifluorescence counts of marine viruses and bacteria.Aquat Microb Ecol 14:113–118
Orellana MV, Petersen TW, Diercks AH, Donohoe S, VerdugoP, van den Engh G (2007) Marine microgels: optical andproteomic fingerprints. Mar Chem 105:229–239
Passow U (2002) Production of transparent exopolymer parti-cles (TEP) by phyto- and bacterioplankton. Mar Ecol ProgSer 236:1–12
Passow U, Alldredge AL (1994) Distribution, size and bacter-
320

! 32
!
!!!!!!!!!!!!!!!!!!
Samo et al.: Transparent organic particles in seawater
ial-colonization of transparent exopolymer particles (TEP)in the Ocean. Mar Ecol Prog Ser 113: 185–198
Proctor LM, Fuhrman JA (1991) Roles of viral infection inorganic particle flux. Mar Ecol Prog Ser 69:133–142
Radic T, Ivancic I, Fuks D, Radic J (2006) Marine bacterio-plankton production of polysaccharidic and proteinaceousparticles under different nutrient regimes. FEMS Micro-biol Ecol 58:333–342
Simon M, Grossart HP, Schweitzer B, Ploug H (2002) Micro-bial ecology of organic aggregates in aquatic ecosystems.Aquat Microb Ecol 28:175–211
Smith DC, Steward GF, Long RA, Azam F (1995) Bacterial
mediation of carbon fluxes during a diatom bloom in amesocosm. Deep-Sea Res II 42:75–97
Verdugo P, Alldredge AL, Azam F, Kirchman DL, Passow U,Santschi PH (2004) The oceanic gel phase: a bridge in theDOM–POM continuum. Mar Chem 92:67–85
Wells ML, Goldberg ED (1991) Occurrence of small colloids insea-water. Nature 353:342–344
Zipper H, Brunner H, Bernhagen J, Vitzthum F (2004) In-vestigations on DNA intercalation and surface bindingby SYBR Green I, its structure determination and meth-odological implications. Nucleic Acids Res 32:e103,doi:10.1093/nar/gnh101
321
Editorial responsibility: Craig Carlson,Santa Barbara, California, USA
Submitted: March 4, 2008; Accepted: September 23, 2008Proofs received from author(s): December 12, 2008

! 33
Chapter!3
Microbial distribution and activity across a water mass frontal zone in the California Current Ecosystem

!
!
34
!!!!!!!!!!!!!!
Microbial distribution and activity acrossa water mass frontal zone in theCalifornia Current Ecosystem
TY J. SAMO*, BYRON E. PEDLER, GREGORY I. BALL, ALEXIS L. PASULKA, ANDREW G. TAYLOR, LIHINI I. ALUWIHARE,FAROOQ AZAM, RALF GOERICKE AND MICHAEL R. LANDRY
SCRIPPS INSTITUTION OF OCEANOGRAPHY, UNIVERSITY OF CALIFORNIA, SAN DIEGO, LA JOLLA, CA 92093-0202, USA
*CORRESPONDING AUTHOR: [email protected]
Received November 4, 2011; accepted in principle May 24, 2012; accepted for publication June 2, 2012
Corresponding editor: John Dolan
Ocean fronts with accumulated biomass and organic matter may be significantsites of enhanced microbial activity. We sampled a frontal region (the A-Front) sep-arating oligotrophic and mesotrophic water masses within the California CurrentEcosystem (CCE) to assess the influence of frontal hydrography on several micro-bial parameters. Samples for heterotrophic bacterial, viral and flagellate abun-dance, dissolved and particulate carbon and nitrogen, transparent particles andbacterial carbon production were collected at 6 depths from the surface to 100 mwith 5–9 conductivity/temperature/depth casts along a 26-km northerly transectacross the front. Relative to adjacent oligotrophic and mesotrophic waters, thefrontal transition displayed peaks in the mean estimates of cell-specific bacterialcarbon and bulk bacterial production, particulate organic carbon and particulateorganic nitrogen concentrations, and the abundance and size of transparent parti-cles. Bacterial carbon production increased !5-fold northward from oligotrophicwaters to the frontal zone, in agreement with an increase in the frequency of divid-ing cells, but bacterial abundance was lower than at adjacent stations. This maybe partially explained by high chlorophyll, elevated virus:bacteria ratios and lownanoflagellate grazer abundance at the front. Our data suggest that CCE frontscan facilitate intense biological transformation and physical transport of organicmatter, in sharp contrast to adjacent low productivity waters, and harbor dynamicmicrobial populations that influence nutrient cycling.
KEYWORDS: bacteria flagellates; viruses; organic matter biogeochemistry;A-Front California Current
I N T RO D U C T I O N
The California Current Ecosystem (CCE) is a seasonal-ly dynamic region that contains oligotrophic offshoreand highly productive coastal environments. Easternboundary currents and wind-driven upwelling eventscombine with the current divergence near PointConception, California, creating distinct water masses
that extend southward (Bray et al., 1999; Rykaczewskiand Checkley, 2008). As these cold, mesotrophic waterparcels contact warmer oligotrophic waters offshore ofthe Southern California Bight, frontal zones with sharpgradients and filaments of sea surface temperature(SST) and chlorophyll often form at the junction, exhi-biting variable spatiotemporal frequencies controlled by
doi:10.1093/plankt/fbs048, available online at www.plankt.oxfordjournals.org. Advance Access publication June 29, 2012
# The Author 2012. Published by Oxford University Press. All rights reserved. For permissions, please email: [email protected]
JOURNAL OF PLANKTON RESEARCH j VOLUME 34 j NUMBER 9 j PAGES 802–814 j 2012!

!
!
35
!!!!!!!!!!!!!!!!!!!!!!!!!!
local forcings and temperature gradients (Kahru et al.,2012).
Driven by primary and secondary circulation fromgeostrophic and ageostrophic processes (Franks, 1992;Claustre et al., 1994), the confluence of water masses atfronts can result in fertilization and horizontal advec-tion. This can lead to the growth and accumulation ofplankton at fronts or within frontal jets. Responses ofmicrobial communities can vary, underscoring the im-portance of physical features in biological processes.Studies in the southwestern Mediterranean Sea exam-ined the effects of the Almeria-Oran geostrophic frontin the eastern Alboran Sea (Prieur and Sournia, 1994).Frontal zones were characterized by elevated primaryproduction rates and diatom-dominated communities(Fiala et al., 1994), enhanced bacterial carbon produc-tion (BCP) (Fernandez et al., 1994) and increases in par-ticle export (Peinert and Miquel, 1994). In thesubtropical convergence zone of the Sargasso Sea,enhanced nutrient fluxes across the transition zone ledto increased chlorophyll a (chl a), though without a con-comitant heterotrophic bacterial response (Riemannet al., 2011). Mesoscale blooms of phytoplankton havealso been attributed to upwelling at fronts in the north-ern CCE (Pallas-Sanz et al., 2010). Others have exam-ined the influence of cyclonic and anticyclonic eddieson primary and secondary production (Ducklow andHill, 1985; Falkowski et al., 1991; Ewart et al., 2008).Consistently, the injection of inorganic nutrients stimu-lated phytoplankton growth, resulting in biomass andorganic matter accumulation relative to adjacent waters.
Dissolved organic matter (DOM) produced by phyto-plankton and other microorganisms is important inmarine biogeochemical cycles and climate regulation(Aluwihare and Repeta, 1999; Raven and Falkowski,1999; Azam and Malfatti, 2007). The biogeochemicalfate of DOM is largely regulated by the heterotrophicactivity of marine prokaryotes (bacteria and archaea,here collectively called “bacteria”) (Hagstrom et al.,1984). The efficiency with which bacteria utilize theDOM of varied quality to create new biomass or, alter-natively, respire carbon, ultimately determines the rela-tive partitioning of carbon into labile, semi-labile andrefractory organic matter classes, influencing globalocean–atmosphere carbon dioxide (CO2) exchange andcarbon export (del Giorgio and Cole, 1998). These pro-cesses influence carbon export via the biological pumpoperating through the microbial loop (Azam et al.,1983; Martin et al., 1994; Karl et al., 1998).
Studies on the roles of microbes in carbon cycling atoceanic fronts have shed light on the role of hydrog-raphy in regulating the metabolism and growth ofphotoautotrophic and heterotrophic microbes. Nutrient
injections in frontal zones, as well as meso- and subme-soscale instabilities, often support enhanced bacterialproduction due to increased primary production bylarger phytoplankton (Videau et al., 1994; Moran et al.,2001), but the mechanisms are not clear. Alternatively,fronts can support a food web characterized by abun-dant picophytoplankton where elevated bacterial pro-duction may be due at least in part to the release oftop-down grazer control modulated by flagellates(Heinanen et al., 1995). Such variability in bottom-upversus top-down control of marine bacterial populationsat frontal zones has also been observed at theAlmeria-Oran front (Van Wambeke et al., 2004), andthe relative contributions of these two mechanisms tomicrobial ecological dynamics in the Mediterraneanregion was found to differ between oligotrophic, frontaland gyre systems. Such interactions between hydro-dynamics and biological responses are likely to deter-mine the extent to which bacteria, phytoplankton andorganic matter impact local food webs as well as theCO2 exchange with the atmosphere (Sempere et al.,2003).
The microbial influences on carbon cycling at frontalzones have not been well studied in the CCE, nor has abaseline of microbial activities or abundance withinthese features been established in this region. As a com-ponent of the California Current Ecosystem—LongTerm Ecological Research (CCE-LTER) site, we investi-gated a frontal boundary, designated the A-Front,between abutting oligotrophic and mesotrophic watermasses to assess patterns, gradients and implications ofmicrobially mediated carbon cycling. The results arediscussed within the comprehensive ecosystem contextof this CCE-LTER study.
M E T H O D
We sampled a 26-km transect of nine stations across adeep water front (Landry, Ohman et al., 2012; Ohmanet al., 2012) located 350 km west of San Diego in thesouthern CCE (Fig. 1). All samples were collected during24–25 October 2008 over a 9 h period at night (21:30–05:00, local time) with Niskin bottles on a conductivity/temperature/depth (CTD) rosette. Based on satelliteimages of the SST and chl a, hydrography, nutrients andbiological parameters, stations 1–3 were located on theoligotrophic side of the front, stations 4 and 5 were desig-nated frontal and stations 6–9 were on the mesotrophicside. Unless otherwise noted, microbial variables weremeasured from 0 to 100 m depths at stations 1, 3, 5, 7and 9. Data for temperature, salinity and density were
T. J. SAMO ET AL. j MICROBIAL DISTRIBUTION AND ACTIVITY ACROSS A FRONT IN THE CCE
803!

!
!
36
!!!!!!!!!!!!!!!!!!!!!!!!!!
obtained from the shipboard CTD package (Sea-BirdElectronics, Inc., Bellevue, WA, USA).
Bacterial abundance, biomass andfrequency of dividing cells
Water samples (3 mL) were fixed with 2% (final) for-maldehyde, filtered on white 0.2-mm pore size 25-mmdiameter polycarbonate filters (Nuclepore, GEWhatman, Piscataway, NJ, USA), dried at room tempera-ture and stored at 2208C. Each filter was mounted andstained with VECTASHIELD containing 1.5 mg mL21
of 40, 6-diamidino-2-phenylindole (DAPI, Vector Labo-ratories, Burlingame, CA, USA), and imaged at 1000!magnification on a Nikon TE2000-U inverted epifluor-escence microscope using a CoolSnapHQ CCD cameraconnected to NIS-Elements 3.2 software. Ten image fieldsper filter were processed to measure cell abundance,length and width using the signal thresholding and binarylayer functions of the software. Cyanobacteria wereexcluded from the total bacterial counts by manualremoval from the DAPI channel identified as autofluor-escent cells in the TRITC channel (excitation 555+14 nm, emission 617+ 37 nm). An area cutoff of 0.1–2 mm2 was used to exclude viral-like particles (VLP) andprotists from the analyses. The average cell number perfield was converted to abundance, and the dimensions of
the cells were used to calculate biovolumes (mm3 cell21)based on the equation V ! (p/4) !W2 ! (L 2 W/3)(Bratbak, 1985). Biovolumes were converted to per cellprotein content (fg cell-1) using the power law functionP=88.6*V0.59, and multiplied by 0.86 to calculate cell-specific carbon (fg C cell-1) (Simon and Azam, 1989).DAPI-based biovolume estimates were found to be ac-ceptable in a previous calibration study using atomicforce microscopy (Malfatti et al., 2010). Cell carbonvalues for each depth were averaged, then multiplied bythe cell abundance to calculate the bacterial carbon (BC)concentration (mg C L21).
The frequency of dividing cells (FDC) was calculatedaccording to Hagstrom et al. (Hagstrom et al., 1979).Septated cells were counted from the same fields usedfor the total cell abundance and divided by the totalnumber of bacteria from each field. The numbers werearcsine transformed to ensure normality of the data andcorrect averaging of percentages, and then back-transformed to obtain a percentage for each depth.
Heterotrophic bacteria were also enumerated by flowcytometry (FCM) from stations 1–9 and depths fromthe surface down to 80 m. Two milliliter samples werepreserved (0.5% paraformaldehyde; final) and thenflash frozen in liquid nitrogen. Onshore, the sampleswere stored at –808C until shipment to the Universityof Hawaii FCM facility (SOEST Flow CytometryFacility, www.soest.hawaii.edu/sfcf ). Samples werethawed and stained with Hoechst 33342 (1 mg mL21
final concentration) (Monger and Landry, 1993). ABeckman-Coulter Altra flow cytometer was mated to aHarvard Apparatus syringe pump for quantitative ana-lyses, and equipped with two argon ion lasers tuned toUV (200 mW) and 488 nm (1 W) excitation (Coherent,Inc., Santa Clara, CA, USA). Scatter (side and forward)and fluorescence signals were collected. Fluorescencesignals were normalized to 0.5 and 1.0-mm yellow–green polystyrene beads (Polysciences, Inc., Warrington,PA, USA). Data generated as listmode files (FCS 2.0format) were acquired from the flow cytometer usingExpo32 software (Beckman-Coulter). FlowJo softwarewas used to assign population designations from thedata based on scatter and fluorescence signals (TreeStar, Inc., www.flowjo.com). Autotrophic bacteria,Prochlorococcus and Synechococcus, identified, respectively,by their chl a and phycoerythrin autofluorescences,were excluded from FCM estimates of total (hetero-trophic) bacteria.
Microscopy-based counts (MIC) from every otherstation were not well resolved between stations or withdepths from 40 to 100 m. To compensate forunsampled stations and depths, two regression plots(intercepts set to 0) were made between MIC- and
Fig. 1. Satellite images of the sea surface temperature (A) with thestudy area indicated by the red box. The section plot of chlorophyll aconcentration across the front with density contours (B).
JOURNAL OF PLANKTON RESEARCH j VOLUME 34 j NUMBER 9 j PAGES 802–814 j 2012
804
!
!

!
!
37
!!!!!!!!!!!!!!!!!!!!!!!!!!
FCM-based measurements. One showed a strong rela-tionship in MIC versus FCM-derived cell counts(MIC ! 0.850*FCM; R2 ! 0.958, P , 0.0001;Supplementary data, Fig. S1A); the other examinedMIC-based carbon biomass (BC, mg C L21) versus theproduct of FCM-derived cell counts and FCM-derivednormalized, mean DNA fluorescence (BC ! 8.122FCM*DNA; R2 ! 0.644, P , 0.0001; Supplementarydata, Fig. S1B). We used the slopes of these regressionsto estimate BC at stations 2, 4, 6 and 8 and for bacterialabundances at stations 1–3 and 7–9, both to a depthof 80 m. Microscope counts were used for 100 m andsurface samples at the front station and mesotrophic sta-tions due to consistent deviations in MIC–FCM regres-sions for those samples.
Viral abundance and virus:bacteria ratios
Viral abundance was determined for 0–80-m depths atstations 4, 5 and 6. Samples were fixed with 0.5%(final) EM-grade glutaraldehyde, flash frozen in liquidnitrogen and stored at 2808C (Brussaard, 2004). Afterthawing, 500 mL was filtered (!25 cm Hg) onto0.02-mm pore size aluminum oxide filters (Anodisc 25,GE Whatman, Piscataway, NJ, USA), stained withSYBR Gold (Invitrogen, Carlsbad, CA, USA; 0.25%final concentration of original stock) and mounted ontoglass slides with anti-fade solution (0.1%p-phenylenediamine in phosphate-buffered saline:gly-cerol at 1:1 concentration). At least 200 viruses persample were counted on an Olympus BX51 microscopeat 1000" magnification using wide-field excitation cen-tered at 470–490 nm with a long pass emission filter(Patel et al., 2007). Bacterial counts were made on thesame filters to calculate the virus:bacteria ratios.
Nano- and microflagellate enumeration
Heterotrophic nano- and microflagellates were countedin 50 and 500 mL samples, respectively. Samples werepreserved sequentially with alkaline Lugol’s solution, for-malin and sodium thiosulfate, stained with proflavin andDAPI, concentrated onto 25-mm diameter 0.8- and8-mm black polycarbonate filters (for nano- and micro-flagellates, respectively), and mounted on slides. Sampleswere digitally imaged at 630" (nano) or 200" (micro)using a Zeiss Axiovert 200 M inverted compound epi-fluorescence microscope. Images were processed withImage Pro software. Nano- and microheterotrophs weredistinguished by the cell length (2–20 versus 20–200 mm) and lack of chloroplasts or significant redchlorophyll fluorescence. Details are described in an ac-companying paper by Taylor et al. (Taylor et al., 2012).
Chlorophyll a concentration
Chlorophyll a was measured by high-performanceliquid chromatography (HPLC). Seawater volumes (2.2or 4.4 L) were filtered onto Whatman GF/F filters,stored in liquid nitrogen, extracted in acetone and ana-lyzed by HPLC (Goericke, 2002) and described byTaylor et al. (Taylor et al., 2012).
Bacterial carbon production
The leucine incorporation method was used to estimatethe rates of BCP. Samples (2 mL) were incubated with20 nM of L-[4,5-3H] leucine in the dark for 1 h at in situtemperature in triplicate with duplicate 5% TCA-killedcontrols (Kirchman et al., 1985; Smith and Azam,1992). Samples were then filtered on either 0.2-mm or1-mm pore size polycarbonate filters (total or .1-mmBCP). Three successive additions of 1 mL 5% TCAwere made and left without suction for 30 s. This ap-proach was used in the response to measurements on aprevious cruise and laboratory experiments thatrevealed anomalously wide-ranging values on filterswhen the sample was first fixed with formaldehyde orTCA. We assumed that negligible amounts of labeledproteins passed through the filter prior to TCA precipi-tation. Each filter was dried in a glass scintillation vialat room temperature. Onshore, EcoLite scintillationcocktail was added to each vial and analyzed in aBeckman LS6000A liquid scintillation counter.Conversion of leucine incorporation to estimate thecarbon production rate was performed assuming3.1 kg C mol21 leucine (2" isotope dilution) and24 h day21 (Simon and Azam, 1989).
Organic and inorganic nutrients
Seawater samples (40 mL) from stations 1–9 were acid-ified with hydrochloric acid to pH!2 for total organiccarbon (TOC) and total nitrogen (TN) analyses on aShimadzu 500 V-CSN/TNM-1 TOC. Quantificationused seven-point C and N standard curves in conjunc-tion with consensus reference material (RSMAS,University of Miami) interspersed between samples.The consensus reference material routinely measuredvalues in the range 41 and 45 mM C. Filtration was notdone prior to TOC determination to minimize contam-ination. Although particulate organic carbon (POC)values were available (below), the dissolved organiccarbon (DOC) was not computed as the differencebetween the TOC and the POC because the determi-nations were made on different volumes (100 mL injec-tions versus 2 L filtrations) and because the DOC was
T. J. SAMO ET AL. j MICROBIAL DISTRIBUTION AND ACTIVITY ACROSS A FRONT IN THE CCE
805!

!
!
38
!!!!!!!!!!!!!!!!!!!!!!!!!!
typically higher than the POC by an order of magni-tude. So, the TOC can be assumed to be mostly com-posed of the DOC. Total organic nitrogen (TON)concentrations, on the other hand, may be stronglyinfluenced by particulate organic nitrogen (PON) astheir values can be similar during phytoplankton bloomconditions.
Samples for analyses of ammonium (NH4!), nitrate
(NO32) and nitrite (NO2
2) were taken from the samedepths and Niskin bottles as those for TOC and TN.Nitrate concentrations determined during CaliforniaCooperative Oceanic Fisheries Investigations (CalCOFI)survey cruise 0810, located in the same area during 14and 30 October 2008, were also used (below). Dissolvedinorganic nitrogen (DIN; nitrate plus nitrite, in thiscase) must be subtracted from TN to calculate TON. Inthis study, TON concentrations were calculated for alldepths ,60 m. Below these depths DIN and TN weretoo similar to allow for accurate TON determination.Nitrate concentrations were available from the A-Frontcruise. However, when nitrate and phosphate concen-trations and ratios in water masses with similar densitieswere compared between A-Front and CalCOFI 0810 itwas apparent that A-Front nitrate samples may havebeen compromised. Therefore, nitrate concentrationsmeasured during CalCOFI 0810, in water masses withsimilar density and phosphate concentration characteris-tics to those sampled for TN during A-Front, were usedto compute the TON. This assumed that phosphateconcentrations did not change independently of nitratein a particular water mass of the same density betweenthe two cruises.
Two liters of seawater were filtered onto 25 mm pre-combusted (4508C, 6 h) Whatman GF/F filters forPOC and PON determinations. Filters were exposed toconcentrated HCl vapors to remove inorganic carbon,oven-dried overnight and one-half of each filter wasanalyzed for C and N at the Scripps Institution ofOceanography’s Analytical Facility using a CostechElemental Analyzer (Costech Analytical Technologies,Valencia, CA, USA) according to standard protocols.
Transparent particles
Following fixation with 2% formaldehyde (final), 20 mLseawater samples were filtered on 1-mm pore size poly-carbonate membranes. With vacuum released, 500 mLof Alcian blue (0.2-mm filter-sterilized solution of 0.02%Alcian blue ! 0.06% acetic acid in milli-Q water) wasthen added on the filter and allowed to stain for 30 s,after which vacuum was reapplied and the filter wasdried at room temperature and stored at 2208C foranalysis onshore (Alldredge et al., 1993). In the
laboratory, the filters were placed on 100 mL drops of1" SYBR Gold, incubated for 15 min, then removedand allowed to fully dry on absorbent paper andmounted onto microscope slides using Resolve immer-sion oil (Richard Allan Scientific, Kalamazoo, MI,USA). Filter fluorescing particles (FFP) were counted at"600 magnification on an Olympus BX51 epifluores-cence microscope using wide field excitation centered at470–490 nm with a long pass emission filter. Countswere made from 20 haphazardly selected fields on eachslide, and the area of each particle was estimated usingthe ocular grid of the microscope (Samo et al., 2008).Transparent exopolymer particles (TEP) were quantifiedon the same preparations using sub-stage illuminationthat was diffused through a Cytoclear slide (SterlitechCorp, Kent, WA, USA) placed below the slide holdingthe mounted filter (Alldredge et al., 1993; Samo et al.,2008).
Contour and section plots
Data collected along the transect was heterogeneousand unevenly spaced in both the horizontal and verticalaxes. The contouring and shading of the DIVA griddingalgorithm in Ocean Data View was therefore used tocreate all section and contour plots (Schlitzer, 2008).
R E S U LT S
Distributions of chlorophyll a and bacterialabundance and biomass
The maximum chl a concentration among all stationsand depths was found at !30 m from the frontalstation 4, coinciding with the su ! 24.75 isopycnal(3.20 mg L21). Frontal station 5 also exhibited a chloro-phyll maximum of 2.46 mg L21 at the su ! 24.75 iso-pycnal (Fig. 1B). Integrated chlorophyll was maximal atstations 4 and 5, and station 5 also exhibited the highestintegrated BCP (Table I). The nitracline, defined as thedepth where nitrate concentration exceeds 1 mM, waslocated at 42 m at the southernmost station 1 in oligo-trophic waters and shoaled to 21 m at the northernmostmesotrophic station 9 (Table I). The detailed depthprofile data collected at the transect stations are pro-vided in Supplementary data, Table S1.
Bacterial abundance in the southern, oligotrophicsurface waters was typically 109 L21, decreasing to 108
cells L21 below 40 m (Fig. 2A). The depth profile at thefront was slightly different, with lower abundance at thesurface and a greater variability in abundance withdepth, which ranged from !5 " 108 to 109 cells L21.
JOURNAL OF PLANKTON RESEARCH j VOLUME 34 j NUMBER 9 j PAGES 802–814 j 2012
806
!
!

!
!
39
!!!!!!!!!!!!!!!!!!!!!!!!!!
Abundances in the northern, mesotrophic waters weresubstantially higher, ranging 1.50–2.25 ! 109 cells L21.Comparison of the BCP and BC (Fig. 2B; Supple-mentary data, Fig. S2B) with chlorophyll (Fig. 1B)revealed these measurements to be effectively boundedby the depth of the chlorophyll maximum. The depthof maximum BCP at station 5 was coincident with thedepth of maximum chlorophyll.
Cell-specific BC was highest at the southernmost(oligotrophic; 27 fg C cell21) and northernmost (meso-trophic; 28 fg C cell21) stations compared with adjacentstations (14–20 fg C cell21; Supplementary data,Fig. S2A), and a relatively high value was also found at
the surface of the front (29 fg C cell21). Profiles of BCfollowed a pattern similar to cell abundance, withhighest values at the northernmost station, and thusappeared to be driven by this parameter and not cell-specific carbon.
Bacterial carbon production
BCP strongly reflected the frontal boundary. Maxima of11–13 mg C L21 day21 were measured from thesurface to !40 m at the front, with enhanced produc-tion shoaling to the surface on the northern, meso-trophic side (Fig. 2A). Bacterial production in southern,oligotrophic waters was low, averaging a quarter of thatat the front (!3 mg C L21 day21). These patterns werecorroborated by nearly identical profiles of .1-mmfractionated carbon production values (data not shown)and the FDC at each depth, both of which exhibitedshallow, subsurface maxima at the front (Supplementarydata, Fig. S2C). Furthermore, growth rates calculatedby dividing depth-integrated BCP by depth-integratedBC (e.g. Ducklow, 2000) exhibited the highest value(0.46 day21) at the front, decreasing to 0.1 day21 northand south of the front (Table I).
Viral abundance and virus:bacteria ratios
Viral abundance at the surface of the front was 1.5–2 ! 1010 VLP L21, and decreased to 5 ! 109 VLP L21
,50 m (Supplementary data, Fig. S3A). The meso-trophic station showed a similar trend, but elevatedviral abundance extended deeper than 30 m. The oligo-trophic station exhibited viral abundances of 1–1.5 !1010 particles L21 from the surface to a depth of 40 m.
Bacterial abundances at station 5 calculated fromAnodisc filters using the BX51 Olympus microscopewere not significantly different from those measured on
Fig. 2. Bacterial abundance (A) and bacterial production (B) alongthe A-Front transect. Stations are identified by numbers with watermasses bracketed. Beige circles within each plot denotemicroscopy-based data when flow cytometry was used to augment theabundance and total carbon datasets. The dashed line denotes thedepth of maximum chlorophyll concentrations.
Table I: Summary values of the nitracline depth and integrated stocks of chlorophyll, bacterial carbon,bacterial carbon production and calculated bacterial growth rate
StationLatitude(8N)
Longitude(8W)
Nitracline depth(m)
Integratedchl a’
Integrated BC(mg C m22)
Integrated BCP(mg C m22 day21)
Bacterial growth rate(day21)
1 32.6667 120.7098 42 30.1 1770 153 0.08632 32.7018 120.7085 39 25.3 9833 32.7247 120.7075 31 33.9 1230 159 0.1294 32.7498 120.7088 36 94.4 14205 32.7762 120.7077 32 98.1 1520 698 0.4596 32.8027 120.7097 28 66.3 21907 32.8263 120.7097 29 56.4 2190 406 0.1858 32.8515 120.7105 25 51.7 25609 32.8965 120.7082 21 45.8 3240 301 0.0929
Depth integrated values were calculated from the surface to 100 m.
T. J. SAMO ET AL. j MICROBIAL DISTRIBUTION AND ACTIVITY ACROSS A FRONT IN THE CCE
807!

!
!
40
!!!!!!!!!!!!!!!!!!!!!!!!!!
polycarbonate filters using the Nikon TE2000-U micro-scope (Student’s t-test, P ! 0.265), and were thereforedeemed appropriate for calculating virus:bacteria ratios.The highest virus:bacteria ratio of 23:1 was observed atthe surface of the front, decreasing to 17:1 and then to10:1 ,20 m (Supplementary data, Fig. S3B).
Nano- and microflagellate abundance
Nanoflagellate abundances were evenly distributed fromthe surface to 40 m both south and north of the front.At the front, abundances were on the order of 4 !105–1 ! 106 L21, or !20–50% of those at the north-ern and southern adjacent stations (Supplementarydata, Table S1). Bacteria:nanoflagellate ratios increasedalong the transect, 3- to 4-fold at the surface of thestation 5 frontal zone and at 15 m in the northernmoststation (Fig. 3). Microflagellate abundances generallyincreased from south (!103 cells L21) to north (!8 !103 cells L21) and showed maxima at the mesotrophicstations from the surface to 30 m (Supplementary data,Table S1). Unlike nanoflagellates, microflagellate abun-dance did not decrease markedly at the front, but wasmore evenly distributed throughout the sampled watercolumn.
Organic and inorganic nutrients
The TOC and POC concentrations were poorly corre-lated, and subsequent analyses and discussion are basedon the premise that the TOC reflects the distribution ofthe DOC. Slightly higher TOC values at the front coin-cided with locations of highest BCP and chl a (Figs 1Band 2B). Maximal mean depth-integrated concentra-tions occurred at station 3, with depth-specific maximafrom 0 to 20 m (Table II and Supplementary data,Fig. S4A). Station 8 had the highest meandepth-integrated and depth-specific TON, with highvalues also present at stations 3–6 throughout the water
column. Depth-specific POC and PON were elevated atthe front and highest at station 2. Mean depth-integrated values did not follow this trend and displayedhighest values at station 2 (POC) and 6 (PON). Overall,the profiles were similar to chl a, indicating that thesemeasurements reflected depth distribution of biomassconcentrations. The DIN, POC/PON and TOC/TONdata (Table II and Supplementary data, Table S2) arediscussed below as they pertain to microbial activity.
Transparent particles
TEP and FFP differed in concentration and size alongthe transect (Supplementary data, Fig. S5 andTable S2). The maximal TEP concentration centered,40 m and south of the front. Concentrations of TEPat the front were enhanced relative to northern waterswhile FFP concentrations were highest at the surface inthe oligotrophic and northernmost stations. Averageareas of each particle size class were also distributed dif-ferently with depth, but showed some agreement at thesurface of the front where FFP average areas decreasedfrom !1000 to 200 mm2 ,20 m while maintaininghigh values northward into the mesotrophic waters.
D I S C U S S I O N
We hypothesized that elevated nutrient fluxes associatedwith the A-Front (Li et al., 2012) would elicit strongmetabolic responses and enhanced primary production,and result in elevated heterotrophic activities, thusaffecting carbon cycling at the meso- to submesoscale.The characteristics and responses of primary producersand heterotrophic bacteria highlighted the active anddynamic nature of this frontal zone. Depending on themagnitude of along isopycnal and frontal jet transportof these microbial communities and their biogeochem-ical influence on inorganic and organic nutrients, suchsites may play an important role in nutrient cycling onlarger spatial scales.
Bacterial responses at the front
A striking observation was the enhanced rate of depth-integrated and depth-specific BCP at the front (Table Iand Fig. 2B). Maximal BCP of !13 mg C L21 day21 at15 m indicated increased bioavailability of DOM andessential nutrients. The range of BCP estimates at theA-Front was within the range of previous measurementsin the Southern California Bight region of the CCE(0.28–14 mg C L21 day21; Fuhrman et al., 1985, assum-ing 20 fg C cell21 and 1.18 ! 1018 cells mol21 TdR;
Fig. 3. Bacteria:nanoflagellate ratios across the front. In comparisonwith the oligotrophic and mesotrophic stations, frontal zonenanoflagellates were less abundant, thereby increasing thebacteria:nanoflagellate ratios.
JOURNAL OF PLANKTON RESEARCH j VOLUME 34 j NUMBER 9 j PAGES 802–814 j 2012
808
!
!

!
!
41
!!!!!!!!!!!!!!!!!!!!!!!!!!
Simon et al., 1990, assuming 3.1 kg C mol21 Leu),and within the range of seasonally estimated ratesin the Arabian Sea (0.50–15.0 mg C L21 day21;Ducklow et al., 2001, assuming 3.1 kg C mol21 Leu).They were greater than those measured in the SantaMonica Basin (!2.0 mg C L21 day21; Cho andAzam, 1988, assuming 20 fg C cell21 and 1.18 ! 1018
cells mol21 TdR), and the North Atlantic (0.50–10.0 mg C L21 day21; Hoppe et al., 2002, assuming3.1 kg C mol21 Leu), yet lower than peak values in theSouth Atlantic Ocean (0.94–16.6 mg C L21 day21;Hoppe et al., 2002, assuming 3.1 kg C mol21 Leu).
The enhanced depth-integrated bacterial growthrates, high FDC, high chl a concentration and the sig-nificant correlation between BCP and chl a (R2 !0.622, P , 0.0001) at the front suggest that this oceano-graphic feature supported enhanced bacterial growth.These results are in agreement with previous worknoting the positive correlation between chl a (and/orprimary production) and heterotrophic bacterial activityand growth rates in aquatic systems (Cole et al., 1988).Bacteria–phytoplankton interactions are facilitated bythe release of labile DOM from phytoplankton (Magueet al., 1980). Heterotrophic bacteria rapidly metabolizelabile organic matter (Kirchman et al., 1991), causingnutrient remineralization, as we saw at station 5(frontal) at 100 m where BCP was 1.4–2.6 timesgreater than either the oligotrophic and mesotrophicstations at 100 m. Thus, microbial activity within thefrontal zone likely exerted substantial influence on elem-ental cycling within and below the euphotic zone of theCCE.
POC and PON were highest at the front(Supplementary data, Fig. S4C and D). These measure-ments reflected localized high phytoplankton biomassand underscored the uniqueness of the A-Front as aregion within the CCE where bloom conditions were
closely flanked by less productive waters. However,TOC was, in fact, lower at the A-Front relative to adja-cent oligotrophic waters (Table II and Supplementarydata, Fig. S4A). Thermal stratification can lead to theaccumulation of semi-labile and refractory DOM withreduced influx of inorganic nutrients, which limits bac-terial processing of DOC in warm, oligotrophic waters(Hansell and Waterhouse, 1997). The TOC was nega-tively correlated with density (R2! 0.832) in our studyregion. However, at the lowest densities, TOC concen-trations were higher than predicted by simple physicalmixing. This observation is consistent with greater accu-mulation of semi-labile TOC in warm surface watersouth of the front. Additionally, reduced DOC con-sumption by heterotrophic bacteria due to grazing orinsufficient nutrients can result in an accumulation ofDOC (Thingstad et al., 1997). Enhanced carbon-richPOM at the southern stations, seen as high POC/PONsignatures (.6.6: Supplementary data, Table S2)(Redfield et al., 1963), suggests preferential degradationof nitrogenous organic matter in the oligotrophic system(Kahler and Koeve, 2001).
We note that the TOC/TON was in agreement withother values for the North Pacific Ocean—between 13and 20 (Supplementary data, Table S2) (Hansell andWaterhouse, 1997; Libby and Wheeler, 1997; Ogawaand Tanoue, 2003). The marginal differences were con-fined to each water mass, i.e. the southern oligotrophic(stations 1–3), the front and adjacent depths (stations4–6) and the northern mesotrophic (stations 7–9). Thelower TOC/TON and POC/PON at the front and ad-jacent stations suggested inputs of organic nitrogenwhile high TOC/TON in the northern and southernstations pointed to the removal of organic nitrogen (in-cluding PON), possibly through microbial regenerationand/or metazoan grazing (Table II) (Hansell andWaterhouse, 1997; Ogawa et al., 1999).
Table II: Mean depth integrated values of organic carbon, organic nitrogen and ratios along the A-Fronttransect
StationLatitude(8N)
Longitude(8W)
Depth ofintegration(m)
MeanintegratedTOC(mg m22)
MeanintegratedTON(mg m22)
MeanintegratedPOC(mg m22)
MeanintegratedPON(mg m22)
MeanintegratedTOC:TON
MeanintegratedPOC:PON
1 32.6667 120.7098 41 7900 530 798 120 14.9 6.642 32.7018 120.7085 39 7430 502 1530 239 14.8 6.433 32.7247 120.7075 44 9160 617 975 148 14.9 6.614 32.7498 120.7088 40 7920 628 1360 241 12.6 5.655 32.7762 120.7077 35 6820 607 1050 254 11.2 4.146 32.8027 120.7097 35 6370 605 1210 270 10.5 4.487 32.8263 120.7097 35 6050 577 1290 266 10.5 4.848 32.8515 120.7105 40 7490 763 1120 238 9.81 4.729 32.8965 120.7082 35 5790 541 961 188 10.7 5.12
TOC, total organic carbon; TON, total organic nitrogen; POC, particulate organic carbon; PON, particulate organic nitrogen.
T. J. SAMO ET AL. j MICROBIAL DISTRIBUTION AND ACTIVITY ACROSS A FRONT IN THE CCE
809!
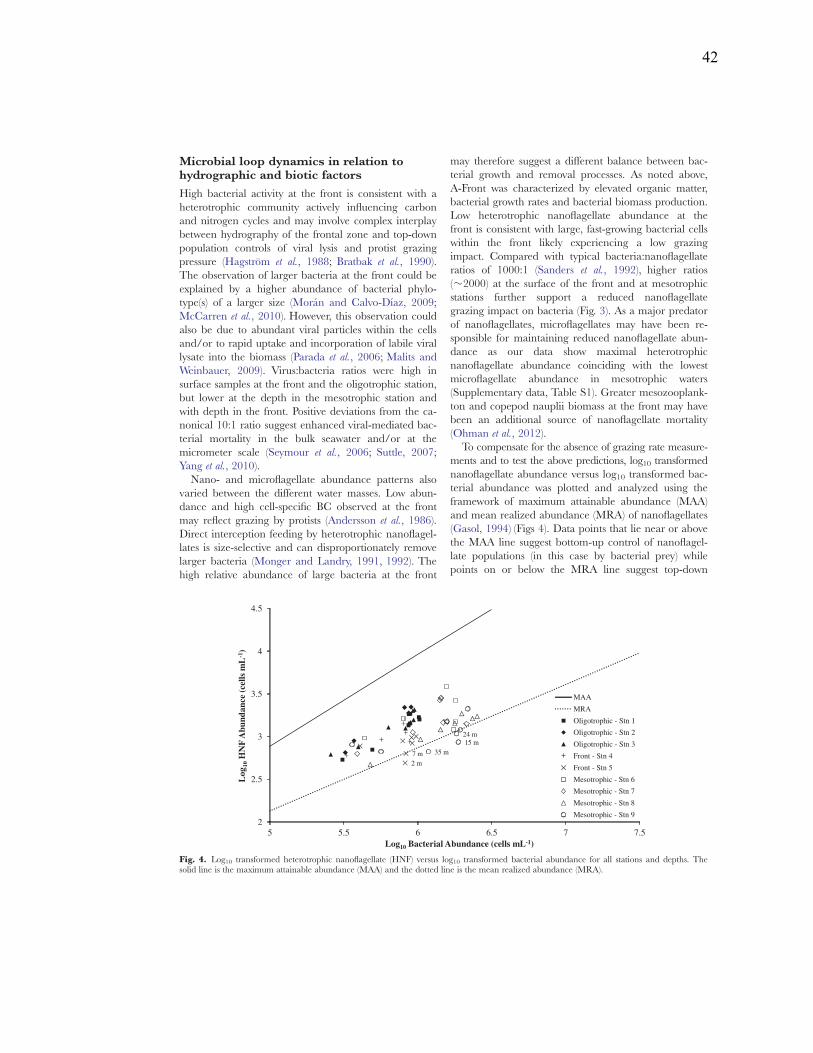
!
!
42
!!!!!!!!!!!!!!!!!!!!!!!!!!
Microbial loop dynamics in relation tohydrographic and biotic factors
High bacterial activity at the front is consistent with aheterotrophic community actively influencing carbonand nitrogen cycles and may involve complex interplaybetween hydrography of the frontal zone and top-downpopulation controls of viral lysis and protist grazingpressure (Hagstrom et al., 1988; Bratbak et al., 1990).The observation of larger bacteria at the front could beexplained by a higher abundance of bacterial phylo-type(s) of a larger size (Moran and Calvo-Dıaz, 2009;McCarren et al., 2010). However, this observation couldalso be due to abundant viral particles within the cellsand/or to rapid uptake and incorporation of labile virallysate into the biomass (Parada et al., 2006; Malits andWeinbauer, 2009). Virus:bacteria ratios were high insurface samples at the front and the oligotrophic station,but lower at the depth in the mesotrophic station andwith depth in the front. Positive deviations from the ca-nonical 10:1 ratio suggest enhanced viral-mediated bac-terial mortality in the bulk seawater and/or at themicrometer scale (Seymour et al., 2006; Suttle, 2007;Yang et al., 2010).
Nano- and microflagellate abundance patterns alsovaried between the different water masses. Low abun-dance and high cell-specific BC observed at the frontmay reflect grazing by protists (Andersson et al., 1986).Direct interception feeding by heterotrophic nanoflagel-lates is size-selective and can disproportionately removelarger bacteria (Monger and Landry, 1991, 1992). Thehigh relative abundance of large bacteria at the front
may therefore suggest a different balance between bac-terial growth and removal processes. As noted above,A-Front was characterized by elevated organic matter,bacterial growth rates and bacterial biomass production.Low heterotrophic nanoflagellate abundance at thefront is consistent with large, fast-growing bacterial cellswithin the front likely experiencing a low grazingimpact. Compared with typical bacteria:nanoflagellateratios of 1000:1 (Sanders et al., 1992), higher ratios(!2000) at the surface of the front and at mesotrophicstations further support a reduced nanoflagellategrazing impact on bacteria (Fig. 3). As a major predatorof nanoflagellates, microflagellates may have been re-sponsible for maintaining reduced nanoflagellate abun-dance as our data show maximal heterotrophicnanoflagellate abundance coinciding with the lowestmicroflagellate abundance in mesotrophic waters(Supplementary data, Table S1). Greater mesozooplank-ton and copepod nauplii biomass at the front may havebeen an additional source of nanoflagellate mortality(Ohman et al., 2012).
To compensate for the absence of grazing rate measure-ments and to test the above predictions, log10 transformednanoflagellate abundance versus log10 transformed bac-terial abundance was plotted and analyzed using theframework of maximum attainable abundance (MAA)and mean realized abundance (MRA) of nanoflagellates(Gasol, 1994) (Figs 4). Data points that lie near or abovethe MAA line suggest bottom-up control of nanoflagel-late populations (in this case by bacterial prey) whilepoints on or below the MRA line suggest top-down
2 m 7 m
15 m 24 m
35 m
2
2.5
3
3.5
4
4.5
5 5.5 6 6.5 7 7.5
Log
10H
NF
Abu
ndan
ce (c
ells
mL
-1)
Log10 Bacterial Abundance (cells mL-1)
MAA
MRA
Oligotrophic - Stn 1
Oligotrophic - Stn 2
Oligotrophic - Stn 3
Front - Stn 4
Front - Stn 5
Mesotrophic - Stn 6
Mesotrophic - Stn 7
Mesotrophic - Stn 8
Mesotrophic - Stn 9
Fig. 4. Log10 transformed heterotrophic nanoflagellate (HNF) versus log10 transformed bacterial abundance for all stations and depths. Thesolid line is the maximum attainable abundance (MAA) and the dotted line is the mean realized abundance (MRA).
JOURNAL OF PLANKTON RESEARCH j VOLUME 34 j NUMBER 9 j PAGES 802–814 j 2012
810
!
!

!
!
43
!!!!!!!!!!!!!!!!!!!!!!!!!!
forcing by nanoflagellate predators (such as microflagel-lates). Bottom-up control of nanoflagellates by bacterialavailability was not significant. However, top-downcontrol was apparent for the frontal and mesotrophicstations. While surface data for stations 6 and 7 were onthe MRA line, stations 5 and 9 with depths of 2 and7 m and 15, 24 and 35 m, respectively, were below theMRA line and thus likely exhibited significant predationof nanoflagellates. Collectively, these observationssupport the proposed mechanism at the front wherebyincreased grazing by microflagellates upon nanoflagel-late bacteriovores led to a bacterial population com-prised of fast-growing, larger cells predominantlyregulated by viral lysis. Through viral lysis, bacterial cellabundance is decreased while the cell lysates could fuelelevated bacterial production through rapid and tightlycoupled cycling of labile organic matter (Fuhrman,1999).
Potential role of transparent particles
We considered the patterns of transparent particles andtheir capacity as microenvironments to identify theircontribution to nutrient cycling and carbon export tothe mesopelagic. The size and concentration profilessuggest potential roles of the microbial communities inparticle formation and degradation. The maxima ofTEP and FFP concentrations were not accompaniedby average particle size maxima at any depth (Supple-mentary data, Fig. S5). This was unexpected, particular-ly at the front, where FFP concentrations were amongthe lowest measured while TEP concentration waselevated in comparison with the mesotrophic stations(Supplementary data, Fig. S5A and C). Interestingly, thedepth at the front that exhibited maximal FFP averagearea and slightly elevated TEP average area also hadthe largest bacterial cell sizes (Supplementary data,Fig. S5B and D). We did not constrain the mechanismsunderlying these observations, but they may includevaried POM-colloid-DOM transformations involvingviral, bacterial and abiotic processes.
Potential influences of frontalhydrodynamics on biogeochemistry in theCCE
The spatial stability of the A-Front was demonstrated byseveral transects with a moving vessel profiler thatshowed enhanced chl a concentrations and particulatebiovolume at the frontal zone east of the transect(Ohman et al., 2012) as well as satellite data depictingthe frontal stability of the SST and chl a for 3 weeksprior to the transect (Kahru et al., 2012). The eastward
velocity along the frontal jet approached 0.3 m s21
(Li et al., 2012), and was thus capable of rapidly advect-ing plankton tens of kilometers within a few days. As aresult, enhanced biological production along the frontalzone likely had biogeochemical consequences for adja-cent regions within the CCE despite being spatially con-fined. The timescales of transport are also relevant forconstraining and characterizing the growth responses ofthe microbial community and the formation andremoval of non-living carbon (DOM, POM and trans-parent particles). Front-induced enhancement of the au-tochthonous biomass and particles was also evident inthe higher photosynthetic potential of phytoplankton(Chekalyuk et al., 2012) mediated by elevated diapycnalnitrate fluxes (Li et al., 2012). If the present observationscan be extrapolated to other frontal zones in the CCE,these features may be important environments wherephysically driven nutrient inputs upshift trophic interac-tions and biogeochemical cycling.
Formed at the interface of oligotrophic and meso-trophic water masses in the CCE, the A-Front was anenhanced microhabitat of high photosynthetic biomass,dynamic formation and removal of dissolved and par-ticulate organic matter, elevated substrate processingand uptake activity by heterotrophic bacteria, and atyp-ical relative abundances of viral, flagellate and zoo-plankton mortality agents. Although the scales ofphysical perturbations in the frontal zones are relativelysmall, such microbially mediated responses may, in theaggregate, affect carbon cycling and export processes onlarger scales.
S U P P L E M E N TA RY DATA
Supplementary data can be found online at http://plankt.oxfordjournals.org.
AC K N OW L E D G E M E N T S
We thank the participants of the CCE-LTER and thecaptain and the crew of the RV Melville. The questions,insights and suggestions of two anonymous reviewersalso contributed significantly to the manuscript and theauthors are very appreciative of their careful observa-tions and feedback.
F U N D I N G
This work was supported by U.S. National ScienceFoundation grants OCE 04–17616 and 10-26607 for
T. J. SAMO ET AL. j MICROBIAL DISTRIBUTION AND ACTIVITY ACROSS A FRONT IN THE CCE
811!

!
!
44
!!!!!!!!!!!!!!!!!!!!!!!!!!
the CCE-LTER Program; OCE-0548275 to L.I.A.; andby a grant from the Gordon and Betty MooreFoundation Marine Microbiology Initiative to F.A.
R E F E R E N C E S
Alldredge, A. L., Passow, U. and Logan, B. E. (1993) The abundanceand significance of a class of large, transparent organic particles inthe ocean. Deep-Sea Res. I, 40, 1131–1140.
Aluwihare, L. I. and Repeta, D. J. (1999) A comparison of the chem-ical characteristics of oceanic DOM and extracellular DOM pro-duced by marine algae. Mar. Ecol. Prog. Ser., 186, 105–117.
Andersson, A., Larsson, U. and Hagstrom, A. (1986) Size-selectivegrazing by a microflagellate on pelagic bacteria. Mar. Ecol. Prog. Ser.,33, 51–57.
Azam, F., Fenchel, T., Field, J. G. et al. (1983) The ecological role ofwater-column microbes in the sea. Mar. Ecol. Prog. Ser., 10,257–263.
Azam, F. and Malfatti, F. (2007) Microbial structuring of marine eco-systems. Nat. Rev. Microbiol., 5, 782–791.
Bratbak, G. (1985) Bacterial biovolume and biomass estimations. Appl.Environ. Microbiol., 49, 1488–1493.
Bratbak, G., Heldal, M., Norland, S. et al. (1990) Viruses as partnersin spring bloom microbial trophodynamics. Appl. Environ. Microbiol.,56, 1400–1405.
Bray, N. A., Keyes, A. and Morawitz, W. M. L. (1999) The californiacurrent system in the southern California bight and the SantaBarbara Channel. J. Geophys. Res., 104, 7695–7714.
Brussaard, C. P. D. (2004) Optimization of procedures for countingviruses by flow cytometry. Appl. Environ. Microbiol., 70, 1506–1513.
Chekalyuk, A., Landry, M. R., Goericke, R. et al. (2012) Laser fluores-cence analysis of phytoplankton across a frontal zone in theCalifornia Current ecosystem. J. Plank. Res., 34, 761–777.
Cho, B. C. and Azam, F. (1988) Major role of bacteria in biogeo-chemical fluxes in the oceans interior. Nature, 332, 441–443.
Claustre, H., Kerherve, P., Marty, J. C. et al. (1994) Phytoplankton dy-namics associated with a geostrophic front: ecological and biogeo-chemical implications. J. Mar. Res., 52, 711–742.
Cole, J. J., Findlay, S. and Pace, M. L. (1988) Bacterial production infresh and saltwater ecosystems: a cross-system overview. Mar. Ecol.Prog. Ser., 43, 1–10.
Del Giorgio, P. A. and Cole, J. J. (1998) Bacterial growth efficiency innatural aquatic systems. Annu. Rev. Ecol. Syst., 29, 503–541.
Ducklow, H. W. (2000) Bacterial production and biomass in theoceans. In Kirchman, D. L. (ed.), Microbial Ecology of the Oceans. 1stedn. Wiley-Blackwell, Hoboken, New Jersey, USA, pp. 85–120.
Ducklow, H. W. and Hill, S. M. (1985) Tritiated-thymidine incorpor-ation and the growth of heterotrophic bacteria in warm core rings.Limnol. Oceanogr., 30, 260–272.
Ducklow, H. W., Smith, D. C., Campbell, L. et al. (2001) Heterotrophicbacterioplankton in the Arabian Sea: Basinwide response to year-round high primary productivity. Deep-Sea Res. II, 48, 1303–1323.
Ewart, C. S., Meyers, M. K., Wallner, E. R. et al. (2008) Microbial dy-namics in cyclonic and anticyclonic mode-water eddies in thenorthwestern Sargasso Sea. Deep-Sea Res. II, 55, 1334–1347.
Falkowski, P. G., Ziemann, D., Kolber, Z. et al. (1991) Role of eddypumping in enhancing primary production in the ocean. Nature,352, 55–58.
Fernandez, M., Bianchi, M. and Vanwambeke, F. (1994) Bacterialbiomass, heterotrophic production and utilization of dissolvedorganic matter photosynthetically produced in the Almeria-Oranfront. J. Mar. Syst., 5, 313–325.
Fiala, M., Sournia, A., Claustre, H. et al. (1994) Gradients of phyto-plankton abundance, composition and photosynthetic pigmentsacross the Almeria-Oran front (SW Mediterranean Sea). J. Mar.Syst., 5, 223–233.
Franks, P. J. S. (1992) Sink or swim: accumulation of biomass at fronts.Mar. Ecol. Prog. Ser., 82, 1–12.
Fuhrman, J. A. (1999) Marine viruses and their biogeochemical andecological effects. Nature, 399, 541–548.
Fuhrman, J. A., Eppley, R. W., Hagstrom, A. et al. (1985) Diel varia-tions in bacterioplankton, phytoplankton, and related parameters inthe Southern California Bight. Mar. Ecol. Prog. Ser., 27, 9–20.
Gasol, J. M. (1994) A framework for the assessment of top-down vsbottom-up control of heterotrophic nanoflagellate abundance. Mar.Ecol. Prog. Ser., 113, 291–300.
Goericke, R. (2002) Top-down control of phytoplankton biomass andcommunity structure in the monsoonal Arabian Sea. Limnol.Oceanogr., 47, 1307–1323.
Hagstrom, A., Ammerman, J. W., Henrichs, S. et al. (1984)Bacterioplankton growth in seawater: 2. Organic matter utilizationduring steady-state growth in seawater cultures. Mar. Ecol. Prog. Ser.,18, 41–48.
Hagstrom, A., Azam, F., Andersson, A. et al. (1988) Microbial loop inan oligotrophic pelagic marine ecosystem: possible roles of cyano-bacteria and nanoflagellates in the organic fluxes. Mar. Ecol. Prog.Ser., 49, 171–178.
Hagstrom, A., Larsson, U., H?rstedt, P. et al. (1979) Frequency ofdividing cells, a new approach to the determination of bacterialgrowth rates in aquatic environments. Appl. Environ. Microbiol., 37,805–812.
Hansell, D. A. and Waterhouse, T. Y. (1997) Controls on the distribu-tions of organic carbon and nitrogen in the eastern Pacific Ocean.Deep-Sea Res. I, 44, 843–857.
Heinanen, A., Kononen, K., Kuosa, H. et al. (1995) Bacterioplanktongrowth associated with physical fronts during a cyanobacterialbloom. Mar. Ecol. Prog. Ser., 116, 233–245.
Hoppe, H. G., Gocke, K., Koppe, R. et al. (2002) Bacterial growthand primary production along a north-south transect of theAtlantic Ocean. Nature, 416, 168–171.
Kahler, P. and Koeve, W. (2001) Marine dissolved organic matter: canits C : N ratio explain carbon overconsumption? Deep-Sea Res. I, 48,49–62.
Kahru, M., Di Lorenzo, E., Manzano-Sarabia, M. et al. (2012) Spatialand temporal statistics of surface temperature and chlorophyll fronts inthe California Current. J. Plank. Res., 34, 749–760.
Karl, D. M., Hebel, D. V., Bjorkman, K. et al. (1998) The role of dis-solved organic matter release in the productivity of the oligotrophicNorth Pacific Ocean. Limnol. Oceanogr., 43, 1270–1286.
Kirchman, D., K’nees, E. and Hodson, R. (1985) Leucine incorpor-ation and its potential as a measure of protein synthesis bybacteria in natural aquatic systems. Appl. Environ. Microbiol., 49,599–607.
JOURNAL OF PLANKTON RESEARCH j VOLUME 34 j NUMBER 9 j PAGES 802–814 j 2012
812
!
!

!
!
45
!!!!!!!!!!!!!!!!!!!!!!!!!!
Kirchman, D. L., Suzuki, Y., Garside, C. et al. (1991) High turnoverrates of dissolved organic carbon during a spring phytoplanktonbloom. Nature, 352, 612–614.
Landry, M. R., Ohman, M. D., Goericke, R. et al. (2012) Pelagiccommunity responses to a deep-water front in the CaliforniaCurrent Ecosystem: overview of the A-Front Study. J. Plank. Res.,34, 739–748.
Li, Q. P., Franks, P. J. S., Ohman, M. D. et al. (2012) Enhanced nitratefluxes and biological processes at a frontal zone in the SouthernCalifornia Current System. J. Plank. Res., 34, 790–801.
Libby, P. S. and Wheeler, P. A. (1997) Particulate and dissolvedorganic nitrogen in the central and eastern equatorial Pacific.Deep-Sea Res. I, 44, 345–361.
Mague, T. H., Friberg, E., Hughes, D. J. et al. (1980) Extracellularrelease of carbon by marine phytoplankton; a physiological ap-proach. Limnol. Oceanogr., 25, 262–279.
Malfatti, F., Samo, T. J. and Azam, F. (2010) High-resolution imagingof pelagic bacteria by Atomic Force Microscopy and implicationsfor carbon cycling. ISME J., 4, 427–439.
Malits, A. and Weinbauer, M. G. (2009) Effect of turbulence andviruses on prokaryotic cell size, production and diversity. Aquat.Microb. Ecol., 54, 243–254.
Martin, J. H., Coale, K. H., Johnson, K. S. et al. (1994) Testing theiron hypothesis in ecosystems of the equatorial Pacific Ocean.Nature, 371, 123–129.
Mccarren, J., Becker, J. W., Repeta, D. J. et al. (2010) Microbial com-munity transcriptomes reveal microbes and metabolic pathwaysassociated with dissolved organic matter turnover in the sea. Proc.Natl. Acad. Sci. U. S. A., 107, 16420–16427.
Monger, B. C. and Landry, M. R. (1991) Prey-size dependency ofgrazing by free-living marine flagellates. Mar. Ecol. Prog. Ser., 74,239–248.
Monger, B. C. and Landry, M. R. (1992) Size-selective grazingby heterotrophic nanoflagellates: an analysis using live-stainedbacteria and dual-beam flow cytometry. Adv. Limnol., 37,173–185.
Monger, B. C. and Landry, M. R. (1993) Flow cytometric analysis of marinebacteria with Hoechst 33342. Appl. Environ. Microbiol., 59, 905–911.
Moran, X. A. G. and Calvo-Dıaz, A. (2009) Single-cell vs. bulk activ-ity properties of coastal bacterioplankton over an annual cycle in atemperate ecosystem. FEMS Microbiol. Ecol., 67, 43–56.
Moran, X. A. G., Taupier-Letage, I., Vazquez-Domınguez, E. et al.(2001) Physical-biological coupling in the Algerian Basin (SWMediterranean): influence of mesoscale instabilities on the biomassand production of phytoplankton and bacterioplankton. Deep-SeaRes. I, 48, 405–437.
Ogawa, H., Fukuda, R. and Koike, I. (1999) Vertical distributions ofdissolved organic carbon and nitrogen in the Southern Ocean.Deep-Sea Res. I, 46, 1809–1826.
Ogawa, H. and Tanoue, E. (2003) Dissolved organic matter inoceanic waters. J. Oceanogr., 59, 129–147.
Ohman, M. D., Powell, J., Picheral, M. et al. (2012) Mesozooplanktonand particulate matter responses to a deep-water frontal systemin the southern California Current System. J. Plank. Res., 34,815–827.
Pallas-Sanz, E., Johnston, T. M. S. and Rudnick, D. L. (2010) Frontaldynamics in a California Current system shallow front: 1. Frontalprocesses and tracer structure. J. Geophys. Res., 115, 14.
Parada, V., Herndl, G. J. and Weinbauer, M. G. (2006) Viral burst sizeof heterotrophic prokaryotes in aquatic systems. J. Mar. Biol. Assoc.U.K., 86, 613–621.
Patel, A., Noble, R. T., Steele, J. A. et al. (2007) Virus and prokaryoteenumeration from planktonic aquatic environments by epifluores-cence microscopy with SYBR Green I. Nat. Protoc., 2, 269–276.
Peinert, R. and Miquel, J. C. (1994) The significance of frontal pro-cesses for vertical particle fluxes: a case study in the Alboran Sea(SW Mediterranean Sea). J. Mar. Syst., 5, 377–389.
Prieur, L. and Sournia, A. (1994) Almofront-1 (April-May 1991): aninterdisciplinary study of the Almeria-Oran geostrophic front, SWMediterranean Sea. J. Mar. Syst., 5, 187–203.
Raven, J. A. and Falkowski, P. G. (1999) Oceanic sinks for atmosphericCO2. Plant Cell Environ., 22, 741–755.
Redfield, A. C., Ketchum, B. H. and Richards, F. A. (1963) The influ-ence of organisms on the composition of seawater. In Hill, M. N.(ed.), The Sea. Vol. 2. Wiley, New York, pp. 26–77.
Riemann, L., Nielsen, T. G., Kragh, T. et al. (2011) Distribution andproduction of plankton communities in the subtropical convergencezone of the Sargasso Sea. I. Phytoplankton and bacterioplankton.Mar. Ecol. Prog. Ser., 426, 57–70.
Rykaczewski, R. R. and Checkley, D. M. (2008) Influence of oceanwinds on the pelagic ecosystem in, upwelling regions. Proc. Natl.Acad. Sci. U. S. A., 105, 1965–1970.
Samo, T. J., Malfatti, F. and Azam, F. (2008) A new class of transpar-ent organic particles in seawater visualized by a novel fluorescenceapproach. Aquat. Microb. Ecol., 53, 307–321.
Sanders, R. W., Caron, D. A. and Berninger, U. G. (1992)Relationships between bacteria and heterotrophic nanoplankton inmarine and fresh waters: an inter-ecosystem comparison. Mar. Ecol.Prog. Ser., 86, 1–14.
Schlitzer, R. (2008) Ocean Data View, version 4.5.0. http://odv.awi.de/.
Sempere, R., Dafner, E., Van Wambeke, F. et al. (2003) Distributionand cycling of total organic carbon across the Almeria-Oran Frontin the Mediterranean Sea: Implications for carbon cycling in thewestern basin. J. Geophys. Res., 108, 11.
Seymour, J. R., Seuront, L., Doubell, M. et al. (2006) Microscalepatchiness of virioplankton. J. Mar. Biol. Assoc. U.K., 86, 551–561.
Simon, M., Alldredge, A. L. and Azam, F. (1990) Bacterial carbon dy-namics on marine snow. Mar. Ecol. Prog. Ser., 65, 205–211.
Simon, M. and Azam, F. (1989) Protein content and protein synthesisrates of planktonic marine bacteria. Mar. Ecol. Prog. Ser., 51,201–213.
Smith, D. C. and Azam, F. (1992) A simple, economical method formeasuring bacterial protein synthesis rates in seawater using3H-leucine. Mar. Microb. Food Webs, 6, 107–114.
Suttle, C. A. (2007) Marine viruses: major players in the global ecosys-tem. Nat. Rev. Microbiol., 5, 801–812.
Taylor, A. G., Goericke, R., Landry, M. R. et al. (2012) Sharp gradi-ents in phytoplankton community structure across a frontal zone inthe California Current Ecosystem. J. Plank. Res., 34, 778–789.
Thingstad, T. F., Hagstrom, A. and Rassoulzadegan, F. (1997)Accumulation of degradable DOC in surface waters: is it caused bya malfunctioning microbial loop? Limnol. Oceanogr., 42, 398–404.
Van Wambeke, F., Lefevre, D., Prieur, L. et al. (2004) Distribution ofmicrobial biomass, production, respiration, dissolved organic
T. J. SAMO ET AL. j MICROBIAL DISTRIBUTION AND ACTIVITY ACROSS A FRONT IN THE CCE
813!

!
!
46
!!
carbon and factors controlling bacterial production across a geo-strophic front (Almeria-Oran, SW Mediterranean Sea). Mar.Ecol.-Prog. Ser., 269, 1–15.
Videau, C., Sournia, A., Prieur, L. et al. (1994) Phytoplankton andprimary production characteristics at selected sites in the
geostrophic Almeria-Oran front system (SW Mediterranean Sea).J. Mar. Syst., 5, 235–250.
Yang, Y. H., Motegi, C., Yokokawa, T. et al. (2010) Large-scale distri-bution patterns of virioplankton in the upper ocean. Aquat. Microb.Ecol., 60, 233–246.
JOURNAL OF PLANKTON RESEARCH j VOLUME 34 j NUMBER 9 j PAGES 802–814 j 2012
814
!
!

47
CHAPTER 4
Rates of single-cell growth, protein, and carbon production rates in natural marine bacterial populations using the methionine analog homopropargylglycine

48
Rates of single-cell growth, protein, and carbon production rates in natural marine
bacterial populations using the methionine analog homopropargylglycine
Ty J. Samo, Steven P. Smriga, Francesca Malfatti, Farooq Azam
Scripps Institution of Oceanography, University of California San Diego, 9500 Gilman
Dr., La Jolla, CA 92093-0202
Abstract
The application of copper(I)-catalyzed cycloaddition, or “click”, chemistry to
biological and biochemical research has recently become a simple and powerful method
for probing the synthesis and turnover of macromolecules in model metazoans and
Escherichia coli. This technique was applied to natural and laboratory samples of
heterotrophic marine bacteria in order to microscopically observe active cells and
subsequently measure and compare single cell protein synthesis and growth rates.
Following incubation with the methionine bioortholog homopropargylglycine (HPG),
click processing revealed labeled cells exhibiting wide ranging signal intensities.
Comparisons of these labeled cells to microautoradiography using 35S-methionine
showed nearly identical labeling percentages, which were corroborated by competitive
inhibition of 35S-methionine in natural seawater by HPG. Seawater samples collected at
Scripps Pier from November 2009 – October 2011 showed labeling percentages of 15 –
100%, demonstrating the sensitivity of the protocol. A conversion factor enabled the
estimation of protein synthesis rates from the signal intensity of each cell, and provided
average values of ~1.5 – 12 fg cell-1 d-1. The average rates of the top 10% and bottom
90% of cells ranged from ~8.5 – 51 fg cell-1 d-1 and ~0.78 – 9.0 fg cell-1 d-1, respectively,

49
and represented the contribution of the most active and less active members of the
community. Frequency distribution plots of activities arranged in 0.05 fg bins followed
power law functions, and were subsequently used as comparative metabolic signatures
for each of the sampling dates. This method and its application reveal a previously
unknown range of production rates in a substantial fraction of slow growing natural
marine bacterial populations previously considered inactive, and represents an approach
to quantitatively and more adequately address questions on growth regulation and
biogeochemical contributions of these consortia. Overall, click chemistry will be useful
in studying the mechanistic responses of heterotrophic bacteria to an assortment of
physical, chemical, and biological variables.
Introduction
Marine bacteria and archaea communities significantly affect global ocean
biogeochemical cycles through their metabolism and growth reflecting their adaptive
biology and response to ecosystem conditions and perturbations in their (micro-)
environments. It has now been well established that the pelagic environment offers
variety of microhabitats within an organic matter continuum to a bacterium. Seawater
contains a great variety and abundance of gels and particles that create a dynamic
architecture and surfaces presumably varying in their chemical and physical attributes.
Adaptive response (particularly growth) of individual bacteria to these microhabitats will
help understand the environmental regulation of bacteria on biogeochemical activities. It
should also help test hypotheses on the significance of microscale heterogeneity for the
maintenance of bacterial diversity in the ocean.
50
Previous studies have shown microscale variation in bacterial community
composition and activity (Long & Azam 2001b, Barbara & Mitchell 2003, Seymour et al.
2005). The challenge is to now develop highly sensitive and quantitative methods for
individual based biogeochemistry. The eventual goal is “see” bacterial activity in its 3D
microenvironment. This is currently not feasible due to technical constraints. Individual
cell growth is currently studied by 3H-based microautoradiography (Fuhrman & Azam
1982) and the use of a non-radioisotopic, fluorescence-based method using the thymidine
analog bromodeoxyuridine (BrdU; Hamasaki et al. 2004). Microautoradiography is a
powerful technique and has been extensively used for decades. However, it is difficult to
quantify the incorporation. Also, it is a slow and tedious process. Further, it is desirable
not to have to use radioisotopes for health and regulatory considerations. The BrdU
method overcomes some of the difficulties of 3H-thymidine microautoradiography
method, and has been adapted and used for individual cell growth measurements (Tada et
al. 2010).
We have now taken advantage of an exciting recent development of the potential
of copper catalyzed azide-alkyne cycloaddition (“click”) chemistry (Best 2009; below)
for measuring protein synthesis rates of individual bacteria. It is a fluorescence-based
method that is highly sensitive and easy to use, and may help address hypotheses on
marine bacterial ecology not previously accessible. An additional advantage is that the
method uses fluorophores bound to a small molecule (compared with the BrdU method
that uses a BrdU monoclonal antibody), so it is not necessary to permeabilize the cells.
The reaction is simply a conjugation of an azide to an alkyne group in the
presence of copper (I) via the formation of a stable triazole (Rostovtsev et al. 2002,

51
Tornoe et al. 2002). The target organism(s) is incubated with azide- or alkyne-
functionalized analogs. These bioorthogonal molecules are structurally similar to various
organic monomers such as thymidine or, in this paper, methionine. Following appropriate
washing and fixation, the sample is incubated with copper (II), an appropriate ligand, a
reducing agent, a buffer, and a fluorophore (linked to either an alkyne to react with the
azide of the incorporated analog, or vice versa) to fluorescently label the analog (Beatty
et al. 2005, Salic & Mitchison 2008). The technique allows rapid sample processing.
Labeled cell fluorescence intensity can be quantified using an epifluorescence
microscope and a CCD camera, enabling the photon flux from the fluorophore covalently
bound to the analog to be measured. The spectrum of 1000s of individual cell activities
can then be compared within a sample as well as among samples, and provides
observations on the distribution of metabolisms within a natural community or in
response to experimental perturbations.
We have employed click chemistry to measure protein synthesis in natural
microbial assemblages. Of immediate interest is visualizing and quantifying HPG
incorporation for single-cell based estimates of protein synthesis rates in marine bacteria.
This technique complements our recent study of nucleic acid incorporation quantified via
click reactions (Smriga et al., in preparation) and may allow simultaneous interrogations
of per cell DNA and protein synthesis. Importantly, with this method it is possible to
visualize cell-cell and cell-organic matter interactions and quantify the importance of cell
sizes, lifestyles, microhabitats and associations. By measuring cell volume-based carbon
content and signal intensity-based carbon production, individual cell growth rates can be
52
measured. It has the potential to yield bulk bacterial production as well. Further
development of the method may assist studies of carbon flow in the microbial loop.
Materials & methods
Field locations and collection
Seawater was collected from a variety of sites representing bacteria from different ocean
ecosystems. Preliminary experiments were conducted with water obtained off Scripps
Pier (32° 52.02’ N, 117° 15.43’ W). As part of the Southern California Coastal Ocean
Observing System (SCCOOS; www.sccoos.org), temperature, salinity, as well as
fluorometry-based and extracted chlorophyll measurements are routinely measured.
Incubation and sample processing
Working solutions of the methionine analog L-homopropargylglycine (HPG; Fig.
1) were prepared in DMSO at 20 – 2000 µM final concentration. Incubations were
performed with 1, 2, 10, 20, or 2000 nM HPG for 15 min to 7 h. Field samples were
incubated at in situ temperature and protected from light. Experiments with bacterial
isolates were performed at room temperature under conditions employed during
cultivation.
Following incubation, samples were fixed with 0.2 µm-filtered formaldehyde (2%
minimum) and filtered onto white 0.2 µm pore size polycarbonate membrane filters
(Nuclepore track-etch, GE Whatman, Piscataway, NJ). Click chemistry processing of
samples was completed using the Click-iT reagent kit (Invitrogen, Carlsbad, CA) using
the mixture detailed in Table 1. Each filter was cut into ~1/8 – 1/6 slices using a sterile

53
razor blade or surgical scissors and placed onto a glass microscope slide. The remaining
filter was stored (dark, -20°C). The processing steps were completed in darkened
conditions to minimize fluorophore photobleaching and reduce azide group
decomposition (Abbenante et al. 2007). Staining of bacterial cells was achieved per
Glöckner et al (1996), and used antifade mounting media to maintain signal intensities
(Patel et al. 2007). The protocol is described in Figure 2. To reduce background signal the
filter-transfer-freeze (FTF) technique was also applied (Hewes & Holm-Hansen 1983).
This approach was applied to all samples filtered on 0.22 µm filters.
Microscopy and acquisition settings
Slides were visualized on a Nikon TE2000-U inverted microscope using a Plan
Apochromat VC 100x, 1.4 numerical aperture oil immersion objective with illumination
from an Exfo Xcite series 120 mercury lamp (Lumen Dynamics Group, Mississauga,
Ontario, Canada). Images were acquired and analyzed using NIS-Elements (Nikon
Instruments Inc., Melville, NY). Each image consisted of three channels with specific
excitation and emission filters: 350/50 nm excitation with 457/50 nm emission for
DAPI-stained cells, 490/20 nm excitation with 528/38 nm emission for the Alexa Fluor
488® signal from incorporated HPG, and 555/28 nm excitation with 617/73 nm emission
for chlorophyll autofluorescence of cyanobacteria and eukaryotic microalgae. Ten to
twenty fields were captured, with exposure times from tens of milliseconds to a few
seconds. After optimizing the exposure time for each channel to ensure maximal,
unsaturated pixel intensities, these settings were maintained throughout the acquisition of
the sample set. The lookup tables (LUTs) for each of the three image channels were

54
adjusted to facilitate easy observation, and the binary editor was used to manually include
cells with signal intensities slightly higher to that of the background.
Controls and incorporation specificity
Several killed and experimental controls were completed to assess non-specific
binding of HPG or Alexa Fluor® 488, identify false positives from background signals,
and confirm the specificity of HPG as a methionine analog. Although it has been
demonstrated that methionyl-tRNA synthetase can bind to and incorporate HPG into
protein (Wang et al. 2008), we asked if this observation could be expanded to natural
marine microbial communities, and questioned the ability of other amino acids to reduce
labeling by influencing uptake, incorporation, or cleavage of post-translated HPG.
Killed controls. The purpose was to identify false positive labeling. Two controls
were made during several experiments. 1) Samples were fixed with 2% formaldehyde
before adding HPG. 2) No HPG was added before incubation.
HPG-methionine competition. These experiments tested the competitive ability of
methionine to reduce or eliminate HPG uptake. Methionine was added at 0 (HPG only), 1
µM or 20 µM plus 20 nM HPG to seawater and incubated 0.5, 1, 4, and 6 h. Samples
were processed as above and visualized to determine possible inhibition of incorporation
of HPG.
Chloromphenicol inhibition of HPG incorporation. Because chloramphenicol
inhibits peptidyl transferase activity of sensitive bacterial ribosomes, we reasoned it may
inhibit HPG incorporation into protein while testing method specificity. Chloramphenicol
55
was added at 50 µg ml-1 and incubated with 20 nM HPG for 1 and 6 h. The samples were
then processed on filters compared to no-chloramphenicol controls.
HPG inhibition of methionine uptake. Bulk incorporation experiments using 35S-
methionine were conducted to ascertain the ability of HPG to reduce methionine
incorporation. Four treatments were employed, using whole Scripps Pier seawater
incubated for one hour with 2 nM 35S-methionine, 2 nM 35S-methionine + 20 nM HPG, 2
nM 35S-methionine + 200 nM HPG, and 2 nM 35S-methionine + 2 µM HPG. Samples
were prepared and processed using the centrifugation method (Smith & Azam 1992).
Further bulk incorporation experiments were conducted with 35S-methionine to
identify HPG as a competitive, noncompetitive, or mixed inhibitor of methionine. Five
concentrations of 35S-methionine + cold methionine were incubated with unfiltered
Scripps Pier seawater in the presence of three HPG concentrations as noted in Table 2.
The specific activity of the radioactive methionine was adjusted proportionately to the
concentration of cold methionine added. Triplicate measurements and duplicate blanks
were used to generate a Michaelis-Menten plot from which Km, Vmax, and Ki values were
calculated based on non-linear regressions calculated in GraphPad Prism software
(Michaelis & Menten 1913). These numbers were then used to assess the uptake kinetics,
substrate preferences, and competition between 35S-methionine and HPG in natural
seawater bacterial communities. We assumed that all replicates had similar permease and
other cellular transport enzyme concentrations.
Microautoradiographic and bulk uptake evaluation. Parallel incubation
experiments were designed to compare microautoradiographic labeling percentages

56
between bacterial communities amended with HPG versus those pulsed with 35S-
methionine.
In the first parallel incubation experiment, seawater was incubated with 1 or 20
nM HPG alongside a separate incubation of 2 nM 35S-methionine + 18 nM methionine
and incubated for 1 hour in the dark. Inoculation, incubation parameters, and processing
steps for HPG were identical to those described above. Following incubation with
radiolabeled amino acid, samples were fixed at 2% final concentration formaldehyde for
at least 15 minutes. Killed controls were prepared by adding each sample to a mixture of
radiolabeled amino acid and formaldehyde. After incubating, the samples were then
filtered onto 0.2 µm pore size polycarbonate filters backed with 0.45 µm pore size
mixed cellulose ester filters (Isopore membrane filters & MF membrane filters,
Millipore, Billerica, MA). Each well and filter was rinsed with 0.2 µm filtered 1x PBS
or Milli-Q water. The filters were then dried on absorbent tissue and stored at –20°C
until processing.
The aim of the second parallel incubation experiment was to confirm the results
of the first while also observing the reduction in labeling percentages by HPG or
methionine in microautoradiographic or Click-processed samples, respectively. The first
setup consisted of bulk measurements of 35S-methionine uptake performed in triplicate
with duplicate 5% TCA-killed controls with the following concentrations: 1) 2 nM 35S-
methionine + 18 nM methionine, 2) 2 nM 35S-methionine + 18 nM methionine + 200 nM
HPG, 3) 2 nM 35S-methionine + 18 nM methionine + 2 µM HPG. The samples were
processed via the centrifugation method. The second microautoradiography setup was
completed with duplicate experimental and duplicate controls with the identical 3 groups

57
of concentrations as the bulk measurements. The third and final setup for HPG and Click
processing was performed in duplicate using these concentrations: 1) 20 nM HPG, 2) 20
nM HPG + 2 µM methionine, 3) 20 nM HPG + 2% formaldehyde, 4) 200 nM HPG, 5)
200 nM HPG + 2 µM methionine, 6) 200 nM HPG + 2% formaldehyde.
For the filters containing 35S-methionine-labeled microbes, each membrane filter
was cut into a 1/8 – 1/4 piece under normal light conditions. Preparations for
microautoradiography were performed under darkroom conditions using a Kodak GBX-2
safelight with a 15 W bulb placed approximately 5 meters away and pointed toward the
work area. This extremely faint light ensured low background signal, but necessitated the
use of night vision monocular goggles (D-112MG; Night Optics USA, Inc., Huntington
Beach, CA). We developed an emulsion coating and cell transferring protocol based on
those from previous publications (Teira et al. 2004, Longnecker et al. 2010). Ammersham
LM-1 emulsion was melted at 43°C for 15 minutes to 1 hour. Slides were dipped in
emulsion for 5 seconds, allowed to drip for 5 seconds, wiped to remove emulsion on the
back of the slide, and immediately placed onto a flat sheet of aluminum foil on ice. After
5 – 10 minutes, a filter slice was placed cell side down onto the emulsion and the slide
was returned to the ice-cold foil. When this was completed for all of the filters, each slide
was then placed in a slide box with desiccant. The slide box was sealed with black tape,
wrapped in foil, placed in a cardboard box, left at room temperature for 1 hour, and then
transferred to 4°C for 24 - 72 hour exposure.
Processing of the slides was completed using Kodak D19 developer and fixer. In
50 ml tubes, 1.6 g of developer was mixed with 40 ml of milli-Q and dissolved at 43°C
for 15 minutes. Nine grams of fixer was mixed with 40 ml milli-Q at room temperature

58
until fully dissolved. Four slide mailers corresponding to the developer, developer wash,
fixer, and fixer wash were filled with 20 ml of appropriate liquid. Under darkroom
conditions, the slides were removed from the darkened box, and the filters on each slide
were then removed gently with forceps, thereby transferring the cells and exposing the
emulsion to the processing chemicals.
Slides were dipped in developer for 4 minutes, washed for 10 seconds, then
dipped in fixer for 5 minutes, washed again for 5 minutes, and then allowed to dry on a
kimwipe. Once the slide was dry, 50 – 100 µl of 1 µg ml-1 DAPI was added to the
location of the cells and incubated for 10 minutes. The slide was then washed in
autoclaved and filtered milli-Q and dried again. A coverslip with #1.5 thickness was
mounted to the slide with 15 - 20 µl of the antifade mounting media.
Visualization was performed using the Nikon TE2000-U inverted microscope
with 350/50 nm excitation and 457/50 emission to observe DAPI-stained bacteria.
Transmitted light was used to observe the presence or absence of exposed emulsion
grains. Images were acquired with approximately 2-second exposure times to document
each experiment and permit analyses at a later date. Percent labeling was calculated as
the number of DAPI-labeled cells located within exposed emulsion divided by the total
number of DAPI-labeled cells in each field of view. These values were arcsine
transformed, averaged, and then back transformed.
Signal quantification of individual bacterial cells
Labeling percentages. The percentage of labeled cells imaged on polycarbonate
filters was calculated using the following equation:

59
[(# HPG+ cells) – (# TRITC+ cells)] ÷ (# DAPI+ cells )
This equation was based on the observation that control samples not amended
with HPG displayed bright green cells in the FITC channel. These were presumably
cyanobacteria and/or picoeukaryotes with autofluorescence emission that carried over
into the FITC channel. Autofluorescent cells were therefore excluded due to the observed
carryover and reduce the possibility of false positives.
Labeled cells imaged on slides via the FTF technique were selected in the
software to analyze the fluorescence intensity information (described in the following
section). This data was comprised of a minimum of 10 fields containing at least 20 cells.
After background subtraction, the sum intensity (S.I. = total amount of fluorescence
emitted from the cell) values greater than zero from all of the images combined were
used to calculate percentage of labeled cells:
(# of cells with FITC sum intensity > 0) ÷ (total # of cells imaged)
Single-cell signal measurements. Most of the filters from experiments and pier
samples were re-processed and transferred to coverslips using FTF. The binary
thresholding feature in the Nikon Elements software was used to select individual cells in
the DAPI channel in order to quantify both labeled and unlabeled cells in an unbiased
fashion. Cyanobacteria and other sources of red fluorescence that appeared to crossover
into the green emission channel were manually removed. Once the selections were

60
completed, data for cell area, width, and length were exported to Microsoft Excel. Signal
intensities in the FITC channel were exported as two separate parameters: sum intensity
and mean intensity, equivalent to the sum intensity divided by the numbers of pixels. The
number of pixels of each cell was calculated by dividing the area of the cell (µm2) by the
(# pixels/µm)2.
To accurately quantify signal intensities from individual cells and the whole
community, a stringent subtraction of background and blanks was employed.
Formaldehyde-fixed control samples revealed that HPG and/or Alexa Fluor 488® were
adsorbing onto bacterial cell surfaces and creating faint signals. It was concluded that the
background of the glass slide did not contribute to background signals because in some
cases the background mean intensity was greater than the mean intensity of a control cell.
Therefore, the mean FITC channel intensities of all cells from 5 different fields in the
HPG + 2% formaldehyde controls (>200 cells, red autofluorescing cells removed) were
averaged. This average background was subtracted from the HPG+ samples by
multiplying this value by the pixel area of each cell and then subtracting this number
from the sum intensity of the cell.
A conversion factor was applied to transform the sum intensities into a carbon
production and growth rate for each cell (method, results, and discussion below). The
values were then averaged, including averages for the top 10% and bottom 90% of cells.
Signal intensity validation. To confirm constant illumination by the mercury bulb
and to ensure the linearity of fluorescence intensity vs. exposure time, an InSpeck Green
Microscope Image Intensity Calibration Kit was used (Life Technologies, Grand Island,
NY). The 0.3% relative intensity beads were imaged on three separate dates at 2, 10, 25,

61
100, and 200 ms exposure times. Additionally, the 0, 0.3, 1, 3, 10, 30, and 100% relative
intensity beads were imaged at a constant 30 ms exposure time.
Signal intensity conversion to single cell carbon production and growth rate
The bacterial isolates AS1 and ALT199 (Alternomonas sp.) were acclimated to
and maintained in GF/F filtered and autoclaved seawater to simulate natural seawater
conditions and eliminate potential responses to high organic nutrient load in ZoBell
media (Pedler et al., in prep). Each isolate was inoculated into 3 flasks containing 100 ml
of GF/F filtered and autoclaved seawater at a starting concentration of 102 cells ml-1 from
exponentially growing cultures. All six flasks were incubated at room temperature for 16
hours, at which point concentrations were expected to be ~103 cell ml-1 following 4
doublings as confirmed via DAPI staining. HPG was added to one flask of each isolate at
0 nM, 2 nM, and 20 nM concentrations, and 20 ml samples were formaldehyde fixed
(2%) and filtered after 24 and 48 hours. Cell counts and click chemistry processing was
performed on each sample and imaged on the Nikon microscope. Images for the FITC
channel were acquired with 200 ms acquisition because the cells were very brightly
labeled. Cell volumes (V) were calculated according to (Bratbak 1985) by measuring the
lengths and widths of each cell. Cellular protein content (P) in fg was estimated using P =
88.6 x V0.59 and converted to carbon (C) by multiplying by 0.86 (Simon & Azam 1989,
Malfatti et al. 2010). After background subtraction, sum intensity data points for each
isolate in 2 nM and 20 nM HPG were divided by volume-based cell carbon to obtain a
conversion factor of S.I./fg carbon. This value was multiplied by 5 to apply the 200 ms
exposure to images acquired from the standard 1 s exposure (1 ÷ 0.2 = 5). After sorting

62
in ascending fashion, the average values of the top 10% for 2 nM and 20 nM HPG
conditions were deemed appropriate conversion factors and later applied to HPG sum
intensities acquired from natural samples and other experiments to obtain single-cell
protein or carbon production (scBPP, scBCP), generation times (g), and growth rates (µ)
using the following equations:
g = P ÷ scBPP
µ = LN(2) ÷ g
Activity upshift experiment
Confirmation that enhanced cell growth resulted in elevated HPG signal intensity
was performed by comparing 0.6 µm filtered seawater amended with and without glucose
and ammonium chloride. 300 ml of the filtrate was divided into two-500 ml glass bottles,
and 1 µM of both glucose and ammonium chloride was added to one bottle. Duplicate 2
ml samples were taken from each bottle for bacterial abundance and 1 hour incubations
with 20 nM HPG at 0, 4, 8, 12, and 24 hours, including duplicate formaldehyde controls.
Images were acquired as above, and processed for activity measurements as described
below.
Scripps Pier monitoring experiment
To monitor dynamics of HPG uptake at the pier, samples were taken at 12pm,
4pm and 8-9pm for 3 consecutive days using the standard incubation parameters with 2
ml volumes. Images were acquired as described above, and processed for activity
measurements as described below. Automated measurements of chlorophyll, temperature,

63
and salinity and production and growth rates were analyzed using Spearman rank
correlations.
HPG uptake by particle-attached bacteria
The incorporation and visualization of HPG within particle-associated bacterial
cells was tested to determine if the method could detect elevated cell production and
labeling intensity in comparison to other particles and unattached cells. Whole seawater
(40 ml) was added to glass culture vials. In duplicate, three sets of vials were treated as
follows: 1) 20 nM HPG, 2) 20 nM HPG + 2% formaldehyde (final conc.), 3) 2 µM HPG,
4) 2 µM HPG + 2% formaldehyde, 5) No addition. The three sets of these manipulations
corresponded to incubation times of 1 hr., 48 hrs., and 8 d. At each time point, 2 and 30
ml was removed from each vial, fixed with 2% formaldehyde, and filtered respectively
on 0.22 µm or 8 µm white polycarbonate filters. All filters were Click processed
normally, but the FTF technique was not applied to the 8 µm filters to minimize damage
to particles and phytoplankton and maintain the positions and orientations of attached
bacteria. Ten image fields were acquired for the 2 ml samples while 10 particles greater
than 10 µm in diameter and containing at least 20 cells were imaged on the 8 µm filters.
Values were log10-transformed to ensure normality for statistical tests.
HPG-based activity structure
Comparison of HPG-based protein production profiles among all the sampling
dates was achieved by graphically representing the frequency distribution of cell-specific
production in log10-log10 charts of percentage of cells vs. fg cell-1 hr-1. Using 0.05 fg cell-1

64
hr-1 bins, the percentage of cells within each bin was plotted. A power function was fit to
each series of points, and the resulting equation was used to generate a continuous line.
Ranges of the axes were adjusted after applying the log10 scale to enable fine or coarse
observation of the community production structures in relation to each other.
Results & Discussion
Controls and incorporation specificity
Killed controls. Non-specific labeling did not occur in any samples. However,
autofluorescence of cyanobacteria was seen to carry over into the FITC channel in HPG-
samples. This necessitated their removal from signal intensity measurements.
HPG-methionine competition. Methionine addition partially or completely
eliminated HPG signals, supporting the method’s basic premise that HPG competitively
replaces methionine in protein (Fig. 3).
Chloromphenicol inhibition of HPG incorporation. Chloramphenicol reduced the
percentage of HPG labeled cells by 10-fold (15.1% to 1.4%) and 44-fold (28.4% to 0.6%)
in the 1 and 6 hour incubations, respectively. These results support HPG being actively
incorporated into protein by bacterial ribosomes.
HPG inhibition of methionine uptake. The subsequent set of bulk incorporation
experiments further explored the mechanism of methionine-HPG inhibition and identified
the inhibitory constant, Ki. The results showed that HPG is a competitive analog for
methionine in natural marine systems; increasing inhibitor (HPG) concentration had no
effect on Vmax (Fig. 4). These values provided an average Ki for the three HPG

65
concentrations. Because the inhibition constant (also known as the dissociation constant,
Kd, for the inhibitor and enzyme) is equivalent to the concentration at which half of HPG
is free and half is bound to the enzyme, and since the velocity of enzyme reactions is
proportional to the concentration of the enzyme-substrate (or enzyme-inhibitor) complex,
then Ki = Km for HPG, which was calculated to be 372.8 nM. The much smaller Km for
methionine (~30 nM) confirms that while HPG substitutes for methionine it has ~ 100-
fold lower affinity for incorporation in natural marine prokaryotic communities. This
suggests that our protocol employing 20 nM HPG is sufficient to minimize extracellular
competition since methionine concentrations typically found in seawater are 100x less
(200 pM)
Microautoradiographic and bulk uptake evaluation. Bulk seawater experiments
showed that adding equimolar methionine or HPG as competitors of 35S-methionine
showed that HPG caused much lower inhibition than methionine (Fig. 5). Thus, uptake of
methionine is kinetically preferred over HPG.
Parallel incubations of Scripps Pier seawater with 35S-methionine or HPG
revealed similar percentages of labeled cells following microautoradiographic or click
protocol. However, this result depended on whether HPG samples were observed on
filters or using FTF protocol (Table 3). The filters method yielded percentages
comparable to microautoradiography while percentages from FTF (lower background)
were ~ 1.5 – 3-fold higher (Fig. 3). Importantly, this indicated that the click protocol has
a higher sensitivity for detecting active cells than microautoradiography.
General observations

66
Labeling percentages and the importance of sample processing. The percentage
of HPG positive cells from Scripps Pier ranged 9% - 47% on filters. Some labeled cells
were easily detectable on filters due to strong signal intensity despite high background.
The Nikon software was particularly helpful in the manual selection of cells required
when faint DAPI-stained cells were unable to be adequately separated from background
signal or associated cells were measured as single loci. The filter-transfer-freeze
technique reduced background by ~5-fold and increased the percent-labeled estimates to
15% - 100% (Fig. 6); presumably background reduction enabled visualization of faintly
labeled cells (Fig. 7). However, the transfer efficiency was 69% to 200%, making cell
concentration calculations unreliable. This wide range of transfer efficiency is likely due
to the incomplete transfer of cells to coverslip and accumulation of transferred cells to
areas where the remaining condensation pooled. Assuming equal transfer efficiency of
both labeled and unlabeled cells, variable incomplete and variable transfer efficiency
should not affect the percentages. Indeed, large differences in labeled cell percentages
were not seen between duplicates in which transfer efficiencies were very different.
Cell labeling characteristics. Labeled cells frequently had a larger signal area
than DAPI labeling. This suggests distribution of HPG labeled protein to both intra- and
cell surface compartments; alternatively, the nucleoid labeling seen with DAPI may
underestimate cell volume (FIG 8)(Fig. 8; Straza et al. 2009). We also note that many
other HPG-positive cells did not exhibit this characteristic. The cause of these differences
were not investigated, but they may signify sub-cellular incorporation patterns in
different physiological conditions. Additionally, we often saw dividing cells with label
evenly distributed between two cells. Occasionally only one of the daughter cells was

67
HPG positive (Fig. 9). Our protocol was not designed to distinguish mother and daughter
cell, or to explain why only one cell would be labeled. Perhaps, one of these cells was
senescent.
Utility in other fields of microbial ecology. The HPG method in natural marine
environments may be useful to quantify protozoan grazing and/or viral infection, lysis,
and burst size in marine prokaryotic communities. We noticed in our samples some
heterotrophic nanoflagellates (HNF) with bright green signals over the whole cell or
within concentrated sections of their cytoplasm. This suggests that these grazers were
consuming HPG labeled cells and then incorporating HPG into biomass, yet we cannot
rule out that some nanoflagellates directly incorporate HPG into protein. The scenario
was not explored in detail and may be due to ingestion of cyanobacteria that, as
mentioned earlier, exhibit strong green emissions naturally and in the absence of HPG.
Further study should clarify whether HPG labeled bacteria can be used to identify and
quantify bactivorous grazing.
Signal intensity conversion to single cell carbon production and growth rate
The average conversion factor from the top 10% values for both ALT199 and
AS1 was set at 122,775.0827 S.I. units fg-1 protein. We concluded that this approach
reduced the influence of anomalously high intensity measurements, and provided an
asymptotic value that most closely represented an accurate conversion factor. Because the
overall approach was based on bacterial isolates that grew well in seawater without
nutrients, the conversion factor is likely a realistic figure that was not based on growth
traits influenced by excess organic matter.

68
This experiment provided a straightforward calculation of biogeochemically
relevant rates based on cell fluorescence that, when applied to the sum intensities of other
HPG datasets, provided realistic single-cell values that were in agreement with past
studies of cell specific carbon production estimation. Minimum and maximum rates of 1
and 100 amol Leu cell-1 d-1 were reported by Sintes and Herndl (2006), which is
equivalent to 0.13 and 13 fg C cell-1 hr-1 assuming 3.1 kg C per mole of leucine
incorporated (Simon & Azam 1989). The method afforded the detection of very low
values with a minimum of ~ 10-6 fg C cell-1 hr-1 while the maximum rate was 5.5 fg C
cell-1 hr-1. However, the accuracy of the lowest values is has a lower limit set by the
fluorescence of the control cells. Due to the fact that the faint fluorescence of the control
cells converts to an average carbon production value of 0.05 fg C cell-1 hr-1, this
represents the base of detection of HPG-based scBCP.
We calculated average scBCP for each of the 21 dates that HPG incubation
experiments were performed (Table 4). The average values provided a snapshot of the
single cell community production and ranged from ~ 0.1 – 0.5 fg C cell-1 hr-1. The
average scBCP of the top 10% and bottom 90% was examined to identify the
contribution of the most active versus remaining members of the community. These
values ranged from ~ 0.4 – 2.1 fg C cell-1 hr-1 and ~ 0.04 – 0.4 fg C cell-1 hr-1 for the top
10% and bottom 90%, respectively. The 10% to 90% ratios permitted comparison among
all of the dates, and showed that the most active cells were approximately 5 to 16 times
more so than the remaining active cells.
The sums of scBCP and ratios for the top 10% and bottom 90% enabled
comparisons among the dates to determine the relative influence on carbon cycling by the

69
partitioning of activities in the bacterial community (Table 5). Ratios greater than 1
highlight dates when the cumulative scBPP of the top 10% of active bacteria was greater
than the cumulative scBPP of the rest of the active cells. Ratios less than 1 denote when
the bottom 90% of the community contributed more to carbon production. Overall, the
ratios were evenly distributed above and below 1 (ratios > 1 in 11/21 dates).
A summary of µ calculated for each date is organized in Table 6. The broad
distribution of growth rates combined with many low values resulted in averages ranging
from ~ 0.09 – 0.35 d-1. Meanwhile, averages of the top 10% showed that cells double
approximately once per one to four days. Maximum growth rates approached 2.5 d-1.
Because these cells represented approximately 1/1000th of the community containing ~ 3
x 106 cells ml-1, it is possible that 3 x 10³ cells ml-1 were rapidly growing and
disproportionately assimilating carbon in that particular water parcel on that date. The
eventual fate and contribution to microbial community structure of these cells remains a
topic for future research.
The quantitative nature of the method has afforded a novel view of the single-cell
growth and carbon cycling, and may represent an attractive approach to address
unanswered questions in marine microbial ecology and elemental cycling. For example,
what are the factors explaining how and why the most active portion of the community is
growing or incorporating carbon at a rate that is more, less, or similarly than the
remaining community? Or, conversely, what influences the bottom 90% community to
be more, less, or as active as the top 10%? Experiments combining HPG incubations with
measurements identifying top-down control by viruses and/or protists may help to
elucidate some of these dynamics. Applying HPG-based activity quantification alongside
70
analyses of the quantity and quality of organic matter available for bacterial incorporation
into biomass may assist in characterizing the bottom-up dynamics influencing bacterial
growth and carbon cycling.
Surprisingly, the method did not agree with previous observations noting the
positive relationship between cell size and activity (Gasol et al. 1995, Lebaron et al.
2002), as regressions of sum intensities and mean intensities vs. biovolume were not
significant (data not shown). Given the diversity of metabolic characteristics within
marine bacterial communities, this result is not unexpected. The propensity for certain
members of the community to exhibit highly specific metabolic traits has been discussed
(del Giorgio & Gasol 2008), and highlight how complementary measurements provided
by HPG incorporation expand our knowledge on the physiological states and rates that
partially govern individual bacterial subsistence. Moreover, quantifying this survival with
HPG in concert with other approaches may highlight the resulting influences over the
cycling of carbon, nitrogen, phosphorous, and other marine elements (Smith & del
Giorgio 2003).
Activity upshift experiment
Seawater cultures amended with 1 µM glucose and 1 µM NH4Cl displayed
significant, linearly increasing cell-specific production over time in comparison to control
samples (Fig. 10). These results supported the utility of HPG incorporation as a reliable
detector of growth enhancement in single cells.
Scripps Pier monitoring experiment

71
The goal of this three-day/night observation of HPG incorporation was to detect
temporal variability patterns (e.g. diel) in bacterial activity at a fixed location and
characterize relationships with chlorophyll, temperature, and salinity. Sharp changes in
bacterial abundance were observed alongside strong dynamics in cell activities (Fig. 11a).
Day 1 was characterized by stable abundances throughout the day, and exhibited a
significantly elevated average cell-specific protein production and growth rate at 12pm.
The abundance and activity data from day 2 were elevated compared to day 1, and a
striking observation was the greatly enhanced abundance, protein production, and growth
rate at 4pm. The cell abundance-based growth rate of the community between 12pm and
4pm on day 2 (~5 d-1) was not similar to average HPG-based growth rate measurement
nor the average top 10% growth rate (0.23 and 1.19 d-1, Fig. 11b & c). However, these
values were significantly elevated relative to the previous and following timepoints.
Potential explanations for this major shift include the transport of water masses
containing high abundance communities by currents, sediment resuspension and mixing
of high-density benthic bacterial communities, a surge in growth that tapered before or
during sampling, or bacterial consortia for which the conversion factor was incorrect.
Day 3 exhibited a different pattern of abundance, production, and growth rate compared
to both days 1 and 2. An extremely high abundance at 12pm decreased 3-fold by 4pm and
then 2-fold by 9pm. This trend agreed with stepwise decreases in the protein production
and growth rate, but the rates of change were different. It appears that on relatively short
timescales, the carbon cycling dynamics of heterotrophic bacterial communities rapidly
shifted in tempo.

72
Significantly positive Spearman’s rho values (p > 0 .05) were found between
chlorophyll and the 10% to 90% ratios of the average and sum production and growth
rate, with one significantly negative correlation between chlorophyll and average
production of the bottom 90%. A confluence of events likely explains these dynamics of
HPG-based physiology. The decreasing abundance and production trends on day 2
between 4pm and 8pm and day 3 between 12pm and 4pm are consistent with grazers
consuming the most active prey (del Giorgio et al. 1996). However, the ratios of the top
10% and bottom 90% active cells for cell-specific growth rate and protein production
increased (Fig. 11d), indicating the elevated abundance of more active cells and/or the
removal of less active cells. Lytic viruses may be an additional mortality agent
responsible for these observations, and in fact may induce similar enhancements in
growth, but with focused effects on certain members of the community, potentially
mildly active cells in this case (Noble et al. 1999, Weinbauer 2004). These biotic forcings
combined with the productivity (chlorophyll) and physical parameters (salinity and
temperature) at the pier may influence bacterial growth, with potential feedbacks on
trophic webs, phylogenetic structure, and elemental cycling dynamics. Yet additional
structuring mechanisms include high substrate concentration exposure and inducement of
slow growth or death (Koch 1997), lack of and/or competition for inorganic nutrients
(Thingstad et al. 1997), and sunlight and UV damage (Alonso-Sáez et al. 2006). Overall,
the HPG-based activities from this experiment provide constraints on the ecological and
biogeochemical effects arising from dynamics in cell-specific heterotrophic bacterial
growth and physiology.
73
HPG uptake by particle-attached bacteria
This investigation tested the hypothesis that heterotrophic bacterial cells attached
to particles exhibit enhanced growth performance, and identified the potential for HPG
incorporation to characterize abiotic and biotic interactions at such microenvironments.
Because methionine outcompetes and eliminates HPG incorporation, the monomerization
of proteins to amino acids (and specifically methionine) by bacteria attached to marine
organic particles would possibly reduce HPG uptake, resulting in diminished cell signal
intensity. The signal intensities of the 4 manipulations at each timepoint (unattached + 20
nM, unattached + 2 µM, particle-attached + 20 nM, particle-attached + 2 µM) were
significantly different from one another (student’s t-test, p < 0.05), except for the 48 hour
unattached + 20 nM and the particle-attached + 2 µM. Not surprisingly, the mean signal
intensities from the 2 µM HPG samples were always higher than the 20 nM, and, in the
case of the particle-attached bacteria, suggested that high HPG concentration enabled
increased incorporation in an environment of potentially high exogenous methionine
(Fig. 12). It is possible, however, that 2 µM was not sufficient to completely and
competitively overwhelm cell permease systems as the signal intensities for unattached +
20 nM and unattached + 2 µM in the 1 hour and 48 hour samples were significantly
higher than the those of particle-attached cells. Not until 8 days later did the signal
intensities from the 2 µM HPG samples exhibit significant and elevated differences from
the 20 nM counterparts, and was presumably caused by the reduced concentration of
methionine and other amino acids within the particles.
These results agree with previous studies of bacterial carbon cycling and
consumption on particles. Simon et al (1990) observed low carbon production of bacteria

74
attached to marine snow. As with Cho & Azam (1988), the authors concluded that the
depth dissipation of particulate organic carbon (POC) was due to the carbon demand of
unattached bacteria. Greater contribution of unattached cells to particle dissolution and
turnover supports our findings of higher mean sum intensities for the unattached cells at
the 1 and 48 hr. timepoints. Nevertheless, the issue of competitive inhibition remains. We
concluded that both the HPG concentration and incubation time affect the labeling
characteristics of these unattached and particle-attached bacteria, and that short
incubation times may not adequately resolve bacterial activity on particles. Either
determining the amino acid composition of the particles to confirm the absence of
methionine, or using other analogs whose natural counterpart is absent from the particle
may address this. However, several other circumstances may explain these observations.
The unique microenvironment of a nutrient rich marine organic particle likely
elicits strong competition among bacteria attempting to maintain space and a stable food
source to support cell growth and progeny release. We would therefore expect particle-
attached cells to inhibit the growth of one another if in direct competition for a particular
resource, and our observations support the potential for such antagonistic interactions
(Long & Azam 2001a). As with most natural phenomena, dynamics in cell
intensities/growth are likely indicative of several mechanisms acting in concert to
structure the composition and metabolism of the microbial community. High substrate
concentrations and antagonism-mediated reduction in cell growth on particles serve to
partially explain the dynamics observed here. Further research on this topic is needed to
clarify the relative contributions of theses mechanisms and identify the role of
spatiotemporal variability in this important component of the microbial food web.
75
HPG-based activity structure
The binning approach enabled visual comparison and contrast of the community
activity structure of unattached cells sampled from Scripps Pier. Lines that are closely
parallel or identical indicate heterotrophic communities with similar carbon production
profiles (Fig. 13). Presenting data in this fashion is one approach to simultaneously
observe the broad scale and cellular scale growth responses of marine bacteria. Exploring
additional statistical techniques to organize and model the data should augment
interpretations of ecological and geochemical functions leveraged by individual
heterotrophic bacterial activities. The distribution of activity as a power function is a
noteworthy result since nearly all evaluations of microbial activity assume Gaussian or
normal distributions within the natural community. Such a fundamental observation on
the ecology of marine bacteria may be an important insight for future assessments of
growth and prevalence of certain phylotypes. Ideally, these quantitative discernments will
inform numerical models to characterize and predict bacteria population trajectories and
their ecosystem and geochemical consequences.
Single cell growth heterogeneity of clonal bacterial isolates and implications for
marine carbon cycling by natural bacterial populations
The broad range of S.I. values measured in growing cultures of ALT199 and AS1
demonstrated the sensitivity of the method and suggested that S.I. heterogeneity is a
reflection of heterogeneous growth in each of the clonal populations. While one hundred
percent of the cells were positive for HPG at each time point, the intensity values varied

76
by an order of magnitude among all of the cells in both cultures. This observation may
reflect several mechanisms enabling marine bacteria to adapt and succeed in a variety of
environments.
As mentioned earlier, asymmetrical growth in prokaryotes is likely to have
important consequences for carbon cycling and population dynamics of marine
prokaryotic communities. Observing the wide range of intensities in clonal laboratory
cultures supports recent work on the adaptive strategy of bacterial aging in E. coli (Rang
et al. 2011). The large difference between the least and greatest signal intensities may
indicate the repeated accumulation of oxidative damage to one daughter cell (lower
intensity cells) that serves to rejuvenate the other daughter cell (higher intensity cells). If
these characteristics of clonal bacterial populations in laboratory cultures are
representative of natural marine communities, this diversity of growth rates is an adaptive
feature. Different taxa may experience different microniches at any given time, and the
mechanism of creating progeny of varying age and growth response will diversity the
metabolic portfolio to increase the likelihood of succeeding within that niche.
Conclusions
The main objective of this work was to develop a method to sensitively observe
and quantify growth of individual heterotrophic marine bacteria. Our analyses focused on
the dynamics of single cell carbon production and growth rates, and in doing so, we
obtained selectivity to characterize the silent majority of less active cells and those that
exhibit rapid growth. The spectrum of responses confirm the heterogeneous nature of
marine microbial ecosystems, and provide a powerful means to characterize the

77
functional contribution of heterotrophic bacterial metabolisms to marine carbon cycling.
As of yet, HPG incorporation has not been utilized to measure single-cell production
rates in bacteria. The protocol described here allows the sensitive, relative, and absolute
measurement of cell-specific protein synthesis. Future work should focus on the
manipulation of this method to enable bulk production estimates that can be studied
alongside the single cell data. Additionally, the application of complementary cell
visualization protocols will supplement current studies on marine microbial identities,
functions, and growth efficiencies to better predict their climatic and oceanic importance
on relevant spatiotemporal scales. For example, integrating the method with fluorescent
in situ hybridization (FISH) is a tractable manner to assign and rank the biogeochemical
influence of bacterial phylotypes on marine ecosystems as a function of low versus high
molecular weight organic matter (Cottrell & Kirchman 2000). Further, linking HPG
incorporation to measurements of cellular respiration using 5-Cyano-2,3-ditolyl
tetrazolium chloride (CTC; Sherr et al. 1999), or other redox dyes, may enable reliable
estimations of single cell bacterial growth efficiency (BGE; del Giorgio & Cole 1998).
New information on the growth responses and requirements of marine bacteria may be
obtained from the use of additional bioorthogonal compounds. Analogs for carbohydrates
and fatty acids are available and may augment the suite of single-cell activity
quantification approaches in microbial ecology. The resulting evidence may shed light on
the heterotrophic control of organic matter transformation into biomass and constrain
values of CO2 production to better inform models on the fluxes of the greenhouse gas and
microbial contributions to climate change. This method adds to the ability of microbial
ecologists and oceanographers to decipher the growth, responses, and potential

78
biogeochemical influences of single bacterial cells in the natural marine environment.
The continued development and application of such tools represents an exciting avenue
of research, and may contribute important details of microbial influence on the world
ocean.
Chapter 4, in part, is prepared for submission to the International Society for
Microbial Ecology Journal. The dissertation author was the primary investigator and
author of this paper.
References
Abbenante G, Le GT, Fairlie DP (2007) Unexpected photolytic decomposition of alkyl azides under mild conditions. Chem Commun 43:4501-4503
Alonso-Sáez L, Gasol JM, Lefort T, Hofer J, Sommaruga R (2006) Effect of natural
sunlight on bacterial activity and differential sensitivity of natural bacterioplankton groups in northwestern Mediterranean coastal waters. Applied and Environmental Microbiology 72:5806-5813
Barbara GM, Mitchell JG (2003) Marine bacterial organisation around point-like sources
of amino acids. FEMS Microbiology Ecology 43:99-109 Beatty KE, Xie F, Wang Q, Tirrell DA (2005) Selective Dye-Labeling of Newly
Synthesized Proteins in Bacterial Cells. J Am Chem Soc 127:14150-14151 Best MD (2009) Click Chemistry and Bioorthogonal Reactions: Unprecedented
Selectivity in the Labeling of Biological Molecules. Biochemistry 48:6571-6584 Bratbak G (1985) Bacterial biovolume and biomass estimations. Applied and
Environmental Microbiology 49:1488-1493 Cho BC, Azam F (1988) Major Role of Bacteria in Biogeochemical Fluxes in the Oceans
Interior. Nature 332:441-443 Cottrell MT, Kirchman DL (2000) Natural assemblages of marine proteobacteria and
members of the Cytophaga-Flavobacter cluster consuming low- and high-

79
molecular-weight dissolved organic matter. Applied and Environmental Microbiology 66:1692-1697
del Giorgio PA, Cole JJ (1998) Bacterial growth efficiency in natural aquatic systems.
Annual Review of Ecology and Systematics 29:503-541 del Giorgio PA, Gasol JM (2008) Physiological Structure and Single-Cell Activity in
Marine Bacterioplankton. In: Kirchman DL (ed) Microbial Ecology of the Oceans. John Wiley & Sons, Inc., Hoboken, N.J.
del Giorgio PA, Gasol JM, Vaqué D, Mura P, Agustí S, Duarte CM (1996)
Bacterioplankton community structure: Protists control net production and the proportion of active bacteria in a coastal marine community. Limnology and Oceanography 41:1169-1179
Fuhrman JA, Azam F (1982) Thymidine Incorporation as a Measure of Heterotrophic
Bacterioplankton Production in Marine Surface Waters - Evaluation and Field Results. Marine Biology 66:109-120
Gasol JM, delGiorgio PA, Massana R, Duarte CM (1995) Active versus inactive bacteria:
Size-dependence in a coastal marine plankton community. Marine Ecology-Progress Series 128:91-97
Glöckner FO, Amann R, Alfreider A, Pernthaler J, Psenner R, Trebesius K, Schleifer KH
(1996) An in situ hybridization protocol for detection and identification of planktonic bacteria. Systematic and Applied Microbiology 19
Hamasaki K, Long RA, Azam F (2004) Individual cell growth rates of marine bacteria,
measured by bromodeoxyuridine incorporation. Aquatic Microbial Ecology 35 Hewes CD, Holm-Hansen O (1983) A Method for Recovering Nanoplankton from Filters
for Identification with the Microscope: The Filter-Transfer-Freeze (FTF) Technique. Limnol Oceanogr 28:389-394
Koch AL (1997) Microbial physiology and ecology of slow growth. Microbiology and
Molecular Biology Reviews 61:305-& Lebaron P, Servais P, Baudoux AC, Bourrain M, Courties C, Parthuisot N (2002)
Variations of bacterial-specific activity with cell size and nucleic acid content assessed by flow cytometry. Aquatic Microbial Ecology 28:131-140
Long RA, Azam F (2001a) Antagonistic interactions among marine pelagic bacteria.
Applied and Environmental Microbiology 67:4975-4983
80
Long RA, Azam F (2001b) Microscale patchiness of bacterioplankton assemblage richness in seawater. Aquatic Microbial Ecology 26:103-113
Longnecker K, Wilson MJ, Sherr EB, Sherr BF (2010) Effect of top-down control on
cell-specific activity and diversity of active marine bacterioplankton. Aquat Microb Ecol 58:153-165
Malfatti F, Samo TJ, Azam F (2010) High-resolution imaging of pelagic bacteria by
Atomic Force Microscopy and implications for carbon cycling. ISME Journal 4:427-439
Michaelis L, Menten ML (1913) The kinetics of invertase action. Biochemische
Zeitschrift 49:333-369 Noble RT, Middelboe M, Fuhrman JA (1999) Effects of viral enrichment on the mortality
and growth of heterotrophic bacterioplankton. Aquatic Microbial Ecology 18:1-13 Patel A, Noble RT, Steele JA, Schwalbach MS, Hewson I, Fuhrman JA (2007) Virus and
prokaryote enumeration from planktonic aquatic environments by epifluorescence microscopy with SYBR Green I. Nature Protocols 2:269-276
Rang CU, Peng AY, Chao L (2011) Temporal Dynamics of Bacterial Aging and
Rejuvenation. Current Biology:1-4 Rostovtsev VV, Green LG, Fokin VV, Sharpless KB (2002) A stepwise Huisgen
cycloaddition process: Copper(I)-catalyzed regioselective "ligation" of azides and terminal alkynes. Angew Chem Int Ed 41:2596-2599
Salic A, Mitchison TJ (2008) A chemical method for fast and sensitive detection of DNA
synthesis in vivo. Proceedings of the National Academy of Sciences 105:2415-2420
Seymour JR, Seuront L, Mitchell JG (2005) Microscale and small-scale temporal
dynamics of a coastal planktonic microbial community. Marine Ecology-Progress Series 300
Sherr BF, del Giorgio P, Sherr EB (1999) Estimating abundance and single-cell
characteristics of respiring bacteria via the redox dye CTC. Aquatic Microbial Ecology 18:117-131
Simon M, Alldredge AL, Azam F (1990) Bacterial carbon dynamics on marine snow.
Marine Ecology-Progress Series 65:205-211 Simon M, Azam F (1989) Protein content and protein synthesis rates of planktonic
marine bacteria. Marine Ecology Progress Series 51:201-213

81
Sintes E, Herndl GJ (2006) Quantifying substrate uptake by individual cells of marine bacterioplankton by catalyzed reporter deposition fluorescence in situ hybridization combined with micro autoradiography. Applied and Environmental Microbiology 72:7022-7028
Smith DC, Azam F (1992) A simple, economical method for measuring bacterial protein
synthesis rates in seawater using 3H-leucine. Mar Microb Food Webs 6:107-114 Smith EM, del Giorgio PA (2003) Low fractions of active bacteria in natural aquatic
communities? Aquatic Microbial Ecology 31:203-208 Straza TRA, Cottrell MT, Ducklow HW, Kirchman DL (2009) Geographic and
Phylogenetic Variation in Bacterial Biovolume as Revealed by Protein and Nucleic Acid Staining. Applied and Environmental Microbiology 75:4028-4034
Tada Y, Taniguchi A, Hamasaki K (2010) Phylotype-specific growth rates of marine
bacteria measured by bromodeoxyuridine immunocytochemistry and fluorescence in situ hybridization. Aquatic Microbial Ecology 59
Teira E, Reinthaler T, Pernthaler A, Pernthaler J, Herndl GJ (2004) Combining catalyzed
reporter deposition-fluorescence in situ hybridization and microautoradiography to detect substrate utilization by bacteria and archaea in the deep ocean. Appl Environ Microbiol 70:4411-4414
Thingstad TF, Hagstrom A, Rassoulzadegan F (1997) Accumulation of degradable DOC
in surface waters: Is it caused by a malfunctioning microbial loop? Limnology and Oceanography 42:398-404
Tornoe CW, Christensen C, Meldal M (2002) Peptidotriazoles on solid phase: [1,2,3]-
triazoles by regiospecific copper(I)-catalyzed 1,3-dipolar cycloadditions of terminal alkynes to azides. J Org Chem 67:3057-3064
Wang A, Nairn NW, Johnson RS, Tirrell DA, Grabstein K (2008) Processing of N-
terminal unnatural amino acids in recombinant human interferon-beta in Escherichia coli. Chembiochem 9:324-330
Weinbauer MG (2004) Ecology of prokaryotic viruses. Fems Microbiology Reviews
28:127-181

82
Figure 4.1. Chemical structures of methionine (m.w. 149.21) and homopropargylglycine (m.w. 127.14).
Reagent Volume (µl)
Milli-Q water 155Reaction buffer 20
Copper (I) sulfate 4Buffer additive 20
Alexa Fluor® 488 1Total 200
Table 4.1. Appropriate mixture of reagents needed to conjugate alkyne-containing HPG to azide functionalized Alexa Fluor® 488.
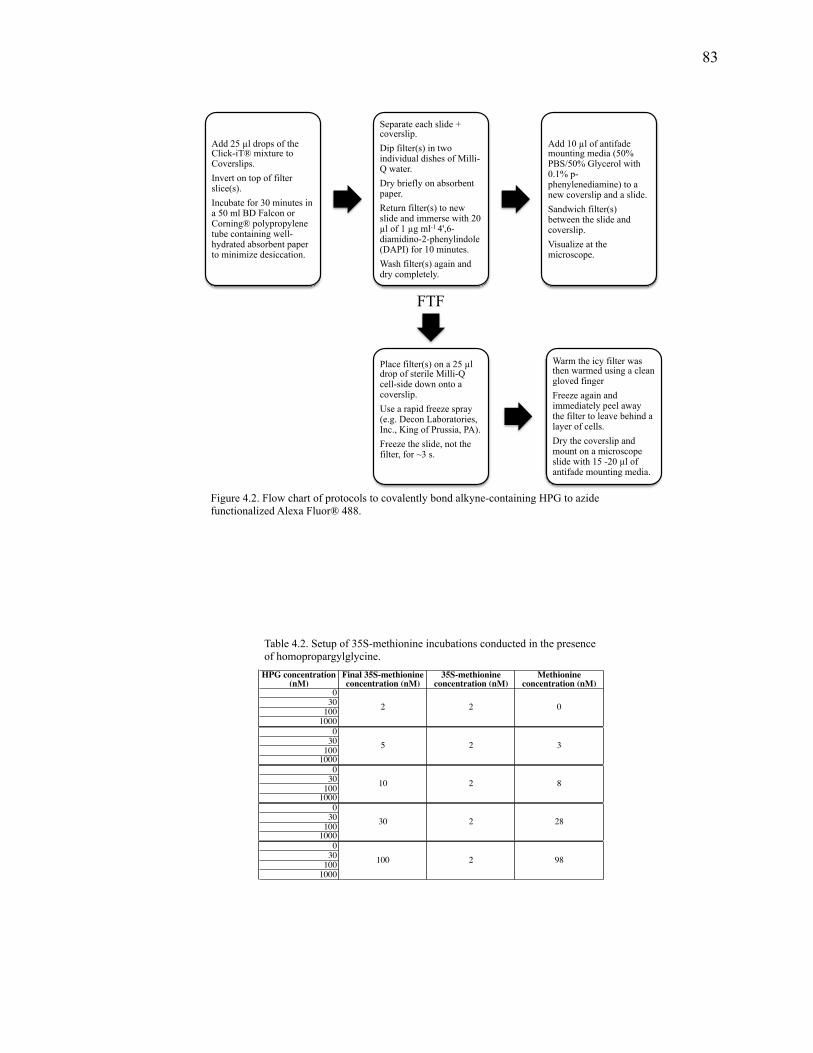
83
Add 25 µl drops of the Click-iT® mixture to Coverslips. Invert on top of filter slice(s). Incubate for 30 minutes in a 50 ml BD Falcon or Corning® polypropylene tube containing well-hydrated absorbent paper to minimize desiccation.
Separate each slide + coverslip. Dip filter(s) in two individual dishes of Milli-Q water. Dry briefly on absorbent paper. Return filter(s) to new slide and immerse with 20 µl of 1 µg ml-1 4',6-diamidino-2-phenylindole (DAPI) for 10 minutes. Wash filter(s) again and dry completely.
Add 10 µl of antifade mounting media (50% PBS/50% Glycerol with 0.1% p-phenylenediamine) to a new coverslip and a slide. Sandwich filter(s) between the slide and coverslip. Visualize at the microscope.
Place filter(s) on a 25 µl drop of sterile Milli-Q cell-side down onto a coverslip. Use a rapid freeze spray (e.g. Decon Laboratories, Inc., King of Prussia, PA). Freeze the slide, not the filter, for ~3 s.
Warm the icy filter was then warmed using a clean gloved finger Freeze again and immediately peel away the filter to leave behind a layer of cells. Dry the coverslip and mount on a microscope slide with 15 -20 µl of antifade mounting media.
FTF
Figure 4.2. Flow chart of protocols to covalently bond alkyne-containing HPG to azide functionalized Alexa Fluor® 488.
HPG concentration (nM)
Final 35S-methionine concentration (nM)
35S-methionine concentration (nM)
Methionine concentration (nM)
0301001000
0301001000
0301001000
0301001000
0301001000
2 2 0
325
10 2 8
30 2 28
100 2 98
Table 4.2. Setup of 35S-methionine incubations conducted in the presence of homopropargylglycine.

84
0
10
20
30
40
50
60
20 nM HPG - Oct 1, 2009!
20 nM HPG + 1 µM methionine -
Oct 1, 2009!
20 nM HPG - May 16, 2010!
20 nM HPG + 1 µM methionine -
May 16, 2010!
20 nM HPG - Oct 6, 2010!
20 nM HPG + 2 µM methionine -
Oct 6, 2010!
20 nM HPG - Oct 11, 2010!
20 nM HPG + 2 µM methionine -
Oct 11, 2010!
Perc
ent l
abel
ed
Figure 4.3. Percentages of HPG-labeled prokaryotic assemblages from Scripps Pier comparing incubations with the analog and with the analog plus methionine. Bars represent standard error.
Figure 4.4. Michaelis-Menten enzyme kinetics chart displaying HPG competitive inhibition of methionine (A). Summary values of fitted values calculated from each dataset (B).
Standard error
Km of methionine 31.19 8.120
Ki of HPG 372.8 142.6
Vmax 0.03395 0.003447
Shared R2 of fits 0.9228
A
B

85
0!
5000!
10000!
15000!
20000!
25000!
2 nM 35S-methionine 2nM 35S-methionine + 8 nM HPG
2nM 35S-methionine + 8 nM methionine
2 nM 35S-methionine + 18 nM HPG
2nM 35S-methionine + 18 nM methionine
2 nM 35S-methionine + 8 nM methionine +
10 nM HPG
DPM
ml-1
h-1
Figure 4.5. Measurements of disintegrations per minute in whole seawater samples incubated with 35S-methionine alone and with varying concentrations of cold methionine and HPG.
Table 4.3. Comparisons of labeled bacteria percentages cells in seawater incubated with 20 nM homopropargylglycine for 1 hour.
Sample35S-
methionine labeling (%)
HPG labeling on filter (%)
HPG labeling with FTF (%)
17-Aug-2010 16.1 12.8 94.810-Oct-2010 17.20 14.3 70.2

86
ND 0
20
40
60
80
100
Oct 1,
2009
Nov 18
, 200
9
Apr 30
, 201
0
Aug, 1
7, 20
10
Oct 6,
2010
Oct 11
, 201
0
Perc
ent
Filter
FTF
Figure 4.6. Percentages of labeled bacterial cells in seawater incubated with 20 nM homopropargylglycine for 1 hour. Cells were visualized directly (filter) or after transferring to slides (FTF). Bars represent standard errors.
A D
E B
F C
Figure 4.7. A representative scene of HPG-labeled bacteria observed on polycarbonate filters and split into DAPI, FITC, and DAPI+FITC channels (A-C). The filter-transfer-freeze technique reduced the background and enabled observation of both faintly and brightly labeled cells (D-F). The green lines in panels B and E correspond to the signal intensity histogram measured across the image and further illustrate the reduction of background using FTF. Scale bars = 20 µm.

87
Figure 4.9. Dividing cells observed in the DAPI channel (A) displayed a variety of HPG labeling characteristics as seen in the FITC and DAPI + FITC channels (B & C). Both cells may be labeled (*) or one cell is labeled and the other is not (**). Scale bar = 5 µm.
A
C
B
* ** **
** *
*
Figure 4.8. Magnified image of bacteria from Scripps Pier stained with the nucleic acid stain DAPI (A) next to the same field showing the green AlexaFluor 488® emission of an HPG-positive cell (B). Panel C depicts the DAPI + FITC composite view. The HPG signals appear as a greater portion of the cell than what is stained with DAPI (C). Scale bars = 2 µm.
A
C
B

88
SampleConcentration
(cells ml-1 x 10⁶)Percent labeled
Avg scBCP (fg cell-1 hr-1)
Avg scBCP of top 10% (fg cell-1 hr-1)
Avg C prod. of bottom 90% (fg cell-1 hr-1)
10% to 90% ratio
Max scBCP (fg cell-1 hr-1)
Min scBCP (fg cell-1 hr-1)
11/18/09 10:00 AM 1.21 15.29 0.3744 ± 0.076 1.8942 ± 0.287 0.2144 ± 0.038 8.84 2.8879 0.00234/30/10 10:00 AM 2.38 48.87 0.2360 ± 0.013 0.9193 ± 0.081 0.1604 ± 0.005 5.73 5.5063 0.0003
8/17/10 4:00 PM 2.41 25.00 0.2451 ± 0.019 1.1501 ± 0.076 0.1454 ± 0.009 7.91 2.6392 0.000110/6/10 10:00 AM 3.25 70.53 0.2731 ± 0.012 1.2438 ± 0.045 0.1655 ± 0.006 7.52 3.4081 0.000010/11/10 2:00 PM 2.87 94.08 0.1035 ± 0.007 0.6727 ± 0.050 0.0400 ± 0.002 16.81 5.5335 0.000110/20/10 2:00 PM 1.62 43.40 0.2087 ± 0.014 0.9731 ± 0.048 0.1244 ± 0.007 7.82 1.8221 0.0002
12/15/10 10:00 AM 1.18 17.29 0.5146 ± 0.068 1.7612 ± 0.275 0.3739 ± 0.042 4.71 3.3852 0.00043/30/11 12:00 PM 0.82 62.55 0.3391 ± 0.018 1.5953 ± 0.071 0.1993 ± 0.009 8.00 3.7576 0.0082
3/30/11 4:00 PM 0.74 81.73 0.1464 ± 0.010 0.8692 ± 0.049 0.0658 ± 0.003 13.20 2.8545 0.00003/30/11 9:00 PM 0.56 97.89 0.1891 ± 0.011 0.9279 ± 0.058 0.1074 ± 0.003 8.64 2.8686 0.0113
3/31/11 12:00 PM 1.20 72.63 0.2771 ± 0.019 1.4462 ± 0.092 0.1465 ± 0.008 9.87 4.1849 0.00013/31/11 4:00 PM 2.71 62.61 0.3879 ± 0.030 2.1199 ± 0.089 0.1938 ± 0.014 10.94 3.9513 0.00003/31/11 8:00 PM 0.78 63.21 0.2325 ± 0.013 1.3118 ± 0.059 0.1124 ± 0.005 11.67 5.3128 0.00004/1/11 12:00 PM 3.82 44.50 0.1346 ± 0.009 0.6993 ± 0.036 0.0715 ± 0.004 9.78 2.0772 0.0000
4/1/11 4:00 PM 1.24 86.28 0.1069 ± 0.006 0.6090 ± 0.028 0.0509 ± 0.002 11.96 1.9099 0.00014/1/11 9:00 PM 0.70 66.83 0.0837 ± 0.007 0.4697 ± 0.031 0.0406 ± 0.002 11.56 1.2883 0.0000
4/12/11 9:00 AM 3.55 14.73 0.1985 ± 0.029 0.8883 ± 0.108 0.1173 ± 0.014 7.57 1.6526 0.00249/30/11 9:00 AM 2.24 63.00 0.0651 ± 0.006 0.3560 ± 0.029 0.0325 ± 0.002 10.96 0.9245 0.000010/3/11 9:00 AM 3.52 70.78 0.3420 ± 0.030 1.8799 ± 0.101 0.1698 ± 0.013 11.07 3.2370 0.000112/9/11 2:30 PM 1.70 75.21 0.1250 ± 0.024 0.9650 ± 0.212 0.0309 ± 0.001 31.21 7.2288 0.00024/16/12 4:30 PM 0.67 100.00 0.2092 ± 0.027 1.5428 ± 0.143 1.4738 ± 0.005 25.12 4.4395 0.0012
Table 4.4. Cell concentrations, percentages of HPG positive cells, averages, and ratios of scBCP for 21 dates at Scripps Pier (± standard error of the mean).
SampleConcentration
(cells ml-1 x 10⁶)Percent labeled
Sum scBCP of top 10% (fg hr-1)
Sum scBCP of bottom 90% (fg hr-1)
10% to 90% ratio
11/18/09 10:00 AM 1.21 15.29 11.36 12.22 0.934/30/10 10:00 AM 2.38 48.87 63.43 99.91 0.63
8/17/10 4:00 PM 2.41 25.00 42.55 48.85 0.8710/6/10 10:00 AM 3.25 70.53 146.77 176.05 0.8310/11/10 2:00 PM 2.87 94.08 95.52 50.93 1.8810/20/10 2:00 PM 1.62 43.40 47.68 55.22 0.86
12/15/10 10:00 AM 1.18 17.29 12.33 23.18 0.533/30/11 12:00 PM 0.82 62.55 122.84 137.91 0.89
3/30/11 4:00 PM 0.74 81.73 82.57 56.09 1.473/30/11 9:00 PM 0.56 97.89 74.23 77.78 0.95
3/31/11 12:00 PM 1.20 72.63 94.00 85.27 1.103/31/11 4:00 PM 2.71 62.61 108.11 88.16 1.233/31/11 8:00 PM 0.78 63.21 156.10 120.14 1.304/1/11 12:00 PM 3.82 44.50 51.05 46.68 1.09
4/1/11 4:00 PM 1.24 86.28 87.08 65.39 1.334/1/11 9:00 PM 0.70 66.83 23.49 18.21 1.29
4/12/11 9:00 AM 3.55 14.73 8.88 9.97 0.899/30/11 9:00 AM 2.24 63.00 14.60 11.89 1.2310/3/11 9:00 AM 3.52 70.78 77.08 62.13 1.2412/9/11 2:30 PM 1.70 75.21 53.07 15.18 3.504/16/12 4:30 PM 0.67 100.00 60.17 21.62 2.78
Table 4.5. Sum and ratio values of scBCP for each of the 21 dates. Green cells denote greater contributions of the top 10% of active cells to the cumulative BCP. Red cells denote greater contributions from the bottom 90%.

89
SampleConcentration
(cells ml-1 x 10⁶)Percent labeled
Avg. growth rate (d-1)
Avg growth rate of top 10% (d-1)
Avg growth rate of bottom 90% (d-1)
10% to 90% ratio
Max growth rate (d-1)
Min. growth rate (d-1)
11/18/09 10:00 AM 1.21 15.29 0.1952 ± 0.035 0.9074 ± 0.132 0.1203 ± 0.018 7.54 1.4492 0.00084/30/10 10:00 AM 2.38 48.87 0.1657 ± 0.007 0.5649 ± 0.021 0.1215 ± 0.004 4.65 1.2291 0.0004
8/17/10 4:00 PM 2.41 25.00 0.1916 ± 0.014 0.8735 ± 0.059 0.1165 ± 0.007 7.50 1.8720 0.000110/6/10 10:00 AM 3.25 70.53 0.1626 ± 0.006 0.6746 ± 0.020 0.1059 ± 0.003 6.37 1.3628 < 0.000110/11/10 2:00 PM 2.87 94.08 0.0477 ± 0.003 0.2803 ± 0.019 0.0218 ± 0.001 12.88 2.2446 < 0.000110/20/10 2:00 PM 1.62 43.40 0.1463 ± 0.009 0.6352 ± 0.027 0.0923 ± 0.005 6.88 1.1575 0.0001
12/15/10 10:00 AM 1.18 17.29 0.3587 ± 0.044 1.1707 ± 0.113 0.2670 ± 0.030 4.39 1.7561 0.00023/30/11 12:00 PM 0.82 62.55 0.1827 ± 0.009 0.8364 ± 0.028 0.1099 ± 0.005 7.61 1.6505 0.0058
3/30/11 4:00 PM 0.74 81.73 0.0887 ± 0.005 0.5003 ± 0.020 0.0428 ± 0.002 11.69 1.2319 < 0.00013/30/11 9:00 PM 0.56 97.89 0.1137 ± 0.006 0.5256 ± 0.027 0.0682 ± 0.002 7.71 1.6126 0.0178
3/31/11 12:00 PM 1.20 72.63 0.1396 ± 0.008 0.6514 ± 0.026 0.0825 ± 0.004 7.90 1.3293 0.00013/31/11 4:00 PM 2.71 62.61 0.2296 ± 0.017 1.1939 ± 0.051 0.1215 ± 0.008 9.83 2.0066 < 0.00013/31/11 8:00 PM 0.78 63.21 0.1599 ± 0.008 0.8509 ± 0.026 0.0830 ± 0.004 10.25 1.8596 < 0.00014/1/11 12:00 PM 3.82 44.50 0.0877 ± 0.005 0.4134 ± 0.011 0.0513 ± 0.003 8.06 0.7875 < 0.0001
4/1/11 4:00 PM 1.24 86.28 0.0663 ± 0.003 0.3571 ± 0.010 0.0339 ± 0.001 10.52 0.8242 0.00014/1/11 9:00 PM 0.70 66.83 0.0469 ± 0.004 0.2527 ± 0.017 0.0239 ± 0.001 10.58 0.6454 < 0.0001
4/12/11 9:00 AM 3.55 14.73 0.1310 ± 0.018 0.5718 ± 0.048 0.0791 ± 0.009 7.23 0.8628 0.00159/30/11 9:00 AM 2.24 63.00 0.0435 ± 0.004 0.2286 ± 0.014 0.0228 ± 0.002 10.03 0.5427 < 0.000110/3/11 9:00 AM 3.52 70.78 0.1862 ± 0.015 0.9433 ± 0.046 0.1014 ± 0.008 9.30 1.6719 0.000112/9/11 2:30 PM 1.70 75.21 0.0616 ± 0.009 0.4314 ± 0.076 0.0202 ± 0.001 21.41 1.9455 0.00024/16/12 4:30 PM 0.67 100.00 0.1124 ± 0.014 0.7799 ± 0.071 0.0384 ± 0.003 20.2918 1.8686 0.0011
Table 4.6. Averages and ratios for growth rates estimated for the 21 dates (± standard error of the mean).
Figure 4.10. XY plot of HPG-based cell-specific BPP measured over 24 hours in the presence or absence of 1µM glucose and ammonium chloride.
y = 0.0012x + 0.1796 R² = 0.03258 p = 0.771 y = 0.0132x + 0.0316 R² = 0.9678 p = 0.0025
0.0000
0.0900
0.1800
0.2700
0.3600
0.4500
0 5 10 15 20 25 30
fg C
cel
l-1 h
r-1
Hour
Average cell specific BPP in seawater cultures without and with 1 µM glucose & NH4
Control Gluc+NH4 Linear (Control) Linear (Gluc+NH4)

90
0
1
2
3
4
5
Day 1 Day 2 Day 3
cells
ml-1
(x 1
06 )
Bacterial abundance
12pm
4pm
8-9pm
0.00
0.08
0.16
0.24
0.32
Day 1 Day 2 Day 3
d-1
Average HPG-based cell-specific growth rate
0.0
0.4
0.8
1.2
1.6
Day 1 Day 2 Day 3
d-1
Top 10% average HPG-based cell-specific growth rate
0.0
3.0
6.0
9.0
12.0
Day 1 Day 2 Day 3 d-1
Ratio of 10% to 90% cell-specific growth rate
Figure 4.11. Bacterial parameters measured for the Scripps Pier monitoring experiment.
A
B
C
D
Figure 4.12. Mean sum intensity values of single bacterial cells incubated in 20 nM or 2 µM HPG and existing in unattached or particle-attached. Bars represent standard errors.
0
1
2
3
4
5
1 hour incubation 48 hour incubation 8 day incubation
RFU
x 1
05
Mean sum intensity of unattached and attached cells
20 nM HPG, unattached
2 µM HPG, unattached
20 nM HPG, particle-attached
2 µM HPG, particle-attached
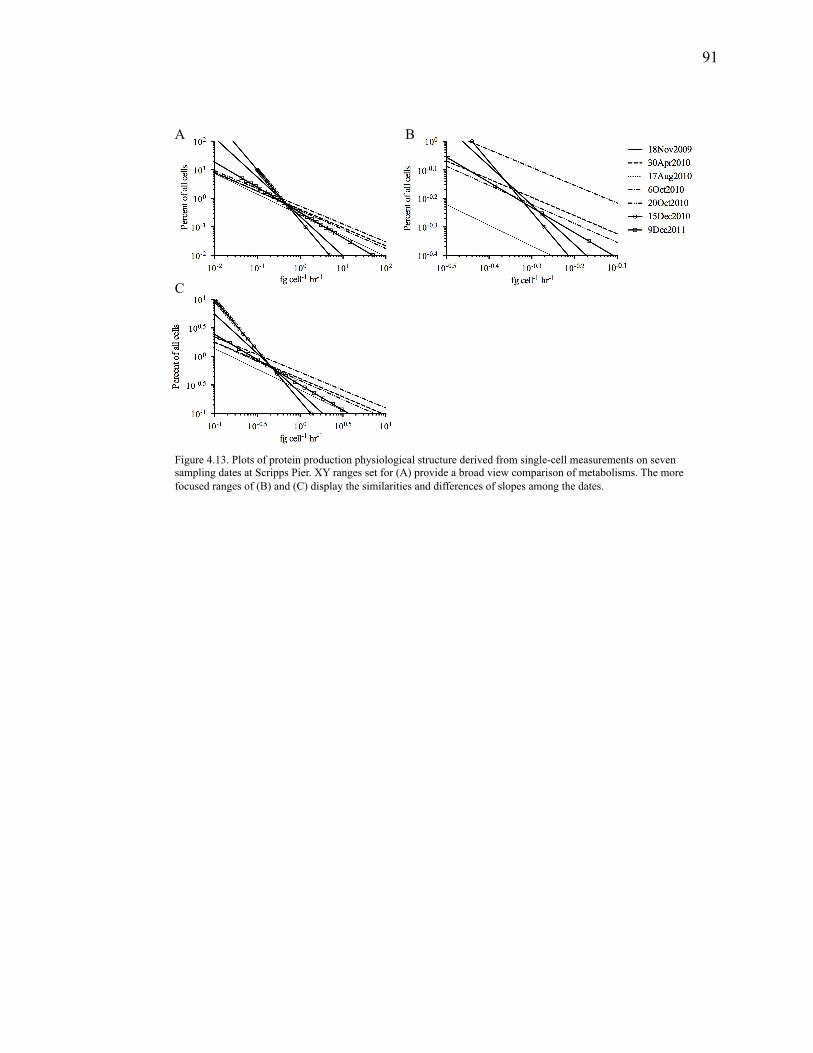
91
Figure 4.13. Plots of protein production physiological structure derived from single-cell measurements on seven sampling dates at Scripps Pier. XY ranges set for (A) provide a broad view comparison of metabolisms. The more focused ranges of (B) and (C) display the similarities and differences of slopes among the dates.
A
C
B

!
!92
CHAPTER 5
Conclusions & Outlook
! 93
!
This dissertation has assessed and developed useful techniques and approaches to
better quantify and understand microbial control over marine carbon cycling. It is
apparent that the scales of interaction among microbes and their physicochemical
environments must be understood before we can hope to portend responses and
consequences to these connections (Brussaard et al. 2008, Stocker et al. 2008, Malfatti &
Azam 2009, Lidstrom & Konopka 2010). The experiments discussed in the preceding
pages represent potentially useful techniques that will, when applied to a variety of
oceanic environments, contribute insights on marine elemental cycles, microbial
oceanography, and ecology.
In general, it is difficult to fully characterize organisms and their environments
without direct observation. As a consequence of this limitation, one cannot fully
determine how the environment affects the physiology of the organisms, and vice versa.
Extending this concept to marine microbial communities, a major challenge lies in
obtaining meaningful observational data that provides ecological and/or biogeochemical
information. In an early example, direct counts of bacteria using the nucleic acid stain
Acridine Orange revealed bacterial abundances that were 3 orders of magnitude greater
than previously believed (Hobbie et al. 1977). This major finding, based on the
application of a novel method, revolutionized the field of aquatic microbial ecology and
spurred the advancement of protocols to view and quantify microbes. An immediate
paradigm shift resulted as well, detailing the extent to which phytoplankton and bacterial
production coupling influences the dynamics of nutrient remineralization and uptake in

! 94
!
addition to the fate of the photosynthetically-derived organic carbon (Cole 1982, Vaqué
et al. 1989).
Since then, the importance of elemental cycling dynamics between
bacterioplankton and phytoplankton communities (mediated by viral lysis and protozoan
grazing mortality) has become a central tenet in marine microbial oceanography and
ecology. As the field continues to develop and grow, so does the need to observe the in
situ and in vivo activity of microorganisms in their native state. One recent method
discarded fluorescent stains to minimize non-specific binding to inorganic surfaces and
applied deep-UV lasers to excite the natural fluorescence of basalt-attached bacterial cells
for in situ abundance and biomass quantification (Bhartia et al. 2010). While such an
approach is unlikely to be usable for determining single-cell activity, this trajectory of
imaging technology will likely usher in new ways to see microbial processes at
meaningful ecological scales. The development and deployment of an underwater
imaging flow cytometer (FlowCytobot) is a specific example of how the combination of
engineering and biology principles has enabled unprecedented views of marine
phytoplankton dynamics in real time (Olson & Sosik 2007). It is plausible that the next
step is a true in situ and in vivo instrument. Conceptually, this could be accomplished
with an incubation chamber and sampler that enables addition of probes or dyes for
incubation, followed by processing and signal quantification. The ongoing development
and application of the environmental sample processor (ESP) has resulted in a
sophisticated device capable of temporal sampling and quantitative molecular assaying of
RNA-targeted organisms (Greenfield et al. 2006). A useful endeavor, then, may be to

! 95
!
modify these pieces of equipment to observe single-cell activity (via HPG incorporation)
at high temporal and spatial resolution.
In light of this current state of the science, the best approach to more fully
characterize and predict microbial contributions to ecological and biogeochemical
dynamics is to assess microbial, geochemical, and physical properties at several scales.
For example, this observational scheme was utilized to better understand the microbial
food web during a Phaeocystis globosa bloom in the Eastern English Channel (Seymour
et al. 2008). The authors found that mean differences in biological measurements (chl a,
bacterial and viral abundances) at the mesoscale were met with significantly different
values calculated from microscale (< 5 cm) samplings. They state that the combination of
tidal fronts (mesoscale physics) results in nutrient enrichment (mesoscale geochemistry)
to elicit a mesoscale bloom. Contemporaneously, microscale patches of P. globosa form
due to the variable stickiness properties of the cells and secreted organic material.
Bacteria cluster differentially at the microscale to consume these point sources of energy
and potentially influence nutrient cycling dynamics at this scale as well. In the coastal
and open ocean regions of the CCE (or other marine systems), a similar hypothesis could
be posited; physical oceanographic structure maintains distinct mesoscale and microscale
responses in marine microbial communities by influencing marine chemistry at the same
scales. To address this, one could sample within and across distinct zones (tidal fronts
and/or internal waves, Omand et al. 2011, temperature-salinity fronts, Landry et al. 2012)
for transparent particles and HPG-based activity measurements of unattached and
particle-attached bacteria along with bulk measurements of chl a and bacterial abundance.

! 96
!
This would provide information on the mesoscale and microscale dynamics of bacterial
activity, and the physical characteristics generating larger scale patterns of phytoplankton
blooms and particle creation brought about by upward nutrient fluxes (Li et al. 2012).
This work would be well informed by continued work on marine fluid dynamics since, as
plankton, all microbes are ultimately transported at the whim of water mass and current
movements. Furthermore, physical dynamics play a role in particle formation,
maintenance, and degradation via microscale eddies and motions that enhance DOM
collisions (Passow 2002).
One of the most recent frontiers in microscopy and digital imaging has been
super-resolution visualization, or nanoscopy. In achieving resolution below the
theoretical limit of diffraction (i.e. < 200 nm), various techniques have enabled
researchers to observe and quantify cellular dynamics otherwise unobservable with
traditional methods and microscopes (Hell 2009). Furthermore, the list of fluorophores
compatible with these methodologies has expanded, allowing some of the most widely
used compounds to be applied, quantified, and observed for a variety of samples
(Moneron et al. 2010). These exciting developments have enabled unprecedented views
of internal and external architecture of single cells, including cytoskeletal microtubules,
protein microdomains, and the bacterial cytoskeletal filament ftsZ (Müller et al. 2012),
Integrating these techniques with the sampling and visualization methods described in
this dissertation is likely tractable, and would facilitate the molecular characterization of
microbial communities at the nanoscale to complement mesoscale and microscale
observations. Quantifying and describing the sub-cellular localization of newly

! 97
!
synthesized, HPG-containing proteins and peptides would reveal the activity of single
cells and constrain how the cell is spatially partitioning incorporated DOM (using HPG
as a tracer) via catabolic and anabolic processes. Live and video rate nanoscopy has also
been demonstrated (Hein et al. 2008), and would be an ideal way to achieve high
temporal significance in controlled laboratory experiments. Devotion of energy into
biomass enhancement versus cell division is an important process in bacteria and one of
several bacterially-mediated mechanisms that influence the marine pool of
photosynthetically-derived organic matter (Chin-Leo & Kirchman 1988). Traditionally,
these measurements were made in bulk samples using radiolabeled thymidine (cell
division) and leucine (protein/biomass production) to calculate leucine:thymidine
incorporation ratios as an expression of balanced or unbalanced growth (balanced ratio
being 1 < Leu:TdR < 20; Chin-Leo & Kirchman 1990, Gasol et al. 2009). The recent
availability of the thymidine analog 5-ethynyl-2’-deoxyuridine (EdU) has assisted with
the probing of DNA replication dynamics in archaeal and bacterial cells (Ferullo et al.
2009, Gristwood et al. 2012). If combined with HPG incorporation and multiplex
imaging with different fluorophores, simultaneous EdU uptake could be used to visualize
and quantify this ratio to further characterize the growth and biogeochemical implications
of balanced versus unbalanced growth in individual cells. Moreover, the application of
fluorescent in situ hybridization (Amann et al. 1995) to these protocols would ascribe
biogeochemical functions to bacterial phylogeny.
It is an exciting era for microbial oceanography and ecology. Interdisciplinary
research has been central to oceanography, but now it has become even more

! 98
!
commonplace and widespread, enabling unique perspectives of microorganisms and their
functions in the marine environment. Our ability to extract evocative and quantitative
information from these observations has been aided by advances in microscopy and
computing while the labeling technologies have benefitted from recent strides in Click
chemistry. While this dissertation examined how to quantify single heterotrophic
bacterial cells, these strategies have the potential to reveal more about photoautotrophic
communities as well. Such innovations along with the continued investigation of
molecular mechanisms underpinning microbial activity and diversity may inform other
fields of study to permit prognostic insights on microorganism responses to and control
over marine biogeochemistry. As interest and knowledge of anthropogenic climate
change increases, this prescience will become more and more necessary as marine
microbes assume mitigating or exacerbating roles (Joint et al. 2011, Doney et al. 2012).
As the lifestyles of marine microorganisms continue to be characterized across several
scales of the world ocean, our understanding of microbial influence on the natural world
will optimistically contribute to improving the health of the planet and its inhabitants.
References
Amann RI, Ludwig W, Schleifer KH (1995) Phylogenetic identification and in situ detection of individual microbial cells without cultivation. Microbiological Reviews 59:143-169
Bhartia R, Salas EC, Hug WF, Reid RD, Lane AL, Edwards KJ, Nealson KH (2010)
Label-Free Bacterial Imaging with Deep-UV-Laser-Induced Native Fluorescence. Applied and Environmental Microbiology 76:7231-7237

! 99
!
Brussaard CPD, Wilhelm SW, Thingstad F, Weinbauer MG, Bratbak G, Heldal M, Kimmance SA, Middelboe M, Nagasaki K, Paul JH, Schroeder DC, Suttle CA, Vaque D, Wommack KE (2008) Global-scale processes with a nanoscale drive: the role of marine viruses. ISME J 2:575-578
Chin-Leo G, Kirchman DL (1988) Estimating Bacterial Production in Marine Waters
from the Simultaneous Incorporation of Thymidine and Leucine. Applied and Environmental Microbiology 54:1934-1939
Chin-Leo G, Kirchman DL (1990) Unbalanced growth in natural assemblages of marine
bacterioplankton. Marine Ecology-Progress Series 63:1-8 Cole JJ (1982) Interactions between Bacteria and Algae in Aquatic Ecosystems. Annual
Review of Ecology and Systematics 13:291-314 Doney SC, Ruckelshaus M, Duffy JE, Barry JP, Chan F, English CA, Galindo HM,
Grebmeier JM, Hollowed AB, Knowlton N, Polovina J, Rabalais NN, Sydeman WJ, Talley LD (2012) Climate Change Impacts on Marine Ecosystems. Annual Review of Marine Science, Vol 4 4:11-37
Ferullo DJ, Cooper DL, Moore HR, Lovett ST (2009) Cell cycle synchronization of
Escherichia coli using the stringent response, with fluorescence labeling assays for DNA content and replication. Methods 48:8-13
Gasol JM, Alonso-Saez L, Vaque D, Baltar F, Calleja ML, Duarte CM, Aristegui J
(2009) Mesopelagic prokaryotic bulk and single-cell heterotrophic activity and community composition in the NW Africa-Canary Islands coastal-transition zone. Progress in Oceanography 83:189-196
Greenfield DI, Marin III R, Jensen S, Massion E, Roman B, Feldman J, Scholin CA
(2006) Application of environmental sample processor (ESP) methodology for quantifying Pseudo-nitzschia australis using ribosomal RNA-targeted probes in sandwich and fluorescent in situ hybridization formats. Limnology and Oceanography-Methods 4:426-435
Gristwood T, Duggin IG, Wagner M, Albers SV, Bell SD (2012) The sub-cellular
localization of Sulfolobus DNA replication. Nucleic Acids Research 40:5487-5496
Hein B, Willig KI, Hell SW (2008) Stimulated emission depletion (STED) nanoscopy of
a fluorescent protein-labeled organelle inside a living cell. Proceedings of the National Academy of Sciences of the United States of America 105:14271-14276
Hell SW (2009) Microscopy and its focal switch. Nature Methods 6:24-32

! 100
!
Hobbie JE, Daley RJ, Jasper S (1977) Use of Nuclepore Filters for Counting Bacteria by Fluorescence Microscopy. Applied and Environmental Microbiology 33:1225-1228
Joint I, Doney SC, Karl DM (2011) Will ocean acidification affect marine microbes?
ISME Journal 5:1-7 Landry MR, Ohman MD, Goericke R, Stukel MR, Barbeau KA, Bundy R, Kahru M
(2012) Pelagic community responses to a deep-water front in the California Current Ecosystem: overview of the A-Front Study. Journal of Plankton Research
Li QP, Franks PJS, Ohman MD, Landry MR (2012) Enhanced nitrate fluxes and
biological processes at a frontal zone in the southern California current system. Journal of Plankton Research
Lidstrom ME, Konopka MC (2010) The role of physiological heterogeneity in microbial
population behavior. Nature Chemical Biology 6:705-712 Malfatti F, Azam F (2009) Atomic force microscopy reveals microscale networks and
possible symbioses among pelagic marine bacteria. Aquatic Microbial Ecology 58:1-14
Moneron G, Medda R, Hein B, Giske A, Westphal V, Hell SW (2010) Fast STED
microscopy with continuous wave fiber lasers. Optics Express 18:1302-1309 Müller T, Schumann C, Kraegeloh A (2012) STED Microscopy and its Applications:
New Insights into Cellular Processes on the Nanoscale. Chemphyschem 13:1986-2000
Olson RJ, Sosik HM (2007) A submersible imaging-in-flow instrument to analyze nano-
and microplankton: Imaging FlowCytobot. Limnology and Oceanography-Methods 5:195-203
Omand MM, Leichter JJ, Franks PJS, Guza RT, Lucas AJ, Feddersen F (2011) Physical
and biological processes underlying the sudden surface appearance of a red tide in the nearshore. Limnology and Oceanography 56:787-801
Passow U (2002) Transparent exopolymer particles (TEP) in aquatic environments.
Progress In Oceanography 55:287-333 Seymour JR, Seuront L, Doubell MJ, Mitchell JG (2008) Mesoscale and microscale
spatial variability of bacteria and viruses during a Phaeocystis globosa bloom in the Eastern English Channel. Estuarine Coastal and Shelf Science 80:589-597

! 101
!
Stocker R, Seymour JR, Samadani A, Hunt DE, Polz MF (2008) Rapid chemotactic response enables marine bacteria to exploit ephemeral microscale nutrient patches. Proceedings of the National Academy of Sciences 105:4209-4214
Vaqué D, Duarte CM, Marrasé C (1989) Phytoplankton colonization by bacteria:
encounter probability as a limiting factor. Marine Ecology-Progress Series 54:137-140