Embed Size (px)
Citation preview

Faculty of Engineering – Department of Engineering Modeling
PhD Course in Environmental, Health and Eco-sustainable Processes
Thesis
Optimization of pretreatment and enzymatic hydrolysis in bioethanol production from
lignocellulosic biomass
Settore Scientifico Disciplinare ING-IND/24 – Principi di Ingegneria Chimica
Supervisors PhD Student
Prof. Vincenza CALABRO’ Alessandra VERARDI Dr. Isabella DE BARI Ciclo XXIV
PhD Coordinator
Prof. Bruno DE CINDIO
A.A. 2010-2011
University of Calabria

2
Non so come chiederti perdono, perché la mente è muta..la mente che non merita perdono.
Oh padre ..che per tanto tempo solo col tuo male, per giorni e giorni e notti di terrore,
come in una sequenza cerebrale ti vedo, solo, solo,
annegare tacendo nel tuo male...
Che ore nere devi aver passato, ore per dire anni, dire vita,
fino a questo novembre disperato di vento freddo, di fronda ingiallita,
padre ingiallito come fronda al fiato di tutto il vento freddo della vita.
Oh padre padre che conosco ora, soltanto ora dopo tanta vita..!
~Patrizia Valduga~

3
Certe persone non sanno, quanto sia bello semplicemente vederle...
Certe persone non sanno, quanto sia incoraggiante il loro sorriso...
Certe persone non sanno, quanto sia importante la loro vicinanza...
Certe persone non sanno, quanto saremmo più poveri se loro non ci fossero...
Certe persone non sanno, di essere un Dono del Cielo...
Se non glielo diciamo non lo sapranno mai ...
~Colette Haddad~
A mia madre, a Laura e a Giuseppe

4
Index
Introduction ................................................................................................................................................... 7
Summary ........................................................................................................................................................ 9
Introduzione ................................................................................................................................................ 11
Sommario .................................................................................................................................................... 14
1. Second generation bioethanol: a sustainable choice to mitigate climate change. ................................. 17
1.1 Introduction ........................................................................................................................................... 17
1.2 Climate change and greenhouse gases ................................................................................................. 18
1.2.1 Climate Change and Carbon Dioxide .............................................................................................. 19
1.3 Automotive sector CO2 reduction: the biofuel solution ........................................................................ 23
1.3.1 The importance of second generation Biofuels ............................................................................. 24
1.4 GHG emission: Life-Cycle comparative analysis among different biofuels ........................................... 25
1.5 Conclusions ............................................................................................................................................ 26
1.6 References ............................................................................................................................................. 27
2. Bioethanol production from Lignocellulosic Biomass ............................................................................. 31
2.1 Introduction ........................................................................................................................................... 31
2.2 Structure of lignocellulose biomass....................................................................................................... 31
2.2.1 Cellulose ......................................................................................................................................... 32
2.2.2 Hemicellulose ................................................................................................................................. 33
2.2.3 Lignin............................................................................................................................................... 35
2.3 Processing of lignocellulosic material to bioethanol ............................................................................. 38
2.3.1 Pretreatment: the comparison between the main technologies employed .................................. 39
2.3.2 Hydrolysis: cellulose degradation strategies by means acids or enzymes ..................................... 44
2.3.3 Fermentation .................................................................................................................................. 46
2.4 Conclusions ............................................................................................................................................ 47
2.5 References ............................................................................................................................................. 47
3. Enzymatic Hydrolysis of Lignocellulosic Biomass: Current Status of Process and Future Perspectives.. 53
3.1 Introduction ........................................................................................................................................... 53
3.2 Cellulases ............................................................................................................................................... 53
3.2.1 Carbohydrate binding module ....................................................................................................... 54
3.2.2 Catalytic domain ............................................................................................................................ 55
3.2.3 Lynker region ................................................................................................................................. 55
3.3 Cellulolytic capability of organisms: Difference in the cellulose-degrading strategy........................... 56
3.4 Characteristics of the commercial hydrolytic enzymes ......................................................................... 58
3.5 Enzymes for the cellulose liquefaction: Thermophilic enzymes ........................................................... 61

5
3.6 Immobilization of enzymes ................................................................................................................... 63
3.7 Conclusions ............................................................................................................................................ 63
3.8 References ............................................................................................................................................. 64
4. Steam Pretreatment Optimization with impregnating agents for Sugarcane Bagasse for advanced
Bioethanol Production ..................................................................................................................................... 70
4.1 Introduction ........................................................................................................................................... 70
4.2 Sugarcane bagasse biomass .................................................................................................................. 70
4.3 SCB Bioethanol production process: Status of art................................................................................. 71
4.3.1 Steam explosion ............................................................................................................................. 72
4.3.2 Fermentation step inhibitors in the steam explosion .................................................................... 73
4.3.3 Inhibitors of enzymatic hydrolysis ................................................................................................. 75
4.3.4 The Enzymatic hydrolysis conditions for assessment of pretreatment ......................................... 76
4.4 Aim of the work: Pretreatment Optimization ....................................................................................... 76
4.4.1 Experimental design ....................................................................................................................... 78
4.5 Materials and Methods ................................................................................................................... 79
4.5.1 Raw materials ................................................................................................................................. 79
4.5.2 Enzymatic hydrolysis ...................................................................................................................... 82
4.5.3 Analysis ........................................................................................................................................... 82
4.6 Results and Discussion ........................................................................................................................... 83
4.7 Analysis of glucose concentrations and inhibitory compounds ............................................................ 93
4.8 Analysis of xylose concentration ......................................................................................................... 100
4.9 Final concentrations and yields of Glucose and Xylose in the various pretreatment conditions ....... 102
4.10 Selectivity........................................................................................................................................... 105
4.11 Conclusions ........................................................................................................................................ 106
4.12 References ......................................................................................................................................... 107
5. Enzymatic Hydrolysis performed in bioreactor ..................................................................................... 114
5.1 Introduction ......................................................................................................................................... 114
5.2 Experimental design ............................................................................................................................ 114
5.3 Material and Method .......................................................................................................................... 115
5.4 Results and Discussion ......................................................................................................................... 116
5.5 Conclusions .......................................................................................................................................... 121
5.6 References ........................................................................................................................................... 122
6. Immobilization of enzyme on Epoxy supports. ..................................................................................... 125
6.1 Introduction ......................................................................................................................................... 125
6.2 Immobilization of enzyme ................................................................................................................... 125

6
6.3 Immobilization of cellulases: status of art ........................................................................................... 128
6.4 Immobilization of enzymes on epoxy supports ................................................................................... 128
6.5 Materials and method ......................................................................................................................... 131
6.5.1 Soluble Enzymes ........................................................................................................................... 131
6.5.2 Support ......................................................................................................................................... 131
6.5.3 Immobilization of enzymes on epoxy supports ............................................................................ 132
6.5.4 Bradford protein assay ................................................................................................................. 133
6.5.5 Determination of free and immobilized enzyme activity ............................................................. 133
6.5.6 Activity of free and immobilized enzyme .................................................................................... 134
6.6 Results ................................................................................................................................................. 134
6.6.1 Kinetic study of Celluclast enzyme immobilization ...................................................................... 134
6.6.2 Study of enzyme activity at alkaline pH 8 ..................................................................................... 136
6.6.3 Thermal stability analysis ............................................................................................................. 136
6.7 Conclusions and outlook ..................................................................................................................... 138
6.8 References ........................................................................................................................................... 139
Conclusions ................................................................................................................................................ 142
Italian scenario and potential industrial application of researches developed. ....................................... 145
References ................................................................................................................................................. 147
Ringraziamenti ........................................................................................................................................... 148

7
Introduction
Nowadays, fossil fuels represent more than 80% of world consumption, and transport in
particular depends 95% on oil. While reserves are diminishing, worldwide demand is constantly
increasing, due to the emergence of certain new economies.
Moreover, burning fossil fuels generates CO2, a greenhouse gas that is the primary cause of
global warming. So, it is therefore necessary to find cleaner fuels that do not depend on oil.
Among the most promising replacement for nonrenewable fossil fuel (petroleum, coal, etc.)
are fuels made from organic materials, the so-called “biofuels”. The two widely used biofuels are
bioethanol and biodiesel.
Bioethanol production has become the major alternative among renewable fuels given its
compatibility with the current automobiles and the available infrastructure.
However, the concerns regarding the production of the so called 1st generation of
bioethanol from raw materials like corn or sugars, such as the extension of land needed to grow the
crops, its competition with food production and supply, and the high water and energy consumption
in the production process, have led to place high expectations upon the 2nd generation of
bioethanol which uses as feedstock lignocellulosic residues or no-food dedicated crops.
So, second-generation biofuels are produced using the inedible part of plants (straw, wood,
plant waste). Unlike first-generation biofuels, they do not compete with the use of raw materials as
food. They can be used directly by traditional vehicles and considerably reduce CO2 emissions.
So, this biofuel is starting to gain interest in Governments and industrial companies. Based
on the report made by the National Resources Defense Council of United States of America
(NRDC), by year 2050, the increasing productivity of cellulosic sources would in due course allow
them to generate as much as 150 billion gallons of ethanol which is comparable to more than two-
thirds present gasoline consumption in the United States.
As a matter of fact, currently, several companies are moving forward having plans to build
plants using to synthetize 2nd generation bioethanol.
But there are several technical challenges that need to be addressed to make bioethanol
profitable.
In this scenario, the present thesis aims to examine two key steps of 2nd generation
bioethanol production and to overcome some critical aspect of this process.
Bioconversion of lignocellulosics to ethanol consists of four major unit operations:
pretreatment, hydrolysis, fermentation and product separation/ distillation.
My research activity has been focused on the optimization of the first two steps.

8
Pretreatment is required to alter the biomass macroscopic and microscopic size and
structure as well as its submicroscopic chemical composition and structure so that hydrolysis of
carbohydrate fraction to monomeric sugars can be achieved more rapidly and with greater yields.
The most used pretreatment is steam explosion and this is one of the most expensive
processing steps in biomass to fermentable sugar conversion. So, my activity has been addressed on
the optimization of this pretreatment by investigating different impregnating agents and different
reaction conditions in order to find the best set for this crucial step in bioethanol synthesis.
After pretreatment there are two types of processes to hydrolyze the feedstock into
monomeric sugar constituents required for fermentation into ethanol. The hydrolysis methods most
commonly used are acid (dilute and concentrated) and enzymatic.
The use of enzymes in place of inorganic acid catalysts is very advantageous, because they
are highly specific and can work at mild process conditions and, moreover, it is possible to achieve
cellulose hydrolysis of close to 100% by using enymes.
However, the use of enzymes in industrial processes is still limited by high costs of enzyme
isolation and purification. In addition, most enzymes are relatively unstable at high temperatures.
In fact, the maximum activity for most fungal cellulases occurs at 50±5°C, while about 60% of this
activity is lost in the temperature range 50–60 °C.
In order to improve biomass hydrolysis, a bioreactor has been tested. The use of this
technology has allowed to perform hydrolysis with a tight control of operating parameters (pH and
temperature) and with an appropriate mixing rate.
To overcome of this problem, in the present work, the using of enzyme immobilization has
been analyzed. In fact, enzyme immobilization frequently results in improved thermostability or
resistance to shear inactivation and so, in general, it can help to extend the enzymes lifetime.
Moreover, enzyme immobilization guarantees an easier recovery and reuse of the catalysts
for more reaction loops improving in this way the process profitability.
Specifically, my PhD research activity aims to pave the way to get over some current
limitations of bioethanol synthesis by optimizing two crucial steps:
• Steam explosion pretreatment by testing different impregnating agents and several
reaction conditions;
• Hydrolysis process by using a bioreactor;
• Hydrolysis process by using immobilized enzymes.

9
Summary
The necessity of using clean energy sources to meet the growing energy needs of the planet
is a topic of strong current especially given the consequences, sometimes even tragic, that climate
change brings. In this framework, emission due to automotive sector is one of the crucial aspects to
improve. Therefore the development of new low-emission energy sources becomes a must for
research.
Research efforts are needed to design and improve biofuel synthesis process, which would
produce sustainable and economically feasible transportation fuel.
Second generation bio-ethanol is certainly one of the most promising biofuel in order to
replace fossil fuel and to achieve a strongly reduction of greenhouse gases.
This PhD thesis has been focused on the optimization of two crucial steps in 2nd generation
bio-ethanol synthesis: steam-explosion pretreatment and hydrolysis.
First chapter describes the massive problem of climate change and the consequent global
warming and the crucial role that emissions of greenhouse gases have in this context. In order to
reduce these emissions, a key role can be played by the replacement of traditional fossil fuels with
biofuels. Among the latter, bioethanol from lignocellulosic biomass is certainly one of the most
promising.
Second chapter describes bioethanol production process by focusing on second generation
bioethanol from lignocellulosic biomass. The chapter includes a thorough treatment of the biomass
used and a detailed description of the several steps of production process.
The state of the art on the enzymatic hydrolysis process is the subject of the third chapter. In
this part of the thesis, it is described, in more detail, the process of enzymatic hydrolysis with
particular attention to enzymes (cellulases) charachetristics and functions.
Fourth chapter describes the experimental work, conducted at the Department of Chemical
Engineering, University of Lund (Sweden) addressed to pretreatment step optimization. In this
phase of research, several impregnating agents have been used in order to improve steam-
explosion process.
Fifth chapter describes the experimental activity, at the University of Lund, performed in
order to test the process of hydrolysis within a bioreactor. This phase of the research was aimed to
verify the benefits of the process by a more efficient mixing of reagents.
The sixth chapter contains a description of the research work developed at the laboratories
of the ENEA Research Center of Trisaia (Rotondella - MT). This phase of research was aimed to
test the enzyme immobilization. The process of immobilization, in fact, is a technique that allows to

10
obtain more stable and more manageable enzymes and, above all, this methodology allows an
easier recovery and reuse of the same enzymes.
This thesis work was done in collaboration with ENEA (Italian Agency for New
Technologies, Energy and Sustainable Economic Development), Laboratory of Technology and
Engineering for Biomass and Solar Thermal Energy at the Research Center of Trisaia
(Rotondella – MT).
Research activity has developed in cooperation with the Department of Chemical
Engineering of University of Lund (Sweden) under the supervision of Prof. Guido Zacchi.

11
Introduzione
Al giorno d'oggi, i combustibili fossili rappresentano oltre l'80% del consumo mondiale, e,
in particolare, il settore dei trasporti dipende al 95% dal petrolio. Mentre le riserve petrolifere
stanno diminuendo, la domanda mondiale è in costante aumento, a causa della comparsa di alcune
nuove economie.
Inoltre, la combustione di combustibili fossili produce CO2, un gas serra che è la causa
primaria del riscaldamento globale. Di conseguenza, diventa necessario trovare combustibili più
puliti che non dipendono dal petrolio.
Tra le soluzioni più promettenti per la sostituzione dei combustibili fossili non rinnovabili
(petrolio, carbone, etc.) vi sono sicuramente i combustibili a base di materiali organici, i cosiddetti
"biocarburanti". I due biocarburanti più diffusi sono il bioetanolo e il biodiesel.
La produzione di bioetanolo è diventata l'alternativa principale fra i carburanti da fonti
rinnovabili data la sua compatibilità con le automobili attuali e le infrastrutture già disponibili.
Tuttavia, vi sono alcune perplessità per quanto riguarda la produzione del cosiddetto bioetanolo di
“prima generazione”, ovvero derivante da materie prime come il mais, il grano e da altre colture
zuccherine che hanno limitato il suo sviluppo a livello industriale. L' estensione di terreno
necessaria per coltivare i prodotti, la concorrenza con la produzione e l'approvvigionamento
alimentare, e l'elevato consumo di energia e di acqua nel processo di produzione, hanno spinto il
mondo della ricerca a concentrarsi sul bioetanolo di “seconda generazione” che utilizza come
materia prima residui o delle colture dedicate non alimentari.
I biocarburanti di seconda generazione sono prodotti utilizzando la parte non commestibile
delle piante (paglia, legno, rifiuti organici) e quindi, a differenza dei biocarburanti di prima
generazione, non entrano in competizione con l'utilizzo di materie prime di tipo alimentare.
Anch’essi possono essere usati direttamente da veicoli tradizionali e ridurre considerevolmente le
emissioni di CO2.
Per tutte le ragioni sopra descritte, questo biocarburante sta cominciando a guadagnare
l’attenzione sia dei governi che del settore industriale. Ad esempio, sulla base della relazione
presentata dal Consiglio Nazionale di Difesa delle Risorse degli Stati Uniti d'America (NRDC), per
l’anno 2050, un adeguato sviluppo della produttività da fonti lignocellulosiche, consentirà una
produzione fino a 150 miliardi di galloni di etanolo, che è paragonabile a più di due terzi il
consumo di benzina presente negli Stati Uniti.
È un dato di fatto che, attualmente, diverse società si stanno muovendo con l’ intenzione di
costruire impianti per la sintesi del bioetanolo di seconda generazione.

12
Esistono tuttavia diversi problemi tecnici che devono essere affrontati per rendere il
bioetanolo di seconda generazione redditizio e economicamente competitivo con i tradizionali
combustibili fossili.
In questo scenario, il presente lavoro di tesi si propone di esaminare due passaggi chiave
della produzione di bioetanolo di seconda generazione, al fine di superare alcuni aspetti critici di
questo processo.
La bioconversione della biomassa legnocellulosica in etanolo è un processo costituito da
quattro step principali: pretrattamento, idrolisi, fermentazione e separazione dei prodotti/
distillazione.
La mia attività di ricerca si è focalizzata sull'ottimizzazione dei primi due passaggi.
Il pre-trattamento è necessario per modificare le dimensioni e la struttura, macroscopica e
microscopica, della biomassa nonché la sua composizione chimica e la struttura submicroscopica
in modo che l'idrolisi della frazione di carboidrati in zuccheri monomerici possa avvenire più
rapidamente e con rese più elevate.
Il pre-trattamento più utilizzato è la steam-explosion, che è una delle fasi di lavorazione più
costose nella trasformazione della biomassa in zuccheri fermentabili.
La mia attività di ricerca è stata indirizzata sull’ottimizzazione di questo pretrattamento,
testando diversi agenti impregnanti e diverse condizioni di reazione per trovare il miglior assetto
per questa fase cruciale del processo di sintesi del bioetanolo.
A valle del pretrattamento ci sono due tipi di processo per idrolizzare la materia prima in
zuccheri monometrici, successivamente fermentati ad etanolo. I metodi d’idrolisi più comunemente
usati sono quelli che utilizzano acidi (diluiti e concentrati) ed il processo enzimatico.
L'uso degli enzimi al posto di catalizzatori acidi inorganici è molto vantaggioso, infatti gli
enzimi sono altamente specifici e possono lavorare in condizioni di processo più miti. Inoltre,
utilizzando gli enzimi è possibile ottenere un’idrolisi della cellulosa con rese vicine al 100%.
Tuttavia, l'uso degli enzimi nei processi industriali è ancora limitato per via degli elevati
costi di separazione e purificazione degli enzimi stessi. La maggior parte degli enzimi sono inoltre
relativamente instabili alle alte temperature. Infatti, la massima attività per la maggior parte delle
cellulasi fungine si registra a 50 ± 5 °C, mentre circa il 60% di questa attività si perde nel range di
temperatura 50-60 °C.
Per ovviare a questo problema, nel presente lavoro di tesi è stata esaminata
l’immobilizzazione degli enzimi su opportuni supporti. L'immobilizzazione degli enzimi spesso si
traduce in una migliore stabilità termica e in una maggiore resistenza all’inattivazione. In questo
modo il processo di immobilizzazione potrebbe prolungare la vita media degli enzimi.

13
Inoltre, l'immobilizzazione degli enzimi garantisce un più facile recupero degli stessi e di
conseguenza il riutilizzo di questi catalizzatori per più cicli di reazione, migliorando in questo
modo l’ economicità globale del processo.
Al fine di migliorare l’idrolisi della bioamssa è stato sperimentato l’utilizzo di un
bioreattore in cui far avvenire questo step del processo. L’utilizzo di questa tecnologia ci ha
consentito di operare con uno stretto controllo dei parametri operativi (pH e temperatura) e con un
opportuno grado di miscelazione.
La mia attività di dottorato di ricerca si propone di aprire la strada per superare alcune
limitazioni attuali nella sintesi del bioetanolo di seconda generazione, ottimizzando due passaggi
cruciali:
• il pretrattamento attraverso steam-explosion testando diversi impregnanti e diverse
condizioni di reazione;
• il processo di idrolisi attraverso l’utilizzo di un opportuno bioreattore;
� Il processo d’idrolisi attraverso l’utilizzo di enzimi immobilizzati.

14
Sommario
La necessità di ricorrere a fonti di energia pulita per soddisfare i sempre crescenti bisogni
energetici del pianeta è un tema di forte attualità soprattutto di fronte alle conseguenze, talvolta
anche drammatiche, che l’alterazione del clima determina.
In questo scenario, le emissioni dovute al settore automobilistico sono uno degli aspetti
cruciali da migliorare. Pertanto lo sviluppo di nuove fonti di energia a basse emissioni diventa un
must per la ricerca.
La comunità scientifica internazionale deve concentrare i propri sforzi al fine di ridisegnare
e migliorare il processo di sintesi dei biocarburanti con l’obiettivo di sviluppare carburanti che
siano sostenibili da un punto di vista ambientale ed economicamente competitivi con i tradizionali
combustibili fossili.
Il bio-etanolo di seconda generazione è sicuramente uno dei più promettenti biocarburanti
per la sostituzione dei combustibili fossili e, di conseguenza, per ottenere una forte riduzione delle
emissioni di gas serra.
Questa tesi di dottorato è stata focalizzata sull'ottimizzazione di due passaggi cruciali nella
sintesi del bio-etanolo di seconda generazione: il pretrattamento di tipo steam-explosion e il
processo di idrolisi.
Nel primo capitolo viene descritto l’ingente problema del cambiamento climatico e del
conseguente global warming e il ruolo cruciale che le emissioni di gas-serra hanno in questo
contesto. Al fine di ridurre questo tipo di emissioni un ruolo fondamentale può essere giocato dalla
sostituzione dei tradizionali combustibili fossili con biofuels. Fra questi ultimi, il bioetanolo da
biomasse lignocellulosiche è sicuramente uno dei più promettenti.
Nel secondo capitolo viene descritto il processo di produzione del bioetanolo focalizzando
l’attenzione sul bioetanolo di seconda generazione da lignocellulosa. Il capitolo comprende una
accurata trattazione sulla biomassa utilizzata e sui vari step del processo produttivo.
Lo stato dell’arte sul processo d’idrolisi enzimatica è l’argomento del terzo capitolo. In
questa parte del lavoro di tesi viene descritto in dettaglio il processo di idrolisi enzimatica, con
particolare attenzione alle caratteristiche ed al funzionamento degli enzimi stessi (cellulasi).
Nel quarto capitolo è presentata l’attività sperimentale, svolta presso il Dipartimento
d’Ingegneria Chimica dell’Università di Lund (Svezia) per l’ottimizzazione dello step di
pretrattamento. In questa fase della ricerca, diversi agenti impregnati sono stati utilizzati per il
miglioramento del processo di steam-explosion.

15
Il quinto capitolo descrive l’attività sperimentale, svolta sempre presso l’Università di Lund,
portata avanti al fine di testare il processo di idrolisi all’interno di un bioreattore. Questa fase
dell’attività di ricerca ha avuto lo scopo di verificare i vantaggi apportati al processo da una
miscelazione maggiormente efficiente dei reagenti.
Il sesto capitolo riporta la descrizione del lavoro di ricerca sviluppato presso i laboratori
del Centro Ricerche ENEA di Trisaia (Rotondella – MT). Questa fase dello studio ha avuto lo scopo
di testare l’immobilizzazione enzimatica. Il processo di immobilizzazione, infatti, è una tecnica che
permette di ottenere enzimi più stabili, maggiormente maneggevoli e soprattutto permette un più
facile recupero e riutilizzo degli enzimi stessi.
Questo lavoro di tesi è stato svolto in collaborazione con l'ENEA (Agenzia Italiana per le
Nuove Tecnologie, l'Energia e lo Sviluppo Economico-sostenibile), Laboratorio di Tecnologia e
Ingegneria per la biomassa e solare termico, presso il Centro Ricerche della Trisaia (Rotondella -
MT).
Parte dell’attività di ricerca è stata svolta presso i laboratori del Dipartimento di
Ingegneria Chimica dell’Università di Lund sotto la supervisione del Prof. Guido Zacchi.

16
Chapter1
Secondgenerationbioethanol:a
sustainablechoicetomitigateclimate
change.

17
1. Second generation bioethanol: a sustainable choice to mitigate climate change.
1.1 Introduction
International researchers has got a new urgency to improve the accuracy of predicting climate change and, overall, to find an effective solution to mitigate it. As matter of fact, our lives are linked to weather and climate, and to energy use and our use of fossil fuels could warm the atmosphere enough to lead earth to serious consequences.
One way to slow these trends is to increase energy efficiency and develop and use clean, sustainable energy sources. Political and business leaders throughout the world recognize that global climate change is real, and are taking steps to reduce fossil fuel emissions.
In fact, it has been proven that emissions of gases like carbon dioxide (CO2), methane (CH4), nitrous oxide (N2O), and chlorofluorocarbons CFC-11 (CCl3F) and CFC-12 (CCl2F2) are the main cause of greenhouse effect. The additional anthropogenic greenhouse gases, which have been introduced into the atmosphere, they are created by burning fossil fuels (Ledley et al., 1999).
Many Governments and industries are responding to the climate change challenge finding ways to use waste products to produce energy and looking at possibilities associated with alternative energy sources.
Many auto makers are investing a lot of money to produce low-emission cars or vehicles using alternative fuels such as ethanol. They manufacture flexible-fuel vehicles that can operate on gasoline or any blend of ethanol in gasoline as high as 85%. In fact, biofuel is one of the most promising way to replace fossil fuel and so to reduce greenhouse emissions (Joint Transport Research Centre, 2008).
Converting biomass feedstocks to biofuels is an environmentally friendly process. So is using biofuels for transportation. When we use bioethanol instead of gasoline, we help reduce atmospheric CO2 in three ways: (1) we avoid the emissions associated with gasoline; (2) we allow the CO2 content of the fossil fuels to remain in storage; and (3) we provide a mechanism for CO2 absorption by growing new biomass for fuels. Because of their compatibility with the natural carbon cycle, biofuels offer the most beneficial alternative for reducing greenhouse gases from the transportation sector.
This market is also being driven by a rapid rise in petroleum prices and, in response, a massive global expansion of biofuel production from maize, oilseed, and sugar crops. Soon the price of these commodities will be determined by their value as feedstock for biofuel rather than their importance as human food (Cassman, 2007). The expectation that petroleum prices will remain high and supportive government policies in several major crop producing countries are providing strong momentum for continued expansion of biofuel production capacity and the associated pressures on global food supply.

18
Given this situation, international researchers have focused their attention on the development of, so called, second generation biofuels as meaning fuel produced from no-edible sources. Production of these fuels avoids competition with food production for arable land.
Among these biofuel, lignocellusic bioethanol is one of the most promising due to the abundance of lignocellulosic biomass and, overall, due to its low life-cycle GHG emissions.
1.2 Climate change and greenhouse gases
The phenomenon known as the “greenhouse effect” is the effect for which Infrared (IR) active gases absorb thermal IR radiation emitted by the Earth’s surface and atmosphere. The atmosphere is warmed by this mechanism and, in turn, emits IR radiation, with a significant portion of this energy acting to warm the surface and the lower atmosphere (Fig. 1.1).
As a consequence the average surface air temperature of the Earth is about 30° C higher than it would be without atmospheric absorption and reradiation of IR energy (Henderson-Sellers and Robinson, 2000; Kellogg, 1996; Peixoto and Oort, 1992).
Fig. 1.1 The natural greenhouse effect
The IR active gases responsible for the effect are principally water vapor (H2O), carbon dioxide (CO2), and ozone (O3), which are naturally present in the Earth’s atmosphere. So this gases are called “greenhouse gases”.
19
The rapid increase in concentrations of greenhouse gases since the industrial period began has given rise to concern over potential resultant climate changes.
The principal greenhouse gas concentrations that have increased over the industrial period are carbon dioxide (CO2), methane (CH4), nitrous oxide (N2O), and chlorofluorocarbons CFC-11 (CCl3F) and CFC-12 (CCl2F2) (Hansen, 1998; Schimel et al., 1996).
The additional anthropogenic greenhouse gases that have been introduced into the atmosphere increase the IR energy absorbed by the atmosphere, thereby exerting a warming influence on the lower atmosphere and the surface, and a cooling influence on the stratosphere (Peixoto and Oort, 1992; Ramanathan, 1985)
The radiative influence resulting from a given incremental increase in greenhouse gas concentration can be quantified and compared as the change in downward IR flux at the tropopause, a quantity known as the radiative forcing. Climate model calculations indicate that to good approximation the global warming influence of the several greenhouse gases is equal for equal forcing (Wang et al., 1992; Wang et al., 1991), lending support to the utility of the concept of climate forcing and response.
Of the several anthropogenic greenhouse gases, CO2 is the most important agent of potential future climate warming because of its large current greenhouse forcing, its substantial projected future forcing (Houghton et al., 1996), and its long persistence in the atmosphere.
1.2.1 Climate Change and Carbon Dioxide
Global warming is caused by the emission of greenhouse gases . 72% of the totally emitted greenhouse gases is carbon dioxide (CO2), 18% Methane and 9% Nitrous oxide (NOx). Carbon dioxide emissions therefore are the most important cause of global warming. CO2 is inevitably created by burning fuels like e.g. oil, natural gas, diesel, organic-diesel, petrol, organic-petrol.
Natural sources of CO2 occur within the carbon cycle where billions of tons of atmospheric CO2 are removed from the atmosphere by oceans and growing plants, also known as ‘sinks’, and are emitted back into the atmosphere annually through natural processes also known as ‘sources’. When in balance, the total carbon dioxide emissions and removals from the entire carbon cycle is roughly equal (Fig. 1.2).

20
Fig. 1.2 The global carbon cycle.
Since the Industrial Revolution in the 1700’s, human activities, such as the burning of oil, coal and gas, and deforestation, has increased CO2 concentrations in the atmosphere. In 2005, global atmospheric concentrations of CO2 were 35% higher than they were before the Industrial Revolution (Fig. 1.3; U.S. Department of Energy, 1999).
Fig. 1.3 The change in the atmospheric concentration of carbon dioxide over the last 1000 years (U.S. Department of Energy, 1999)

21
In the 1980s, a convergence of results from paleoclimate data and geochemical and climate models suggested that such long-term variations in climate have been strongly influenced by natural variations in the carbon dioxide (CO2) content of the atmosphere (Cassman, 2007; Crowley and Berner, 2001; Barron and Washington, 1985).
Figure 1.4 shows clearly this correlation.
Fig. 1.4 Global temperature trend and CO2 concentration in atmosphere (US DOE data - www.energy.gov)
As matter of fact, reducing CO2 emissions became a must for worldwide governments and industry and a great challenge for international research.
For this reasons, several studies have been developed to locate the major anthropogenic CO2 sources. U.S. Department of Energy (DOE) has been focused a great effort in this direction by using and comparing data coming from two sources: from 1958 forward, they are from a weather station high atop the Mona Loa volcano in Hawaii and earlier data are from ice cores in Antarctica.
Obtained results are summarized in figure 1.5.

22
Fig. 1.5 Carbon Dioxide emission per year (US DOE Data - www.energy.gov)
Data reported in figure 1.6 show clearly how the largest source of CO2 emissions globally is the combustion of fossil fuels such as coal, oil and gas. When fossil fuels are burned to produce energy the carbon stored in them is emitted almost entirely as CO2. The main fossil fuels burned by humans are petroleum (oil), natural gas and coal. CO2 is emitted by the burning of fossil fuels for electricity generation, industrial uses, transportation, as well as in homes and commercial buildings (Crowley and Berner, 2001). The figure below displays emissions for each of main sectors.
Fig. 1.6 Global CO2 emissions per sector (Pachauri, IPCC Fourth assessment, WG III, 2007)

23
The transportation sector is one of the largest sources of CO2 emissions. Almost all of the energy consumed in the transportation sector is petroleum based, including gasoline, diesel and jet fuel. Automobiles and light-duty trucks account for almost two-thirds of emissions from the transportation sector and emissions have steadily grown since 1990. Other sources of transportation emissions are freight trucks, aircraft, trains and boats.
Emissions from transportation depend on the number of trips or miles traveled by each type of vehicle each year, which are in turn influenced by larger economic trends and consumer behaviors. Over the long term, research developed to improve the fuel efficiency of vehicles and in the type of fuel used can also influence the level of emissions.
1.3 Automotive sector CO2 reduction: the biofuel solution
The automotive sector is playing a leading role, embracing its responsibility to reduce CO2 emissions. Its commitment is reflected in investments in technology solutions that have brought significant cuts in CO2 emissions from cars and commercial vehicles.
But nowadays, the best solution to reduce CO2 emissions is the utilization of biofuel to replace traditional fossil fuel. As matter of fact, biofuels offer CO2 reduction benefits relative to mineral fuels because their carbon was absorbed from the atmosphere as the source plants grew, rather than being released from underground storage as with fossil fuels. However few if any biofuels are truly ‘carbon neutral’; those grown in Europe typically offer around a 50% greenhouse gas reduction, although the benefits of ethanol imported from Brazil are typically much greater (around 80% reduction) (Smokers et Al, 2006).
Currently the biofuels most commonly available as transport fuels are biodiesel and bioethanol (with the latter often converted to bio-ETBE to be used as an additive in petrol). The traditional main feedstocks are crops grown for oil (such as rape, soya and sunflower) for biodiesel, and crops high in sugar or starch (including sugar beet and cane, various grain crops, etc) for ethanol.
Biodiesel is a renewable, domestic substitute for petroleum diesel fuel. It can be used in any diesel engine without modification in any concentration. It is a product of a reaction between lipids (typically vegetable oil) and an alcohol, with a byproduct of glycol. There are many ways to accomplish this, but the most common is transesterification. The process steps for transesterification are reactant preparation, transesterification, separation, and purification (Coronado et al., 2009). There are many possible feedstocks, but the most common feedstocks are soybean oil, rapeseed oil, canola oil, sunflower oil, and palm oil (Demirbas, 2009).
Bioethanol is an alcohol that can be used as a vehicle fuel when combined with as little as 15% gasoline. It requires small modifications to the most prevalent gasoline engines, and has been gaining increasing traction in vehicle design for the last decade. Ethanol is created by the fermentation of simple sugars (glucose). The most prevalent feedstock used to make ethanol is corn starch (Graboski, 2002).
World-wide production of biofuels is growing rapidly. From 2001 to 2007, world production of ethanol tripled from 20 billion liters to 50 billion liters (F.O. Licht’s, 2007), and world biodiesel

24
production grew from 0.8 billion liters to almost 4 billion liters. The production of biodiesel in Europe is growing more rapidly than the production of ethanol, with a current level of more than 5.5 million tonnes of biodiesel and only 2.0 million tons of ethanol (F.O. Licht’s, 2007).
Biofuel are in fact an effective solution to replace traditional fossil fuel but their production could become unsustainable if they compete with food crops for available land.
1.3.1 The importance of second generation Biofuels
Global biofuel production has been increasing rapidly over the last decade, but the expanding biofuel industry has recently raised important concerns. In particular, the sustainability of many first-generation biofuels – which are produced primarily from food crops such as grains, sugar cane and vegetable oils – has been increasingly questioned over concerns such as reported displacement of food-crops.
In general, there is growing consensus that if significant emission reductions in the transport sector are to be achieved, biofuel technologies must become more efficient in terms of net lifecycle greenhouse gas (GHG) emission reductions while at the same time is socially and environmentally sustainable. It is increasingly understood that most first-generation biofuels, with the exception of sugar cane ethanol, will play a limited role in the future transport fuel mix (IEA, 2010; Hill et al., 2006).
The increasing criticism of the sustainability of many first-generation biofuels has raised attention to the potential of so-called second-generation biofuels. Depending on the feedstock choice and the cultivation technique, second-generation biofuel production has the potential to provide benefits such as consuming waste residues and making use of abandoned land. In this way, the new fuels could offer considerable potential to promote rural development and improve economic conditions in emerging and developing regions.
Second-generation biofuels are not yet produced commercially, but a considerable number of pilot and demonstration plants have been announced or set up in recent years, with research activities taking place mainly in North America, Europe and a few emerging countries (e.g. Brazil, China, India and Thailand). Current IEA projections see a rapid increase in biofuel demand, in particular for second-generation biofuels, in an energy sector that aims on stabilizing atmospheric CO2 concentration at 450 parts per million (ppm).
The World Energy Outlook 2009 (IEA, 2009a) 450 Scenario1 projects biofuels to provide 9% (11.7 EJ) of the total transport fuel demand (126 EJ) in 2030. In the Blue Map Scenario2 of Energy Technology Perspectives 2008 (IEA, 2008) that extends analysis until 2050, biofuels provide 26% (29 EJ) of total transportation fuel (112 EJ) in 2050, with second-generation biofuels accounting for roughly 90% of all biofuel.
Ambitious biofuel support policies have recently been adopted in both the United States (with 60 billion litres of second-generation biofuel by 2022) and the European Union (with 10% renewable energy in the transport sector by 2020). Due to the size of the two markets and their considerable biofuel imports, the US and EU mandates could become an important driver for the

25
global development of second-generation biofuels, since current IEA analysis sees a shortfall in domestic production in both the US and EU that would need to be met with imports (IEA, 2009b).
1.4 GHG emission: Life-Cycle comparative analysis among different biofuels
In general, there is growing consensus that if significant emission reductions in the transport sector are to be achieved, biofuel technologies must become more efficient in terms of net lifecycle greenhouse gas (GHG) emission reductions while at the same time is socially and environmentally sustainable. It is increasingly understood that most first-generation biofuels are not sustainable for their competition with edible crops and so they will likely have a limited role in the future transport fuel mix (United Nations Conference on Trade and Development, 2009).
In order to get a complete understanding of the net greenhouse gas emissions by biofuels combusting, previous research investigating biofuels from a full fuel life cycle perspective was examined. To understand the effects of biofuel use, the entire lifecycle must be considered, including the manufacture of inputs (e.g. fertilizer), crop production, transportation of feedstock from farm to production facilities, and then biofuel production, distribution, and use.
The literature on biofuels contains different and sometimes conflicting studies about this subject so an accurate analysis is very hard but the three studies compared here are very similar for the approach, the methodology of investigation and the accuracy of analysis. Obtained data are summarized in fig. 1.7 (Delucchi, 2006; Farrell et Al, 2006; Spatari et Al, 2005).
Fig. 1.7 Life cycle GHG emission by different biofuel (Delucchi, 2006; Farrell et Al, 2006; Spatari et Al, 2005)
By this comparison among some of the main biofuels present on the market, it’s possible to note how cellulosic ethanol present lower GHG emission (evaluated as CO2-equivalent greenhouse-gas emission) per liter of fuel respect to 1st generation bioethanol from corn and biodiesel from

26
soybean oil. In particular, this analysis shows that the best result has been achieved by cellulosic ethanol from switch grass.
In this direction, it’s important to highlight results obtained by E. D. Larson that in his analysis he has summarized and synthesized results from the rich literature of published life-cycle analyses (LCAs) of liquid biofuels, with a focus on elucidating the impacts that production and use of such biofuels might have on emissions of greenhouse gases (Larson, 2006).
Data obtained by Larson are reported in figure 1.8.
Fig. 1.8 Well-to-wheels (WTW) energy requirements and greenhouse gas emissions for conventional biofuel pathways compared with gasoline and diesel pathways (Larson, 2006)
This analysis shows Well-to-wheels (WTW) energy requirements and greenhouse gas emissions per vehicle-km (v-km) for a given biofuel and originating biomass source compared with fossil gasoline and diesel.
Also in this case lignocellulosic ethanol present the best result in term of reduction of GHG emissions. Reported data also stress how lignocellulsic bioethanol require a lot of energy underlinr in this way how this is process that have to be developed and optimized in order to became an effective solution to replace fossil fuel.
1.5 Conclusions
International researchers have confirmed the relationship between human activity and climate change: human emissions of so-called greenhouse gases are reinforcing the Earth’s natural greenhouse effect and causing atmospheric temperatures to rise. The main cause of climate change

27
is the burning of fossil fuels, a process necessarily accompanied by release of the greenhouse gas carbon dioxide (CO2).
One of the crucial sector is transport that consume fossil derivates (gasoline and diesel) emitting CO2. So, there is an increasing interest in biofuels for climate change mitigation, since an amount of carbon dioxide (CO2) emitted during combustion of the biofuel is absorbed during photosynthesis by replacement biomass.
The main biofuel are ethanol to replace gasoline and biodiesel a substitute of fossil diesel. This biofuel can be synthetized from different biomass such as soybeans, corn, coconut or sunflowers oil for the biodiesel and grains or seeds and sugar crops for bioethanol. These “Conventional” (or first generation) biofuels will play a limited role in the future due to their competition with food production for arable land.
The increasing criticism of the sustainability of many first-generation biofuels has raised attention to “Advanced” (or second generation) biofuels which are produced from no-edible feedstock.
Lignocellulosic ethanol is one of the most promising advanced biofuel. In fact, it can be produced by using a cheap and abundant biomass and, overall, it can achieve the greatest reduction of GHG gas emission respect to the other 2nd generation biofuels.
1.6 References
Barron E. J., Washington W. M., Warm cretaceous climates: high atmospheric CO2 as a plausible mechanism, in The Carbon Cycle and Atmospheric CO2: Natural Variations Archean to Present, E. T. Sundquist, W. S. Broecker, Eds.(American Geophysical Union, Washington, DC - ) A86-39426 18-46, pp. 546-553, 1985.
Cassman K. G., Climate change, biofuels, and global food security, Environmental Research Letters 2, 2007.
Coronado, C. R., de Carvalho Jr J. A., Silveira, J. L., Biodiesel CO2 emissions: A comparison with the main fuels in the Brazilian market. Fuel Processing Technology, 90(2), 204-211, 2009.
Crowley T. J., Berner R. A., Paleoclimate: Enhanced: CO2 and Climate Change, Science 4, Vol. 292. no. 5518, pp. 870 – 872, May 2001.
Delucchi, M., Lifecycle analyses of biofuels, Draft report to Institute of Transportation Studies, University of California, Davis. UCE-ITS-RR-06-08, May 2006
Demirbas, A. Progress and recent trends in biodiesel fuels. Energy Conversion and Management, 50(1), 14-34, 2009.
F.O. Licht’s, World Ethanol and Biofuels Report, Vol. 6 No. 2. Agra Informa Ltd, 2007
Farrell, A. E., Plevin R. J., Turner B. T., Jones A. D., O’Hare M., Kammen D. M., Ethanol can contribute to energy and environmental goals, Science, Vol 311,no 5760, pp 506, 2006.

28
Graboski, M. S. Fossil energy use in the manufacture of corn ethanol. Report prepared for the National Corn Growers Association, 2002.
Hansen, J. E., Sato M., Lacis A., Ruedy R., Gegen I., Matthews E., Climate forcings in the industrial era, Proceedings of the National Academy of Sciences, 95, 12,753-12,758, 1998.
Henderson-Sellers A., Robinson P. J., Contemporary Climatology, International Journal of Climatology, Vol. 20, Issue 12, pp. 1517–1518, October 2000.
Hill, J., Nelson, E., Tilman, D., Polasky, S., Tiffany, D., Environmental, economic, and energetic costs and benefits of biodiesel and ethanol biofuels, PNAS – Proceedings of the National Academy of Sciences of the United States of America, Vol. 103, pp. 11206-11210, National Acad Sciences, 2006
Houghton, J. T., Filho L. G. M., Callander B. A., Harris N., Kattenberg A., Maskell K., Climate Change 1995: The Science of Climate Change, Intergovernmental Panel on Climate Change, pp. 572, Cambridge University Press, Cambridge, GB, 1996.
IEA, Energy Technology Perspectives 2008: Scenarios and Strategies to 2050, OECD/IEA, Paris, 2008.
IEA, Medium Term Oil Market Report, OECD/IEA, Paris, 2009b
IEA, Sustainable Production of Second -Generation Biofuels, OECD/IEA, Paris, 2010
IEA, World Energy Outlook 2009, OECD/IEA, Paris, 2009a.
Joint Transport Research Centre, Transport Outlook 2008 – Focusing on CO2 emissions from road vehicles, Discussion Paper 2008-13, May 2008.
Kellogg, W. K., Greenhouse Effect, in Encyclopedia of Climate and Weather, edited by S. H. Schneider, pp. 368- 371, Oxford University Press, New York, 1996.
Larson E. D., “A review of life-cycle analysis studies on liquid biofuel systems for the transport sector”, Energy for Sustainable Development Volume X No. 2, June 2006.
Ledley T. S., Sundquist E. T., Schwartz S. E., Hall D. K., Fellows J. D., Killeen T. L., Climate Change and Greenhouse Gases, EOS Vol. 80, No. 39, September 28, p. 453, 1999.
Pachauri R. K., Climate Change 2007: Synthesis Report. Contribution of Working Groups I, II and III to the Fourth Assessment Report of the Intergovernmental Panel on Climate Change, 2007
Peixoto, J. P., Oort A. H., Physics of Climate, 520 pp., American Institute of Physics, ISBN 0 88318 712 4, New York, 1992.
Ramanathan, V., Cicerone R. J. , Singh H. B., Kiehl J. T., Trace gas trends and their potential role in climate change, J. Geophys. Res., 90, pp. 5547-5566, 1985.
Schimel D., Alves D., Enting I., Heimann M., Joos F., Raynaud D., Wigley T., Prather M., Derwent R., Ehhalt D., Fraser P., Sauhueza E., Zhou X., Jonas P., Charlson R., Rodhe H., Sadasivan S.,
29
Shine K. P., Fouquart Y., Ramaswamy V., Solomon S., Srinivasan J., Albritton D., Derwent R., Isaksen I., Lal M., Wuebbles D., Radiative forcing of climate change, in Climate Change 1995: The Science of Climate Change, edited by J. T. Houghton, L. G. M. Filho, B. A. Callander, N. Harris, A. Kattenberg, and K. Maskell, pp. 65-131, Cambridge University Press, Cambridge, UK, 1996.
Smokers R., Vermeulen F. R., van Mieghem R., Gense R., Skinner I., Fergusson M., MacKay E., Brink P. T., Fontaras G., Samaras Z., Review and analysis of the reduction potential and costs of technological and other measures to reduce CO2-emissions from passenger cars, Final Report for European Commission, October 2006.
Spatari, S., Zhang, Y., MacLean, H. L., Life Cycle Assessment of Switchgrass- and Corn Stover-Derived Ethanol-Fueled Automobiles Environmental. Science and Technology, Vol. 39 (24), pp 9750–9758, 2005.
U.S. Department of Energy, Office of Energy Efficiency and Renewable Energy - Office of Transportation Technologies. Report “Biofuels: A Solution for Climate Change”, September 1999.
United Nations Conference on Trade and Development, The Biofuels Market: Current Situation and Alternative Scenarios, Geneva and New York, 2009
Wang, W.-C., Dudek M. P., Liang X.-Z., Kiehl T. J., Inadequacy of effective CO2 as a proxy in simulating the greenhouse effect of other radiatively active gases, Nature, 350, 573-577, 1991.
Wang, W.-C., Dudek M. P., Liang X.-Z., Inadequacy of effective CO2 as a proxy in assessing the regional climate change due to other radiatively active gases, Geophysical Research Letters, 19, 1375-1378, 1992.
www.energy.gov

30
Chapter2
Bioethanolproductionfrom
LignocellulosicBiomass

31
2. Bioethanol production from Lignocellulosic Biomass
2.1 Introduction
Bioethanol can be produced from several different biomass feedstocks: sucrose rich feedstocks (e.g. sugar-cane), starchy materials (e.g. corn grain), and lignocellulosic biomass. This last category, including biomass such as corn stover and wheat straw, woody residues from forest thinning and paper, it is promising especially in those countries with limited lands availability. In fact, residues are often widely available and do not compete with food production in terms of land destination. Lignocellulosic biomass is the most abundant reproducible resource on the Earth and it could produce up to 442 billion l per year of bioethanol (Bohlmann, 2006).
The process converting the biomass biopolymers to fermentable sugars is called hydrolysis. There are two major categories of methods employed. The first and older method uses acids as catalyst, while the second uses enzymes called cellulases. Feedstock pretreatment has been recognized as a necessary upstream process to remove lignin and enhance the porosity of the lignocellulosic materials prior to the enzymatic process (Zhu and Pan, 2010; Kumar et al., 2009). Cellulases are proteins that have been conventionally divided into three major groups: endoglucanase, which attacks low cristallinity regions in the cellulose fibers by endoaction, creating free chain-ends; exoglucanases or cellobiohydrolases which hydrolyze the 1,4- glycocidyl linkages to form cellobiose; and β-glucosidase which converts cellooligosaccharides and disaccharide cellobiose into glucose residues. In addition to the three major groups of cellulose enzymes, there are also a number of other enzymes that attack hemicelluloses, such as xylanase, galactomannase and glucomannase. These enzymes work together synergistically to attack cellulose and hemicellulose. The final step of upstream processes is the fermentation of monomer sugars to ethanol. High solids loadings are usually required to obtain higher ethanol levels in the fermentation broths. In particular, solids loadings of pretreated lignocellulose feedstock close to 30% (w/w) would be need to reach an ethanol concentration of 4-5% that is considered a threshold level for a sustainable distillation process. However, increasing the amount of the solids content in a bioreactor the hydrolytic performances of the enzymes mixture tends to worsen. Several strategies have been investigated to overcome this limitation, such as the simultaneous saccharification and fermentation (SSF). In this process, the sugars released from the hydrolysis are directly consumed by the present microorganisms. However, since fermentation and hydrolysis usually have different optimum temperatures, separate enzymatic hydrolysis and fermentation (SHF) is still considered as a choice .
2.2 Structure of lignocellulose biomass
Lignocellulosic biomass is typically nonedible plant material, including dedicated crops of wood and grass, and agro-forest residues. The basic structure of all lignocellulosic biomass consists of three basic polymers: cellulose (C6H10O5)x, hemicelluloses such as xylan (C5H8O4)x, and lignin [C9H10O3 • (OCH3)0.9-1.7]n in trunk, foliage, and bark (Demirbas, 2005).

32
Cellulose is a homopolysaccharide composed of β-D-pyranose units, linked by β-1, 4- glycosidic bonds (Lynd et al., 2002). Cellobiose is the smallest repetitive unit and it is formed by two glucose monomers. The long-chain cellulose polymers are packed together into microfibrils by hydrogen and van der Waals bonds. Hemicellulose and lignin cover the microfibils. Hemicellulose is a mixture of polysaccharides, including pentoses, hexoses and uronic acids. Lignin is the most complex natural polymer consisting of a predominant building block of phenylpropane units. More specifically, p-coumaryl alcohol, coniferyl alcohol and sinapyl alcohol are the most commonly encountered alcohols (Harmesen et al., 2010). Lignocellulosic materials also contain small amounts of pectin, proteins, extractives (i.e. no- structural sugars, nitrogenous material, chlorophyll and waxes) and ash (Kumar et al., 2009).
The composition of the biomass constituents can vary greatly among various sources. Accurate measurements of the biomass constituents, mainly lignin and carbohydrates, are of prime importance because they assist tailored process designs for the maximum recovery of energy and products from the raw materials.
Since 1900, researchers have developed several methods to measure the lignin and carbohydrates content of lignocellulosic biomass. Globally recognized Organizations, such as American Society for Testing and Materials (ASTM), Technical Association of the Pulp and Paper Industry (TAPPI) and National Renewable energy and Laboratory (NREL) have developed methods to determine the chemical composition of biomass, based on modifications of the two main procedures developed by Ritter (Ritter et al., 1932) and by Seaman (Saeman et al., 1954).
2.2.1 Cellulose
Cellulose is the most important natural polymer and the first polymer on which X-ray investigation had been performed, a year after the discovery of diffraction of X-rays on crystalline materials in 1912 (Zugenmaier, 2001).
Cellulose is found in nature mainly in plant cell walls in the range of approximately 35 to 50% of plant dry weight (Mohan et al., 2006). However some animals, bacteria and algal species can also produce the polymer (Lynd et al, 2002).
Cellulose is a homopolymer of ß-linked D-glucopyranose units usually present in a highly ordered crystalline structure that impedes hydrolysis (Lynd et al., 1999). The monomers are connected with ß-1,4 glycosidic bonds. Glucose is present in chair conformation. Every second glucose unit is rotated by 180° to the main axis of the chain; therefore every second glycosidic bond is in the same sterical conformation, so the repeating unit of cellulose is cellobiose.
Cellulose is a high molecular weight polysaccharide, the degree of polymerisation (DP) is usually between 500 and 15,000 (Sjöström, 1993). The structure of cellulose is shown schematically in figure 2.1.

33
Fig. 2.1 Schematic structure of cellulose with cellobiose as repeating unit
Intramolecular hydrogen bonds are present between the hydroxyl group of the C3 and the oxygen atom of the C5 in the adjacent glucose units. Cellulose fibers form bundles, which are stabilized by intermolecular hydrogen bonds between the cellulose chains. Approximately 30 individual cellulose molecules are assembled into larger units known as elementary fibrils (protofibrils), which are packed into larger units called microfibrils, and these are in turn assembled into the familiar cellulose fibers (Lynd et al., 2002).
In most cases the cellulose fibers are embedded in a matrix of hemicelluloses and lignin, which comprise 20 to 35 and 5 to 30% of plant dry weight (Lynd et al., 1999).
There are crystalline and amorphous regions in the structure of cellulose. Amorphous regions are less organised than the crystalline, thus these regions are less resistant to enzymatic attack. In addition to the crystalline and amorphous regions, cellulose fibers contain various types of irregularities, such as kinks or twists of microfibrils, or voids such as surface micropores, large pits and capillaries (Lynd et al., 2002).
The total surface area of a cellulose fiber is thus much greater than the surface area of an ideally smooth fiber of the same dimension. The net effect of structural heterogeneity within the fiber is that the fibers are at least partially hydratated by water when immersed in aqueous media, and some micropores and capillaries are sufficiently spacious to permit penetration by relatively large molecules- including, in some cases, cellulolytic enzymes (Lynd, 2002). Cellulose is hydrophilic, but not water-soluble. Cellulose is hydrolysed by acids, but not by alkalis, in contrast to hemicellulose, which can be hydrolysed and solubilised both with acids and with concentrated bases.
2.2.2 Hemicellulose
Hemicellulose is a highly branched heteropolysaccharide, mainly consist of pentoses (β-D-xylose, α-L-arabinose) and hexoses (β-D-mannose, β-D-glucose, α-D-galactose). Among building blocks, uronic acids (α-D-glucuronic, α-D-4-O-methylgalacturonic, α-D-galacturonic acids) are present as well. Other sugars such as α-L-rhamnose and α-L-fucose may also be present in small amounts and hydroxyls groups of sugars can be partially substituted with acetyl groups. (Gírio et al., 2010). Xylose is the predominant pentose sugar derived from the hemicelluloses of the most hardwood feedstocks, but arabinose can constitute a significant amount of pentose sugars derived from various agricultural residues and other herbaceous crops, such as switchgrass (Balat, 2008).

34
The linkage of the monomers can be different glycosidic bonds. The DP is less, compared to cellulose (100-200). The classification of hemicelluloses can be upon their structure. The classification recommended by Brigham et al. (1996) is based on the composition of the main chain: (a) xylans, (b) mannans, (c) ß-glucans, (d) xyloglucans and (e) arabinogalactans. Xylans are probably the most abundant hemicelluloses. The main chain is built up from ß-1,4-xylopyranose subunits, which is usually substituted with D-arabinose, L-galactose or methyl-glucuronic acid side-chains (Fig.2.2 A,B). Mannans have basically two main groups; glucomannans and galactomannans. The main chain of the glucomannans are built up from glucose and mannose subunits linked by ß-1,4 glycosidic bonds (Fig.2.2 C), whereas galactomannans have ß-1,4 homomannan main chain substituted with D-galactose by a-1,6 bonds. Mannans are mostly presented in softwoods. ß-glucans are randomly linked by ß-1,3 and ß-1,4 linkages.
Fig. 2.2 Structure of three types of hemicelluloses: (A) arabinoxylan, (B) arabino4-O-methyl glucuronoxylan and
(C) O-acetyl-galactoglucomannan according to Sjöström (1993)

35
2.2.3 Lignin
Among the three major biopolymers that constitute wood, lignin is distinctly different from the other two macromolecular polymers. It is a copolymer of three different phenylpropane monomer units (monolignols), that differ in their degree of methoxylation (Nagy, 2009) The three most common building blocks are the 4-hydroxyphenylpropane, the guaiacylpropane, and the syringylpropane subunits (Fig.2.3). 4-hydroxyphenylpropane unit is not methoxylated, whereas guajacyl and syringyl units have one and two methoxyl groups adjacent to the phenolic hydroxyl group, respectively.
The precursors of these units during the biosynthesis of the lignin are p-coumaryl alcohol, trans-coniferyl alcohol and trans-sinapyl alcohol.
Fig. 2.3 Building blocks and linkages in lignin macromolecules
Composition and amount of lignin varies from species to species. Softwoods are known to
contain higher contents of lignin, followed by hardwoods and grasses (Zakzeski et al., 2010). Morevor, lignin from hardwood contains a higher methoxylcontent due to the presence of roughly equal guaiacyl and syringyl units, compared to that from softwood with guaiacyl units accounting for around 90 % of the total units (Brunow, 2006). Lignin basically consists of a variety of linkages irregularly connecting various aryl ethers (Dorrestijin et al., 2000). Although the proportion of these linkages varies according to the type of wood, typically more than two-thirds of the linkages in lignin are ether linkages. Hardwood lignin contains about 1.5 times more β-O-4-linkages than softwood lignin (Dorrestijin et al., 2000). Other major linkages include β-5-, 5-5-, 4-O-5, β-1-, α-O-4 and β-β-linkages, as shown in figure 2.4.

36
Fig. 2.4 Major linkages found in lignin polymer: (A) β-O-4, (B) 5-5, (C) α-O-4, (D) β-5, (E) β-β, (F) 4-O-5, and (G)
β-1 (Pandey and Kim, 2011)
Although the proportion of these linkages varies considerably, typical values have been
listed in Table 2.1
Tab. 2.1 Proportion of major linkages in lignin (Pandey and Kim, 2011)

37
The functional groups of major influence on the reactivity of lignin consist of methoxyl,
phenolic and aliphatic hydroxyl, benzyl alchohol, noncyclic benzyl ether and carbonyl groups.
Lignin is insoluble in acids, while it can be solubilised using concentrated alkali bases or organic solvents. Degradation and conversion of lignin can be achieved by thermochemical treatments, which include the thermal treatment of lignin in the presence or absence of some solvents, chemical additives and catalysts. Yields and composition of degradation products vary based on the process type and on the conditions applied.
The major thermochemical lignin conversion processes are summarized in figure 2.5.
Fig. 2.5 Major thermochemical lignin conversion processes and their potential products (Pandey and Kim, 2011)
Lignin is a good candidate for oxidation or oxidative cracking due to the presence of hydroxyl groups. The oxidative cracking reaction involves the cleavage of the lignin rings, aryl ether bonds, or other linkages within the lignin. The oxidation products of lignin range from aromatic aldehydes to carboxylic acids, based on the severity of the reaction conditions (Xiang and Lee, 2000). Alkaline oxidation of softwood lignin produces vanillin and vanillic acid while syringaldehyde and syringic acid are obtained from hardwood lignin. Hydrogen peroxide is a very weak acid employed for the oxidative cracking that can degrade and solubilize lignin (Pandey and Kim, 2011).

38
2.3 Processing of lignocellulosic material to bioethanol
The processing of lignocellulosic biomass to ethanol proceeds through common steps: pretreatment, hydrolysis of cellulose and hemicelluloses to monomeric sugars, fermentation and product recovery (Fig 2.6). The pretreatment has been recognized as a necessary upstream process to promote the physical separation of lignocellulosic matrix in lignin, hemicelluloses and cellulose and reduce the cristallinity of cellulose. In this way, the cellulose polymers are made accessible for further conversion. (Hamelinck et al., 2005). In this step hydrolysis of hemicelluloses may occur, as well as separation of the lignin fraction, depending on the process applied.
The next step is the hydrolysis of cellulose to fermentable sugars. The main sugar produced by hydrolysis reaction is glucose:
This reaction can be performed by dilute acid, concentrated acid or enzymatically. The main advantage of the acid hydrolysis is that acids can penetrate lignin without any preliminary pretreatment of biomass and it can break down the cellulose and hemicellulose polymers to form individual sugar molecules (Galbe and Zacchi, 2002).
Fermentation step is carried out by bacteria, yeast or fungi that ferment sugars produced previously to ethanol under oxygen-free conditions (Hamelinck et al., 2005).
The product from fermentation is a mixture of ethanol, cell mass and water. Then, the first step is to recover the ethanol in a distillation or beer column, where most of the water remains with the solids part. The ethanol produced is then concentrated in a rectifying column (Wooley et al., 1999).
Fig. 2.6 Processes for production ethanol from lignocellulosic biomass (Galbe and Zacchi, 2002)

39
2.3.1 Pretreatment: the comparison between the main technologies employed
Pretreatment is a crucial process step for the biochemical conversion of lignocellulosic biomass into bioethanol. A pretreatment step is required to alter the structure of cellulosic biomass to make cellulose more accessible to the enzymes that convert the carbohydrate polymers into fermentable sugars (Balat et al., 2008). In fact, for most types of biomass, the enzymatic digestibility of the cellulose without pretreatment is very low (<20%), (Lynd et al., 2002). A schematic presentation of the effect of pretreatment on lignocellulosic biomass is showed in figure 2.7.
Fig. 2.7 Schematic presentation of effects of pretreatment on lignocellulosic biomass (Harmsen et al, 2010)
Pretreatments methods can be classified into different categories: physical, physicochemical,
chemical, biological, electrical, or a combination of these (Tab. 2.2, kumar et al., 2009). Different types of raw material require different pretreatments (Wyman, 2007).
Lignocellulosic biomass can be pulverized by physical pretreatments such as chipping, grinding or milling. The goal of mechanical pulverization is to reduce the particle size of the biomass and so to increase surface area, which leads to improved cellulose hydrolysis. These physical pretreatments do not remove effectively the lignin or hemicellulose while costs and energy demands are high (Wyman, 2007). Another physical method is irradiation of cellulose by γ-rays, which cleaves the β-1,4-glicosidic bonds, thus given a larger surface area and a lower cristallinity. This method is, however, far too expensive to be used in a full-scale process (Galbe and Zacchi, 2007).
The main physico-chemical pretreatments include: steam pretreatment; pretreatment of biomass with aqueous ammonia at elevated temperatures, such as ammonia fibre explosion-method (AFEX) and ammonia recycle percolation (ARP); CO2 explosion, and methods with an oxisiding agent, such as ozone (ozonolysis), oxygen or air (wet oxidation).
Steam pretreatment, used to be called steam explosion, is an efficient physic-chemical methods, often combined with H2SO4 or SO2 as chemical agents (§4.3 and 4.3.1). In the steam pretreatment process, high temperature steam (16-260°C) and pressure (0.69−4.83 MPa) is introduced into a sealed chamber containing lignocellulosic material. After a period of time ranging from seconds to

40
several minutes, the material is exposed to atmospheric pressure, so, in this way, the pressure is suddenly reduced and the biomass is undergo to an explosive decompression (Galbe and Zacchi, 2007; Balat et al, 2008). The effect is the separation of lignocellulosic matrix in individual fibers with minimal loss of material, then lignin and all or part of the hemicelluloses is solubilised (Alvira et al., 2010; Balat et al., 2008).
Steam pretreatment without extra catalysts is known as autohydrolysis. It is able to hydrolyses hemicellulose using the acetic acid as catalyst released from hemicellulose itself (Balat, 2008). Steam pretreatment requires a low energy compared to physical pretreatments (70% more energy required) (Vessia, 2005).
The Ammonia fiber/freeze explosion (AFEX) pretreatment involves liquid ammonia and steam explosion (Hamelinck et al., 2005).The AFEX process treats lignocellulosic material with liquid ammonia (NH3), at a loading of about 1-2kg NH3/kg dry biomass, under pressure and then rapidly releases pressure. Pressures exceeding 12 atm are required for operation at ambient temperature (Silverstein, 2004). This system does not directly liberate any sugars, but allows the polymers (hemicelluloses and cellulose) to be attacked enzymatically and reduced to sugars (Dale et al., 2000). The AFEX pre-treatment yields optimal hydrolysis rates for pretreated lignocellulosics with close to theoretical yields at low enzyme loadings, however this method requires efficient ammonia recovery to be economical due to the high cost of ammonia (Balat, 2008).
Another type of process utilizing ammonia is the ammonia recycle percolation (ARP) method. In the process aqueous ammonia (10-15w/w%) passes through biomass at elevated temperatures (150-170°C), after which the ammonia is recovered (Galbe and Zacchi, 2007). ARP is an efficient delignification method for hardwood and agricultural residues, but is somewhat less effective for softwood (Galbe and Zacchi, 2007).
Carbon dioxide explosion is also used for lignocellulosic biomass pretreatment. The method is based on the utilization of CO2 as a supercritical fluid, which refers to a fluid that is in a gaseous form but is compressed at temperatures above its critical point to a liquid like density. Supercritical pretreatment conditions can effectively remove lignin increasing substrate digestibility. In aqueous solution CO2 forms carbonic acid, which favours the polymers hydrolysis. CO2 molecules are comparable in size to water and ammonia and they can penetrate in the same way the small pores of lignocellulose. This mechanism is facilitated by high pressure. After the explosive release of CO2 pressure, disruption of cellulose and hemicellulose structure is observed and consequently accessible surface area of the substrate to enzymatic attack increases (Alvira et al., 2010).
Current efforts to develop this method do not guarantee economic viability yet. A very high pressure requirements is specially a concerning issue. On the other hand, carbon dioxide utilization
is an attractive alternative to reduce costs because of its co-production during ethanol fermentation. Other advantages are non toxicity, non-flammability and easy recovery after extraction (Alvira et al., 2010).
Ozone treatment focuses on lignin degradation by attacking and cleavage of aromatic rings structures, while hemicellulose and cellulose are hardly decomposed. It can be used to disrupt the structure of many different lignocellulosic materials, such as wheat straw, bagasse, pine, peanut, cotton straw and poplar sawdust (Harmsen et al., 2010). Ozonolysis pretreatment has an advantage

41
that the reactions are carried out at room temperature and normal pressure. Furthermore, the fact that ozone can be easily decomposed by using a catalytic bed or increasing the temperature means that processes can be designed to minimize environmental pollution. A drawback of ozonolysis is that a large amount of ozone is required, which can make the process expensive (Kumar et al., 2009).
Wet oxidation pretreatment involves the treatment of the biomass with water and air, or oxygen, at temperatures above 120◦C, sometimes with the addition of an alkali catalyst. This method is suited to materials with low lignin content, since the yield has been shown to decrease with increased lignin content, and since a large fraction of the lignin is oxidized and solubilized (Schmidt and Thomsen, 1998).
Chemical pretreatment methods, such as acid, alkali or organosolv pretreatments, are considered to be the ones, in which any chemical substances are involved.
The main objective of the acid pretreatment is to solubilize the hemicellulosic fraction of the biomass and to make the cellulose more accessible to enzymes. This type of pretreatment can be performed with concentrated or diluted acid but utilization of concentrated acid is less attractive for ethanol production due to the formation of inhibiting compounds.
Furthermore, equipment corrosion problems and acid recovery are important drawbacks when using concentrated acid pretreatments (Alvira et al., 2010). Diluted acid pretreatment appears as more favourable method for industrial applications and have been studied for pretreating wide range of lignocellulosic biomass (Taherzadeh and Karimi, 2007).
Two types of dilute-acid pretreatment processes are typically used: at high-temperature (T > 160 °C), continuous-flow process for low solids loadings (weight of substrate/weight of reaction mixture= 5-10%) and at low-temperature (T < 160 °C), batch process for high solids loadings (10-40%) (Kumar et al., 2009).
The most widely used and tested approaches are based on dilute sulfuric. However, nitric acid, hydrochloric acid and phosphoric acid have been tested (Kumar et al., 2009). Dilute acid presents the advantage of solubilizing hemicellulose, mainly xylan, but also converting solubilized hemicellulose to fermentable sugars. Nevertheless, depending on the process temperature, some sugar degradation compounds such as furfural, HMF and aromatic lignin degradation compounds are detected; these affect the microorganism metabolism in the fermentation step (Alvira et al., 2010).
Some bases can be used for the pretreatment of lignocellulosic materials, and the effect of alkaline pretreatment depends on the lignin content of the materials (Kumar et al., 2009).
Alkali pretreatment processes utilize lower temperatures and pressures than other pretreatment technologies. Alkali pretreatment can be carried out at ambient conditions, but pretreatment times are on the order of hours or days rather than minutes or seconds. Compared with acid processes, alkaline processes cause less sugar degradation, and many of the caustic salts can be recovered and/or regenerated. Sodium, potassium, calcium, and ammonium hydroxides are suitable alkaline pretreatment agents (Kumar et al., 2009).
In the organosolv process an organic or aqueous organic solvent mixture with inorganic acid catalysts (HCl or H2SO4) is used to break the internal lignin and hemicellulose bonds. The
42
solvents commonly used in the process are methanol, ethanol, acetone, ethylene glycol, triethylene glycol, and tetrahydrofurfuryl alcohol (Thring et al., 1999).
Organic acids such as oxalic, acetylsalicylic, and salicylic acids can also be used as catalysts in the organosolvation process (Kumar et al., 2009).
In essence, the organosolv process involves simultaneous prehydrolysis and delignification of lignocellulosic biomass supported by organic solvents and, usually, dilute aqueous acid solutions. A high yield of xylose can usually be obtained with the addition of acid (Kumar et al., 2009). Temperatures used for the process can be as high as 200 °C, but lower temperatures can be sufficient depending on the type of biomass and the use of a catalyst (Harmsen et al., 2010).
The organosolv pretreatment produces a high-quality lignin, which might facilitate higher-value applications of lignin such as production of chemicals. An advantage of this pretreatment is the lowering of enzyme costs by separation of lignin before the enzymatic hydrolysis of the cellulose fraction. In addition to improved accessibility of the cellulose fibres, also absorption of cellulase enzymes to lignin is minimized by actual removal of lignin beforehand (Harmsen et al., 2010).
However, solvents generally used in the organosolv process need to be drained from the reactor, evaporated, condensed, and recycled to reduce the cost. Removal of solvents from the system is necessary because the solvents might be inhibitory to the growth of microorganisms, enzymatic hydrolysis, and fermentation (Kumar et al., 2009).
Biological pretreatment can be performed by applying lignin-degrading microorganisms, such as white- and soft-rot fungi, to the lignocellulose materials (Sun and Cheng, 2002). The method is performed at low temperature and needs no use of chemicals.
However, the rate of biological pretreatment processes is far too low for industrial use, and some material is lost as these microorganisms to some extent also consume hemicellulose and cellulose, or lignin (Hsu, 1996). Nevertheless, the method could be used as a first step followed by some of the other types of pretreatment methods (Galbe and Zacchi, 2007).
Pulsed-electricfield (PEF) pretreatment involves application of a short burst of high voltage to a sample placed between two electrodes (Kumar et al., 2009). PEF pretreatment can have serious effects on the structure of plant tissues leading to rapid electrical breakdown and local structural changes of the cell membrane and the cell wall.
The electric field results in a dramatic increase in mass permeability and, in some cases, mechanical rupture of the plant tissue. By applying electric pulses with high field strengths, PEF pretreatment can create permanent pores in the cell membrane and hence facilitate the entry of acids or enzymes used to break down the cellulose into its constituent sugars.
PEF pretreatment can be carried out at ambient conditions and energy use is low because pulse times are very short (100 µs), (Kumar et al., 2009).
The main technology used for the pretreatment of biomass are summarized in table 2.2.

43
Method Operating conditions Advantages Disadvantages
Physical Chipping Grinding Milling
Room temperature/ Energy input < 30Kw per ton biomass
Reduces cellulose critallinity Power consumption higher than inherent biomass energy
Physico-chemical
Steam pretreatment
160-260°C (0,69-4,83MPa) for several second (~15 min in the range 200-230°C)
Causes hemicellulose auto hydrolysis and lignin transformation; cost-effective for hardwoods and agricultural residues
Destruction of a portion of the xylan fraction; incomplete distruption of the lignin-carboydrate matric; generation of compounds inhibitory; less effective for softwoods
AFEX (Ammonia fiber explosion method)
90°C for 30 min.1-2kg ammonia /kg dry biomass
Increases accessible surface area, removes lignin and hemicellulose;
Do not modify lignin neither hydrolyzes hemicellulose ;
ARP (Ammonia recycle percolation method)
150-170°C for 14 min Fluid velocity 1cm/min
Increases accessible surface area, removes lignin and hemicellulose;
Do not modify lignin neither hydrolyzes hemicellulose ;
CO2 explosion
4kg CO2/kg fiber at 5.62 MPa 160 bar for 90 min at 50 °C under supercritical carbon dioxide
Do not produce inhibitor for downstream processes. Increases accessible surface area, does not cause formation of inhibitory compounds
It is not suitable for biomass with high lignin content (such as woods and nut shells) Does not modify lignin neither hydrolyze hemicelluloses
Ozonolysis
Room temperature Reduce lignin content; does not produce toxic residue
Expensive for the ozone required;
Wet oxidation 148-200°C for 30 min Efficient removal of lignin; Low formation of inhibitors; low energy demand
High cost of oxygen and alkaline catalyst
Chemical
Acid hydrolysis: dilute-acid pretreatment
Type I: T>160°, continuous-flow process for low solid loading 5-10%,)-Type II: T<160°C, batch process for high solid loadings (10-40%)
Hydrolyzes hemicellulose to xylose and other sugar; alters lignin structure
Equipment corrosion; formation of toxic substances
Alkaline hydrolysis
Low temperature; long time high ; concentration of the base; For soybean straw: ammonia liquor (10%) for 24 h at room temperature
Removes hemicelluloses and lignin; increases accessible surface area
Residual salts in biomass
Organosolv 150-200 °C with or without addition of catalysts (oxalic, salicylic, acetylsalicylic acid)
Hydrolyzes lignin and hemicelluloses
High costs due to the solvents recovery
Biological Several fungi (brown-, white- and soft-rot fungi
Degrades lignin and hemicelluloses; low energy requirements
Slow hydrolysis rates
Electrical Pulsed electrical field in the range of 5-20 kV/cm,
~2000 pulses of 8 kV/cm Ambient conditions; disrupts plant cells; simple equipment
Process needs more research
Tab. 2.2 Methods for biomass lignocellulosic pretreatment (Kumar et al., 2009)

44
2.3.2 Hydrolysis: cellulose degradation strategies by means acids or enzymes
The cellulose hydrolysis in the biomass, in order to obtain simpler sugar molecules, can be performed by acids or enzymes.
It has been known for over 100 years that acids act as catalyst to convert cellulose and hemicellulose into hexose and pentose sugars. The cellulose molecule is characterized by ß-1,4-glucosidic linkages between sequential glucose units. There are three reactive hydroxyl groups in each glucose unit. Acid can attack the ß-1,4-glucosidic linkages in cellulose leading to degradation. The reaction includes: the rapid protonation of the glucosidic oxygen atom, the transfer of a positive charge to the number one carbon producing a cyclic carbonium cation and cleavage of the glucosidic linkage, and finally, the addition of water to the carbonium ion (Fig. 2.8; Krässig, 1993).
Fig. 2.8 The acid-catalyzed hydrolysis of cellulose to yield glucose
Several types of acids, concentrated or diluted, can be used, such as sulphurous, sulphuric,
hydrocloric, hydrofluoric, phosphoric, nitric and formic acid (Galbe and Zacchi, 2002). Sulphuric and hydrochloric acids are the most commonly used catalysts for hydrolysis of lignocellulosic biomass (Lenihan et al., 2010).
The acid concentration used in the concentrated acid hydrolysis process is in the range of 10-30%. The process occurrs at low temperatures, producing high yields (i.e. 90% of theoretical glucose yield) (Iranmahboob et al., 2002). However, this process requires large amounts of acids, causing corrosion problems to the equipment.
The main advantage of the dilute hydrolysis process is the low amount of acid required (2-5%). However this process must be carried out at high temperatures to achieve acceptable rates of cellulose conversion. The high temperature increases the rates of hemicellulose sugars decomposition, causing inhibition in the subsequent fermentation stage (Larsson et al., 1999). In addition, high temperatures increase the equipment corrosion (Jones and Semrau, 1984).
In 1999, the Bat Conservation International (BCI) of United States has marketed a technology based on two-step dilute acid hydrolysis, in order to decrease the sugars degradation. In the first hydrolysis stage, hemicellulose is hydrolyzed under rather mild conditions (170-190°C). This enables the second acid hydrolysis step to proceed at more severe conditions without degrading the hemicellulose. In the second step, the cellulose is hydrolyzed in the range of 200-230°C (Wyman, 1999). In 1991, the Swedish Ethanol Development Foundation (now: the

45
Bioalcohol Fuel Foundation) developed a process for the two–stage dilute acid hydrolysis, known as the CASH process, using a sulphur dioxide impregnation in the first step, and a diluted hydrochloric acid in the second step. In 1995, this foundation has focused researches on a two-step dilute-acid hydrolysis process for softwoods using sulphuric acid (Galbe and Zacchi, 2002).
In nature, various cellulolytic microorganisms produce enzymes that are able to degrade hemicellulose and cellulose in fermentable sugars. This enzymes are classified based on their substrate and mode of action, as recommended by the Enzyme Commission (EC). It is possible to distinguish cellulase and hemicellulase (xylanases, glucomannases and galactomannases.) enzymes. However, some enzymes can act both on cellulose and on hemicellulose substrates, i.e. Cel5A of T. reesei, which has both endoglucanase and xylanase activity (Bailey et al., 1993). Enzymes acting inside the polymer chain are generally called endo-enzymes, while those acting on the end of the polymer chain are called exoenzymes.
Active research on enzymes regulating cellulose degradation and related polysaccharidases began in the early 1950s, owing to their enormous potential to convert lignocellulose, the most abundant and renewable source of energy on Earth, to glucose and soluble sugars (Bhat, 2000). Enzymatic hydrolysis of cellulose consists of three steps: adsorption of cellulases to the surface of the cellulose, hydrolysis of cellulose to glucose, and desorption of cellulases.
Cellulases are classified as endoglucanases or endo -1,4β-glucanases (EC 3.2.1.4), exoglucanases or cellobiohydrolases or exo -1,4β-D-glucanases (EC 3.2.1.91) and ß-glucosidases or β-D-glucoside glucohydrolases (EC 3.2.1.21). Endoglucanases (EG) act inside the cellulose chain in a random manner. It cleaves the ß-1,4-glucosidic linkages of cellulose structure in random positions to produce oligomeric chain fragments. Exo-glucanases cleave glucose dimers (cellobiose) from the end of shorter oligosaccharides. ß-Glucosidase act to release D-glucose units from cellobiose and soluble cellodextrins (Xu et al., 2007).
Cellulase enzymes are regarded to act synergistically on cellulosic substrates. The first synergistic model was introduced in the early 1950s by Reese et al. (1950), when they have reported, that enzymes called cellulases consist of at least two consecutive systems: C1 and Cx. C1 acts in an unspecified way to disrupt the crystalline structure of cellulose, while Cx encompasses all β-1,4-glucanase action, including the exoglucanases and the endoglucanases (Reese et al., 1950). Thus, the picture of the cellulase system from the view of the late 1960s was limited by proposition of the as-yet-uncharacterized C factor (Xu, 2007). Later, Petterson (1972) has verified, that C1 enzymes have real, endo-type hydrolytic activity and Cx enzymes are exo-enzymes releasing cellobiose from the end of the cellulose chain. The naming of the enzymes has changed from C1 to endoglucanases and from Cx to cellobiohydrolases. Nidetzky et al. (1994) have observed that synergistic effect may not only arise among endoglucanases and cellobiohydrolases (endo-exo synergism), but also among the two exoglucanases (exo-exo synergism). More recently, synergistic effect has been verified between cellulases and hemicellulases as well (Selig et al., 2008).
The use of enzymes in the hydrolysis of cellulose is more advantageous than the use of chemicals, because enzymes are highly specific and can work at mild process conditions. On the other hand, enzymatic hydrolysis has its own problems compared to dilute-acid hydrolysis. A hydrolysis time of several days is necessary for enzymatic hydrolysis (Tengborg et al., 2001), whereas a few minutes is enough for the acid hydrolysis (Taherzadeh and Karimi, 2007). The prices

46
of the enzymes are much higher than e.g. sulfuric acid that is used in acid hydrolysis (Sheehan and Himmel, 1999). In acid hydrolysis, the final products, e.g. released sugars, do not inhibit the hydrolysis. However, in enzymatic hydrolysis, the sugars released inhibit the hydrolysis reaction (Taherzadeh and Karimi, 2007). In order to overcome this problem, simultaneous saccharification and fermentation (SSF) was developed, in which the sugars released from the hydrolysis are directly consumed by the present microorganisms (Wyman, 1996). However, since fermentation and hydrolysis usually have different optimum temperatures, separate enzymatic hydrolysis and fermentation (SHF) is still considered as a choice (Taherzadeh and Karimi, 2007).
There are other non-catalytic proteins, such as expansins or swollenins, which have been shown to disrupt the crystalline structure of cellulose, thus making it more accessible for enzymes (Jørgensen et al., 2007). This may show a new strategy to improve hydrolysis, to increase substrate accessibility for non-processive enzymes, rather than on improving the properties of processive enzymes (Horn et al., 2006).
2.3.3 Fermentation
The final step of upstream processes is the fermentation of monomer sugars to ethanol. The most common ethanologenic microorganism is bakers’ yeast (Saccharomyces cerevisiae), which forms ethanol from sugars under anaerobic conditions by the following reaction:
Sugars are first converted to pyruvate in the glycolysis. In most microorganisms, lactic acid is formed under anaerobic conditions, but in case of etanologen microorganism, pyruvate is first converted to acetaldehyde, then to ethanol. This metabolic pathway is less efficient, than the tricarboxylic acid cycle, but can be performed in the absence of oxygen. However, ethanologen microbes can form ethanol in the presence of oxygen, when the glucose concentrations are higher than the maximum that can be consumed by tricarboxylic acid cycle, which is the so-called Crabtree effect. This is the basis of the very high gravity ethanol fermentation, when ethanol is produced under aerobic conditions (Bvochora et al., 2000).
The biopolymers hydrolysis and the sugar fermentation steps can be performed separately (SHF, separate hydrolysis and fermentation) or simultaneously (SSF, simultaneous saccharification and fermentation). SSF technology is generally considered more advantageous than SHF technology, for several reasons:
1) reduced number of the process steps (Koon Ong, 2004). 2) Reduced end product inhibition because of the rapid conversion of the glucose into ethanol by
yeast (Viikari et al., 2007) 3) Reduced contamination by unwanted microorganisms thanks to the presence of ethanol
(Elumalai and Thangavelu, 2010). However, the optimum temperature for enzymatic hydrolysis is typically higher than that of
fermentation, so that in SHF process, the temperature for the enzymatic hydrolysis can be optimized independently from the fermentation temperature, whereas a compromise must be found in SSF process (Olofsson et al., 2008). Another obstacle of the SSF process is the difficulty to carry out

47
continuous fermentation by recirculating and reusing the yeast because the presence of the solid residues from the hydrolysis. On the whole, high solids loadings are usually required to obtain higher ethanol levels in the fermentation broths. In particular, solids loadings of pretreated lignocellulose feedstock close to 30% (w/w) would be need to reach an ethanol concentration of 4-5% that is considered a threshold level for a sustainable distillation process. However, increasing the amount of the solids content in a bioreactor, the hydrolytic performances of the enzymes mixture tends to worsen. In particular, the high initial substrate consistency causes the viscosity increase that is an obstacle toward the homogeneous and effective distribution of the enzymes in the bioreactor (Sassner et al., 2006). This problem could be partly overcome by using thermostable enzymes. In particular, the hydrolysis could be carried out in two steps: a former step at elevated temperatures with thermostable hydrolytic enzymes will produce the liquefaction of biomass (SHF); the latter step, aimed at completing the biomass saccarification, could be carried out at milder temperatures by using the SSF approach (Olofsson et al., 2008).
2.4 Conclusions
In this chapter an overview of the current knowledge on the lignocellulosic biomass structure and its using for bioethanol production has been presented. Various pretreatment processes for lignocellulosic biomass, and their advantages and disadvantages, are discussed. The choice of the pretreatment technology used for a particular biomass depends on its composition and the byproducts produced as a result of pretreatment. These factors significantly affect the costs associated with a pretreatment method. As the pre-treatment is finished, the cellulose is prepared for hydrolysis, which means the cleaving of a molecule by adding a water molecule. This reaction is catalysed by dilute acid, concentrated acid or enzymes (cellulase). The use of enzymes in the hydrolysis of cellulose is more effective than the use of inorganic catalysts, because enzymes are highly spefic and can work at mild process conditions. In spite these advantages, the use of enzymes in industrial applications is still limited by several factors: the costs of enzyme isolation and purification are high and for enzymatic hydrolysis a hydrolysis time of several days is necessary. In addition, in enzymatic hydrolysis, the sugars released inhibit the hydrolysis reaction. In order to overcome this problem, simultaneous saccharification and fermentation (SSF) process has been developed.
2.5 References
Alvira P., Tomás-Pejó E., Ballesteros M., Negro M., J. Pretreatment technologies for an efficient bioethanol production process based on enzymatic hydrolysis: A review, Bioresource Technology, 101 (13), 4851-4861, 2010.
Bailey M., Siika-aho M., Valkeajärvi A., Pentillä M. Hydrolytic properties of two cellulases of T. reesei expressed in yeast. Biotechnology and Applied Biochemistry, 17, 65-76, 1993.
Balat M., Balat H., Oz C. Progress in bioethanol processing, Progress and Energy Combustion science, 34 (5), 551-573, 2008.

48
Bhat M.K. Cellulases and related enzymes in biotechnology, Biotechnology Advances 18, 355-383, 2000.
Bohlmann G.M. Process economic considerations for production of ethanol from biomass feedstocks. Industrial Biotechnology, 2, 14–20, 2006.
Brigham J.S., Adney W.S., Himmel M.E. Hemicellulases: diversity and applications. In: Handbook of bioethanol: Production and utilization, Ed: Wyman C.E., ISBN: 1-56032-553-2, 1996.
Brunow G., Lignin Chemistry and its Role in Biomass Conversion, in Biorefineries – Industrial Processes and Products, B. Kamm, P. R. Gruber, M. Kamm Eds, 2, Wiley-VCH Verlag, Weinheim, 2006.
Bvochora J.M., Read J.S., Zvauya R. Application of very high gravity technology to the cofermentation of sweet stem sorghum juice and sorghum grain. Industrial Crops and Products, 11, 11–17, 2000.
Dale M.C., Moelhman M. Enzymatic simultaneous saccharification and fermentation (SSF) of biomass to ethanol in a pilot 130 l Multistage continuous reactor separator. Ninth Biennial bioenergy conference, Buffalo, New York, October 15–19, 2000.
Demirbas A. Estimating of structural composition of wood and non-wood biomass samples. Energy Sources, 27, 761–7, 2005.
Dorrestijin E., Laarhoven L.J.J., Arends I.W.C.E., Mulder P. The occurrence and reactivity of phenoxyl linkages in lignin and low rank coal, Journal of Analytical and Applied Pyrolysis, 2000, 54, 153.
Elumalai S. and Thangavelu V. Simultaneous Sacccharification and fermentation (SSF) of pretreated sugarcane bagasse using Cellulase and Saccharomyces cerevisiae-Kinetics and modeling. Chemical Engineering Research Bullettin, 14, 29-35, 2010.
Galbe M., Zacchi G. Pretreatment of Lignocellulosic Materials for Efficient Bioethanol Production, Advances in biochemical Engineering/Biotechnology, 108, 41-65, 2007.
Galbe M. and Zacchi G. A review of the production of ethanol from softwood. Applied Microbiology and Biotechnology, 59 (6), 618-628, 2002.
Gírio F.M., Fonseca C., Duarte L.C., Marques S., Bogel-Lukasik R., Hemicelluloses for fuel ethanol: A review. Bioresource Technology 101 (13), 4775-4800, 2010.
Hamelinck C.N., van Hooijdonk G., Faaij A. P.C. Ethanol from lignocellulosic biomass: techno-economic performance in short, -middle and long-term, Biomass and Bioenergy, 28, 384-410, 2005.
Harmsen P.F.H., Huijen W.J.J., Bermúdez López L.M., Bakker R.R.C, Literature Review of Physical and Chemical Pretreatment Processes for Lignocellulosic Biomass, Biosinergy, 1-54, 2010.
Horn S.J., Sikorski P., Cederkvist J.B., Vaaje-Kolstad G., Sorlie M., Synstad B., Vriend G., Varu, K.M., Eijsink V.G.H. Cost and benefits of processivity in enzymatic degradation of recalcitrant

49
polisaccharides. Proceedings of the National Academy of Sciences of the United States of America, USA, 103, 18089-18094, 2006.
Hsu T.A. In: Wyman CE (ed) Handbook on bioethanol production and utilization. Taylor & Francis, (eds). Washington, 179, 1996.
Iranmahboob J., Nadim F., Monemi S. Optimizing acid-hydrolysis: a critical step for production of ethanol from mixed wood chips. Biomass and Bioenergy, 22 (5), 401-404, 2002.
Jones J.L., Semrau K.T. Wood Hydrolysis for ethanol production-previous experience and the economics of selected processes, Biomass, 5 (2), 109-135, 1984.
Jørgensen H., Kristensen J.B., Felby C. Enzymatic conversion of lignocellulose into fermentable sugars: challenges and opportunities. Biofuels Bioproducts and Biorefining, 1, 119–134, 2007.
Koon Ong L. Conversion of Lignocellulosic Biomass to Fuel Ethanol- A brief review. Since cellulases are inhibited. The Planter, Kuala Lumpur, 80 (941), 517-524, 2004.
Krässig, H.A. Cellulose: Structure, accessibility, and reactivity. Gordon and Breach Science Publishers S.A., 6-13, 187-205, 1993.
Kumar P., Barrett D.M., Delwiche M.J., Stroeve P. Methods for Pretreatment of Lignocellulosic Biomass for Efficient Hydrolysis and Biofuel Production, Industrial & engineering chemistry research, 48 (8), 3713-3729, 2009.
Larsson S., Palmqvist E., Hahn-Hägerdal B., Tengborg C., Stanberg K., Zacchi G., Nilverbrant N. The generation of fermentation inhibitors during dilute acid hydrolysis of softwood. Enzyme and Microbiology Technology, 24 (3-4), 151-159, 1999.
Lenihan P., Orozco A., O’Neil E., Ahmad M.N.M., Rooney D.W., Walker G.M. Dilute acid hydrolysis of lignocellulosic biomass. Chemical Engineering Journal, 156, (2), 395-403, 2010.
Lynd L.R., Weimer P. J., van Zyl W. H., Pretorius I.S. Microbial Cellulose Utilization: Fundamentals and Biotechnology. Microbiology and Molecular Biology Reviews, 66 (3), 506–577, 2002.
Lynd, L. R., Wyman C. E., Gerngross T. U. Biocommodity engineering. Biotechnology Progress, 15, 777–793, 1999.
Mohan D., Pittman C.U., Steele P.H. Pyrolysis of wood/biomass for bio-oil: a critical review. Energy Fuels, 20, 848–89, 2006.
Nagy M. Biofuels from lignin and novel biodiesel analysis, Doctoral Dissertation, Georgia Institute of Technology, Atlanta, USA, 2009.
Nidetzky B., Steiner W., Hayn M., Claeyssens M. Cellulose hydrolysis by the cellulases from Trichoderma reesei: a new model for synergestic interaction. Biochemical Journal, 298, 705-710, 1994.

50
Olofsson K., Bertilsson M., Lidén G. A short review on SSF – an interesting process option for ethanol production from lignocellulosic feedstocks. Biotechnology for Biofuels 1, 1-7, 2008.
Pandey M.P., Kim C.S. Lignin Depolymerization and Conversion: A Review of Thermochemical methods. Chemical Engineering Technology, 34 (1), 29-41, 2011.
Petterson G.L., Axiö-Frederiksson U-B., Berghem L.E.R. The mechanism of enzymatic cellulose degradation. Fermentation Technology Today, 727-729, 1972.
Ritter J.G. , Seborg M.R., Mitchell R.L. Factors Affecting Quantitative Determination of Lignin by 72 Per Cent Sulfuric Acid Method. Analytical Edition, 4 (2), 202-204,1932.
Saeman J.F., Moore W.E., Mitchell R.L., Millet M.A. Techniques for the determination of pulp constituents by quantitative paper chromatography. Tappi Journal, 37 (8), 336, 1954.
Sassner P., Galbe M., Zacchi G. Bioethanol production based on simultaneous saccharification and fermentation of steam-pretreated salix at high dry-matter content. Enzyme and Microbial Technology, 39 (4), 756–762, 2006.
Schmidt A.S., Thomsen A.B. Optimization of wet oxidation pre-treatment of wheat straw Bioresource Technology, 64, 139- 151, 1998.
Selig M.J., Knoshaug E.P., Adney W.S., Himmel M.E., Decker S.R. Synergistic enhancement of cellobiohydrolase performance on pretreated corn stover by addition of xylanase and esterase activities. Bioresource Technology, 99, 4997-5005, 2008.
Sheehan J., Himmel M.E. Enzymes, Energy, and the Environment: A strategic perspective on the U.S. Department of Energy’s research and development activities for bioethanol. Biotechnology Progress, 15, 817-827, 1999.
Silverstein R.A. A Comparison of chemical pretreatment methods for converting cotton stalks to ethanol. Master’s Thesis (adv: R. Sharma), Biological and Agricultural Engineering, North Carolina State University, 2004.
Sjöström, E. Wood Chemistry. Fundamentals and Applications, Academic Press,San Diego, CA, 1993.
Sun Y., Cheng J. Hydrolysis of lignocellulosic materials for ethanol production: a review. Bioresource Technology, 83, 1–11, 2002.
Taherzadeh M.J., Karimi K. Enzyme-based hydrolysis processes for ethanol from lignocellulosic materials: a review, Bioresources, 2 (4), 707-738, 2007.
Tengborg C., Galbe M., Zacchi G. Influence of enzyme loading and physical parameters on the enzymatic hydrolysis of steam-pretreated softwood, Biotechnology Progress, 17 (1), 110-117, 2001.
Thring R. W., Chorent E. Overend R. Recovery of a solvolytic lignin: Effects of spent liquor/acid volume ratio, acid concentration and temperature. Biomass, 23, 289–305, 1990.

51
Vessia Ø. Biofuels from lignocellulosic material: In the Norwegian context 2010—technology, potential and costs, Department of electrical engineering, NTNU, Norwegian University of Science and Technology, Project report, Trondheim, Norway, December 20, 2005.
Viikari L., Alapuranen M., Puranen T., Vehmaanperä J., Siika-aho M. Thermostable Enzymes in Lignocellulose Hydrolysis. Advances in Biochemical Engineering/Biotechnology, 108, 121-145, 2007.
Wooley R., Ruth M., Sheehan J., Ibsen K., Majdeski H., Galvez A. Lignocellulosic biomass to ethanol—Process design and economics utilizing co-current dilute acid prehydrolysis and enzymatic hyrolysis—Current and futuristic scenarios, Report No. TP-580-26157. National Reneawable Energy Laboratory. Golden Colorade USA, 130pp., 1999.
Wyman C.E. What is (and is not) vital to advancing cellulosic ethanol. Trends in Biotechnology, 25, 153-157, 2007.
Wyman C.E. Production of low cost sugars from biomass: progress, opportunites, and challenges. In Overerd RP, Cornet E. (eds.) Biomass- a growth opportunity in green energy and value-added products. Proocedings of the 14th Biomass conference of the americas, Pergamon, Oxford.1, 867-872, 1999.
Wyman C.E. Handbook on bioethanol: production and utilization. Applied energy technologies series (Ed.), ISBN 1-56032553-4, 1996.
Xiang Q., Lee Y.Y. Oxidative cracking of precipitated hardwood lignin by Hydrogen peroxide, Applied biochemistry and biotechnology, 84-86 (1-9), 153-162, 2000.
Xu Q., Adney W.S., Ding S.Y., Himmel M. Cellulases for biomass conversion, in Industrial enzymes, J. Polaina and A.P MacCabe (eds.), 35-50, 2007.
Zakzeski J., Bruijnincx P.C.A., Jongerius A.L., Weckhuysen B.M. The Catalytic Valorization of Lignin for the Production of Renewable Chemicals. Chemical Reviews, 110, 3552-3599, 2010.
Zhu J.Y, Pan X.J. Woody biomass pretreatment for cellulosic ethanol production: Technology and energy consumption evaluation. Bioresource Technology, 101, 13, 4992-5002, 2010.
Zugenmaier P. Conformation and packing of various crystalline cellulose fibers, Progress in Polymer Science, 26 (9), 1341-1417(77), 2001.

52
Chapter3
EnzymaticHydrolysisofLignocellulosic
Biomass:CurrentStatusofProcessand
FuturePerspectives

53
3. Enzymatic Hydrolysis of Lignocellulosic Biomass: Current Status of Process and Future Perspectives
3.1 Introduction
Enzymatic hydrolysis means the breakdown of cellulose to monomer sugars by cellulase enzymes. Cellulase are produced by various bacteria and fungi that can have cellulolytic mechanisms significantly different. In recent years genes encoding cellulases from some invertebrate animal taxa, such as nematodes, termites and cockroaches, have also been isolated. The use of enzymes in the hydrolysis of cellulose is more effective than the use of inorganic catalysts, because enzymes are highly specific and can work at mild process conditions. In spite these advantages, the use of enzymes in industrial applications is still limited by several factors: most enzymes are relatively unstable at high temperatures, the costs of enzyme isolation and purification are high and it is quite difficult to recover enzymes from the reaction mixtures.
Currently, extensive researches are being carried out to step up hydrolysis by improving the properties of cellulases. Nowadays, enzymes producing companies, such as Novozyme and Genencor, have invested in the production of cellulases cocktails, obtained by enzymes assembly (multienzyme mixtures), or to construct engineered microrganisms. In addition, cellulases with improved thermostability have been isolated from thermophilic microorganisms. These enzymes have high specific activity and increased flexibility. For these reasons they could work at low-dosages and the higher working temperatures could speed up the hydrolysis reaction time. As consequence, the overall process costs could be reduced.
Major impediments to exploiting the commercial potential of cellulases are caused by the high cost of enzymes and by the inability to recover them from the reaction mixture. To overcome these problems, the immobilization of enzymes has also been proposed. Currently, immobilized enzymes are well established in the industrial sector, such as food production, brewing, pharmaceuticals, medicine, textiles, detergents and in the so called green chemistry, because their use is more advantageous than non-immobilized enzymes. The main advantages are an easier recovery and reuse of the catalysts for more reaction loops. Also, enzyme immobilization frequently results in improved thermostability or resistance to shear inactivation and so, in general, it can help to extend the enzymes lifetime.
This chapter contains an overview of the lignocellulosic hydrolysis process. Several process issues are deepening: cellulase enzyme systems and cellulose hydrolysis mechanisms, commercial mixtures, currents limits in the cellulose hydrolysis, innovative bioreactors technologies and improved biocatalysts.
3.2 Cellulases
Cellulases are O-glycosyl hydrolases (GHs) that are distinguished from other glycoside hydrolases by their ability to hydrolyze internal β-1,4-glucosidic linkages of cellulose chains. These

54
are proteins with molecular weights ranging from 30,000 to 60,000 Dalton and a typical ellipsoid arrangement with dimensions from 30 minutes to max 200 A (Sun and Cheng, 2002).
Cellulases have tradionally been divided into three major groups involved in the hydrolysis process of cellulose (§2.3.2):
endoglucanase (endo-1,4-b-D-glucanase, EG, EC 3.2.1.4), which attacks region of low cristallinity in the cellulose fiber by endoaction, creating free chain-ends;
exoglucanases or cellobiohydrolases (exo-1,4-b-D-glucanase, CBH, EC 3.2.1.91) which hydrolyze the 1,4-glycocidyl linkages at either the reducing or non-reducing ends of cellulose chains to form cellobiose (glucose dimer);
β-glucosidase (1,4-b-D-glucosidase, BG, EC 3.2.1.21) which converts cellooligosaccharides and the disaccharide cellobiose into glucose residues (Lenting and Warmoeskerken, 2001).
Typical cellulases contain one o more catalytic domain(s) (CD), one or more distinct carbohydrate binding module(s) (CBMs), which were previously called cellulose-binding domains (CBD), and a glycosylated and flexible linker peptide connecting CBMs to CD (Fig. 3.1; Xu et al., 2007).
Fig. 3.1 Multi-domain structure of T. reesei Cel7A (from NREL), catalytic domain, linker and
carbohydrate binding module
3.2.1 Carbohydrate binding module
CBM is the most common accessory module of cellulases and serves for cellulolytic enzymes as an attachment to substrate (Watson et al., 2009). Its major function is to deliver resident catalytic domain to crystalline cellulose. Binding of the cellulase via CBM is extremely stable, yet still allows the enzymes to diffuse laterally across the surface of the substrate. There are numerous

55
examples in the literature where removal of the CBM results in a significantly reduced activity of the enzymes on crystalline cellulose probably because of a decreased binding capacity (Igarashi et al., 2008). CBMs, varying in size from 4 to 20 kDa, are located commonly at one end of the protein sequence that binds to certain substrate. All CBMs use aromatic and often polar residues for interactions with their target (Kubicek et al., 2009). It has been postulated that the aromatic amino acids of the CBMs, most often tyrosines and tryptophans, form van der Waals interactions and aromatic ring polarization interactions with the pyranose rings exposed on the crystalline face of cellulose (Watson et al., 2009). This interaction is supplemented by polar residues forming hydrogen bonds (Kubicek et al., 2009). The stacking interactions between this linear strip of aromatic residues on the plane of the CBM surface and the glucose rings along one of the cellulose chains are considered the major factor in the recognition and strong binding (Zhang et al., 2004).
3.2.2 Catalytic domain
CD of cellulases is the largest functional region of cellulose and includes a chitin-binding region and a cellulose-binding region (Wang et al., 2004). The main topological arrangements of CDs active site found in cellulases are: a cleft (or groove), mostly suited for processive endo-attack and a tunnel, uniquely suited for processive exo-attack (Fig. 3.2; Kubicek et al., 2009). It is suggested, that endoglucanases have a more open active site cleft, whereas related exoglucanase (cellobiohydrolases) have tunnel shaped active sites (Davies and Henrissat, 1995). Cleft or groove is an “open structure”, allows a random binding of several sugar units in polymeric substrates. Tunnel arises from the previous one when the protein evolves long loops that cover part of the cleft (Davies and Henrissat, 1995). ß-glucosidases have pocket shape active site (Kleywegt et al., 1997).
Fig. 3.2 Topological arrangements of catalytic domain in endo- and exoglucanase
3.2.3 Lynker region
Linker region is capable to connect the independent catalytic core to CBM (Mosier et al., 1999). Its structure varies widely among cellulases, anywhere from 5 to 100 residues in length and an average of 3.0-0.7 Å/residue3 and its sequence is rich in proline and hydroxyl amino acids (Ting

56
et al., 2009). In particular, the role of the linker between the two domains is not known, but enzymatic activity is sometimes affected when the linker peptide has been shortened or completely deleted suggesting that it should be of sufficient length and/or flexibility to ensure an independent action of the two functional modules (Receveur et al 2002).
3.3 Cellulolytic capability of organisms: Difference in the cellulose-degrading strategy
A wide range of microorganisms produce complete cellulose system, including aerobic bacteria (Pseudomonas, Actinomycetes), facultative anaerobe bacteria (Bacillus, Cellulomonas), strict aerobe bacteria (Clostridium strains) and a large variety of fungal species (Trichoderma, Penicillum, Aspergillus) (Sun and Cheng, 2002). Moreover, cellulase genes from Termites have been isolated (Tokuda et al., 1999).
Different strategies for the cellulose degradation are used by the cellulase-producing microorganisms: aerobic bacteria and fungi secrete soluble extracellular enzymes known as non complexed cellulase system; anaerobic cellulolytic microorganisms produce complexed cellulase systems, called cellulosomes (Sun and Cheng, 2002). A third strategy was proposed to explain the cellulose-degrading action of two recently discovered bacteria: the aerobic Cytophaga hutchinsonii and the anaerobic Fibrobacter succinogenes (Ilmén et al., 1997).
• Non-complexed cellulase system. One of the most fully investigated non-complexed cellulase system is the Trichoderma reesei (teleomorph Hypocrea jecorina) model.
T. reesei is a saprobic fungus, known as an efficient producer of extracellular enzymes (Bayer et al., 1998). Its non-complexed cellulase system includes two cellobiohydrolases, at least seven endoglucanases, and several ß-glucosidases. However, in T. reesei cellulases, the amount of ß-glucosidase is lower than that needed for the efficient hydrolysis of cellulose into glucose. As a result, the major product of hydrolysis is cellobiose. This is a dimer of glucose with strong inhibition toward endo- and exoglucanases so that the accumulation of cellobiose significantly slows down the hydrolysis process (Gilkes et al., 1991). By adding ß-glucosidase to cellulases from either external sources, or by using co-culture systems, the inhibitory effect of cellobiose can be significantly reduced (Ting et al., 2009).
It has been observed that the mechanism of cellulose enzymatic hydrolysis by T.reesei involves three simultaneous processes (Ting et al., 2009):
1. Chemical and physical changes in the cellulose solid phase. The chemical stage includes changes in the degree of polymerization, while the physical changes regard all the modifications in the accessible surface area. The enzymes specific function involved in this step is the endoglucanase.
2. Primary hydrolysis. This process is slow and involves the release of soluble intermediates from the cellulose surface. The activity involved in this step is the cellobiohydrolase.
3. Secondary hydrolysis. This process involves the further hydrolysis of the soluble fractions to lower molecular weight intermediates, and ultimately to glucose. This step is much faster than the primary hydrolysis and ß-glucosidases play a role for the secondary hydrolysis.

57
• Complexed cellulase system. Cellulosomes are produced mainly by anaerobic bacteria, but their presence have also been described in a few anaerobic fungi from species such as Neocallimastix, Piromyces, and Orpinomyces (Tatsumi et al., 2006; Watanabe and Tokuda, 2010). In the domain Bacteria, organisms possessing cellulosomes are only found in the phylum Firmicutes, class Clostridia, order Clostridiales and in the Lachnospiraceae and Clostridiaceae families. In this latter family, bacteria with cellulosomes are found in various clusters of the genus Clostridium (McCarter and Whiters, 1994; Wilson, 2008).
Cellulosomes are protuberances produced on the cell wall of the cellulolytic bacteria grown on cellulosic materials. These protuberances are stable enzyme complexes tightly bound to the bacteria cell wall but flexible enough to bind strongly to cellulose (Lentig and Warmoeskerken, 2001). A cellulosome contains two types of subunits: non-catalytic subunits, called scaffoldins, and enzymatic subunits. The scaffoldin is a functional unit of cellusome, which contain multiple copies of cohesins that interact selectively with domains of the enzymatic subunits, CBD (cellulose binding domains) and CBM (carbohydrates binding modules). These have complementary cohesins, called
dockerins, which are specific for each bacterial species (Fig. 3.3; Gilligan and Reese, 1954; Lynd et al., 2002; Arai et al., 2006).
For the bacterial cell, the biosynthesis of a cellulosome enables a specific adhesion to the substrate of interest without competition with other microorganisms. The cellulosome allows several advantages: (1) synergism of the cellulases; (2) absence of unspecific adsorption (McCarter and Whiters, 1994; Zhang and Lynd, 2004). Thanks to its intrinsic Lego-like architecture, cellulosomes may provide great potential in biofuel industry. The concept of cellulosome was firstly discovered in the thermophilic cellulolytic and anaerobic bacterium, Clostridium thermocellum (Wyman, 1996). It consists of a large number of proteins, including several cellulases and hemicellulases. Other enzymes that can be included in the cellulosome are lichenases.
Fig. 3.3 Schematic representation of a cellulosoma

58
•Third cellulose-degrading strategy. The third strategy was recently proposed to explain the cellulose-degrading behavior of two recently sequenced bacteria: Cytophaga hutchinsonii and Fibrobacter succinogenes (Ilmén, 1997). C. hutchinsonii is an abundant aerobic cellulolytic soil bacterium (Fägerstam and Petterson, 1984), while F. succinogenes is an anaerobic rumen bacterium which was isolated by the Rockville (Maryland, USA), and San Diego (California, USA) Institute of Genomic Research (TIGR) (Mansfield et al., 1998). In the aerobic C. hutchinsonii, no genes were found to code for CBM and, in the anaerobic F. succinogenes, no genes were identified to encode dockerin and scaffoldin. Thus, a third cellulose degrading mechanism was proposed. It includes the binding of individual cellulose molecules by outer membrane proteins of the microrganisms followed by the transport into the periplasmic space where they are degraded by endoglucanases (Ilmén, 1997).
3.4 Characteristics of the commercial hydrolytic enzymes
Most cellulase enzymes are relatively unstable at high temperatures. The maximum activity for most fungal cellulases and ß-glucosidase occurs at 50±5°C and a pH 4.5- 5 (Taherzadeh & Karimi, 2007; Galbe & Zacchi, 2002). Usually, they lose about 60% of their activity in the temperature range 50–60 °C and almost completely lose activity at 80°C (Gautam et al., 2010). However, the enzymes activity depends on the hydrolysis duration and on the source of the enzymes (Tengborg et al., 2001).
In general, cellulases are quite difficult to use for prolonged operations. As mentioned before, enzyme production costs mainly depend on the productivity of the enzymes-producing microbial strain. Filamentous fungi are the major source of cellulases and mutant strains of Trichoderma (T. viride, T. reesei, T. longibrachiatum) have long been considered to be the most productive (Gusakov et al., 2005; Galbe & Zacchi, 2002).
Preparations of cellulases from a single organism may not be highly efficient for the hydrolysis of different feedstock. For example, Thrichoderma reesei produces endoglucanases and exoglucanases in large quantities, but its ß-glucosidase activity is low, resulting in an inefficient biomass hydrolysis. For this reason, the goal of the enzymes producing companies has been to form cellulases cocktails by enzymes assembly (multienzyme mixtures) or to construct engineered microrganisms to express the desired mixtures (Mathew et al., 2008).
Enzyme mixtures often derive from the co-fermentation of several micro-organisms (Table 3.1; Ahamed and Vermette, 2008; Kabel et al., 2005; Berlin et al., 2007).

59
Tab. 3.1 Commercial cellulases
All the commercial cellulases listed in table above have an optimal condition at 50°C and pH of 4.0-5.0. More recently, some enzymes producers have marked new mixtures able to work in a higher temperature ranging from 50 to 60°C (Table 3.2).

60
Tab. 3.2 Commercial cellulases able to work at temperature ranging from 50 to 60°C
In 2010, new enzymes were produced by two leading companies, Novozymes and Genencor, supported by the USA Department of Energy (DOE). Genencor has launched four new blends: Accelerase®1500, Accelerase®XP, Accelerase® XC and Accelerase®BG. Accelerase®1500 is a cellulases complex (exoglucanase, endoglucanase, hemi-cellulase and ß-glucosidase) produced from a genetically modified strain of T. reesei.
All the other Accelerase are accessory enzymes complexes: Accelerase®XP enhances both xylan and glucan conversion; Accelerase® XC contains hemicellulose and cellulase activities; Accelerase® BG is a ß-glucosidase enzyme. In February 2010, Genencor has developed an enzyme complex known as Accellerase®Duet which is produced with a genetically modified strain of T. reesei and which contains not only exoglucanase, endoglucanase, ß-glucosidase, but also it includes xylanase. This product is capable of hydrolyzing lignocellulosic biomass into fermentable monosaccharides such as glucose and xylose (Genencor, 2010)1.
Similarly, Novozymes has produced and commercialized two new enzymatic mixtures: cellic Ctec, and cellic Htec. Cellic Ctec is used in combination with Cellic HTec and this mixture is capable to work with a wide variety of pretreated feedstocks, such as sugarcane bagasse, corn cob, corn fiber, and wood pulp, for the conversion of the carbohydrates in these materials into simple sugars (Novozyme, 2010)2.
Novozyme has recently developed two new enzymatic mixtures: Cellic Ctec2, a cellulase complex for degradation of cellulose to fermentable sugar, and HTec2, a endoxylanase with high specificity toward soluble hemicelluloses3.
In order to meet the future challenges, innovative bioprocesses for the production of new generation of enzymes are needed. As already described, conventional cellulases work within a range of temperature around 50°C and they are typically inactivated at temperatures above 60-70 °C due to disorganization of their three dimensional structures followed by an irreversible denaturation (Viikari et al., 2007). Some opportunities of process improvement derive from the use of thermostable enzymes.
1 Genencor, products, 14 January 2010, avaible from: http:// www.genencor.com/ wps/ wcm/ connect/ genencor/ genencor/
products and services/ business development/ biorefineries/ products/ accellerase product line en.htm
2 Novozyme, brochure, 29 January 2010, Viable from: http:// www.bioenergy. novozymes.com/ files/ documents/
Final%20Cellic%20Product%20Brochure_ 29Jan2010.pdf
3 Novozyme, brochure, Viable from: http://www.scienceplease.com/files/products/overviews/cellicctec2.pdf

61
3.5 Enzymes for the cellulose liquefaction: Thermophilic enzymes
The thermophilic microrganisms can be grouped in thermophiles (growth up to 60 °C), extreme thermophiles (65-80 °C) and hyperthermophiles (85-110 °C). The unique stability of the enzymes, produced by these microrganisms, at elevated temperatures, extreme pH and high pressure (up to 1000 bar) makes them a valuable resource for the industrial bioprocesses that run at harsh conditions (Demain et al., 2005). Of special interest it is the thermoactivity and thermostability of these enzymes in the presence of high concentrations of organic solvents, detergents and alcohols. On the whole, thermophilic enzymes have an increased resistance to many denaturing conditions such as the use of detergents which can be used to obviate the irreversible adsorption of cellulases on the substrates. Furthermore, the utilization of high operative temperatures, which cause a decrease in viscosity and an increase in the diffusion coefficients of substrates, has a significant influence on the cellulose solubilization. It is worth noting that, differently from the mesophilic enzymes, most thermophilic cellulases did not show inhibition at high level of reaction products (e.g. cellobiose and glucose). As consequence, higher reaction rates and higher process yields are expected (Bergquist et al., 2004). The high process temperature also reduces any contamination of fermentation medium.
Several cellulose degrading enzymes from various thermophilic organisms have been investigated. These include cellulases mainly isolated from anaerobic bacteria such as Anaerocellum thermophilum (Zverlov et al., 1998), Clostridium thermocellum (Romaniec et al., 1992), Clostridium stercorarium (Bronnenmeier et al., 1991; Bronnenmeier and Staudenbauer, 1990) and Caldocellum saccharolyticum (Te’o et al., 1995), Pyrococcus furiosus (Ma and Adams, 1994), Pyrococcus horikoshi (Rahman et al.,1998), Rhodothermus strains (Hreggvidsson et al., 1996), Thermotoga sp., (Ruttersmith et al., 1991), Thermotoga marittima (Bronnenmeier et al., 1995), Thermotoga neapolitana (Bok et al., 1998).
Xylanase has been detected in Acidothermus cellulolyticus in different Thermus, Bacillus, Geobacillus, Alicyclobacillus and Sulfolobales species (Sakon et al., 1996).
Although many cellulolytic anaerobic bacteria, such as Clostridium thermocellum, produce cellulases with high specific activity, they do not produce high enzymes quantities. Since the anaerobes show limited growth, most researches on thermostable cellulases production have been addressed to aerobic species. Several mesophilic or moderately thermophilic fungal strains are also known to produce enzymes stable and active at high temperatures. These enzymes are produced from species such as Chaetomium thermophila (Venturi et al., 2002), Talaromyces emersonii (Grassick et al., 2004), Thermoascus aurantiacus (Parry et al., 2002).
They may be stable at temperatures around 70 °C for prolonged periods. Table 3.3, summarizes some of thermostable enzymes isolated from Archea, Bacteria and Fungi.
During the last decade several efforts have been devoted to develop different mixtures of selected thermostable enzymes. In 2007, mixtures of thermostable enzymes, including cellulases from Thermoascus auranticus, Thrichoderma reseei, Acremonium thermophilum and Thermoascus auranticus, have been produced by ROAL, Finland (Viikari et al., 2007). Multienzyme mixtures were also reconstituted using purified Chrysosporium lucknowense enzymes (Gusakov et al., 2005).

62
Despite the noticeable advantages of thermostable enzymes, cultivation of thermophiles and hyperthermophyles requires special and expensive media, and it is hampered by the low specific growth rates and product inhibition (Krahe et al., 1996; Schiraldi et al., 2002; Turner et al., 2007). Large scale commercial production of thermostable enzymes still remains a challenge also dependent on the optimization of their production from mesophilic microorganisms.
Archea
Enzymes Organism pH
optimum
T
optimum
(°C)
Stability
(half life) References
β-glucosidase
Pyrococcus furiousus 5 102 13h at 110°C Lebbinik et al., 2001
Pyrococcus horikoshi 6 100 15h at 90°C Matsui et al., 2002
Endoglucanase
Pyrococcus furiousus 6 100 40h at 95°C Bauer et al., 1999
Pyrococcus horikoshi 6-6.5 100 19h at 100°C Van Lieshout et al.,
2004
Bacteria
Endoglucanase
Acidothermus
cellulolyticus 5.0 83
Inactivated at
110°C Sakon J. et al. 1996
Anaerocellum
thermophilum 5-6 95-100 40min at 100°C Zverliv et al., 1998
Clostridium
stercorarium 6-6.5 90
Stable for several
days
Bronnenmeier K et al.,
1991
Clostridium
thermocellum 6.6 70
33% of activity
remained after
50h at 60°C
Faut U., et al. 1991
Clostridium
thermocellum 7.0 70
50% of activity
remained after
48h at 60°C
Romaniec M,., et al.
1992
Rhodothermus
marinus 7.0 95
50% of activity
remained after
3.5h at 100°C, 80%
after 16h at 90°C
Miettinen-Oinonen A,,
et al, 1996
Thermotoga
marittima 6.0-7.5 95 2h at 95°C
Bronnenmeier K, et al.,
1995
Thermotoga
neapolitana 6.0 95 >240min at 100°C Bok JD et al., 1995

63
Exoglucanase Clostridium
stercorarium 5-6 75 3 days at 70°C
Bronnenmeier K et al.,
1990
Fungal
Endoglucanase
Chaetomium
termphilum 4.0 60 60min at 60°C Venturi L. et al., 2002
Thermoascus
aurantiacus 4.5 75
98h at 70°C and
41h at 75°C Parry N., 2002
Exoglucanase
(CBH IA)
Talaromyces
emersonii 3.6 78 34 min at 80°C Grassik A., 2004
Tab. 3.3 Thermostable cellulases
3.6 Immobilization of enzymes
Thanks to the latest breakthroughs in the research for improving the enzymes, nowadays most enzymes are produced for a commercially acceptable price. Nonetheless, the industrial utilization of cellulases could be even more convenient by improving their stability in long-term operations and by developing methods/processes for the downstream recovery and reuse. These objectives can be achieved by the immobilization of the enzymes (Cao, 2005). The main methods of enzyme immobilization can be classified into four classes: support binding (carrier), entrapment, encapsulation and cross-linking.
In literature, only few papers are available on cellulases immobilization. This is due to the problems connected with working by using immobilized enzyme, such as enzymes entrapment, impede the interaction enzyme-substrate, inasmusch cellulose is not soluble and some immobilization. As matter of fact, immobilization of cellulases via covalent bonds appears to be the most suitable technique. Besides the enzyme stabilization, the covalent-immobilization allows the use of supported enzymes for several cycles o reactions (Brady and Joordan, 2009; Li et al., 2007; Mateo et al., 2007; Dourado et al., 2002; Yuan et al., 1999).
In my research activity, the cellulase enzyme immobilization has been obtained by using of epoxy support (Sepabeads® EC-EP403/S), a particular support to perform a very easy immobilization-stabilization of commercial cellulase enzymes.
An extensive description of enzyme immobilization is reported in Chapter 6.
3.7 Conclusions
In this chapter an overview of the current knowledge on the hydrolysis of lignocellulosics for bioethanol production has been presented. In the last years several important breakthroughs have been made either on the biochemical and technological sides. This is confirmed by several industrial initiatives spread over the world. Some cooperation agreements were strengthen with Novozymes for improving the efficiency of the hydrolysis step. This event represent an important

64
stage for all the Europe making the production of lignocellulosic ethanol closer to the industrialization and opening the way to new lignocellulosic biorefineries.
3.8 References
Ahamed A., Vermette P. Enhanced enzyme production from mixed cultures of Trichoderma reesei RUT-C30 and Aspergillus niger LMA grown as fed batch in a stirred tank bioreactor, Biochemical Engineering Journal,42 (1), 41-46, 2008.
Arai T., Kosugi A., Chan H., Koukiekolo R., Yukawa H., Inui M., Doi R.H. Properties of cellulosomal family 9 cellulases from Clostridium cellulovorans. Applied Microbiology and Biotechnology, 71 (5), 654-660, 2006.
Bayer E.A., Chanzy H., Lamed R., Shoham Y. Cellulose, cellulases and cellulosomes. Current Opinion in structural Biology, 8 (5), 548-557, 1998.
Bergquist P.L., Te’o V.S.J., Gibbs M.D., Curah N.C., Nevalainen K.M.H. Recombinant enzymes from thermophilic micro-organisms expressed in fungal hosts. Biochemical Society Transaction, 32 (2), 293–297, 2004.
Berlin A., Maximenco V., Gilkes N., Saddeler J. Optimazion of enzyme complexes for lignocelluloses hydrolysis, Biotechnology and Bioengineering, 97 (2),287-296, 2007.
Bok J.D., Yernool D. A., Eveleigh D. E. Purification, characterization, and molecular analysis of thermostable cellulases CelA and CelB from Thermotoga neapolitana. Applied and Environmental Microbiology, 64 (12), 4774–4781,1998.
Brady D., Jordaan J. Advances in enzyme immobilisation, Biotechnology Letters, 31 (11), 1639-1650, 2009.
Bronnenmeier K., Kern A., Liebl W., Staudenbauer W. Purification of Thermotoga maritima enzymes for the degradation of cellulosic materials. Applied and Environmental Microbiology, 61 (4), 339–1407, 1995.
Bronnenmeier K., Rücknagel K., Staudenbauer W. Purification and properties of a novel type exo-1,4-ß-glucanase (Avicelase II) from the cellulolytic thermophile Clostridium stercorarium. European Journal Biochemistry, 200 (2), 379–385, 1991.
Bronnenmeier K., Staudenbauer W. Cellulose hydrolysis by a highly thermostable endo-1,4-glucanase (Avicelase I) from Clostridium stercorarium. Enzyme and Microbial Technology, 12 (6), 431–436, 1990.
Cao, L. Carrier-bound Immobilized Enzymes, Principles, Applications and Design, Book, Wiley-VCH Verlag GmbH & Co.KGaA, Weinheim, ISBN-13: 978-3-527-31232-0; ISBN-10: 4-527-31232-3, 2005.

65
Davies G., Henrissat B. Structures and mechanisms of glycosyl hydrolases, Structure 3(9), 853-859, 1995.
Demain A., Newcomb M., Wu J.H.D. Cellulase, clostridia and ethanol. Microbiology and Molecular Biology Reviews, 69 (1), 124–154, 2005.
Dourado F., Bastos M., Mota M., Gama F.M. Studies on the properties of Celluclast/Eudragit L-100 conjugate. Journal of Biotechnology, 99 (2), 121-131, 2002.
Fägerstam L.G., Pettesson L.G. The primary structure of a 1,4–ß-glucan cellobiohydrolases of Trichoderma reesei QM9414. FEBS Letters, 119 (2), 97–101, 1984.
Galbe M., Zacchi G. A review of the production of ethanol from softwood. Applied Microbiology and Biotechnology, 59 (6), 618-628, 2002.
Gautam S.P., Bundela P.S., Pandey A.K., Khan J., Awasthi M.K., Sarsaiya, S. Optimization for the Production of Cellulase Enzyme from Municipal Solid Waste Residue by Two Novel Cellulolytic Fungi, Biotechnology Research International, 2011, 1-8, 2010.
Gilkes N.R., Henrissat B., Kilburn D.G., Miller R.C., Jr.&Warren R.A.J. Domains in microbial β-1,4-glycanases: sequence conservation, function, and enzyme families. Microbiological Reviews, 55(2), 303–315, 1991.
Gilligan W, Reese E.T. Evidence for multiple components in microbial cellulases. Canadian Journal of Microbiology , 1 (2), 90-107,1954.
Grassick A., Murray P., Thompson R., Collins C., Byrnes L., Birrane G., Higgins T., Tuohy M. Three-dimensional structure of a thermostable native cellobiohydrolase, CBH IB, and molecular characterization of the cel7 gene from the filamentous fungus, Talaromyces emersonii. European Journal of Biochemistry, 271 (22), 4495–4506, 2004.
Gusakov A.V., Sinitsyn A.P., Salanovich T.N., Bukhtojarov F.E., Markov A.V., Ustinov B.B., van Zeijl C., Punt P., Burlingame R. Purification, cloning and characterisation of two forms of thermostable and highly active cellobiohydrolase I (Cel7A) produced by the industrial strain of Chrysosporium lucknowense. Enzyme and Microbial Technology, 36 (1), 57–69, 2005.
Hreggvidsson G.O., Kaiste E., Holst O., Eggertsson G., Palsdottir A., kristjansson J.K. An extremely Thermostable cellulose from the Thermophilic Eubacterium Rhodothermus marinus. Applied and Environmental Microbiology, 62 (8), 3047, 1996.
Igarashi K., Ishida T., Hori C., Samejima M. Characterization of an Endoglucanase Belonging to a New Subfamily of Glycoside Hydrolase Family 45 of the Basidiomycete Phanerochaete chrysosporium. Applied Environmental Microbiology, 5628–5634, 2008.
Ilmén M., Saloheimo A., Onnel M., Pentillä M.,E. Regulation of Cellulase Gene Expression in the Filamentous Fungus Trichoderma reesei. Applied and Environmental Microbiology, 63 (4), 1298-1306, 1997.

66
Kabel M., van der Maarel M.J.E.C., Klip G., Voragen A.G., Schols H. Standard assays do not predict the efficiency of commercial cellulose preparations towards plants materials. Biotechnology and Bioengineering, 93(1), 56-63, 2006.
Kleywegt G.J., Zou J., Divne C., Davies G.J., Sinning I., Stahlberg J., Reinikainen T., Srisodsuk M., Teeri T.T., Jones T.A. The chrystal structure of the catalytic core domain of endoglucanase I from Trichoderma reesei at 3.6 Å resolution, and a comparison with related enzymes. Journal of Molecular Biology, 272, 383-397, 1997.
Krahe M., Antranikian G., Mäirkl H. Fermentation of extremophilic microorganisms. FEMS Microbiology Reviews, 18 (2-3), 271-285, 1996.
Kubicek C. P., Mikus M., Schuster A., Schmoll M., Seiboth B., 2009. Metabolic engineering strategies for the improvement of cellulose production by Hypocrea jecorina. Biotechnology for Biofuels, 2, 19, 2009.
Lenting H.B.M., Warmoeskerken M.M.C.G. Mechanism of interaction between cellulase action and applied shear force, an hypothesis. Journal of Biotechnology 89, 217-226, 2001.
Li C., Yoshimoto M., Fukunaga K., Nakao K. Characterization and immobilization of liposome-bound cellulase for hydrolysis of insoluble cellulose. Bioresouce technology, 98 (7), 1366-1372, 2007.
Lynd L.R., Weimer P. J., van Zyl W. H., Pretorius I.S. Microbial Cellulose Utilization: Fundamentals and Biotechnology. Microbiology and Molecular Biology Reviews, 66 (3), 506–577, 2002.
Ma K., Adams M.W. Sulfide dehydrogenase from the hyperthermophilic archaeon Pyrococcus furiosus: a new multifunctional enzyme involved in the reduction of elemental sulfur, Journal of Bacteriology, 176 (21), 6509-17,1994.
Mansfield S.D., Saddler J.N., Gubitz G.M. Characterization of endoglucanases from the brown rot fungi Gloeophyllum sepiarium and Gloeophyllum trabeum. Enzyme and Microbial Technology, 23 (1-2), 133– 140, 1998.
Mateo, C., Grazu, V., Palomo, J., M., Lopez-Gallego, F., Fernandez-Lafuente, R., Guisan M. J., Immobilization of enzymes on heterofunctional epoxy supports. Nature Protocols, 2, 1022-1033, 2007.
Mathew G.M., Sukumaran R.K., Singhania R.R., Pamdey A. Progress in research on fungal cellulases for lignocelluloses degradation. Journal of Scientific & Industrial Research, 67 (11), 898-907, 2008.
McCarter J.D., Whiters S.G. Mechanisms of enzymatic glycoside hydrolysis. Current Opinion in Structural Biolology, 4 (6), 885-892, 1994.
Mosier N. S., Hall P., Ladisch M.R. Reaction Kinetics, Molecular Action, and Mechanisms of Cellulolytic Proteins. Advances in Biochemical Engineering Biotechnology 65, 24-40, 1999

67
Parry N., Beever D., Owen E., Nerinckx W., Claeyssens M., Van Beeumen J., Bhat M., Biochemical characterization and mode of action of a thermostable endoglucanase purified from Thermoascus aurantiacus. Archives of Biochemistry Biophysics, 404 (2), 243–253, 2002.
Rahman R.N.Z.A., Fujiwara S., Takagi M., Imanaka T. Sequence analysis of glutamate dehydrogenase (GDH) from the hyperthermophilic archaeon Pyrococcus sp. KOD1 and comparison of the enzymatic characteristics of native and recombinant GDHs, Molecular and General Genetics MGG, 257 (3), 338-347, 1998.
Receveur V., Czjzek M., Schülen M., Panine P., Henrissat B. Dimension, Shape, and Conformational Flexibility of a Two Domain Fungal Cellulase in Solution Probed by Small Angle X-ray Scattering. Journal of Biological Chemistry 25, 40887-40892, 2002.
Romaniec M., Fauth U., Kobayashi T., Huskisson N., Barker P., Demain, A. Purification and characterization of a new endoglucanase from Clostridium thermocellum. Biochemical Journal, 283 (Part1), 69–73, 1992.
Ruttersmith L., Daniel R. Thermostable cellobiohydrolase from the thermophilic eubacterium Thermotoga sp. strain FjSS3-B.1: purification and properties. Biochemical Journal, 277 (3), 887–890, 1991.
Sakon J., Adney W., Himmel M., Thomas S., Karplus P. Crystal structure of thermostable family 5 endoglucanase EI from Acidothermus cellulolyticus in complex withcellotetraose. Biochemistry, 35 (33), 10648–10660, 1996.
Schiraldi C., De Rosa M. The production of biocatalysts and biomolecules from extremophiles. Trends in Biotechnology, 20 (12), 515-521, 2002.
Sun Y., Cheng J. Hydrolysis of lignocellulosic materials for ethanol production: a review. Bioresource Technology, 83, 1–11, 2002.
Taherzadeh M.J., Karimi K. Enzyme-based hydrolysis processes for ethanol from lignocellulosic materials: a review. Bioresources, 2 (4), 707-738, 2007.
Tatsumi H., Katano H. and Ikeda T. Kinetic analysis of enzymatic hydrolysis of crystalline cellulose by cellobiohydrolase using an amperometric biosensor. Analytical Biochemistry, 357 (2), 257–261, 2006.
Te’o V., Saul D., Bergquist P. CelA, another gene coding for a multidomain cellulases from the extreme thermophile Caldocellum saccharolyticum. Applied Microbiology and Biotechnology, 43 (2), 291–296,1995.
Tengborg C., Galbe M., Zacchi, G. Influence of enzyme loading and physical parameters on the enzymatic hydrolysis of steam-pretreated softwood. Biotechnology Progress, 17 (1), 110-117, 2001.
Ting C. L., Makarov D.E., Wang Z.G. A Kinetic Model for the Enzymatic Action of Cellulase. The Journal of Physical Chemistry, 113 (14), 4970–4977, 2009.

68
Tokuda G., Lo N., Watanabe H., Slaytor M., Matsumoto T., Noda H. Metazoan cellulase genes from termites: intron/exon structures and sites of expression. Biochimica et Biophysica Acta, 1447, 146-159, 1999.
Turner P., Mamo G., Karlsson E.N. Potential and utilization of thermophiles and thermostable enzymes in biorefining. Microbial Cell Factories, 6 (9), 1-23, 2007.
Venturi L., Polizeli M., Terenzi H., Furriel R., Jorge J. Extracellular ß-d-glucosidase from Chaetomium thermophilum var. coprophilum: production, purification and some properties. Journal of Basic Microbiology, 42 (1),55–66, 2002.
Viikari L., Alapuranen M., Puranen T., Vehmaanperä J., Siika-aho M. Thermostable Enzymes in lignocellulose Hydrolysis. Advances in Biochemical Engineering/Biotechnology, 108, 121-145, 2007.
Wang T.-H., Liu T., Wu Z.-H., Liu S.-L., Lu Y., Qu Y.-B. Novel Cellulase Profile of Trichoderma reesei Strains Constructed by cbh1 Gene Replacement with eg3 Gene Expression Cassette. Acta Biochimica et Biophysica Sinica 36(10), 667–672, 2004.
Watanabe H., Tokuda, G. Cellulolytic System in Insects. Annual Review of entomology,55, 609-632, 2010.
Watson B.J., Zhang H., Longmire A.G., Moon Y.H., Hutcheson S.W. Processive Endoglucanases Mediate Degradation of Cellulose by Saccharophagus degradans. Journal of Bacteriology 191 (18), 5697-5705, 2009
Wilson D.B. Three microbial strategies for plant cell wall degradation. Annals of the New York Academy of Science, 1125, 289–297, 2008.
Wyman C.E. Handbook on bioethanol: production and utilization. Applied energy technologies series (Ed.), ISBN 1-56032553-4, 1996.
Xu Q., Adney W.S., Ding S.Y., Himmel M. Cellulases for biomass conversion, in Industrial enzymes, J. Polaina and A.P MacCabe (eds.)35-50, 2007.
Yuan X., Shen N., Sheng J., Wei X., Immobilization of cellulase using acrylamide grafted acrylonitrile copolymer membranes. Journal of Membrane Science, 155 (1), 101-106, 1999.
Zhang Y.P., Lynd L.R. Toward an aggregated understanding of enzymatic hydrolysism of cellulose: noncomplexed cellulose systems. Biotechnology and Bioengineering, 88 (7), 797-823, 2004.
Zverlov V., Mahr S., Riedel K., Bronnenmeier K. Properties and gene structure of a bifunctional cellulolytic enzyme (CelA) from the extreme thermophile Anaerocellum thermophilum with separate glycosyl hydrolase family 9 and 48 catalytic domains. Microbiology, 143 (Part2), 3537–3542, 1998.

69
Chapter4
SteamPretreatmentOptimizationwith
impregnatingagentsforSugarcane
BagasseforadvancedBioethanol
Production

70
4. Steam Pretreatment Optimization with impregnating agents for Sugarcane Bagasse for advanced Bioethanol Production
4.1 Introduction
The commercial feasibility of second-generation bioethanol production from biomass is dependent on the availability of lignocellulose in large amounts at low cost. Sugarcane bagasse (SCB) is a widely available lignocellulosic residue and a solid byproduct from sugar refining based on sugarcane.
Like traditional lignocellulosic biomass, also SCB needs to be pretreated in order to separate the biomass into its principal component (hemicelluloses, cellulose and lignin), making, in this way, the cellulose surface more easily accessible to enzymes and ensuring a better hydrolysis of the cellulose component.
Pretreatment is a crucial step in bioethanol production from lignocellulosic biomass and, at the same time, this phase of the process is the more energetic-intensive so an optimization of this step is a key factor in order to make advanced bioethanol profitable and moreover to make its production energetic sustainable.
The optimization of the biomass pretreatment has been the main aim of the research activity carried out at the laboratory of Chemical Engineering Department of Lund University (Sweden), under the supervision of Prof. G. Zacchi. In this study different impregnating agents has been tested in steam explosion pretreatment to maximize the final yields of fermentable sugars obtained from the pretreatment and enzymatic hydrolysis steps. In fact, a higher fermentable sugar concentration allows a greater final bioethanol production.
4.2 Sugarcane bagasse biomass
Annually, all over the world, about 5,4 x 10⁸ dry tons of sugarcane are processed (Cerqueira et al., 2007). Currently, the largest producer in the world of SCB is Brazil where the global production of sugarcane (Saccharum sp.) is about 27% of world production (Balat et al., 2008). For the MY 2010/11, in Brazil, total sugarcane area was at 8.95 million hectares (ha) with an agricultural yield of 74.8 metric tons per ha (mt/ha). For MY 2011/2012, total sugarcane area is forecast at 9.65 million hectares, but the agricultural yield is forecast at 71 mt/ha, down 3.8 mt/ha from previous MY4. According to data of São Paulo State Research Foundation, about 60-90% of the bagasse generated from milled sugarcane, in Brazil is used as fuel for steam and energy production and, between 10 and 40% is not used, representing about 5-12 million ton annually5. 4 USDA Foreign Agricultural Service- Global Agricultural Information Network, 4/14/2011- GAIN Report Number
BR110006.
5 São Paulo State Research Foundation, 2004, www.fapesp.gov.br/energia.1 htm.

71
Because of the high carbohydrate content, sugar cane bagasse is a highly interesting substrate that can be used for fuel ethanol production and/or others products, within the context of biorefinery (Gómez et al., 2010).
In Asia (India, Thailand, Philippines), sugarcane is produced on small fields; for example India has around 7 million small farmers with an average of around 0,25 ha sugarcane fields. On the contrary, in European countries, beet molasses are the most utilized sucrose-containing feedstock (Balat et al., 2008).
In sugar/alcohol industry, sugarcane is crushed to extract the juice used to produce sugar or fermented to produce alcohol. The fibrous matter that remains after the juice extraction is bagasse (Teixeira et al., 2011). In general, 1 ton of sugarcane generates 280 kg of bagasse (Cardona et al, 2010). The bagasse contains mainly cellulose (40-45%) and hemicelluloses (30-35%) and consists of a relatively low lignin content (20-30%), (Peng et al., 2009). The SCB has also a low ash content, 1.9% (Cardona et al, 2010), for this reason bagasse offers numerous advantages compared with other agro-based residues such as a paddy straw, 16% (Goh et al., 2009), rice straw, 14.5% (Guo et al., 2010) and wheat straw, 9.2% (Zhao and Bai, 2009).
4.3 SCB Bioethanol production process: Status of art
The ethanol production from SCB includes five main steps: biomass pretreatment, cellulose hydrolysis, fermentation of hexoses, separation and effluent treatment.
As mentioned previously, there are major limitations to an efficient ethanol production from agricultural residues. These limitations include the close physical and chemical associations between lignin and plant cell wall polysaccharides, together with cellulose crystallinity. Lignin forms a protective shield around cellulose and hemicelluloses, protecting the polysaccharides from enzymatic degradation (Dawson and Boopathy, 2008). To convert the biomass into ethanol, the cellulose must be readily available for cellulose enzymes (Krishna and Chouldary 2000). Thus, by removing the lignin, the cellulose becomes vulnerable to enzymes and allows the yeast to convert the glucose into ethanol during fermentation (Wymann, 1996). Therefore, a pretreatment must be applied to remove lignin in the bagasse.
The pretreatment process promotes the physical disruption of the lignin layer and the degradation of hemicelluloses, reduce the cristallinity of cellulose, and increase the porosity of the lignocellulosic materials; therefore the pretreatment make more accessible the cellulose fibers to enzymatic hydrolysis (Balat et al., 2008).
Several pretreatment methods have been investigated for SCB, including: acid pretreatment wet oxidation (Martin et al., 2002), dilute-acid hydrolysis at moderate temperatures using phosphoric acid or sulfuric acid (Hernandez-Salas et al., 2009) and high temperature steam explosion with a catalysts such as sulfuric acid (Sendelius, 2005), alkaline treatment (Hernandez-Salas et al., 2009) and biological treatment (Li et al, 2002; Camassola and Dillon 2009).
The steam explosion is the most commonly used method for pretreatment of SCB and, in general, of lignocellulosic materials (Ballesteros, et al. 2000). In fact, this technique is reported in the literature as effective on a wide variety of biomass substrates: wood chips, macroalga, sugar

72
cane bagasse, oil palm cake and fiber, wheat straw, hemp, corn sillage, and bananagrass (Barisano et al., 2001).
Steam explosion process offers several attractive features when compared to other pretreatment technologies. These include the potential for significantly lower environmental impact, lower capital investment and more potential for energy efficient. The conventional mechanical methods require 70% more energy than steam explosion to achieve the same particle reduction (Hendriks and Zeeman, 2009). Other advantages include less hazardous process chemicals and conditions and complete sugar recovery, the possibility of using high chip size, high sugar recovery, good hydrolysis and its feasibility at industrial scale development (Alvira et al., 2010). The main drawbacks of steam explosion pretreatment are the destruction of a portion of the xylan fraction, incomplete disruption of the lignin-carbohydrate matrix, the partially hemicelluloses degradation and the generation of some toxic compounds that could affect the following hydrolysis and fermentation steps (Kumar et al., 2009; Alvira et al., 2010). Inhibition is influenced by the concentration of the soluble substances released during pretreatment, present in the original raw material, e.g. acetic acid produced from acetic groups present in the hemicellulosic fraction and formed in the pretreatment step. The major inhibitors present in the slurry are furfural and 5-hydroxymethyl furfural (5-HMF or furfuryl alcohol) derived from pentoses and hexoses degradation, respectively (Larsson et al., 1999; Galbe and Zacchi, 2007). Wide range of aliphatic, aldehydic and phenolic compounds is generated due to the lignin breakdown (see fig. 2.5; Alvira, 2010). Because of the degradation products formation, that are inhibitory to enzymatic hydrolysis and fermentation, pretreated biomass needs to be washed with water in order to remove the inhibitory materials (McMillan, 1994). The water wash decreases the overall saccharification yield through the removal of soluble sugars such as those generated by hydrolysis of hemicelluloses (Mosier et al., 2005). The addition of agents such as SO2 or H2SO4, in steam explosion has been stated as an advantage, as matter of fact it can lower time and temperature of pretreatment, effectively improve enzymatic hydrolysis, give a partial hydrolysis of cellulose and lead to more complete removal hemicelluloses (Sun and Cheng, 2002; Kumar 2009). It was found that impregnation with SO2 results in a more effective hydrolysis than the one with H2SO4 (Eklund et al., 1995). In order to increase the digestibility of some lignocelluloses substrates, the addition of oxidative agents, as hydrogen peroxide, was frequently used (Zanuttini et al., 2009).
4.3.1 Steam explosion
During the steam explosion pretreatment, biomass is chopped to an appropriate size and fed into a high-pressure reactor where it remains for a preselected time that is relatively short (from seconds to minutes). At the end of selected time, the treated biomass is expelled through a valve and the material literally explodes into a flash tank. The exploded biomass and volatile stream are recovered. The explosive decompression at the orifice causes the “flashing off” of the liquid water in the cellular structure of the substrate. The steam explosion pretreatment combines mechanical forces and chemical effects. The mechanical effects can be easily explained by the fact that pressure is suddenly reduced and this cause the separation of lignocellulosic matrix in individual fibers with minimal loss of material (Alvira et al., 2010). The biomass is so separated into its principal component (hemicelluloses, cellulose and lignin), making the cellulose surface more easily accessible to enzymes and ensuring a better hydrolysis of the cellulose component (Balat et al.,

73
2008). The chemical effects are due to the high temperature promote the formation of acetyl groups present in hemicelluloses (Alvira et al., 2010). These acidic groups could catalyze the further hydrolysis of the hemicelluloses. This process, in which the in situ formed acids catalyze the process itself, is called “autohydrolysis” or “auto-cleave” steam pretreatment (Hendriks and Zeeman, 2009).
The role of the acids is probably however not to catalyze the solubilization of the hemicelluloses, but to catalyze the hydrolysis of the soluble hemicelluloses oligomers (Hendriks and Zeeman, 2009). The soluble sugars products are primarily xylose, and further mannose, arabinose, and galactose. A small portion of the cellulose may already be converted to glucose. However, the mainly yield of glucose from cellulose is obtained during enzymatic hydrolysis step. The sugars obtained from the pretreatment and enzymatic hydrolysis process, can be fermented to ethanol using a suitable microorganism (Carrasco et al., 2010).
The most important factors affecting the effectiveness of steam explosion are particle size, temperature, residence time and the combined effect of both temperature (T) and time (t), which is described by the severity factor (Ro): Ro=t*e[T-100/14.75] , where t is measured in minutes and T in degrees Celsius (Overend and Chornet, 1987). In order to obtain the optimal conditions for maximum sugar yield, a severity factor have to be between 3.0 and 4.5 (Alfani et al., 2000). Optimal hemicelluloses solubilization and hydrolysis can be achieved by either high temperature and short residence time (270 °C, 1 min) or lower temperature and longer residence time (190°C, 10 min) (Kumar et al., 2009).
A third parameter, the environmental pH, into the above equation was introduced to describe the combined severity (CS) (Chum et al., 1990)
CS=log Ro-pH
When the CS is increased beyond the value which generated maximal mannose and glucose concentrations, hemicelluloses sugars and glucose are broken down. The decrease in the concentration of fermentable sugars coincide with the formation of products that are inhibitors for the following enzymatic hydrolysis and fermentation steps (Barisano et al., 2001).
4.3.2 Fermentation step inhibitors in the steam explosion
In the pretreatment of lignocellulosic biomass, inhibitors compounds of fermentation are released (Palmqvist et al., 1997). The main types of inhibitors generated during steam explosion pretreatment and the reactions occurring during hydrolysis of lignocellulosic materials are showed in figure 4.1.

74
Fig. 4.1 Major types types of inhibitors generated during pretreatment and the reactions occurring during hydrolysis of lignocellulosic materials
The fermentation inhibitors are organic acids (e.g. acid acetic), furan derivates (e.g. furfural and 5-HMF) and lignin degradation products. Acid acetic is an organic and weak acid liberated from naturally occurring acetylated hemicellulose and released through the partial hydrolysis of hemicellulose. The toxicity of acetic acid varies according to the fermentation conditions. At low pH in the fermentation medium, the acetic acid (pKa=4.75) is in the undissociated form which is liposoluble. Thus, it can permeate the cell membrane and diffuses into the cells. In the cell (pH=7.4) the acid dissociates causing a lowering of cell pH that inhibits cell activity. The toxicity varies according to the fermentation conditions (Mills et al., 2009). Since the formation of acetic acid is inherent to hemicelluloses hydrolysis, its formation cannot be prevented. However, a higher fermentation pH can reduce this effect or the acid can be neutralized before fermentation (Harmsen et al., 2010). Subsequent to hemicellulose hydrolysis, pentose sugar monomers (e.g. xylose) may dehydrate to the inhibitor furfural. Similarly hexose sugars (e.g. glucose) may degrade to the toxic 5-HMF (or furfuryl alcohol) . Concentrations typically range between 0 and 5 g/L for each compound (Larsson et val., 1999; Martinez et al., 2001). Furfural has been identified as a key inhibitor in lignocellulosic hydrolysate because it is toxic by itself and also synergistically with other inhibitors (Zaldivar et al., 1999). HMF is considered less toxic than furfural and its concentration in (hemi)cellulose hydrolysates is usually lower than that of furfural. Both compounds act on intracellular sites of ethanol-producing yeast and bacteria, compromising membrane integrity (Mills et al., 2009). Furfural and 5-HMF could be degraded to levulinic and formic acids (Oefner et., 1992). It is clear that extensive degradation of hemicelluloses is responsible for the formation of the latter inhibitor compounds (Harmsen et al., 2010). Levulinic and formic are weak acids and their inhibition mechanism is the same as described for acetic acid (Mills et al., 2009). During fermentation furfural reduction to furfuryl alcohol occurs with high yields (Palmqvist et al., 1999a).

75
A wide range of inhibitors products, that show different solubility degree to water, could be generated from degradation of lignin, including phenolic, aliphatic and aldehydic compounds (Palmqvist and Hahn-Hägerdal, 2000). Phenolic compounds have a considerable inhibitor effect on fermentation process and are more toxic, even at low concentrations than furfural and HMF. Main phenolic compounds have carboxyl, formyl or hydroxyl group functionalities which cause partition and loss of integrity of cell membranes of fermenting organism reducing cell growth and sugar assimilation (Mills et al., 2009). Ketons can also be released during pretreatment, but are not generally considered as primary inhibitors because they occur at low concentrations (<0.05 g/L) and are also partially or completely removed with various detoxification treatments (Larsson et al., 1999). The main factors influencing formation of lignin degradation products are process temperature and residence time. At temperature lower than 180°C lignin degradation is negligible. However, the presence of strong acid or alkaline conditions could promote a higher lignin degradation even at 180° C (Harmsen et al., 2010). The major phenolic constituents in the lignocellulosic hydrolysate are 4-hydroxybenzoic acid, vanillin, and catechol (Palmqvist and Hahn-Hägerdal, 2000). 4-hydroxybenzoic acid has been used as a model compound to study the influence of phenolic compounds on fermentation (Palmqvist et al., 1999b).
The inhibitors can come also from wood extractives and equipment used. Extractives are derived from lignocellulose structure and comprise terpenes, acidic resins and tanninc acids. These extractives are less toxic than lignin breakdown products or acetic acid. In addition, heavy metal ions, as Fe, Cr, Ni and Cu, may originate from corrosion of equipment used. Their toxicity may inhibit enzymes in the fermenting organism metabolism (Klinke et al., 2004).
4.3.3 Inhibitors of enzymatic hydrolysis
Highly specific cellulase enzymes catalyze enzymatic hydrolysis of cellulose to glucose. Enzyme activity is influenced by several parameters (Hettenhaus and Glassner., 1997). The most important is the temperature. The enzymes are proteins and high temperatures cause a their undesiderable denaturation. The maximum activity for most fungal cellulases and ß-glucosidase occurs at 50±5°C and a pH 4.5- 5 (Taherzadeh and Karimi, 2007; Galbe and Zacchi, 2002). Usually, they lose about 60% of their activity in the temperature range 50–60 °C and almost completely lose activity at 80°C (Gautam et al., 2010). In addition the specificity of enzyme activity plays an important role. In fact the enzyme acts by binding to the solid substrate of cellulose. If the fermentation medium contains other solid products, e.g. lignin, an enzyme loss could occur owing to parallel adsorption onto lignin. The specificity of the enzyme interaction site could reduce the overall activity by up to 50% (Rahikainen et al., 2011). Thus, high lignin concentration can cause enzyme inhibition, which substantially lowers the hydrolysis rate.
The Enzyme/Substrate ratio used is another important factor in enzymatic hydrolysis. Obviously application of more cellulase, up to a certain level, increases the rate and yield of hydrolysis. However, the increase in cellulase level would significantly increase the cost of the

76
process. Cellulase loading is usually in the range of 5 to 35 FPU6 per gram of substrate (Taherzadeh and Karimi, 2007).
The cellulose hydrolysis by cellulase enzyme can be also strongly inhibited by products coming from the pretreatment step. In particular, the presence of certain levels of glucose can strongly inhibit the enzyme activity (Tengborg et al., 2001). In addition, products as organic acids, furan derivatives and lignin degradation products, strongly inhibit the cellulose hydrolysis by cellulase enzyme, and the inhibitions on cellulases are all competitive type. The order of the inhibition strength by the lignocellulosic material degradation products to cellulase is lignin breakdown products > furan derivatives > organic acids (Jing et al.,2009).
4.3.4 The Enzymatic hydrolysis conditions for assessment of pretreatment
The Enzymatic hydrolysis for assessment of pretreatment can be performed using various conditions (substrate concentration, enzyme dosage, temperature, stirring speed). A common way is to use washed material at 2 wt% WIS, to avoid end-product-inhibition (Galbe and Zacchi, 2007). This could be seen as the maximum achievable digestibility or glucose yield. However, it does not reflect the pretreatment efficiency in terms of avoiding formation of compounds that are inhibitory to the cellulases. In a full-scale process it is crucial to reach high sugar and ethanol concentrations in order to decrease the energy demand in downstream processes. To increase the sugar concentration during large-scale operation, it is assumed that the whole slurry after pretreatment would be used without introducing separation steps, which would dilute the process stream. Furthemore, the overall substrate loading in enzymatic hydrolysis would probably need to be above 10%wt WIS to meet the energy requirement for ethanol recovery. To mimic a situation that will be more similar to final process conditions, the enzymatic hydrolysis can be performed using the whole slurry from pretreatment diluted to various WIS concentrations, e.g. 10 wt% WIS. In this case also the effect of inhibitors is assessed. However, due to the higher concentration of sugars the enzymes will also suffer from end-product inhibition (Galbe and Zacchi, 2007).
4.4 Aim of the work: Pretreatment Optimization
The experimental activity, carried out at Chemical Engineering Department of Lund University under the supervision of Prof. Zacchi, has been focused on comparing different impregnating agents in steam explosion pretreatment in order to optimize this fundamental step in bioethanol synthesis from lignocellulosic material.
So, sugarcane bagasse biomass was subjected to steam explosion pretreatment with different impregnating agents as sulfur dioxide (SO2) and hydrogen peroxide (H2O2) and the obtained results has been compared with autohydrolysis (without impregnating agents) data in term of fermentable sugars yields.
In general, the addition of sulfure dioxide is an effective pretreatment method for softwood (Tengborg et al., 1998), hardwood, and agricultural residues (Mosier et al., 2005) and the
6 FPU (filter paper unit) is the measure unit of activity enzyme. FPU=International Unit (I.U)/ml. I.U=µmol sugars
produced/min

77
impregnation of SO2 prior to pretreatment results in lower treatment temperatures and short reaction times, thereby improving hemicelluloses recovery and reducing the formation of sugar degradation products (Bura et al., 2003). SO2 supplies the acid medium favorable to plant carbohydrate hydrolysis (Shevchencko et al., 2000). For this reason, SO2 impregnation, prior to steam pretreatment, enhanced the carbohydrate hydrolysis rate by increasing the accessibility of cell walls via the formation of fractures and the removal of hemicelluloses during the steaming of the substrate (Avellar and Glasser, 1998), while reducing the depolymerization of the oligomers and increasing of monomers in the water-soluble stream (Tengborg et al., 1998). SO2 could generate corrosion into reactors, so the use of this agent could require corrosion-resistant reactors. In addition, SO2 pretreatment generates fermentation inhibitors, in particular 5-HMF and furfural (Yang and Wyman, 2007).
The purpose of the pretreatment with hydrogen peroxide (H2O2) was delignification. H2O2
is an oxidizing chemical which is commonly used as a disinfectant. Its oxidizing ability allows to detach and solubilize lignin, loosening the lignocellulosic matrix, increasing the amount of cellulose available for hydrolysis by enzymes (Pandey et al., 2000).
Hydroperoxyl and hydroxyl radicals which are generated by decomposition of hydrogen peroxide initiate delignification. The chemical reactions, which generate the active species, are reported in figure 4.2.
H2O2+OH-= H2O+HOO- H2O2+ HOO-=HO•+ O2
-•+ H2O
Fig. 4.2 chemical Reactions of hydrogen peroxide
In the pretreatment with hydrogen peroxide, it occurs the attack of peroxide anion on
electron deficient carbon atoms in the lignin. The result of this reaction step is the addition of the peroxy group to the lignin (Fig. 4.3).
Fig. 4.3 General scheme for addition of hydroperoxy ion to a conjugated carbonyl structure (Eriksson, 2010)
In subsequent reaction steps, the conjugated structure is broken down with formation of carboxyl groups in the fibers as well as of low molecular weight organic acids.
The reaction between hydroxyl radicals and lignin structures is high (Eriksson, 2010) and this can occur by:
addition to the aromatic ring in nonphenolic units;
electron abstraction by phenolate ions;
O-C-C
C-OHHO
HOO- C=C
C=OH2O; -HO-

78
hydrogen abstraction from the side chain.
Based on the reaction pattern and the products that are formed, this type of oxidation of lignin seems to promote delignification (Eriksson, 2010).
The use of hydrogen peroxide agent in the pretreatment includes following advantages (Cardona et al., 2010):
1) it is considered “environmental benign” 2) the chemicals costs, compared to the use of other effective pretreatment chemicals, are
lower. However, the high oxidative degradation of lignin by H2O2 can lead to the accumulation of
aliphatics, aldehydics and phenolics inhibitory products (Ximenes et al., 2011).
4.4.1 Experimental design
In order to optimize steam-explosion pretreatment step, four parallel pretreatment conditions were carried out: one without any impregnation (autohydrolysis), a second with 2% SO2, a third with 1% H2O2, and a fourth with 0.2% H2O2. The Enzymatic hydrolysis for assessment of pretreatment was performed in water bath at 45°C, with glass flasks. It have been tested two WIS concentration of pretreated material: 2 wt% WIS and 10 wt% WIS. In order to assess the pretreatment efficiency in terms of the main sugars concentration obtained and of avoiding formation of compounds that are inhibitory to the cellulases, the enzymatic hydrolysis was performed using washed material after pretreatment and whole slurry from pretreatment, both at 2 wt% and 10 wt% WIS (Fig. 4.4).
Fig. 4.4 Scheme of design experimental

79
The aim was to investigate and compare the use of these impregnating agents in various conditions of steam explosion pretreatment in order to explore advantages in terms of glucose and xylose yields after enzymatic hydrolysis and inhibitor formation in the pretreatment.
So, for every pretreatment condition, it has been evaluated produced fermentable sugars amount, glucose and xylose yields and the selectivity of the process respect to glucose and xylose and the inhibitors effect.
4.5 Materials and Methods
4.5.1 Raw materials
Sugar cane bagasse (Fig. 4.5) from the sugar plant, located in Seranna, São Paulo, Brazil, was provided by Centro de Tecnologia Canavieira (São Paulo, Brazil) and transported to Lund University, Sweden, by air. The material has been assayed by the National Renewable Energy Laboratory (NREL) methods (Sluiter et al., 2006) to determine raw material composition (Tab. 4.1) and it contained 69.9 % of carbohydrates and 23.6% of lignin. The material has been stored in plastic buckets at 5°C. The dry matter content of sugar cane bagasse was initially 91.61%.
4.5.2 Pretreatment
Parallel pretreatments have been carried out by using SO2 and H2O2 as impregnating agents. To impregnate the bagasse with SO2, the raw material has been put in a plastic bag and then SO2-gas has been added from a gas container corresponding to 2.0% by weight based on the water content of the bagasse. The bag has been then sealed and the gas left to distribute and impregnate
Content (%)
Glucan 41,4
Xylan 22,5
Arabinan 1,3
Galactan 1,3
Mannan 3,4
Lignin 23,6
Total 93,5
Table 4.1. Composition of sugar cane bagasse as percentage of dry matter. (Ferreira-Leitão et al. Biotechnology for biofuels 2010 3:7)
Figure 4.5. Fresh sugar cane bagasse (from São Paulo, Brazil)

80
the bagasse. The bag is let it settle for about two hours at room temperature. H2O2 was used as impregnation by mixing with bagasse in a plastic bucket with 1% and 0.2% of hydrogen peroxide by weight based on the water content of the bagasse. The buckets has been covered and kept at room temperature. The pretreatment with these kinds of impregnating agents was compared with a pretreatment of SCB without any impregnation (autohydrolysis).
The pretreatment has been performed in 10 l steam reactor followed by a flash cyclone tank to accumulate the pretreated bagasse. Figure 4.6 shows the schematic representation of the steam pretreatment unit at Department of Chemical Engineering, Lund University (Sweden).
The equipment consists of a 10l reactor and a flash cyclone. In the reactor there is a ball valve at the top for the feedstock input. There is another valve in the bottom, which is regulated by the computer. After the set residence time has been achieved, the material is released through this valve to the flash cyclone. There are two stream inlets into the reactor: (1) for rapid heat up of the material (located near to the bottom), and (2) controlling the temperature and the pressure (located higher up).
The first inlet is opened only for a short time at the beginning. Steam pretreatment results a slurry-like material with an approximate DM content of 10-25% depending on the pretreatment parameters. The WIS fraction consists of cellulose, lignin and the remaining hemicellulose, while the liquid fraction contains the hemicellulose hydrolysate (monomer and oligomer sugars, acetic acid), sugar degradation products (such as furanics, levulinic acid or formic acid), and phenolic compounds (released from lignin).
The separation of the solid and liquid fractions might be advantageous, as in this case the hemicellulose sugars (mainly pentoses) can be processed separately. The separation of slurry can be obtained by filter press (Palmqvist et al., 1996).

81
Fig. 4.6 Steam pretreatment unit; 1:flash cyclone, 2: reactor, 3:steam generator, 4:operator computer
Bagasse equivalent to 600 grams of dry matter was loaded into the pre-heated reactor. The
bagasse was treated by saturated steam produced by an electric boiler at 200°C for 5 min, with SO2-impregnating, and at 210ºC for 15 minutes, both with H2O2-impregnating and in condition of authohydrolysis (Tab. 4.2).These conditions have been found to be the best in according to literature data (Kovàcs et al., 2009).
Catalysts Temperature (°C) Time (min) SO2 200 5 H202 1% 210 15 H2O2 0,2% 210 15 Autohydrolysis 210 15
Tab. 4.2 Steam pretreatment conditions

82
4.5.2 Enzymatic hydrolysis
Enzymatic hydrolysis has been carried out on the pretreated bagasse to evaluate the efficiency of the pretreatment using Cellic® Ctec2 enzyme, provided by Novozymes A/S (Bagsvaerd, Denmark). This enzyme is a cellulase complex for degradation of cellulose to fermentable sugars and include a blend of : aggressive cellulases, high level of β-glucosidases and hemicellulase.
Enzymatic hydrolysis was performed in 0.5 l flask holding 500 g of material at pH 4.8 and it has been kept in a water bath (45°C) for 96 h using 2% and 10% (w/w) of pretreated material under mechanical stirring. Two parallel experimental conditions have been investigated during enzymatic hydrolysis step: the first one with bagasse pressed and washed with hot water (washed samples) after steam-pretreatment, and the second one with bagasse no-pressed and no-washed (whole slurry samples) before enzymatic hydrolysis.
The fibrous pretreated material (WIS washed and no-washed sugar cane bagasse) was placed in 0.5l glass flask, diluted with 0.1 M sodium acetate buffer (pH=4.8) and mixed with Ctec2 (10FPU/g of fibrous material). Buffer was added to a final weight of 500g. Samples were taken for carbohydrate analysis after 0, 2, 4, 6, 8, 12, 24, 33, 48, 72 and 96 hours. All enzymatic hydrolysis trials have been performed in two parallel runs and the average of the two runs has been considered.
4.5.3 Analysis
The samples from pretreatment and enzymatic hydrolysis have been analyzed by high performance liquid chromatography (HPLC) instrument (Shimadzu LC-10AD, Tokyo, Japan) equipped with a Refractive Index detector (Shimadzu). All samples have been filtered through a 0.20 µm filter and diluted prior to HPLC analysis.
The concentration of cellobiose, glucose, xylose, galactose, mannose and arabinose in the liquid collected after pretreatment and in the samples from enzymatic hydrolysis have been separated using an Aminex HPX-87P column (Bio-Rad, Hercules, CA, USA) operating at 85°C with deionized water as the mobile phase at a flow rate of 0.6 ml/min. Inhibitory compounds, such as acetic acid, furfural and hydroxymethylfurfural (HMF) in pretreatment liquid samples have been analyzed with an Aminex HPX-87H operating at 65°C, with 5mM H2SO4 as mobile phase at a flow rate of 0.6 ml/min (Tab. 4.3).

83
Tab. 4.3 Retention times of main compounds analyzed on Aminex HPX-87P/-87H columns (BioRad, Hercules, CA, USA)
4.6 Results and Discussion
The efficiency of the pretreatments has been evaluated by enzymatic hydrolysis of the pretreated materials. For each pretreatment condition tested, the achieved soluble sugars concentration, by enzymatic, hydrolysis has been analyzed. The hydrolysis curves of pretreated SCB, using the washed fiber and the whole slurry are reported in figures below (Figg. 4.7 – 4.10).

84
Fig. 4.7 Fermentable sugars concentrations in hydrolysis of pretreated bagasse samples, using 2%DM of
washed
Figure 4.7 shows the conversion of the biomass to fermentable sugars for tests operated by
using washed sample with 2 %wt WIS. It’s possible to note like, in this case, cellobiose, xylose and galactose reach a negligible final concentration, while the process it’s able to synthetize glucose with a final concentration equal around 12 g/l.
In all the case examined, glucose concentration follows the same trend, with an initial strong increasing followed by a plateau situation. The plateau state is reached after a reaction time around 60-70 hours.
The results obtained operating with washed samples 10%wt WIS are showed in figure 4.8.
0
2
4
6
8
10
12
14
0 50 100 150
Co
nce
ntr
ati
on
[g
/l]
Time [h]
Autohydrolysis - 2wt% WIS Washed
Cellobiose
Glucose
Xylose
Galactose
0
2
4
6
8
10
12
14
0 20 40 60 80 100 120
Co
nce
ntr
ati
on
[g
/l]
Time [h]
SO2 - 2wt% WIS Washed
Cellobiose
Glucose
Xylose
Galactose
0
2
4
6
8
10
12
14
0 20 40 60 80 100 120
Co
nce
ntr
ati
on
[g
/l]
Time [h]
1% H2O2 - 2wt% WIS Washed
Cellobiose
Glucose
Xylose
Galactose
0
2
4
6
8
10
12
14
0 20 40 60 80 100 120
Co
nce
ntr
ati
on
[g
/l]
Time [h]
0,2% H2O2 - 2wt% WIS Washed
Cellobiose
Glucose
Xylose
Galactose

85
Fig. 4.8 Fermentable sugars concentrations in hydrolysis of pretreated bagasse samples, using 10%DM of
washed
Also in this case, only glucose concentration is notable. Conversion trend is similar to the previous case with an initial increasing followed by a plateau situation. In this case, the initial increasing of conversion is slower respect to 2%wt WIS trials, and a longer time is required to achieve the plateau condition (around to 80 hours). This is due to the larger amount of biomass used which needs a longer time to be attacked by enzymes. This effect could be increased by reactor used. In fact, these experiments have been carried out in glass flasks using a low mechanical mixing equal around 10-20 rpm. Clearly, final concentration achieved is quite higher compared with previous tests, in fact operating with 10%wt WIS samples there is a larger amount of biomass which can be converted to fermentable sugars. Glucose final concentration achieved is equal around 52 g/l.
0
10
20
30
40
50
60
0 20 40 60 80 100 120
Co
nce
ntr
ati
on
[g
/l]
Time [h]
Autohydrolysis - 10wt% WIS Washed
Cellobiose
Glucose
Xilose
Galactose
0
10
20
30
40
50
60
0 20 40 60 80 100 120
Co
nce
ntr
ati
on
[g
/l]
Time [h]
SO2 - 10wt% WIS Washed
Cellobiose
Glucose
Xilose
galactose
0
10
20
30
40
50
60
0 20 40 60 80 100 120
Co
nce
ntr
ati
on
[g
/l]
Time [h]
1% H2O2 - 10wt% WIS Washed
Cellobiose
Glucose
Xilose
galactose
0
10
20
30
40
50
60
0 20 40 60 80 100 120
Co
nce
ntr
ati
on
[g
/L]
Time [h]
0,2% H2O2 - 10wt% WIS Washed
Cellobiose
Glucose
Xilose
Galactose

86
Fig. 4.9 Fermentable sugars concentrations in hydrolysis of pretreated bagasse samples, using 2%DM of whole slurry
Results obtained operating with non-washed samples 2%wt WIS are summarized in figure 4.9. In this case, glucose final concentration is lower respect to tests carried out by using washed samples with the same loads of biomass. Average final concentration achieved is equal around 9 g/l. Glucose trend, also in this case, is similar with an initial increasing and a following plateau state. Plateau conditions are achieved after around 50 hours.
On the other hand, for non-washed samples, there is the presence of other sugars (cellobiose, xylose, galactose, arabinose and mannose) and, overall, xylose final concentration is notable and equal around to 3-4%.
0
2
4
6
8
10
12
0 20 40 60 80 100 120
Co
nce
ntr
ati
on
[g
/l]
Time [h]
Autohydrolysis - 2 wt% WIS Whole Slurry
Cellobiose
Glucose
Xylose
Galactose
Arabinose
Mannose
0
2
4
6
8
10
12
0 20 40 60 80 100 120
Co
nce
ntr
ati
on
[g
/l]
Time [h]
2% SO2 - 2 wt% WIS Whole Slurry
Cellobiose
Glucose
Xylose
Galactose
Arabinose
Mannose
0
2
4
6
8
10
12
0 20 40 60 80 100 120
Co
nce
ntr
ati
on
[g
/l]
Time [h]
1% H2O2 - 2 wt% WIS Whole Slurry
Cellobiose
Glucose
Xylose
Galactose
Arabinose
Mannose
0
2
4
6
8
10
12
0 20 40 60 80 100 120
Co
nce
ntr
ati
on
[g
/l]
Time [h]
0,2% H2O2 - 2 wt% WIS Whole Slurry
Cellobiose
Glucose
Xylose
Galactose
Arabinose
Mannose

87
Fig. 4.10 Fermentable sugars concentrations in hydrolysis of pretreated bagasse samples, using 10%DM of whole slurry
Figure 4.10 shows the results obtained by working with non-washed 10%wt WIS samples. Clearly, also for non-washed samples, the larger amount of biomass used allows to achieve larger amount of fermentable sugars and a slower initial increasing of produced glucose. In this case, glucose final concentration is around 46 g/l and the plateau state is reached after around 80 hours of reaction. Also in this case, xylose final concentration is considerable and equal to an average of around 15 g/l.
As it has been described, for every sample tested, the levels of mannose, arabinose and galactose are negligible, so only the concentrations of glucose and xylose has been compared for each pretreatment condition (Figg. 4.11 and 4.12).
0
10
20
30
40
50
60
0 20 40 60 80 100 120
Co
nce
ntr
ati
on
[g
/l]
Time [h]
Autohydrolysis - 10wt% WIS Whole Slurry
Cellobiose
Glucose
Xylose
Galactose
Arabinose
Mannose
0
10
20
30
40
50
60
0 20 40 60 80 100 120
Co
nce
ntr
ati
on
[g
/l]
Time [h]
SO2 - 10wt% WIS Whole Slurry
Cellobiose
Glucose
Xylose
Galactose
Arabinose
Mannose
0
10
20
30
40
50
60
0 20 40 60 80 100 120
Co
nce
ntr
ati
on
[g
/l]
Time [h]
1% H2O2 - 10wt% WIS Whole Slurry
Cellobiose
Glucose
Xylose
Galactose
Arabinose
Mannose
0
10
20
30
40
50
60
0 20 40 60 80 100 120
Co
nce
ntr
ati
on
[g
/l]
Time [h]
0,2% H2O2 - 10wt% WIS Whole Slurry
Cellobiose
Glucose
Xylose
Galactose
Arabinose
Mannose

88
Fig. 4.11 Glucose and xylose concentrations in hydrolysis of pretreated bagasse samples, using 2%DM of washed and whole slurry
By a first analysis, it’s possible to note that xylose concentration, for every condition tested, follows a trend similar to glucose concentration with an initial increasing followed by a plateau state.
In the case of using sample with 2 %wt WIS, it’s possible to see like glucose and xylose reach the plateau state after the same reaction time (equal about at 60 hours), so it’s correct to state that, in this case, hydrolysis process achieve the final conversion already after 60 hours of reaction time.
0
2
4
6
8
10
12
14
0 20 40 60 80 100 120
Co
nce
ntr
ati
on
[g
/l]
Time [h]
Glucose - 2wt% WIS Washed
AutoHydrolysis
SO2
1% H2O2
0,2% H2O2
0
0,1
0,2
0,3
0,4
0,5
0,6
0 20 40 60 80 100 120
Co
nce
ntr
ati
on
[g
/l]
Time [h]
Xylose - 2wt% WIS Washed
AutoHydrolysis
SO2
1% H2O2
0,2% H2O2
0
2
4
6
8
10
12
0 20 40 60 80 100 120
Co
nce
ntr
ati
on
[g
/l]
Time [h]
Glucose - 2 wt% WIS Total Slurry
AutoHydrolysis
SO2
1% H2O2
0,2% H2O2
0
1
2
3
4
5
0 20 40 60 80 100 120
Co
nce
ntr
ati
on
[g
/l]
Time [h]
Xylose - 2 wt% WIS Total Slurry
AutoHydrolysis
SO2
1% H2O2
0,2% H2O2

89
Fig. 4.12 Glucose and xylose concentrations in hydrolysis of pretreated bagasse samples, using 10%DM of washed and whole slurry
In the test run using 10 wt% WIS sample, glucose conversion shows a slower trend with a gradual achievement of the plateau state after about 80 hours while, on the other hand, xylose conversion presents a more rapid increasing and the reaching of the plateau state already after 50-55 hours.
Looking figures 4.11 and 4.12, it’s important to highlight like, working with non-washed material, produced xylose amount is already considerable at the beginning of the hydrolysis step. This is due to the pretreatment step that already produces a considerable amount of xylose.
On the contrary, working with washed samples, at the start of hydrolysis, xylose amount is equal to zero, this is due to the washing phase which removes xylose produced in the steam pretreatment.
A confirmation of this, it is given by glucose and xylose trend, in fact both show a higher initial velocity of conversion working with no-washed material. This depend on content of cellobiose, xylose oligomers or other oligo- dimers sugars, generated during SCB steam-pretreatment, which is higher, at the beginning of hydrolysis, in no-washed samples than in washed
0
10
20
30
40
50
60
0 20 40 60 80 100 120
Co
nce
ntr
ati
on
[g
/l]
Time [h]
Glucose - 10wt% WIS Washed
AutoHydrolysis
SO2
1% H2O2
0,2% H2O2
0
1
2
3
4
5
0 20 40 60 80 100 120
Co
nce
ntr
ati
on
[g
/l]
Time [h]
Xylose- 10wt% WIS Washed
AutoHydrolysis
SO2
1% H2O2
0,2% H2O2
0
10
20
30
40
50
60
0 20 40 60 80 100 120
Co
nce
ntr
ati
on
[g
/l]
Time [h]
Glucose - 10wt% WIS Whole Slurry
AutoHydrolisys
SO2
1% H2O2
0,2% H2O2
0
5
10
15
20
25
30
0 20 40 60 80 100 120
Co
nce
ntr
ati
on
[g
/l]
Time [h]
Xylose - 10wt% WIS Whole Slurry
AutoHydrolisys
SO2
1% H2O2
0,2% H2O2

90
ones (in table 4.4 the main monomers sugars concentration are listed). In fact, in the latters a higher amount of sugars is removed in the course of the washing step (Barisano et al., 2001).
WIS Conditions of hydrolysis
Impregnating agent
Vi glucose [(g/L)/h]
Vi xylose [(g/L)/h]
Plateau Time
glucose (h)
Plateau Time
xylose (h)
2%
Washed Autohydrolysis 0,37 0,01 74,5 74,5
SO2 1,04 0,01 48,8 49
1% H2O2 0,64 0,002 74,5 48,8
0.2% H2O2 0,24 0,001 74,5 74,5
Whole slurry
Autohydrolysis 0,61 0,05 74,5 74,5
SO2 0,98 0,18 48,8 48,8
1% H2O2 0,78 0,05 48,8 48,8
0.2% H2O2 0,73 0,05 48,8 48,8
10%
Washed
Autohydrolysis 6,37 0,008 72 72
SO2 6,001 0,028 72 38
1% H2O2 2,85 0,011 72 49
0.2% H2O2 5,53 0,077 72 72
Whole slurry
Autohydrolysis 0,72 0,08 78,4 48,6
SO2 3,05 0,90 78,4 54,4
1% H2O2 0,95 0,17 78,4 48,5
0.2% H2O2 0,99 0,15 78,4 48,5
Tab. 4.4 The main monomers sugars concentration
Glucose and xylose final concentrations obtained in 2%wt and 10%wt washed and non washed samples, pretreated with SO2, H2O2 agent and without any impregnation, are summarized in the table 4.5.

91
WIS Conditions of hydrolysis
Impregnating agent Final glucose (g/L)
Final xylose (g/L)
Final glucose+xylose
(g/L)
2%
Washed
Autohydrolysis 13,011 0,128 13,139
SO2 12,743 0,499 13,243
1% H2O2 11,719 0,099 11,818
0.2% H2O2 11,839 0,103 11,942
Whole slurry
Autohydrolysis 9,344 1,502 10,846
SO2 8,741 4,683 13,425
1% H2O2 9,873 1,492 11,365
0.2% H2O2 10,260 1,718 11,978
10%
Washed
Autohydrolysis 53,110 0,638 53,748
SO2 51,048 2,497 53,545
1% H2O2 51,096 0,410 51,596
0.2% H2O2 48,885 1,501 50,386
Whole slurry
Autohydrolysis 41,679 5,346 47,025
SO2 49,385 25,487 74,872
1% H2O2 49,037 8,494 57,531
0.2% H2O2 42,260 6,969 49,228
Tab. 4.5 Final concentration of glucose and xylose in different conditions of pretreatment and enzymatic hydrolysis
It’s clear that, working with a higher amount of pretreated material load, a greater fermentable sugars level can be achieved in the hydrolyzed liquid. Consequently, in 10 wt% WIS samples, both washed and no-washed, the concentrations (g/l) of glucose and xylose are higher than in washed and no-washed samples with 2 wt% WIS.
So, in order to compare the two process investigated (2%wt and 10%wt), the final conversion of glucose and xylose has been evaluated per grams of biomass feed and results are summarized in table 4.6.

92
WIS Conditions of
hydrolysis
Impregnating agent
Final glucose/gr of biomass (g/L)/g
Final xylose/gr of
biomass (g/L)/g
Final glucose+xylose/gr of
biomass (g/L)/g
2%
Washed
Autohydrolysis 0,361 0,004 0,365
SO2 0,376 0,015 0,391
1% H2O2 0,305 0,003 0,308
0.2% H2O2 0,275 0,002 0,277
Whole
slurry
Autohydrolysis 0,108 0,017 0,125
SO2 0,183 0,098 0,281
1% H2O2 0,133 0,020 0,153
0.2% H2O2 0,142 0,024 0,166
10%
Washed
Autohydrolysis 0,377 0,005 0,382
SO2 0,414 0,020 0,435
1% H2O2 0,338 0,003 0,341
0.2% H2O2 0,303 0,009 0,313
Whole
slurry
Autohydrolysis 0,089 0,011 0,101
SO2 0,146 0,076 0,222
1% H2O2 0,108 0,019 0,127
0.2% H2O2 0,096 0,016 0,112
Tab. 4.6 Glucose and xylose concentration per grams of biomass load
Obtained data show clearly that by using washed material it was obtained a higher glucose production in every pretreatment condition investigated. On the other hand, conversion to xylose is higher in the case of no washed sample.
The average increasing obtained for glucose production by using washed samples, and for xylose by using non-washed samples is reported in Table 4.7.

93
WIS Impregnating agent
Average Increase (%) of final glucose/gr biomass (g/L)/g
in WASHED samples compared to NO-WASHED
samples
Average Increase (%) of final xylose/gr biomass (g/L)/g in NO-WASHED samples
compared to WASHED samples
2%
Autohydrolysis 12,65% 0,65%
SO2 9,65% 4,15%
1% H2O2 8,60% 0,85%
0.2% H2O2 6,65% 1,10%
Total average
increase for every
condition
9,39% 1,69%
10%
Autohydrolysis 14,40% 0,30%
SO2 13,40% 2,80%
1% H2O2 11,50% 0,80%
0.2% H2O2 10,35% 0,35%
Total average
increase for every
condition
12,41% 1,06%
Tab. 4.7 Average increasing of glucose/xylose concentration
4.7 Analysis of glucose concentrations and inhibitory compounds
Although a small portion of the cellulose may already be converted to glucose in the course of steam explosion, the largest production of glucose sugar is carried out by cellulase enzymes in hydrolysis step. This is confirmed by glucose amount which, at the beginning of hydrolysis step, is very low also for non-washed samples (Figg. 4.11 and 4.12).
The highest glucose concentration has been obtained in 10wt% WIS washed samples impregnated with SO2, while the lower concentration has been obtained in 10 wt% WIS whole slurry samples pretreated without any impregnation. In table 4.8, investigated samples have been listed from the sample with the higher glucose concentration to the sample with the lower one.

94
Conditions of hydrolysis Impregnating agent
10% Washed SO2
Fin
al g
luco
se/g
r of
bio
mas
s (g
/L)/
g
10% Washed Autohydrolysis
2% Washed SO2
2% Washed Autohydrolysis
10% Washed 1% H2O2
2% Washed 1% H2O2
10% Washed 0.2% H2O2
2% Washed 0.2% H2O2
2% Whole slurry SO2
10% Whole slurry SO2
2% Whole slurry 0.2% H2O2
2% Whole slurry 1% H2O2
10%Whole slurry
2%Whole slurry
1% H2O2
Autohydrolysis
10%Whole slurry 0.2% H2O2
10%Whole slurry Autohydrolysis
Tab. 4.8 Tested samples listed from which present the higher glucose production
In whole slurry samples, the concentration of glucose is lower than in washed samples. The cellulose hydrolysis by cellulase enzyme can be inhibited by the presence of certain levels of glucose which negatively affect the enzyme activity (Tengborg et al., 2001). As matter of fact, lower conversion of cellulose may be related to the higher amount of glucose contained in the whole slurry samples respect to the washed ones at the start of hydrolysis (Figg 4.11 and 4.12).
But, the main reason for the lower glucose yields obtained in whole slurry samples is the presence of various inhibitory products generated during pretreatment. As previously describe, the main part of glucose is produced by enzymatic hydrolysis process. Inhibitory compounds have a negative effects on cellulase activity and, consequently, on rate and yield of cellulose conversion to glucose (Jing et al., 2009).
Pretreated material washing, prior to enzymatic hydrolysis, promotes inhibitors compounds removal and avoid their buildup. Consequently, this step prevents endproduct inhibition in determination of the potential sugar yield (Söderström et al., 2002).

95
By HPLC was possible to analyze the concentrations (g/l) of various inhibitory compounds, such as acetic acid, furfural and hydroxymethylfurfural (HMF) in pretreatment liquid samples. In washed samples, it has been found only the presence of acetic acid how it is showed in table 4.9 which displays the amount of the main inhibitory compounds for all the samples investigated.
WIS Conditions of
hydrolysis Impregnating
agent Acetic acid
(g/L) HMF (g/L)
Furfural (g/L)
2%
Washed
Autohydrolysis 0,924 - -
SO2 0,986 - -
1% H2O2 0,898 - -
0.2% H2O2 0,869 - -
Whole slurry
Autohydrolysis 0,752 0,062 0,189
SO2 1,311 0,013 0,522
1% H2O2 0,993 0,033 0,020
0.2% H2O2 1,099 0,069 0,781
10%
Washed
Autohydrolysis 4,619 - -
SO2 4,930 - -
1% H2O2 4,492 - -
0.2% H2O2 4,343 - -
Whole slurry
Autohydrolysis 3,761 0,313 0,944
SO2 6,556 0,025 0,951
1% H2O2 4,967 0,165 0,979
0.2% H2O2 5,492 0,344 3,907
Tab. 4.9 Main inhibitory compound amount in the tested samples
For washed samples, the best result has been achieved by using SO2 as impregnating agent.
In fact, SO2 agent stimulates cellulose saccharification during the enzymatic hydrolysis stage.
This is due to the capacity of SO2 impregnating agent to degrade lignocellulosic fraction and in particular hemicellulosic fraction. In fact, SO2 present a high hemicellulolitic activity how it’s proven by the large amount of xylose produced already in steam-pretreatment step how it’s possible to note looking to the graph of xylose conversion for non-washed samples. As matter of fact, literature also describe like the addition of SO2 improved the recovery of hemicellulose sugars compared to pretreatment without impregnation (Martin et al., 2002).

96
It also must be highlighted that, for washed sample, autohydrolysis process, both for 2% and 10%, gets a glucose final concentration higher than working with H2O2 pretreatment, at 0.2 and 1 % both.
This result is due to the high ability of hydrogen peroxide to degrade lignin producing a large amount of lignin-derived products, generated during H2O2 pre-treatment (Jing et al., 2009). This compounds, such as simpler aromatic and phenol compounds, are not fully removed during washing phase, due to their low solubility in water, and so these compound remain in solution with their negative effect on enzyme activity.
All non-washed samples shows a final glucose production lower than the washed one, so in order to investigate the effect of inhibitory compounds on them, the detailed results of HPLC analysis on inhibitory compounds concentration are showed in figures 4.13 and 4.14.
Fig. 4.13 Concentration of inhibitors in whole slurry samples at 2 wt%

97
0
0,3
0,6
0,9
1,2
1,5
Inh
ibit
ory
co
mp
ou
nd
s
C (
g/L)
Autohydrolysis - 2 wt% WIS whole slurry
0
0,3
0,6
0,9
1,2
1,5
Inh
ibit
ory
co
mp
ou
nd
s
C (
g/L)
SO2 - 2wt% WIS whole slurry
0
0,3
0,6
0,9
1,2
1,5
Inh
ibit
ory
co
mp
ou
nd
s
C (
g/L)
1% H2O2 - 2 wt% WIS wholw slurry
0
0,3
0,6
0,9
1,2
1,5
Inh
ibit
ory
co
mp
ou
nd
s
C (
g/L)
0.2% H2O2 - 2 wt% WIS whole slurry
Fig. 4.14 Concentration of inhibitors in whole slurry samples at 10 wt%WIS
Clearly, by working with a higher amount of pretreated material, a greater level of inhibitors compounds is achieved in the hydrolyzed liquid. Consequently, in 10 wt% WIS non washed samples, the concentrations (g/l) of inhibitors are higher than 2 wt% WIS non washed samples.
To evaluate better the effect of inhibitory compound in table 4.10 the amount of the main inhibitory product (HMF and furfural) per grams of biomass loaded is reported.

98
WIS Conditions of hydrolysis
Impregnating agent
Furfural concentration/gr of
biomass (g/L)/g
HMF concentration/gr of
biomass (g/L)/g
2% Whole slurry
Autohydrolysis 2.02*10^-3 0,67*10^-3
SO2 7.73*10^-3 0,18*10^-3
1% H2O2 2.16*10^-3 0,36*10^-3
0.2% H2O2 8.88*10^-3 0,78*10^-3
10% Whole slurry
Autohydrolysis 2.18*10^-3 0,72*10^-3
SO2 10.9*10^-3 0,26*10^-3
1% H2O2 0.26*10^-3 0,44*10^-3
0.2% H2O2 10.8*10^-3 0,95*10^-3
Tab. 4.10 Main inhibitory compound amount per grams of biomass
The mechanism how inhibitor compounds affect negatively enzyme activity has been not already established, in fact, in literature only few works treat this argument. As matter of fact, analyzing obtained data, it’s possible to highlight that 2 wt% and 10 wt% WIS samples, pretreated with SO2, contain a large amount of furfural but, at the same time, sodium dioxide pretreatment results to achieve the highest level of cellulose to glucose conversion respect to other pretreatment in the same conditions.
It’s significant to note that the high production of inhibitors is related to the greater capacity of impregnating agent to degrade hemicellulosic fraction. But, at the same time, this deconstruction increases the accessibility of cell walls during biomass pretreatment step by the formation of fractures, hemicelluloses removing and oligomers depolymerization. These effects increase monomers amount in the water-soluble stream ensuring, in this way, a considerable increasing of carbohydrate hydrolysis rate (Tengborg et al., 1998).
As matter of fact, it’s possible to say that in this process SO2 plays a double role, in opposition one to another, increasing at the same time carbohydrate hydrolysis rate and inhibitor compounds formation and this is the reason for which it’s not easy to find a strong correlation between inhibitor content and glucose final yield.
The characteristic of hydrogen peroxide pretreatment is the removing of lignin by oxidation and the breaking of the bonds which are typical of this polymer (Xiang and Lee, 2000). The lignin oxidation with hydrogen peroxide is carried out at 210°C for 15 min. This high severity in reaction condition is required in order to promote the hydrogen peroxide decomposition in molecular oxygen and radical species which can react with lignin in a variety of ways, and in order to increase lignin degradation to an appreciable extent (Xiang and Lee, 2000).

99
Also in this case, if on the one hand the higher lignin degradation allows a higher accessibility of enzyme to hemicelluloses and cellulose surface, on the other hand it causes a large amount of inhibitory compounds production.
These inhibitors are acids product, as acetic, levulinic and formic acid, aromatic acid, but also aliphatics, aldehydes and phenolics compounds (Xiang and Lee, 2000). These last inhibitors were not separated by HPLC but their production during treatment with peroxide hydrogen was extensively confirmed in literature (Martin et al., 2002).
Then, a higher concentration of hydrogen peroxide promote, at the same temperature, a higher oxidation reactions of furans, as furfural, to phenols and other inhibitors compounds production. This fact agrees with data obtained. In non-washed samples pretreated with 0,2 % H2O2 agent, it has been showed a higher amount of furfural than those pretreated with H2O2 more concentrated (1%).
Nevertheless, in the samples, pretreated with more dilute H2O2 agent at 2 wt% WIS, glucose final concentration in hydrolyzed liquid is higher than those impregnated with 1 % H2O2 agent. These results are related to the formation of phenol and of other lignin derived compounds that have a higher inhibitory effect respect to derived furans (Jing et al., 2009).
As matter of fact, in 2wt% WIS non washed samples, phenols amount produced by using 0,2% H2O2 is so low to no effectively influence the enzymatic activity, while in no-washed samples at 2% WIS impregnated by using 1% H2O2, a higher phenols amount is produced and therefore it’s present a considerable inhibitory action on enzymatic activity that lead to a lower glucose final yield.
Instead, at 10wt % WIS, the greater glucose final concentration is achieved in no-washed samples pretreated with 1% H2O2 according with literature data (Badovskaya and Povarova, 2009).
In 10% WIS samples there is a higher inhibitory compounds amount, both in samples pretreated with 0,2% H2O2 and 1% H2O2, and so it leads to an higher phenol amount in both investigated samples.
In the case of working with no-washed 10% WIS samples impregnated with 0,2% H2O2, the lower glucose concentration released into hydrolyzed liquid is due to the amount of total inhibitory compounds, in particular the sum of phenol, furfural and HMF, that is higher than the amount of all inhibitory compounds present in the liquid for 1% H2O2.
Moreover, working with a larger biomass load needs a higher degradation of biomass structure to make cellulose fibers accessible to enzymes attack. So the high disruption of biomass achieved with H2O2 more concentrate promotes the production of fermentable sugars.
Unwashed samples at 10% WIS, pretreated without using chemical agents (autohydrolysis), shows instead a lower glucose final concentration respect to all the other pretreatment conditions investigated.
This result clearly show how pretreatment operated without chemical impregnating agents get a lower destruction and solubilization of lignin and hemicellulose. So, the presence of these solid residues, that is higher working with a wider biomass amount, makes more difficult enzyme action on cellulose and therefore it lead the reaction to a lower cellulose to glucose conversion (Rahikainen et al., 2011). Literature, in fact, reports that partial delignification of pretreated

100
materials before enzymatic hydrolysis results in increased sugar yields (Adsul et al., 2005; Ohgren et al., 2007).
By the analysis of experimental results for washed and non-washed samples both, it’s still correct to say that SO2 pretreatment is the most effective pretreatment method for the production of glucose from SCB by enzyme saccharification.
This result is quite important, in fact, steam-pretreatment, by using SO2 as impregnating agent, is which requires the lower pretreatment time, only 5 minutes respect 15 minutes required by the other process (with H2O2 impregnation and without any impregnating agents).
This result is considerable inasmuch it leads to great advantages in terms of process energetic needs and to an effective reduction of process costs in bioethanol production.
4.8 Analysis of xylose concentration
Xylose is generated from the hemicelluloses fraction in a great amount already during steam explosion process. The concentration of xylose in the hydrolyzed liquid is lower than glucose one. This difference can be attributed to a higher degree of destruction of the former due to longer exposure to conditions resulting in dehydration and formation of the corresponding byproduct.
Hemicellulose does not have the crystallinity of cellulose (Sjöström, 1993) and consequently is to a higher degree susceptible to hydrolysis. Since hemicellulose-derived sugars, such as xylose and arabinose, are formed at an earlier stage, they are thus exposed to the dehydrating agents for a longer time. The higher concentration of furfural respect to HMF (Fig. 4.13 and 4.14) supports this assumption.
Non-washed samples show a higher final xylose concentration than washed ones in the different investigated conditions. It is related to the fact that the washing step causes a greater removal of fermentable sugars and therefore of xylose which is produced in considerable amount in steam-pretreatment step compared to glucose which is mainly synthesized in enzymatic hydrolysis step.
In table 4.11, investigated samples have been listed from the sample with the higher glucose concentration to the sample with the lower one.

101
Conditions of hydrolysis Impregnating agent
2% Whole slurry SO2
Fin
al x
ylos
e/gr
of b
iom
ass
(g/L
)/g
10%Whole slurry SO2
2% Whole slurry 0.2% H2O2
2% Whole slurry
10% Washed
1% H2O2
SO2
10%Whole slurry 1% H2O2
2% Whole slurry Autohydrolysis
10%Whole slurry 0.2% H2O2
2% Washed SO2
10%Whole slurry Autohydrolysis
10% Washed 0.2% H2O2
10% Washed Autohydrolysis
2% Washed Autohydrolysis
10% Washed=2% Washed 1% H2O2
2% Washed 0.2% H2O2
Tab. 4.11 Tested samples listed from which present the higher glucose production
In whole slurry samples, the effect of the large production of inhibitors on enzymatic hydrolysis step to produce xylose is negligible. In fact, the enzyme used for hydrolysis step has a low hemicellulasic activity. As matter of fact, xylose production by enzymatic hydrolysis step is low and not much affected from inhibitory compounds.
The maximum of xylose final concentration is gained in non-washed samples pretreated with addition of SO2 as impregnating agent. Therefore, also in this case the pretreatment with SO2 impregnating agent is the most effective method to produce xylose from SCB by steam explosion pretratment and enzymatic hydrolysis.

102
4.9 Final concentrations and yields of Glucose and Xylose in the various pretreatment conditions
By a cross –check data obtained, it was possible to order the samples from those containing a higher concentration of glucose and xylose to those with lower concentration of these fermentable sugars (Tab. 4.12).
Conditions of hydrolysis Impregnating agent
10% Washed SO2
Fin
al g
luco
se+
xylo
se/g
r of
bio
mas
s (g
/L)/
g
2% Washed SO2
10% Washed Autohydrolysis
2% Washed Autohydrolysis
10% Washed 1% H2O2
10% Washed 0.2% H2O2
2% Washed 1% H2O2
2% Whole slurry SO2
2% Washed 0.2% H2O2
10%Whole slurry SO2
2% Whole slurry 0.2% H2O2
2%Whole slurry 1% H2O2
10%Whole slurry 1% H2O2
2% Whole slurry Autohydrolysis
10%Whole slurry 0.2% H2O2
10%Whole slurry Autohydrolysis
Tab. 4.12 Tested samples listed from which present the higher glucose+xylose production
The final yields of the two fermentable sugars has been calculated as:\
Figure 4.15 shows the glucose+xylose yields obtained in various pretreatment conditions.
Residual sugarconcentration (g/l)
Weight of bagasse fiber at beginning of the saccharification (g) / reaction volume (l)% Yield = *100

103
Fig. 4.15 Glucose+Xylose final yield
It’s possible to note how the steam-pretreatment by using SO2 give the best results also in terms of total fermentable sugars yields.
The final yields of glucose and xylose compared with the theoretical final glucose and xylose yields has been evaluated as reported in the equation below.
Figure 4.16 shows the results obtained.
0
10
20
30
40
50
Glu
cose
+x
ylo
se y
ield
(%
)
2wt% WIS WHOLE SLURRY 2wt% WIS WASHED 10wt% WIS WASHED 10wt% WIS WHOLE SLURRY
Final yield amount of glucose produced (g/l)
amount of glucan (g/l) Theoretical yields = amount of xylose produced (g/l)
amount of xylan (g/l) +

104
Fig. 4.16 Glucose+Xylose final yield rapported to the theoretical one
From the figure above can be seen as the best result has been obtained by using washed SCB
after pretreatment with 10 wt% WIS SCB .
The pretreatment with SO2 impregnating agent has guarantees final yields equal to 68% and to 61% of the theoretical ones working at 10 wt% and 2wt% WIS, respectively. These yields are the most considerable results compared with data obtained in the other pretreatment conditions investigated.
With SO2-pretreated non washed SCB, the glucose and xylose final yields are equal to 44% for 2 wt% WIS and 32% for 10wt% WIS. These are decreased by more than half compared to washed samples but they are higher than non-washed samples examined with different pretreatment conditions.
In washed samples, pretreated with the addition of 1% hydrogen peroxide, glucose and xylose yields result to be about 51% of theoretical ones, so, comparing these results with SO2 pretreatment data, it highlights the reduced efficiency of this pretreatment. Moreover, these yields are also found to be lower than glucose and xylose obtained working with washed samples, not treated with impregnating agents (autohydrolysis), which are equal to 60% and 57% of the theoretical ones working with 10wt% and 2wt% WIS respectively.
0
10
20
30
40
50
60
70
80
Glu
cose
+xy
lose
yie
ld (
% o
f th
eo
reti
cal)
2wt% WIS WHOLE SLURRY 2wt% WIS WASHED
10wt% WIS WASHED 10wt% WIS WHOLE SLURRY

105
4.10 Selectivity
The selectivity of the process respect to glucose produced has been evaluated as reported in the equation below.
This evaluation has been carried out in order to confirm the considerable importance of obtained data and in order to highlights how the investigated process is moved towards to glucose production which is the fermentable sugars to synthetize bioethanol.
Obtained results are showed in Figures 4.17 and 4.18.
Fig. 4.17 Glucose selectivity in test carried out with washed samples
Figure 4.17 shows the selectivity respect to glucose for the hydrolysis step carried out on washed samples. It’s possible to note how all the results are close one to each other and how the process is strongly moved towards glucose production with a selectivity equal over 90% in all the case investigated.
0
20
40
60
80
100
Glucose -selectivity
2% washed
10% washed
Selectivity (%) = amount of glucose produced (g/l) amount of all sugars produced (g/l)

106
Fig. 4.18 Glucose selectivity in test carried out with non-washed samples
The selectivity of non-washed sample is displayed in figure 4.18. Clearly, in the case of unwashed samples, the selectivity is lower respect to the test carried out with washed samples. This is due to the presence of xylose which is abundant amount produced in pretreatment that in absence of the washing step is not removed.
Xylose is still an important by-product, in fact, a part of its amount is still fermented and the remaining part can be recovered for the production of other bio-based products (Bozell and Petersen, 2010).
4.11 Conclusions
This research activity has been focused on a comparative analysis of different impregnating agents in order to optimize steam-explosion pretreatment.
To get this aim, two different impregnating agents (SO2 and H2O2) have been tested and their performance has been compare with pretreatment without any impregnation data. By experimental tests, it has been proved the importance of pretreatment optimization; in fact considerable differences in final sugars yields from bagasse hydrolyzates using different impregnating agents has been achieved.
0
20
40
60
80
100
Glucose selectivity
2% whole slurry
10% whole slurry

107
The yields of glucose and xylose under different pretreatment conditions provided an indication of the efficiency of the conversion of cellulose and hemicellulose to the corresponding monosaccharides.
The utilization of SO2 as impregnating agent for steam pretreatment is resulted the most promising method respect hydrogen peroxide impregnation and respect to the pretreatment without addition of chemicals agents. This study shows that the optimal conditions for SCB pretreatment steam is working with SO2 impregnation and running pretreatment process at 200°C for 5 min. Enzymatic hydrolysis was performed both on the whole pretreated material and the separated washed fiber fraction. By working with 10wt% WIS, the achieved final glucose concentration value, in washed samples, was around 50g/l with a final yields equal to 68% (compared with theoretical one) and e selectivity equal to 93% Furthermore, xylose final concentration obtained has been considerable, equal to around 13 g/l. In H2O2 pretreatment, glucose and xylose yields have been very low. This data confirm that H2O2 impregnated bagasse, compared to SO2 impregnated and non impregnated bagasse, lead to a higher degree of hydrolysis of cellulose and hemicellulose at the pretreatment stage causing a high degree of degradation of the released sugars.
Results obtained are quite important for the optimization of the process. In fact, the pretreatment by using SO2 as impregnating agent, resulted the most effective, is the one which requires shorter pretreatment time, only 5 minutes, compared with the other process which needs 15 minutes of stem-pretreatment to be effective.As matter of fact, this result involves a great reduction in term of energy requirements of the process and so it implies a strong breakdown of bioethanol production costs.
4.12 References
Adsul M.G., Ghule J.E., Shaikh H., Singh R., Bastawde K.B., Gokhale D.V., Varma A.J. Enzymatic hydrolysis of delignified bagasse polysaccharides. Carbohydrate Polymers, 62 (17), 6-10, 2005.
Alfani A., Gallifuoco F., Saporosi A., Spera A., Cantarella M. Comparison of SHF and SSF process for the bioconversion of steam-exploded wheat straw. Journal of Industrial Microbiology and Biotechnology 25, 184-192, 2000.
Alvira P., Tomás-Pejó E., Ballesteros M., Negro M., J. Pretreatment technologies for an efficient bioethanol production process based on enzymatic hydrolysis: A review, Bioresource Technology, 101 (13), 4851-4861, 2010.
Avellar B.K., Glasser W.G. Steam-assisted biomass fractionation. I. Process considerations and economic evaluation, Biomass and Bioenergy, 3, 14-205, 1998.
Badovskaya L.A., Povarova L.V. Oxidation of furans, review, Chemistry of heterocyclic compounds, 45, 1023-1034, 2009.
Balat M., Balat H., Oz C. Progress in bioethanol processing, Progress and Energy Combustion science, 34 (5), 551-573, 2008.
108
Banerjee G., Car S., Scott-Craig J.S., Hodge D.B., Walton J.D. Alkaline peroxide pretreatment of corn stover: effects of biomass, peroxide, and enzyme loading and composition on yields of glucose and xylose Biotechnology for Biofuels, 4 (16), 1-15, 2011.
Barisano D., De Bari I., Viola E. State of the art on bioethanol production, ENEA, Ente per le nuove tecnologie, l'energia e l'ambiente, 1-98, 2001.
Bozell. J.J., Petersen G.R. Technology development for the production of biobased products from biorefinery carbohydrates-The US Department of Energy’s “Top10“ revisited, Green Chemistry, 12 (4), 525-728, 2010.
Bura R., Bothast R.J, Mansfiels S.D., Saddler J.N. Optimization of SO2-catalyzed steam pretreatment of corn fiber for ethanol production, Applied Biochemistry and Biotechnolology, 106 (1-3), 319-335, 2003.
Camassola M., Dillon A.J.P., 2009. Biological pretreatment of sugar cane bagasse for the production of cellulases and xylanases by Penicillium echinulatum. Industrial Crops and Products 29, 642–647, 2009.
Cardona C.A, Quintero J.A., Paz I.C. Production of bioethanol from sugarcane bagasse: Status and perspectives, Bioresource Technology, 101, 4754-4766, 2010.
Carrasco C., Baudel H.M. SO2-catalyzed steam pretreatment and fermentation of enzymatically hydrolyzed sugarcane bagasse. Enzyme and Microbial Technology, 46 (2), 64-73, 2010.
Cerqueira D.A., Rodrigues G., Meireles C.D. Optimization of sugarcane bagasse cellulose acetylation, Carbohydrate Polymers, 69, 579–582, 2007.
Chum H.L., Johnson D.K., Black S.K., Overend R.P. Pretreatment catalyst effects and the combined severity parameter, Applied Biochemistry and Biotechnolology, 24 (5), 1-14, 1990.
Dawson L., Boopathy R. Cellulosic ethanol production from sugarcane bagasse without enzymatic saccharification. Bioresources 3 (2), 452-460, 2008.
Eklund R., Galbe M. and Zacchi G. The influence of SO2 and H2SO4 impregnation of willow prior to steam pretreatment, Bioresource Technology, 52 (3), 225-229, 1995.
Eriksson K.E., Lignin biodegradation, in Lignin and Lignans: Advances in Chemistry (chapter 14), Cyril Heitner , Don Dimmel, John Schmidt (Editor) , 471-494, 2010.
Ferreira-Leitão V., Perrone C.P., Rodrigues J., Franke A.P.M, Macrelli S., Zacchi G. An approach to the utilisation of CO2 as impregnating agent in steam pretreatment of sugar cane bagasse and leaves for ethanol production, Biotechnology for Biofuels, 3 (7), 1-8, 2010.
Galbe M and Zacchi G. Pretreatment of Lignocellulosic Materials for Efficient Bioethanol Production, Advances in biochemical Engineering/Biotechnology, 108, 41-65, 2007.
Galbe M., Zacchi G. A review of the production of ethanol from softwood. Applied Microbiology and Biotechnology, 59 (6), 618-628, 2002.

109
Gautam S.P, Bundela P.S. Pandey A.K., Khan J., Awasthi M.K., Sarsaiya S. Optimization for the Production of Cellulase Enzyme from Municipal Solid Waste Residue by Two Novel Cellulolytic Fungi, Biotechnology Research International, 2011, 1-8, 2010.
Goh C.S., Tan K.T., Lee K.T., Bhatia S. Bio-ethanol from lignocellulose: status, perspectives and challenges in Malaysia. Bioresource Technology, 101 (13), 4834-4841, 2010.
Gómez S.M.R, Andrade R.R., Santander C.G., Costa A.C., Maciel F.R., Pretreatment of sugarcane bagasse with phosphoric and sulfuric diluted acid for fermentable sugars production by enzymatic hydrolysis, Chemical Engineering transactions, 20, 321-326, 2010.
Harmsen P.F.H., Huijen W.J.J., Bermúdez López L.M., Bakker R.R.C, Literature Review of Physical and Chemical Pretreatment Processes for Lignocellulosic Biomass, Biosinergy, 1-54, 2010.
Hendricks A.T.W.M. and Zeeman G. Pretreatments to enhance the digestibility of lignocellulosic biomass, Bioresource Technology, 100, 10-18, 2006.
Hernández-Sala, J.M., Villa-Ramírez M.S., Veloz-Rendón J.S., Rivera-Hernández K.N., González-César R.A., Plascencia-Espinosa M.A., Trejo-Estrada S.R.. Comparative hydrolysis and fermentation of sugarcane and agave bagasse, Bioresource Technology 100, 1238–1245, 2009.
Hettenhaus J., Glassner D. Enzyme Hydrolysis of Cellulose: Short Term Commercialization Prospects for Conversion of Lignocellulosics to Ethanol, Internal Report, National Renewable Energy, 1997.
Jing X., Zhang X., Bao J. Inhibition Performance of Lignocellulose Degradation Products on Industrial Cellulase Enzymes During Cellulose Hydrolysis. Applied Biochemistry and Biotechnology, 159 (3), 696-707, 2009.
Klinke H. B., Thomsen A.B., Ahring B. K. Inhibition of ethanol-producing yeast and bacteria by degradation products produced during pre-treatment of biomass. Applied microbiology and Biotechnology, 66(1), 10-25, 2004.
Kovàcs K., Macrelli S., Szakacs G., Zacchi G., Enzymatic hydrolysis of steam-pretreated lignocellulosic materials with Trichoderma atroviride enzymes produced in-house, Biotechnology for Biofuels, 2 (14), 1-11, 2009.
Krishna S.H., Chowdary G.V. optimization of simultaneous saccharification and fermentation for the production of ethanol from lignocellulosic biomass, Journal of Agricultural and Food chemistry, 48, 1971-1976, 2000.
Kumar P., Barrett D.M., Delwiche M.J., Stroeve P. Methods for Pretreatment of Lignocellulosic Biomass for Efficient Hydrolysis and Biofuel Production, Industrial & engineering chemistry research, 48 (8), 3713-3729, 2009.
Larsson S., Palmqvist E., Hahn-Hägerdal B., Tengborg C., Stanberg K., Zacchi G., Nilverbrant N. The generation of fermentation inhibitors during dilute acid hydrolysis of softwood. Enzyme and Microbiology Technology, 24 (3-4), 151-159, 1999.

110
Martín C., Galbe M., Nilvebrant N.O., Jönsson L.J. Comparison of the fermentability of enzymatic hydrolysates of sugarcane bagasse pretreated by steam explosion using different impregnating agents, Applied Biochemistry and Biotechnology 98–100, 699–716, 2002.
Martinez A., Rodriguez M.E., Wells M.L., York S.W., Preston J.F., Ingram L.O. Detoxification of dilute acid hydrolysates of lignocelluloses with lime. Biotechnology Progress, 17, 287-293, 2001.
McMillan J.D. Pretreatment of lignocellulosic biomass. In: Enzymatic Conversion of Biomass for Fuels Production; Himmel, M. E., Baker, J. O., Overend, R. P., Eds.; American Chemical Society: Washington, DC, 292-324, 1994.
Mills T., Sandoval N.R., Gill R.T. Cellulosic hydrolysate toxicity and tolerance mechanism in E. Coli, Biotechnology for Biofuels, 2:26, 2009.
Mosier N.S., Wyman C., Dale B., Elander R., Lee Y.Y., Holtzapple M., Ladisch M.R. Features of promising technologies for pretreatment of lignocellulosic biomass. Bioresouce Technology 96, 673–686, 2005.
Oefner P.J., Lanziner A.H., Bonn G., Bobleter O. Quantitative studies on furfural and organic-acid formation during hydrothermal, acidic and alkaline-degradation of deuterium-xylose. Monatshefte Für Chemie, 123, 547-556, 1992.
Ohgren K., Bura R., Saddler J., Zacchi G. Effect of hemicellulose and lignin removal on enzymatic hydrolysis of steam pretreated corn stover. Bioresource Technology, 98, 2503-251, 2007.
Overend R.P., Chornet E. Fractionation of lignocelluloses by steam-aqueous pretreatments. Philosophical Transactions of the Royal Society of London A, 321, 523-536, 1987.
Palmqvist E., Hahn-Hägerdal B. Fermentation of lignocellulosic hydrolysates. II: inhibitors and mechanism of inhibition, Bioresources Technology 74, 25-33,2000.
Palmqvist E., Meinander Q., Grage H., Hahn-Hägerdal B. Influence of furfural on anaerobic glycolytic kinetics of Saccharomyces cerevisiae in batch culture. Biotechnology and Bioengineering, 62, 447-454, 1999(a).
Palmqvist E., Hahn-Hägerdal B., Szengyel Z., zacchi G., Rèczey K. Simultaneous detoxification and enzyme production of hemicelluloses hydrolysates obtained after steam pretreatment. Enzyme and Microbial Technology 20, 286-293,1997
Palmqvist E., Meinander Q., Grage H., Hahn-Hägerdal B. Main the interaction effects of acetic acid, furfural and p-hydroxybenzoic acid on growth and ethanol productivity of yeasts. Biotechnology and Bioengineering, 63, 46-55, 1999b.
Palmqvist E., Hahn-Hägerdal B., Galbe M., Larsson S., Stenberg K., Szengyel Z., Tengborg C., Zacchi G. Design and operation of a bench-scale process development unit for the production of ethanol from lignocellulosics. Bioresource Technology, 58, 171-179, 1996.
Pandey A., Soccol C.S, Nigam P., Soccol V.T. Biotechnological potential of agro-industrial residues. I. sugarcane bagasse. Bioresource Technology, 74 (2), 69-80, 2000.

111
Peng F., Ren J.L., Xu F., bian J., Peng P., Sun R.C. Comparative Study of Hemicelluloses Obtained by Graded Ethanol Precipitation from Sugarcane Bagasse, Journal of Agricultural and food chemistry, 57, 6305-6317, 2009.
Rahikainen J., Mikander S., Marjama K., Lappas A., Viikari L., Kruus K. Inhibition of enzymatic hydrolysis by residual lignins from softwood—study of enzyme binding and inactivation on lignin-rich surface. Biotechnology and Bioengineering 108 (12), 2823-2834, 2011.
Sendelius J. Steam Pretreatment Optimisation for Sugarcane Bagasse in Bioethanol Production, Master of Science Thesis. Lund University, Sweden, 2005.
Shevchenko S.M., Chang K., Robinson J. Optimization of monosaccharide recovery by post-hydrolysis of the water-soluble hemicellulose component after steam explosion of softwood chips, Bioresource technology, 72 (3), 207-211, 2007.
Sjöström, E. Wood Chemistry. Fundamentals and Applications, Academic Press,San Diego, CA, 1993.
Sluiter A., Hames B., Ruiz R., Scarlata C., Sluiter J.,Templeton D. Determination of Sugars, Byproducts, and Degradation Products in Liquid Fraction Process Samples, Laboratory Analytical Procedure (LAP), A national laboratory of the U.S. Department of Energy Office of Energy Efficiency & Renewable Energy. Technical Report NREL/TP-510-42623,1-11, 2006.
Söderström J., Pilcher L., Galbe M., Zacchi G. Two-step steam pretreatment of softwood with SO2 impregnation for ethanol production, Applied Biochemistry and Biotechnology, 98 -100, (1-9), 5-21, 2002.
Sun Y., Cheng J. Hydrolysis of lignocellulosic materials for ethanol production: a review. Bioresource Technology, 83, 1–11, 2002.
Taherzadeh M.J., Karimi K. Enzyme-based hydrolysis processes for ethanol from lignocellulosic materials: a review, Bioresources, 2 (4), 707-738, 2007.
Teixeira S.R., Eunice de Souza A., Vilche Peña A.F, Godoy de Lima R., Miguel Á. G. Use of Charcoal and Partially Pirolysed Biomaterial in Fly Ash to Produce Briquettes: Sugarcane Bagasse. Alternative Fuel, 4, 177-200, 2011.
Tengborg C., Galbe M., Zacchi G. Reduced inhibition of enzymatic hydrolysis of steam-pretreated softwood. Enzyme and Microbial Technology, 28, 835-844, 2001.
Tengborg C., Stenberg K., Galbe M., Zacchi G., Larsson S., Palmquist E., Hahn-Hegerdal B. Comparison of SO2 and H2SO4 impregnation of softwood prior to steam pretreatment on ethanol production. Applied Biochemistry and Biotechnolology, 70, 72-73, 1998.
Wyman C.E., Ethanol production from lignocellulosic biomass: Overview, Handbook on Bioethanol: Production and Utilization, C.E. Wyman (ed.), Taylor and Francis, Washinghton DC, Chapter 1, 11-12, 1996.

112
Xiang Q., Lee Y.Y. Oxidative cracking of precipitated hardwood lignin by Hydrogen peroxide, Applied biochemistry and biotechnology, 84-86 (1-9), 153-162, 2000.
Ximenes E., Kim Y., Mosier N.S., Dien B., Ladischa M.R. Deactivation of cellulase by phenols. Enzyme and Microbial Technology, 48, 54-60, 2011.
Yang B., Wyman C.E. Pretreatment the key to unlocking low cost cellulosic ethanol. Biofuels Bioproducts Biorefining, 2, 26-40, 2007.
Zaldivar J., Martinez A., Ingram L.O. Effect of selected aldehydes on the growth and fermentation of ethanologenic Escherichia coli. Biotechnology and Bioengineering, 65, 24-33, 1999.
Zanuttini M.A., Marzocchi V.A., Mocchiutti P.Alkaline peroxide treatment for improving the papermaking properties of recycled unbleached softwood kraft pulps, Cellulose Chemistry and Technology, 43 (1-3), 65-69, 2009.
Zhao X.Q., Bai F.W. Mechanisms of yeast stress tolerance and its manipulation for efficient fuel ethanol production. Journal of Biotechnology, 144 (1), 23-30, 2009.

113
Chapter5
EnzymaticHydrolysisperformedin
bioreactor

114
5. Enzymatic Hydrolysis performed in bioreactor
5.1 Introduction
The aim of this study has been to optimize the enzymatic hydrolysis step by performing it in a bioreactor (Infors AG, Bottmingen Switzerland), with a working volume of 500ml. The procedure followed is similar to which used by working with glass flasks that it has been described in the previous chapter (§4.5.3).
The use of a bioreactor enhance the mixing of SCB-material pretreated, increasing the power of stirring. So, it’s possible to obtain smaller size particles in the agglomerate, achieving a uniform suspension of material-pretreated (Pereira et al., 2011). In this way, the cellulosic fraction becomes more easily accessible for the enzymes. In fact, several studies have proved that a glucose concentration yield by enzymatic hydrolysis is lower when the mixing is inadequate (Bylund et al, 1998; Schweder et al., 1999; Enfors, 2001).
5.2 Experimental design
Enzymatic hydrolysis experiments (Fig. 5.1) have been carried out by using 10 wt % WIS with no-washed SCB (whole slurry samples) pretreated with 2% SO2, 1%H2O2 and 0.2%H2O2, as previously described (§4.5.1).
Obtained results have been compared with whose achieved performing hydrolysis in glass flasks, for washed and no-washed samples.
This analysis is significant to evaluate the importance of perfect SCB-pretreated mixing and, overall, to evaluate the possibility to bypass washing step that is an economical relevant obstacle to get a profitable bioethanol synthesis.
In fact, the washing step includes two phases, mechanical compression and pretreated biomass washing that are a further economical and energetic cost for the whole process. Moreover, the main advantage of the washing step is the separation from the solid of the liquid fraction, which is xylose rich.
Recoverd xylose could be used for ethanol fermentation, cellulase enzyme production (Szengyel et al., 1997) or can be transformed to other valuable products. But, in bioethanol synthesis, this amount si very low and so this advantage is almost negligible.
Cellic® Ctec2 enzyme has been still used and two parallel experimental conditions on the enzymatic loading were analyzed, 10FPU/g and 20FPU/g of fibrous material, in order to verify if increasing cellulases dosage in the process can enhance the yield and rate of the hydrolysis.

115
Fig 5.1 Scheme of experimental design
5.3 Material and Method
Enzymatic hydrolysis has been performed in a 2 l bioreactor (Infors AG, Bottmingen Switzerland; Fig 5.2), at 45 °C, pH 4.8-4.9 (0.1 M sodium acetate buffer) using overhead stirring at 300 rpm average agitation speed, for 48 hours.
Buffer has been added to a final weight of 500g. Samples have been taken for carbohydrate analysis after 24 and 48 hours. All enzymatic hydrolysis trials have been carried out in two parallel runs and the average of the two runs used.

116
.
Fig 5.2 Bioreactor (Infors AG, Bottmingen Switzerland)
The concentration of fermentable sugars in hydrolyzed liquid is separated by HPLC, using Aminex HPX-87P column (Bio-Rad, Hercules, CA, USA), as previously described (§4.5.4).
5.4 Results and Discussion
For each pretreatment condition tested, the concentration of glucose and xylose (g/l) achieved in the hydrolyzed liquid has been analyzed and it has been compared with the yields obtained, after 48 h and at the plateau state, for enzymatic hydrolysis performed in glass flasks (Fig. 5.3).

117
Fig 5.3 The final yields of glucose and xylose in the whole slurry samples hydrolyzed by using bioreactor and glass flasks
Comparing the final percent yields of glucose and xylose, between samples hydrolized in bioreactor and whole slurry samples hydrolyzed in glass flasks, it’s possible to state that: bioreactor enhances strongly biomass conversion to fermentable sugars.
In particular, analazyng the data it’s possible to note that:
� by working with 10FPU/g, by using a bioreactor, there is an average enhancement of final percent yields achivied equal around 29% for glucose and 9% for xylose respect to enzymatic hydrolysis performed in glass flasks. This result proves the importance of an appropriare stirring rate. In fact, comparing results obtained operating at the same conditions (impregnating agents, enzymatic load, absence of
0
10
20
30
40
50
SO2 1%H2O2 0,2% H2O2
Yie
ld (
%)
Xylose -10 wt% WIS
10 FPU/g in bioreactor (48h)
20FPU/g in bioreactor (48h)
10FPU/g in flasks (48h)
10FPU/g in flasks (plateau)
after 48h in bioreactor
at plateau state in flasks
0
10
20
30
40
50
SO2 1%H2O2 0,2% H2O2
Yie
ld (
%)
Glucose-10 wt% WIS
10 FPU/g in bioreactor (48h)
20FPU/g in bioreactor (48h)
10FPU/g in flasks (48h)
10FPU/g in flasks (plateau)

118
washing phase), it’s possible to note how bioreactor using improve biomass conversion to glucose over 150% .
� Enhancing enzymatic load clearly improves biomass conversion to fermentable sugar. In fact, by using 20 FPU/g in bioreactor, there is an average enhancement of final percent yields achivied equal around 38% for glucose and 11% for xylose respect to conversion achieved with glass flasks.
A comparison between the final yields of glucose and xylose achieved in non-washed hydrolyzed samples by using bioreactor and in washed hydrolyzed samples by using glass flasks is showed in figure 5.4.
Fig 5.4 The final yields of glucose and xylose in the whole slurry samples hydrolyzed by using bioreactor and washed samples hydrolyzed by using glass flasks
0
10
20
30
40
50
SO2 1%H2O2 0,2% H2O2
Yie
ld (
%)
Glucose-10 wt% WIS
10 FPU/g in bioreactor (48h)
20FPU/g in bioreactor (48h)
10FPU/g in flasks (48h) washed
10FPU/g in flasks (plateau) washed
0
5
10
15
20
25
30
SO2 1%H2O2 0,2% H2O2
Yie
ld (
%)
Xylose -10 wt% WIS
10 FPU/g in bioreactor (48h)
20FPU/g in bioreactor (48h)
10FPU/g in flasks (plateau) washed
10FPU/g in flasks (48h) washed

119
By data obtained, it’s possible to note that:
� In SO2-samples hydrolyzed with 10 FPU/g, the glucose percent yield achieved by using bioreactor enhance about 3,5% respect to glucose production obtained, after 48 hours, in glass flasks. However, the glucose yields obtained after 48 hours in samples hydrolyzed in bioreactor are around 4% lower than those obtained in flasks at plateau.
� On the other hand, by using 20 FPU/g, the final conversion enhancement equal around 5 and 13% respect to those obtained in glass flasks, after 48 hours and at plateau, respectively.
� In H2O2-samples hydrolyzed in bioreactor, by working with 10FPU/g, the glucose final yield is lower than that achieved in glass flasks, both after 48 hours that at plateau. This is due to formation of phenol and of other lignin derived compounds which strongly negative affect enzyme activity (§4.5).
� Instead, working with 20FPU/g, the glucose final yields in bioreactor present an improving equal to 4,5 and 9% than those obtained respectively after 48 hours and at plateau time, in glass flasks.
� In all samples examined, xylose yields obtained by using a bioreactor were significantly higher than those obtained performing hydrolysis step in glass flasks. In particular, SO2- samples hydrolyzed in bioreactor show an enhancement of xylose final yield equal about 18% for 10FPU/g and 20% for 20FPU/g than that obtained in glass flasks, both after 48 hours and at plateau.
It is possible to conclude that, for SO2-pretreated samples, working with an amount equal to 10FPU/g of enzyme load and enhancing the mixing of SCB-material pretreated, it is possible to increase the yields of glucose and xylose respect to those obtained after 48 hours in whole slurry and washed samples hydrolyzed in glass flasks.
On the other hand, by using H2O2 as impregnating agent, performing enzymatic hydrolysis in bioreactor strongly improve biomass conversion to fermentable sugars but in this case the washing step is crucial to remove inhibitory compounds present. To overcome this problem it’s possible to enhance enzymatic load.
As matter of fact, working with an amount equal to 20FPU/g of enzyme load and enhancing the mixing of SCB-material pretreated, it is possible to obtain glucose and xylose yields, even after 48hours of enzymatic hydrolysis, higher than final yield achieved by enzymatic hydrolysis in glass flasks. Glucose and xylose improving obtained, increasing the dosage of enzyme in the process to 20FPU/g, are reported in the figure below (fig 5.5).

120
0
10
20
30
40
50
SO2 1%H2O2 0,2% H2O2
Co
nce
ntr
ati
on
(g
/L)
Glucose -10 wt% WIS
24 hours
48 hours
0
10
20
30
40
50
SO2 1%H2O2 0,2% H2O2
Co
nce
ntr
ati
on
(g
/L)
Xylose -10 wt% WIS
24 hours
48 hours
10 FPU/g10 FPU/g
0
10
20
30
40
50
60
SO2 1%H2O2 0,2% H2O2
Co
nce
ntr
ati
on
(g
/L)
Glucose -10 wt% WIS
24 hours
48 hours
20 FPU/g
0
10
20
30
40
50
60
SO2 1%H2O2 0,2% H2O2
Co
nce
ntr
ati
on
(g
/L)
Xylose -10 wt% WIS
24 hours
48 hours
20 FPU/g
Fig 5.5 Comparison between the final yields of glucose and xylose obtained in the samples hydrolyzed in bioreactor and by working with two different enzymatic dosages
By the analysis of obtained data, it is possible to note that, in case of SCB pretreated with SO2, the achieved glucose concentration values after 24 h results to be around 40g/l and 48 g/l, working to 10 and 20 FPU/g, respectively. After 48h, the glucose yield results to be around 46 g/l, by using 10FPU/g and 59 g/l, working to 20 FPU/g. So, by working with 20FPU, an increasing of conversion rate is achieved. In fact, already after 24 hours with 20 FPU, it’s achieved a conversion equal around to the conversion obtained by working with 10FPU after 48 hours of reaction.
Xylose concentration in these hydrolysates was also considerable, around 25g/l and 29 g/l, using 10 and 20 FPU/g respectively. As obtained in previous experiments (§4.5), after 48 h, glucose and xylose final concentrations has been the lowest in samples pretreated with 1% and 0.2%H2O2
impregnating agent. In 1% H2O2-hydrolysates, glucose concentration achieved has been equal about 40g/l and 6g/l to 10FPU/g, and about 46g/l and 9 g/l to 20FPU/g. Instead, the glucose and xylose concentration values produced in 0,2% H2O2-hydrolysates has been about 34g/l and 6g/l to 10FPU/g, and approximately 44g/l and 7 g/l by working with 20FPU/g.
The final glucose and xylose yields (%) have been calculated as previously descripted (§4.5) and they are showed in the table 5.2.
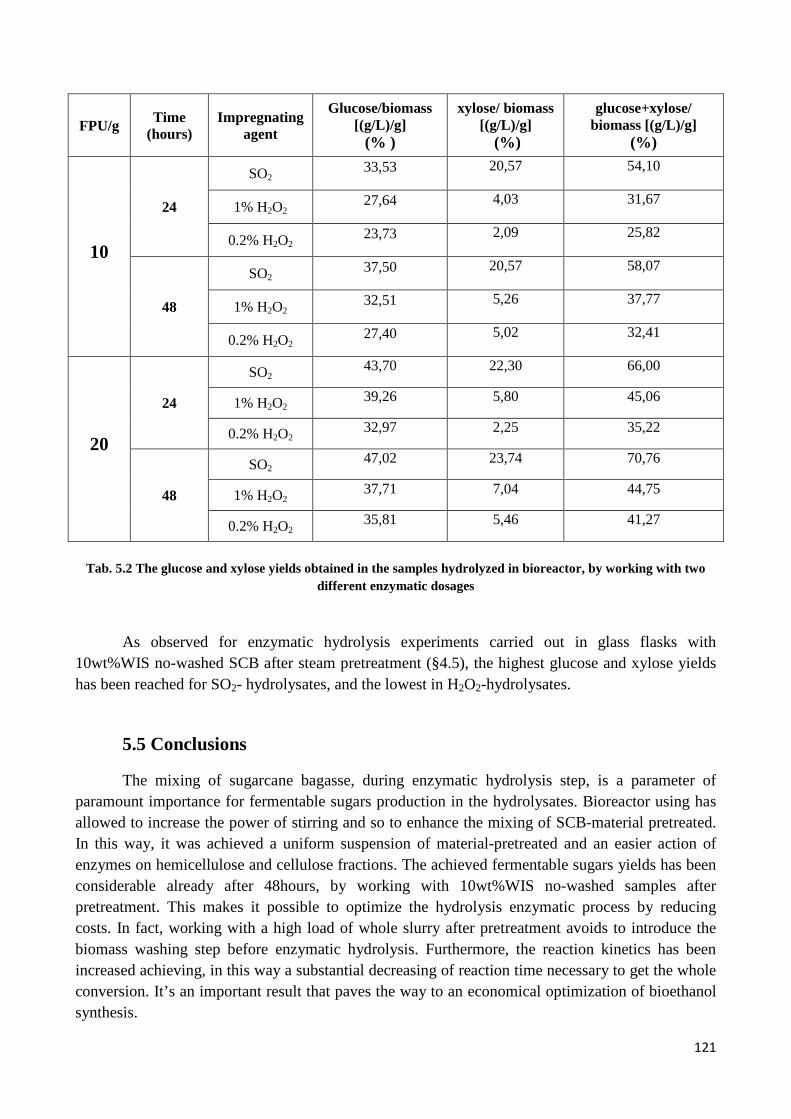
121
FPU/g Time (hours)
Impregnating agent
Glucose/biomass [(g/L)/g]
(% )
xylose/ biomass [(g/L)/g]
(%)
glucose+xylose/ biomass [(g/L)/g]
(%)
10
24
SO2 33,53 20,57 54,10
1% H2O2 27,64 4,03 31,67
0.2% H2O2 23,73 2,09 25,82
48
SO2 37,50 20,57 58,07
1% H2O2 32,51 5,26 37,77
0.2% H2O2 27,40 5,02 32,41
20
24
SO2 43,70 22,30 66,00
1% H2O2 39,26 5,80 45,06
0.2% H2O2 32,97 2,25 35,22
48
SO2 47,02 23,74 70,76
1% H2O2 37,71 7,04 44,75
0.2% H2O2 35,81 5,46 41,27
Tab. 5.2 The glucose and xylose yields obtained in the samples hydrolyzed in bioreactor, by working with two different enzymatic dosages
As observed for enzymatic hydrolysis experiments carried out in glass flasks with
10wt%WIS no-washed SCB after steam pretreatment (§4.5), the highest glucose and xylose yields has been reached for SO2- hydrolysates, and the lowest in H2O2-hydrolysates.
5.5 Conclusions
The mixing of sugarcane bagasse, during enzymatic hydrolysis step, is a parameter of paramount importance for fermentable sugars production in the hydrolysates. Bioreactor using has allowed to increase the power of stirring and so to enhance the mixing of SCB-material pretreated. In this way, it was achieved a uniform suspension of material-pretreated and an easier action of enzymes on hemicellulose and cellulose fractions. The achieved fermentable sugars yields has been considerable already after 48hours, by working with 10wt%WIS no-washed samples after pretreatment. This makes it possible to optimize the hydrolysis enzymatic process by reducing costs. In fact, working with a high load of whole slurry after pretreatment avoids to introduce the biomass washing step before enzymatic hydrolysis. Furthermore, the reaction kinetics has been increased achieving, in this way a substantial decreasing of reaction time necessary to get the whole conversion. It’s an important result that paves the way to an economical optimization of bioethanol synthesis.

122
The yield and rate of the hydrolysis is considerably enhanced by increasing the dosage of cellulases in the process. However, in according with Sun and Cheng, 2002, by increasing enzyme load, the cost of the process increase significantly (Sun and Cheng, 2002). Currently, enzyme cost in cellulosic ethanol production is about 10-15c€/l which is about 20-25% of the total costs (Sassner et al, 2008; Lynd et al., 2008). This could be cut down by:
• using cheaper enzymes; • increasing the cellulase activity by optimization of enzyme components (Sun and Cheng,
2002); • decreasing unproductive enzyme binding (Eriksson et al., 2002)
• recycling enzyme(Galbe et al., 1990).
A proposed method to obtain more convenient cellulases is the immobilization of enzymes (Cao, 2005) which the main advantage is an easier recovery and reuse of the catalysts for more reaction loops. Also, enzyme immobilization frequently results in improved thermostability and resistance to shear inactivation and so, in general, it can help to extend the enzymes lifetime (Hong et al., 2008).
The experimental activity, carried out at ENEA Italian National Agency for New Technologies, Energy and Sustainable Economical Development, Technical Unit of Trisaia, under the supervision of Dr. Isabella De Bari, has been focused on the study of cellulase enzyme immobilization by using of particular support in order to enhance cellulases efficiency. This study was explained in the chapter 6.
5.6 References
Bylund F, Collet E, Enfors SO, Larsson G. Substrate gradient formation in the large-scale bioreactor lowers cell yield and increases by-product formation. Bioprocess Engineering, 18 (3), 171, 1998.
Cao, L. (2005). Carrier-bound Immobilized Enzymes, Principles, Applications and Design, Book, Wiley-VCH Verlag GmbH & Co.KGaA, Weinheim, ISBN-13: 978-3-527-31232-0; ISBN-10: 4-527-31232-3, 2005.
Enfors S.O., Jahic M., Rozkov A., Xu B., Hecker M., Jürgen B., Krüger E., Schweder T., Hamer G., O'Beirne D., Noisommit-Rizzi N., Reuss M., Boone L., Hewitt C., McFarlane C., Nienow A., Kovacs T., Trägårdh C., Fuchs L., Revstedt J., Friberg P.C., Hjertager B., Blomsten G., Skogman H., Hjort S., Hoeks F., Lin H.Y., Neubauer P., van der Lans R., Luyben K., Vrabel P., Manelius A. Physiological responses to mixing in large scale bioreactors. Journal of biotechnology, 85 (2), 175-185, 2001.
Eriksson .T, Börjesson J., Tjerneld F. Mechanism of surfactant effect in enzymatic hydrolysis of lignocellulose. Enzyme and Microbial Technology, 31, 353-364, 2002.
Galbe M., Eklund R., Zacchi G. Adsorption of cellulases on steam pretreated willow. Applied biochemistry and biotechnology, 24/25, 87-101, 1990.

123
Hong, J.; Xu, D.; Gong, P.; Yu, J.; Ma, H. & Yao, S. Covalent-bonded immobilization of enzyme on hydrophilic polymer covering magnetic nanogels. Microporous and mesoporous materials, 109 (1-3), 470-477, 2008.
Lynd L.R., Laser M.S., Bransby D., Dale B.E., Davison B., Hamilton R., Himmel M., Keller M., McMillan J.D., Sheehan J., Wyman C.E. How biotech can transform biofuels. Nature Biotechnology, 26, 169-172, 2008.
Pereira L.T., Pereira L.T., Texeira R.S., Bon E.P., Pereira F.S. Sugar cane bagasse enzymatic hydrolysis: rheological data as criteria for impeller selection, Journal of Industrial microbiology and biotechnology, 38 (8), 901-907.
Sassner P., Galbe M., Zacchi G. Techno-economic evaluation of bioethanol production from three different lignocellulosic materials. Biomass and Bioenergy, 32,422-430, 2008.
Schweder T., Krüger E., Bo X., Jürgen B., Blomsten G., Enfors S.O.Monitoring of Genes that Respond to Process Related Stress in Large Scale Bioprocesses. Biotechnology and Bioengineering, 65, 151-159, 1999.
Sun Y., Cheng J. Hydrolysis of lignocellulosic materials for ethanol production: a review. Bioresource Technology, 83, 1–11, 2002.
Szengyel Z., Zacchi G., Réczey, K. Cellulase production based on hemicellulose hydrolysate from steam pretreated willow. Applied biochemistry and biotechnology, 63-65 (1), 351-362, 1997.

124
Chapter6
ImmobilizationofenzymeonEpoxy
supports.

125
6. Immobilization of enzyme on Epoxy supports.
6.1 Introduction
The use of enzymes in the hydrolysis of cellulose is very advantageous because enzymes are highly specific and can work at mild process conditions (Galbe and Zacchi, 2002).
Despite these advantages, the use of enzymes in industrial applications is still limited by several factors: most enzymes are relatively unstable at high temperatures, the costs of enzyme isolation and purification are high and it is quite difficult to recover them from the reaction mixtures. Currently, extensive research is being carried out on cellulases with improved thermostability (Grassick et al., 2004; Demain et al., 2005; Gusakov et al., 2005; Turner et al., 2007).
The immobilization of enzymes has been proposed to remove some limitations in the enzymatic process (Hong et al., 2008). The main advantage is an easier recovery and reuse of the catalysts for more reaction loops. Also, enzyme immobilization frequently results in improved thermostability and resistance to shear inactivation and so, in general, it can help to extend the enzymes lifetime.
The cellulase enzyme immobilization has been the main aim of the research activity carried out at the UTTRI BIOM laboratory of ENEA Italian National Agency for New Technologies, Energy and Sustainable Economical Development, Technical Unit of Trisaia, under the supervision of Dr. Isabella De Bari. In this study preliminary results have been obtained by using of epoxy support (Sepabeads® EC-EP403/S), a particular support to perform a very easy immobilization-stabilization of commercial cellulase enzymes.
6.2 Immobilization of enzyme
In enzymatic hydrolysis process, the final yield and rate of fermentable sugars is considerably enhanced by increasing the dosage of cellulases (§5.4 and 5.5). One typical index used to evaluate the performances of the cellulase preparations during the enzymatic hydrolysis is conversion rate expressed as obtained glucose concentration per time required to achieve it (g glucose/l/h). Some authors reported conversion rates of softwoods substrates (5%w/v solids loading) in the range 0.3-1.2 g/l/h (Berlin et al., 2007). However, in according with Sun and Cheng, by increasing enzyme load, the cost of the process increases significantly (Sun and Cheng, 2002). In general, compromise conditions are necessary between enzymes dosages and process time to contain the process costs. In 2001, the cost to produce cellulase enzymes was 60-90 c€/l (0.8-1.32$/liter). In order to reduce the cost of cellulases for bioethanol production, in 2000 the National Renewable Laboratory (NREL) of USA has started collaborations with Genencor Corporation and Novozymes. Similarly, collaboration between Novozymes and NREL has yielded a cost reduction of about 30-fold since 2001 (Mathew et al., 2008). Currently, enzyme cost in cellulosic ethanol production is about 10-15 c€/l which is about 20-25% of the total costs (Sassner et al, 2008; Lynd et al., 2008).

126
So, thanks to the latest breakthroughs in the research for improving enzymes synthesys, nowadays most enzymes are produced for a commercially acceptable price. Nonetheless, the industrial utilization of cellulases could be even more convenient by improving their stability in long-term operations and by developing methods/processes for the downstream recovery and reuse. These objectives can be achieved by the immobilization of the enzymes (Cao, 2005).
The main advantages of the enzyme immobilization are:
1. more convenient handling of enzymes
2. easy separation from the product
3. none or minimal protein contamination of the product
4. possible recovery and reuse of enzymes
5. enhanced stability under different storage and operational conditions (e.g. towards denaturation by heat or organic solvents or by autolysis) (Sheldon, 2007).
The main methods of enzyme immobilization can be classified into four classes: support
binding (carrier), entrapment, encapsulation and cross-linking (Fig. 6.1).
Support binding is based on fixing the enzyme to the external or internal surface of a substrate, by physical (adsorption), ionic or covalent bonding. Adsorption is a simple and inexpensive method of immobilization which does not modify the enzyme chemical structure. However, it does not produce strong bonds between enzyme and substrate and this could cause a progressive lost of the enzyme from the support. Ionic-binding determines a strong bond between enzyme and support. The supports may be functionalized with a variety of chemical groups to achieve the ionic interaction, including quaternary ammonium, diethylaminoethyl and carboxymethyl derivates (Brady and Joordan, 2009).
Covalent binding is the most widely used method of immobilization. In this method, the amino group of lysine is typically used as point of covalent attachment (Brady and Joordan, 2009). Lysine is a very common amino-acid presents in proteins, often localized on their surface. It has a good reactivity and provides acceptable bonds stability (Krenkova and Forest, 2004). Supports containing epoxy groups are widely used in the immobilization by covalent binding. These can react with lysine and with many other nucleophilic groups on the protein surface (e.g. Cys, Hys, and Tyr). Epoxy groups also react, in a slower way, with carboxylic groups (Mateo et al., 2007). The support used in this immobilization method is typically a prefabricated carrier, such as synthetic resins, biopolymers, inorganic polymers such as silica or zeolites.
Entrapment is based on inclusion of the enzyme in a polymer network (i.e. organic polymer, silica sol-gel).
Unlike the previous methods, entrapment requires the synthesis of the polymeric network in the presence of the enzyme (Sheldon, 2007). This method has the advantage of protecting the enzyme from direct contact with the environment, reducing the effects of mechanical sheer and hydrophobic solvents. However, only low amount of enzymes can be immobilized (Lalonde and Margolin, 2002).

127
Encapsulation is a method similar to entrapment, but, in this case, the enzyme is enclosed in a membrane that acts as a physical barrier around it (Cao L., 2005). The disadvantage is that entrapping or encapsulating matrix offer a certain resistance to the substrates diffusion.
Cross-linking results in the formation of enzyme aggregates by using bifunctional reagent, like glutaraldehyde, able to bind enzymes to each other without resorting to any support. In 1996, cross-linked enzyme crystals (CLEC) were commercialized by Altus Biologics (Margolin, 1996). However, CLEC formation requires laborious and expensive processes of protein purification and it is applicable only to crystallisable enzymes. In addition, only one kind of enzyme can be used in the CLEC formation (Brady and Joordan, 2009). In 2001 a less-expensive method, known as CLEA (cross linked enzyme aggregates) was developed in Sheldon´s Laboratory and commercialized by CLEA Technologies (Netherlands), (Sheldon et al., 2005).
Fig. 6.1 Enzyme immobilization strategies: (a) support binding, (b) entrapment, (c) encapsulation and (d) cross-
linking. Enzymes are represented by circles
Recently a new method has been developed, especially suitable for lipase immobilization. It is defined Spherezymes and it is based on the formation of a water-in-oil emulsion, in which lipases and surfactant are dissolved. Following the addition of a bifunctional cross-linker, permanent spherical particles of enzyme are generated (Brady and Joordan, 2009).
The most interesting immobilization procedures are in the area of covalent binding. Supports containing epoxy groups are widely used in the immobilization by covalent binding because these generate intense multipoint covalent attachment with different nucleophiles present on the surface of the enzyme molecules (Mateo et al., 2007). One limitation of epoxy supports is the slow reaction of immobilization. To overcome this problem, Mateo and coworkers have designed epoxy supports able to ensure a mild physical adsorption of the enzymes followed by a very fast intramolecular covalent binding with the material epoxy groups. These supports were used to immobilize and stabilize enzymes such as glutaryl acylase (Mateo et al., 2001), ß-galactosidase from Thermus sp. 12 (Pessela et al., 2003), and peroxidase (Abad et al., 2002). Epoxy supports, known as Sepabeads® are marketed by Resindion s.r.l. and quickly have begun to supersede another commercial support,

128
known as Eupergit. This last is a microporous, epoxy-activated acrylic beads with a diameter of 100-250µ, used for a wide variety of different enzymes (Boller et al., 2002).
6.3 Immobilization of cellulases: status of art
In literature, only few papers are available on the cellulases immobilization. This is due to the fact that cellulose is not soluble and some immobilization techniques, such as enzymes entrapment, impede the interaction enzyme-substrate. Immobilization of cellulases via covalent bonds appears to be the most suitable technique. Besides the enzyme stabilization, the covalent-immobilization allows the use of supported enzymes for several cycles of reactions (Brady & Joordan, 2009; Li et al., 2007; Mateo et al., 2007; Dourado et al., 2002; Yuan et al., 1999).
In 1999, Yuan and coworkers, immobilized cellulases onto acrylamide grafted acrylonitrile copolymer membranes (PAN) by means of glutaraldehyde. They showed that the enzyme stability was increased after the immobilization process. Also, the activity of the immobilized cellulases was higher than the free cellulases at pH 3 - 5 and at temperatures above 45 °C (Yuan et al., 1999).
In 2002, cellulases from T. reesei were immobilized on Eudragit L-100 by researchers of the University of Minho (Portugal). They used the commercial mixture Celluclast® 1.5L supplied by Novozymes (Denmark). This method allowed to improve the stability of the enzymes without significant loss of its specific activity. The adsorption of cellulases on Eudragit lowered the enthalpy of denaturation, but affected only slightly the denaturation temperature (Dourado et al., 2002).
In 2006, Li and coworkers immobilized cellulase enzymes by means of liposomes. These are phospholipid vesicle, ranging in size from 25 nm to 1µm. In this method, glutaraldehyde-activated liposome bound to the enzyme thus forming the liposome-cellulase complex. Following this step, the complex was immobilized on chitosan-gel. The immobilized enzyme by the liposome molecules showed efficiency higher by 10% compared to the enzyme immobilized in chitosan-gel without liposome. The immobilized cellulase-liposome complex showed a loss of activity of 20% with respect to the original value after six cycles of reaction. Therefore, liposome-binding cellulase appeared to prevent or limit the enzyme deactivation (Li et al., 2007). Recently, a β-glucosidase has been immobilized on magnetic particles activated by cyanuric and polyglutaraldehyde groups. This study has show that immobilized-β-glucosidase activity is retained after five cycles of reaction (Alftrén and Hobley, 2011).
6.4 Immobilization of enzymes on epoxy supports
Epoxy supports are ideal matrices to perform a very easy immobilization–stabilization of proteins via multipoint covalent attachment (Mateo et al., 2007). These supports display short spacer arms which may react with many nucleophilic groups present on the protein surface (e.g., Lys, Cys, His, Tyr) and, in a slower way, with carboxylic groups (Fig. 6.2-6.3; Mateo et al., 2007).

129
Fig. 6.2 Proteins bind to epoxide groups on the SuperEpoxy surface. Primary amines (lysine shown) on the
protein surface act as nucleophiles, attacking epoxy groups and coupling the protein covalently to the surface
Fig 6.3 Reactive epoxide surface chemistry binds proteins covalently in several different ways and, therefore, a high number of protein molecules can be captured on the surface for various binding reactions

130
The enzyme-immobilization onto epoxy support follows a two-step mechanism (Guisan, 2006) :
1. Rapid physical or chemical fixation of protein on the support surface (through different regions of the protein surface);
2. Promotion of intramolecular multipoint attachment between the epoxy groups of the support and the nucleophiles placed in the vicinity of the region of the protein participating in the first fixation. The first step is promoted by a low concentration of chemical moieties included on epoxy
supports (easily introduced on a few epoxy groups). Each chemical moiety promotes different interactions involving different regions of the protein surface. Epoxy groups also react, in a slower way, with carboxylic groups (Mateo et al., 2001). Table 6.1 shows some examples of different chemical moieties able to promote a rapid physical or chemical binding of proteins to epoxy supports, under very mild conditions (Mateo et al., 2007).
Table 6.1 Different groups that may be used in promote a rapid physical or chemical binding of proteins to
epoxy supports, under very mild conditions
The second step is promoted by epoxy groups. Although long-term incubation of the already immobilized proteins under neutral pH may promote the formation of a few covalent linkages between the protein and the epoxy groups in the support (Katchalski-Katzir and Kraemer, 2000). The highest intensity of multipoint covalent attachment is achieved via a long-term incubation under alkaline conditions because of the increase in the reactivity of nucleophiles (mainly Lys residues usually present on the protein surface) (Mateo et al., 2002; Mateo et al. 2000) (Fig. 6.4).

131
Fig. 6.4 (a) Physical or chemical immobilization of proteins (blue). Groups in the protein able to interact with the groups in the support. Groups in the support able to promote a rapid physical or chemical fixation of the protein
on the support surface. (b) Multipoint reaction of nucleophiles of immobilized proteins and epoxy groups
The use of several of these supports may permit the immobilization of a particular enzyme with different orientations, resulting that each preparation has very different activity, stability and selectivity (Mateo et al.,2007). Enzymes immobilized on epoxy support include: epoxyde hydrolase (A. niger) (Mateo et al., 2003), glutaryl acylase (López-Gallego et al., 2004), ß-galactosidase (Thermus sp) (Pessela et al., 2004).
In my research activity, a commercial cellulase enzyme (Celluclast® 1.5) was immobilized on epoxy Sepabeads® EC – EP support (Resindion s.rl) at alkaline conditions (pH 8). A long-term incubation of enzymes has been carried out in the mixture containing the epoxy support and buffer in order to promote immobilization via covalent linking.
6.5 Materials and method
6.5.1 Soluble Enzymes
Celluclast®1.5L (Novozymes A/S, Bagsvӕrd, Denmark) were used to test the effect of cellulases immobilization. Celluclast protein concentration was 123 mg/mL and the filter paper units (FPU) was 59.47 FPU/ml.
6.5.2 Support
Sepabeads® EC –EP403/S support (Resindion s.rl) was used to immobilize Celluclast®1.5L enzyme (Fig 6.5).

132
Fig 6.5 Sepabeads® EC –EP support (Resindion s.r.l)
6.5.3 Immobilization of enzymes on epoxy supports
The commercial enzyme was immobilized on epoxy Sepabeads® support by using 1 ml of enzyme per 0.1g of support in a buffered medium containing KH2PO4/K2HPO4 (1M, pH8), as suggested by Basso et al. on the immobilization of inulinases (Fig. 6.6; Basso et al., 2010).
Fig 6.6 Schematic representation of cellulase immobilization onto a epoxy support
The mixture was stirred at room temperature for 19h. Successively, the immobilization went on for 21h without stirring. The solution was filtered and the liquid phase was recovered for proteins determination by the Bradford's method. The resulting cellulase-supported epoxy
Particle size range (µm)
S grade M grade
100 — 300 200 — 500

133
Sepabeads® was washed three times with the same buffer solution. After the third washing, the residual proteins still adsorbed on the support were desorbed by adding 0.5M NaCl and by stirring for 45 min. The solution was filtered and the liquid phase was recovered for protein determination by Bradford's method. The immobilized biocatalysts were finally rinsed with phosphate buffer (1M, pH 8) and stored at 4°C.
6.5.4 Bradford protein assay
The proteins assays were carried out according to the Bradford's method by using the Bio-Rad kit. Bradford method is based on the action of Coomassie brilliant blue G-250 (CBBG) dye that binds specifically to residues of arginine, tryptophan, tyrosine, phenylalanine and histidine. The CBBG binds to these residues in an anionic form, with maximum absorbance at 595 nm. The dye in the stock solution is, in fact, in cationic form and it has a maximum of absorbance at 470 nm (Fig. 6.7).
Fig. 6.7 Molecular structure of Coomassie brilliant blue G-250
The binding of the dye to basic and aromatic residues determines a shift of the absorption
maximum from 465 to 595 nm, which can be measured by spectrophotometric analysis. For the assay, 1 ml of sample and 3 ml of Bradford Reagent have been used. After the addition of the reagent, test tube have been gently mixed and incubated at room temperature from 5 to 45 minutes. The marker-protein complex is stable for 60 minutes then the samples have to be analyzed within this time and possibly 10 minutes away from each other. The reading of the samples has been performed by spectrophotometry, using UNICAM UV 300Thermospectronia double beam spectrophotometer at 595 nm.
The protein amount was determined through absorbance measurements at 595 nm. The percentage of bonded enzyme was determined by the difference between the concentration of the native protein before immobilization and those residual in the filtrates after immobilization.
6.5.5 Determination of free and immobilized enzyme activity
The activity of enzymes was calculated in according to the standard procedure recommended by IUPAC (Ghose, 1987).

134
For Celluclast®1.5L, the activity of the free and immobilized enzyme was determined by the amount of glucose produced during the hydrolysis of the filter paper Whatman No.1. The tests were carried out in 0.05 M acetate buffer solutions (pH=4.8) for 60 min. The amount of reducing sugars was measured through spectrofotometric measurements in presence of 2,4-dinitrosalicylic acid reagent (DNS).
For immobilized enzyme, the samples were centrifugated and the supernatant was removed.
The enzymes activity has been calculated as the µmoles of glucose produced per min and per mg of enzymes proteins during the hydrolysis reaction:
Activity of cellulase [µmoles/(min mg)] = 1000 w/(Mvtm)
where, w is the amount (ppm) of produced glucose, M (g/ moles) is the molecular weight of the glucose, v (L) is the volume of the measured sample, t is the reaction time (min), m is the mass of the biocatalyst (milligrams).
6.5.6 Activity of free and immobilized enzyme
A solution of immobilized cellulase and an equivalent amount of free enzyme were taken, along with 50mg Whatman #1 filter paper in 0.05M acetate buffer (pH=4.8). The experiments were carried out in test tubes incubated at different temperatures ranging from 40°C to 70°C. The reaction was stopped after 60 minutes by putting the tubes in a boiling water bath for few minutes. Finally, the glucose released by the free and immobilized cellulases at different temperatures were measured and compared.
6.6 Results
6.6.1 Kinetic study of Celluclast enzyme immobilization
Celluclast®1.5 enzyme immobilization on epoxy Sepabeads® support has been carried out via incubation at 25 °C for 40 h. Kinetic analysis has been performed by the measurement of the proteins remaining in solution through the incubation time. Obtained data are showed in Table 6.2, where the amount of immobilized proteins (absorbed-linked proteins) is expressed as percentage of proteins total amount present in the sample. They have been calculated as complement to the residual proteins in solution.
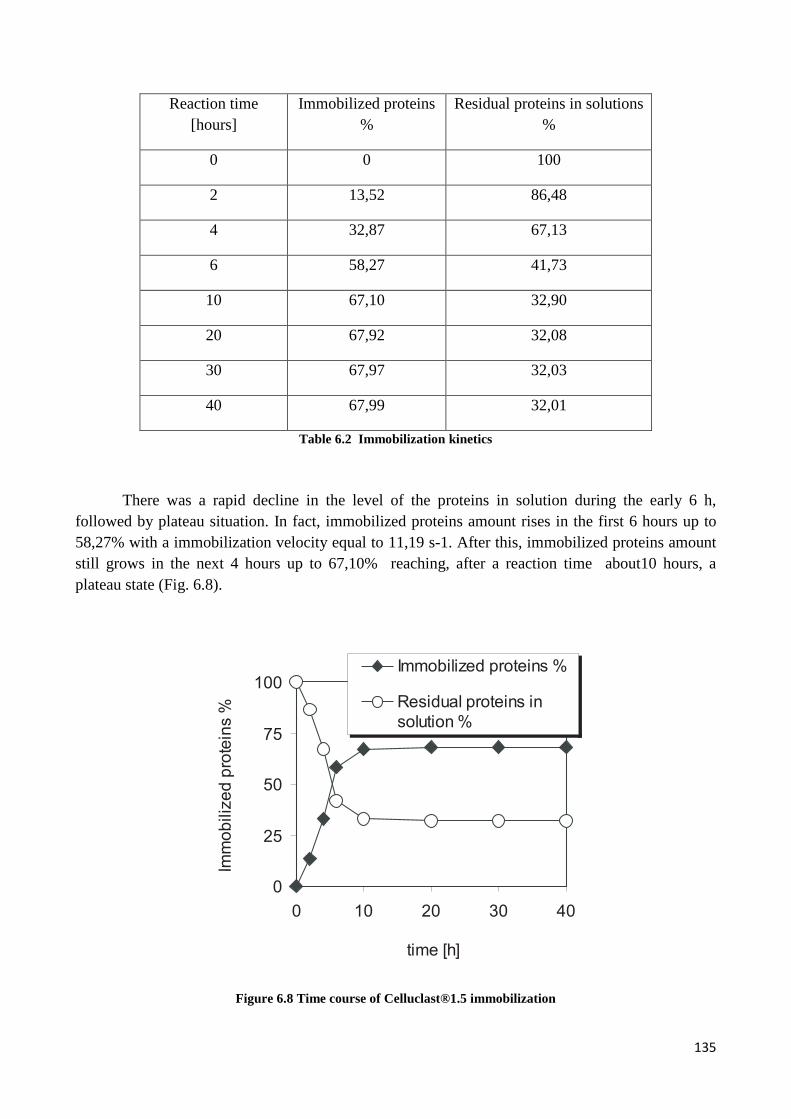
135
Reaction time [hours]
Immobilized proteins %
Residual proteins in solutions %
0 0 100
2 13,52 86,48
4 32,87 67,13
6 58,27 41,73
10 67,10 32,90
20 67,92 32,08
30 67,97 32,03
40 67,99 32,01
Table 6.2 Immobilization kinetics
There was a rapid decline in the level of the proteins in solution during the early 6 h, followed by plateau situation. In fact, immobilized proteins amount rises in the first 6 hours up to 58,27% with a immobilization velocity equal to 11,19 s-1. After this, immobilized proteins amount still grows in the next 4 hours up to 67,10% reaching, after a reaction time about10 hours, a plateau state (Fig. 6.8).
Figure 6.8 Time course of Celluclast®1.5 immobilization

136
These results are very important in order to optimize enzyme immobilization reaction time. At the end of the immobilization process, data reports that the proteins immobilized on epoxy Sepabeads® at pH 8 were 68% of the initial loading, obtaining a final product with a ratio of 0.66 proteins grams per support grams. The amount of proteins released during the support washing was of the order of few percents. This implies that following the immobilization at pH 8, the proteins were covalently linked to the support.
6.6.2 Study of enzyme activity at alkaline pH 8
In order to analyze if the use of alkaline pH during the enzymes immobilization could have affected the enzymes activity, samples of free and immobilized enzyme were suspended in buffer solution at pH 8. The activities were determined by spectrophotometric analysis. The results are summarized in Figure 6.9 where the control represents the Celluclast activity at pH 4.8 (50°C).
Figure 6.9 Enzyme activity at pH 8
Data show that the use of pH 8 during the enzymes immobilization partially affected the enzymes activity. However, the activity of the free cellulases incubated in alkaline medium without the expoxy support is even lower than immobilized enzyme one. This implies that the presence of support reduced the enzyme denaturation caused by the pH of the immobilization step.
6.6.3 Thermal stability analysis
In order to compare the activities of the free and immobilized enzyme a series of tests have been performed at different reaction temperatures. Table 6.3 shows the reaction parameters.
0
0.1
0.2
0.3
0.4
0.5
0.6
0.7
0.8
control immobilized enzymes
non- immobilizedenzymes
cellu
lase
sac
tivity
(µm
olm
in-1
mg
-1)

137
Parameter Range investigated
Enzyme Free/Immobilized
Temperature 40,60,70°C
pH 4,8-5
Reaction Time 60min
Table 6.3 Reaction parameters of enzymatic activity calculation
To compare immobilized and free enzyme performance, the FPU activities of the immobilized Celluclast were measured in similar conditions at 40, 60 and 70°C. Figure 6.10 shows the activity of the free and immobilized enzymes as function of temperature.
Fig. 6.10 Comparison between free and immobilized enzyme
According with literature data, free enzyme activity present a trend with a maximum at
around 60 °C followed by a strong decreasing. This result confirms enzyme deactivation at high temperature (Aymard and Belarbi, 2000).
The activity of the immobilized enzyme is lower than the corresponding activity of the free enzyme. However the immobilized enzyme activity is continuous increasing with the temperature rising.
The trend does not present a pick of maximum and moreover the pendency of the curve increases for higher temperature.

138
Activity should be expressed as function of reciprocal of temperature, as reported in figure 6.11, where it is evident that an Arrhenius behaviour should be estimated for immobilized enzyme:
Activity = 3,9365 e-755,3(1/T)
Figure 6.11 Activity as function of temperature: Arrhenius behavior
These results clearly show as immobilized enzyme present a great thermal stability with no thermal deactivation for high temperature process and overall, immobilized enzyme activity overcome free enzyme activity for temperature higher than 70 °C.
This is a key step for hydrolysis process optimization, in fact, crossing these data with kinetic analysis of hydrolysis step in function of temperature is possible to achieve the whole optimization of hydrolysis reaction parameters.
6.7 Conclusions and outlook
The results presented in this thesis are very interesting. As matter of fact, Epoxy Sepabeads® EC-EP403/S support has a good capacity to immobilize the enzymatic components in Celluclast® rapidly and with an overall efficiency close to 70%.
The kinetic analysis of this process has showed as proteins immobilization presents a strong increasing of immobilized enzyme amount in the first 6 hours of the processing then followed by a slow decline over the next 34 h. This result is a preliminary step to achieve the operative and economic optimization of the immobilization process.
By a comparison between free and immobilized enzyme activity, it’s showed as, in the investigated range, immobilized enzyme present a higher thermal stability respect to free enzyme.

139
In fact, immobilized doesn’t suffer of thermal deactivation and for temperature higher than 70 °C its activity overcome free enzyme’s one.
This analysis has to be completed with further test at higher temperature to confirm the trend of a constant increasing of immobilized enzyme activity with temperature. Other trials, for different reaction times, will be also carried out in order to confirm obtained results.
However, results presented in this thesis are quite promising in order to achieve hydrolysis process optimization.
In fact, crossing immobilized enzyme activity with a kinetic analysis of hydrolysis process it is possible to achieve an optimum range for the running temperature and, in this way, to optimize one of the fundamental parameter of the process.
6.8 References
Abad J.M., Vélez M., Santamaria C., Guisán J.M., Matheus P.R., Vázquez L., Gazaryan I., Gorton L., Gibson T., Fernández V.M. Immobilization of Peroxidase Glycoprotein on Gold Electrodes Modified with mixed epoxy-boronic acid monolayers. Journal of the American chemical Society, 124 (43), 12845–12853.
Alftrén J., Hobley T. Immobilization of β-glucosidase on magnetic particles for lignocelluloses hydrolysis. Proceedings of “XIX ISAF- International Symposium on alchol fuels”. Conference of Verona 10-14 October, 2011.
Aymard C., Belarbi A. Kinetics of thermal deactivation of enzymes: a simple three parameters phenomenological model can describe the decay of enzyme activity, irrespectively of the mechanism. Enzyme and Microbial Technology, 27 (8), 612-618, 2000.
Basso A., Spizzo P., Ferrario P., Knapic L., Savko N., Braiuca P., Ebert C., Ricca E., Calabrò V., Gardossi L. Endo- and exo-inulinases: Enzyme-substrate interaction and rational immobilization. Biotechnology Progress, 26 (2), 397-405, 2010.
Berlin A., Maximenco V., Gilkes N., Saddeler J. Optimazion of enzyme complexes for lignocelluloses hydrolysis. Biotechnology and Bioengineering, 97 (2), 287-296, 2007.
Boller T., Meier C., Menzler S. Eupergit Oxirane acrylic beads: How to Make Enzymes fit for Biocatalysis. Organic Process Research & Development, 6 (4), 509-519, 2002.
Brady D., Jordaan J. Advances in enzyme immobilisation, Biotechnology Letters, 31 (11), 1639-1650, 2009.
Cao, L. Carrier-bound Immobilized Enzymes, Principles, Applications and Design, Book, Wiley-VCH Verlag GmbH & Co.KGaA, Weinheim, ISBN-13: 978-3-527-31232-0; ISBN-10: 4-527-31232-3, 2005.
Demain A., Newcomb M, Wu J.H.D. Cellulase, clostridia and ethanol. Microbiology and Molecular Reviews, 69, 124–154, 2005.

140
Dourado F., Bastos M., Mota M., Gama F.M. Studies on the properties of Celluclast/Eudragit L-100 conjugate. Journal of Biotechnology, 99 (2), 121-131, 2002.
Galbe M. and Zacchi G. A review of the production of ethanol from softwood. Applied Microbiology and Biotechnology, 59 (6), 618-628, 2002.
Ghose T.K, Measurement of cellulase activities, Pure and applied Chemistry, 59 (2), 257-268, 1987.
Grassick A., Murray P., Thompson R., Collins C., Byrnes L., Birrane G., Higgins T., Tuohy M. Three-dimensional structure of a thermostable native cellobiohydrolase, CBH IB, and molecular characterization of the cel7 gene from the filamentous fungus, Talaromyces emersonii. European Journal of Biochemistry, 271, (22), 4495–4506, 2004.
Guisan J. Immobilization of enzymes and cells, Book, Humana Press Inc., ISBN: 1-59745-053-7, 2006.
Gusakov A.V., Sinitsyn A.P., Salanovich T.N., Bukhtojarov F.E, Markov A.V., Ustinov B.B., van Zeijl C., Punt P., Burlingame R. Purification, cloning and characterisation of two forms of thermostable and highly active cellobiohydrolase I (Cel7A) produced by the industrial strain of Chrysosporium lucknowense. Enzyme and Microbial Technology, 36 (1), 57–69, 2005.
Hong, J.; Xu, D.; Gong, P.; Yu, J.; Ma, H. & Yao, S. Covalent-bonded immobilization of enzyme on hydrophilic polymer covering magnetic nanogels. Microporous and mesoporous materials, 109 (1-3), 470-477, 2008.
Katchalski-Katzir E., Kraemer D.M. Eupergit®C, a carrier for immobilization of enzymes of industrial potential. Journal of molecular Catalysis B: Enzymatic, 10, 157–176, 2000.
Krenkova J., Foret F. Immobilized microfluidic enzymatic reactors. Electrophoresis, 25, (21-22), 3550–3563, 2004.
Lalonde J., Margolin A. Immobilization of enzymes. In: Drauz K, Waldmann H (eds), Enzyme catalysis in organic chemistry, 2nd edn. Wiley-VCH, Weinheim, 163–184, ISBN-10:3527299491, ISBN-13:978-352729949-2, 2002.
Li C., Yoshimoto M., Fukunaga K., Nakao K. Characterization and immobilization of liposome-bound cellulase for hydrolysis of insoluble cellulose. Bioresouce technology, 98 (7), 1366-1372, 2007.
López-Gallego F., Betancor L., Hidalgo A., Mateo C., Guisán J.M., Fernández-Lafuente R. Optimization of an industrial biocatalyst of glutaryl acylase. Stabilization of the enzyme by multipoint covalent attachment onto new amino-epoxysepabeads. Journal of Biotechnology, 111, 219–227, 2004.
Margolin A. Novel crystalline catalysts. Trends in Biotechnology, 14 (7), 223-230, 1996.

141
Mateo, C., Grazu, V., Palomo, J., M., Lopez-Gallego, F., Fernandez-Lafuente, R., Guisan M. J., Immobilization of enzymes on heterofunctional epoxy supports. Nature Protocols, 2, 1022-1033, 2007.
Mateo C., Archelas A., Fernández-Lafuente R., Guisan, J.M., Furstoss R. Enzymatic transformations. Immobilized A. niger epoxide hydrolase as a novel biocatalytic tool for repeated-batch hydrolytic kinetic resolution of epoxides. Organic and Biomolecular Chemistry, 1, 2739–2743, 2003.
Mateo C., Abian O., Fernández-Lorente G., Pedroche J., Fernández-Lafuente R., Guisan J.M., Tam A., Daminati M. Epoxy Sepabeads: a novel epoxy support for stabilization of industrial enzymes via very intense multipoint covalent attachment. Biotechnology Progress, 18, 629–634, 2002.
Mateo C., Fernández-Lorente G., Cortés E.; Garcia J.L., Fernández-Lafluente R., Guisan J.M.One step purification, covalent immobilization and additional stabilization of poly-His-tagged proteins using novel heterofunctional chelate-epoxy supports, Biotechnology and Bioengineering, 27 (3), 269-276, 2001.
Mateo C., Abian O., Fernandez-Lafuente R., Guisan, J.M. Increase in conformational stability of enzymes immobilized on epoxy-activated supports by favoring additional multipoint covalent attachment. Enzyme and Microbiology Technolology, 26, 509–515, 2000.
Pessela B.C.C., Mateo C., Fuentes M., Vian A., García J.L., Carrascosa A.V., Guisán J.M., Fernández-Lafuente R. Stabilization of a multimeric -galactosidase from Thermus sp. strain T2 by immobilization on novel hetero-functional epoxy supports plus aldehyde-dextran cross-linking. Biotechnology Progress, 20, 388–392 , 2004.
Pessela B.C., Mateo C., Carrascosa A.V., Vian A., García J.L., Rivas G., Alfonso C., Guisan J.M, Fernández-Lafluente R. One step purification, covalent immobilization and additional stabilization of a thermophilic polyHis-tagged beta-galactosidase from thermos sp. Strain T2 by using novel heterofunctional chelate-epoxy Sepeabeds, Biomacromolecules, 4 (1), 107-13,2003.
Sheldon R.A. Enzyme Immobilization: The quest for Optimumu Performance. Advanced Synthesis & Catalysis, 349, 1289-1307, 2007.
Sun Y., Cheng J. Hydrolysis of lignocellulosic materials for ethanol production: a review. Bioresource Technology, 83, 1–11, 2002
Turner P., Mamo G., Karlsson E.N. Potential and utilization of thermophiles and thermostable enzymes in biorefining. Microbial Cell Factories, 6 (9),1-23, 2007.
Yuan X., Shen N., Sheng J., Wei X., Immobilization of cellulase using acrylamide grafted acrylonitrile copolymer membranes. Journal of Membrane Science, 155 (1), 101-106, 1999.

142
Conclusions
In this PhD thesis several technologies to optimize advanced bioethanol synthesis have been investigated. In particular, the research carried out has been focused on two of the main step of second generation bioethanol synthesis: pretreatment by using stem-explosion technology and hydrolysis.
Steam-explosion is an effective and widely diffused method to pretreat lignocellulosic biomass in order to get a disruption of lignocellulosic structure in its main constituents. In this phase of research activity, the utilization of impregnating agents has been investigated to enhance steam-explosion performance. A comparative analysis of SO2 and H2O2 as impregnating agents has been carried out and by experimental tests, major differences in final sugars yields from bagasse hydrolyzates using different impregnating agents has been demonstrated. The yields of glucose and xylose under different pretreatment conditions provided an indication of the efficiency of the conversion of cellulose and hemicellulose to the corresponding monosaccharides.
The utilization of SO2 as impregnating agent for steam pretreatment is the most promising method respect to H2O2 impregnation and to the pretreatment without addition of chemicals agents. By working with 10wt% WIS, the achieved final glucose concentration value was around 50g/l with a final yields equal to 68% (compared with theoretical one). Xylose final concentration obtained has been considerable, it is equal to around 13 g/l while in H2O2 pretreatment glucose and xylose yields has been lower.
This result is quite important, in fact, steam-pretreatment, by using SO2 as impregnating agent, is which requires the lower pretreatment time, only 5 minutes respect 15 minutes required by the other process (with H2O2 impregnation and without any impregnating agents). This result is considerable inasmuch it leads to great advantages in terms of process energetic needs and to an effective reduction of process costs in bioethanol production.
The mixing of sugarcane bagasse, during enzymatic hydrolysis step is a parameter of paramount importance for fermentable sugars production in the hydrolysates. Bioreactor using has allowed to increase the power of stirring and so to enhance the mixing of SCB-material pretreated. The achieved fermentable sugars yields has been considerable already after 48hours, by working with 10wt%WIS no-washed samples after pretreatment.
The yield and rate of the hydrolysis is considerably enhanced by increasing the dosage of cellulases in the process, so increasing enzymatic load is way to enhance fermentable sugars production, but in this case, the high cost of enzymes could negative affect the profitability of the process.
To overcome this problem enzyme immobilization has been investigated. In fact, immobilized enzymes is a way to ensure an easier recovery and reuse of the enzyme for more reaction loops. Moreover, the immobilization is a way to enhance enzyme stability at different process conditions.

143
Epoxy Sepabeads® EC-EP403/S support has been proved to have a good capacity to immobilize the cellulose used (Celluclast® 1.5 L) rapidly and with an overall efficiency close to 70%.
The immobilization kinetic analysis of this process has showed as proteins immobilization presents a strong increasing of immobilized enzyme amount in the first 6 hours of the processing then followed by a slow decline over the next 34 h with a whole efficiency of around 70%.
By a comparison between free and immobilized enzyme activity, it’s showed as, in the investigated range, immobilized enzyme present a higher thermal stability respect to free enzyme. In fact, immobilized doesn’t suffer of thermal deactivation and for temperature higher than 70 °C its activity overcome free enzyme’s one.
However, results presented in this thesis are quite promising in order to achieve hydrolysis process optimization. In fact, crossing immobilized enzyme activity with a kinetic analysis of hydrolysis process it is possible to achieve an optimum range for the running temperature and, in this way, to optimize one of the fundamental parameter of the process.
The arguments and the deepenings on lignocelulosic bioethanol synthesys, reported in chapters 2 and 3, have been published in a book:
Verardi A.,De Bari I., Ricca E., Calabrò V. “Hydrolysis of Lignocellulosic Biomass: Current Status of Processes and Technologies and Future Perspectives”. Chapter in book “Bioethanol”. Book edited by Prof. Marco Aurelio Pinheiro Lima, Intech Publisher, ISBN 979-953-307-007-9
The experimental results and the analysis described in chapter 6 have been presented in several International Conferences:
18th European Biomass Conference & Exhibition, Lyon (France), 3-7May 2010;
IBS2010 14th International Biotechnology Symposium and Exhibition, Rimini, 14-18 September 2010.
19th European Biomass Conference & Exhibition, Berlin (Germany), 6-10 June 2011;
19th ISAF –International Symposium on alchol fules, Verona 10-14 October 2011
And they have been published in the following paper:
De Bari I., Verardi A., Calabrò V., Liuzzi F., Ricca E., Braccio G.. “Immobilization of Cellulase enzymes on epoxy sepabeads® for the hydrolysis of lignocellulosic materials”. Proceedings of “18th European Biommas Conference & Exhibition” pp. 1440-1442 ISBN: 978-88-89407-56-5.
Verardi A., Saraceno A., Calabrò V., Curcio S., Iorio I., De Bari I., Liuzzi F., Cuna D. (2010) “Modeling of an Integrated bioreactor / pervaporation system, for bioethanol production,

144
based on hybrid approach”. Proceedings of “IBS2010 14th International Biotechnology Symposium and Exhibition” (Rimini 14-18 September 2010) .
Verardi A., De Bari I., Ricca E., Calabrò V., “Hydrolysis of cellulose with immobilized cellulases: process analysis and control”. Proceedings of “19th European Biommas Conference & Exhibition”.Berlin, 6-10 giugno 2011
Verardi A., De Bari I., Blasi A.., Calabrò V., “Improving of cellulose hydrolysis by using immobilized cellulases”. Proceedings of “XIX ISAF- International Symposium on alchol fuels”.Verona 10-14 Ottobre 2011
My research results have been used to develop other research aspects of bioethanol synthesys, and they are presented to the following International Conference:
Verardi A., Saraceno A., Calabrò V., Curcio S., Iorio I., De Bari I., Liuzzi F., Cuna D. (2010) “Modeling of an Integrated bioreactor / pervaporation system, for bioethanol production, based on hybrid approach”. Visula presentation at “IBS2010 14th International Biotechnology Symposium and Exhibition” (Rimini 14-18 Settembre 2010) .
Calabrò V., De Bari I., Verardi A., Saraceno A., Curcio S., Liuzzi F. “Integrated bioreactor / pervaporation system, for bioethanol production from lignocellulosic biomass”. Oral presentation at “AMS6/IMSTEC10 – the 6th Conference of the Aseanian Membrane Society in conjunction with the 7th International Membrane Science and Technology Conference” (Sidney – Australia 22 -26 Novembre 2010) and it will be published on “Desalination” Journal.

145
Italian scenario and potential industrial application of researches developed.
In recent years, there has been increasing interest in the use of perennial grasses as energy crops. The characteristic which make perennial grasses, such as Switchgrass, Miscanthus, and Arundo donax, attractive for biomass production are their high yield potential, the high contents of lignin and cellulose of their biomass and their generally anticipated positive environmental impact (Lewandowski et al., 2003).
In Italy, the research for perennial grasses as biomass crop for energy and fibre has started in1998 and it has been developed in South Italy at ENEA Research Center of Trisaia (Rotondella - MT), by studying of 5 varieties of switchgrasses : Alamo, Blackwell, Cave-in-Rock, Forestburg and Kanlow (Fig A1). These varieties have shown a good adaptability and biomass productivity (Elbersen et al., 2001). Many reasons are given for using switchgrass as a biomass crop. These include the high net energy production per ha, low production costs, low nutrient requirements, low ash content, high water use efficiency, large range of geographic adaptation, easy of establishment by seed, adaptation to marginal soils, and potential for carbon storage in soil (Lewandowski, 2003).
Fig. A1 Four varieties of switchgrass: A) Alamo B) Cave-in-Rock C) Kanlow D) Blackwell
In Southern Italy was found at 37°latitudine, Miscanthus x giganteus (Fig. A2), a species of Miscanthus that is widely used in Europe and it is adapted to a wide range of soil conditions.

146
Fig. A2 Miscanthus x giganteus
In April 2011, in northwestern Italy, began the construction of a cellulosic ethanol plant named Italian Bio Products (IBP). The IBP will produce second generation bioethanol from variable ligno-cellulosic biomass, by using as feedstock, non-food biomass and in particular Arundo donax (giant cane; Fig. A3), a grass able to tolerate a wide variety of ecological conditions. It can grow in all types of soils from heavy clays to loose sands and gravelly soils and tolerates soils of low quality such as saline ones, too.
Fig. A3 Arundo donax
The perennial grasses as energy crops may represent a major opportunity for the agriculture of the Italy, and in particular for South of Italy whose conditions of high insolation and temperature are able to influence positively in the dry biomass production of plants "no food”.

147
In this scenario, researches developed during my PhD activity can be of fundamental importance to the production of advanced bioethanol from lignocellulosic residues.
In fact, also these varieties of biomass (Perennial grasses), which are widely present in Italy, need to be pretreated before hydrolysis step. So all the evaluation carried out by using SCB are still ready for these biomasses. Conseguently, research activity performed can be applied to improve advanced bioethanol production and market in Italy.
Utilization of immobilized enzyme can be a way to make more profitable bioethanol production from perennial grasses too.
So results obtained could be an important step for all the Europe and, in particular for Italy, in order to make the production of lignocellulosic ethanol closer to the industrialization and opening the way to new lignocellulosic biorefineries.
References
Elbersen, H. W.,. Christian D. G, El Bassen N., Bacher W., Sauerbeck G., Aleopoulou E., Sharma N., Piscioneri I., De Visser P., and Van Den Berg D.2001. Switchgrass Variety choice in Europe. Aspects of Applied Biology, 65, 21-28, 2001.
Lewandowski I., Scurlock J.M.O., Lindvall E., Christou M. The development and current status of perennial rhizomatous grasses as energy crops in the US and Europe. Biomass and Bioenergy, 25, 335-361, 2003.

148
Ringraziamenti
In questi tre anni di dottorato, sono state molte le persone che ho incontrato e che mi hanno aiutato
ad andare avanti nel mio percorso, dedicandomi tempo, professionalità ed amicizia.
Con immenso affetto, ringrazio la Prof.ssa Vincenza Calabrò, per il suo costante aiuto e l’attenzione
che mi ha sempre dedicato. I suoi insegnamenti, consigli ed il suo caloroso sostegno durante questi
anni, sono stati per me molto importanti. La ringrazio per la grande professionalità ed umanità che
mi ha offerto quotidianamente e per avermi guidato con entusiasmo ed incoraggiamento in questo
lavoro di tesi.
Desidero ringraziare il gruppo del Laboratorio di Fenomeni di Trasporto e Biotecnologie, del
Dipartimento di Modellistica per l’Ingegneria dell’Università della Calabria, per la loro
disponibilità e gentilezza ed in particolare Alessandra, per avermi accolto con grande affetto.
Ringrazio tutti i membri del Centro Ricerca ENEA della Trisaia, per avermi dato la possibilità di
svolgere con serenità ed entusiasmo parte del mio dottorato presso i laboratori dell’Ente.
In particolare, ringrazio di cuore la Dott.ssa Isabella De Bari, per la costante disponibilità e cortesia
avute nei miei confronti; particolarmente preziose sono state le sue indicazioni ed i suoi
insegnamenti, e soprattutto l’amicizia e le parole di sostegno che mi ha sempre dato.
Desidero ringraziare il gruppo di ricerca del Dipartimento di Ingegneria chimica dell’Università di
Lund (Svezia) ed il Prof. Guido Zacchi per l’accoglienza e la cordialità. Li ringrazio per le
conoscenze che mi hanno trasmesso e per avermi dato la possibilità di svolgere un’esperienza che per
me è stata altamente formativa.
Un grazie di cuore va alla mia famiglia, a Laura, Giuseppe ed alla mia mamma, per tutto l’amore di
cui mi circondano quotidianamente e di cui ho immensamente bisogno. Grazie per aver creduto in
me, essermi stati vicini in ogni scelta che ho preso, ma soprattutto per essere prontamente corsi in
mio aiuto anche quando ci separavano 2500Km di distanza!
Ringrazio con affetto gli amici di Lund, Mario, Trypta e Shilpi, per la loro infinita pazienza, per le
bellissime giornate trascorse insieme e soprattutto le indimenticabili “international dinners”.
Un grazie va alla mia amica Fortunata, per il ricordo che ancora oggi conservo di quella sua
contagiosa allegria e del buon umore che riusciva sempre a trasmettermi anche nelle giornate più
difficili. Cara Fortu, ti ho pensato molto in questi anni, mi dispiace che il tempo non mi abbia
permesso di riuscire a salutarti come avrei voluto. Ti mando un abbraccio attraverso queste poche
righe, nella strana speranza che tu possa riceverlo.
Grazie di cuore a Francesca, la splendida amica con la quale sono cresciuta, che non mi ha mai
lasciato sola, che mi ha sempre sostenuto ed incoraggiato ad andare avanti. Cara Fra, in questi
quindici anni, sei stata per me come una sorella e vorrei esprimerti tutto il mio affetto per il tempo
che mi hai sempre dedicato, anche quando eri presa da mille impegni e per aver condiviso con me i
tanti momenti belli ma soprattutto per avermi aiutato a superare i momenti più tristi e difficili.

149
Il mio grazie più forte va ad Alessandro, per per aver camminato sempre al mio fianco, giorno dopo
giorno, aiutandomi e sostenendomi con la sua grinta, il suo entusiasmo ed il suo affetto. Grazie per
avermi insegnato ad avere più coraggio nell’affrontare situazioni nuove e non sempre facili e per
avermi spinto a guardare oltre le mie paure ed insicurezze. Penso che tu sappia il bene profondo che
ti voglio e per ogni tuo gesto, per ogni giornata passata insieme, per tutto quello che sei riuscito a
fare per me.. per tutto questo, semplicemente grazie.
Infine, a tutti voi e a tutti quelli che mi sono stati vicini in questi tre anni dedico le parole di questa
bellissima canzone.
“L'amore più puro in un tepore nuovo
di celesti lenzuola e del loro ristoro:
sono i soffici raggi delle pupille tue,
vi si accuccia il cessare delle sue paure.
Ed io vi spio e mi commuovo.
E grazie...
per tutto questo: grazie.
Per tutto quanto: grazie.
Per tutto: grazie.
E grazie.
Semplicemente grazie.
Perdutamente grazie.
Solennemente grazie.”
~Marlene Kuntz~