Embed Size (px)
Citation preview
U C,I
Experiments in critical mathematical modelling
T
submitted in partial satisfaction of the requirementsfor the degree of
M S
in Engineering
by
Michael Dean Silberman
Thesis Committee:Associate Professor Beatriz da Costa, Chair
Associate Professor Robert NidefferAssociate Professor Bill Tomlinson
Associate Professor Kavita Philip
2009

c© 2009 Michael Dean Silberman
Permission is granted to copy, distribute and/or modify this document under
the terms of the GNU Free Documentation License, Version 1.3 or any later
version published by the Free Software Foundation; with no Invariant
Sections, no Front-Cover Texts, and no Back-Cover Texts.
A copy of the license is available at gnu.org/licenses/fdl-1.3.txt.

The thesis of Michael Dean Silbermanis approved and is acceptable in qualityand form for publication on microfilm:
Committee Chair
University of California, Irvine2009
ii

T C
A
A T
1 I: A 1
2 N 72.1 ‘Normal’ mathematical modelling . . . . . . . . . . . . . . . . . 82.2 The work outside the work . . . . . . . . . . . . . . . . . . . . . 152.3 The model that makes the market . . . . . . . . . . . . . . . . . . 242.4 Past performance is not an indication of future results . . . . . . 272.5 A broader criticality . . . . . . . . . . . . . . . . . . . . . . . . . . 36
3 T 493.1 Bribe Payers Index . . . . . . . . . . . . . . . . . . . . . . . . . . 493.2 Index of Imperial Domination . . . . . . . . . . . . . . . . . . . . 523.3 Miles Per Casualty . . . . . . . . . . . . . . . . . . . . . . . . . . 563.4 Capitalism Collaps-O-Meter . . . . . . . . . . . . . . . . . . . . . 583.5 The Bureau of Economic Interpretation . . . . . . . . . . . . . . 64
4 C 654.1 Reading the Bribe Payers Indices . . . . . . . . . . . . . . . . . . 654.2 Running (and reading) the Capitalism Collaps-O-Meter . . . . . 71
5 T 83
6 C 91
iii

Acknowledgments
In the event that this document or the projects it describes should ever proveto be of use or interest, blame should be apportioned, in no particular order, tothe following parties: Beatriz da Costa; Robert Nideffer; Kavita Philip; BillTomlinson; Antoinette LaFarge; Lilly Irani; Marisa Cohn; Silvia Lindtner; NinaBecker; Julka Almquist; Simon Penny; Michael McNally; Jean-DanielSaphores; Tom Jennings; Josef Nguyen; Faith Dang; Brett Doar; Anahita Fazl;Dustin Utt; Ward Smith; Sam Kaufman; Judy Chen; Frazier Cunningham;Nikolai Kirienko; Gillian Hayes; Paul Dourish; Tom Boellstorff; MarthaFeldman; Francesca Polletta; Shawn Rosenberg; Eleanore Stewart; DavidFamilian; Nalika Gajaweera; Nanao Akanuma; the staff at Peet’s Coffee inIrvine; Diego Pontoriero; Joseph Jailer-Coley; Chris Wiggins; Harish Bhat;Tanya Heikkila; Tobias Siegfried; Somudro Gupta; Eric Garrido; Varun Mehta;Casey Callendrello; Emmi Yonekura; Aditi Sriram; Sonali Phatak; AnubhaAgarwal; Hannah Lee; Jeff Shrader; Upmanu Lall; Vijay Modi; MichaelGrainger; and my parents, Ana Maria and Donn Silberman.
To the extent that it remains obscure, irrelevant, irresponsible, incomplete,obnoxious, or erroneous, I claim all credit.
iv

A T
Experiments in critical mathematical modelling
By
Michael Dean Silberman
Masters of Science in Engineering
University of California, Irvine, 2009
Associate Professor Beatriz da Costa, Chair
The ongoing global economic crisis motivates the following questions: How
does economic knowledge, and mathematical modelling in particular, act in
the world? Indeed, how does it become ‘knowledge’? What are the ethical
commitments and political implications and stakes of such
knowledge-making practices? Are the practices and dominant frameworks in
contemporary economics useful in understanding the current crisis? Useful
for whom? If the assumptions and commitments that inflect and undergird
economic knowledge and knowledge-making prove to be impediments to
understanding rather than preconditions for it, how can one build a modelling
practice that is more useful? What exactly is meant by ‘useful’? Again, for
whom? Assuming what objectives?
This thesis grapples with these questions, both theoretically and by the
construction of mathematical indices and models with working visualization
interfaces.
v

C 1
I: A
The purpose of studying economics is not to acquire a set of ready-made
answers to economic questions, but to learn how to avoid being deceived by
economists.
—Joan V. Robinson
What is the meaning of the current ‘global economic crisis’? What are its
origins and implications? What is it? What, indeed, is ‘the global economy’,
and how (and when) did we all decide that it was a reasonable and important
thing to fret over? How do we see it, talk about it, make predictions about it,
claim that it is healthy, or sick, or getting better, or has more dark days ahead?
What connection does this talk and its associated modes of representation and
knowing have to do with the lived experiences of people who appear to have
been ‘affected’ by the ‘crisis’? Whose crisis is it anyway?
The Capitalism Collaps-O-Meter and the indices displayed in association
with it at the Beall Center for Art and Technology between June 9 and June 12,
2009 can be read as one step in the development of a set of quantitative
techniques for representing, modelling, and interpreting economic
relationships ‘outside’ the traditional concerns and conventions of academic
economics. I have some formal training in mathematical modelling, in the
shape of an undergraduate degree in applied mathematics, but almost no such
training in academic economics. As such, I have some access to the language
of economic analysis but little predisposition to accept its axiomatic
1

assumptions, approaches, frameworks, or tools. In this respect I am playing,
in the development of this project, the role Claire Pentecost has named the
‘public amateur’, a figure who “consents to learn in public” [1]. For Pentecost,
the practice of public amateurism “is a proposition of active social
participation in which any nonspecialist is empowered to take the initiative to
question something within a given discipline, acquire knowledge in a
noninstitutionally sanctioned way, and assume the authority to interpret that
knowledge, especially in regard to decisions that affect our lives” [1].
As of April 2009, the first-ever ‘global financial crisis’ is, on one reading,
almost two years old, with substantial detrimental impacts continuing on
parties far away from the centers of financial and political power. The speed
with which the crisis has developed appears to have served as an opportunity
for financial and political elites in industrialized economies to further
concentrate financial and political power, and a number of protests of dubious
efficacy have sprung up as this realization has circulated throughout
industrialized societies. Despite the apparent short-term consolidation of
financial and political power, efforts taken ostensibly to ‘stabilize the
economy’ appear thus far to have failed. One reading of this failure suggests
that the frameworks offered by academic macroeconomics that form the basis
of these policy interventions are inadequate to the task of coherently analyzing
the global political economy in the current moment. If the fundamental
operating assumptions of leading academic macroeconomists and
policymakers have proved intellectually bankrupt—and former Federal
Reserve Chairman Alan Greenspan admitted as much in his testimony before
the United States Congress on October 23, 2008, saying, “I made a mistake in
presuming that the self-interests of organizations, specifically banks and
others, were such that they were best capable of protecting their own
2

shareholders and their equity in the firms” [3]—then perhaps an argument can
be made that it has become appropriate to examine these assumptions with
great care, and to attempt to construct alternative models, interpretations,
representations, and narratives about the functioning of ‘the global [political]
economy’. In the context of such dramatic epistemological collapse, as
Pentecost writes of another case study, “self-experimentation becomes
necessary because no one can trust the authorities or so-called experts”:
Our condition of reflexivity at this point is such that the amount of
commentary or information on what we do is overwhelming not
only us, but it’s overwhelming the “experts.” The dams around
science’s fantasy of objectivity are being breached. Science is more
and more obviously driven by subjective interests. Even though
technocratic knowledge still legitimizes a major portion of the
spectrum of authority, our ability to rely on technoscientific
pronouncements is crumbling under the weight of information and
the light of examination. We have more tools for producing
‘information’ and fewer for making judgments; we have more
networks for informing—press, publishing, publicity—so we have
more opportunities for examination. The public, weary of
conflicting authorities, constantly exposed to means of reporting on
and reflecting on the claims of authorities, has to devise other
means of producing information, i.e., their own experience, and
also has to move further to self reliance, i.e., trusting their own
observation, good “sense,” and decision. [4]
In another formulation of the artist as amateur in the context of the
biological sciences under neoliberalism, Pentecost enumerates a number of
mechanisms by which science and the public are alienated from one another,
3

and a number of corresponding strategies that an artist can deploy in order to
interrupt this alienation: “staging of scientific procedures in participatory
theaters to provide experiences of the materiality of science; initiation across
specialized knowledge fields enfranchises nonspecialists to author new
narratives with a perspective on the real stakes involved; playing the amateur,
the artist takes pains to find collaborators within scientific fields and/or
consents to become a ‘thief’ of privatized knowledge in order to politicize or at
least problematize this sequestering” [5]. While useful in the context of the
biological sciences, these strategies appear to presume that the scientific
knowledge being appropriated is valuable beyond its performative use in the
construction of the discipline and the figure of the expert; that is, that it has
some demonstrated explanatory and/or predictive power. While perhaps less
frequently problematic in the context of the physical and biological sciences,
whether this assumption holds in the context of academic economics is
unclear. The role of the public ‘amateur-economist’ is less that of a translator
or liberator of obviously valuable knowledge and more that of a critic or
interrogator of dubious knowledge that has been used to make decisions
affecting the lives of ‘the public’ at large.
In this particular project, I have brought to the role of ‘public amateur’ in
academic economics some of the knowledge of a mathematically literate
‘analyst’; following economic sociologist Michel Callon, I take “the task of the
analyst” to be the “multipl[ication of] possible worlds” [6] (p. 15). The
Capitalism Collaps-O-Meter acts as an instrument for effecting this
multiplication by providing an expanded interpretation of what constitutes
economically relevant data, facilitating the subjective reorganization and
reinterpretation of that data, and furnishing a language for the construction of
economic narratives and analyses beyond that of academic economics. In the
4

wake of the intellectual collapse of economic orthodoxy, the time seems ripe
for analytic and linguistic experimentation.
But which ‘public’ is involved in this practice of ostensibly ‘public’
economic amateurism? I do not wish here to imply the existence of a smooth
‘information space’ or ‘public sphere’ into which interpretations,
representations, methods, models, or taxonomies can be sent forth, to be
impartially and definitively judged true or false, useful or unuseful, novel or
trite, ideologically acceptable or ‘problematic’. Rather, we can make use of
Michael Warner’s notion of a “public that comes into being only in relation to
texts and their circulation”; which “exists by virtue of being addressed” [2] (p. 50;
emphasis in the original). The ‘experiments’ in explicitly ‘critical’
mathematical modelling described here have been rendered to a very
particular ‘public’; namely, those individuals who happened to pass through
the Beall Center for Art and Technology at the University of California, Irvine
between June 9 and June 12, 2009, and later, readers of this document. Because
of this numerically limited and temporally constrained circulatory scope, they
should be thought of primarily as experiments rather than political actions; as
Warner points out, “publics act historically according to the temporality of
their circulation”:
The more punctual and abbreviated the circulation, and the more
discourse indexes the punctuality of its own circulation, the closer a
public stands to politics. At longer rhythms or more continuous
flows, action becomes harder to imagine. This is the fate of
academic publics, a fact very little understood when academics
claim by intention or proclamation to be doing politics. [2] (p. 68)
Attributing political efficacy to these particular artifacts at this particular
showing, then, would be somewhat suspect. I do wish, however, to explore
5

their political implications.
6

C 2
N
G. I have found a flaw. I don’t know how significant or permanent it
is. But I have been very distressed by that fact.
W. In other words, you found that your view of the world, your
ideology, was not right, it was not working.
G. Absolutely, precisely. You know, that’s precisely the reason I was
shocked, because I have been going for 40 years or more with very
considerable evidence that it was working exceptionally well.
—October 23, 2008
How are mathematical models used to generate knowledge and guide or
justify action in the world? What would constitute a ‘critical’ practice of
mathematical modelling, and why might such a practice be desirable? I will
approach these questions by providing four accounts: first, an account of the
modelling process as described by two practitioners in transportation
modelling, accompanied by a simple but detailed example; second, an account
of the way in which academic economics relies on activities and mechanisms
‘outside’ the substantive ‘content’ of the discipline in order to prepare ‘natural
experiments’ that can form the basis of empirical work in the field, as analyzed
by a political theorist; third, an account of the construction of the markets for
financial derivatives and their grounding in the mathematical theory of
derivatives pricing, as analyzed by a sociologist; and finally, an account of the
failure of financial risk models and their role in the contemporary global
7

financial crisis (and a previous crisis), as told in five separate articles by four
financial journalists and one economist. These accounts will serve to
foreground some of the challenges of mathematical modelling as a knowledge
production practice, and will animate a discussion of a first set of
characteristics of a notional ‘critical’ mathematical modelling; these
characteristics will focus on the question ‘How can we model better?’, and
how the Capitalism Collaps-O-Meter stands in relation to these concerns.
There is, of course, a broader interpretation of ‘criticality’, at least as
important as that flavor of critique which aims to revise disciplinary practices
and formalisms in an attempt to solve better the technical problem under
consideration. This is the strand of critique which, roughly understood,
inquires about the social and political effects of the technical work: what
should we model? to what purpose? who benefits? Put simply, this order of
critique focuses less on the how of modelling and more on the what, why, and
for whom. Although technical understanding of the details of particular
models under analysis are central to this mode of critique, the critique itself is
properly social, political, institutional, and/or economic; it is not necessarily
technical in a mathematical sense, although the techniques used to effect this
critique may include tools from almost any discipline—sociology, media
studies, the plastic arts, quantitative modelling itself—the list goes on.
2.1 ‘N’
Transportation analysts Juan de Dios Ortuzar and Luis Willumsen offer an
eight-point portrayal of the planning processes within which mathematical
models of transportation systems are constructed and used for ‘decision
support’:
8

1. Formulation of the problem.
2. Collection of data.
3. Construction of an analytical model.
4. Generation of [possible] solutions.
5. Forecast[ing] the future values of the planning variables.
6. Testing the model and solution.
7. Evaluation of [possible] solutions.
8. Implementation of [selected] solutions. [7] (pp. 25-27)
I am particularly interested here in part (3), the construction of analytical
models. Following Ortuzar and Willumsen, we can represent a model as a
mapping
Y = f (X,θ)
where the X are referred to as “variables” and the θ as “parameters.” In this
case by “variables” (X) what is meant is in fact explanatory or independent
variables: these may include demographic data like income, age, and gender;
data that describe the state of the transportation system (width and quality of
roads, traffic signals, bus routes and frequencies, etc.); data describing the
“activity system” or network of destinations that users access by means of the
transportation system; and so on. The Y are the dependent variables whose
values are predicted by the model and constitute its ‘output.’ Note that very
often there will be some variables which appear in both X (‘input’) and Y
(‘output’); these variables are said to be determined ‘endogenously’—that is,
within the model (as opposed to being determined ‘exogenously,’ or ‘given’).
9

Obtaining the values of these variables generally involves solving a set of
simultaneous equations.
To develop a very elementary familiarity of the techniques employed in this
way, I will describe a toy problem and solution.1 Researchers familiar with
approaches from neoclassical economics will find this approach unsurprising,
if somewhat naıve.
Suppose we have an origin “O” and a destination “D” joined by a single
road, along which travel time t in minutes varies linearly with the number of
vehicles v on the road at any particular time according to
t = 10 +1
60v
That is, if there are no cars on the road, it takes 10 minutes to travel from O to
D; for the first car, it takes 10 minutes and 1 second; and for every additional
car on the road it takes another 160 of a minute, or one additional second (see
Fig. 1). This is referred to as the “performance function” of the road under
study. Additionally, we can define a “demand function,” which predicts the
number of vehicles on the road v (i.e., the number of drivers who wish to
travel from O to D, in vehicles per hour or ‘vph’) as a linearly declining
function of travel time t:
v = 5000 − 100t
That is, if travel between O and D were instantaneous (i.e, if t = 0), 5000
drivers would make the trip; for each additional minute, 100 would-be drivers
decide it’s not worth the time and abstain. At the so-called “base travel time”
of 10 minutes, 4000 drivers would like to make the trip. But of course, things are
not so easy; if 4000 drivers take to the road, the travel time increases far in
1I thank Michael McNally of the Institute for Transportation Studies at UC Irvine for thisexample, although I have altered the numbers slightly.
10

excess of 10 minutes, and more drivers abstain. This process is called
“equilibration,” and to obtain the model “equilibrium”—that is, the system
state predicted by the model—we solve the demand and performance
functions simultaneously, for example by substitution:
t = 10 +1
60v
t = 10 +1
60(5000 − 100t)
t =2803−
10060
t
83
t =2803
t = 35
v = 5000 − 100(35) = 1500
and we see that the model predicts an equilibrium volume of 1500 vph and
an equilibrium travel time of 35 minutes.
We can also see that this model can be abstracted further. By abstaining
from specifying the values of the parameters, we can write something like
t = α1 + β1v
v = α2 + β2t
where by writing α and β in front of the variables we are saying essentially,
“there is probably some relationship here, but we don’t know what it is yet.”
That is, the “parameters” α and β are not yet defined, and must be estimated
or calibrated—and then validated—before the model can be used to predict
future conditions.
11
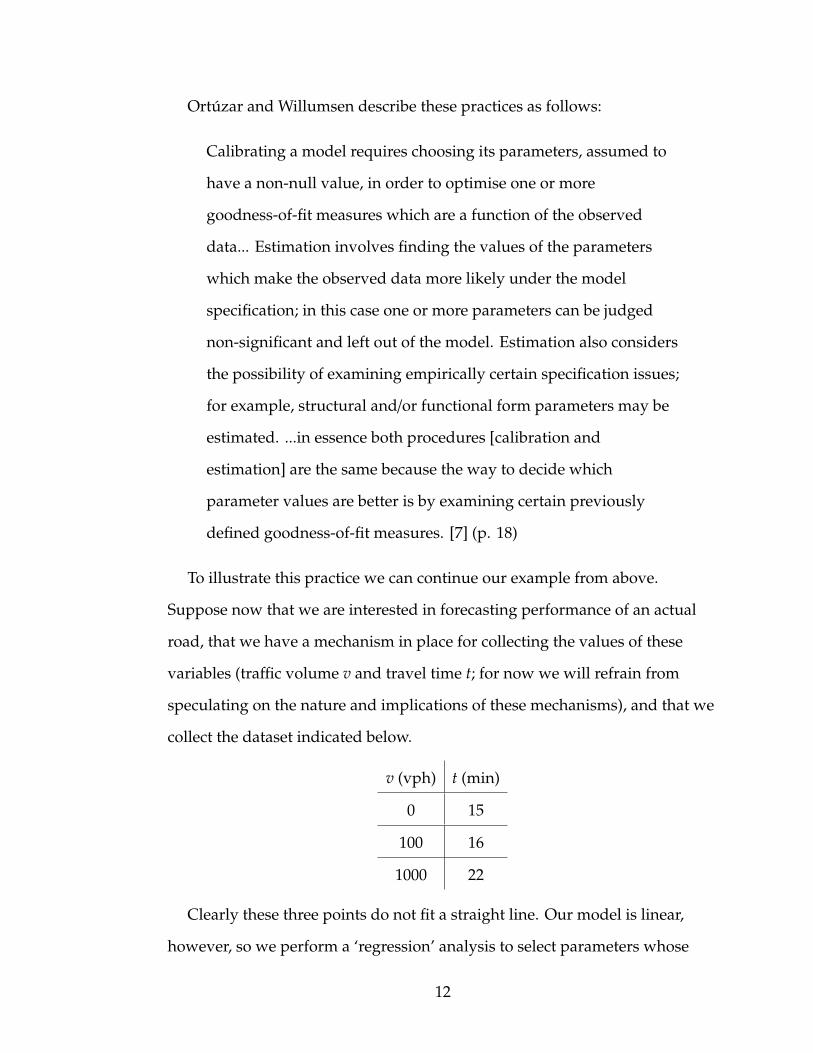
Ortuzar and Willumsen describe these practices as follows:
Calibrating a model requires choosing its parameters, assumed to
have a non-null value, in order to optimise one or more
goodness-of-fit measures which are a function of the observed
data... Estimation involves finding the values of the parameters
which make the observed data more likely under the model
specification; in this case one or more parameters can be judged
non-significant and left out of the model. Estimation also considers
the possibility of examining empirically certain specification issues;
for example, structural and/or functional form parameters may be
estimated. ...in essence both procedures [calibration and
estimation] are the same because the way to decide which
parameter values are better is by examining certain previously
defined goodness-of-fit measures. [7] (p. 18)
To illustrate this practice we can continue our example from above.
Suppose now that we are interested in forecasting performance of an actual
road, that we have a mechanism in place for collecting the values of these
variables (traffic volume v and travel time t; for now we will refrain from
speculating on the nature and implications of these mechanisms), and that we
collect the dataset indicated below.
v (vph) t (min)
0 15
100 16
1000 22
Clearly these three points do not fit a straight line. Our model is linear,
however, so we perform a ‘regression’ analysis to select parameters whose
12

values cause our linear model to most closely approximate the data we have
collected. Presenting and commenting on the various goodness-of-fit
measures that can be used in regression analyses is beyond the scope of this
paper, but we can select one (a typical one might be “Ordinary Least Squares”)
and, assuming that with this dataset we consider v the independent variable
and t the dependent, obtain values for α1 and β1. We can repeat this process for
α2 and β2 to ‘identify’—that is, specify completely—our model for v(t).
To ‘validate’ the model after it has been calibrated (or after its parameters
have been estimated, whichever you prefer) “requires comparing the model
predictions with information not used during the process of model
estimation”—that is, collecting additional data in order to verify the model’s
predictive power. I will refrain from presenting the formal methods employed
in this process but will illustrate this process with our model for t(v) from
above and two additional example datasets:
D 1.v (vph) t (min)
1 15.02
110 16.1
1100 22.1
D 2.v (vph) t (min)
1 22
105 10
1500 15
If, after calibrating our model, we were to collect Dataset 1 on the road for
which our model is supposed to offer meaningful predictions, we might be
13

reassured; if, on the other hand, we were to collect Dataset 2 on that road, we
might be skeptical of our model’s ability to offer any such predictions.
Now suppose we have two roads, and drivers are expected to choose
between them. To determine the equilibrium distribution of vehicles (and
thence the equilibrium travel times on the roads), we assume that users have
knowledge of the travel times on each road and will select the road with the
shortest travel time. This is called assuming ‘Nash equilibrium’ or ‘user
equilibrium,’ and it rests on three assumptions:
1. Users prefer shorter trips over longer trips (that is, they obtain greater
utility from shorter trips);
2. users will act to maximize their own utility at the expense of others’, and
therefore will select the route with the shortest travel time even if it
raises the travel time for the other users on the route; and
3. users have perfect (i.e., complete) information of the system at all times;
in this case, they know the exact travel times along both routes.
Generally speaking, these assumptions describe the canonical ‘rational’
user. In more complex scenarios where users make additional choices (for
example, selecting a transportation ‘mode’—that is, selecting between driving,
walking, cycling, taking the bus, and so on) we assume that users have
‘rational preferences,’ meaning that the user makes a choice from a set which
is exhaustive—that is, it covers all possible choices—mutually exclusive—each
user makes only one choice at a time—and finite [8] (p. 15). Further, we
assume that users’ preferences over this choice set are complete—that is, we can
meaningfully compare any two choices—transitive—if a user prefers A to B
and B to C, the user must prefer A to C—and continuous.2 These six2Continuity is an assumption made for technical convenience which we will not be too
concerned about here; I have included it for completeness.
14

assumptions allow for the construction of a meaningful ‘utility function,’
which maps choices—quantities of goods consumed, routes or modes chosen,
parking spots selected, and so forth—to levels of ‘utility,’ a constructed
measure of well-being. We assume that all users will make use of their
information (assumed to be complete and up-to-date at all times) to make
choices that maximize their utility. The preference axioms (completeness,
transitivity, and continuity) are widely acknowledged not to hold in all
circumstances—there is a substantial economic literature exploring the
situations in which transitivity does and does not hold, for example—but
many contemporary transportation modelling approaches still rely on them.
2.2 T
The political theorist Timothy Mitchell tells the story of an economic ‘natural
experiment’ conducted in Peru and analyzed by development economist Erica
Field [9], [10] which examines the hypothesis that the transformation of “the
country’s informal urban neighborhoods into legal, state-regulated
housing”—i.e., granting property title to squatters, transforming them into
legally recognized property owners—“offered a simple and inexpensive
means to end widespread poverty” [11] (p. 299): newly-legalized landholders
would be able to use their property titles as collateral for loans, which they
would use to start small businesses. Ultimately the hypothesis was not
supported—“there is no evidence,” write Field and Torero [9], “that titles
increase the likelihood of receiving credit from private sector banks”—but the
finding reports an unexpected secondary finding: Fields’ “estimates suggest
that titling results in a substantial increase in labor hours, a shift in supply
away from work at home to work in the outside market and substitution of
15

adult for child labor” [10]. That is, “those who became formal property
owners...began to work harder”. Mitchell summarizes the findings articulated
by Field:
Obtaining title to their property seemed to increase the average
number of hours that members of a household worked by 17 per
cent. The data suggested that over time, as the effect of titling
intensified, the total number of hours worked might increase by 40
per cent. There was also a redistribution of labor from work within
the home to employment outside, and from children to adults.
Property titling was associated with a 47 per cent decrease in the
number of hours worked inside the house, and a 28 per cent
reduction in the use of child labor.
To explain these findings, ... Field hypothesized that acquiring
formal title freed members of the household to spend more time
outside the home, based upon the intuition that in the absence of a
formal title people had to stay home to protect their property from
being seized by others. A further intuition suggested that adults
had a comparative advantage over children in defending the home,
so in the absence of secure property rights children were more
likely to be sent out to work. Once the property was secured with a
formal title, children could stay home and adults could take over
children’s jobs outside the household. [11] (pp. 300-301), citing [10]
Mitchell is skeptical about the conclusions of the study. “The research
experiment,” he explains, “was made possible by the political experiment that
it studied. The agencies and arrangements that framed the property rights
experiment framed the conclusions reached in the experiment on the
16

experiment” [11] (p. 301). Put another way, the conclusions of the research
experiment were shaped by factors not explicitly considered or ‘scoped in’.
Some of these are attributes of the neighborhoods under study; others are
attributes of the broader intellectual environment in which the research was
conducted, or of the researchers themselves. “The paper’s argument,” writes
Mitchell, “depends on the assumption that the informal neighborhoods of
different Peruvian cities are similar to one another and that the sequence in
which the titling program entered different cities and neighborhoods was
random”:
The staggered implementation that made a natural experiment
possible must be unrelated to any local differences that might
influence the extent to which people in different neighborhoods
work outside the home. The paper claims to resolve the possibility
of non-random city timing by including city-level fixed effects in
the regression estimates. However, more than half the survey
neighborhoods already reached by the titling program were located
in one city, Lima. Different neighborhoods of the capital were
reached by the program at different times. If there were significant
reasons for introducing the program in some neighborhoods of
Lima before others, and for later extending it to certain
neighborhoods of certain provincial cities before others, and
significant differences among these neighborhoods, this might offer
a more reasonable explanation for the outcome of the experiment.
Simply allowing for city-level fixed effects would not be able to
capture the possible interaction among this range of differences.
The experiment was unable to test whether differences among
neighborhoods were affecting the rate of employment outside the
17

home. The author claims such differences can be ignored, on the
grounds that eight district-level poverty indicators (rates of chronic
malnutrition, illiteracy, fraction of school-aged children not in
school, residential crowding, adequacy of roofing, and the
proportion of the population without access to water, sewerage,
and electricity) were similar for program and non-program
neighborhoods. [... However,] indirect indicators of poverty
levels...may be unable to capture major differences between
different kinds of neighborhoods with different patterns of
employment. [... Further,] the World Bank also says that the order
[in which the program was launched in different neighborhoods
and cities] was not random, but was based on “ease of entry” to the
neighborhood. The bank’s Peruvian program office reported that
the order depended on “geographical situation, feasibility to
become regularized, dwellers’ requests, existing legal and technical
documents, and linkages with other institutions involved in the
existing obstacles.” [11] (pp. 310-311)
In short, there were significant factors in the environment under study that
were not modelled explicitly (“inputs” in the lexicon of Ortuzar and
Willumsen discussed above) but that could entirely plausibly have had a
substantial effect on the outcomes observed (“outputs”). Arguments put forth
by the study authors that the effects of these factors were neglible are, at least
according to Mitchell, unconvincing.
There are additional factors that Mitchell argues may have affected the
interpretation of the study data, and thus the outcomes of the study as
presented by the authors. These factors are not attributes of the environment
under study (i.e., the informal urban neighborhoods in Peru) but rather
18

attributes of the authors themselves, and of the intellectual climate in which
they operated:
No plausible evidence is offered to support the author’s intuition
that households without a formal ownership document have to
keep people at home to defend the property from being seized by
others, or that gaining this document suddenly removes the
alleged need for self-defense. The intuition is backed only by an
anecdote from a World Bank report and the writings of Hernando
de Soto [the neoliberal development economist on whose
intellectual and political work the “natural experiment” analyzed
in the study is based]. Evidence available in the same World Bank
documents suggests a contrary view: Peru’s informal urban
communities are described as having very strong collective
organizations and a great variety of neighborhood mutual-help
arrangements. Typically a squatter neighborhood was formed by a
single village, whose members would plan their relocation
collectively in advance, allocate each family a building plot, and
reproduce the communal associations of the village in the new
location. None of this indicates a situation in which people feel so
threatened they must stay home to guard their individual
properties. (The World Bank also reports that titling programs tend
to weaken these neighborhood associations.) Evidence from other
studies suggests that the security of informal households depends
on a wide range of factors and is not necessarily dependent on
possession of formal title.
What makes the intuition plausible is that it resonates with the
work of neo-institutionalist economists like Douglas North and
19

neoliberal theorists of development like Peter Bauer. It assumes
that a world without formal property rights is anarchic, and that
once the proper rules are in place a natural spirit of self-interested
endeavor will be set free. It derives its plausibility more from the
reader’s familiarity with certain texts in economics than from any
knowledge of informal communities. [11] (pp. 309-310; emphasis
added)
If the objective of mathematical modelling in this ‘natural experiment’ is to
make inferences about the world from data, Mitchell’s analysis foregrounds
two challenges for this project. First, it is difficult to know what factors are
relevant ‘inputs’ to the phenomena (‘outputs’) under study; most social
phenomena, however, are too complex to admit comprehensive observation
(not to mention quantitative representation in a model) of all factors that could
conceivably be relevant. This places upon the analyst the burden of deciding
which factors to observe and which to ignore, which becomes problematic in a
research culture in which ambivalent results (e.g., ‘I think we need to go back
and collect data on factors X, Y, and Z which were ignored in the previous
study’) are not rewarded as highly as decisive ones. Such a culture can
incentivize dubious arguments about the ‘negligibility’ of factors which were
omitted from the data collection process not because the analyst was
convinced of their negligibility but simply because it would have been too
onerous to collect them, because the analyst did not think to collect them until
later, the requisite labor or equipment was unavailable at the time, or any
number of other completely reasonable—but ‘merely practical’—reasons.
Second, it is difficult to understand the probable or even possible effects of
one’s own intellectual predilections or those of one’s discipline on the
preferential interpretation of data, or on the production of knowledge
20

generally. If, as the political psychologist Shawn Rosenberg suggests, “a
discipline is a group of people who have all agreed to remain ignorant of the
same things” [12], disciplinary histories can be reasonably expected to shape
more and less acceptable interpretations of data, processes, and phenomena.
The challenge to the critical modeller is to model the extent to which such
predilections affect not just the interpretation of field data and model results,
but also the ways in which experiments are constructed, surveys designed,
classifications articulated, and so on; in short, to examine carefully the various
ways in which disciplinary conventions and histories order the world, thereby
shaping what is possible, epistemologically speaking, and what is not. This
second challenge can be read as the challenge of rejecting the traditional notion
of objectivity within positivist science, and operationalizing this rejection
within one’s modelling practice. The cyberneticist Heinz von Foerster [13]
characterizes this particular flavor of “objectivity” in the following fashion:
“The properties of the observer shall not enter the description of his
observations.”
“But,” he asks,
how would it be possible to make a description in the first place if
not the observer were to have properties that allows for a
description to be made? Hence, I submit in all modesty, the claim
for objectivity is non sense! One might be tempted to negate
“objectivity” and stipulate now “subjectivity”. But, ladies and
gentlemen, please remember that if a nonsensical proposition is
negated, the result is again a nonsensical proposition. However,
the nonsensicality of these propositions either in the affirmative or
in their negation cannot be seen in the conceptual framework in
21

which these propositions have been uttered. If this is the state of
affairs, what can be done? We have to ask a new question:
“What are the properties of an observer?”
Donna Haraway does not abandon the term “objectivity”, but works to
develop a new interpretation of it. This feminist objectivity addresses exactly
this question:
I would like a doctrine of embodied objectivity that accommodates
paradoxical and critical feminist science projects: Feminist
objectivity means quite simply situated knowledges. ...[the] view of
infinite vision is an illusion, a god trick. I would like to suggest
how our insisting metaphorically on the particularity and
embodiment of all vision (although not necessarily organic
embodiment and including technological mediation), and not
giving into the tempting myths of vision as a route to
disembodiment and second-birthing allows us to construct a
usable, but not an innocent, doctrine of objectivity. ...objectivity
turns out to be about particular and specific embodiment and
definitely not about the false vision promising transcendence of all
limits and responsibilities. The moral is simple: only partial
perspective promises objective vision. All Western cultural
narratives about objectivity are allegories of the ideologies
governing the relations of what we call mind and body, distance
and responsibility. Feminist objectivity is about limited location
and situated knowledge, not about transcendence and splitting of
subject and object. It allows us to become answerable for what we
learn how to see. [14] (pp. 582-583)
22

That is: all ‘seeing’ (and ‘understanding’), and by extension all modelling,
is necessarily grounded and located in a particular body (or set of bodies, or
physical assemblage), a particular context, and a particular set of assumptions,
positions, and interests, and is therefore limited. No technique exists that
allows for omniscient, disembodied, ‘disinterested’ analysis; no position exists
‘outside’ the ‘system’ under study, because the apparatus that allows for
observation and analysis to occur at all necessarily joins ‘observer’ to ‘system’.
The act of observation itself renders boundaries between ‘observer’ and
‘observed’ analytically suspect. The corollary is that no model or practice of
critical mathematical modelling can ever account for iteself completely, and
therefore that every act of modelling (which might begin from ‘observations’)
and every act of prediction or explanation (based on a model) is necessarily
preceded by an act of interpretation, in which some ‘facts’ are decided to be
more important than others, some trends more relevant than others, and some
questions more interesting than others. Thus critical mathematical
modelling—with its origins in positivist, instrumentalist knowledge
production and its association with the fetishization of predictive power and
techniques and technologies for abstract, disembodied representation—finds
itself in a sort of epistemological badlands between ‘positivist’ and
‘interpretivist’ and even between ‘quantitative’ and ‘qualitative’ ways of
knowing, seeing, and representing.
In some ways, ironically enough, the researcher who refuses to
acknowledge the second challenge—who refuses to admit their particularity,
specificity, locatedness, embodiment, intellectual predilections,
disciplinarily-rooted assumptions, and so on—opens themselves to criticism
stemming from the first challenge (that is, the impossibility of knowing all of
the relevant variables and parameters). By rejecting omnipotent, omnipresent,
23

omnianalytic interpretations of objectivity, one allows oneself the luxury of
non-omniscience: “I didn’t think of that” (or “we didn’t have enough people”
or “we didn’t have the equipment”) becomes an acceptable, legitimate
response to “Why isn’t X in your model?” rather than a career-destroying
admission of failure. As a result, readers get models that have the luxury of
being truthful about their own limitations.
2.3 T
Economic sociologist Donald MacKenzie tells a story about the role of the
Black-Scholes-Merton model for pricing options in the creation and
standardization of the market for those options [15]. The title of his chapter is
“Is economics performative?” and exploring this question is his primary
concern. “To claim that economics is performative,” he writes,
is to argue that it does things, rather than simply describing (with
greater or lesser degrees of accuracy) an external reality that is not
affected by economics. But what does economics do, and what are
the effects of it doing what it does? [15] (p. 54)
I will not dwell here on the various flavors of performativity discussed by
MacKenzie; to provide a short account of the deployment of the Black-Scholes
option pricing model and its effects on economic actors is sufficient to the task
of articulating the challenge for modellers. I will quote MacKenzie at length:
An option is a contract that gives the right, but does not impose the
obligation, to buy (or, in an alternative form of the contract, to sell)
a set quantity of a particular asset at a set price on, or up to, a given
future date. ...The asset in question is classically a block of stock
24
(typically 100 shares), but options can also be written on many
other assets: gold, oil, wheat, and other physical commodities;
stock indexes and other more abstract assets; and so on.
A central question for the theory of options is how the cost of
options is established. Intuition suggests certain parameters that
can be expected to play a role in determining the cost... Unaided
intuition is, however, not sufficient to go beyond [a] list [of
parameters] to a formula for the option price. Nor is practical
experience decisive in this respect. Options have been traded since
at least the seventeenth century, and market practitioners
developed rules of thumb for pricing options, but those rules of
thumb did not add up to a precise or comprehensive theory.
...By the start of the 1970s, ... work by financial economists Fisher
Black and Myron Scholes, with key additional input from their
colleague Robert C. Merton, produced what has become the
canonical theory of options. ...an old technology formed the key
mediator between the model’s mathematics and the shouting,
sweating, gesticulating, jostling human bodies on the trading
floors: paper. Away from the hubbub, computers were used to
generate Black-Scholes prices. Those prices were reproduced on
sets of paper sheets which floor traders could carry around...
How were Black’s sheets [Fisher Black himself provided the most
popular printouts] and similar option pricing services used? They
could, of course, simply be used to set option prices. In April 1976,
options trading began on the Pacific Stock Exchange in San
Francisco, and financial economist Mark Rubinstein became a
trader there. He found his fellow traders on the new exchange
25

initially heavily reliant on Black’s sheets: “I walked up [to the most
active option trading ‘crowd’] and looked at the screen [of market
prices] and at the sheet and it was identical. I said to myself,
‘academics have triumphed.”’ [15] (pp. 56-57; 62)
MacKenzie provides an exhaustive analysis of the many ways in which the
Black-Scholes option pricing model was ‘performative’: in addition to
allowing issuers to set option prices, the model also provided a way for
traders to minimize risk while taking positions in the options market; it helped
to legitimate options trading, which prior to the deployment of the model had
been reviled and equated with gambling; it furnished traders with an entirely
new language for guiding and understanding the options market and their
own actions in it; and, perhaps most importantly for MacKenzie’s thesis, it
demonstrably altered trading practice to cause the price patterns of stock
options to conform closely to what it said they should be. The nuances and
distinctions between these effects and the taxonomy of performativities that
MacKenzie develops around them are not central to my thesis; I wish only to
foreground that models, even ones which ostensibly aim only to represent a
reality to which they are external, retain a capacity to act (and in any number
of ways, through any number of artifacts and processes) on that reality and to
alter it. This is the third challenge for the critical modeller: the challenge of
anticipating the ways in which the interpretation of results is complicated by
the non-separation (indeed non-separability) of the model and the ostensibly
independent world it represents. This separability provides a further
complication for a modeller interested not only in technical ‘criticality’ (i.e., in
asking ‘how can we better model?’) but in the second-order criticality that
asks about the social, political, and generally ‘ethical’ ramifications of a model.
This will be discussed in a later section.
26

2.4 P
In 1994, the former head of bond trading at Salomon Brothers investment bank,
two Nobel-winning economists, and a bevy of other economists with PhDs
from the Massachusetts Institute of Technology founded Long-Term Capital
Management (LTCM), a hedge fund which developed and implemented
trading strategies based on quantitative models of the behavior of different
asset prices. The “fund nearly tripled the money of its wealthy investors
between its inception in March, 1994, and the end of 1997,” write Peter Coy
and Suzanne Woolley in the September 1998 issue of BusinessWeek [16].
Its sophisticated arbitrage strategy was avowedly
‘market-neutral’—designed to make money whether prices were
rising or falling. Indeed, until last spring its net asset value never
fell more than 3% in a single month.
Then came...August [1998]. Long-Term Capital’s...portfolio’s value
fell 44%, giving it a year-to-date decline of 52%...a loss of almost $2
billion.
...Nearly every major investment house and bank in the U.S. and
abroad has a group of highly paid [quantitative traders] in its
proprietary trading department trying to beat the market with
complex, computer-aided trading strategies. In an announcement
on Sept. 2, [1998,] Salomon Smith Barney Holdings disclosed that it
had realized $300 million in losses from fixed income and global
arbitrage... Then, on Sept. 9, Merrill Lynch & Co. announced that it
had lost $135 million from trading and said that the losses had hurt
27

its own stock price.
Financial journalist Roger Lowenstein, in his comparison of the current
crisis (written in September 2008) with the 1998 collapse—“through the lens of
today’s more widespread failure,” he writes, “the Long-Term Capital collapse
looks like a small dress rehearsal...but at the time, it sent tremors of fear
through the corridors of Wall Street” [17]—offers a rough but useful
conceptual sketch of what went wrong, which I will quote at length:
How could the fund have been so far off? ...“risk management”
calculations were and are a central tenet of modern finance. “Risk”
is said to be a function of potential market movement, based on
historical market data. But this conceit is false, since history is at
best an imprecise guide.
Risk—say, in a card game—can be quantified, but financial markets
are subject to uncertainty, which is far less precise. We can calculate
that the odds of drawing the queen of spades are 1 in 52, because
we know that each deck offers 52 choices. But the number of
historical possibilities [in financial markets] keeps changing.
Before 1929, a computer would have calculated very slim odds of a Great
Depression; after it, considerably greater odds. Just so, before August
1998, Russia had never defaulted on its debt [this default being the
widely-accepted proximate cause of the huge losses incurred by
LTCM and other quantitatively-oriented funds]—or not since 1917,
at any rate. When it did, credit markets behaved in ways that
Long-Term didn’t predict and wasn’t prepared for.
This was the same mistake that scores of lenders would make in the
housing industry. The United States had never suffered a
28

nationwide contraction in housing prices; they assumed that the
pattern would hold.
Modern finance is an antiseptic discipline; it eschews anecdotes
and examples, which are messy and possibly misleading—but
nonetheless real. It favors abstraction, which is perfect but
theoretical. Rather than evaluate financial assets case by case,
financial models rely on the notion of randomness, which has huge
implications for diversification. It means two investments are safer
than one, three safer than two.
The theory of option pricing, the Black-Scholes formula, is the
cornerstone of modern finance and was devised by two Long-Term
Capital partners, Robert C. Merton and Myron S. Scholes, along
with one other scholar [Fisher Black]. It is based on the idea that
each new price is random, like a coin flip.
Long-Term Capital’s partners were shocked that their trades,
spanning multiple asset classes, crashed in unison. But markets
aren’t so random. In times of stress, the correlations rise. People in
a panic sell stocks—all stocks. Lenders who are under pressure
tighten credit to all.
And Long-Term Capital’s investments were far more correlated
than it realized. In different markets, it made essentially the same
bet: that risk premiums—the amount lenders charge for riskier
assets—would fall. Was it so surprising that when Russia
defaulted, risk premiums everywhere rose?
More recently, housing lenders—and the rating agencies who put
triple-A seals on mortgage securities—similarly misjudged the
29

correlations. The housing market of California was said to be
distinct from Florida’s; Arizona’s was not like Michigan’s. And
though one subprime holder might default, the odds that three or
six would default were exponentially less. Randomness ensured
(or so it was believed) a diverse performance; diversity guaranteed
safety.
[LTCM]’s partners likened their disaster to a “100-year flood”—a
freak event like [Hurricane] Katrina or the Chicago Cubs winning
the World Series... But their strategies would have lost big money
this year, too.
...If 100-year floods visit markets every decade or so, it is because
our knowledge of the cards in history’s deck keeps expanding.
(emphasis added) [17]
Of course, Lowenstein is not implying that any computer is doing
calculation on its own; rather, we should say that the more widely used models,
which rely exclusively on historical data, would have calculated slim odds of a
Great Depression before 1929, and substantially greater odds of one after. This
conundrum brings the fourth and final challenge of critical mathematical
modelling into view: generally put, this is the challenge of managing data. As
is well known in computing, “the quality of the output [of a model or
computer program] is a function of the quality of the input”; this is expressed
by the acronym and aphorism “GIGO”: “put garbage in and you get garbage
out” [18]. (The Jargon File offers the additional interpretation “Garbage In,
Gospel Out,” explaining, “this more recent expansion is a sardonic comment
on the tendency human beings have to put excessive trust in ‘computerized’
data” [19].) Although simple, it could be argued that the operators of the risk
models whose failure was the proximate cause of the current financial crisis
30

ignored or otherwise failed to observe the GIGO principle; that is, they put
garbage in (wittingly or unwittingly) and expected non-garbage out.
Lowenstein’s account highlights the primary dimension along which the
principle was violated: time. Analysts fed risk models historical price data,
expecting inferences made from that data to hold true in the future, even
under changed market conditions. What assumptions were being made
implicitly? Even in cases where the implicit assumptions were understood, the
social, political, economic, and/or financial mechanisms by which they were
expected to hold true were hazy at best. Niels Bohr is said once to have noted
that “prediction is very difficult, especially about the future.” The distinction
is important here; although modellers often wish to make predictions about
the future, the only data they have with which to make such predictions are
about the past.
If the primary dimension along which the GIGO principle was violated in
the context of models of financial risk is foregrounded by the question “data
from when?”, an additional such violation occurred when analysts asked
themselves the question “data about what?” This complication is highlighted
in an account of the current financial crisis by Felix Salmon, published in
February 2009 in Wired Magazine, entitled “Recipe for disaster: the formula
that killed Wall Street” [20]:
Bond investors also invest in pools of hundreds or even thousands
of mortgages. ...But mortgage pools are messier than most bonds.
There’s no guaranteed interest rate, since the amount of money
homeowners collectively pay back every month is a function of
how many have refinanced and how many have defaulted. There’s
certainly no fixed maturity date: Money shows up in irregular
chunks as people pay down their mortgages at unpredictable
31
times—for instance, when they decide to sell their house. And
most problematic, there’s no easy way to assign a single probability
to the chance of default.
Wall Street solved many of these problems through a process called
tranching, which divides a pool and allows for the creation of safe
bonds with a risk-free triple-A credit rating. Investors in the first
tranche, or slice, are first in line to be paid off. Those next in line
might get only a double-A credit rating on their tranche of bonds
but will be able to charge a higher interest rate for bearing the
slightly higher chance of default. And so on.
The reason that ratings agencies and investors felt so safe with the
triple-A tranches was that they believed there was no way
hundreds of homeowners would all default on their loans at the
same time. One person might lose his job, another might fall ill.
But those are individual calamities that don’t affect the mortgage
pool much as a whole: Everybody else is still making their
payments on time.
But not all calamities are individual, and tranching still hadn’t
solved all the problems of mortgage-pool risk. Some things, like
falling house prices, affect a large number of people at once. If
home values in your neighborhood decline and you lose some of
your equity, there’s a good chance your neighbors will lose theirs as
well. If, as a result, you default on your mortgage, there’s a higher
probability they will default, too. That’s called correlation—the
degree to which one variable moves in line with another—and
measuring it is an important part of determining how risky
mortgage bonds are.
32

...Using some relatively simple math...[analyst David X. Li, while
working at JPMorgan Chase in 2000] came up with an ingenious
way to model default correlation without even looking at historical
default data. Instead, he used market data about the prices of
instruments known as credit default swaps [insurance against
bond borrowers defaulting].
When the price of a credit default swap goes up, that indicates that
default risk has risen. Li’s breakthrough was that instead of
waiting to assemble enough historical data about actual defaults,
which are rare in the real world, he used historical prices from the
CDS market. It’s hard to build a historical model to predict
[borrower] Alice’s or [borrower] Britney’s behavior, but anybody
could see whether the price of credit default swaps on Britney
tended to move in the same direction as that on Alice. If it did, then
there was a strong correlation between Alice’s and Britney’s default
risks, as priced by the market. Li wrote a model that used price
rather than real-world default data as a shortcut (making an
implicit assumption that financial markets in general, and CDS
markets in particular, can price default risk correctly).
...The damage was foreseeable and, in fact, foreseen. In 1998, before
Li had even invented his copula function, Paul Wilmott wrote that
“the correlations between financial quantities are notoriously
unstable.” Wilmott, a quantitative-finance consultant and lecturer,
argued that no theory should be built on such unpredictable
parameters. And he wasn’t alone. During the boom years,
everybody could reel off reasons why the Gaussian copula function
wasn’t perfect. Li’s approach made no allowance for
33
unpredictability: It assumed that correlation was a constant rather
than something mercurial. Investment banks would regularly
phone [Stanford University professor of finance Darrell] Duffie and
ask him to come in and talk to them about exactly what Li’s copula
was. Every time, he would warn them that it was not suitable for
use in risk management or valuation.
In hindsight, ignoring those warnings looks foolhardy. But at the
time, it was easy. Banks dismissed them, partly because the
managers empowered to apply the brakes didn’t understand the
arguments between various arms of the quant universe. Besides,
they were making too much money to stop. [20]
So the analysts who deployed the Gaussian copula to price their
collateralized debt obligations fell prey to at least three of the challenges of
critical mathematical modelling. They were tripped up by the fourth challenge
(the challenge of data) when they failed to imagine that the possibility space
for future behavior might be different than that of past behavior, and deemed
their historical data sufficient for predicting future performance; and again
when they chose to assume that the market for credit default swaps would
accurately indicate both individual probabilities of default and default
correlations. As for the third challenge (the challenge of performativity):
almost single-handedly, Li’s application of the Gaussian copula to the pricing
of collateralized debt obligations transformed the market:
The effect on the securitization market was electric. Armed with
Li’s formula, Wall Street’s quants saw a new world of possibilities.
And the first thing they did was start creating a huge number of
brand-new triple-A securities. Using Li’s copula approach meant
34

that ratings agencies like Moody’s—or anybody wanting to model
the risk of a tranche—no longer needed to puzzle over the
underlying securities. All they needed was that correlation
number, and out would come a rating telling them how safe or
risky the tranche was.
As a result, just about anything could be bundled and turned into a
triple-A bond—corporate bonds, bank loans, mortgage-backed
securities, whatever you liked. The consequent pools were often
known as collateralized debt obligations, or CDOs. You could
tranche that pool and create a triple-A security even if none of the
components were themselves triple-A. You could even take
lower-rated tranches of other CDOs, put them in a pool, and
tranche them—an instrument known as a CDO-squared, which at
that point was so far removed from any actual underlying bond or
loan or mortgage that no one really had a clue what it included.
But it didn’t matter. All you needed was Li’s copula function.
The [credit default swap] and [collateralized debt obligation]
markets grew together, feeding on each other. At the end of 2001,
there was $920 billion in credit default swaps outstanding. By the
end of 2007, that number had skyrocketed to more than $62 trillion.
The CDO market, which stood at $275 billion in 2000, grew to $4.7
trillion by 2006. [20]
Finally, they were blindsided by the second challenge (the challenge of
reflexivity); in this case, the challenge was particularly great, as anyone
seriously confronting the inadequacy of the model for the task to which it was
being repeatedly applied would have risked substantial damage to their
paycheck. Analysts offering critiques of the model appear, at least in Salmon’s
35

account, to have been in institutional contexts in which the model was not
being applied; either in firms making use of different strategies, or, as in
Duffie’s case, in a university [20].
2.5 A
But these four challenges of critical mathematical modelling form the grounds
for nothing more than a technical critique; that is, they furnish language
(‘variables’, ‘reflexivity’, ‘performativity’, ‘data’) for answering ‘how can we
better model?’ without obviously touching the questions of what we are
modelling, for whose benefit, and to what end. Thus the four challenges of the
critical modeller articulated thus far align well with the ‘critical technical
practice’ articulated by the computer-scientist-turned-social-scientist Philip
Agre in his seminal essay “Toward a Critical Technical Practice: Lessons
Learned in Trying to Reform AI” (where “AI” indicates the ‘discipline’ of
artificial intelligence) [21] in that they bring concepts and practices from
outside the discipline proper to bear in evaluating the discipline’s success in
accomplishing its own goals, and use those concepts and practices to critique
and negotiate with existing concepts, assumptions, and practices within the
field in the hope of bringing about useful and substantive change. In theory,
such change might conceivably extend to a reconfiguration of the criteria by
which success is defined within the field; in my reading of Agre, while not
excluded, such a reconfiguration does not appear foregrounded. To the extent
that we limit ourselves to essentially technical critiques of technical
practice—i.e., critiques of the form “technical practice or method X is inferior
to practice or method Y in accomplishing agreed-upon technical objective
Z”—we are vulnerable to the accusation levelled, for example, by theorists
36

Fred Moten and Stefano Harney when they claim that “critical academics are
the professionals par excellence” [22] (p. 111). That is, the purpose of this kind
of (technical) critique is to evaluate and refine approaches to agreed-upon
“technical difficult[ies]” [21]; to provide a comprehensive analysis, or a
critique on grounds other than those customary within a particular discipline
or community of practice, one must step outside the technical language of
discipline (or, for Moten and Harney, ‘profession’):
...communities of composition teachers, mentorless graduate
students, adjunct Marxist historians, out or queer management
professors, state college ethnic studies departments, closed-down
film programs, visa-expired Yemeni student newspaper editors,
historically black college sociologists, and feminist engineers...what
will the university say of them? It will say they are unprofessional.
This is not an arbitrary charge. It is the charge against the more than
professional. [22] (p. 104; emphasis added)
What is ‘wrong’ with these figures? They are not, one might suggest,
objective in the traditional sense of the term: how can one be a ‘good engineer’
when one is also a feminist, or a ‘good management professor’ when one is
also queer? (For that matter, can one be a ‘good’ sociologist when one is also a
Republican? A ‘good’ paleobiologist and also a Christian?) Does not one run
the risk of (assumed) political commitments ‘polluting’ the work? Don’t
engineers and management researchers wear buttoned-down shirts and suits,
not skirts? Aren’t crosses forbidden in the biology department? Disciplinary
performances of political neutrality or scientific objectivity aside, I suggest
that, if we take ‘good’ to mean ‘ethically responsible’, one cannot be a ‘good’
engineer, or management professor, or anything else, without apprehending
and engaging the political dimensions of one’s ‘technical’ work—without, that
37
is, having a politics. Of course, ‘good’ does not traditionally mean ‘ethically
responsible’ in the technical disciplines.
How does one develop a language and, centrally, a practice of critical
engagement with disciplinary discourses in which it is acceptable and
‘productive’ to critique the activities (and objectives) of disciplinary
practitioners, and of ‘the discipline’ itself? What constitutes ‘productive’
engagement at all if there is no agreed-upon definition of ‘good’ or ‘useful’
practice; indeed, if the definition of ‘good practice’ is exactly what is being
contested in the process of critique? We can begin to get a handle on these
questions with two examples of disciplinary critique in which the practices
and/or relations under critique are not explicitly technical but rather concern
the relation of the discipline to institutional formations ‘outside’ itself.
The first, offered by the Institute for Applied Autonomy (IAA) under the
title “Engaging Ambivalence: Interventions in Engineering Culture” [23],
begins with a portrayal of the relationship between engineering research
within the U.S. university context and the Defense Advanced Research
Projects Agency (DARPA), and military objectives generally:
The most significant underwriter of engineering research in the
United States in the Department of Defense, largely acting through
the Defense Advanced Research Projects Agency (DARPA).
DARPA exists to channel funds from the military to academic and
corporate research labs in exchange for technological innovations
that serve the needs of its clients—the Army, Navy, Air Force, and
Marines. As DARPA public relations officers are fond of pointing
out, innovations funded by DARPA grants may also find
expression in civilian applications, particularly in the
communications and aerospace industries.
38

Researchers (‘principal investigators’) are held accountable to
DARPA programme managers via aggressive schedules of
milestones, deliverables, and administrative review. Framing this
process as a form of cultural co-production implicates both
researchers and military officers as active participants in
constructing military-funded civilian research, and highlights
tensions between martial and academic approaches to knowledge
production. This depiction reveals opportunities for interventions
that pose deep challenges to engineering culture. [23]
The IAA develops engineering projects based on metaphorical readings of
DARPA texts; for example,
our ‘Contestational Robotics’ (2004) initiative proceeds from a loose
reading of DARPA’s Tactical Mobile Robotics programme:
The Tactical Mobile Robotics program is developing
robotics technologies and platforms designed to
revolutionize dismounted ooperations by projecting
operational influence and situational awareness into
previously denied areas.
Recognising the references to ‘denied areas’ as a metaphor for the
privatisation of public space, we developed several devices that
allow artists, activists, and juvenile delinquents to ‘project
operational influence in ways that humans cannot by using reliable
semi-autonomous robotic platforms’. Like their military
counterparts, our graffiti writing and humanoid propaganda
machines are intended to perform actions too risky for human
39

actors—although, in our case, the ‘operations’ include
spray-painting slogans and distributing subversive literature, and
the ‘denied areas’ are government buildings, shopping malls, and
public streets. [23]
The IAA present their work “as ‘research findings’ at university lectures
and technical conferences”, and their projects “are reported on in engineering
journals and trade publications.” Their “critique of engineering practice”, they
argue, “thus comes from within engineering culture, and is given material
weight by the production of working artifacts.” The mechanism, then, is similar
to that employed by Agre in his critique of AI’s methods—the production of
working technical systems—but the objective is broader in scope:
...DARPA involvement in academia normalises ambivalence among
students and researchers. Although the agency’s motivation is to
enhance the military’s ability to win wars and kill enemies, open
declarations of martial efficacy are rare within academia. Instead,
DARPA-supported research is presented to the academic
community (including the students working on military projects)
in abstract terms, as ‘optimization algorithms’ and ‘enabling
technologies’. Civilian applications are highlighted, thus fostering
a sense that the particular (and, by extension, all) technologies are
neutral. The rhetorical work done by this positioning of military
research relies on the slippage between ‘dual use’ technologies,
which have a varied but limited set of military and civilian
applications, and ‘general purpose’ tools, which can be brought to
bear on virtually any problem. While it may be argued that in
practice there can be no such thing as a general purpose tool,
emphasising civilian applications for a DARPA-funded research
40

project downplays the particular application for which it has been
designed and frees the engineer from responsibility for the uses to
which it will most likely be put. The culture that celebrates
technology’s neutrality thus mobilizes ambivalence as a
mechanism that enables thoughtful, well-intentioned individuals
to work on projects they would otherwise find morally repugnant.
...By acting as engineers who address contentious political issues,
we undermine the normalised ambivalence that characterises
engineering practice. [Our] works thus act as Trojan horses,
carrying our critique through the gates of detachment that guard
engineers against taking responsibility for the products of their
labour. In lieu of ambivalence, we offer the engineering community
the image of an ‘engaged engineering’ that works diligently in the
service of freedom and human dignity, and takes responsibility for
the world it helps create. [23]
To use the terms of the second example of disciplinary critique, that offered
by human-computer interaction (HCI) researcher Nicholas Knouf, drawing on
the work of designer Victor Papanek, in his presentation to the “alt.chi”
session of the 2009 Computer-Human Interaction conference “HCI for the Real
World”, the politically engaged projects presented to the engineering
community by the Institute for Applied Autonomy “foreground the agency of
the designer” (or engineer). What does HCI’s comfortable and unquestioned
relationship with “the corporate world...mean in terms of an ethics of problem
choice,” asks Knouf, “meaning the considerations that influence what types of
design projects HCI researchers consider as important?” [24] (emphases in the
original) Knouf, following Papanek, offers a vision of design practice as
fundamentally socially and politically engaged:
41
...I must agree that the designer bears a responsibility for the way
the products he designs are received at the market place. But this is
still a narrow and parochial view. The designer’s responsibility
must go far beyond these considerations. His social and moral
judgment must be brought into place long before he begins to
design, since he has to make a judgment, and a prior judgment at
that, as to whether the products he is asked to design or redesign
merit his attention at all. In other words, will his design be on the
side of the social good or not. [25] (p. 66), as cited in [24]
Given this conception of design, Knouf argues that the close linking of HCI
with industrial concerns has brought “two diametrically opposed poles into
close proximity: corporatism, which exists to increase profits for shareholders,
and design, that ideally exists to improve the human conditions irrespective of
monetary gain.” Thus Knouf, although not operating extra-textually through
the demonstration of working technical systems as Agre and the IAA do,
encourages technical practitioners to consider objectives traditionally beyond
those normally prioritized in the technical practice of the discipline. His
critique, although perhaps perceived by some reviewers as snarky or strident,
seems generally to have been accepted by the disciplinary community as
well-articulated, relevant, and productive [26]; sufficiently so, at least, to have
been accepted for presentation and archival publication.
Where do these examples lead us in terms of a theory and practice of
socially and politically engaged critical mathematical modelling, in particular
when that modelling serves the purpose of economic analysis? The central
result, I would submit, is that the critical modeller—as practitioner, not just as
‘theorist’—is obliged to engage with the question “Why this project, and not
another?”—not only on the grounds of technical logics and ‘open problems’
42

already understood as ‘important’ within a particular disciplinary discourse,
but also on the grounds of personal values, beliefs, and politics, as they relate
to broader social, economic, political, and cultural concerns, trends, and
terrains. Under this rubric, then, the engineer who designs ‘optimization
algorithms’ ostensibly for ‘general use’ is obliged to address seriously the
question of whether or not said algorithms are in fact primarily for use in
missile guidance systems, and subsequently to either defend or renounce the
cultural and political logic which deems work in missile guidance acceptable;
similarly, the human-computer interaction researcher who works to
‘democratize access to information’ is encouraged to subject this easy slogan
to a more rigorous cultural and political analysis, and subsequently to
reaffirm, reposition, or reassess their technical work given this more broadly
situated understanding of its potential impacts, uses, preconditions, and/or
implications.
In considering this broader analysis, two caveats should be made clear. The
first is that it is unreasonable to expect any ‘designer’ to know the ways in
which a ‘design’ will be taken up, or will influence the lives of its ‘users’ (and
others); to postulate perfect knowledge would of course be to postulate a
perfect technological determinism. At the same time, I will argue that it is
utterly irresponsible to posit its opposite; a nuclear weapon is not a fork is not
a book. “The idea,” writes legal scholar Yochai Benkler, “is...distinct from a
naıve determinism”:
Different technologies make different kinds of human action and
interaction easier or harder to perform. All other things being
equal, things that are easier to do are more likely to be done, and
things that are harder to do are less likely to be done. All other
things are never equal. That is why technological determinism in
43

the strict sense—if you have technology “t,” you should expect
social structure or relation “s” to emerge—is false.
...Neither deterministic nor wholly malleable, technology sets some
parameters of individual and social action. It can make some
actions, relationships, organizations, and institutions easier to
pursue, and others harder. In a challenging environment—be the
challenges natural or human—it can make some behaviors obsolete
by increasing the efficacy of directly competitive strategies.
However, within the realm of the feasible—uses not rendered
impossible by the adoption or rejection of a technology—different
patterns of adoption and use can result in very different social
relations that emerge around a technology. Unless these patterns
are in competition, or unless even in competition they are not
catastrophically less effective at meeting the challenges, different
societies can persist with different patterns of use over long
periods. [27]
The onus, then, is on the designer, modeller, or analyst to imagine plausible
uptake scenarios for their technology, model, or narrative, and to make value
judgments about these scenarios. It is not at all obvious that any particular
methodology, disciplinary language, or approach should be naturally better
than any other in developing these scenarios of making judgments about
them; the problem, I submit, demands techniques and knowledges from many
disciplines. The questions and evaluations are as political as they are technical,
and as such the (self-)‘critique’ in ‘critical modelling’ requires the modeller not
only to assume but to explicitly articulate and defend a political position.
This being said, we should be wary of approaches that reduce the analysis
of sociotechnical systems or ‘ecologies’ to “the question of impacts.”
44

Sociologists Robert Latham and Saskia Sassen write:
...impacts are only one of several forms of intersection of society
and technology... Other forms of intersection have to do with the
constitution of whole new sociotechnical relations and
domains—digital formations—that in turn need to be constructed
as objects of study. This means examining the specific ways in
which these technologies are embedded in often very specialized
and distinct contexts. And it requires examining the mediating
cultures that organize the relation between these technologies and
users, where we might think of matters as diverse as gendering or
the utility logics that organize use. Because they are specific, these
mediating cultures can be highly diverse; for example, when the
objective is control and surveillance, the practices and dispositions
involved are likely to be different from those involved in using
electronic markets or engaging in large-scale computer-based
conversations. [28] (pp. 8-9)
Agre highlights these imbrications and complications as well:
Every technology fits, in its own unique way, into a far-flung
network of different sites of social practice. Some technologies are
employed in a specific site, and in those cases we often feel that we
can warrant clear cause-and-effect stories about the
transformations that have accompanied them, either in that site or
others. Other technologies are so ubiquitous—found contributing
to the evolution of the activities and relationships of so many
distinct sites of practice—that we have no idea how to being
45

reckoning their effects upon society, assuming that such a global
notion of “effects” even makes sense.
Computers fall in this latter category of ubiquitous technologies. In
fact, from an analytical standpoint, computers are worse than that.
Computers are representational artifacts, and the people who
design them often start by constructing representations of the
activities that are found in the sites where they will be used. This is
the purpose of systems analysis, for example, and of the systematic
mapping of conceptual entities and relationships in the early stages
of database design. A computer, then, does not simply have an
instrumental use in a given site of practice; the computer is
frequently about that site in its very design. In this sense computing
has been constituted as a kind of imperialism; it aims to reinvent
virtually every other site of practice in its own image. [21]
The analogy to be drawn here between ‘computers’ and ‘models’,
‘computing’ and ‘modelling’ is exact: modelling, like computing—indeed as a
precondition for computing, as beneath or implicit within every interactive
software system is a model of the user, and encoded within every database a
model of the knowledge it is designed to store, (re)order, and (re)present—is a
way of knowing, a way of seeing, a way of interacting with and acting in the
world.
The richness, texture, and flexibility of the analytic language called for here,
then, seems likely to exceed, for example, those developed for the formal
modelling approaches offered by Paul Weston and Heinz von Foerster as part
of efforts to develop a “second-order cybernetics” or “cybernetics of
cybernetics” (e.g., [29], as cited in [13]). Analyses grounded in assessments of
costs and benefits, argues Donna Haraway, are, although perhaps politically
46

useful, similarly deficient:
...there is a way of thinking about any technology that has the same
baleful effects as ...universal categories of human and machine, and
that is thinking in terms of costs and benefits. And if you can make
up an economic accounting sheet, an audit, you can audit a
technology for cost over here, benefits over there, who gets which
costs, who gets which benefits, and so forth. You handle it like an
accounting problem. And I think that’s a terrible mistake, or rather
that’s a tiny little bit of work that ought to come after we ask
questions like “What kind of world is this?” Literally, ontological
questions: What sorts of entities exist here, and with what kind of
relationality? What are the practices here? We might find much
more interesting things, including things that bear on who lives
and who dies, that aren’t well gotten at by thinking as an
accountant or cost-benefit analyst. [30]
In the case of formal models (or formal modelling languages), one might
wish to foreground the corollaries: what sorts of entities don’t exist here? what
ways of living and decision-making logics are written out, and go
unrepresented, unaccounted for? What is ‘marginalized’ in the ‘real’ world
becomes de-inscribed in the modeled world; it is not represented in the first
place; it does not exist at all.
Latham and Sassen, following Latour [31], note the instability of some of
the concepts fundamental to this flavor of analytical work:
We do not assume that technology and society are actually separate
entities, and we accept many of the propositions in the critical
social science literature that posit that technology is one particular
47

instantiation of society—society frozen, that is, one moment in a
trajectory that once might have been experienced as simply social.
Without losing this critical stance, we want, nevertheless, to
capture the distinctiveness and variable weight of “technology”
and to develop analytic categories that allow us to examine the
complex imbrications between the outcome of society that we call
technology and the social, economic, political, and cultural
dynamics through which relations and domains are constituted.
[28] (p. 1)
The critical modeller is confronted, then, with the task of developing a
model, and simultaneously with the task of understanding not only what it
says but what it does in the world; or, put another way, with the task of
understanding (and articulating and ‘defending’) not only the world it
represents but also the world it creates.
At this point I will leave off the discussion of critical mathematical
modelling in general terms. We proceed now to a detailed technical
description of the indices and models at hand, and subsequently to an
interpretation and discussion of the work aided by the critical apparatus
outlined above.
48

C 3
T
A visitor to the corner of the Beall Center for Art and Technology in which the
Capitalism Collaps-O-Meter was displayed between June 9 and June 12, 2009
was presented with three 36” x 24” prints mounted on a wall, each
accompanied by 8.5” x 11” wall texts divided into two sections; a fourth,
‘stand-alone’ 8.5” x 11” wall text; a 52” flatscreen LCD showing an interactive
visualization mounted on a freestanding cart; and a smaller flatscreen monitor
showing runtime logs and source code for the visualization. Each print
featured a plot of a different dataset. The first print featured a scatterplot
labeled “Bribe Payers Index” on the vertical axis, with nominal gross domestic
product per capita on the horizontal axis, with each data point on the plot
corresponding to (and labeled as) a particular nation-state; the second, a
similar scatterplot, labeled “Index of Imperial Domination” on the vertical axis
and “Fuel Exports, Percentage of Total Exports” on the horizontal axis; the
third, a vertical bar graph, with bars in red, labeled “Miles Per Casualty” on
the vertical axis and the years 2003 through 2008 on the horizontal axis. Each
print will be discussed in detail below.
3.1 B P I
The Bribe Payers Index (BPI) is an index constructed from data collected for
the nonprofit Transparency International (TI) in their 2008 Bribe Payers
Survey. In their words:
The 2008 Bribe Payers Survey consists of 2,742 interviews with
49

50

senior business executives in 26 countries and territories completed
between 5 August and 29 October 2008. The survey was carried out
on behalf of TI by Gallup International, which was responsible for
the overall implementation of the survey and the data quality
control process. Gallup International relied on a network of partner
institutions to carry out the survey locally.
The countries surveyed were selected on the basis of their Foreign
Direct Investment (FDI) inflows and imports, and importance of
regional trade. Total inflows of GDI and imports of goods from
these 26 countries amounted to 54 percent of world flows in 2006.
In each country there were a minimum of 100 senior business
executives interviewed and samples in each country were designed
taking into consideration the following variables: the size of firms,
sector and location. Additionally, due to the nature of the
phenomenon under analysis, the survey oversampled large and
foreign-owned firms.
To assess the international supply side of bribery reflected in the
2008 BPI, senior business executives were asked about the
likelihood of foreign firms from countries they have business
dealings with to engage in bribery when doing business in the
respondents’ country. In short, senior business executives provided
their informed perceptions of sources of foreign bribery, and these
views formed the basis of the 2008 BPI.
The 2008 BPI is calculated based on two questions from the Bribe
Payers Survey. Senior business executives were first asked which of
the 22 countries to be ranked they have commercial relationships
51

with. For those countries that they selected, they were then asked
to assess the frequency with which companies from these countries
engage in bribery when operating in their own (the respondents’)
countries. [32]
In TI’s report, countries are scored on a scale of 0 to 10, with a score of 10
indicating that companies based in that country were reported to never
engage in bribery. (No country received a score better than 8.8.) To create the
plot, I subtracted the scores from 10 in order to create an index that
approximated something like the (perceived) ‘frequency’ of bribery.
Along the horizontal axis I plotted nominal Gross Domestic Product per
capita.
3.2 I I D
The Index of Imperial Domination (IID) purports to quantify the degree to
which the political and financial elite of some nations control economic and
social policy in other nations. It is a per-country indicator. The value of D for a
given country indicates the extent to which policy in that country is
“dominated” by external actors. In particular, for a given country in a given
time period,
D =d
h + e
where d is the fraction of the country’s total government budget dedicated
to debt service in the period in question, and h is the fraction dedicated to
health care in that same period. In practice, this is computed as
52

53

D =dxx
h + e
where dx is the total debt service as a fraction of export earnings, x is the
total value of exported goods and services as a fraction of GDP, and h and e
indicate government expenditure on public health and public education
(respectively), as a fraction of GDP. These data are taken directly from the
World Resources Institute’s EarthTrends database [33], which for these
variables relies primarily on data adapted from the World Bank’s World
Development Indicators.
Countries with index values exceeding 1 spent a larger fraction of their
budgets in the period in question on external debt service than on public
health and education combined. This suggests that one interpretive approach
to the IID is to consider whether governments spending more money on debt
service than on health and education have effectively had their national
sovereignty compromised by the Bretton Woods institutions (the IMF and
World Bank in particular).
In the print, the Index of Imperial Domination is plotted against fuel
exports as a percentage of a nation’s total exports. This quantity can be read in
some cases as an indicator of the extent to which a nation’s economic life is
dependent on exports of fuel (primarily oil and natural gas), and has been
examined a great deal in discussions of the so-called “resource curse,” a
phrase used to denote the observation that “resource-poor economies often
vastly outperform resource-rich economies in economic growth” [34] (p. 1).
54

55
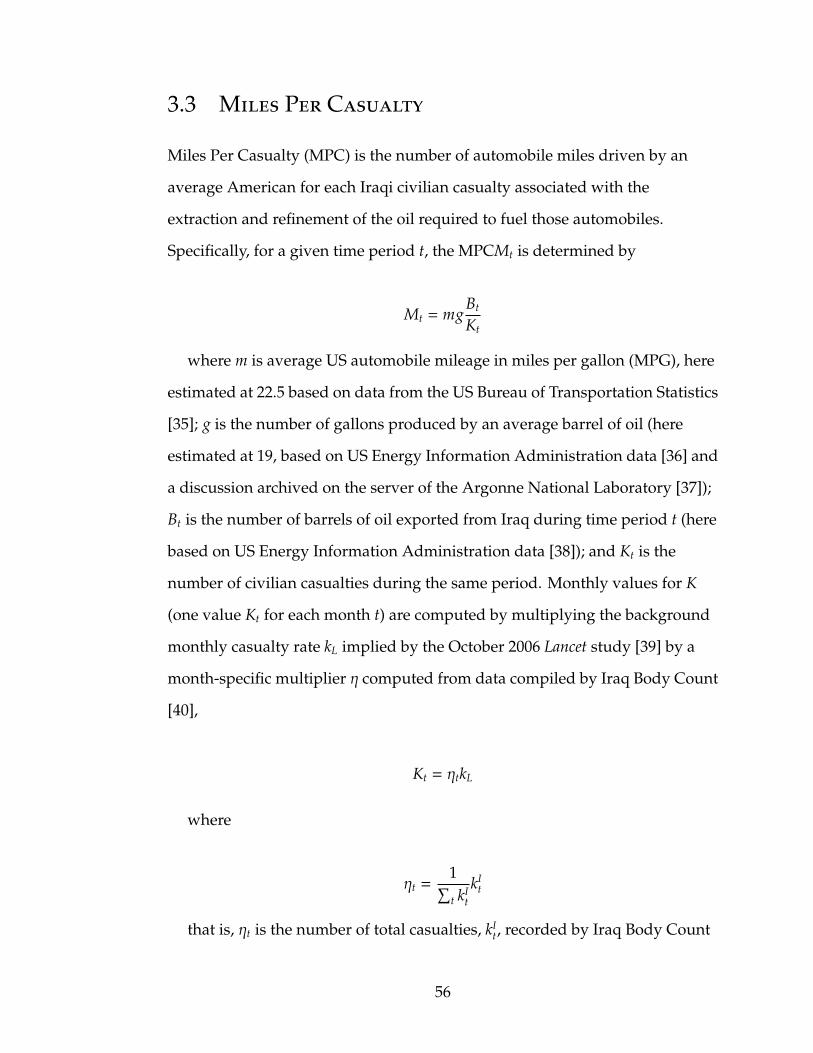
3.3 M P C
Miles Per Casualty (MPC) is the number of automobile miles driven by an
average American for each Iraqi civilian casualty associated with the
extraction and refinement of the oil required to fuel those automobiles.
Specifically, for a given time period t, the MPCMt is determined by
Mt = mgBt
Kt
where m is average US automobile mileage in miles per gallon (MPG), here
estimated at 22.5 based on data from the US Bureau of Transportation Statistics
[35]; g is the number of gallons produced by an average barrel of oil (here
estimated at 19, based on US Energy Information Administration data [36] and
a discussion archived on the server of the Argonne National Laboratory [37]);
Bt is the number of barrels of oil exported from Iraq during time period t (here
based on US Energy Information Administration data [38]); and Kt is the
number of civilian casualties during the same period. Monthly values for K
(one value Kt for each month t) are computed by multiplying the background
monthly casualty rate kL implied by the October 2006 Lancet study [39] by a
month-specific multiplier η computed from data compiled by Iraq Body Count
[40],
Kt = ηtkL
where
ηt =1∑t kI
t
kIt
that is, ηt is the number of total casualties, kIt, recorded by Iraq Body Count
56

in month t divided by∑
t kIt, the total casualties recorded by Iraq Body Count
over the study period.
57

3.4 C C-O-M
The Capitalism Collaps-O-Meter is a simulation of economic change with
allows the ‘user’ to manipulate different parameters describing a
social-political-economic system, and observe the effect of these parameters on
the distribution of incomes, ‘income utilities’, and ‘situated income utilities’ in
the system, and through these, their effect on the system’s position on a
hypothetical spectrum between ‘stability’ and ‘collapse’. For a population of
citizen-subjects (or, in the language of computational economics, ‘agents’) of a
given size n, at any time t the value of the Collaps-O-Meter c(t) ∈ [0, 1] is
defined by
c(t) = 1 −1
nv
n∑i=1
vi(t) (3.1)
where i = 1, 2, ...,n, and
vi(t) = αi(t)u(yi(t), y∗(t)) (3.2)
v(t) = u(y(t), y∗(t)) (3.3)
y(t) =1n
n∑i=1
yi(t) (3.4)
αi(y(t)) =1∑n
j=1 y j(t)
∑j:y j(t)≤yi(t)
y j(t) (3.5)
u(yi(t), y∗(t)) = exp(− exp[β(yi(t) − y∗(t))]
)(3.6)
58
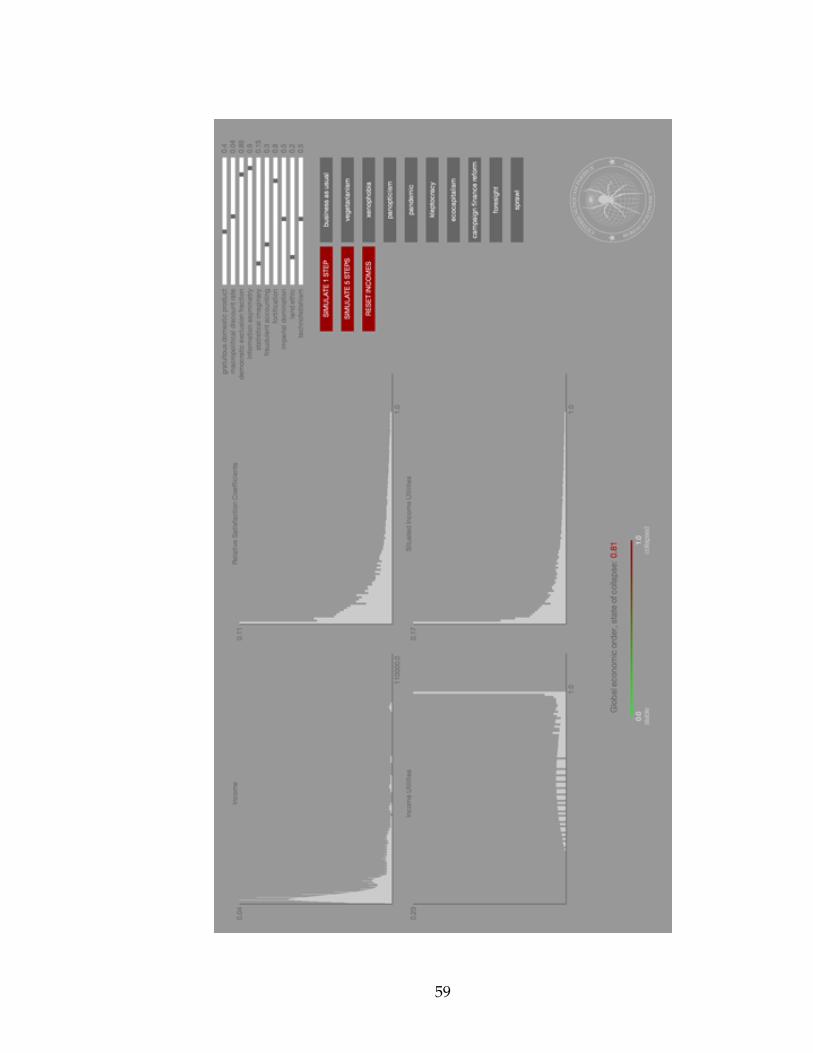
59

dy∗(t)dt
= gφDK − se (3.7)
dyi(t)dt
=(yi(t) − y∗(t)
) (gxi fφDK −
ser
)(3.8)
where
• yi(t) denotes the income of ‘agent’ i at simulation time t, and y(t) denotes
the vector of all incomes yi at time t;
• y(t) denotes the mean world income at time t;
• vi(t) denotes the ‘situated income utility’ obtained by agent i at time t as a
result of having income yi(t), given the global distribution of incomes
y(t);
• αi(t) is a ‘relative satisfaction coefficient’ used to represent the
assumption that an agent whose basic needs are met will be happier if it
is wealthier than most other agents in the population, and less happy if it
is less wealthy than most other agents in the population;
• u(yi(t), y∗(t)) is the ‘utility’ obtained by agent i at time t, given that its
income at that time is yi(t), and the global poverty line at that time is
y∗(t); and
• v(t) is the utility obtained by an agent with the mean global income y(t).
The parameters controlled by the sliders in the upper-right hand corner of
the interface are
• g ∈ [0, 1], the ‘gratuitous domestic product’;
• r ∈ [−1, 1], the ‘macropolitical discount rate’;
60

• x ∈ [0, 1], the ‘democratic exclusion fraction’;
• i ∈ [0, 1], ‘information asymmetry’;
• s ∈ [0, 1], ‘statistical imaginary’;
• f ∈ [0, 1], ‘fraudulent accounting’;
• φ ∈ [0, 1], ‘fortification’;
• D ∈ [0, 1], ‘imperial domination’;
• e ∈ [0, 1], ‘land ethic’; and
• K ∈ [0, 1], ‘technofetishism’.
When the interface is loaded (or when the ‘user’ clicks on the red ‘RESET
INCOMES’ button), the histogram in the upper left hand corner of the
interface (titled ‘Income’) is displayed, with a distribution that corresponds
roughly to the world distribution of income in 2006, according to the World
Resources Institute’s EarthTrends database [33]. The model is populated with
6197 ‘agents’, approximately one for every one million inhabitants of the world
in 2006. When the ‘user’ clicks the button ‘SIMULATE 1 STEP’, the model:
1. adjusts the incomes of each agent yi(t) based on the poverty line and the
parameter values the ‘user’ has chosen with the sliders (Eqn. 8);
2. adjusts the poverty line y∗(t) based on the parameter values the user has
chosen (Eqn. 7);
3. computes the ‘income utilities’ u(yi(t), y∗(t)) of each agent based on the
updated incomes and poverty line (Eqn. 6);
4. computes the ‘relative satisfaction coefficients’ αi(t) of each agent based
on the new global distribution of income (Eqn. 5);
61

5. computes the ‘situated income utilities’ vi(t) of each agent, which
weights their ‘raw’ income utilities with their relative satisfaction
coefficients (Eqn. 2); and finally
6. computes the value of economic collapse c(t) (Eqn. 1), which depends on
the income utility of a hypothetical agent with the mean global income
(Eqns. 3 and 4).
As each set of values is computed, the histograms in the interface are
updated; after the value of economic collapse is computed, the graphic at the
bottom of the interface is updated to reflect the new value. If the user clicks on
the button labeled ‘SIMULATE 5 STEPS’, the computational process is run 5
times before the visualizations are updated.
The gray buttons on the far right hand side of the interface (labeled
‘business as usual’, ‘vegetarianism’, ‘xenophobia’, etc.) can be understood as
‘scenarios’. Each scenario corresponds to a particular set of values for the
parameters. The scenarios are:
scenario name g r x i s f φ D e K
business as usual 0.6 0.04 0.8 0.8 0.1 0.5 0.8 0.5 0.2 0.6
vegetarianism 0.4 0.04 0.8 0.8 0.1 0.5 0.8 0.5 0.5 0.5
xenophobia 0.6 0.04 0.8 0.8 0.05 0.5 0.95 0.7 0.2 0.8
panopticism 0.6 0.04 0.8 0.5 0.3 0.3 0.8 0.5 0.2 0.9
pandemic 0.6 0.2 0.9 0.95 0.1 0.6 0.95 0.6 0.1 0.8
kleptocracy 0.6 0.1 0.8 0.9 0.1 0.9 0.9 0.7 0.2 0.6
ecocapitalism 0.4 0.04 0.8 0.8 0.2 0.5 0.8 0.5 0.6 0.6
campaign finance reform 0.55 0.04 0.5 0.8 0.1 0.4 0.8 0.5 0.2 0.6
foresight 0.6 -0.5 0.8 0.9 0.1 0.5 0.8 0.5 0.2 0.7
sprawl 0.8 0.08 0.8 0.9 0.1 0.5 0.7 0.5 0.05 0.8
62

Because scenarios cannot be ‘combined’ by clicking one button and then
another (say, ‘xenophobia’ followed by ‘panopticism’ in order to get
‘xenophobia plus panopticism’), the distinctive features of each scenario are
‘translated’ into the ‘language’ of the parameter set as changes made to the
‘business as usual’ scenario, which is used as a baseline.
63

3.5 T B E I
The Bureau of Economic Interpretation (BEI) is imagined as a hypothetical
research agency which might produce the indices and models presented here.
The circular BEI seal, a sphere covered in lines of latitude and longitude
overlaid by a stylized spider and surrounded by two stars and the Latin
phrase ‘ceteris nunquam paribus’, appears in the upper right hand corner of
all three prints and in the lower right hand corner of the interface to the
Collaps-O-Meter. This phrase is a reference to the condition one often finds in
discourses surrounding formal models of complex phenomena of all kinds,
‘ceteris paribus,’ meaning, ‘all else being equal.’ It often appears in the context
of prediction: “If [condition], then, ceteris paribus, [outcome].” ‘Nunquam’
means ‘never’, indicating a general skepticism about the habit of ignoring
variables presumed to be unimportant.
64

C 4
C
4.1 R B P I
The Bribe Payers Index, as discussed above, is compiled by a
nongovernmental organization called Transparency International (TI), which
self-describes as “the global civil society organisation leading the fight against
corruption.” Their “mission,” according to the ‘About’ page on their website,
“is to create change towards a world free of corruption” [41]. The original 2008
“Bribe Payers Index” is released in a 24-page report, available as a PDF on the
TI website, with associated press releases in English, French, Spanish, and
Japanese. In the report, the salient data—values of the Bribe Payers Index for
each country—are presented in tabular form on page 5, following a description
of the survey methodology. BPI values fall between 0 and 10; in TI’s original
formulation, a higher value indicates that survey respondents perceived
companies from the country in question as less likely to engage in bribery, not
more. This seemed counterintuitive to me; on a “Bribe Payers Index,” it
seemed to me, the most practiced ‘bribe payers’ ought to score the highest!
Accordingly, for the plot, I subtracted the original values from 10 in order to
reverse the ‘polarity’ of the index. In the index’s original discursive context,
however—a report published by a well-known NGO with an international
publicity apparatus, invested in fostering ‘transparency’ (and in being seen as
at least somewhat successful in fostering it)—it is not difficult to imagine that a
decision might have been made to equate a higher score with the ostensibly
preferable political condition (less perceived ‘bribery’). Additionally, this
65

ordering is commensurate with TI’s previous work; for example, the
widely-publicized ‘Corruption Perceptions Index’, on which ‘clean’ countries
like Denmark are ranked higher than ‘corrupt’ ones like Haiti [42].
“Corruption and bribery are complex transactions,” begins the introduction
to the 2008 BPI [32] (p. 2)—and certainly this is difficult to dispute. The
phenomenon quantified in the report, however—‘perceived bribery’—is more
rather than less conceptually opaque than the already slippery terms
‘corruption’ and ‘bribery’. By plotting perceived bribery as reported in the BPI
against nominal GDP per capita, the BPI plot helps us to ask what it means
both to quantify ‘bribery’ and, more specifically, to attempt to do so with data
collected through a survey of ostensibly well informed business executives
consisting of questions to be answered on a 5-point Likert scale. Why does
‘perceived bribery’ correlate negatively with GDP?
If we take the BPI (‘perceived bribery’) as a trustworthy proxy for ‘bribery’,
the correlation should encourage us to direct our attentions to the conditions
under which ‘bribery’ occurs, and what it achieves. Do businesspeople from
poorer nations have a stronger profit imperative than businesspeople from
richer ones, such that they turn to ‘bribery’ as a technique to ensure or
augment shareholder returns? Are they ‘less skilled’ at ‘business’ and
therefore find themselves compelled to use ‘bribery’ as a technique to achieve
the same sorts of returns as their competitors from wealthier (and perhaps
more ‘culturally’ business-savvy) nations?
Explanatory power can be read the other way on the plot, of course;
perhaps we should not look for GDP to explain bribery but rather for bribery
(or its lack) to explain GDP? Armed with this kind of plot (although perhaps
with the axes switched, so as to conform to the convention of plotting the
ostensibly ‘independent’ variable on the horizontal axis and the ‘dependent’
66

on the vertical), one could deploy fairly straightforwardly a narrative about
how poor countries are ‘held back’ economically by their endemic corruption,
or even by their cultural inability (so compellingly demonstrated by the
methodologically unobjectionable BPI, especially if one is prone to eliding
‘nation’ with ‘culture’—see e.g. Geert Hofstede’s much-cited Culture’s
Consequences [44]) to play by the sensible, rational, impartial, rules of global
capitalism. Indeed, the International Monetary Fund seems to have done
exactly this; on a page entitled “The IMF and good governance,” we learn that
“poor governance clearly is detrimental to economic activity and welfare”,
and that the IMF “promot[es] good governance through IMF surveillance,
lending, and technical assistance”, “work[ing] with its members to prevent
and address corruption in areas where the Fund has a mandate and expertise”:
These include, notably, public resource management and financial
sector soundness where the emphasis is on establishing strong and
transparent procedures and institutions in order to ensure
accountability. The Fund also helps strengthen countries’ capacity
to combat corruption by advising on appropriate anti-corruption
strategies, commissions, and legislation. [43]
In this way, then, narratives of corruption and poor governance as
explanatory factors for poverty have paved the way for international
intervention in the domestic policies of ostensibly sovereign nations. (The
effects of these interventions will be discussed at some length in the following
section, in the context of the Index of Imperial Domination.)
Another reading of the plot is to infer that the correlation implies that the
BPI (‘perceived bribery’) is a bad proxy for ‘bribery’, because respondents
simply use their preconceived ideas about different countries’ corruption or
lack thereof (which may be based substantially on widely-held knowledge
67
about relative national wealth) to make guesses about the relative frequencies
of bribery.
Yet another reading of the plot is that it problematizes ‘bribery’ as a globally
useful ontological category. Suppose we accept that GDP actually does
correlate meaningfully (negatively) with something the staff of a Berlin-based
NGO would recognize as ‘bribery’. Does this definition map onto notions of
what is or is not appropriate business practice in other cultural contexts? This
can be read as an argument about the ‘backwardness’ of poor nations or, just
as easily, about the perverse estrangement of the ‘economic’, the ‘political’,
and the ‘social’ in market ‘democracies’; if the reader refuses to take as
unproblematic the category of ‘bribery’, the plot, by marking difference, can
serve to render normalized practices in the ‘West’ anthropologically strange.
The plot does not, however, do this conceptual work ‘on its own’; it does not
take a straightforwardly didactic approach.
What else can we say the Bribe Payers Index does? TI’s report points out
that “much blame has been apportioned over the years to the bribe takers,”
those who pocket the wealth and take advantage of the influence
and authority that corruption affords them. And, indeed, bribe
takers must be exposed, prosecuted and appropriately punished.
The systems that breed this behaviour require holistic reform, so
that bribes are not demanded in the first place.
TI believes it is also critical to shine a spotlight on the bribe
payers—whose supply of bribes, irregular payments and other
forms of influence-buying fuel the machinery of corruption. [32] (p.
2)
This “shining the spotlight”, this foregrounding of the “supply side of
corruption” is ostensibly the purpose of the BPI report. As a discursive object,
68
I think it succeeds, even if the analytical categories deployed are somewhat
suspect and the method fraught. The report also claims, however, that “part of
TI’s mission” is “to curb the...supply side of corruption” (p. 2, emphasis
added). The report can be a first, taxonomic and perhaps even cartographic
piece of this project. But it has serious epistemological flaws that limit its use
in constructing actionable knowledge of its object. How would one go about
‘curbing’ the supply side of corruption? The report does little to imagine
approaches, to examine the conditions under which offering a bribe seems like
a reasonable thing to do (or the mechanisms which bring these conditions
about), or even to warn readers of issues which might contraindicate use of the
BPI data in such an examination. Rather, it “calls on governments and the
private sector to renew their efforts to curb the supply side of corruption” (p.
2). By plotting the BPI against GDP, the index is more easily deconstructed.
After doing this, we can more easily develop an understanding of what it can
and can’t (or at least shouldn’t) be used for.
How does the BPI—both in the report and plotted against GDP—encounter
the ‘challenges’ of ‘critical mathematical modelling’—‘variables’;
‘performativity’; ‘data’; ‘reflexivity’—outlined above? In fact, I read TI’s report
as being rather savvy about these challenges. If we take the stated objective of
the report—to ‘shine the spotlight’ on the ‘supply side of corruption’—at face
value, we can then assume that the report is self-consciously a performance. It
seems reasonable, following this, to imagine that an audience of NGOs and
their corporate and governmental sponsors might be partial (or at least
accustomed) to what they might perceive as the rational communication of
objective data and analysis. By conducting a survey of presumably reputable
businesspeople (especially a quantitative survey), the report authors leverage
the fantasy of objectivity and the fallacy of concreteness to gain discursive
69
legitimacy and achieve their performative objective. However, the flaws that
limit the index’s utility in usefully theorizing ‘bribery’ in such a way as to
guide ‘strategic’ or even ‘tactical’ action to mitigate some of the “extreme
inequity” [32] (p. 2) attributed to it highlight a well-discussed pathology of the
NGO sector: the staff of any organization which ‘solves’ the ‘problem’ it
publicly assigns itself is out of work. By dealing in perceptions and
abstractions, TI can safely foreground the ‘supply side of corruption’ while
refraining from generating actionable recommendations (for which their
method is unfit). A close reading of the plot of BPI vs. GDP suggests that if we
take the problem of ‘corruption’ as posed by TI seriously, the knowledge being
generated is inappropriate to the analytical task at hand. That non-actionable
knowledge is being generated (and generally lauded) is taken to indicate a
broader pathology in the context of knowledge production; here then I follow
Agre’s inclination to locate the “intellectual utility of technical exercises, aside
from the practical utility that they might actually have in the world,
...precisely in their limitations and failures”:
Perhaps we can learn to approach technical work in the spirit of
reductio ad absurdum: faced with a technical difficulty, perhaps we
can learn to diagnose it as deeply as possible. Some difficulties, of
course, will be superficial and transient. But others can serve as
symptoms of deep and systematic confusions in the field. We are
only aware of this possibility if we develop the critical tools to
understand the depths below the ordinary practices of a technical
field. Some of these critical tools will draw on the methods of
institutional and intellectual analysis that have served generations
of philosophers, sociologists, and literary critics. Others may be
responses, each sui generis, to the specific properties of technical
70

work. Research could proceed in a cycle, with each impasse
leading to critical insight, reformulation of underlying ideas and
methods, fresh starts, and more instructive impasses. [21]
Of course, in the case of statistical indices produced by international NGOs
ostensibly for the purpose of combating corruption (through which, it is
presumed, we will eventually combat “extreme inequity”, poverty, unequal
opportunity, and other ills many and various), we may sometimes find that
the failure to be of “practical utility” is itself an intellectual failure, and can be
read, as in this case, as symptomatic of larger structural or philosophical
contradictions.
4.2 R ( ) C
C-O-M
The Capitalism Collaps-O-Meter is a simulation and representation of
economic change. When the simulation is initialized, the operator is presented
with:
• a histogram labeled ‘Income’: this is a representation of the incomes of
the 6187 computational ‘agents’ which make up the ‘world’ of the
simulation;
• ten ‘sliders’, each corresponding to one of the model parameters
(‘gratuitous domestic product’, ‘information asymmetry’, etc.; see above
for the complete list);
• ten gray buttons, each corresponding to a ‘scenario’, or preprogrammed
collection of parameter settings (‘xenophobia’, ‘vegetarianism’, etc., see
above for the complete list);
71

• two red buttons, labeled ‘SIMULATE 1 STEP’ and ‘SIMULATE 5 STEPS’;
and
• a value between 0 and 1 indicating the state of the model economic
system, with a graphic indicating that a value of 0 corresponds to ‘stable’
and a value of 1 to ‘collapsed’.
In the current version, the income distribution corresponds roughly to the
world distribution of income in 2006, with each simulated ‘agent’
corresponding to a block of approximately one million human beings; based
on this distribution, the initial system ‘collapse value’ in this version is 0.81.
When the operator clicks the button labeled ‘SIMULATE 1 STEP’, the incomes
yi = y1, y2, ..., yn of each agent i = 1, 2, ...,n are updated according to the
formulae
dy∗(t)dt
= gφDK − se (4.1)
dyi(t)dt
=(yi(t) − y∗(t)
) (gxi fφDK −
ser
)(4.2)
y∗(t + τ) = y∗(t) +dy∗(t)
dtτ (4.3)
yi(t + τ) = yi(t) +dyi(t)
dtτ (4.4)
where y∗(t) is the ‘poverty line’ in the simulated world (in this version of the
model, initialized at 730, which could be taken to stand for USD 2 per day) and
τ is the length of a ‘time step’ (in this version of the model, always equal to 1).
Eqn. 11 can be interpreted as follows: At some time t + τ, the poverty line
y∗(t + τ) is equal to the poverty line at a prior time y∗(t) plus the derivative of
72

the poverty line with respect to time (that is, the ‘rate of change’ of the poverty
line) at the prior time, dy∗(t)dt , multiplied by the length of the interval between the
current time and the prior time, τ. Eqn. 12 can be read identically, substituting
the income of agent i, yi, for the poverty line y∗.
The rates of change used in Eqns. 11 and 12 to update the values of the
poverty line and agent incomes are defined in Eqns. 9 and 10. These equations
constitute what might be referred to as the ideological core of the model.
Recall from the prior section that g, x, i, f , φ, D, K, s, and e must lie between 0
and 1, and r must lie between -1 and 1. This means that Eqn. 10 describes the
world as existing in one of three regimes:
gxi fφDK −ser> 0 (4.5)
gxi fφDK −ser
= 0 (4.6)
gxi fφDK −ser< 0 (4.7)
We can call these Regime I, Regime II, and Regime III, respectively. Eqn. 10
can be expressed more simply as
dyi(t)dt
= pi(t)w (4.8)
where pi(t) = yi(t) − y∗(t) and w = gxi fφDK − ser . If pi(t) < 0, agent i’s income
is below the ‘poverty line’ y∗(t); agent i is ‘poor’. If at some time t the world is
in Regime I, then w > 0, and agents i with pi(t) < 0 will have dyi(t)dt < 0 also.
Conversely, in Regime I, agents with pi(t) > 0 will have dyi(t)dt > 0. That is:
In Regime I, the rich get richer and the poor get poorer.
73

If, on the other hand, w < 0, then agents i with pi(t) < 0 will have dyi(t)dt > 0;
that is:
In Regime III, the rich get less rich and the poor get less poor.
In Regime II, w = 0, so dyi(t)dt = 0 for all agents i: all incomes stay the same.
What causes the simulation to move between regimes? As g, x, i, f , φ, D,
and K increase in relation to s and e, the model economy moves toward (or
deeper into) Regime I. As s and e increase, it moves toward (or deeper into)
Regime III. As the discount rate r rises, the effect of s and e is reduced. If r is
negative, w is nonnegative and the model economy is in Regime I (unless
gxi fφDK − se = 0, in which case it is in Regime II).
Why arrange these parameters this way? In short, the model suggests that
g, x, i, f , φ, D, and K contribute to economic inequality over long times, while s
and e reduce it. These parameters are:
• g ∈ [0, 1], the ‘gratuitous domestic product’, denoting the fraction of
economic activity in excess of that required to fill human ‘needs’ (that
fraction which is ‘gratuitous’);
• r ∈ [−1, 1], the ‘macropolitical discount rate’. This is the ‘discount rate’
familiar to students of mainstream economic theory; that is, it is the rate
at which we “discount future benefits that come from current costs”. In
mainstream economic theory it is traditionally positive. I allow it to be
negative in the model to point to ongoing discussions in the economics
of climate change, which suggest that if we believe that climate change
will seriously damage economic activity if steps are not taken ‘ahead of
time’ to mitigate its effects, then we should apply a negative discount
rate in evaluating economic decisions (eg., [45]). Upon some reflection, I
suspect that w = 1r gxi fφDK − se may more accurately reflect this
74
analytical position than the expression used in the current version of the
simulation.
• x ∈ [0, 1], the ‘democratic exclusion fraction’, denoting the fraction of the
population excluded from taking part in political and economic
decisions which affect their lives and livelihoods;
• i ∈ [0, 1], ‘information asymmetry’, denoting the extent to which these
decisions are discussed and taken effectively in secret;
• f ∈ [0, 1], ‘fraudulent accounting’, denoting the extent to which complex
systems of economic bookkeeping are gamed (e.g., Enron);
• φ ∈ [0, 1], ‘fortification’, denoting the extent to which, although
‘globalization’ may facilitate transnational flows of capital, media, and
‘intellectual property’, transnational flows of persons are often strictly
regulated;
• D ∈ [0, 1], ‘imperial domination’, a normalized version of the Index of
Imperial Domination discussed in the previous section;
• K ∈ [0, 1], ‘technofetishism’, denoting the extent to which policymakers
tend to look for ‘silver bullet’ technological or policy ‘fixes’ for complex
social-political-cultural ‘problems’;
• s ∈ [0, 1], ‘statistical imaginary’, standing in for Immanuel Kant’s notion
of “enlarged mentality” (later taken up by Hannah Arendt), “the
capacity to think...from the standpoint of everyone else” [46]; and
• e ∈ [0, 1], ‘land ethic’, indicating the prevalence in the simulated world of
the land ethic promulgated by Aldo Leopold, in which “a thing is right
75

when it tends to preserve the integrity, stability, and beauty of the biotic
community” and “is wrong when it tends otherwise” [47].
That is: in the model, gratuitous products, democratic exclusion,
information asymmetry, fraudulent accounting, fortification, imperial
domination, technofetishism, and a high discount rate are all seen as
contributing to economic equality over long times; a statistical imagination (or
“enlarged mentality”) and widespread land ethic are seen as eroding it.
In the current version of the model, all of the parameters are independent,
and under direct operator control; that is, they are ‘exogenous’. One might
imagine a more sophisticated model in which the parameters interacted (that
is, in which they were ‘endogenous’: given an initial value for each parameter,
the model computes a new value at each time step without additional operator
input). Consider for example
d fdt
= c1K + c2x + c3i (4.9)
dxdt
= c4i (4.10)
didt
= c5x + c6αK (4.11)
α = D − D (4.12)
and suppose we select 0 < c j ≤1
100 for j = 1, 2, ..., 6. Then we can interpret
these equations as follows:
Eqn. 17 indicates that fraudulent accounting increases as technofetishism,
democratic exclusion, and information asymmetry increase.
76

Eqn. 18 indicates that democratic exclusion increases as information
asymmetry increases.
Eqn. 19 indicates that information asymmetry increases as democratic
exclusion increases, and
• increases as technofetishism increases, if α > 0,
• decreases as technofetishism increases, if α < 0, and
• is independent of technofetishism, if α = 0.
Recall from the previous section that in the original formulation, the Index
of Imperial Domination can be any nonnegative number; that is, Doriginal > 0.
In the Collaps-O-Meter, however, imperial domination is represented as a
number between 0 and 1: 0 ≤ D ≤ 1. We can say (perhaps appropriately) that
in the Collaps-O-Meter, imperial domination is ‘normalized’. To do this, one
‘maps’ the original space (the ‘domain’) of values ‘onto’ the new space (the
‘range’). It is difficult (but not impossible) to map an infinite domain onto a
finite range, so for the sake of simplicity we may be inclined to select a finite
domain. But recall that the Index of Imperial Domination as originally
formulated conveys what might be described as politically salient information
around 1; because the IID is the ratio of external debt service expenditures to
public health and education expenditures, a value of D > 1 indicates external
debt service greater than domestic expenditures on education and health
combined. The politically salient value in the normalized index will depend
on the normalization process. Suppose we decide to normalize by selecting a
finite domain 0 ≤ Doriginal ≤ Dmax, where Dmax is the largest value in the set (3.7
in the plot above) and mapping it onto the interval between 0 and 1. Then the
politically salient value becomes 1Dmax
; in any event, it is also between 0 and 1.
We may wish to perform some other normalization procedure: for example,
77
we may wish to select the finite domain between 0 and 2Dmax, or some other
multiple of Dmax; alternatively, we may wish to select the infinite domain
0 ≤ Doriginal < ∞. In any event, we can find the politically salient value that
corresponds to 1 in the original formulation. We can insert this value into the
expanded formulation of the Collaps-O-Meter as D. Then, following Eqn. 20
above,
• α > 0 indicates external debt service expenditures greater than health
and education expenditures combined;
• α = 0 indicates debt service equal to combined health and education
expenditures; and
• α < 0 indicates debt service less than combined health and education
expenditures.
This construction then encodes a belief that the ratio between external debt
service and combined health and education expenditures is a good way to
predict the political effects of widespread use of technology: it says in effect, “if
government is captured by external interests, technology uptake will lead to
greater economic inequality; if not, it can, depending on other factors, lead to
greater economic equality.” This is not too far from a mathematical articulation
of Benkler’s position, cited earlier, on “technological determinism”—
Different technologies make different kinds of human action and
interaction easier or harder to perform. All other things being
equal, things that are easier to do are more likely to be done, and
things that are harder to do are less likely to be done. All other
things are never equal.1 That is why technological determinism in the
1That is, ceteris nunquam paribus.
78
strict sense—if you have technology “t,” you should expect social
structure or relation “s” to emerge—is false. [27] (emphasis added)
—although it does not represent the more subtle relation between
‘technology’ and ‘society’ offered by Latour (“technology is society made
durable” [31]).
Note also that Eqns. 18-19 define a ‘positive feedback loop’: greater
democratic exclusion leads to greater information asymmetry (Eqn. 19), which
leads in turn to greater democratic exclusion (Eqn. 18). Feedback loops (both
‘positive’ and ‘negative’) are a common feature of models of this flavor.
Nobel laureate in economics George Akerlof and his Yale University
collaborator Robert Shiller (one of two namesakes of the widely used
Case-Shiller home price index), in what may have been the most anticipated
monograph-length publication to come out of economics as a discipline in the
first half of 2009, write, in the opening paragraph of their book Animal Spirits:
How Human Psychology Drives the Economy, and Why It Matters for Global
Capitalism:
To understand how economies work and how we can manage
them and prosper, we must pay attention to the thought patterns
that animate people’s ideas and feelings, their animal spirits. We
will never really understand important economic events unless we
confront the fact that their causes are largely mental in nature.
It is unfortunate that most economists and business writers
apparently do not seem to appreciate this and thus often fall back
on the most tortured and artificial interpretations of economic
events. They assume that variations in individual feelings,
impressions, and passions do not matter in the aggregate and that
79

economic events are driven by inscrutable technical factors or
erratic government action. In fact, as we shall discover in this book,
the origins of these events are quite familiar and are found in our
own everyday thinking. [49] (p. 1; emphasis in the original)
Akerlof and Shiller are not quibbling about so much about the way in
which, say, interest rates affect business investment, or fiscal policy affects
unemployment; rather, they are saying that these are not the only things that
matter; that the concepts that have populated previous efforts of academic
economics to model ‘the economy’ (indeed, the world, or at least the parts of it
that were taken to mattered) have been inadequate. New nouns, new entities,
are needed. Akerlof and Shiller offer a few:
This book will describe five different aspects of animal spirits and
how they affect economic decisions—confidence, fairness, corruption
and antisocial behavior, money illusion, and stories:
• The cornerstone of our theory is confidence and the feedback
mechanisms between it and the economy that amplify
disturbances.
• The setting of wages and prices depends largely on concerns
about fairness.
• We acknowledge the temptation toward corrupt and antisocial
behavior and their role in the economy.
• Money illusion is another cornerstone of our theory. The public
is confused by inflation or deflation and does not reason
through its effects.
• Finally, our sense of reality, of who we are and what we are
doing, is intertwined with the story of our lives and of the
80

lives of others. The aggregate of such stories is a national or
international story, which itself plays an important role in the
economy. [49] (pp. 5-6; emphasis in the original)
This proposal would have been economic heresy not more than ten years
ago, because the orthodox discourse of the discipline had no room for these
entities; indeed, for entities that exceeded the rational actor, the calculating
firm, the efficient market, and those other abstractions with which analysts
and critics of economic thinking will already be familiar. Akerlof and Shiller’s
contribution to contemporary economic discourse is anticipated exactly by
Haraway’s “ontological questions”:
“What kind of world is this?” ...What sorts of entities exist here, and
with what kind of relationality? What are the practices here? [30]
That is, Akerlof and Shiller’s contribution is an ontological one: they have
added new entities to the world of economic analysis. They suggest a
‘something else’ that might, in their view, be important “to understand how
economies work.”
Although it may be an important contribution, I do not believe that Akerlof
and Shiller’s model will be found to “explain fully and naturally how the U.S.
economy, and indeed the world economy, has fallen into the current crisis”
[49] (pp. 6-7), as they claim it does; that is, it will not be the last word on the
psychology of economic life and its implications for policy, even within the
discipline of economics. Rather, I suspect it will begin a series of ontological
inquiries, renewing discussions and reopening questions thought closed
within the discipline for centuries. The Collaps-O-Meter purports to perform a
similar discursive maneuver; through it I suggest that peculiar and often
‘subjectively’ defined ‘parameters’ (like ‘gratuitous domestic product’,
81

‘fortification’, and ‘statistical imaginary’) might be important objects in the
world of (political) economic analysis. Like (for example), “stories,” a complex
set of socio-techno-cultural artifacts and practices are imbricated in each
ostensibly unitary ‘parameter.’ The model presented here, I suggest, is thus
the kind of artifact that might play a role in the ongoing ontological
reconstruction of our understandings of economic life.
82

C 5
T
What began as merely a ‘financial crisis’ and developed into an ‘economic
crisis’ has in turn become what might be called an ‘ontological crisis’. It turns
out that it has simultaneously become an ideological and epistemological
crisis. In October of 2008, as real estate markets across the United States
collapsed, global stock markets crashed and volatility spiked, and liquidity
evaporated as a contagion of fear spread throughout the banking system, each
bank uncertain which of their peers would be the next to collapse,
ex-“maestro” Alan Greenspan publicly declared intellectual bankruptcy on the
floor of the United States House of Representatives. “Your view of the world,
your ideology, was not working,” California Representative Henry Waxman
accused him. “Absolutely, precisely,” replied the former Federal Reserve
Chairman. “That’s precisely the reason I was shocked,” he continued,
“because I have been going for 40 years or more with very considerable
evidence that it was working exceptionally well” [3]. In April of 2009, Seth
Freeman, a professor with appointments at the business schools of both
Columbia University and New York University published an op-ed in the New
York Times which began:
Since I don’t understand the economic crisis, I listen to lots of talk
and go to lots of conferences about it. I still don’t understand it, but
my efforts have led me to some surprises: How tempting it is to
say, “I understand,” how hard it is to govern well, and how little
anyone really knows. I’ve seen that the pretense of our scientific
understanding of economics is false, which means that a hidden
83

gift of the crisis is its insistent invitation to be humble and grateful,
and respond accordingly.
At a recent economics conference, one speaker confessed he’d been
so humbled by the crisis that he’d stopped calling himself an
economist. Almost none had seen the collapse coming. The field,
he’d realized, simply didn’t understand its subject. Later he asked
a top economist: How do we know what to do about the crisis?
What’s the basis for our knowledge? The man placidly replied he
thought his side was right. His response—or lack of one—echoed
loudly. What do we really know? [48]
As of this writing, the Princeton University Press website for Akerlof and
Shiller’s book Animal Spirits comes up as the second hit on Google’s results
page for the query “animal spirits,” after a website about shamanism [50]. In
light of Freeman’s account, the juxtaposition with shamanism hardly seems
inappropriate: the explanatory and predictive powers of shamanism (and
their epistemological grounding) seem to compare favorably with those of
academic economics; conversely, the dogmatic conviction apparently inspired
by academic economics compares well with that inspired by any venerable
and long-lived religious faith. As the journalistic accounts discussed in
previous sections highlight, doubt—that most reputable methodological tool
of positivist knowledge-making since before Descartes—has become
unprofitable (‘disincentivized’, we might say) among the makers of economic
knowledge.
The purpose of this comparison is not to rehearse boring old performances
of the ‘science wars’, or to build a wall around the citadel of ‘science’ or some
other hypothetical ‘reality-based community’ characterized by ostensibly
‘rigorous’ methodological practices and epistemological groundings,
84

somehow unpolluted by the temptations of the ‘outside’ world, and to cast the
economists out of the city with the barbarians and primitives. Rather: after
acknowledging the instability, provisionality, and strictly limited
generalizability of our (in this case economic) knowledge, we can begin
meaningfully to ask questions about those limits, and to develop a generative
relationship with our ignorance. We return to Freeman, who at this point in
his discussion turns to literature for an understanding of his discipline’s
epistemological predicament:
In “War and Peace,” Leo Tolstoy describes a German officer so
confident of his battle plan he believes only a fool could question it.
Yet, it’s so complicated, assumes so much, and so ignores human
behavior that it’s doomed. Still, the officer is set: If his plan fails,
it’ll be because lesser men failed to perform it.
Tolstoy’s thinking about war comes to mind a lot lately because it
challenges our belief that we understand highly complex events.
He argues war is too complex for anyone to fathom. Studies
strongly suggest he’s right: that wars occur in predictably
unpredictable ways, like avalanches and stock market crashes.
There may be many complexities we cannot fully grasp or control.
This idea that the world is uncontrollable challenges ideals of the
Enlightenment, which sought to master human behavior as
physicists master the universe. We cannot. Isaac Newton himself
discovered this truth when he got caught up in one of the first
speculative bubbles—a craze involving stock of the South Sea
Company. When the bubble burst, thousands took huge
losses—including Newton. “I can calculate the motion of heavenly
bodies,” Newton said, “but not the madness of people.”
85

At one conference, a panelist confidently asserted we should let the
banks fail. An audience member challenged him, explaining how
she’d helped the government quietly and inexpensively solve an
earlier bank crisis. The panelist seemed unimpressed. But her story
told me we sometimes get things right, and that experience may
matter more than theory in highly complex situations. [48]
Epistemologically, then, where do we stand? How are we to theorize our
relation to our own (putative) knowledge, and make decisions in vast and
complex systems whose responses to our own actions (let alone those of our
governments’ policy apparatus) we cannot fully predict, or perhaps know at
all, even after they occur? One (perhaps reasonable) reaction is simply to
chuckle, observe that the economists have finally caught up to Lyotard (or
perhaps vice versa), and move on with our lives and our thick descriptions,
close readings, microhistories, and so forth. But to turn willfully away from
the examination of complex transnational systems—to refuse to engage the
‘micro-to-macro’ question—is, in a sense, to abdicate responsibility for
understanding our own material conditions; it is to abjure the political. If, as
Garrett Hardin suggested in his (much misappropriated) 1968 essay on “the
tragedy of the commons”, “the morality of an act is a function of the state of
the system [in which it is performed] at the time it is performed” [51]—and
possibly, by extension, of its effects on future states of the ‘system’—then it
seems to follow that even while we commit to a healthy skepticism of theories,
we remain obligated to theorize.
What kind of theorization? Given the epistemological constraints operating
in the domain of ‘economic’ inquiry, it seems sensible to supplant ‘analysis’—a
reductionist technique involving the lysis, the breaking up, of an ostensibly
unproblematically delineated ‘whole’ (which might in this case be taken as
86

‘the economy’, the object of analysis)—with, as Agre says in a different
context, “something more like hermeneutics” [21]. In complex systems,
‘agents’ tend to act ‘locally’, but their actions sometimes have effects at scales
beyond that which they can perceive directly—beyond the ‘local’. In
‘studying’ the system sometimes called ‘the global economy’, the ‘student’ (a
term I find preferable to, say, ‘analyst’) is necessarily also an ‘agent’: to use
Haraway’s terminology, they are situated somewhere specific in the ‘system’
under study. In fact, as von Foerster pointed out, situatedness within the
system is a precondition for the ability to study it at all [13]. So we must begin
where we find ourselves, and attempt to understand the ways in which local
options, actions, and interpretations are conditioned by, and condition in their
turn, the macroscopic state and trajectory of the ‘system’—as well as our
understanding of it. In attempting to understand the constitution of the ‘local’,
our attention is directed ‘outward’, both spatially and temporally, and we
encounter larger-scale phenomena that must be explained in turn by some
combination of larger- and smaller-scale phenomena; that is, by the interaction
of processes in and across other ‘local[e]s’. The process is hermeneutic;
applied to ‘economic’ phenomena, it seems reasonable to refer to such a
method as ‘economic interpretation’. Miscreant humanists Kavita Philip and
Ackbar Abbas, in articulating “poor theory”, offer an orientation relevant to
this approach, and to the concerns of economists suffering from
epistemological shock:
Poor theory is less a theory than a way of proceeding.
Poor theory proposes to find ways of making the most of limited
resources.
Poor theory uses the tools at hand to take the present to task. In the
process it tinkers with theoretical technique and analytical object.
87

Poor theory suggests the need to work around intransigent
problems, when clear solutions are not discernible and the means
at our disposal are limited.
Poor theory reflexively re-encounters the history of theory through
paying attention to the murky, unsystematic practices and
discourses of everyday life. Poor theory is conditioned by reflexive
imbrication with probable pasts and arguments with/about possible
futures, and thus comes to see the present, too, as heterotemporal.
Poor theory proceeds not through tabula rasa, not by wiping the
slate clean and starting afresh. That, to some extent, was the
modernist aspiration, which has proven to be always costly and
often undesirable. By contrast, poor theory proceeds through
appropriations and improvisations, through descriptions that do
not leave what it describes unchanged.
Poor theory is theory shaped by the fact that we are always
confronted by objects and situations that are ‘riddled with error’
(Benjamin) and that outpace theory. Critically using the tools at
hand, poor theory questions their construction and re-orients their
practice. Tinkering calls for a tactical, recombinatorial,
experimental ethic toward theoretical objects, and an historical
analysis of the changing political contexts of intellectual inquiry.
Poor theory suggests not a resignation to epistemological futility
but an openness to that which outpaces understanding. Objects of
analysis present, in their contingency, in their being unsystematic, a
degree of intransigence that frustrates mastery. The intractability of
the object throws into relief the possibility of error in our methods.
88

[52]
Models reliant on economic rationality have always been haunted by its
other—by the excess, the irrationality, immediately and patently apparent in
any study of human ‘economic’ behavior. In economic models, as Philip
points out, “remainders, residuals, and ghosts...have been problems to explain
away, but in moments of crisis, they are mechanisms of bringing back
fragments of meaning formerly discarded” [53]. It is (epistemologically) worse
even than this: these excesses and residuals are posited as the fundamental
driving forces, the explanatory factors for, crises and otherwise inexplicable
phenomena. Consider for example a 2006 paper by economists Sharon
Harrison and Mark Weder describing a quantitative model simulation in
which “the residual from a regression from the spread on fundamentals is
taken to measure nonfundamental confidence” [54] (p. 1328). Under certain
model conditions, “changes in agents’ expectations are self-fulfilling and
therefore serve as a primary impulse behind [economic] fluctuations. [They]
find that such a model, driven only by these measured [autonomous changes
in agents’ expectations, also called] sunspot shocks, can explain well the entire
Depression era” [54] (p. 1328). The sources of these shocks are not modelled;
they are simply represented. A reasonable interpretation of Harrison and
Weder’s claim, then, seems to be: the behavior of the US economy during the
Depression era can be explained (only) by phenomena that lie entirely outside the
purview of economics as a discipline. In economic theory ‘sunspot shocks’ and
‘animal spirits’ have come to serve a function analogous to ‘idiopathy’ in
medicine, or ‘the cosmological constant’ and ‘quintessence’ in general
relativity: they are ‘fudge factors’, wielded as necessary to bridge the gap
between the predictions offered by the model as derived logically from
disciplinary first principles and the apparent reality. These residuals can be
89

named and even quantified, but not, by and large, modelled or explained.
This, I would suggest, is exactly what Akerlof and Shiller are up to in naming
their ‘animal spirits’ (‘confidence’, ‘fairness’, ‘corruption’, and so on, as
described in the previous chapter) [49] (pp. 6-7). This taxonomy seems hardly
more than the proliferation, renaming, and clever (i.e., empirically—and
perhaps more importantly, intuitively—plausible) arrangement of additional
fudge factors: idiopathies, quintessences, cosmological constants. That is: if
we follow Akerlof and Shiller, we will find that we are playing games and
inventing categories, not “paying attention to the murky, unsystematic
practices and discourses of everyday life” [52]; we are not doing “poor
theory”—we are just theorizing poorly.
Is there space for, say, a ‘poor systems theory’, or, put another way, a
practical approach to the study of complex systems which takes into account,
even leverages, the limits of our own knowledge (the ‘challenges’ of ‘critical
mathematical modelling’)? Does mathematical modelling have any place in
this approach (or, more likely, set of approaches)? These experiments in
‘critical mathematical modelling’ highlight the flexibility of mathematics as
language, modelling as thought technique, visualization as communicative
apparatus, and simulation as medium for political and epistemological
critique and world-making. These are not bad things to remember, or
foreground, even if they are hardly novel results. They offer little consolation,
admittedly, to the modeller interested in generating comprehensive (and
especially predictive) models of complex ‘social-ecological’ systems, and
confronted by the challenges enumerated in the discussion here. It is hoped
however that this discussion serves to point simultaneously to the utility of
quantitative modelling as a speculative method, and to its perils as a
predictive method. Both, I suggest, have been historically under-emphasized.
90

C 6
C
I offer the following conclusions about modelling, economics in the
contemporary moment, and ‘critical mathematical modelling’.
• Predictive modelling of complex social-political-economic-ecological
‘systems’ confronts a number of technical challenges:
– Ontological challenge. What kinds of entities exist in the world (or
‘system’) being modelled; of these, which are most relevant to the
phenomena under investigation? In modelling terms, what
variables are required?
– Epistemological challenge. How do we get enough data to make
the predictions we want to make? How do we know when we have
enough? If we are making predictions about the future, are we sure
that we can make them only with data about the past?
– Challenge of performativity. Sometimes theory acts on its ‘object’
(or, a model acts on the ‘system’ being modelled). This is because
the theorist/modeller is necessarily a part of the object/system being
theorized/modelled, even if they choose not to represent it in a way
that makes this obvious. In fact, this is a precondition for
theorization/modelling. A predictive model of a system must take
into account the possibility that the existence of the model itself
(within the system, as it necessarily is) will alter the behavior of the
system.
91

– Challenge of objectivity. Sometimes a model of a system tells us
more about the modeller than about the system. To what extent this
has occurred in any particular instance of modelling is often
difficult to know, especially if the other modellers who are available
for comment tend to think about the system in question in the same
terms as the modeller whose model we wish to inquire about.
• Additionally, a modeller may be confronted with the challenge of
examining the ethical or political implications of their model, especially
in the event that it comes to be widely taken up and acquires some
degree of performative force. Often this is not seen as a ‘technical’
modelling challenge, because the disciplines involved in modelling lack
the language to apprehend ethical or political questions. Put another
way, this is a technical question, but usually in another discipline.
• As of this writing, the understanding of economic activity and of the
contemporary political-economic moment offered by economics as an
academic discipline has failed to address all four of the technical
challenges:
– Ontological challenge. The kinds of actors that populate economic
models do not, generally speaking exist in the world. Conversely,
the kinds of actors that populate the world that economic models
attempt to represent possess properties and develop agencies that
are important to understanding economic activity but are omitted
from economic models.
– Epistemological challenge. Given the entities populating current
economic models, it appears that the past is not a useful guide to the
future. Economists, however, persist in acting as though it is.
92

– Challenge of performativity. Economic theory has shaped and
continues to shape the world that it now measures. Economic
theory includes no theory of its own action on the world, however.
– Challenge of objectivity. Economic theory has been radically
historically determined. Economic theory includes no theory of its
own historical development, however.
• Economic theory purports to be value-neutral, non-normative, apolitical,
and scientifically objective. This has turned out to be false; rather,
economists have simply resisted apprehending the ethical and political
implications of the performativity and historical contingency of
economic theory.
• The current crisis of the global economy can be usefully read as
simultaneously a crisis of economics; in particular, the discipline lacks a
model of the contemporary economic configuration that is ontologically
or epistemologically adequate to the task of generating predictions of the
future which are accurate to within a margin of error that can be bridged
with empirically and intuitively plausible fudge factors. That is, the
economic crisis is also—indeed, perhaps fundamentally—an ontological
and epistemological crisis.
• For positivist knowledge production, ontological uncertainty, partiality,
and situatedness are liabilities. Critical mathematical modelling relies
on these phenomena, leveraging them to engage in a different kind of
discursive action which is ontologically imaginative, epistemologically
opportunistic, intentionally and strategically performative, materially embodied
and socially embedded, and actively and openly engaged with—indeed,
often primarily concerned with—the ethical and the political.
93

• The epistemological challenge of positivist modelling creates a condition
in which more data is always better. Critical mathematical modelling
resists this panoptic impulse by making use of the data at hand to explore
(e.g., Bribe Payers Index; Index of Imperial Domination; Capitalism
Collaps-O-Meter), critique (e.g., Index of Imperial Domination; Miles Per
Casualty), foreground (e.g., Miles Per Casualty), and re-imagine (e.g.,
Capitalism Collaps-O-Meter) existing ontologies, relations, and
practices. It is a socially situated practice of discursive action, political
engagement, speculation, and worldmaking that makes use of a
combination of qualitative, formal, and qualitative ways of thinking,
seeing, and representing.
• Finally, critical mathematical modelling can be allied with a practice of
‘economic interpretation’. Rather than attempting to explain particular
relations, events, or patterns as examples of general laws, or large-scale
and long-term trends and ‘structures’ as simply the emergent result of
the preferences and decisions of individual, autonomous actors,
economic interpretation tries to apprehend the circular, mutually
constitutive relations between events and ‘agents’ at multiple scales,
both in space and in time.
94

B
[1] Pentecost, C., n.d.: Oh! the public amateur is not afraid to let on that shejust figured it out. The Public Amateur.publicamateur.wordpress.com/about.
[2] Warner, M., 2002: Publics and counterpublics. Public Culture 14 1, 49-90.
[3] Irwin, N. and A. R. Paley, 2008: Greenspan says he was wrong onregulation. The Washington Post, October 24, 2008.washingtonpost.com/wp-dyn/content/article/2008/10/23/
AR2008102300193.html.
[4] Pentecost, C., 2007: Case study in Manhattan. The Public Amateur.publicamateur.wordpress.com/2007/03/26/case-study-in-manhattan.
[5] Pentecost, C., 2007: When art becomes life. Transform.transform.eipcp.net/transversal/0507/pentecost/en.
[6] MacKenzie, D., F. Muniesa, and L. Siu, 2007: Introduction. In DoEconomists Make Markets? On the Performativity of Economics. MIT Press.
[7] Ortuzar, J. de D. and L. G. Willumsen, 2004: Modelling Transport, 3rd ed.Wiley & Sons.
[8] Train, K., 2003: Discrete Choice Models with Simulation. CambridgeUniversity Press.
[9] Field, E. and M. Torero, 2006: Do property titles increase credit accessamong the urban poor? Evidence from a nationwide titling program.economics.harvard.edu/faculty/field/files/FieldTorerocs.pdf.
[10] Field, E., 2007: Entitled to work: urban property rights and labor supplyin Peru.economics.harvard.edu/faculty/field/files/Field COFOPRI QJE.pdf.
[11] Mitchell, T., 2005: The work of economics: how a discipline makes itsworld. European Journal of Sociology 47 2, 297-320.
[12] Rosenberg., S., 2008, personal communication.
[13] von Foerster, H., 1979: Cybernetics of cybernetics.grace.evergreen.edu/∼arunc/texts/cybernetics/heinz/cybernetics.pdf.
[14] Haraway, D., 1988: Situated knowledges: the science question infeminism and the privilege of partial perspective. Feminist Studies 14 3,575-599.
95

[15] MacKenzie, D., 2007: Is economics performative? Option theory and theconstruction of derivatives markets. In Do Economists Make Markets? Onthe Performativity of Economics. MIT Press.
[16] Coy, P. and S. Woolley, 1998: Failed wizards of Wall Street. BusinessWeek.September 21, 1998. www.businessweek.com/1998/38/b3596001.htm.
[17] Lowenstein, R., 2008: Long-Term Capital: it’s a short-term memory. NewYork Times. September 6, 2008.nytimes.com/2008/09/07/business/07ltcm.html.
[18] GIGO. Compiled at die.net, originally from WordNet 1.7.dictionary.die.net/gigo.
[19] GIGO. Compiled at die.net, originally from the Jargon File 4.3.1.dictionary.die.net/gigo.
[20] Salmon, F., 2009: Recipe for disaster: the formula that killed Wall Street.Wired Magazine. February 23, 2009.wired.com/techbiz/it/magazine/17-03/wp-quant.
[21] Agre, P., 1997: Toward a critical technical practice: lessons learned intrying to reform AI. Published in Bowker, G., L. Gasser, L. Star, and W.Turner, eds., 1997: Bridging the Great Divide: Social Science, TechnicalSystems, and Cooperative Work. Erlbaum. Accessed atpolaris.gseis.ucla.edu/pagre/critical.html.
[22] Moten, F. and S. Harney, 2004: The University and the Undercommons:seven theses. Social Text 22 2, 101-115.
[23] Institute for Applied Autonomy, 2005: Engaging ambivalence:interventions in engineering culture. Published in Cox, G. and J. Krysa,eds., 2005: DATA browser 02. Autonomedia. Accessed atdata-browser.net/02/DB02/IAA.pdf.
[24] Knouf, N., 2009: HCI for the real world. CHI 2009. April 4-9, 2009, Boston,MA, USA. Accessed atzeitkunst.org/media/pdf/HCIForTheRealWorld.pdf.
[25] Papanek, V., 1971: Design for the Real World: Human Ecology and SocialChange. Pantheon Books.
[26] Irani, L., 2009: pers. comm.
[27] Benkler, Y., 2006: The Wealth of Networks: How Social Production TransformsMarkets and Freedom. Yale University Press. Accessed atcyber.law.harvard.edu/wealth of networks/Chapter 1.
96

[28] Latham, R. and S. Sassen, 2005: Introduction: Digital formations:constructing an object of study. In Latham, R. and S. Sassen, eds., 2005:Digital Formations: IT and New Architectures in the Global Realm. PrincetonUniversity Press.
[29] Weston, P. E. and H. von Foerster, 1973: Artificial intelligence andmachines that understand. Annual Review of Physical Chemistry 24, 353-378.
[30] Nakamura, L. and D. Haraway, 2003: Prospects for a materialistinformatics: an interview with Donna Haraway. Interview conducted byLisa Nakamura.electronicbookreview.com/thread/technocapitalism/interview.
[31] Latour, B., 1991: Technology is society made durable. In Law, J., ed., 1991:A Sociology of Monsters: Essays on Power, Technology, and Domination.Routledge.
[32] Riano, J. and R. Hodess, 2008: 2008 Bribe Payers Index. TransparencyInternational. transparency.org/content/download/39275/622457.
[33] World Resources Institute, 2007: EarthTrends: Environmental Information.earthtrends.wri.org.
[34] Sachs, J. D. and A. M. Warner, 1995: Natural resource abundance andeconomic growth. National Bureau of Economic Research Working Paper5398. nber.org/papers/w5398.pdf.
[35] United States Bureau of Transportation Statistics, 2008: Average FuelEfficiency of U.S. Passenger Cars and Light Trucks.bts.gov/publications/national transportation statistics/html/
table 04 23.html.
[36] Energy Information Administration, 2009: Frequently AskedQuestions—Gasoline. tonto.eia.doe.gov/ask/gasoline faqs.asp.
[37] Calder, V. et al., 2004: Oil to gasoline. Ask a Scientist Environmental EarthScience Archive. newton.dep.anl.gov/askasci/eng99/eng99288.htm.
[38] Energy Information Administration, 2009: Iraq. Country Analysis Briefs.eia.doe.gov/emeu/cabs/Iraq/Full.html.
[39] Burnham, G., R. Lafta, S. Doocy, and L. Roberts, 2006: Mortality after the2003 invasion of Iraq: a cross-sectional cluster sample survey. The Lancet368, 1421-1428.
[40] Iraq Body Count, 2009: Iraq Body Count Database.iraqbodycount.org/database.
[41] Transparency International: About us. transparency.org/about us.
97

[42] Transparency International: CPI 2008 Table.transparency.org/news room/in focus/2008/cpi2008/cpi 2008 table.
[43] International Monetary Fund, 2008: The IMF and Good Governance.imf.org/external/np/exr/facts/gov.htm.
[44] Hofstede, G., 2001: Culture’s Consequences: Comparing Values, Behaviors,Institutions and Organizations Across Nations. 2nd ed. Sage Publications.
[45] Dasgupta, P., 2006: Discounting global warming. Is SustainableDevelopment Feasible? The State of the Planet 2006. Transcript of talk givenat Columbia University.www.earth.columbia.edu/sop2006/transcripts/tr dasgupta.html.
[46] d’Entreves, M. P., 2006: Hannah Arendt. Stanford Encyclopedia ofPhilosophy. plato.stanford.edu/entries/arendt.
[47] Leopold, A., 1949: A Sand County Almanac. Oxford University Press.
[48] Freeman, S., 2009: A hidden gift. New York Times, 2009 April 29.nytimes.com/2009/04/30/opinion/30iht-edfreeman.html.
[49] Akerlof, G. A. and R. Shiller, 2009: Animal Spirits: How Human PsychologyDrives the Economy, and Why It Matters for Global Capitalism. PrincetonUniversity Press.
[50] google.com/search?q=animal+spirits. Accessed 30 June 2009.
[51] Hardin, G., 1968: The tragedy of the commons. Science 162, 3859,1243-1248.
[52] Philip, K. and A. Abbas, 2008: Poor theory: notes toward a manifesto.www.humanities.uci.edu/critical/html/Projects%20+%20Events/
Poor%20Theory/poortheorymanifesto.html.
[53] Philip, K., 2009: Post-colonial conditions: another report on knowledge.University of California, Irvine, 18 March 2009.
[54] Harrison, S. G. and M. Weder, 2006: Did sunspot forces cause the GreatDepression? Journal of Monetary Economics 53, 7, 1327-1339.
98