Embed Size (px)
Citation preview
University of Buffalo The State University of New York
Spatiotemporal Data Mining on Networks
Taehyong Kim
Computer Science and Engineering
State University of New York at Buffalo

University of Buffalo The State University of New York
Table of Contents
Studies Spreading and Defense
model in Networks Fixed-random network Spreading Model Defense Model
Avian Influenza Outbreaks Modeling Mining parameters
Introduction Overview Networks Data Mining Spatiotemporal Data
Mining Applications
Quality of Bone (osteoporosis) as a Network Dynamics
Amazon Deforestation
University of Buffalo The State University of New York
Overview
Most of real world relationships and communications could be represented on networks (graphs).
Understanding the behavior of such systems starts with understanding the topology of the corresponding network.
Yeast PPI network AT&T Web NetworkCollaboration network
University of Buffalo The State University of New York
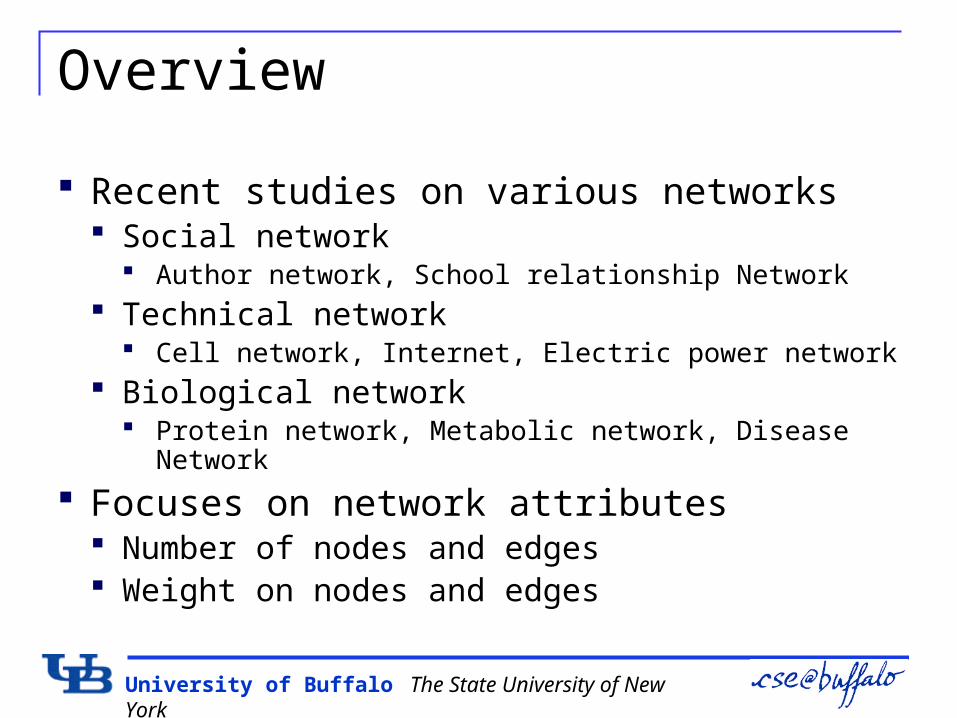
Overview
Recent studies on various networks Social network
Author network, School relationship Network Technical network
Cell network, Internet, Electric power network Biological network
Protein network, Metabolic network, Disease Network
Focuses on network attributes Number of nodes and edges Weight on nodes and edges
University of Buffalo The State University of New York
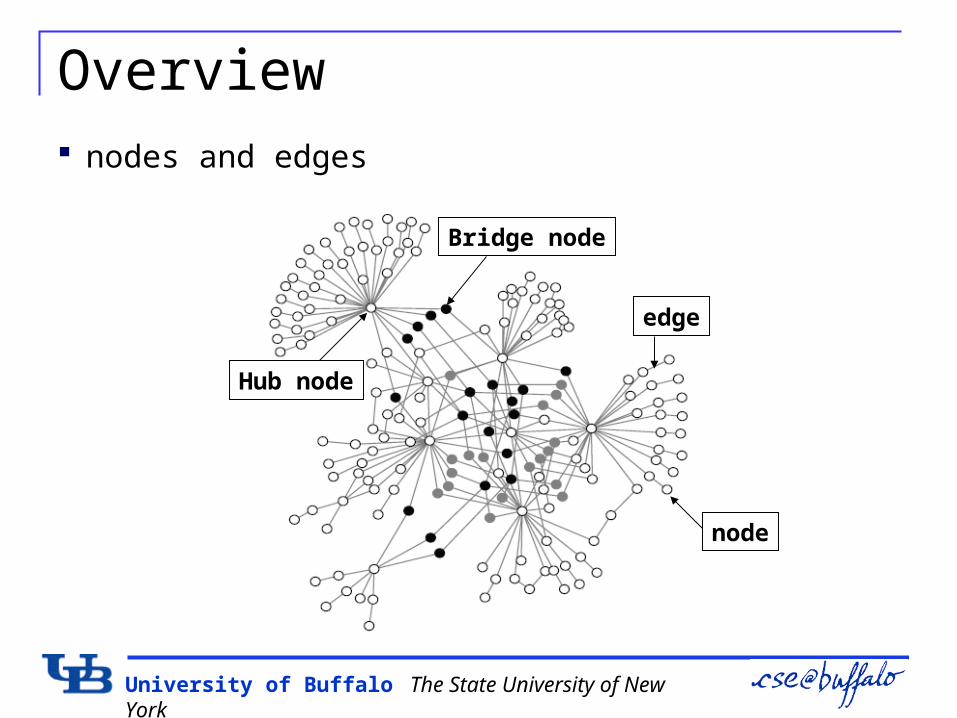
Overview
Hub node
Bridge node
edge
node
nodes and edges
University of Buffalo The State University of New York
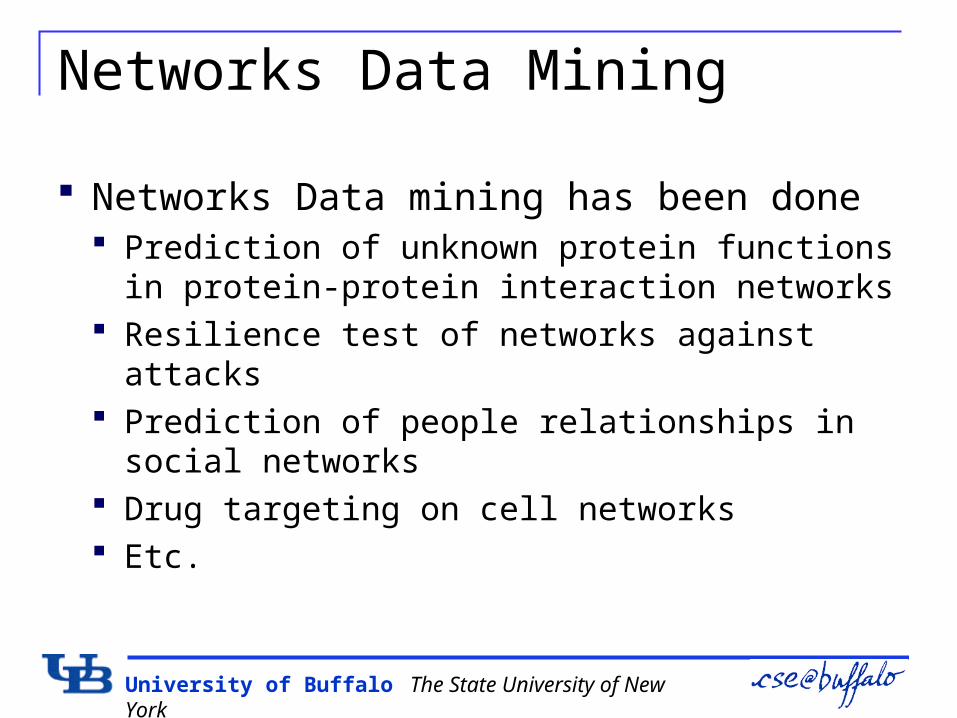
Networks Data Mining
Networks Data mining has been done Prediction of unknown protein functions in protein-
protein interaction networks Resilience test of networks against attacks Prediction of people relationships in social
networks Drug targeting on cell networks Etc.
University of Buffalo The State University of New York
Spatiotemporal Data Mining
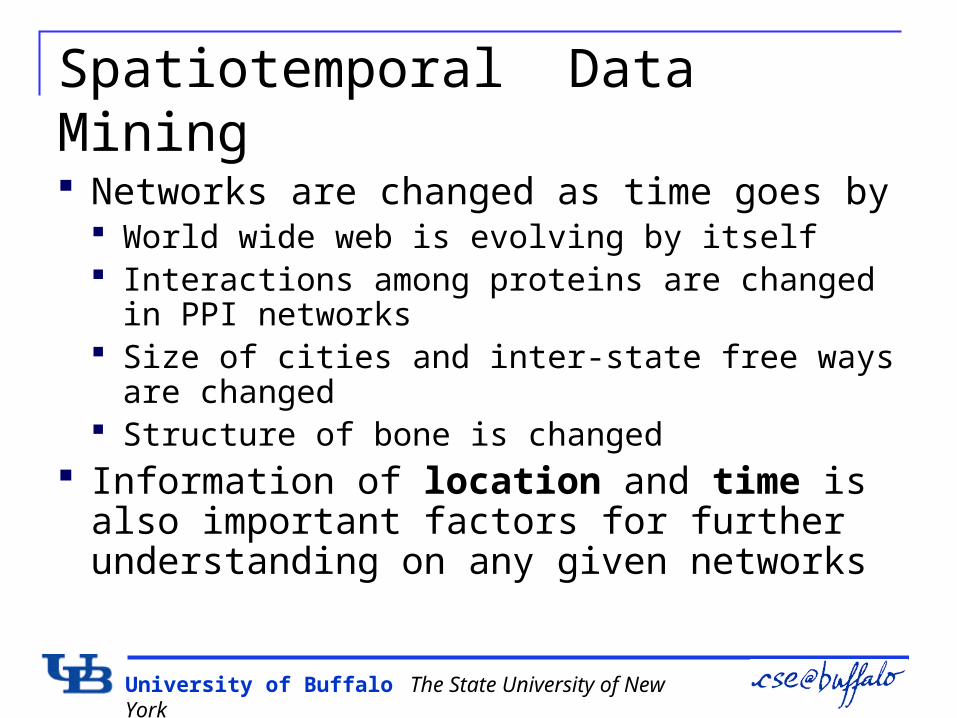
Networks are changed as time goes by World wide web is evolving by itself Interactions among proteins are changed in PPI
networks Size of cities and inter-state free ways are
changed Structure of bone is changed
Information of location and time is also important factors for further understanding on any given networks
University of Buffalo The State University of New York
Spatiotemporal Data Mining
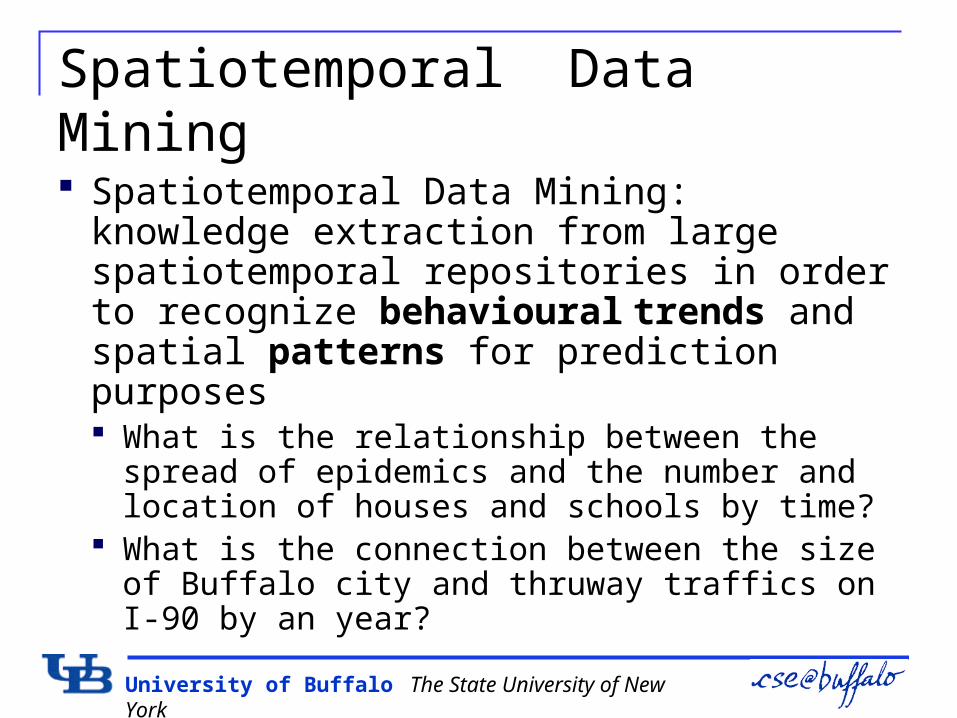
Spatiotemporal Data Mining: knowledge extraction from large spatiotemporal repositories in order to recognize behavioural trends and spatial patterns for prediction purposes What is the relationship between the spread of
epidemics and the number and location of houses and schools by time?
What is the connection between the size of Buffalo city and thruway traffics on I-90 by an year?
University of Buffalo The State University of New York
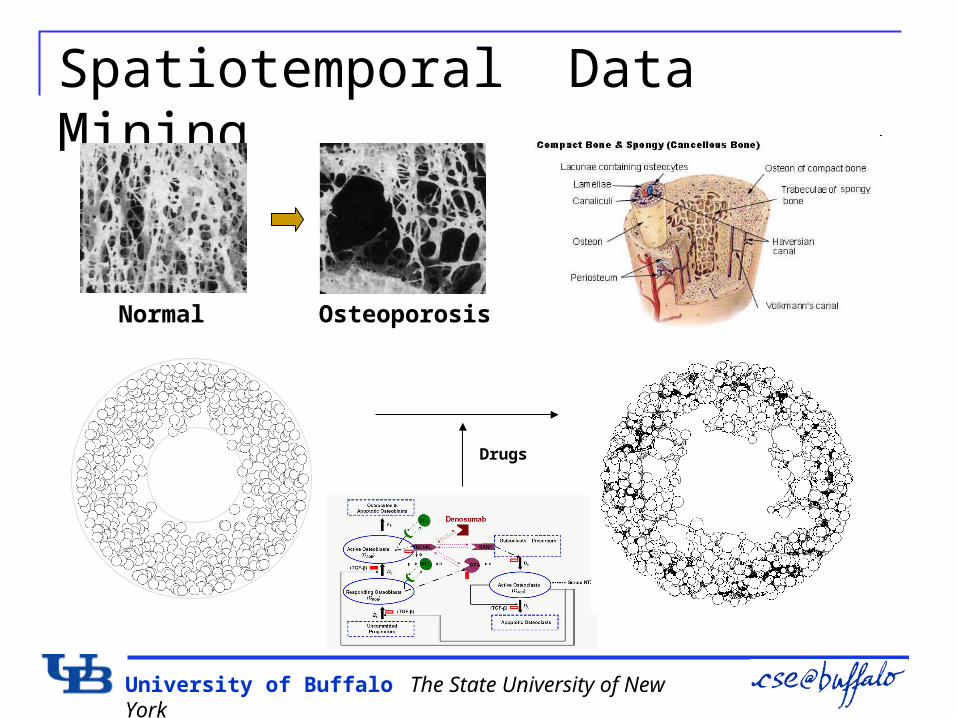
Spatiotemporal Data Mining
Normal Osteoporosis
Drugs
University of Buffalo The State University of New York
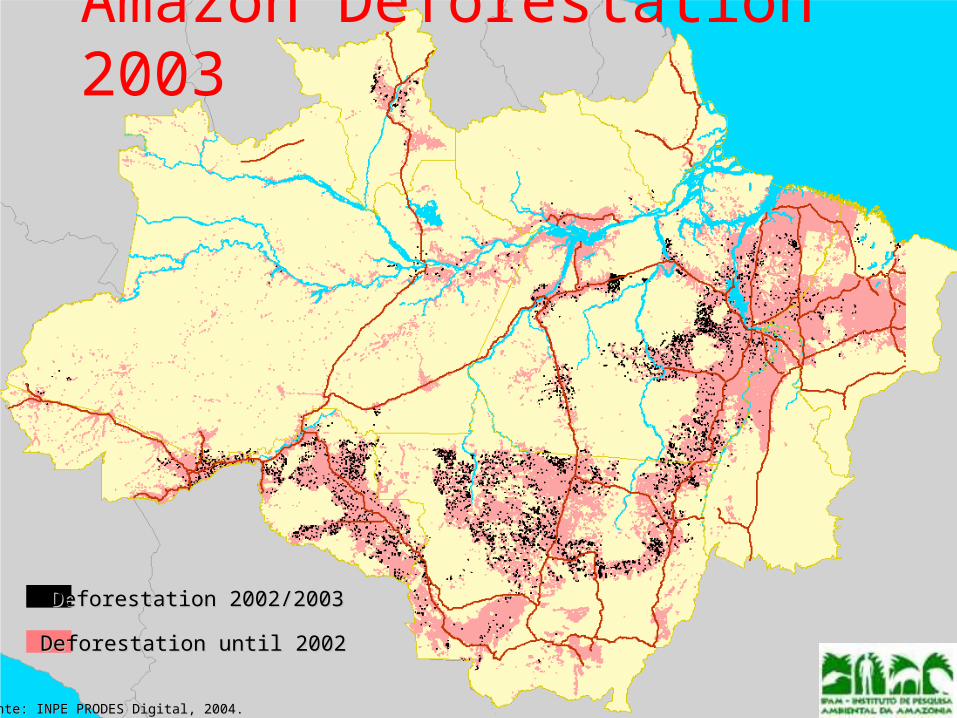
Amazon Deforestation 2003
Fonte: INPE PRODES Digital, 2004.Fonte: INPE PRODES Digital, 2004.
Deforestation 2002/2003Deforestation 2002/2003
Deforestation until 2002Deforestation until 2002
University of Buffalo The State University of New York
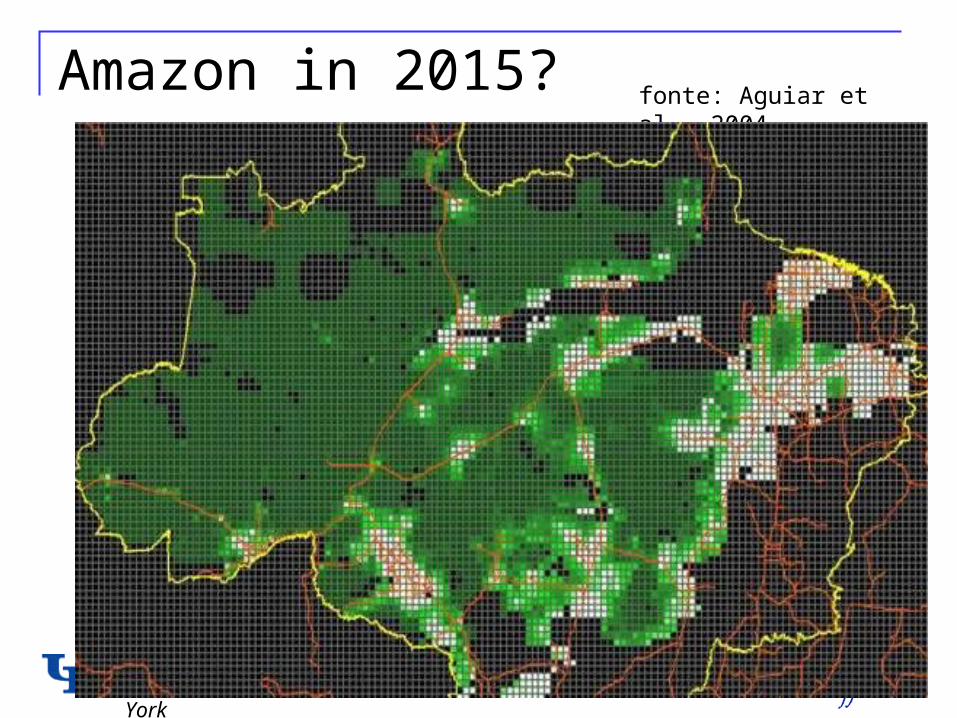
Amazon in 2015?fonte: Aguiar et al., 2004
University of Buffalo The State University of New York
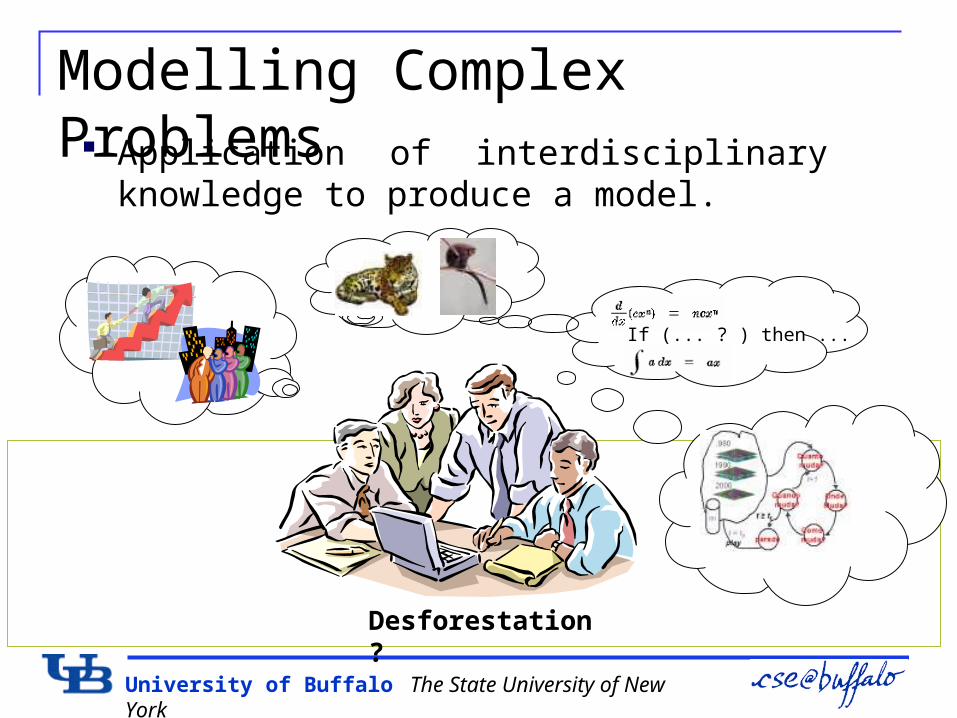
Modelling Complex Problems Application of interdisciplinary knowledge to
produce a model.
If (... ? ) then ...
Desforestation?

University of Buffalo The State University of New York
Table of Contents
Studies Spreading and Defense
model in Networks Fixed-random network Spreading Model Defense Model
Avian Influenza Outbreaks Modeling Mining parameters
Introduction Overview Networks Data Mining Spatiotemporal Data
Mining Applications
Quality of Bone (osteoporosis) as a Network Dynamics
Amazon Deforestation
University of Buffalo The State University of New York
Spreading and Defense model in Networks Fixed-radius random network
Cellular transmission tower Interstate free ways Epidemics on communities Sensor networks
How we can defend if there are attacks or breaks from the center of the networks?
University of Buffalo The State University of New York
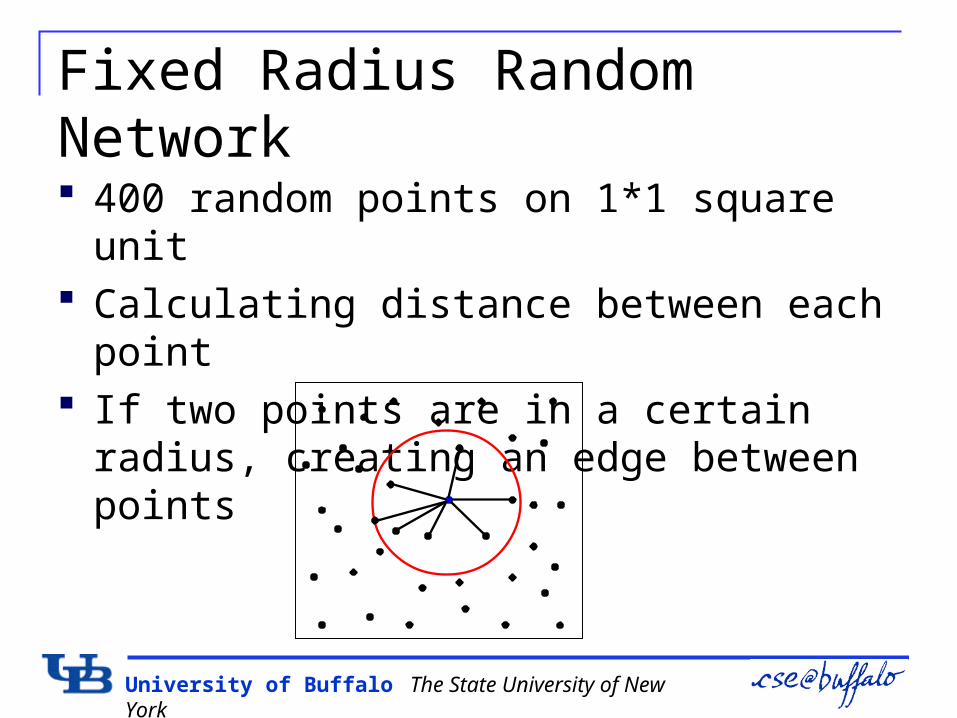
Fixed Radius Random Network 400 random points on 1*1 square unit Calculating distance between each point If two points are in a certain radius, creating
an edge between points
University of Buffalo The State University of New York
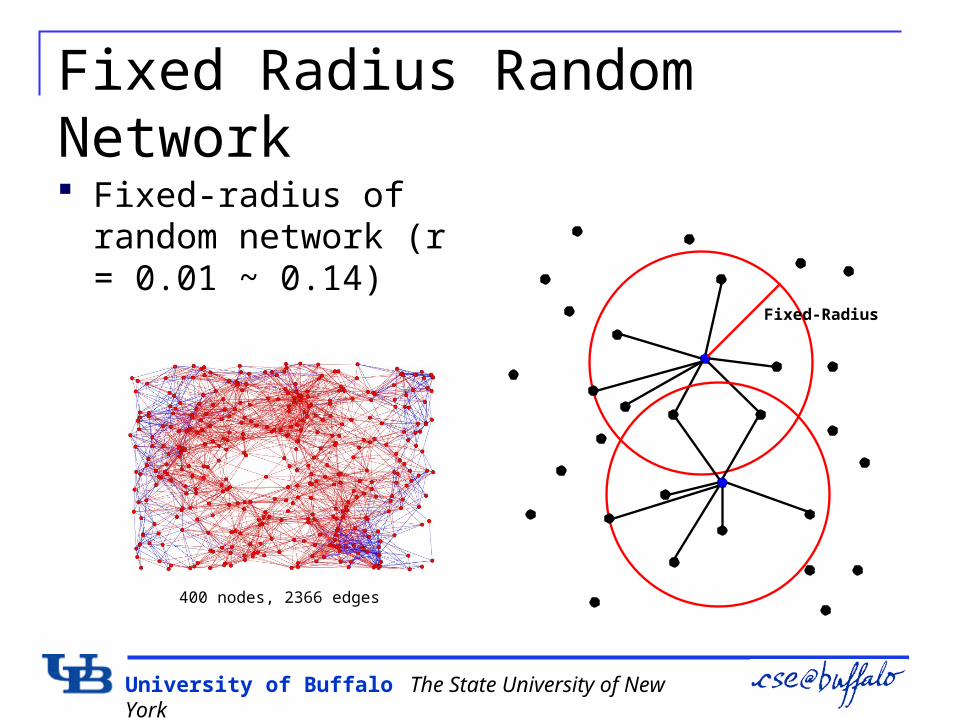
Fixed Radius Random Network Fixed-radius of random
network (r = 0.01 ~ 0.14)
Fixed-Radius
400 nodes, 2366 edges
University of Buffalo The State University of New York
Simulation on network
Network dynamics are studied based on fixed-radius random network
Simple spreading model and defense model is implemented for simulation
Mining important parameters on this model of network dynamics
Mining optimal values of parameters on this model of network dynamics
University of Buffalo The State University of New York
Spreading Model
Simulating disease spreading or message spreading
Starting from center point (0.5*0.5) Affecting edges which are in a spreading
radius (ROI) from center Spreading radius grows or reduces based on
how many edges are damaged
University of Buffalo The State University of New York
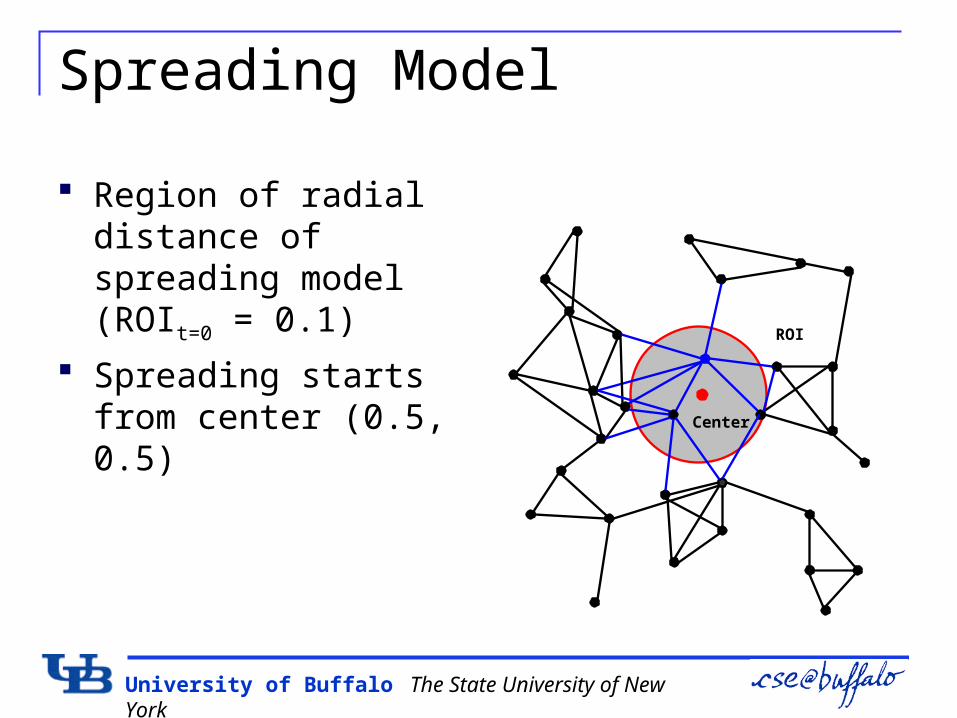
Spreading Model
Region of radial distance of spreading model (ROIt=0 = 0.1)
Spreading starts from center (0.5, 0.5)
ROI
Center
University of Buffalo The State University of New York
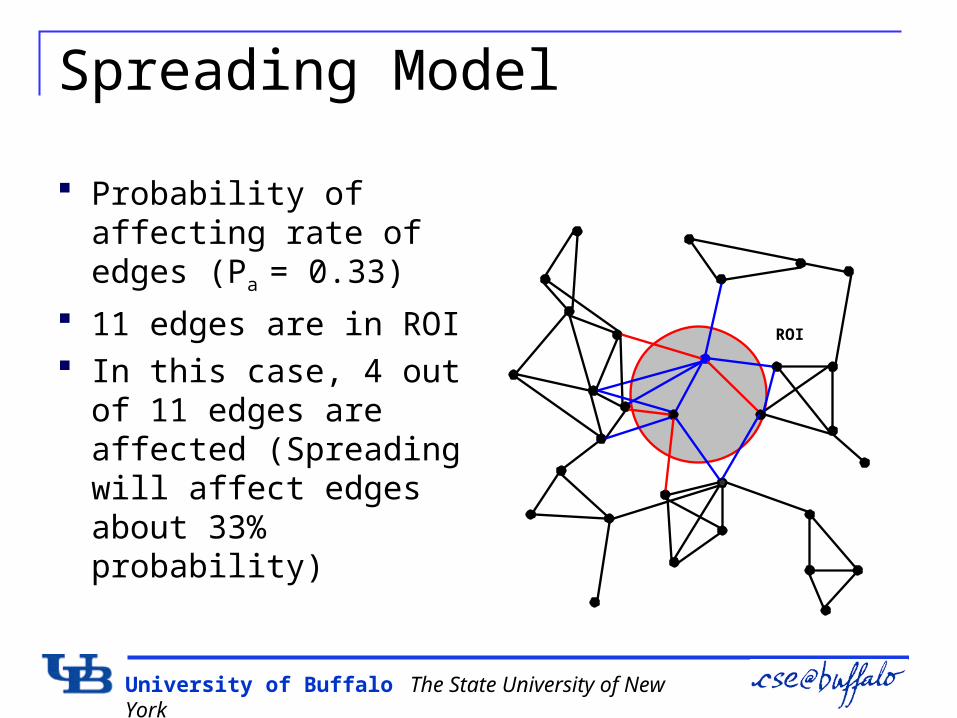
Spreading Model
Probability of affecting rate of edges (Pa = 0.33)
11 edges are in ROI In this case, 4 out of 11
edges are affected (Spreading will affect edges about 33% probability)
ROI
University of Buffalo The State University of New York
Defense Model
Simulating defense system of disease spreading or message spreading
Signaling to neighbor nodes in order to inform (disease) spreading
Activated when the affection of spreading (# of signals from neighbor nodes) is over threshold
Removing edges which are in a radius () from activated neighbor nodes in order to stop spreading
University of Buffalo The State University of New York
Defense Model
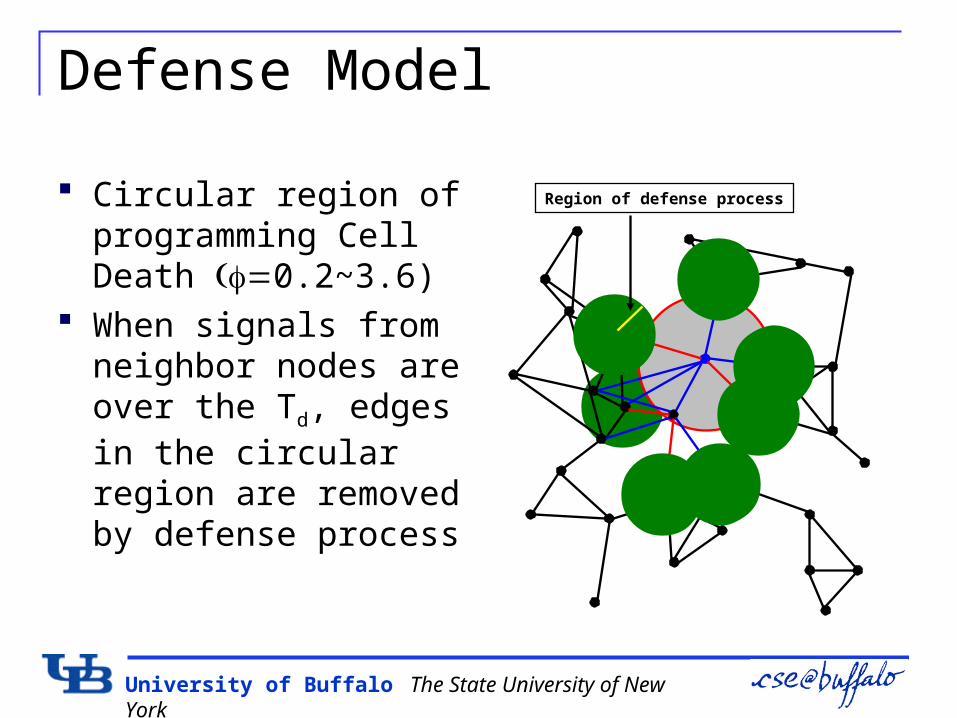
Circular region of programming Cell Death 0.2~3.6)
When signals from neighbor nodes are over the Td, edges in the circular region are removed by defense process
Region of defense process
University of Buffalo The State University of New York
Defense Model
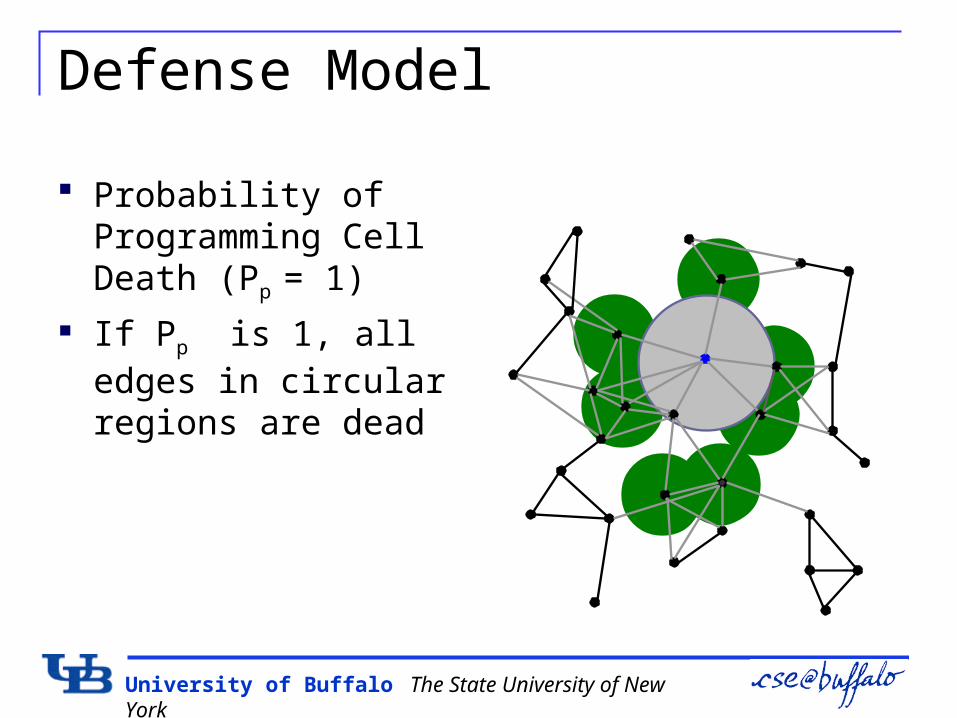
Probability of Programming Cell Death (Pp = 1)
If Pp is 1, all edges in circular regions are dead
University of Buffalo The State University of New York
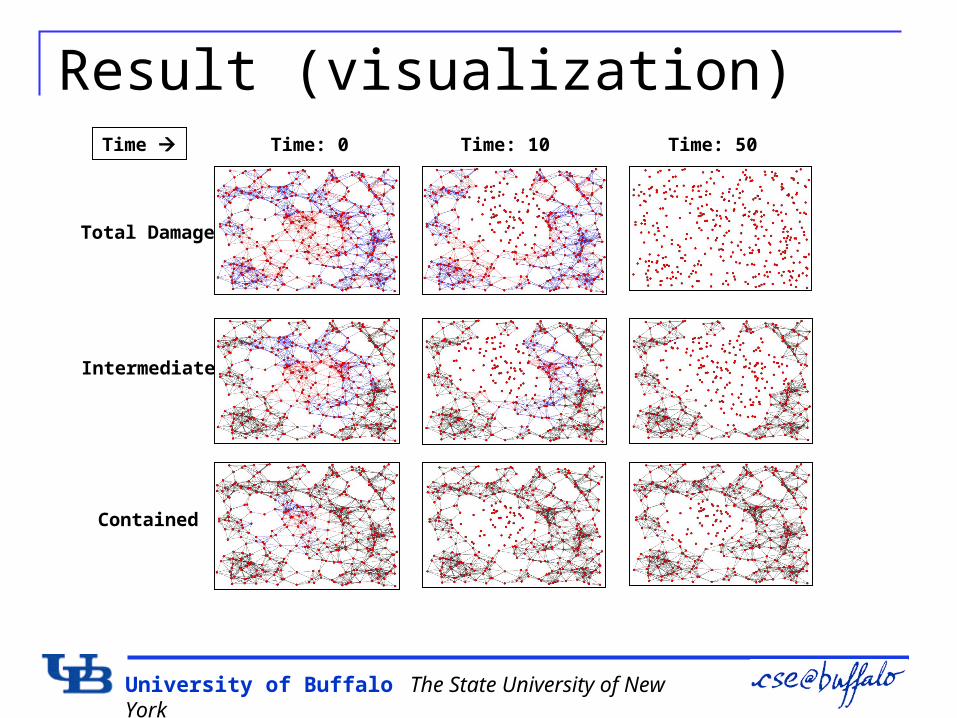
Result (visualization)
Time: 0 Time: 10 Time: 50
Total Damage
Intermediate
Contained
Time
University of Buffalo The State University of New York
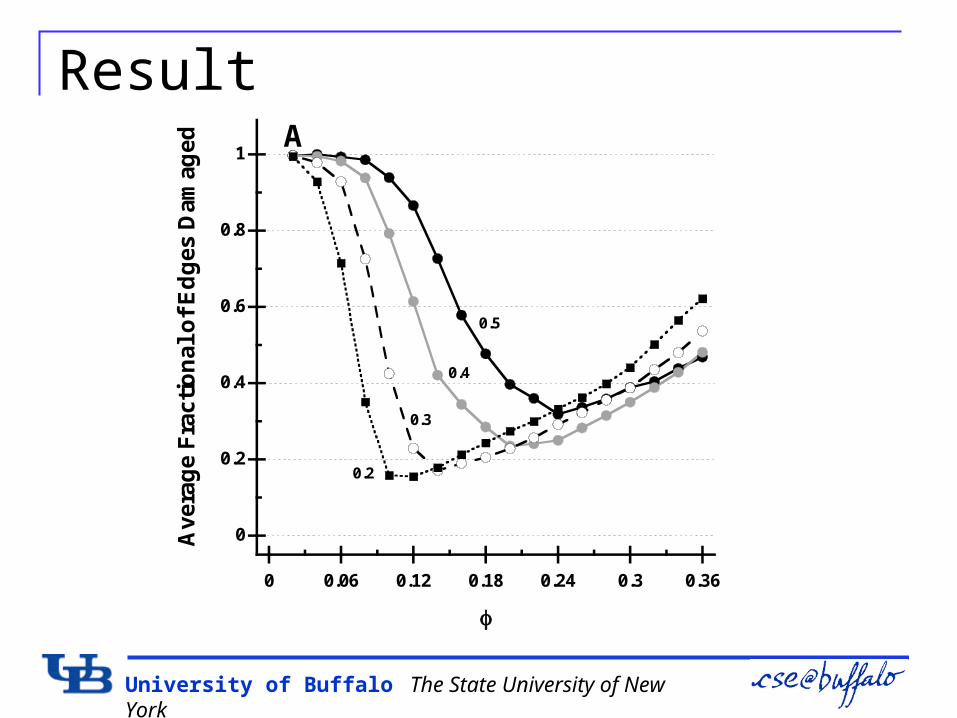
Result
0
0.2
0.4
0.6
0.8
1
0 0.06 0.12 0.18 0.24 0.3 0.36
Ave
rag
e F
ract
ion
al o
f E
dg
es D
amag
ed
0.3
0.4
0.5
A
0.2
University of Buffalo The State University of New York
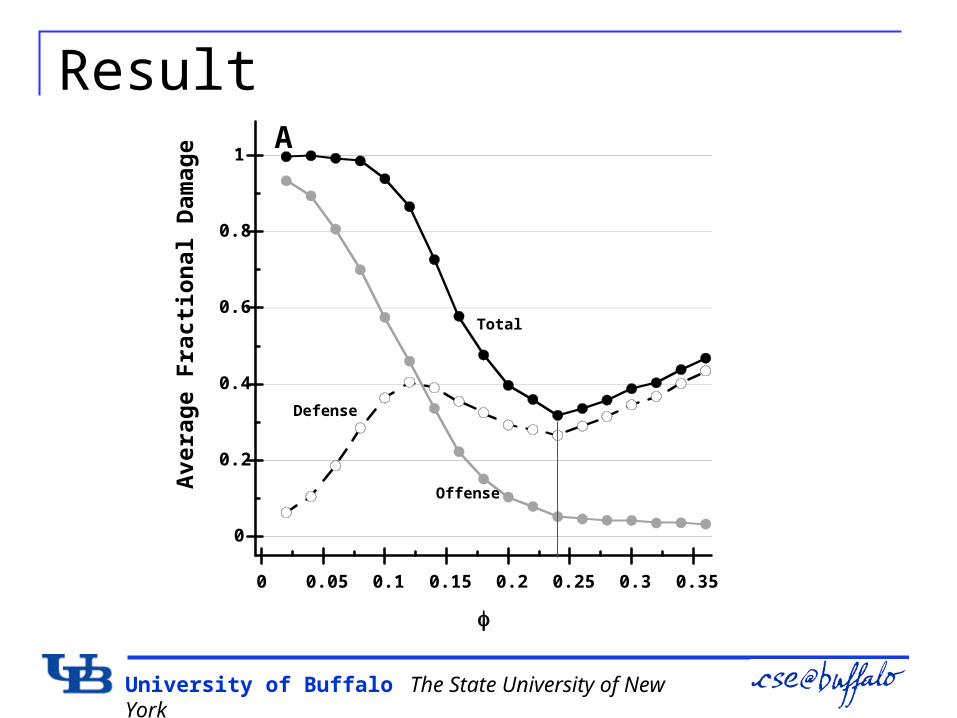
Result
0
0.2
0.4
0.6
0.8
1
0 0.05 0.1 0.15 0.2 0.25 0.3 0.35
Av
era
ge
Fra
cti
on
al
Da
ma
ge
Offense
Defense
Total
A
University of Buffalo The State University of New York
Summary
Containment strategy on epidemics and virus spreads Mining important parameters Mining optimal values of important parameters
Understanding dynamics on human tissues and bones Development of diseases (osteoporosis) Drug effects on cell networks
University of Buffalo The State University of New York
Table of Contents
Studies Spreading and Defense
model in Networks Fixed-random network Spreading Model Defense Model
Avian Influenza Outbreaks Modeling Mining parameters
Introduction Overview Networks Data Mining Spatiotemporal Data
Mining Applications
Quality of Bone (osteoporosis) as a Network Dynamics
Amazon Deforestation
University of Buffalo The State University of New York
Avian Influenza
AI outbreaks are frequently occurring around the world recently H5N1 type has high infection and mortality rate Chickens and ducks are main victims of AI Mortality rate of H5N1 could reach 90-100% within 48
hours
Threat from AI has greatly increased for human beings There are several reports showing human infection of AI People could get infected by contacting excretion of
contaminated birds
University of Buffalo The State University of New York
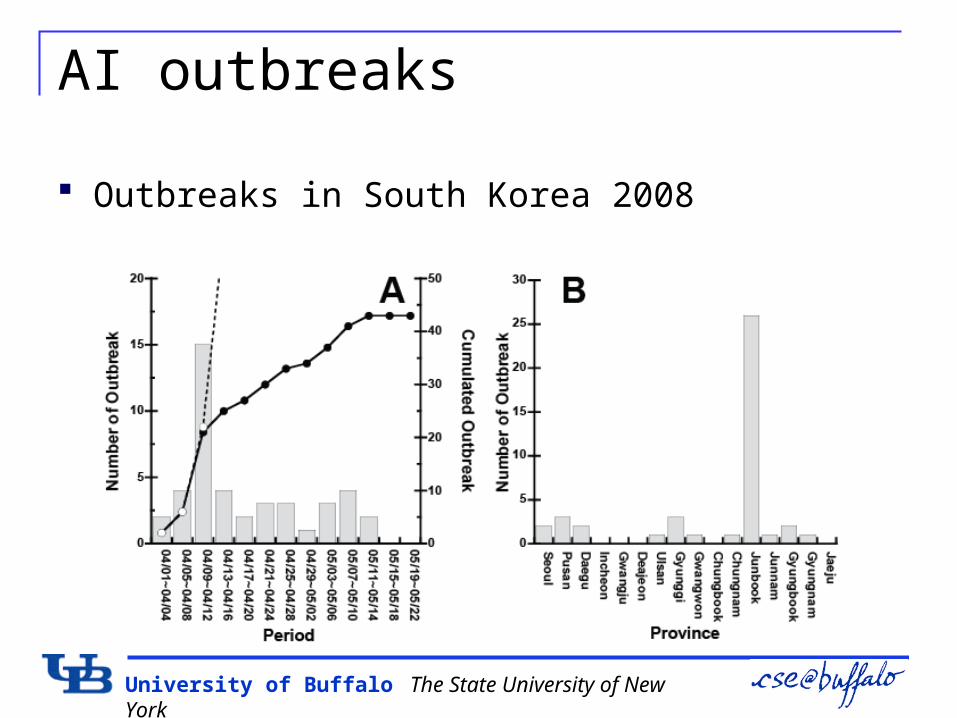
AI outbreaks
Outbreaks in South Korea 2008
University of Buffalo The State University of New York
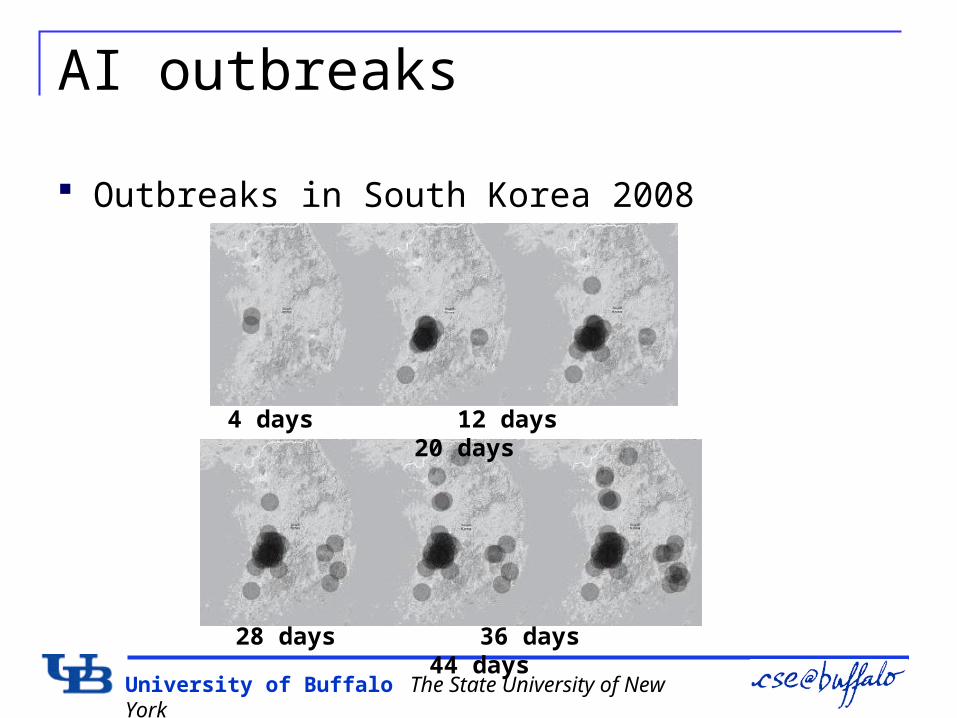
AI outbreaks
Outbreaks in South Korea 2008
4 days 12 days 20 days
28 days 36 days 44 days
University of Buffalo The State University of New York
Challenges
Strategies are needed for AI containment Early identification of the first cluster of cases Warning system from contaminated area to neighbor areas
are needed Effective quarantine plan should be existed
Containment model helps plan effective strategies Prediction of damage with certain environment parameters Mining important parameters to control outbreaks Measurement of effective values of important parameters
University of Buffalo The State University of New York
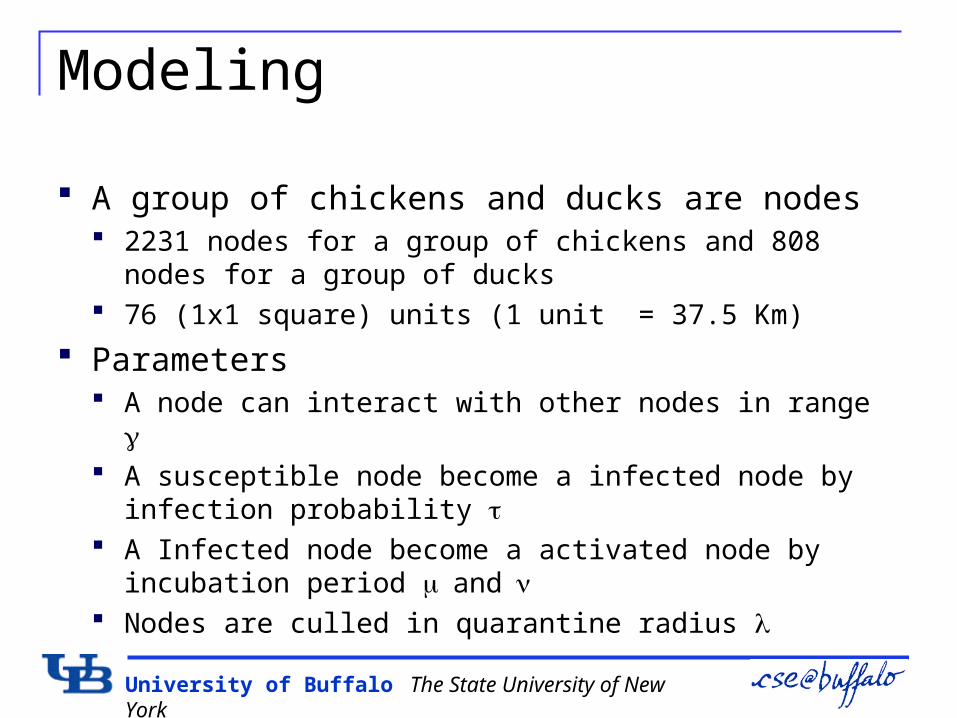
A group of chickens and ducks are nodes 2231 nodes for a group of chickens and 808 nodes for a
group of ducks 76 (1x1 square) units (1 unit = 37.5 Km)
Parameters A node can interact with other nodes in range A susceptible node become a infected node by infection
probability A Infected node become a activated node by incubation
period and Nodes are culled in quarantine radius
Modeling
University of Buffalo The State University of New York
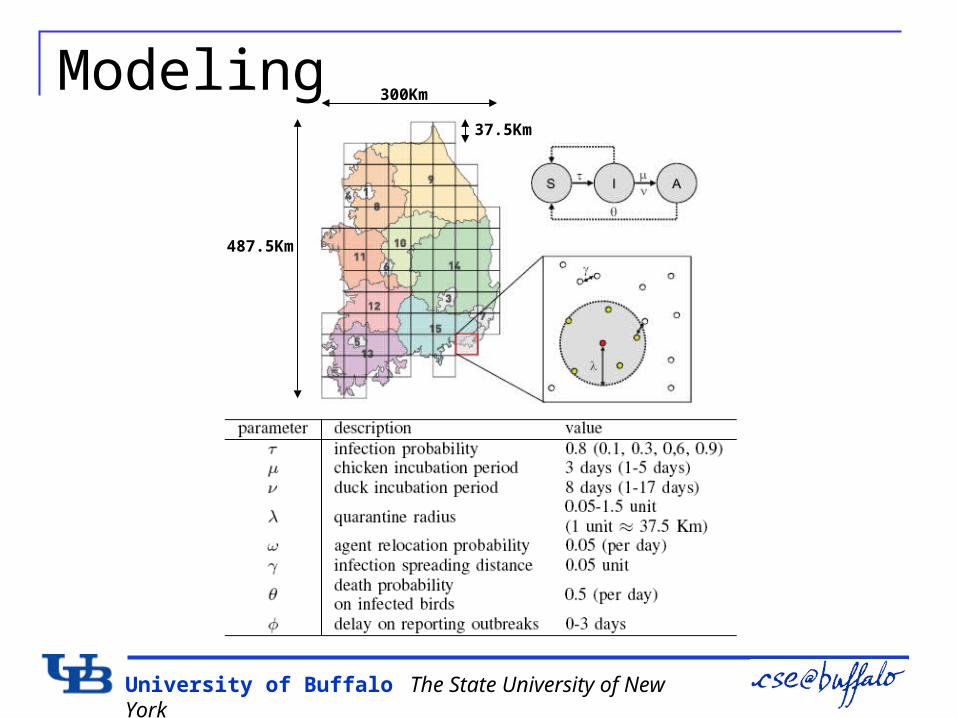
Modeling
487.5Km
300Km
37.5Km
University of Buffalo The State University of New York
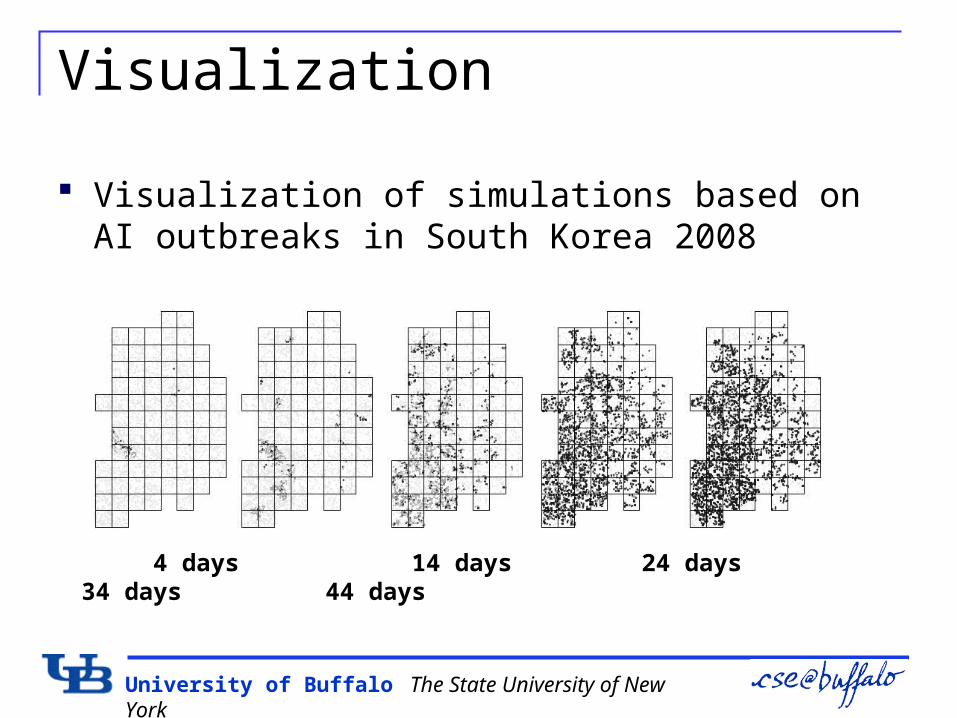
Visualization
Visualization of simulations based on AI outbreaks in South Korea 2008
4 days 14 days 24 days 34 days 44 days
University of Buffalo The State University of New York
Important Parameters
Effect of Increased Quarantine Range Quarantine radius: 0.0 ~ 0.32 unit
Effects of Increased Incubation Period Incubation Period: 0 ~ 17 days
Effects of Increasing the Infection probability Infection probability: 0.0 ~ 1.0
University of Buffalo The State University of New York
Quarantine Radius
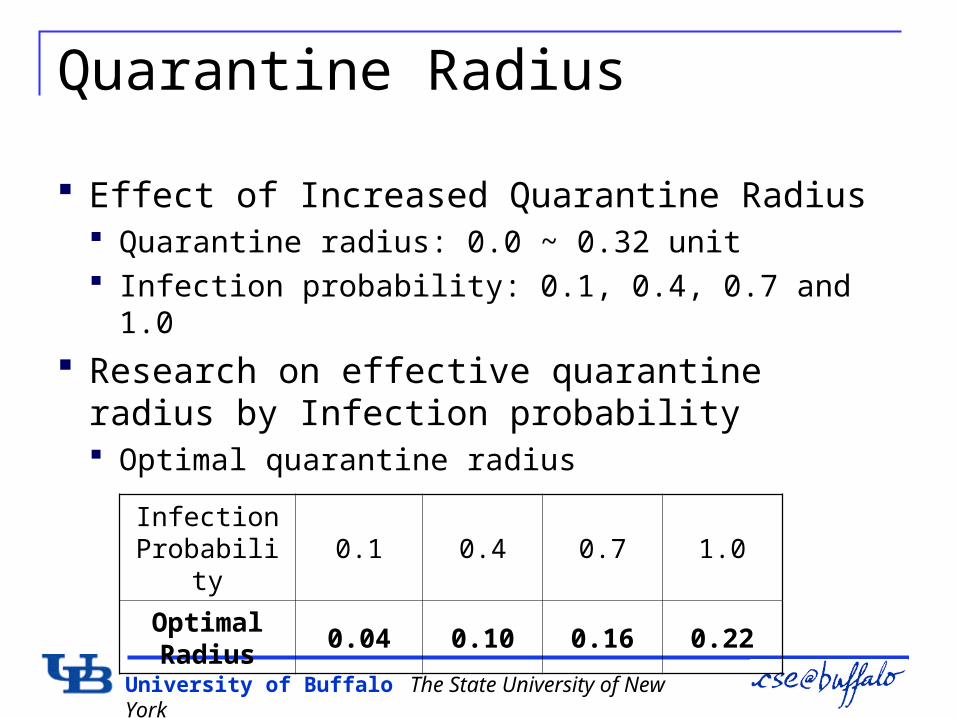
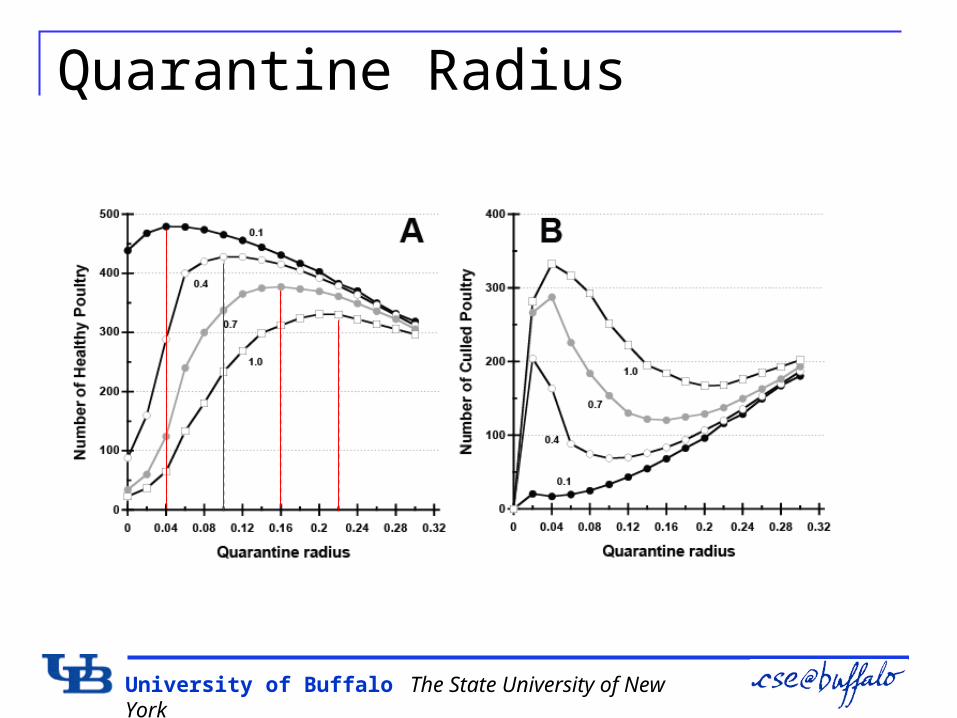
Effect of Increased Quarantine Radius Quarantine radius: 0.0 ~ 0.32 unit Infection probability: 0.1, 0.4, 0.7 and 1.0
Research on effective quarantine radius by Infection probability Optimal quarantine radius
Infection Probability
0.1 0.4 0.7 1.0
Optimal Radius
0.04 0.10 0.16 0.22
University of Buffalo The State University of New York
Quarantine Radius
University of Buffalo The State University of New York
Incubation Period
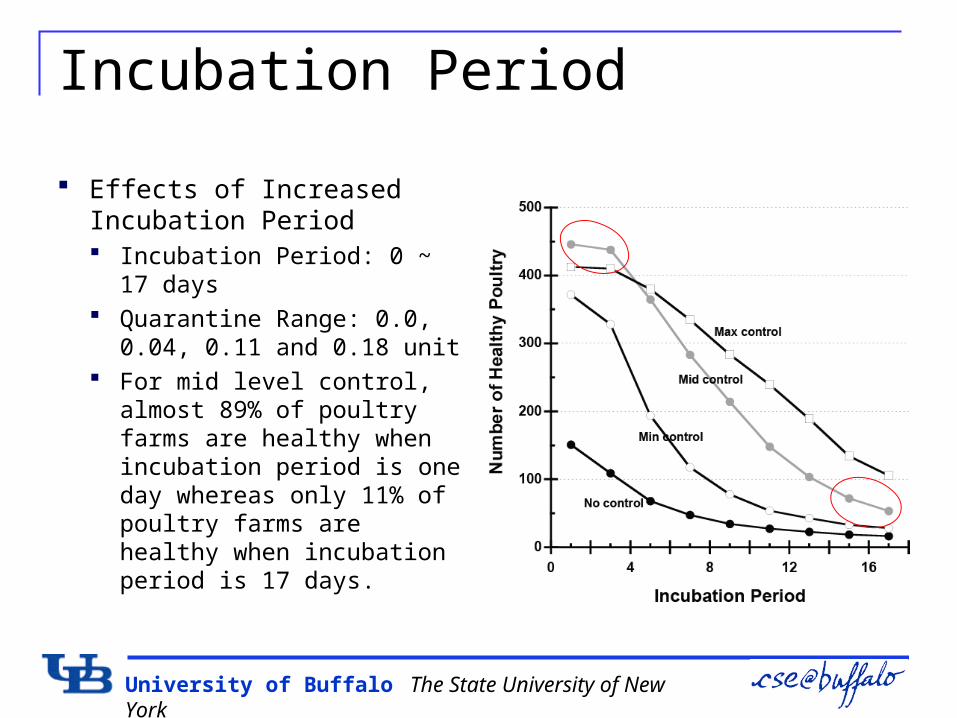
Effects of Increased Incubation Period Incubation Period: 0 ~ 17
days Quarantine Range: 0.0,
0.04, 0.11 and 0.18 unit For mid level control, almost
89% of poultry farms are healthy when incubation period is one day whereas only 11% of poultry farms are healthy when incubation period is 17 days.
University of Buffalo The State University of New York
Infection probability
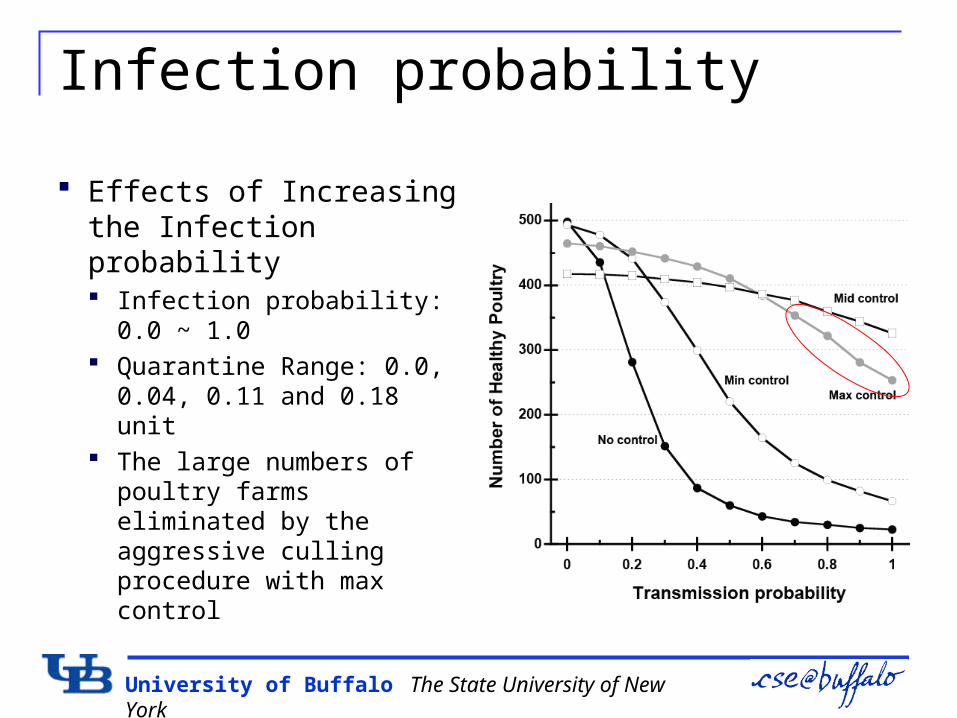
Effects of Increasing the Infection probability Infection probability: 0.0
~ 1.0 Quarantine Range: 0.0,
0.04, 0.11 and 0.18 unit The large numbers of
poultry farms eliminated by the aggressive culling procedure with max control
University of Buffalo The State University of New York
Summary
Modeling AI dynamics based on statistic data Modeling of AI outbreaks and spreads Modeling of defense strategies
Mining important parameters and values in order to contain AI outbreaks in early stage Quarantine radius, infection rate, incubation
period Damage predictions with important parameters Mining defense strategies for future outbreaks

University of Buffalo The State University of New York
Thank you!