Embed Size (px)
Citation preview

University of Alberta
Evaluating trade-offs: the effects of foraging, biting flies, and footing on
wood bison (Bison bison athabascae) habitat use
by
Robert Joseph Belanger
A thesis submitted to the Faculty of Graduate Studies and Research
in partial fulfillment of the requirements for the degree of
Masters of Science
in
Conservation Ecology
Department of Renewable Resources
© Robert J. Belanger
Fall 2017
Edmonton, Alberta
Permission is hereby granted to the University of Alberta Libraries to reproduce single copies of this thesis and to
lend or sell such copies for private, scholarly or scientific research purposes only. Where the thesis is converted to,
or otherwise made available in digital form, the University of Alberta will advise potential users of the thesis of
these terms.
The author reserves all other publication and other rights in association with the copyright in the thesis and, except
as herein before provided, neither the thesis nor any substantial portion thereof may be printed or otherwise
reproduced in any material form whatsoever without the author’s prior written permission.

ii
Abstract
Understanding the distribution of forage is important in predicting the distribution, habitat use
(behaviour), movements, and fitness-related traits of large, grazing ungulates. Although this
bottom-up perspective provides a foundation for understanding habitat supply and thus nutrition,
foraging decisions are also affected by among other things trade-offs with energy expenditure
and predation risk. This includes energy expenditures associate with thermal stress, deep snow,
and predation from biting flies and larger carnivores. The objectives of this study were to
quantify trade-offs between summer forage availability for wood bison with that of biting fly
abundance representing a form of predation, and soil firmness which affects movement and thus
energy budgets and carnivore predation risk. Specifically, trade-offs were assessed for three
habitat types and one landscape feature at nine replicate sites (n = 36 sites) utilized by bison in
the Ronald Lake area of northeast Alberta, Canada in the summer of 2016. At each site dung
counts (summer vs. winter) were quantified in belt transects to measure bison use, forage
measured in quadrats as dry biomass of graminoids, soil firmness quantified along transects with
a penetrometer, and biting flies trapped and netted throughout the summer. Structural equation
models were used to relate summer and winter use of habitats by bison as dung counts with that
of forage, footing, and biting flies. Graminoid availability was not related to summer wood bison
use, but was related positively to winter use when biting insects were absent and footing was
firm (frozen). Although summer bison use was not related to graminoid biomass, it was
negatively related to biting fly abundance and positively related to sites with more firm footing.
These results were consistent with diet and habitat selection studies of wood bison with summer
diets generally more diverse than that of winter diets. Studies of bison habitat use in relation to

iii
forage are often descriptive and rarely quantitative, often reporting the effects between a single
factor, either forage quality/quantity or land-cover types (vegetation types). This study provides a
more comprehensive understanding of the factors that contribute to the dynamic nature of wood
bison behaviour, habitat use, and fitness-related costs and benefits. A greater understanding of
the factors and trade-offs influencing and limiting habitat use is fundamental to guiding the
management and conservation of threatened bison populations, including the Ronald Lake herd
that overlaps its territory with that of oil sand deposits.

Preface
This thesis is the original work of Robert Belanger. The aim of this thesis is to investigate the
mechanisms, processes, and trade-offs influencing wood bison (Bison bison athabascae) habitat
use in northeast Alberta, Canada. Land-cover data was provided by Ducks Unlimited Canada and
were used for classifying habitat types and locating both study area and sample sites. I
contributed to the concept formation and study design, and led work on field data collection, data
analysis, and manuscript composition. Scott E. Nielsen and Mark A. Edwards contributed to the
concept formation, study design, data analysis, and thesis edits. Lu N. Carbyn contributed to
concept formation and study design.
Acknowledgements
I thank my supervisor, Dr. Scott Nielsen for his vison, profuse knowledge, and resolute focus
towards a study that faced great logistical challenges. His profound guidance contributed to a
successful field season and the work of this thesis. I thank him for his mentorship, continual
support, tremendous communication, and keeping an open door. Undoubtedly, I am beholden for
the opportunity to study in his lab, and the experiences that I wouldn’t otherwise have had the
liberty. I thank my co-supervisor, Dr. Mark Edwards for his remarkable knowledge of wildlife,
his constructive criticism which was instrumental in my development as a graduate student, his
mentorship, and his encouragement during trialing moments throughout my term. He provided
exceptional and invaluable communication and dedication towards my project and thesis, and I
owe him a great debt of gratitude. I thank Dr. Lu Carbyn for sitting on my committee and for his
unparalleled expertise, insight, and observations of bison ecology. His knowledge and wisdom
bolstered my comprehension of bison history, biology, ecology, and conservation, and was
fundamental in forming the basis of this study. I very much thank him for contributing time in
the field with me; his observations and guidance during this time were paramount to the strength
and success of this thesis. Lu has been a tremendous friend and mentor and I cherish everything
he has contributed to my thesis and personal growth.
Thank you to Karen Halwas and Tech Resources Limited, and Paul Knaga and Shell Canada
(now Alberta Environment and Parks) for providing funding. Your support was instrumental for
the realization of this project and what contributed to my most memorable field season thus far.
Thank you for providing comments and constructive feedback throughout my term – I greatly
appreciate your contributions to this project and my thesis. Thank you to Craig Dockrill and
Joann Skilnick from Alberta Environment and Parks for providing guidance and constructive
feedback throughout this project and for contributing time to meeting with me. I value the
insights you provided which improved the meaningfulness and implications of this study.

vi
Thank you to the Royal Alberta Museum (RAM) for providing funding to support a field
assistant and other considerable in-kind support. The funding and provisions you provided were
recognizably influential towards the completion of a successful, logistically challenging, field
season that was in part to the remarkable assistance of Ian Kriston (RAM).
Thank you to Alberta Conservation Association (ACA) Grants in Biodiversity, Northern
Scientific Training Program (NSTP), and University of Alberta Northern Research Awards
(UANRA), for providing funding that supported field activities, particularly as it relates to the
logistical challenges of working in the far north of Alberta.
Thank you to Dr. Derek MacKenzie for providing valuable guidance regarding soil properties
and methodology, and for use of lab equipment, space, and time. Your knowledge of soils and
advice were instrumental to my thesis work related to bison footing, and I greatly value the time
you spent with me.
Thank you to Vincent Belluz and John Acorn for providing helpful direction regarding insect
preservation and sampling methodology. Your background and knowledge were valuable in
navigating me to effective and cost-saving insect preservation and sampling methods.
Many thanks to my colleagues in the Applied Conservation Ecology at the University of Alberta.
The time you imparted toward conversations we’ve had were instrumental to the success of this
thesis. Your encouraging words supported me during the best and worst times, and I am forever
thankful for your kindness and comradeship.
To my family and friends, your encouragement, inspiration, and confidence in me, undeniably,
was responsible for making me the person I am today. Your palpable support was the mainstay
in my academic career and was integral in the accomplishments I’ve achieved. I will forever be
thankful for being a part of your lives. I love you.
Thank you to Melissa Dergousoff. Your tenacity, determination, skill, and physical and mental
strength were invaluable to the completion of a successful field season. Your hard work, effort,
kindness, advice, support, and ingenuity in bird identification were indispensable in everything

vii
we accomplished during our summer at Ronald Lake. I will forever remember the sacrifices you
made, the sunrises and campfires we shared, the storms we endured, and your commitment to
donning a bug-suit all summer long. Thank you.
Thank you to Roy Ladouceur and Mike Guertin for providing logistical support throughout the
summer during this study. The support you provided was essential for this project, and I thank
you for ensuring that Melissa and I were safe and happy campers.

Table of contents
Abstract ........................................................................................................................................... ii
Preface............................................................................................................................................ iv
Acknowledgements ......................................................................................................................... v
Table of contents .......................................................................................................................... viii
List of tables .................................................................................................................................... x
List of figures ................................................................................................................................ xii
List of Appendices ....................................................................................................................... xiv
Chapter 1: General introduction...................................................................................................... 1
Chapter 2: Evaluating the trade-offs influencing wood bison habitat use ...................................... 5
1.0 Introduction ........................................................................................................................... 5
2.0 Methods ................................................................................................................................. 8
2.1 Study area .......................................................................................................................... 8
2.2 Sample site selection ......................................................................................................... 9
2.3 Field methods .................................................................................................................. 10
2.4 Analysis of the effects of land-cover type on bison summer and winter activity, footing,
biting fly abundance, and forage biomass ............................................................................. 15
2.5 Analysis of effects of footing, biting fly abundance, and forage biomass on summer and
winter bison activity .............................................................................................................. 16
3.0 Results ................................................................................................................................. 17
3.1 Effects of land-cover type on summer and winter bison activity, footing, biting fly
abundance, and forage biomass ............................................................................................. 17
3.2 Structural equation model of soil wetness, biting fly abundance, and forage biomass on
summer and winter bison activity .......................................................................................... 18

ix
4.0 Discussion ........................................................................................................................... 18
4.1 Trade-offs in summer bison habitat use .......................................................................... 18
4.2 Management implications ................................................................................................ 22
Chapter 3: General conclusions .................................................................................................... 34
Literature cited .............................................................................................................................. 37
Appendix ....................................................................................................................................... 50

List of Tables
Table 2.1: Pearson’s correlation matrix of the most supported variables used in structural
equation models of summer bison activity. Dung, soil moisture content, biting fly
abundance, and graminoid biomass were measured in 4 land-cover types near Ronald
Lake, Alberta between June and August 2016 (n = 36).
Table 2.2: Univariate, linear regression models relating land-cover type on measured variables of
summer bison activity (n = 108), winter bison activity (n = 108), soil moisture content
(lab measured; n = 180), biting fly abundance (sweep net method; n = 2837), and
graminoid biomass (n = 324). Land-cover type ‘marsh’ was withheld as the reference
category in all models and thus significance based on their comparison (difference).
Dung, soil moisture content, biting fly abundance, and graminoid biomass were
measured in 4 land-cover types near Ronald Lake, Alberta between June and August
2016.
Table 2.3: Best fit structural equation model of direct, indirect, and total effects of soil moisture
content, biting fly abundance (sweep net method), and graminoid biomass on summer
bison activity. Soil moisture content, biting fly abundance, and graminoid biomass
were measured in 4 land-cover types (n = 36) near Ronald Lake, Alberta between June
and August 2016. Pearson’s R-square = 0.56
Table 2.4: Best fit structural equation model of direct total effects of graminoid biomass on
winter bison activity (dung). Graminoid biomass was measured in 4 land-cover types
(n = 36) near Ronald Lake, Alberta in August 2016. Pearson’s R-square = 0.16.
Table 2.5: Structural equation models testing the effects soil parameters (footing), biting fly
abundance, and forage biomass on summer bison activity (dung). Candidate,
multivariate models were used for selection of best fit structural equation model.
Bison dung counts, soil parameters (soil moisture, bulk density, and penetration
depth), biting fly abundance (using two methods: sweep net and tabanid traps), and
forage biomass (divided into three groups: graminoids, forbs, and shrubs) were

xi
measured in 4 land-cover types near Ronald Lake, Alberta between June and August
2016.
Table 2.6: Structural equation model testing the effects soil parameters (indirect effect) and
forage biomass (direct effect) on winter bison activity (dung). Candidate, multivariate
models were used for selection of best fit structural equation model. Bison dung
counts, soil parameters (soil moisture, bulk density, and penetration depth), and forage
biomass (divided into three groups: graminoids, forbs, and shrubs) were measured in 4
land-cover types near Ronald Lake, Alberta between June and August 2016.

List of Figures
Figure 2.1: Map of study area and study sites in north-eastern Alberta near Ronald Lake, Alberta,
~ 150 km north of Fort McMurray and ~15 km south of Wood Buffalo National Park.
Study sites were located adjacent to an ~18 km trapper’s trail that starts at the
Athabasca River and ends at Ronald Lake.
Figure 2.2: Mean dung count estimates in 4 land-cover types near Ronald Lake, Alberta (n =
108). Dung counts were measured in August 2016. Relative to marsh, summer bison
activity (dung counts) did not differ significantly from deciduous forest (β = 0.36, S.E.
= 0.34, p = 0.291), while being higher in pine forests (β = 1.48, S.E. = 0.34, p < 0.001)
and the esker habitat (β = 1.71, S.E. = 0.34, p < 0.001). In contrast to summer, winter
bison activity (dung counts) were not significantly differ from marsh in all three
habitats of deciduous forest (β = -0.39, S.E. = 0.46, p = 0.402), pine forest (β = -0.77,
S.E. = 0.46, p = 0.105), and the esker habitat (β = 0.13, S.E. = 0.46, p = 0.778).
Figure 2.3: Mean percent soil moisture content across 4 land-cover types near Ronald Lake,
Alberta (n = 180). Soil moisture content was measured using a 577 cm3
(15 cm height
x 7 cm round) soil core. Soil cores were dried in a drying oven at 100°C for 48 hours
and weighed. Relative to marsh habitats, soil moisture content was always
significantly lower for deciduous forest (β = -2.02, S.E. = 0.16, p < 0.001), pine forest
(β = -2.16, S.E. = 0.16, p < 0.001), and the esker habitat (β = -2.24, S.E. = 0.16, p <
0.001).
Figure 2.4: Mean biting fly abundance estimates from sweep nets for tabanids, mosquitos, and
midges across 4 different land-cover types near Ronald Lake, Alberta. Graph is of
mean number of flies caught during a single sweep net event which consisted of 30
sweeps while walking a 50 m transect (n = 2837). Flies were caught between June and
August of 2016. See appendices 21, 22 and 23 for individual abundances of tabanids,
mosquitoes, and midges. Relative to marshes, there were significantly fewer biting

xiii
flies in deciduous forest (β = -1.29, S.E. = 0.27, p < 0.001), pine forest (β = -1.25, S.E.
= 0.27, p < 0.001), and the esker habitat (β = -2.33, S.E. = 0.27, p < 0.001).
Figure 2.5: Mean forage biomass for 4 growth forms in 4 land-cover types near Ronald Lake,
Alberta. Forage was estimated at the end of the growing season (August 2016) in
multiple 0.5 m2 circular quadrats per site (n = 324). Relative to marshes, graminoid
biomass was lower in deciduous forests (β = -2.18, S.E. = 0.15, p < 0.001), pine
forests (β = -2.24, S.E. = 0.15, p < 0.001), and the esker habitat (β = -2.05, S.E. = 0.15,
p < 0.001).

List of Appendices
Appendix 1: Bison dung during summer (left) and winter (right). Summer and winter dung are
differentiated by texture and is largely influenced by moisture content influenced by
both direct water consumption and water content in forage. During summer months,
bison are better hydrated, thus summer dung is moister and more ‘plop’-shaped. In
contrast, during winter months bison are more dehydrated, thus winter dung is less
moist and is more block-shaped (Carbyn pres. comm.).
Appendix 2: Bison total dung counts for 4 land-cover types (n = 36). Dung was counted in 3,
100-m belt transects of 4-m width at each site in August 2016. Dung was divided into
summer and winter dung based on dung texture.
Appendix 3: Habitat selection coefficients for bison from the Ronald Lake herd from Tan et al.
(2015) and DeMars et al. (2016). Deciduous forest was held constant in both reports
(reference habitat). Seasons defined by: winter (Nov – Apr), spring (Apr – May),
calving (May – Jun), summer (Jun – Sept), and fall (Sept – Nov). In the DeMars et al.
(2016) report, the season summer + fall was defined as June – November.
Appendix 4: Mean forage biomass (g/m2) (n = 324) for three forage groups for 4 land-cover
types (n = 36) measured in August 2016.
Appendix 5: Mean biting fly abundance (count) from June to August 2016 for three sampling
methods across 4 land-cover types: sweep netting (n = 2837), tabanid traps (n= 540),
and Malaise traps (n = 80).
Appendix 6: Tabanid trap developed for this thesis based on design of Thorsteinson et al. 1965.
Traps were designed to catch flies from the family Tabanidae (description in section:
Field methods).

xv
Appendix 7: Correlation matrix of measured soil properties for 180 soil moisture and bulk
density samples and 756 penetration depth measures taken in 4 land-cover types
(marsh, deciduous, pine, and esker) in the summer of 2016 near Ronald Lake, Alberta.
Appendix 8: Mean penetration depth (n = 756), bulk density (n = 180), in-situ soil moisture (n =
756), and lab measured soil moisture (n = 180), for 4 land-cover types (n = 36). Soil
parameters were measured in July 2016.
Appendix 9: Soil penetrometer developed for this thesis and used to measure soil resistance and
strength (description in section: Field methods). Penetrometer body constructed of 2 m
length, 1.5” schedule 40 steel pipe, and 1 m length penetration pin constructed of 1”
solid steel (A). A sliding weight (7 kg) was dropped from 1.5 m height onto the collar
of the penetration pin (B & C). A tape measure fixed to a stake was used to measure
penetration depth to the nearest 0.5 cm.
Appendix 10: Univariate, linear regression models testing the effects of soil parameters (footing),
biting fly abundance, and forage biomass on summer bison activity (dung). Candidate,
univariate models were used for selection of variables to be used in multivariate,
structural equation models. Bison dung counts, soil parameters (soil moisture, bulk
density, and penetration depth), biting fly abundance (using two methods: sweep net
and tabanid traps), and forage biomass (divided into three groups: graminoids, forbs,
and shrubs) were measured in 4 land-cover types near Ronald Lake, Alberta between
June and August 2016.
Appendix 11: Univariate, linear regression models testing the effects of different forms of forage
biomass on winter bison activity (dung). Candidate, univariate models were used for
selection of variables to be used in multivariate, structural equation models. Bison
dung counts and forage biomass (divided into three groups: graminoids, forbs, and
shrubs) were measured in 4 land-cover types near Ronald Lake, Alberta between June
and August 2016.

xvi
Appendix 12: Linear regression of the effect of soil moisture content on bison summer activity
(dung). Soil moisture content and dung counts were measured from June to August
2016 for 4 land-cover types (n = 36) near Ronald Lake, Alberta.
A linear regression of summer dung count and percent soil moisture. Bison summer
activity (dung) was significantly negatively related to soil moisture (F1,34 = 16.84, S.E.
= 0.83, R2 = 0.33, p < 0.001).
Appendix 13: Linear regression of the effect of biting flies: tabanids, mosquitos, and midges
(sweep net total) on bison summer activity (dung). Biting fly abundance and dung
counts were measured from June to August 2016 for 4 land-cover types (n = 36) near
Ronald Lake, Alberta. A linear regression of summer dung count and biting fly
abundance. Bison summer activity (dung) was significantly negatively related to biting
fly abundance (F1,34 = 16.64, S.E. = 0.83, R2 = 0.33, p < 0.001).
Appendix 14: Linear regression of the effect of graminoid biomass on bison summer activity
(dung). Graminoid biomass and dung counts were measured in August 2016 for 4
land-cover types (n = 36) near Ronald Lake, Alberta. A linear regression of summer
dung count and graminoid biomass. Bison summer activity (dung) was significantly
negatively related to graminoid biomass (F1,34 = 9.99, S.E. = 0.89, R2 = 0.45, p =
0.003).
Appendix 15: Linear regression of the effect of graminoid biomass on bison winter activity
(dung). Graminoid biomass and dung counts were measured from June to August 2016
for 4 land-cover types (n = 36) near Ronald Lake, Alberta. A linear regression of
winter dung count and graminoid biomass. Bison winter activity (dung) was not
significantly related to graminoid biomass (F1,34 = 2.92, S.E. = 0.43, R2 = 0.08, p =
0.097).
Appendix 16: Mean percent soil moisture content for 4 land-cover types near Ronald Lake,
Alberta (n = 756). Soil moisture content was measured using a soil moisture probe
(TDR) in July 2016.

xvii
Appendix 17: Mean soil bulk density estimate for 4 land-cover types near Ronald Lake, Alberta
(n = 180). Soil bulk density was measured using a 577 cm3 soil core measuring 15 cm
in height x 7 cm in diameter. Soil cores were dried in a drying oven at 95°C for 48
hours and weighed.
Appendix 18: Mean soil penetration depth for 4 land-cover types near Ronald Lake, Alberta (n =
756). Soil penetration depth was measured using a custom-designed soil penetrometer
described in Appendix 9.
Appendix 19: Mean tabanid (Diptera: Tabanidae) abundance from June to August 2016 for 4
land-cover types near Ronald Lake, Alberta. Graph is of mean number of horse flies
(tabanids) caught during a single sweep net event which consisted of 30 sweeps while
walking a 50 m transect (n = 2837).
Appendix 20: Mean mosquito (Diptera: Culicidae) abundance from June to August 2016 for 4
land-cover types near Ronald Lake, Alberta. Graph is of mean number of mosquitos
caught during a single sweep net event which consisted of 30 sweeps while walking a
50 m transect (n = 2837).
Appendix 21: Mean midge (Diptera: Ceratopogonidae) abundance from June to August 2016 for
4 land-cover types near Ronald Lake, Alberta. Graph is of mean number of midges
caught during a single sweep net event which consisted of 30 sweeps while walking a
50 m transect (n = 2837).
Appendix 22: Mean tabanid (Diptera: Tabanidae) abundance from June to August 2016 for 4
land-cover types near Ronald Lake, Alberta. Graph is of mean number of tabanids
caught in tabanid traps over 5, 7-day periods (n = 540).

xviii
Appendix 23: Mean tabanid (Diptera: Tabanidae) abundance from June to August 2016 for 4
land-cover types near Ronald Lake, Alberta. Graph is of mean number of tabanids
caught in Malaise traps over 5, 7-day periods (n = 36).
Appendix 24: Mean abundance of tabanids, mosquitos, and midges (total) from June to August
2016 for 4 land-cover types near Ronald Lake, Alberta. Graph is of mean number of
flies caught during a single sweep net event which consisted of 30 sweeps while
walking a 50 m transect (n = 2837).
Appendix 25: Mean tabanid (Diptera: Tabanidae) abundance from June to August 2016 for 4
land-cover types near Ronald Lake, Alberta. Graph is of mean number of horse flies
caught during a single sweep net event which consisted of 30 sweeps while walking a
50 m transect (n = 2837).
Appendix 26: Mean mosquito (Diptera: Culicidae) abundance from June to August 2016 for 4
land-cover types near Ronald Lake, Alberta. Graph is of mean number of horse flies
caught during a single sweep net event which consisted of 30 sweeps while walking a
50 m transect (n = 2837).
Appendix 27: Mean midge (Diptera: Ceratopogonidae) abundance from June to August 2016 for
4 land-cover types near Ronald Lake, Alberta. Graph is of mean number of horse flies
caught during a single sweep net event which consisted of 30 sweeps while walking a
50 m transect (n = 2837).

1
Chapter 1: General introduction
Habitat selection is a hierarchical, behavioural process by which animals select resources within
a landscape, thereby affecting acquisition and competition for food and mates, reproductive
success, and predator avoidance (Schaefer & Messier 1995; Rettie & Messier 2000; Dussault et
al. 2005; Loiser et al. 2015; Long et al. 2016). Animal behavioural and functional responses are
influenced by spatial and temporal variability in resources that relate to trade-offs associated
with abiotic-biotic interactions, which are most apparent when resources are limiting (forage) or
fitness-costs are high (predation) (Mysterud & Ims 1998; Godvik et al. 2009; Hebblewhite &
Merrill 2009; Owen-Smith et al. 2010). Based on energy maximization principles within a
heterogeneous landscape, we expect the distribution of large, grazing ungulates to match
nutritious forage resources (Hanley 1982; Bergman et al. 2001; Fortin et al. 2003; Zweifel-
Schielly et al. 2009; Wilmshurst et al. 2000; Beyar et al. 2010; Newmark & Rickart 2013;
Shoenecker et al. 2015; Dupke et al. 2017). While attaining forage resources may be critical for
meeting nutritional needs, foraging decisions by animals may be only one of several factors,
including predation risk and energy budgets, which affect animal behaviour, habitat use and
distributions, and ultimately fitness (Hanley 1982; Canon et al. 1987; Brown et al. 1999; Aublet
& Festa-Bianchet 2009; Ahmad et al. 2016; Dupke et al. 2017). Examining the processes and
trade-offs related to fitness is therefore important to understanding animal behaviour and habitat
use, which is beneficial for the successful management of populations (Mysterud & Ims 1998;
Brow et al 1999; Dussault et al. 2004; Schoenecker et al. 2015; Steenweg 2016; Yan et al 2016).
Much is known regarding habitat and resource selection of animals, where a myriad of studies
has examined the effects of land-cover attributes and scale on the spatial and temporal
distributions of animals (Boyce 2006; Hebblewhite et al. 2008; Zweifel-Schielly et al 2009;
Owen-Smith et al. 2010; Shoenecker et al. 2015; Steenweg 2016). While models of habitat and
resource selection can provide a basis for the conservation and management of populations,
attributes in these models are rarely quantified resulting in speculation about the operative
processes influencing the health and survival of animals (Brown et al. 1999; Joly 2008;
Theuerkauf & Rouys 2008; Owe-Smith 2014: Schoenecker et al. 2015; Tan et al. 2015; Courbin
et al 2017). Identifying, quantifying, and coupling land-cover attributes with biological and

2
environmental processes can assist in more accurately modeling biotic-abiotic interactions and
spatial and temporal distributions of animals. A more comprehensive understanding of habitat
use can provide robust rationale for the conservation and management of habitats and resources
within populations ranges’, especially for those species that are rare or endangered, or whose
habitats limit populations due to disturbance, fragmentation, and loss.
Biological and environmental factors influencing animal habitat use are generally regulated by
bottom-up (primary production) or top-down (predation) processes. Trade-offs are common
where predation risk or predator avoidance limits use of foraging areas composed of high
quality/quantity forage and/or increase use of areas where prey are less vulnerable to predators
(Canon et al. 1987; Fortin et al. 2002; Dussault et al. 2005; Brown et al. 2009; Hebblewhite &
Merrill 2009; Witter et al. 2012: Dupke et al.2017). Behavioural responses to trade-offs in
foraging and predations risk can have profound effects on animal distributions and habitat
selection, such as avoidance of valleys and meadows where forage resources are abundant, but
predation risk is high, and conversely selection for mountain ridges where risk of predation is
low (Sih 1980; Hamel & Cote 2007; Fortin et al. 2009; Zweifel-Schielly et al. 2009; Newmare &
Richart 2013; Schoenecker et al. 2015; Yan et al. 2016; Baruzzi et al. 2017).
Underlying mechanisms that affect habitat use include forage and water availability (Later &
Gates 1991; Fortin et al. 2003; Acebes et al. 2013; Newmark & Rickart 2013; Long et al. 2014;
Long et al. 2016; Ringinos 2016), predation risk (Brown 1999: Brown et al. 1999; Hammel &
Cote 2007; Hebblewhite & Merrill 2009), and environmental components such as thermal stress
(Mysterud & Ostby 1999: van beest et al. 2012; Dussault et al. 2004; Aublet & Festa-Bianchet
2009), and snow depth (Schaefer & Messier 1995; Mysterud et al. 1997; Brown 1999;
Hebblewhite & Merrill 2009; Robinson & Merrill 2012). Examples of fitness-related trade-offs
are often found in studies of large, grazing ungulates. For instance, elk (Cervus canadensis) and
mountain goats (Oreamnos americanus) limiting use of areas of high forage quantity/quality to
mediate predation risk by wolves by using areas of higher elevation (Fortin et al. 2002; Richard
et al. 2014). Similarly, caribou (Rangifer tarandus) reduce time spent foraging to mediate
predation by biting flies by seeking snow patches, open tundra, and hill-tops during summer

3
months (Helle et al. 1992; Toupin 1996; Hagemoen & Reimers 2002; Rolf & Reimers 2000).
Likewise, moose (Alces alces) and elk decrease time spent in open areas of higher forage
availability during summer months to mediate thermal stress by using closed canopy, conifer
forests (Dussault et al. 2004; van Beest et al. 2012; Mysterud & Ostby 1999). White-tail deer
(Odocoileus virginianus), muskoxen (Ovibos moschatus), moose, caribou, and mountain goats
adjust their forage preference and behaviour to mediate locomotive and energetic costs, and
predation risk by diversifying foraging strategies and limiting their travel through areas of deeper
snow (Pruitt 1960; Stardom 1977; Schmitz 1991; Schaefer & Messier 1995; Mysterud &
Bjornsen 1997; Poole & Mowat 2005; Robinson & Merrill 2012; Richard et al. 2014; Courbin et
al. 2017). Overall, animals use different habitat and feature types due to relationships with fitness
by counterbalancing energy gains (forage) with predation risk and energy costs (Hanley 1982;
Pepin et al. 2009; Shepard et al. 2013; Long et al. 2016). Better understanding of the processes
and mechanisms that govern habitat use can benefit ecologists by better discerning animal
behavioural and functional responses, and for land-use managers who are tasked with species-
specific land-use planning to maintain and/or maximize populations.
Wood bison (Bison athabascae) are a large grazing ungulate (Knapp et al. 1999; Mendoza &
Palmqvist 2008), and a close relative to European (Bison. b. bonasus), and plains (Bison b.
bison) bison that once numbered in the tens of millions on the great plains of North America
until the turn of the 20th
century (SARA 2017). Wild and managed extant occurrences of wood
bison are endemic to areas north of their plains relatives in the northern regions of the provinces
and territories of Canada and the state of Alaska, and are classified as near threatened
internationally (IUCN 2017), and threatened in Canada (SARA 2017). Bison diet and habitat
selection have been well studied, with forage availability identified as a significant factor
limiting bison populations, and a primary factor determining bison distributions and habitat use
(Chowns 1987; Reynolds 1987; Larter & Gates 1991; Carbyn et al. 1993; Fortin et al. 2002;
Fortin et al. 2009; Strong & Gates 2009; Jung 2015; Merkel et al. 2015; Steenweg et al. 2016).
While many studies address bison habitat selection relative to forage, there is a lack of focus on
trade-offs associated with foraging, and other mechanisms that may affect bison habitat use,
including factors that may limit use of areas with high forage quality and quantity such as

4
predation risk and energy costs (Carbyn & Trottier 1987; Theuerkauf & Rouys 2008).
Comprehensive studies addressing top-down, bottom-up, biological and environmental factors
regarding bison habitat use are rare and are needed to understand the factors influencing and
limiting bison populations.
Wood bison, like other boreal ungulates, likely face similar trade-offs relative to their energy
demands via foraging, such as predation risk by wolves and biting flies, thermal stress, and snow
depth. While studies have speculated that bison are affected by factors other than forage, they
have rarely been empirically quantified (Berezanski 1986; Morgan 1987; McMillian 2000; Fortin
et al. 2009). A more comprehensive analysis of the mechanisms regulating bison habitat use is
needed to improve our understanding of bison behavioural and functional responses to biological
and environmental stimuli which in-turn affect the spatial and temporal distribution of
individuals and populations. Progressive and comprehensive knowledge of the resources and
habitat types and features needed for the maintenance and survival of wood bison populations is
essential for the conservation and management of this species.
In this thesis I examine patterns in bison summer habitat use as it relates to the bottom-up factor
of forage availability and two factors that may limit summer use of high forage value areas:
biting fly activity and soil/ground firmness or footing. Insect harassment can negatively affect
health and survival (Helle & Tarvainen 1984; Toupin et al. 1996; Rolf & Reimers 2002), while
footing, like that of snow depth, can limit movement and thus positively affect predation risk by
large carnivores, and negatively affect energy budgets (Pruitt 1960; Parker et al. 1984; Fancy &
White 1986; Shepard et al. 2013). The remainder of thesis is comprised of a single ‘data’ chapter
(Chapter 2) that relates to field work conducted to address the above question, a conclusion
chapter that relates this work to management questions and future research needs, and lastly a
supplemental appendix that supports the research. The style used in this thesis reflects formatting
requirements for the Journal of Mammal Research.
5
Chapter 2: Evaluating the trade-offs influencing wood bison habitat use
1.0 Introduction
Wood bison are a large, grazing ruminant (Knapp et al. 1999; Mendoza & Palmqvist 2008)
whose summer diets are diverse being composed of graminoids (primarily), forbs, and shrubs
with winter diets being primarily graminoids, particularly sedges (Jung 2015; Fortin et al. 2003;
Strong & Gates 2009; Bergman et al. 2015; Steenweg et al. 2016; Leonard et al. 2017).
Numerous ecological studies of bison have focused on the diversity and seasonality of diets
(Reynolds et al. 1987; Campbell & Hinks 1983; Larter & Gates 1991; Strong & Gates 2009;
Bergmann et al. 2015; Jung 2015; Lenard et al. 2017), with seasonal selection of vegetation-
cover types quantified during different seasons and life-stages (Schoenecker et al 2015; Tan et al.
2015; DeMars et al. 2016). Habitat selection of the Ronald Lake bison herd (Tan et al. 2015;
DeMars et al. 2016) show results that are consistent with studies and observations of bison where
sedge marshes are selected in both summer and winter months relative to other land-cover types
(Chowns 1987; Larter & Gates 1991; Fortin et al. 2003; Jung 2015; Merkel et al. 2015).
However, habitat selection is substantially lower for sedge marshes during summer compared to
winter with a 1.5 to 4-fold decrease in use during summer from winter. The observed decrease in
selection leads to complementary hypotheses: 1) forage availability and nutrition in sedge
marshes, relative to other land-cover types, is greater during winter months (Larter & Gates
1991; Bergmann et al. 2015; Leonard et al. 2017), thus bison show greater selection for sedge
marshes in winter, and/or 2) non-forage related factors contribute to declines in summer selection
of sedge marshes, including availability of more nutritious forage resources (forbs, shrubs)
(Larter & Gates 1991; Leonard et al. 2017) in other land-cover types (2a) and/or other
mechanism(s), such as increased predation risk, contributing to lower use of sedge marshes (2b).
Here, I evaluate these hypotheses by investigating bison use of sedge marshes, deciduous forests,
jack pine forests, and an esker (prominent, high elevation geological feature). I examine these
land-cover and feature types to contrast forage availability, predation risk by biting flies and
large carnivores, and locomotion as mechanisms of habitat use within the Ronald Lake bison
herd in northeast Alberta, Canada (Fig. 2.1). By examining this question, we will better

6
understand factors affecting bison habitat use, thus providing insight into the possible
mechanisms contributing to differences in habitat use between two seasonal extremes.
Ungulate foraging decisions are often discussed in the context of trade-offs, where predation risk
and energy costs associated with locomotion and thermal conditions affect foraging behaviour,
habitat use, and general spatial and temporal changes in their distributions. (Brown 1999; Fortin
et al. 2001; Dussault et al. 2005; Hebblewhite & Merrill 2009; Zweifel-Schielly et al. 2009;
Ahmad et al. 2015). While much is known regarding bison habitat use in the context of forage
availability and nutrition, less is known regarding the trade-offs associated with foraging and
abiotic and biotic stimuli, including predation and energetic costs that may affect bison foraging
behaviour.
Wetlands in the boreal, particularly marshes, are areas of high primary productivity during
summer months, where graminoids contribute a substantial portion of annual biomass (Gorham
1974). This productivity can be attributed to elevated levels of soil moisture content (Gorham
1974; Briggs & Knapp 1995; Duckworth et al. 2010). Despite contributing to considerable
amounts of primary productivity, these wetlands also significantly shape other ecosystem
functions, processes, and taxa, including provisioning of breeding sites and habitats for the
lifecycles of many insects, including those of biting flies that prey on mammals for blood-meals
(Danks 1981; Lewis 1987; Kozlov et al. 2005). Wetlands and graminoids are therefore important
aspects of habitat supply and forage availability for bison. However, summer use of these areas
may be limited due to 1) harassment by biting flies which may negatively affect the health and
energy balance of bison, and 2) soft soil conditions which may limit the movement of bison thus
affecting their energy balance and predation risk by wolves. To balance the trade-offs associated
with these factors, like other ungulates, bison may 1) seek areas where alternate forage
opportunities exist, such as other graminoids, forbs, and shrubs, 2) seek areas of refugia from
biting flies, such as hill-tops and areas of lower insect activity and abundance, and 3) seek areas
of firmer ground where energy costs associated with movement are lessened, and where bison
are more readily able to defend themselves from large carnivores such as wolves. In this study I
investigate the effects of forage availability, biting fly activity, and soil softness/firmness, or

7
footing, on bison summer habitat use for the Ronald Lake bison herd. Forage resources may be
important regarding bottom-up effects of bison habitat use. However, a more comprehensive
understanding of bison summer habitat use is needed to address multiple factors and processes
limiting bison habitat use/selection.
Biting, blood-sucking flies from the order Diptera and families Simuliidae, Culicidae,
Ceratopogonidae, and Tabanidae are some the most common and widespread biting flies in
boreal environments (Lewis 1987; Kozlov et al. 2005; Krecmar 2005). Predation by biting flies
have been shown to affect ungulate behaviour, health, distribution and migration patterns during
summer and calving seasons (Helle & Tarvainen 1984; Morgan 1987; Thomas and Kiliaan 1990;
Folstad et al. 1991; Toupin et al. 1996; Witter et al 2012 & 2014). Because of harassment by
biting flies, ungulates reduce time foraging, while also expending more energy in response to
irritation (harassment) by flies. Consequences of this harassment are blood and net energy loss,
and decreased health and survival of adults and calves (Ralley 1985; Walsh et al. 1992; Morschel
& Klein 1997; Hagemoen & Reimers 2002; Witter et al. 2014). To avoid or reduce predation by
flies, animals seek habitat types and features including open tundra, hill-tops, and snow patches
(Rolf & Reimers 2002), and time their migrations from areas of high insect load to areas of low
insect load, including movements from inland to coastal areas, and lowlands to elevated areas
(Folstad et al. 1991).
Observational studies of bison behaviour during summer months show that bison are affected by
biting flies (Morgan 1987; Carbyn et al. 1993; McMillan et al. 2000), although quantitative
studies of biting fly activity and/or abundance in relation to bison habitat use are rare. During
times of high biting fly activity, bison spend less time foraging, more time lying, and more time
using wallows to thwart the effects of biting flies (Morgan 1987; McMillan et al. 2000). Biting
flies may negatively affect bison health and energy budgets, and may therefore be a key factor
regarding bison foraging decisions, health, and habitat use. In contrast to summer, during winter
the distribution and depth of snow affects ungulate foraging decisions, movement, distributions,
and negatively affects energy budgets, and positively affects predation risk (Mysterud et al.
1997; Pool & Mowat 2005; Pepin et al. 2009; Robinson & Merrill 2012; Courbin et al. 2017).

8
Like that of snow cover, during summer months variation in soil softness/firmness may yield
similar energy costs and risk to predation, and thus constrain foraging opportunities in highly
productive areas such as wetlands and marshes where primary production is high (Murray 1991;
Duckworth et al. 2010; Shepard et al. 2013). This has not, however, been quantitatively
examined for wood bison. The objective of this study is to test trade-off hypotheses in the
context of forage availability, predation risk by biting flies, and locomotive, energetic costs
associated with abiotic elements of terrain affecting footing which may further relate to predation
risk, during the summer period when forage is widely available. Specifically, I quantify wood
bison habitat use with dung counts, summer forage (graminoid) biomass, biting fly abundance,
and soil firmness/footing in three habitat types and one landscape feature for the Ronald Lake
bison herd in northeast Alberta, Canada. This examination will improve our knowledge of the
factors regulating bison foraging decisions and use of land-cover types important for habitat
supply (forage).
2.0 Methods
2.1 Study area
The study area was selected based on the known distribution of bison in the Ronald Lake area
(Tan et al. 2015; DeMars et al. 2016) in northeast Alberta, Canada approximately 15 km south of
Wood Buffalo National Park (Fig. 2.1). I selected sampling sites within a 12-km radius of
Ronald Lake and covering ~452 km2 of boreal forest (57°58’ N, 111°40’ W). The area of Ronald
Lake marks the approximate center of the herds’ known home-ranges which extend ~40 km to
the north and south and ~30 km and ~15 km from western and eastern extents, respectively. The
nearest whether station to the Ronald Lake area is Fort Chipewyan where mean annual
temperature is -1.5° C, and a mean annual precipitation of 366 mm. Elevation within the study
area vary between 222 to 325 m above sea-level. Land-cover types include a mosaic of upland
aspen (Populus tremuloides) and balsam poplar (P. balsamifera), white spruce (Picea glauca),
jack pine (Pinus banksiana), and mixed-wood forests, and wetlands that include meadow and
emergent marshes, treed swamps, and poor to rich treed and non-treed fens and bogs. Unlike

9
much of the Lower Athabasca region, this area is more dominated by meadows and marshes than
fens and bogs which are more common to other areas of the region. Bordered to the west and
east of the study area are the Birch Mountains and the Athabasca River, respectfully. Active
resource exploration, extraction, and development by forestry and energy industries have created
a variety of anthropogenic disturbances including forestry, seismic lines, and temporary or
season roads that occur mostly in the southern parts of the study area (Tan et al. 2015).
2.2 Sample site selection
I selected three land-cover types frequently used by bison, marsh meadows, deciduous forests,
and jack pine forests, for study using previous information on Ronald Lake bison habitat
selection (Tan et al. 2015; DeMars et al. 2016). In addition to land-cover types, I also included a
large esker (surficial geological feature composed of alluvial sediments formed by under-glacial
streams) (Storrar et al. 2015) that dissects the study area spanning ~15 km north-south ending in
the north at Ronald Lake itself. The esker represents an area of higher elevation that is exposed
to westerly winds which were hypothesized to be a potential refuge from biting insects and thus
included in the study design. Here forth, I refer to land-cover types and land form features
(esker) collectively as land-cover for simplicity.
I selected 9 representative field sites for each of the 4 land-cover types (n = 36) using the Ducks
Unlimited Enhanced Wetland Classification (Ducks Unlimited Canada 2016) in ArcGIS 10.3
(ESRI 2014). Only sites having a minimum patch size of 1 ha (100 x 100 m) were considered, to
avoid potential misclassification and to be large enough to accommodate my field sampling
design. All sites were close to a ~18 km long, semi-maintained, trapper’s access trail starting at
the Athabasca River and ending at Ronald Lake. Final sample sites were based on stratification
in ArcGIS (land cover type and patch size) and accessibility (within 3 km of the trail). Because
the esker was a single landform in the area, the nine sampled esker sites were equally spaced
along a 6-km section of the esker and thus ~750 m apart (Fig. 2.1).

10
2.3 Field methods
2.3.1 Transects
I established transects 60 m in length in the center of each site and sampled soils, biting flies, and
vegetation. I selected the 60 m transect length to reduce edge effects given that some patches
were as small as 1 ha with all transect ending >20 m from any visible edge. All transects were
established along a north-south bearing, except in marshes where directionality and proximity of
marshes to other land-cover types required an alternate bearing.
2.3.2 Bison activity
Bison summer and winter dung counts were used as a measure of bison summer and winter
activity, respectively. I sampled dung counts at all sites between 16 and 18 August of 2016. At
each sample site, dung were counted in 3 belt transects, 100 m in length and 4 m in width (2 m
on either side of a tape), and parallel to each-other starting at the center of each site. A single
dung count was recorded based on the assessment of an individual bison defecation event, i.e. a
single or small grouping of dung patty(s) as summer dung, or grouping of droppings as winter
dung with texture further used to differentiate seasons (Appendix 1). In total, 108 transects were
sampled (4 landcover types × 9 sites per landcover type × 3 transects each) (Appendix 2).
Dung counts were assumed to be directly proportional to bison activity, and more specifically
that decay rates for both summer and winter dung to be equal within land-cover types (Brodie
2006; Theurerkauf & Rouys 2008). Detectability of dung in marshes may be lower given the
amount of biomass present obscuring visibility and moist conditions that may increase
decomposition rates (Rodriguez et al. 1998; Brodie 2006). Exhaustive effort was given to fully
searching each transect to minimize false absences due to poor visibility. Relative to length of
time dung were assessed, decay rates of dung for cattle have been estimated at 180 to 240 days
(Rodriguez et al. 1998). To help minimize bias associated with time since defecation, I counted
only recent dung, or dung that did not look visibly decayed. Overall, dung counts represented the
complete winter period (mid-November – March) and the summer (April – mid-August) cycle
for up to 270 days. Dung encounter rates in this study were also consistent with studies of wood
11
bison summer and winter diet elsewhere (Larter & Gates 1991; Jung 2015; Leonard et al. 2017)
and importantly were similar in ranking to habitat selection values for this population of animals
based on GPS-telemetry data (Tan et al. 2015; DeMars et al. 2016) that independently indexed
use of habitats without potential biases associated with dung measures and redistribution of dung
based on foraging, resting, and movement behaviours (Appendix 3).
2.3.4 Forage
I estimated biomass of plants by species, growth form, or genera at the end of the growing
season between 9 and 15 August. Nine equally spaced 0.5 m2 circular quadrats were alternatingly
set at 2-m from the 60 m transect line starting at 0-m and ending at 60-m. In total, I sampled 324
plots (4 landcover types × 9 replicate sites × 9 quadrats per site/transect). All vegetation within
quadrats were clipped with graminoids and forbs cut 2.5 cm above ground and only new growth
of shrubs cut. Creeping shrubs, such as bearberry (Arctostaphylos uva-ursi), lichens, mosses, and
trees were not collected due to 1) unlikeliness of being a component of bison diet (Jung 2015,
Bergmann et al. 2015; Leonard et al. 2107), or 2) very low occurrences within plots. Clipped
vegetation was separated by species, dried in a drying oven at 60° C for 48 hours, and weighed
using a balance to the nearest 0.01 g. For final analysis vegetation was lumped into one of three
growth forms based on previous studies of bison diet composition (Jung 2015, Bergmann et al.
2015; Leonard et al. 2107): graminoids, forbs, and shrubs (Appendix 4)
2.3.5 Biting flies
I sampled biting flies between 18 June and 16 August with a focus on groups of insects that are
known to affect the behaviour of boreal ungulates, including caribou (Helle & Tarvainen 1984;
Witter et al. 2014) and bison (Morgan 1987; McMillan et al; 2000). Specifically, 4 families of
biting flies were assessed from the order Diptera: Tabanidae (horse-fly and allies), Simuliidae
(black fly and allies), Culicidae (mosquito and allies), and Ceratopogonidae (biting midges and
allies) (Lewis 1987; Walsh et al 1992; Pfannenstiel & Ruder 2015; Kozlov et al. 2015). I used 3
sampling methods to measure biting fly activity: 1) sweep netting (Rolf & Reimers 2002;
Krcmar 2005); 2) tabanid traps (or modified Manitoba traps) (Thorsteinson et al. 1965; Morgan

12
1987; Duncan & Cowtan 1980; Schreck et al. 1993); and 3) Malaise traps (Schreck et al. 1993;
Tunnakundacha et al. 2017). Each sampling method is described below.
Sweep netting
Sweep net sampling started 18 July and ended 16 August. Ten sampling days occurred in July
and 8 days in August with 2 observers used. Sweep net samples occurred across the study period
with 16 sites randomly selected for sampling each day (4 per land-cover type). A site was
sampled at a minimum frequency of 2 to 3 days. Specifically, 30 full sweeps (180°) above
graminoid vegetation height (~1 m above ground) were used while walking a 50-m transect with
12 transects completed per site. Total number of flies caught was recorded and the flies released.
Time of day, average and maximum wind speed (m/s), temperature (°C), and relative humidity
(%) were recorded using a handheld Kestral 3500 weather meter mounted to a stake at 1.3 m
height at each sample site for the duration of sweep net sampling (~20 minutes). In total, 2837
sweep net events were conducted during 254 site visits at the 36 sites (Appendix 5).
Tabanid and Malaise traps
Tabanids were sampled in 2016 between 27 June and 16 August over five 7-day sampling
periods using tabanid and Malaise traps. Three tabanid traps were spaced equally along the main
60 m transect at each of the 36 sites, while a single Malaise trap (4 per land-cover type) was set
15 m perpendicular to the center of each transect. Traps were set on day 1 and samples collected
on day 7 of each sampling period. In total, 504 tabanid trap samples and 80 Malaise trap samples
were collected over the 5-week sampling period or 108 samples per week. Of the 80 Malaise trap
samples (16 per week), only 36 samples were fully collected due to high trap interference from
wildlife. Given the loss of these data, Malaise trap information were removed from analyses due
to low sample sizes (Appendix 5).
Tabanid traps were constructed using the design of Thorsteinson et al. (1965) to specifically
target flies from the family Tabanidae (Thorsteinson et al. 1965). Traps were constructed of 6
mm transparent plastic cut into a cone shape measuring 13 cm diameter at the top and 76 cm

13
diameter at the bottom, and at a 76-cm height. Half-inch plastic tubing was taped with weather
resistant tape to the bottom of the cone for support. Two-liter soda bottles were used to capture
tabanids with the top of soda bottles cut off, inverted, and glued inside the soda bottles. Soda
bottle-capture units were attached to the top of the cone. Traps were fixed to a stake with the
bottom 1 m above ground. A black ring measuring 50 cm in diameter x 12 cm in height, made of
3 mm black plastic was fixed to the stake just below the bottom cone opening to attract (lure)
biting flies from the family Tabanidae (Appendix 6). No preservatives were used in traps.
Tabanids from traps were preserved in 250 ml specimen cups filled with ethylene glycol
(Schmidt et al. 2006) and brought back to lab for identification by family, and counted.
2.3.6 Footing
Ground footing by animals can be described by the firmness, strength, or shear resistance of soil
when pressure is applied to it such as when an animal steps (Haranz et al. 2000). Three soil
properties were used to index footing conditions – soil bulk density, soil moisture content, and
soil penetration depth. All measures of soil properties were correlated (r > 0.866) with each other
(Appendix 7). A more detailed description of each measure is provided below.
Soil bulk density
Soil bulk density describes the pore space within a specific volume of soil. Soils with lower bulk
density have a greater amount of pore space (Hernanz et al. 2000). Soils with lower bulk density
and greater pore space are often considered softer or less firm soils. Soil bulk density was
measured using two cylindrical steel soil cores that each measured 70 mm x 150 mm. A 150-mm
core was used to ensure that both organic and mineral horizons were obtained. At sites with
shallow organic horizons, composed primarily of mineral soil, a core was pushed into to the soil
to obtain a soil core. At sites with deep organic horizon, composed primarily of organic material,
a core sharpened on one end was drilled into the soil to cut and obtain a soil core. Five soil cores
were taken equally spaced along the main 60 m transect at each site. Soil cores were then placed
into a double layer of plastic Ziploc bags to ensure that core moisture loss was minimal, and
taken to lab for drying and weighing. Aluminum baking trays and a drying oven were used for

14
drying the cores. Trays were dried and weighed using a balance before soil cores were placed on
them. Soil cores were dried in a drying oven at 100 °C for 48 hours. A total of 180 soil bulk
density cores were sampled (Appendix 8). Soil bulk density was then calculated on a volumetric
basis using the following equation:
𝜌𝑏 =𝑊𝑑
𝑚𝑚3 ,
where 𝜌𝑏 = bulk density of soil, 𝑊𝑑 = dry weight of soil, and 𝑚𝑚3 = volume of soil.
Soil moisture content
Soil moisture content describes the water holding capacity of a soil as it is related to soil
properties such as texture (sand, silt, clay). Water holding capacity of a soil increases as organic
and/or clay content increases (Hernanz et al 2000). Soils with high moisture content are
generally softer and thus less firm soils. Soil moisture content was measured here using two
methods – in-situ and lab measurements. In-situ soil moisture content was measured using a PR2
soil moisture probe (Delta-T Devices Ltd. Cambridge, UK) at 7 locations equally spaced along
the main 60 m transect starting at 0-m and ending at 60-m. Lab soil moisture content was
measured using the same soil cores used for bulk density. In total, 756 in-situ measures and 180
lab-measures of soil moisture content were taken (Appendix 8). Percent soil moisture content
was then calculated on a gravimetric, wet-weight basis using the following equation:
𝑊𝑚 =𝑊𝑤−𝑊𝑑
𝑊𝑤 ,
where 𝑊𝑚 = percent water mass, 𝑊𝑤 = wet weight of soil, and 𝑊𝑑 = dry weight of soil.
Soil penetration depth
Soil penetration depth describes soil strength as it relates to the shear strength and resistance of a
soil which itself is related to soil bulk density and moisture content (Hermanz et al. 2000; Vaz &
Hopmans 2001). Soil penetration is also often used as an index for soil compaction. Soils with

15
low strength have lower bulk density, higher moisture content, less compaction, and therefore
have higher penetration depths (Hermanz et al. 2000; Vaz & Hopmans 2001).
I designed a custom soil penetration device constructed of steel with the body of the
penetrometer being 2 m in length and composed of 1.5” schedule 40 steel pipe (Appendix 9). A 1
m length penetration pin made from solid 1” round steel was then welded to the collar of the
bottom of the body. A sliding weight around the penetrometer body of 7 kg was dropped from a
height of 1.5 m onto the collar of the penetration pin. The penetration device was tested prior to
field use on compacted and non-compacted soils of similar types, and modeled in relation to soil
bulk density. Overall, there was a strong positive relationship between soil penetration depth and
soil bulk density (R2 = 0.96, SE = 0.12, p < 0.001). For each field site, 21 penetration measures
were taken at 7 locations equally spaced along the main 60 m transect with 3 measurements per
location. Penetration depth was recorded in cm. In total, 756 soil penetration measurements were
taken (Appendix 8).
2.4 Analysis of the effects of land-cover type on bison summer and winter activity, footing, biting
fly abundance, and forage biomass
All data were assessed for assumptions of parametric tests using Shapiro-Wilk’s test of
normality, Bartlett’s test of variance, fitted residuals, and normal q-q plots. Data which violated
assumptions for parametric tests were log10 transformed after adding a constant of 1 and then
standardized. All analyses were performed in Stata version 15 (Stata. IC 2017), while all
graphics were created in ggplot2 (Wickham 2016).
A series of linear regression models were first fit to independently test the effects of land-cover
types on bison summer and winter activity, footing, biting fly abundance, and forage biomass.
Land-cover type “marsh” was withheld as the reference category in all models to test the relative
effects of other land-cover types to that of marsh. Adjusted R-squared was used to assess model
fit. Zero inflated negative binomial (ZINB) models for bison summer and winter activity (dung
counts) were fit, but were similar to those of linear regression and thus dropped.
16
2.5 Analysis of effects of footing, biting fly abundance, and forage biomass on summer and
winter bison activity
A series of candidate, univariate, linear regression models were fit to test the effects of footing,
biting fly abundance, and forage biomass on summer and winter bison activity (Appendix 11 &
12). Results from these analyses were used to guide the development of multivariate models of
summer and winter bison activity, including relationships between footing, biting fly, and forage
variables. Akaike’s information criterion (AIC; Akaike 1974) ranking was used to compare
support between a series of models that compared measures of biting flies and footing.
Multivariate, linear regression models could not be used to test these combined relationships
because of high collinearity among independent variables and in some cases multiple response
variables (Table 2.1). Instead, structural equation modeling (SEM) was used to fit a series of
multiple regressions that tested hypotheses of the direct, indirect, and total effects (direct +
indirect) of footing, biting fly abundance, and forage biomass on summer and winter bison
activity. Structural equation models are applicable for fitting multivariate, global (multi-faceted),
regression models and data that are highly correlated (Bagozzi 1989), and were a suitable
modeling approach for this study.
A series of global SEM models were then fit to test different measures of footing (soil bulk
density, moisture content, and penetration depth) and biting fly abundance (sweep net and
tabanid trap methods) on summer and winter bison activity. AIC was used to compare support
between a series of models that compared types of measures and number of variables (Appendix
13 & 14). Model strength was then assessed for the most supported AIC model using Pearson’s
R-square.

17
3.0 Results
3.1 Effects of land-cover type on summer and winter bison activity, footing, biting fly abundance,
and forage biomass
Here, I report the results of linear regressions that I used to test the effects of land-cover type on
summer and winter bison activity, footing, biting fly abundance, and forage biomass (Table 2.2).
Relative to marsh, summer dung counts of bison did not differ significantly for deciduous forests
(β = 0.36, S.E. = 0.34, p = 0.291), but were greater in pine forests (β = 1.48, S.E. = 0.34, p <
0.001), and the esker (β = 1.71, S.E. = 0.34, p < 0.001) (Fig. 2.2). Relative to marsh, winter dung
counts of bison did not significantly differ from that of deciduous forests (β = -0.39, S.E. = 0.46,
p = 0.402), pine forests (β = -0.77, S.E. = 0.46, p = 0.105), and the esker (β = 0.13, S.E. = 0.46, p
= 0.778) (Fig. 2.2).
Marsh had softer footing relative to all land-cover types with greater soil moisture and
penetration depth, and lower bulk density. Soil moisture content was significantly lower in
deciduous forest (β = -2.02, S.E. = 0.16, p < 0.001), pine forest (β = -2.16, S.E. = 0.16, p <
0.001), and the esker (β = -2.24, S.E. = 0.16, p < 0.001) (Fig. 2.3), while marsh had greater
abundance of biting flies, including horse flies, mosquitos, and midges with fewer biting flies in
deciduous forest (β = -1.29, S.E. = 0.27, p < 0.001), pine forest (β = -1.25, S.E. = 0.27, p <
0.001), and the esker (β = -2.33, S.E. = 0.27, p < 0.001) (Fig. 2.4). And finally, there was less
graminoid biomass in deciduous forest (β = -2.18, S.E. = 0.15, p < 0.001), pine forest (β = -2.24,
S.E. = 0.15, p < 0.001), and the esker (β = -2.05, S.E. = 0.15, p < 0.001) than in marshes (Fig
2.5). Bison therefore use marshes less than deciduous and pine forests and the esker in summer,
with winter use of land-cover types being more ubiquitous, but generally with greater use of
marshes and esker, although not significantly different. These data also demonstrate that marshes
have greater overall forage biomass primarily composed of preferred sedges, but also having
softer soils and greater biting fly abundance than in nearby deciduous and pine forests and the
esker sites. During summer months, it is apparent that bison used the esker more than marshes
and deciduous and pine forests (Fig. 2.2). Overall, the esker had relatively firmer soils (Fig. 2.3),

18
low abundance of biting flies (Fig. 2.4), and relatively greater graminoid biomass than deciduous
and pine forests (Fig. 2.5).
3.2 Structural equation model of soil wetness, biting fly abundance, and forage biomass on
summer and winter bison activity
Summer and winter structural equation models (Table 2.2 & 2.3) tested seasonal effects of
measured covariates on bison activity (dung counts). The most supported summer model
included covariates for soil moisture content from soil cores, biting fly abundance from sweep
netting, and graminoid biomass (AIC = 340). When examining the total effects of summer bison
activity, soil moisture (β = -0.58, S.E. = 0.14, p < 0.001) and biting flies (β = -0.38, S.E. = 0.19,
p = 0.046) were negatively related to bison activity, while graminoid biomass (also, forbs and
shrubs) had no overall effect (β = 0.01, S.E. 0.25, p = 0.979). The most supported winter model
included only the covariate of graminoid biomass (AIC = 205) which was positively related to
bison activity (β = 0.28, S.E. 0.15, p = 0.062).
4.0 Discussion
4.1 Trade-offs in summer bison habitat use
From my analysis, I find that bison habitat use in summer is not related to forage availability
(quantity), however, is negatively related to 1) large abundances of biting flies which can
negatively affect net energy budgets and health, and 2) soft soils that can hinder movement,
increase energy expenditure, and increase vulnerability to large predators. During winter months
when biting when fly abundance is low to nil, and ground conditions are frozen, I find that
graminoid biomass has a strong positive effect on bison use of land-cover types. This analysis
supports my hypotheses that bison habitat use, and summer distribution are affected by
mechanisms other than forage, including biting flies and footing. In this section I will discuss the
effects of forage, biting flies, and footing in the context of bison habitat use.

19
Energy maximizing principles state that bison should show high selection for areas composed of
copious and nutritious food resources, such as marshes (Brown et al. 1999; Bergman et al. 2001;
Fortin et al. 2003: Merkel et al. 2015). During summer months, however, bison show lower
selection for marshes (Tan et al. 2015; DeMars et al. 2016), and do not follow energy
maximizing principles but time minimizing principles, where bison spend shorter than expected
bouts of time in marshes (Fortin et al. 2003; Merkel et al. 2015). During summer months bison
use of marshes closely follow time minimizing principles potentially due to alternative,
nutritious foraging opportunities in other land-cover types such as shrubs in forested areas
(Larter & Gates 1991; Strong & Gates 2009; Bergmann et al. 2015; Leonard 2017). From my
results, I find that during summer months bison in the Ronald Lake area may be sourcing
alternative forage opportunities in deciduous and pine forests due to increased availability of
forbs and shrubs, and more widely distributed graminoids in land-cover types other than
marshes. While forbs and shrubs may comprise a small proportion of bison summer diets (Larter
& Gates 1991; Leonard et al. 2017), shrubs are found to be more nutritious (Larter and Gates
1991), with higher crude protein levels, thus may supplement as an alternative forage resource.
My findings of forage biomass as a factor that does not affect bison habitat use is consistent with
studies that show seasonal shifts in bison summer diet and use of land-cover types (Larter &
Gates 1991; Bergmann et al. 2015; Leonard et al. 2017). While my estimation of bison forage in
focal land-cover types is consistent with other studies, I suggest there is merit in further
investigation to quantify Ronald Lake bison use of forage types, and diet diversity and
composition to further our understanding of bison seasonal shifts in dietary preferences, and use
of land-cover types.
The effect of biting flies on bison behaviour and habitat use has rarely been quantified. I use
three methods to capture biting flies, each method differing in effectiveness. Sweep netting and
Malaise traps are effective for capturing varieties of flying insects (Schreck et al. 1993; Rolf &
Reimers 2002; Krecmar 2005; Bawm et al. 2015; Tunnakundacha et al. 2017), and tabanid traps
are effective for capturing biting flies from the family Tabanidae (Thorsteinson et al. 1965;
Duncan & Cowtan 1980; Hughes et al. 1981). Though I cannot speak on the effectiveness of
Malaise traps in my study due to low sample size, the Malaise trap data (Appendix 1.1) reflects

20
similar trends compared to the sweep net data (Fig. 2.4). In contrast to Malaise traps and sweep
netting, the tabanid trap method likely introduced a bias towards attracting tabanids from
surrounding land-cover types, and may be non-representative of tabanid, or insect, abundance
within a land-cover type. Tabanids are known to travel up to 2.4 km (Thronhhill & Hays 1972;
Cooksey & Wright 1987; Foil et al 1991), thus tabanid traps likely bias abundance estimates
within a land-cover type. I tested the effects of bison habitat use between all methods and found
the sweep net data to better fit the models. I am confident that my data are representative of
insect loads within land-cover types; however, are indirect measures of the influence of flies on
bison. I suggest that direct observations throughout the summer period and in various land-cover
types are needed to better assess the effects of biting flies on bison habitat use.
Snow depth is an important factor that influences ungulate distributions, predation risk and
energetic costs associate with locomotion (Mysterud et al. 1997; Pool & Mowat 2005; Pepin et
al. 2009; Robinson & Merrill 2012; Courbin et al. 2017). Deeper snow conditions increase
ungulate vulnerability to predators, (Fancy & White 1986; Carbyn et al. 1988; Carbyn et al.
1993), and can increase locomotive, energetic costs up by 7 times that of snow-free conditions
(Stardom 1977; Parker et al. 1984; Schaefer & Messier 1995; Mysterud et al. 1997; Robinson &
Merrill 2012). Like quantitative studies of snow depth in relation to ungulate habitat use, I tested
the effects of summer soil conditions on bison habitat use. During summer months, bison can
better escape predation when on firm ground (Carbyn & Forttier 1988) and thus avoid soft
terrain that can limit movement and increase vulnerability to wolves. In addition to predation
risk, energy expenditure in soft terrain is higher than that of more firm ground (Shepard et al.
2013). My methods of quantifying soil conditions in the context of animal footing, predation
risk, locomotion, and habitat use are novel and a step towards examining soil conditions as a
mechanism affecting habitat use and distributions. More work is needed to address the influence
of soil conditions in relation to predation risk and locomotive, energetic costs.
Like habitat use models that incorporate direct measurements of animal movements with the use
of GPS radio telemetry, or aerial observations, here, I use indices of bison habitat use by using
dung counts to quantify seasonal bison habitat use in three land-cover types and one landform
21
feature. Using animal dung counts to measure relative use of different land-cover types is an
effective method (Brodie 2006; Theurerkauf & Rouys 2008), but still has limitations. Dung
counts are time consuming to establish, especially if year to year measurements are important.
Measurement errors from dung surveys are affected by sample sizes, observer bias, and decay
rates (Rodriguez et al. 1998; Brodie 2006; Alves et al. 2013). However, unlike radio telemetry or
aerial surveys, where financial cost and logistics of collaring individuals and surveys can limit
sampling effectiveness and success, dung surveys can be conducted at relatively low cost to
budget and time, and account for population-level measures of habitat use. My use of dung
counts to measure summer and winter bison use of land-cover types is consistent with other
studies of bison diet (Larter & Gates 1991; Fortin et al. 2009; Jung 2015; Leonard et al. 2017),
observations of bison (Carbyn & Trottier 1987; Carbyn et al. 1993), and telemetry-based habitat
selection of the Ronald Lake bison herd (Tan et al. 2015; DeMars et al. 2016).
The objective of this study was to investigate mechanisms, including forage, that effect ungulate
habitat use. The results of my study are consistent with studies of the effects of forage (Larter &
Gates 1991; Leonard et al. 2017), biting flies (Walsh et al. 1992; Witter et al. 2014), and
locomotion (Robinson & Merrill 2012; Shepard et al. 2013) on ungulate habitat use. I find that
the effect of forage biomass on bison habitat use is less important during summer months than in
winter months. This is because forage is more widely available across habitat types during
summer months than winter months, thus bison are not constrained to habitats, such as marshes,
where forage (graminoids) persist year-round. I find that biting flies and footing negatively affect
summer habitat use, where bison reduce use of areas with greater biting fly abundances and
softer footing. This is because biting flies can negatively affect health, survival, and energy
budgets, and soft ground can reduce movement, and increase predation risk and locomotion
costs. I find support for my hypotheses that bison habitat use is affected by mechanisms other
than forage, and that bison observe trade-offs between forage, biting flies, and footing. The
combination of forage, biting flies, and footing, influence a hierarchical behavioural construct
between these factors, and bison balance energy demands and predation risk by using various
habitat types.

22
Understanding the complex ecology and relationships between animals and their environment is
challenging and often onerous, but necessary for filling knowledge gaps related to animal
behaviour, and the biological and environmental factors limiting individuals and populations. A
comprehensive investigation of the processes contributing to the dynamic nature of animal
habitat use will shed light on the factors and mechanisms that significantly affect animal
temporal and spatial distributions, behaviour, and fitness-related costs and benefits. This includes
not only proximate, descriptive explanations of habitat use, as they relate to attributes such as
land-cover types and how these effect animal distributions, but also casual links of small and
large-scale processes associated with those attributes and distributions. These observations are
fundamental to our ability in the successful management of populations of animals, and are
essential for the conservation of rare and endangered species.
4.2 Management implications
Bison once numbered in the tens of millions until the turn of the 20th century when they were
nearly extirpated from North America. The establishment and recovery of bison populations to
this point marks a major achievement for the conservation of this species. However, as land use
expands further into pristine, natural environments, such as those surrounding Fort McMurray,
habitat for threatened and endangered species will be more limited (SARA 2017).
Wood bison are now a threatened species in Canada with an estimated population of
approximately 10,000 individuals across 12 wild subpopulations. In Alberta, free-roaming wood
bison are primarily found in 2 subpopulations located in the Hay-Zama and Wood Buffalo
National Park areas (SARA 2017). Current forestry, bitumen exploration, and proposed bitumen
mining operations in the Ronald Lake area pose as potential impacts and direct loss of habitat to
the Ronald Lake bison herd. This examination of the mechanisms that influence wood bison
habitat use garners comprehensive knowledge of the factors affecting wood bison health and
survival, and can provide guidance to better manage, conserve, and reclaim habitats and features
important to the sustainability of the Ronald Lake bison herd and bison populations in free-
ranging and managed herds.

23
Table 2.1: Pearson’s correlation matrix of the most supported variables used in structural
equation models of summer bison activity. Dung, soil moisture content, biting fly abundance,
and graminoid biomass were measured in 4 land-cover types near Ronald Lake, Alberta between
June and August 2016 (n = 36).
Dung
summer
Soil
moisture
Biting flies
(Sweep net)
Graminoid
biomass
Dung summer 1
Soil moisture -0.576 1
Biting flies (Sweep net) -0.573 0.692 1
Graminoid biomass -0.477 0.831 0.706 1

24
Table 2.2: Univariate, linear regression models relating land-cover type on measured variables of
summer bison activity (n = 108), winter bison activity (n = 108), soil moisture content (lab
measured; n = 180), biting fly abundance (sweep net method; n = 2837), and graminoid biomass
(n = 324). Land-cover type ‘marsh’ was withheld as the reference category in all models and thus
significance based on their comparison (difference). Dung, soil moisture content, biting fly
abundance, and graminoid biomass were measured in 4 land-cover types near Ronald Lake,
Alberta between June and August 2016.
Model # Dependent Independent β S.E. C.I. p
Bison summer Deciduous 0.36 0.34 -0.32 1.04 0.291
1 activity Pine 1.48 0.34 0.80 2.17 < 0.001
R2 = 0.49 Esker 1.71 0.34 1.02 2.39 < 0.001
Bison winter Deciduous -0.39 0.46 -1.33 0.55 0.402
2 activity Pine -0.77 0.46 -1.71 0.17 0.105
R2 = 0.05 Esker 0.13 0.46 -0.81 1.07 0.778
Soil moisture Deciduous -2.02 0.16 -2.35 -1.69 < 0.001
3 content Pine -2.16 0.16 -2.49 -1.83 < 0.001
R2 = 0.88 Esker -2.24 0.16 -2.57 -1.91 < 0.001
Biting fly Deciduous -1.29 0.27 -1.84 -0.75 < 0.001
4 abundance Pine -1.25 0.27 -1.80 -0.70 < 0.001
R2 = 0.68 Esker -2.33 0.27 -2.88 -1.78 < 0.001
Graminoid Deciduous -2.18 0.15 -2.50 -1.87 < 0.001
5 Biomass Pine -2.24 0.15 -2.55 -1.93 < 0.001
R2 = 0.90 Esker -2.05 0.15 -2.36 -1.74 < 0.001

25
Table 2.3: Best fit structural equation model of direct, indirect, and total effects of soil moisture
content, biting fly abundance (sweep net method), and graminoid biomass on summer bison
activity. Soil moisture content, biting fly abundance, and graminoid biomass were measured in 4
land-cover types (n = 36) near Ronald Lake, Alberta between June and August 2016. Pearson’s
R-squared = 0.56
Dependent Independent β S.E. C.I. p
Direct effects
Summer bison
activity
Soil Moisture -0.45 0.24 -0.93 0.02 0.061
Biting fly abundance -0.38 0.19 -0.75 -0.01 0.046
Graminoid biomass 0.17 0.25 -0.32 0.65 0.498
Biting fly abundance Soil Moisture 0.34 0.20 -0.06 0.74 0.098
Graminoid biomass 0.42 0.20 0.02 0.83 0.038
Graminoid biomass Soil Moisture 0.83 0.09 0.65 1.01 < 0.001
Indirect effects
Summer bison activity Soil Moisture -0.12 0.21 -0.53 0.29 0.557
Graminoid biomass -0.16 0.11 -0.38 0.06 0.151
Biting fly abundance Soil Moisture 0.35 0.17 0.01 0.70 0.043
Total effects
Summer bison activity
Soil moisture -0.58 0.14 -0.84 -0.31 < 0.001
Biting fly abundance -0.38 0.19 -0.75 -0.01 0.046
Graminoid biomass 0.01 0.25 -0.47 0.49 0.979
Biting fly abundance Soil moisture 0.69 0.12 0.46 0.93 < 0.001
Graminoid biomass 0.42 0.20 0.02 0.83 0.038
Graminoid biomass Soil moisture 0.83 0.09 0.65 1.01 < 0.001

26
Table 2.4: Best fit structural equation model of direct total effects of graminoid biomass on
winter bison activity (dung). Graminoid biomass was measured in 4 land-cover types (n = 36)
near Ronald Lake, Alberta in August 2016. Pearson’s R-squared = 0.16
Dependent Independent β S.E. C.I. p
Direct and total effects
Bison winter activity Graminoid biomass 0.28 0.15 -0.01 0.58 0.062

27
Table 2.5: Structural equation models testing the effects soil parameters (footing), biting fly
abundance, and forage biomass on summer bison activity (dung). Candidate, multivariate models
were used for selection of best fit structural equation model. Bison dung counts, soil parameters
(soil moisture, bulk density, and penetration depth), biting fly abundance (using two methods:
sweep net and tabanid traps), and forage biomass (divided into three groups: graminoids, forbs,
and shrubs) were measured in 4 land-cover types near Ronald Lake, Alberta between June and
August 2016.
Model I.D. Model form df AIC ∆ AIC
3 Dung ~ Soil Moisture (Lab) + Sweep Net +
Graminoid Biomass 12 340.5 -
5 Dung ~ Soil Moisture (Lab) + Sweep Net +
(Graminoid + Shrub Biomass) 12 344.9 4.3
4 Dung ~ Soil Moisture (Lab) + Sweep Net +
(Graminoid + Forb Biomass) 12 347.3 6.7
1 Dung ~ Soil Moisture (Lab) + Sweep Net +
Plant Biomass (Total) 12 351.0 10.5
2 Dung ~ Soil Moisture (Lab) + Tabanid Trap +
Plant Biomass (total) 12 370.7 30.1

28
Table 2.6: Structural equation model testing the effects soil parameters (indirect effect) and
forage biomass (direct effect) on winter bison activity (dung). Candidate, multivariate models
were used for selection of best fit structural equation model. Bison dung counts, soil parameters
(soil moisture, bulk density, and penetration depth), and forage biomass (divided into three
groups: graminoids, forbs, and shrubs) were measured in 4 land-cover types near Ronald Lake,
Alberta between June and August 2016.
Model I.D. Model name df AIC ∆ AIC
5 Dung ~ Graminoid Biomass 3 205 -
1 Dung ~ Soil Moisture (Lab) +
Graminoid Biomass 6 270.2 65.2
2 Dung ~ Soil Moisture (Lab) +
(Graminoid + Forb Biomass) 6 281.6 76.6
3 Dung ~ Soil Moisture (Lab) +
(Graminoid + Shrub Biomass) 6 282.3 77.3
4 Dung ~ Soil Moisture (Lab) +
Plant Biomass (Total) 6 288.1 83.1

29
Figure 2.1: Map of study area and study sites in north-eastern Alberta near Ronald Lake, Alberta,
~ 150 km north of Fort McMurray and ~15 km south of Wood Buffalo National Park. Study sites
were located adjacent to an ~18 km trapper’s trail that starts at the Athabasca River and ends at
Ronald Lake.
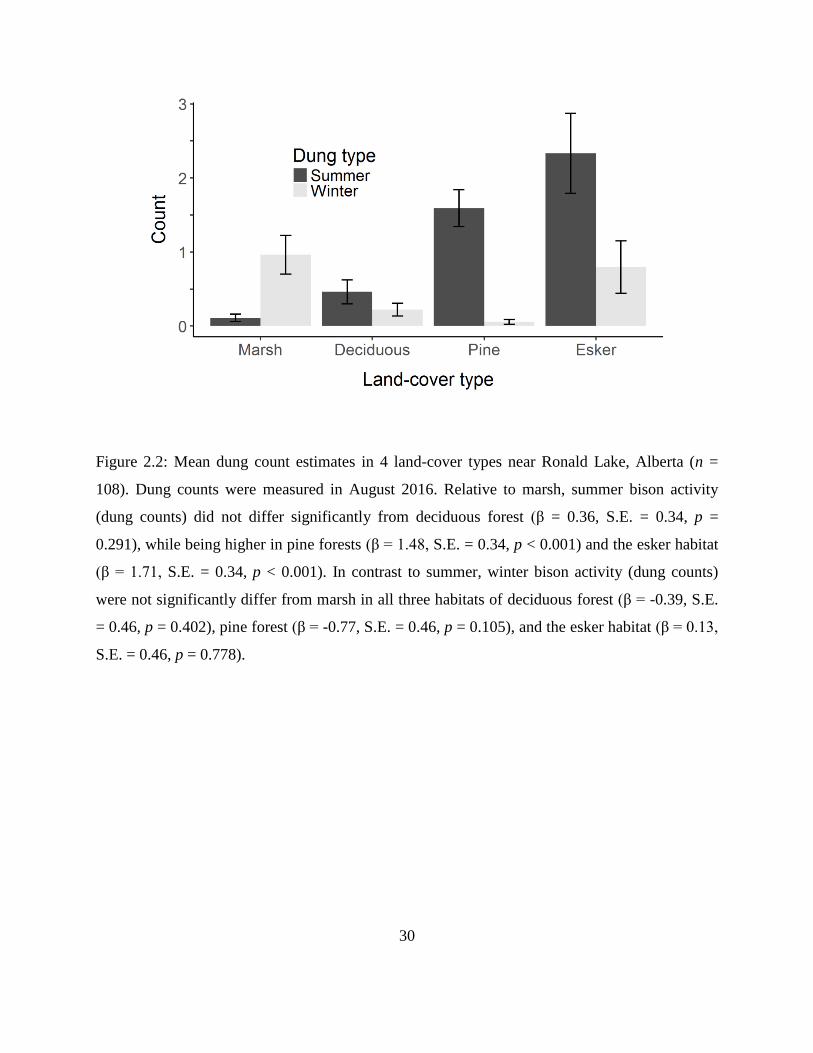
30
Figure 2.2: Mean dung count estimates in 4 land-cover types near Ronald Lake, Alberta (n =
108). Dung counts were measured in August 2016. Relative to marsh, summer bison activity
(dung counts) did not differ significantly from deciduous forest (β = 0.36, S.E. = 0.34, p =
0.291), while being higher in pine forests (β = 1.48, S.E. = 0.34, p < 0.001) and the esker habitat
(β = 1.71, S.E. = 0.34, p < 0.001). In contrast to summer, winter bison activity (dung counts)
were not significantly differ from marsh in all three habitats of deciduous forest (β = -0.39, S.E.
= 0.46, p = 0.402), pine forest (β = -0.77, S.E. = 0.46, p = 0.105), and the esker habitat (β = 0.13,
S.E. = 0.46, p = 0.778).
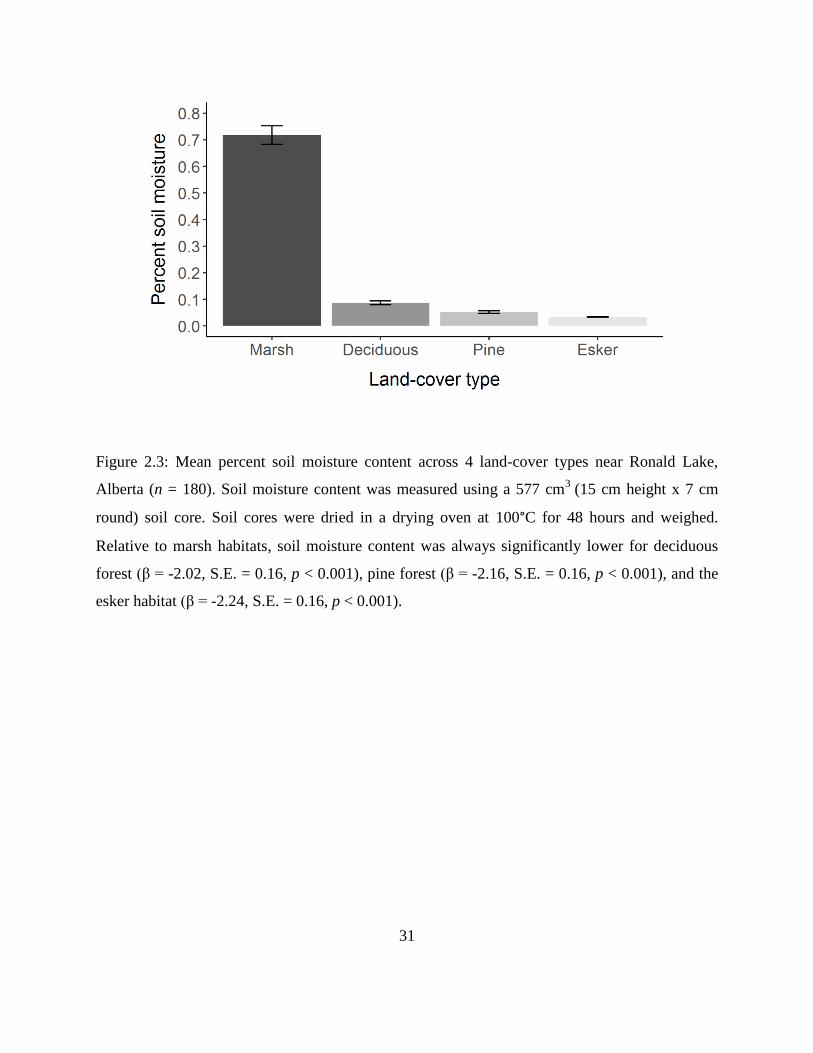
31
Figure 2.3: Mean percent soil moisture content across 4 land-cover types near Ronald Lake,
Alberta (n = 180). Soil moisture content was measured using a 577 cm3
(15 cm height x 7 cm
round) soil core. Soil cores were dried in a drying oven at 100°C for 48 hours and weighed.
Relative to marsh habitats, soil moisture content was always significantly lower for deciduous
forest (β = -2.02, S.E. = 0.16, p < 0.001), pine forest (β = -2.16, S.E. = 0.16, p < 0.001), and the
esker habitat (β = -2.24, S.E. = 0.16, p < 0.001).

32
Figure 2.4: Mean biting fly abundance estimates from sweep nets for tabanids, mosquitos, and
midges across 4 different land-cover types near Ronald Lake, Alberta. Graph is of mean number
of flies caught during a single sweep net event which consisted of 30 sweeps while walking a 50
m transect (n = 2837). Flies were caught between June and August of 2016. See appendices 21,
22 and 23 for individual abundances of tabanids, mosquitoes, and midges. Relative to marshes,
there were significantly fewer biting flies in deciduous forest (β = -1.29, S.E. = 0.27, p < 0.001),
pine forest (β = -1.25, S.E. = 0.27, p < 0.001), and the esker habitat (β = -2.33, S.E. = 0.27, p <
0.001).

33
Figure 2.5: Mean forage biomass for 4 growth forms in 4 land-cover types near Ronald Lake,
Alberta. Forage was estimated at the end of the growing season (August 2016) in multiple 0.5 m2
circular quadrats per site (n = 324). Relative to marshes, graminoid biomass was lower in
deciduous forests (β = -2.18, S.E. = 0.15, p < 0.001), pine forests (β = -2.24, S.E. = 0.15, p <
0.001), and the esker habitat (β = -2.05, S.E. = 0.15, p < 0.001).

34
Chapter 3: General conclusions
Realization of forage resources as a principle component of habitat use is integral for
understanding prerequisites of ungulate fitness-related traits, behaviour, and distributions
(Hanley 1982; Bergman et al. 2001; Fortin et al. 2003; Pool & Mowat 2005; Long et al. 2014;
Long et al. 2016). Forage, however, is one of several factors that affect health and survival.
Ungulates observe a diverse set of challenges that differ among seasons with trade-offs affecting
behaviour, health, and survival being common (Brown et al. 1999; Dussault et al. 2005; Witter et
al. 2012; Yan et al. 2016). Land-cover types that supply abundant forage are critical to supplying
basic and essential needs for maintenance of large grazing ruminants (Larter & Gates 1991;
Carbyn et al. 1993; Fortin et al. 2002), but they may also be areas where predation risk and
energetic costs are high (Brown et al. 1999; Hebblewhite & Merrill 2009; Zweifel-Schielly et al.
2009; Courbin et al. 2017). A heterogenous landscape provides animals with a variety of forage
opportunities, as well as attributes that reduce predation risk and energetic costs (Dussault et al.
2004; Pepin et al. 2009; Robinson & Merrill 2012; Shepard et al. 2013).
By focusing on the mechanisms that are important to the fitness and subsequently the distribution
of individuals and populations, a better understanding of the factors and trade-offs influencing
and limiting habitat use can be made. This understanding is fundamental to the successful
management of animal populations, and in particular the conservation of rare and endangered
species.
Wood bison are endemic to northern regions of the provinces and territories of Canada and the
state of Alaska, and are extant in a small fraction of their native habitat. My findings contribute
towards a better understanding of wood bison behaviour, habitat use, and fitness-related costs
and benefits associated with forage, insect harassment, and footing. This information can be used
to guide the maintenance, (re)introduction, and conservation of this IUCN Red Listed species
within extant, historic, and novel wild and managed areas. In particular, this herd overlaps with
possible future oil sands developments that require information on the habitat types important to
the Ronald Lake wood bison herd. Little knowledge exists regarding habitat supply (forage) for
land-cover types in the Ronald Lake area. This study helps to quantify forage resource

35
abundance within bison home ranges and identifies land-cover types important for supplying
forage resources. This study can also contribute to a more comprehensive knowledge of the
biological and environmental factors that affect bison health and survival, and provide rational
for the conservation and reclamation of land-cover types and features within and surrounding
Ronald Lake bison home ranges.
Marshes in the Ronald Lake area are dominated by graminoids, especially sedges (Carex spp.),
that comprise a large portion of a wood bison’s diet (Larter & Gates 1991; Steenweg 2016). In
this study I found that marshes supply ~100-fold more graminoid forage than deciduous and pine
forests, and esker. Unlike other habitats used by Ronald Lake bison, I found soil in marshes are
~10-fold softer, and have ~13-fold greater abundance of biting flies than deciduous and pine
forests, and esker. In this study, I observed low bison activity in marshes during summer
months, but high activity during winter months. During summer months, marshes are important
regarding habitat supply for bison, but a diversity of habitat types is important for suppling
alternate foraging opportunities, escapement of harassment by biting flies, and reduction of
predation risk and energetic costs. During winter months, marshes are a critically important for
providing forage resource for bison.
Direct loss of habitat is a consequence of potential bitumen mining in the Ronald Lake area. This
study provides understanding of the mechanisms of habitat use and provides rational for the
conservation and reclamation of habitat types within Ronald Lake bison home ranges. Marshes
comprise ~1 percent of the study are with deciduous and pine forest, and esker comprising ~35,
~13, and < 1 percent, respectively. The conservation and reclamation of marshes that supply
critically important winter forage, the esker that provides bison relief from biting flies, and
forests that supply alternate forage and frim footing are important for the maintenance and
conservation of wood bison in this area.
This study builds on pre-existing knowledge of the effects of forage on bison seasonal habitat
use and is the first comprehensive, quantitative examination of the effects of biting flies and
footing on bison habitat use, and trade-offs associated with foraging. This improves our
understanding of bison ecology and can direct attention towards mechanisms that affect the

36
health and survival of other large ungulates. Examining the causal factors that affect bison use of
land-cover types can help identify areas important to bison, and can assist with management
decisions for among other things the 1) prioritization and protection and conservation of habitat
for threatened and endangered species; 2) reclamation of habitat from land-use activities; and 3)
identification of habitat suitability for the (re)-introduction of species to native or novel
environments

37
Literature cited
Acebes, P., Malo, J.E., Traba, J. 2013. Trade-offs between food availability and predation risk in
desert environments: the case of polygynous monomorphic guanaco (Lama guanicoe).
Journal of Arid Environments 97:136-142.
Ahmad, R., Mishra, C., Singh, N.J., Kaul, R., Bhatnagar, Y.V. 2016. Forage and security trade-
offs by markhor Capra falconeri mothers. Current Science 110:1559-1564.
Akaike, H. 1974. A new look at the statistical model identification. IEEE Transactions on
Automatic Control 19:716-723.
Alves, J., Alves de Silva, A., Soares, A.M.V.M., Fonseca, C. 2013. Pellet group count methods
to estimate red deer densities: Precision, potential accuracy and efficiency.
Mammalian Biology 78:134-141.
Anderson, T.M., Hopcraft, G.C., Eby, S., Ritchie, M., Grace, J.B., Olff, H. 2010. Landscape-
scale analyses suggest both nutrient and antipredator advantages to Serengeti
herbivore hotspots. Ecology 91:1519-1529.
Aublet, J.F., Festa-Bianchet, M. 2009. Temperature constraints on foraging behaviour of male
Alpine ibex (Capra ibex) in summer. Oecologia 159:237-247.
Bagozzi, R. P., Youjae, Y. 1989. On the use of structural equation models in experimental
designs. Journal of Marketing Research 26:271-284.
Bali, A., Alexeev, V.A., White, R.G., Russell, D.E., McGuire, A.D., Kofinas, G.P. 2013. Long-
term patterns of abiotic drivers of mosquito activity within summer ranges of Northern
Alaska caribou herds (1979-2009). Rangifer 33:173-176.
Baruzzi, C., Lovari, S., Fattorini, N. 2017. Catch me if you can: antipredatory behaviour of
chamois to the wolf. Ethology Ecology and Evolution 29:589-598.
Bawm, S., Soe, T.T., Htun, L.L. 2015. Seasonal abundance of horse flies (Diptera: Tabanidae)
and stable fly (Diptera: Muscidae) collected by Nzi trap within Taw Area, Myanmar.
Journal of Environmental and Applied Research 3:1-6.
Benson, J.F. 2012. Improving rigour and efficiency of use-availability habitat selection analyses
with systematic estimation of availability. Methods in Ecology and Evolution 4:244-
251.
Bergman, C.M., Fryxell, J.M., Gates, C.C., Fortin, D. 2001. Ungulate foraging strategies: energy
maximizing or time minimizing? Journal of Animal Ecology 70:289-300.

38
Bergmann, G.T., Craine, J.M., Robeson II, M.S., Fierer, N. 2015. Seasonal shifts in diet and gut
microbiota of the American bison (Bison bison). PLoS ONE 10:1-14.
Berezanski, D.J. 1986. Summer feeding and resting behavior of wood bison and the effects of
fire on fen vegetation near Waterhen, Manitoba. Univeristy of Manitoba, Winnipeg.
M.Sc. Thesis.
Beyar, H.L., Haydon, D.T., Morales, J.M., Frair, J.L., Hebblewhite, M., Micthell, M.,
Matthiopoulous, J. 2010. The interpretation of habitat preference metrics under use-
availability designs. Philosophical Transactions 365:2245-2254.
Blume, R., Matter, J., Pickens, M., Miller, J., Eschle, J. 1972. Trapping tabanids with modified
Malaise traps baited with CO2. Mosquito News 1:90-95.
Bobek, B., Merta, D., Furtek, J. 2016. Winter food and cover refuges of large ungulates in
lowland forests of south-western Poland. Forest Ecology and Management 359:247-
255.
Boyce, M.S. 2006. Scale for resource selection functions. Diversity and Distributions 12:269-
276.
Boyce, M.S., Turner., M.G., Fryxell, J., Turchin, P. 2003. Scale and heterogeneity in habitat
selection by elk in Yellowstone National Park. Ecoscience 10: 421-431.
Bradley, M., Wilmshurst, J. 2005. The fall and rise of bison populations in Wood Buffalo
National Park: 1971 to 2003. Canadian Journal of Zoology 83:1195-1205.
Briggs, J.M., Knapp, A.K. 1995. Interannual variability in primary production in tallgrass prairie:
climate, soil moisture, topographic position, and firs as determinants of aboveground
biomass. American Journal of Botany 82:1024-1030.
Brodie, F. J. 2006. An experimentally determined persistence-rate correction factor for scat-
based abundance indices. Wildlife Society Bulletin 34:1216-1219.
Brown, J.S. 1999. Vigilance, patch use and habitat selection: foraging under predation risk.
Evolutionary Ecology Research 1:49-71.
Brown, J.S., Laundre, J.W., Gurung, M. 1999. The ecology of fear: optimal foraging, game
theory, and trophic interactions. Journal of Mammalogy 80:385-399.
Campbell, B.H., Hinkes, M. 1983. Winter diets and habitat use of Alaska bison after wildfire.
Wildlife Society Bulletin 1:6-21.

39
Canon, S.K., Urness, P.J., DeByle, N.V. 1987. Habitat selection, foraging behaviour, and dietary
nutrition of elk in burned aspen forest. Journal of Range Management 40:433-438.
Carbyn, L.N., Oosenbrug, S., Anions, D.W. 1993. Wolves, bison and the dynamics related to the
Peace-Athabasca Delta in Canada's Wood Buffalo National Park. Canadian
Circumpolar Institute, Edmonton, Alberta.
Carbyn, L.N., Trottier, T. 1987. Responses of bison on their calving grounds to predation by
wolves in Wood Buffalo National Park. Canadian Journal of Zoology 65:2072-2078.
Chowns, T. 1987. Seasonal changes in distribution of wood bison in the Mackenzie Bison
Sanctuary. Yellowknife, N.W.T. Northwest Territories Renewable Resources 67:1-
26.
Cooksey, L.M., Wright, R.E. 1987. Flight range and dispersal activity of the host-seeking horse
fly, Tabanus abactor (Diptera: Tabanidae), in north central Oklahoma. Environmental
Entomology 16:211-217.
Coppedge, B.R., Shaw, J.H., 1997. Effects of horning and rubbing behavior by bison (Bison
bison) on woody vegetation in a tallgrass prairie landscape. The American Midland
Naturalist 138:189-196.
Collins, W.B., Urness, P.J. 1982. Mule deer and elk responses to horsefly attack. Northwest
Science 56:299-302
Courbin, N., Dussault, C., Veillette, A., Giroux, M.A., Cote, S.D. 2017. Coping with strong
variations in winter severity: plastic habitat selection of red deer at high density.
Behavioral Ecology 28:1037-1046.
Cristescu, B., Stenhouse, G.B., Symbaluk, M., Nielsen, S.E., Boyce, M.S. 2016. Wildlife habitat
selection on landscapes with industrial disturbance. Environmental Conservation
43:327-336.
Danks, H.V. 1981. Arctic arthropods: a review of systematics and ecology with particular
reference to the North American fauna. Entomological Society of Canada, Ottawa,
Ontario.
DeMars, C.A., Nielsen, S.E., Edwards, M.A. 2016. Range use, habitat selection, and the
influence of natural and human disturbance on wood bison (Bison bison athabascae)
in the Ronald Lake area of northeastern Alberta. Ronald Lake Bison Report 2:1-60.
Downes, C.M., Smith, S.M., Theberge, J.B., Dewar, H.J. 1985. Hilltop aggregation sites and
behavior of male Cephenemyia trompe (Diptera: Oestridae). The Canadian
Entomologist 117:321-326.

40
Downes, C.M., Theberge, J.B., Smith, S.M. 1986. The influence of insects on the distribution,
microhabitat choice, and behaviour of the Burwash caribou herd. Canadian Journal of
Zoology 64:622-629.
Ducks Unlimited Canada. 2016. Ronald Lake bison herd enhanced wetland classification user’s
guide. Ducks Unlimited Canada, Edmonton, Alberta. Prepared for: Government of
Alberta (Alberta Environment and Parks) 69 pp.
Duckworth, G.D., Altwegg, R., Guo, D. 2010. Soil moisture limits foraging: a possible
mechanism for the range dynamics of the hadeda ibis in southern Africa. Diversity and
Distributions 16:765-772.
Duncan, P., Cowtan P. 1980. An unusual choice of habitat helps Camargue horses to avoid
blood-sucking horse-flies. Biology of Behaviour 5:55-60.
Dupke, C., Bonenfant, C., Reineking, B., Hable, R., Zeppenfeld, T., Ewald, M., Heurich, M.
2017. Habitat selection by a large herbivore at multiple spatial and temporal scales is
primarily governed by food resources. Ecography 40:1014-1027.
Dussault, C., Ouellet, J., Courtois, R., Huot, J., Breton, L., Jolicoeur, H., Kelt, D. 2005. Linking
moose habitat selection to limiting factors. Ecography 28:619-828.
Dussault, C., Ouellet, J., Courtois, R., Huot, J., Breton, L., Larochelle, J. 2004. Behavioural
response of moose to thermal conditions in the boreal forest. Ecoscience 11:321-328.
ESRI. 2014. ArcGIS desktop: ArcMap version 10.2.1. Environment Systems Research Institute,
Redlands CA.
Fancy, S.G., White, R.G. 1986. Energy expenditures for locomotion by barren-ground caribou.
Canadian Journal of Zoology 65:122-128.
Flesch, A.D., Steidi, R.J. 2010. Importance of environmental and spatial gradients on patterns
and consequences of resource selection. Ecological Applications 21:1021-1039.
Foil, L.D., Leprince, D.J., Byford, R.L. 1991. Survival and dispersal of horse flies (Diptera:
Tabanidae) feeding on cattle sprayed with a sublethal dose of fenvalerate. Journal of
Medical Entomology 28:663-667.
Folstad, I., Nilssen, A.C., Halvorsen, O., Andersen, J. 1991. Parasite avoidance: the cause of
post-calving migrations in Rangifer? Canadian Journal of Zoology 69:2423-2429.

41
Fortin, D., Fortin, M., Beyer, H.L., Duchesne, T., Courant, S., Dancose, K. 2009. Group-size-
mediated habitat selection and group fusion-fission dynamics of bison under predation
risk. Ecology 90:2480-2490.
Fortin, D., Fryxell, J. M., O’Brodovich, L., Frandsen, D. 2003. Foraging ecology of bison at the
landscape and plant community levels: The applicability of energy maximization
principles. Oecologia 134:219-227.
Fortin, D., Fryxell, J.M., Pilote, R. 2002. The temporal scale of foraging decisions in bison.
Ecology 83:970-982.
Fortin, D., Beyer, H.L., Boyce, M.S., Smith, D.W., Duchesne, T., Mao, J.S. 2005. Wolves
influence elk movements: behavior shapes a trophic cascade in Yellowstone National
Park. Ecology 86:1320-1330.
Gebert, C., Verheyden-Tixier, H. 2001. Variations of diet composition of red deer (Cervus
elaphus L.) in Europe. Mammal Review 31:189-201.
Godvik, I.M.R., Loe, L.E., Vik, J.O., Veiberg, V., Langvain, R.., Mysterud, A. 2009. Temporal
scales, trade-offs, and functional response in red deer habitat selection. Ecology
90:699-710.
Gorham, E. 1974. The relationship between standing crop in sedge meadows and summer
temperature. Journal of Ecology 62:487-491.
Hagemoen, R.I.M., Reimers, E. 2002. Reindeer summer activity pattern in relation to weather
and insect harassment. Journal of Animal Ecology 71: 883-892.
Hamel, S., Cote, S.D. 2007. Habitat use patterns in relation to escape terrain: are alpine ungulate
females trading off better foraging sites for safety? Canadian Journal of Zoology
85:933-943.
Hanley, T.A. 1982. The nutritional basis for food selection by ungulates. Journal of Range
Management 35:146-151.
Harvey, T.L., Launchbaugh, J.L. 1982. Effect of horn flies on behavior of cattle. Journal of
economic entomology 75:25-27.
Hebblewhite, M., Merrill, E. 2009. Trade-offs between predation risk and forage differ between
migrant strategies in a migratory ungulate. Ecology 90:3445-3454.
Hebblewhite, M., Merrill, E., McDermid, G. 2008. A multi-scale test of the forage maturation
hypothesis in a partially migratory ungulate population. Ecological Monographs
78:141-166.

42
Helle, T., Aspi, J., Lempa, K., Taskinen, E. 1992. Strategies to avoid biting flies by reindeer:
field experiments with silhouette traps. Annales Zoologici Fennici 29:69-74.
Helle, T., Tarvainen, L. 1984. Effects of insect harassment on weight gain and survival in
reindeer calves. Rangifer 4:24-27.
Hernanz, J.L., Peixoto, H., Cerisola, C., Sanchez-Giron, V. 2000. An empirical model to predict
soil bulk density profiles in field conditions using penetration resistance, moisture
content and soil depth. Journal of Terramechanics 37:167-184.
Hollander, A.L., Wright, R.E. 1980. Impact of tabanids on cattle: blood meal size and preferred
feeding sites. Journal of Economic Entomology 73:431-433.
Horejsi, B.I. 1981. Behavioural response of barren ground caribou to a moving vehicle. Artic
34:180-185.
Hughes, R.D., Duncan, P., Dawson, J. 1981. Interactions between Camargue horses and
horseflies (Diptera: Tabanidae). Bulletin of Entomological Research 71:227-242.
Joly, K. 2008. Modeling influence of winter distribution of caribou in northwestern Alaska
through use of satellite telemetry. Rangifer 19:75-85.
Jung, T.S. 2015. Winter diets of reintroduced bison (Bison bison) in northwestern Canada.
Mammal Research 60:385-391.
Kamut, M., Jezierski, T. 2014. Ecological, behavioural and economic effects of insects on
grazing farm animals – a review. Animal Science Papers and Reports 32:107-119.
Knapp, A.K., Blair, J.M., Briggs, J.M., Collins, S.L., Hartnett, D.C., Johnson, L.C., Towne, E.G.
1999. The keystone role of bison in North American tallgrass prairie: bison increase
habitat heterogeneity and alter a broad array of plant, community, and ecosystem
processes. Bioscience 49:39-50.
Kowalczyk, R., Taberlet, P., Coissac, E., Valentini, A., Miquel, C., Kaminski, T., Wojcik, J.M.
2011. Influence of management practices on large herbivore diet – case of European
bison in Bialowieza Primeval forest (Poland). Forest Ecology and Management
261:821-828.
Kozlov, M.V., Brodskaya, N.K., Haarto, A., Kuusela, K., Schafer, M., Zverev, V. 2005.
Abundance and diversity of human-biting flies (Diptera: Ceratopogonidae, Culicidae,
Tabanidae, Simuliidae) around a nickel-copper smelter at Monchegorsk, northwestern
Russia. Journal of Vector Ecology 30:263-271.

43
Krcmar, S. 2005. Seasonal abundance of horse flies (Diptera: Tabanidae) from two locations in
eastern Croatia. Journal of Vector Ecology 30:316-321.
Krinsky, W.R. 1976. Animal disease agents transmitted by horse flies and deer flies (Diptera:
Tabanidae). Journal of Medical Entomology 13:225-275
Larter, N.C., Gates, C.C. 1991. Diet and habitat selection of wood bison in relation to seasonal-
changes in forage quantity and quality. Canadian Journal of Zoology 69:2677-2685.
Leblond, M., Dussault, C., Ouellet, J.P. 2010. What drives fine-scale movements of large
herbivores? A case study using moose. Ecography 33:1102-1112.
Leonard, J.L., Perkins, L.B., Lammers, D.J., Jenks, J.A. 2017. Are bison intermediate feeders?
Unveiling summer diet selection at the northern fringe of historical distribution.
Rangeland Ecology and Management 70:405-410.
Lewis, D. 1987. Biting flies (Diptera) of peatlands and marshes in Canada. The Memoirs of the
Entomological Society of Canada 119:133-140.
Loiser, C.L., Couturier, S., St-Laurent, M.H., Drapeau, P., Dussault, C., Rudolph, T., Brodeur,
V., Merkle, J.A., Fortin, D. 2015. Adjustments in habitat selection to changing
availability induce fitness costs for a threatened ungulate. Journal of Applied Ecology
52:496-504.
Long, R.A., Bowyer, R.T., Porter, W.P., Mathewson, P., Monteith, K.L., Findholt, S.L., Dick,
B.L., Kie, J.G. 2016. Linking habitat selection to fitness-related traits in herbivores:
the role of the energy landscape. Oecologia 181:709-720.
Long, R.A., Bowyer, R.T., Porter, W.P., Mathewson, P., Monteith, K.L., Kie, J.G. 2014.
Behavior and nutritional condition buffer a large-bodied endotherm against direct and
indirect effects of climate. Ecological Monographs 84:513-532.
McMillan, B., Cottam, M.R., Kaufman, D.W. 2000. Wallowing behaviour of American bison
(Bos bison) in tallgrass prairie: an examination of alternate explanations. The
American Midland Naturalist 144:159-167.
Melton, D.A., Larter, N.C., Gates, C.C., Virgl, J.A. 1989. The influence of rut and environmental
factors on the behaviour of wood bison. ACTA Theriologica 34:179-193.
Mendoza, M., Palmqvist, P. 2008. Hypsodonty in ungulates: an adaptation for grass consumption
or for foraging in open habitat? Journal of Zoology 274:134-142.
Merkle, J. A., Cherry, S. G., Fortin, D. 2015. Bison distribution under conflicting foraging
strategies: site fidelity vs. energy maximization. Ecology 96:1793-1801.

44
Morgan, S.B. 1987. The effects of Tabanidae (Diptera) on the behaviour of wood bison at
Waterhen, Manitoba. University of Manitoba, Winnipeg. M.Sc thesis.
Morschel, F.M. 1999. Use of climatic data to model the presence of oestrid flies in caribou herds.
Journal of Wildlife Management 63:588-593.
Morschel, F.M., Klein, D.R. 1997. Effects of weather and parasitic insects on behavior and group
dynamics of caribou of the Delta Herd, Alaska. Canadian Journal of Zoology
75:1659-1670.
Muller, A., Dahm, M., Bocher, P.K., Root-Bernstein, M., Svenning, J.C. 2017. Large herbivores
in novel ecosystems – habitat selection by red deer (Cervus elaphus) in a former
brown-coal mining area. Plos ONE 12:1-20.
Murray, M.G. 1991. Maximizing energy retention in grazing ruminants. Journal of Animal
Ecology 60:1029-1045.
Mysterud, A., Bjornsen, B.H., Ostbye, E. 1997. Effects of snow depth on food and habitat
selection by roe deer Caprolus capreouls along an altitudinal gradient in south-central
Norway. Wildlife Biology 3:27-33.
Mysterud, A., Ims, R.A. 1998. Functional responses in habitat use: availability influences
relative use in trade-off situations. Ecology 79:1435-1441.
Mysterud, A., Ostby, E. 1999. Cover as a habitat element for temperate ungulates: effects on
habitat selection and demography. Wildlife Society Bulletin 27:385-394.
Newmark, W.D., Rickart, E.A. 2012. High-use movement pathways and habitat selection by
ungulates. Mammalian Biology 77:293-298.
Nilssen, A.C., Haugerud, R.E. 1994. The timing and departure rate of larvae of the warble fly
Hypoderma (Oedemagena) tarandi (L.) and the nose bot fly Cepbenemyia trompe
(Modeer) (Diptera: Oestridae) from reindeer. Rangifer 14:113-122.
Nilsen, E.B., Pedersen, S., Linnell, J.D.C. 2008. Can minimum convex polygon home ranges be
used to draw biologically meaningful conclusions? Ecological Research 23:635-639.
Okarma, H., Jedrzejewska, B., Jedrzejewski, W., Krasinski, Z.A., Milkowski, L. 1995. The roles
of predation, snow cover, acorn crop, and man-related factors on ungulate mortality in
Bialowieza Primeval Forest, Poland. Acta Theriologica 40:197-217.

45
Owen-Smith, N., Goodall, V.2014. Coping with savanna seasonality: comparative daily activity
patterns of African ungulates as revealed by GPS telemetry. Journal of Zoology
293:181-191.
Owen-Smith, N., Fryxell, J.M., Merrill, E.H. 2010. Foraging theory upscaled: the behavioural
ecology of herbivore movement. Philosophical Transactions: Biological Sciences
365:2267-2278.
Parker, K.L., Barboza, P.S., Gillingham, M.P. 2009. Nutrition integrates environmental response
of ungulates. Functional Ecology 23:57-69
Parker, K.L., Gillingham, M.P., Hanley, T.A., Robbins, C.T. 1995. Foraging efficiency: energy
expenditure versus energy gain in free-ranging black-tailed deer. Canadian Journal of
Zoology 74:442-450.
Parker, K.L., Robbins, C.T., Hanley, T.A. 1984. Energy expenditures for locomotion by mule
deer and elk. Journal of Wildlife Management 48:474-488.
Pfannenstiel, R.S., Ruder, M.G. 2015. Colonization of bison (Bison bison) wallows in a tallgrass
prairie by Culicoides spp (Diptera: Ceratopogonidae). Journal of Vector Ecology
40:187-190.
Vaz, C.M.P., Hopmans, J.W. 2001. Simultaneous measurement of soil penetration resistance and
water content with a combined penetrometer-TDR moisture probe. Soil Science
Society of America Journal 69:927-929.
Pepin, D., Morellet, N., Goulard, M. 2009; Seasonal and daily walking activity patterns of free-
ranging adult red deer (Cervus elaphus) at the individual level. European Journal of
Wildlife Research 55:479-486.
Poole, K.G., Mowat, G. 2005. Winter habitat relationships of deer and elk in the temperate
interior mountains of British Columbia. Wildlife Society Bulletin 33:1288-1302.
Pruitt, W.O. Jr. 1960. Behaviour of the barren-ground Caribou. Lacaster Pa. Intelligence
Printing Co. Biological Papers of the University of Alaska.
R Core Team. 2013. R: A language and environment for statistical computing. R Foundation for
Statistical Computing, Vienna, Austria.
Ralley, W.E. 1986. The effects of biting flies on the weight gain and behavior of dairy heifers.
University of Manitoba, Winnipeg. M.Sc. thesis.
Ranglack, D.H., du Toit, J.T. 2015. Habitat selection by free-ranging bison in a mixed grazing
system on public land. Rangeland Ecology & Management 68:349-353.

46
Raynor, E.J., Joern, A., Briggs, J.M. 2015. Bison foraging responds to fire frequency in
nutritionally heterogeneous grassland. Ecology 1586-1597.
Reynolds, H.W., Hansen, R.M., Peden, D.G. 1978. Diets of the Slave river lowland bison herd,
Northwest Territories, Canada. Journal of Wildlife Management 42:581-590.
Rettie, W.J., Messier, F. 2000. Hierarchical habitat selection by woodland caribou: Its
relationship to limiting factors. Ecography 23:466-478.
Richard, J.H., Wilmshurst, J., Cote, S.D. 2014. The effect of snow on space use of an alpine
ungulate: recently fallen snow tells more than cumulative snow depth. Canadian
Journal of Zoology 92:1067-1074.
Riginos, C. 2015. Climate and the landscape of fear in an African savanna. Journal of Animal
Ecology 84:124-133.
Ripple, W.J. Beschta, R.L. 2006. Linking wolves to willows via risk-sensitive foraging by
ungulates in the northern Yellowstone ecosystem. Forest Ecology and Management
230:96-106.
Robinson, B.G., Merrill, E.H. 2012. The influence of snow on the functional response of grazing
ungulates. Oikos 121:28-34.
Rodriguez, I., Crespo, G., Torres, V., Fraga, S. 1998. The rate of decay of cattle dung patches in
a Cynodon nlemfuensis grassland in the dry season. Cuban Journal of Agricultural
Science 32:207-212.
Rolf, I.M., Reimers, E. 2002. Reindeer summer activity pattern in relation to weather and insect
harassment. Journal of Animal Ecology 71:883-892.
Schaefer, J.A., Messier, F. 1995. Habitat selection as a hierarchy: the spatial scales of winter
foraging by muskoxen. Ecography 18:333-344.
Schmidt, M. H., Clough, Y., Schulz, W., Westphalen, A., Tscharntke, T. 2006. Capture
efficiency and preservation attributes of different fluids in pitfall traps. Journal of
Arachnology 34:159-162.
Schmitz, O.J. 1991. Thermal constraints and optimization of winter feeding and habitat choice in
white-tailed deer. Holarctic Ecology 14:104-111.
Schoenecker, K.A., Nielsen, S.E., Zeigenfuss, L.C., Pauge, C.A. 2015. Selection of vegetation
types and density of bison in an arid ecosystem. Journal of Wildlife Management
79:1117-1128.

47
Schreck, C.E., Kline, D.L., Williams, D.C., Tidwell, M.A. 1993. Field evaluation in Malaise and
canopy traps of selected targets as attractants for tabanid species (Diptera: Tabanidae).
Journal of the American Mosquito Control Association 9:182-188.
Shepard, E.L.C., Wilson, R.P., Rees, W.G., Grundy, E., Lambertucci, S.A., Vosper S.B. 2013.
Energy landscapes shape animal movement ecology. The American Naturalist 182:298-
312.
Sih, A. 1980. Optimal behavior: can foragers balance two conflicting demands? Science
210:1041-1043.
Smith, D.W., Mech, L.D., Meagher, M., Clark, W.E., Jaffe, R., Phillips, M.K., Mack, J.A. 2000.
Wolf-bison interactions in Yellowstone National Park. Journal of Mammalogy
81:1128-1135.
Stardom, R.P. 1977. Winter ecology of woodland caribou, Rangifer tarandus caribou, and some
aspects of the winter ecology of moose, Alces alces andersoni, and whitetail deer,
Odocoileus virginianus dacotensis (mammalia:Cervidae) in southeastern Manitoba.
Thesis.
StataCorp. 2017. Stata Statistical Software: Release 15. College Station, TX: StataCorp LLC
Steelman, C.D. 1976. Effects of external and internal parasites on domestic livestock production.
Animal Review of Entomology 21:155-179.
Steenweg, R., Hebblewhite, M., Gummer D., Low, B., Hunt, B. 2016. Assessing potential habitat
and carrying capacity for reintroduction of plains bison (Bison bison bison) in Banff
National Park. PLoS ONE 11:1-22.
Storrar, R.D., Evans, D.J.A., Stokes, C.R., Ewertowski, M. 2015. Controls on the location,
morphology and evolution of complex esker systems at decadal timescales,
Breioamerkurjokull, southeast Iceland. Earth Surface Processes and Landforms
40:1421-1438.
Strong, W.L., Gates, C.C. 2009. Wood bison population recovery and forage availability in
northwestern Canada. Journal of Environmental Management 90:434-440.
Tan, T., Nielsen, S.E., Edwards, M.A. 2015. Ronald Lake bison (Bison bison) preliminary
summary report: March 2013 – March 2014 telemetry data study. Ronald Lake Bison
Report 1:1-54.
Theuerkauf, J., Rouys, S. 2008. Habitat selection by ungulates in relation to predation risk by
wolves and humans in the Bialowieza Forest, Poland. Forest Ecology and
Management 256:1325-1332.

48
Thomas, D.C., Kiliaan, H.P.L. 1990. Warble infestations in some Canadian caribou and their
significance. Rangifer 3:409-417.
Thornhill, A.R., Hays, K.L. 1972. Dispersal and flight activities of some species of Tabanus
(Diptera: Tarabidae). Environmental entomology 1:602-606.
Thorsteinson, A.J., Bracken, G.K., Hanec, W. 1965. The orientation behaviour of horse flies and
deer flies (tabanidae, Diptera). Entomologia Ezperimentalis et Applicata 8:314-318.
Toupin, B., Juot, J., Manseau, M. 1996. Effect of insect harassment on the behaviour of the
Riviere George caribou. Artic 49:375-382.
Tunnakundacha, S., Dewquesnes, M, Masmeatathip, R. 2017. Comparison of Vavoua, Malasie
and Nzi traps with and without attractants for trapping of Stomoxys spp. (Diptera:
Muscidae) and tabanids (Diptera: Tabanidae) on cattle farms. Agriculture and Natural
Resources 1-5.
van Beest, F., Van Moorter, B., Milner, J.M. 2012. Temperature-mediated habitat use and
selection by a heat-sensitive northern ungulate. Animal Behaviour 84:723-735.
Walsh, N.E., Fancy, S.G., McCabe, T.R., Pank, L.F. 1992. Habitat use by the Porcupine Caribou
Herd during predicted insect harassment. Journal of Wildlife Management 56:465-473.
Wickham, H. 2016. ggplot2: Elegant graphics for data analysis. Springer-Verlag New York.
Wilmshurst, J.F., Fryxell, J.M., Bergman, C.M. 2000. The allometry of patch selection in
ruminants. Proceedings: Biological Sciences 267:345-349.
Witter, L., Johnson, C., Croft, B. 2014. Weather-based indices of parasitic fly activity and
abundance for the Bathurst caribou post-calving and summer range: users guide.
Northwest Territories Environment and Natural Resources Manuscript Report No.
246.
Witter, L., Johnson, C., Croft, B., Gunn, A., Gillingham, M.P. 2012a. Behavioural trade-offs in
response to external stimuli: time allocation of an Arctic ungulate during varying
intensities of harassment by parasitic flies. Journal of Animal Ecology 81:284-295.
Witter, L., Johnson, C., Croft, B., Gunn, A., Poirier, L.M. 2012b. Gauging climate change effects
at local scales: weather-based indices to monitor insect harassment in caribou.
Ecological Applications 22:1838-1851.

49
Woloszyn-Galeza, A., Perzanowski, K., Januszczak, M., Pagacz, S. 2016. Habitat preferences of
a European bison (Bison bonasus) population in the Carpathian Mountains. Annales
Zoologici Fennici 53:1-18.
Wood, J.R., Holdaway, R.J., Orwin, K.H., Morse, C., Bonner, K.I., Davis, C., Bolstridge, N.,
Dickie, I.A. 2017. No single driver of biodiversity: divergent responses of multiple
taxa across land use types. Ecosphere 8:1-17.
Yan, W.B., Zeng, Z.G., Gong, H.S., He, X.B., Liu, X.Y., Si, K.C., Song, Y.L. 2016. Habitat use
and selection by takin in the Quinling Mountains, China. Wildlife Research 43:671-
680.
Zweifel-Schielly, B., Kreuzer, M., Ewald, K.C., Suter, W. 2009. Habitat selection by an alpine
ungulate: the significance of forage characteristics varies with scale and season.
Ecography 32:102-113.

50
Appendix
Appendix 1: Bison dung during summer (left) and winter (right). Summer and winter dung are
differentiated by texture and is largely influenced by moisture content influenced by both direct
water consumption and water content in forage. During summer months, bison are better
hydrated, thus summer dung is moister and more ‘plop’-shaped. In contrast, during winter
months bison are more dehydrated, thus winter dung is less moist and is more block-shaped
(Carbyn pres. comm.).

51
Appendix 2: Bison total dung counts for 4 land-cover types (n = 36). Dung was counted in 3,
100-m belt transects of 4-m width at each site in August 2016. Dung was divided into summer
and winter dung based on dung texture.
Summer Winter
Land-cover Site # Count Count
Marsh 1 0 0
Marsh 2 0 0
Marsh 3 0 0
Marsh 4 1 0
Marsh 5 0 0
Marsh 6 0 8
Marsh 7 0 0
Marsh 8 3 25
Marsh 9 2 19
Deciduous 1 4 0
Deciduous 2 16 7
Deciduous 3 0 0
Deciduous 4 3 1
Deciduous 5 0 1
Deciduous 6 0 0
Deciduous 7 0 0
Deciduous 8 2 0
Deciduous 9 0 3
Pine 1 9 0
Pine 2 4 0
Pine 3 11 0
Pine 4 20 0
Pine 5 12 0
Pine 6 3 0
Pine 7 1 0
Pine 8 3 3
Pine 9 23 0
Esker 1 8 2
Esker 2 17 30
Esker 3 3 1
Esker 4 9 2
Esker 5 63 6
Esker 6 8 1
Esker 7 5 1
Esker 8 6 0
Esker 9 7 0

52
Appendix 3: Habitat selection coefficients for bison from the Ronald Lake herd from Tan et al.
(2015) and DeMars et al. (2016). Deciduous forest was held constant in both reports (reference
habitat). Seasons defined by: winter (Nov – Apr), spring (Apr – May), calving (May – Jun),
summer (Jun – Sept), and fall (Sept – Nov). In the DeMars et al. (2016) report, the season
summer + fall was defined as June – November.
Tan et al. 2015
Land-cover Winter Spring Summer (calving) Fall
Marsh 3.001 1.840 1.969 -0.450
Conifer -0.141 1.663 -3.478 0.482
Pine 2.135 2.059 -4.054 3.094
DeMars et al. 2016
Land-cover Winter Spring Calving Summer + Fall
Marsh 3.360 1.830 1.570 0.850
Conifer -0.530 -0.660 -3.440 0.750
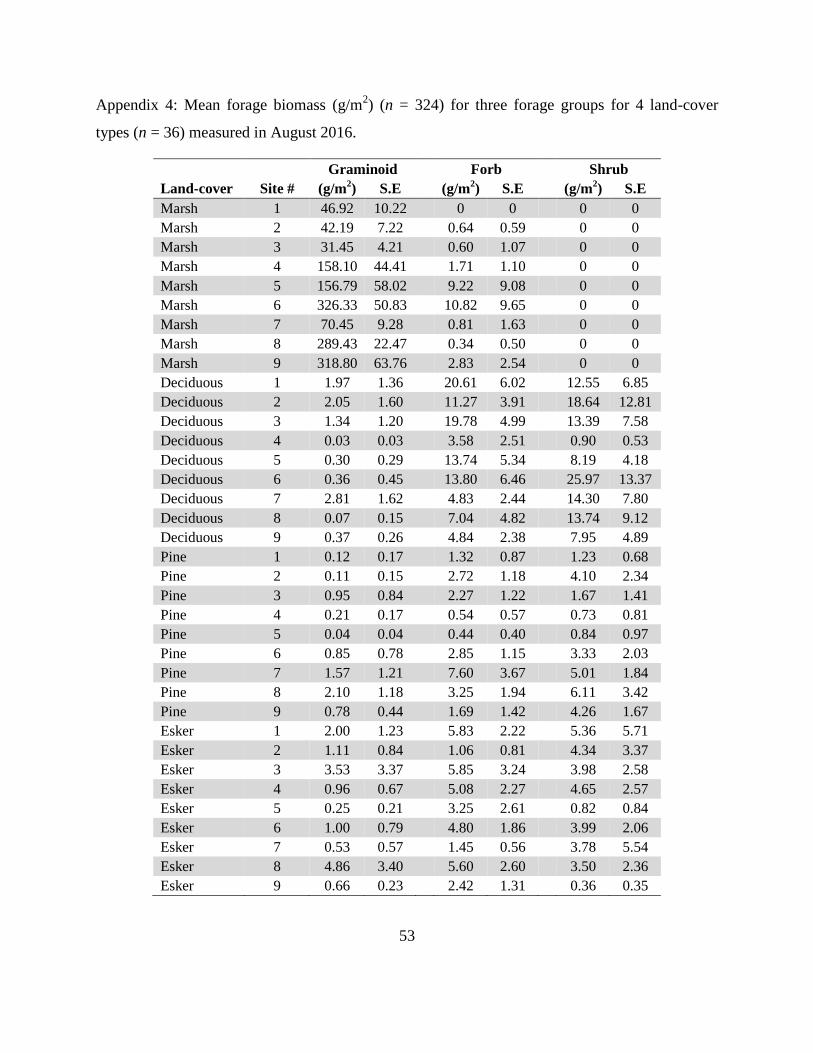
53
Appendix 4: Mean forage biomass (g/m2) (n = 324) for three forage groups for 4 land-cover
types (n = 36) measured in August 2016.
Graminoid Forb Shrub
Land-cover Site # (g/m2) S.E (g/m
2) S.E (g/m
2) S.E
Marsh 1 46.92 10.22 0 0 0 0
Marsh 2 42.19 7.22
0.64 0.59
0 0
Marsh 3 31.45 4.21 0.60 1.07 0 0
Marsh 4 158.10 44.41
1.71 1.10
0 0
Marsh 5 156.79 58.02 9.22 9.08 0 0
Marsh 6 326.33 50.83
10.82 9.65
0 0
Marsh 7 70.45 9.28 0.81 1.63 0 0
Marsh 8 289.43 22.47
0.34 0.50
0 0
Marsh 9 318.80 63.76 2.83 2.54 0 0
Deciduous 1 1.97 1.36
20.61 6.02
12.55 6.85
Deciduous 2 2.05 1.60 11.27 3.91 18.64 12.81
Deciduous 3 1.34 1.20
19.78 4.99
13.39 7.58
Deciduous 4 0.03 0.03 3.58 2.51 0.90 0.53
Deciduous 5 0.30 0.29
13.74 5.34
8.19 4.18
Deciduous 6 0.36 0.45 13.80 6.46 25.97 13.37
Deciduous 7 2.81 1.62
4.83 2.44
14.30 7.80
Deciduous 8 0.07 0.15 7.04 4.82 13.74 9.12
Deciduous 9 0.37 0.26
4.84 2.38
7.95 4.89
Pine 1 0.12 0.17 1.32 0.87 1.23 0.68
Pine 2 0.11 0.15
2.72 1.18
4.10 2.34
Pine 3 0.95 0.84 2.27 1.22 1.67 1.41
Pine 4 0.21 0.17
0.54 0.57
0.73 0.81
Pine 5 0.04 0.04 0.44 0.40 0.84 0.97
Pine 6 0.85 0.78
2.85 1.15
3.33 2.03
Pine 7 1.57 1.21 7.60 3.67 5.01 1.84
Pine 8 2.10 1.18
3.25 1.94
6.11 3.42
Pine 9 0.78 0.44 1.69 1.42 4.26 1.67
Esker 1 2.00 1.23
5.83 2.22
5.36 5.71
Esker 2 1.11 0.84 1.06 0.81 4.34 3.37
Esker 3 3.53 3.37
5.85 3.24
3.98 2.58
Esker 4 0.96 0.67 5.08 2.27 4.65 2.57
Esker 5 0.25 0.21
3.25 2.61
0.82 0.84
Esker 6 1.00 0.79 4.80 1.86 3.99 2.06
Esker 7 0.53 0.57
1.45 0.56
3.78 5.54
Esker 8 4.86 3.40 5.60 2.60 3.50 2.36
Esker 9 0.66 0.23 2.42 1.31 0.36 0.35

54
Appendix 5: Mean biting fly abundance (count) from June to August 2016 for three sampling
methods across 4 land-cover types: sweep netting (n = 2837), tabanid traps (n = 540), and
Malaise traps (n = 80).
Sweep net Tabanid trap Malaise trap
Land-cover Site # Count S.E. Count S.E. Count S.E
Marsh 1 7.86 0.69 24.27 12.27 No trap set
Marsh 2 4.30 0.50
12.67 6.42
No trap set
Marsh 3 8.94 0.85 15.00 7.45 24.60 24.35
Marsh 4 7.11 0.73
29.93 19.74
No trap set
Marsh 5 19.51 1.86 7.69 5.95 No trap set
Marsh 6 8.95 1.21
14.80 8.60
38.00 38.00
Marsh 7 13.65 1.46 41.20 22.31 No trap set
Marsh 8 14.03 1.53
16.53 8.65
38.80 38.05
Marsh 9 10.11 1.30 10.73 5.95 193.20 191.20
Deciduous 1 4.51 0.60
8.13 4.23
Trap destroyed
Deciduous 2 2.12 0.30 3.60 1.75 No trap set
Deciduous 3 5.03 0.79
1.67 1.53
No trap set
Deciduous 4 0.99 0.20 23.60 19.84 No trap set
Deciduous 5 2.37 0.30
4.73 2.70
Trap destroyed
Deciduous 6 2.72 0.39 2.00 1.24 No trap set
Deciduous 7 1.63 0.25
6.67 3.85
No trap set
Deciduous 8 7.02 0.59 1.36 1.11 6.20 5.95
Deciduous 9 1.15 0.18
9.07 5.72
23.00 21.76
Pine 1 1.55 0.30 24.67 15.80 60.20 60.20
Pine 2 1.93 0.36
20.67 12.25
No trap set
Pine 3 2.75 0.44 22.80 13.07 0.60 0.40
Pine 4 1.38 0.22
29.80 17.03
No trap set
Pine 5 3.78 0.46 9.67 5.52 10.20 10.20
Pine 6 3.24 0.37
9.33 6.02
No trap set
Pine 7 3.26 0.53 4.00 2.51 No trap set
Pine 8 4.18 0.50
9.40 4.92
28.00 27.26
Pine 9 3.22 0.52 19.13 12.15 No trap set
Esker 1 1.59 0.29
28.29 13.39
9.60 9.35
Esker 2 0.76 0.17 6.07 4.62 No trap set
Esker 3 0.76 0.20
10.60 5.49
No trap set
Esker 4 1.52 0.24 43.33 24.55 0.40 0.40
Esker 5 0.21 0.11
15.40 9.21
No trap set
Esker 6 2.46 0.38 7.40 4.10 4.20 4.20
Esker 7 0.46 0.10
11.27 6.59
No trap set
Esker 8 1.53 0.25 18.93 10.80 No trap set
Esker 9 0.50 0.12 15.33 7.99 19.80 19.55

55
Appendix 6: Tabanid trap developed for this thesis based on design of Thorsteinson et al. (1965).
Traps were designed to catch flies from the family Tabanidae (description in section: Field
methods).

56
Appendix 7: Correlation matrix of measured soil properties for 180 soil moisture and bulk
density samples and 756 penetration depth measures taken in 4 land-cover types (marsh,
deciduous, pine, and esker) in the summer of 2016 near Ronald Lake, Alberta.
Soil moisture
(lab %)
Bulk density
(g/mm3)
Penetration
depth (cm)
Soil moisture (lab %) 1
Bulk density (g/mm3) -0.980 1
Penetration depth (cm) 0.889 -0.866 1

57
Appendix 8: Mean penetration depth (n = 756), bulk density (n = 180), in-situ soil moisture (n =
756), and lab measured soil moisture (n = 180), for 4 land-cover types (n = 36). Soil parameters
were measured in July 2016.
Penetration depth Bulk density Moisture in-situ Moisture lab
Land-cover Site # (cm) S.E. (g/mm3) S.E. (%) S.E. (%) S.E.
Marsh 1 42.76 4.76 0.09 0.01 1.00 0 0.89 0.01
Marsh 2 43.76 4.03
0.07 0.01
0.99 0.01
0.91 0
Marsh 3 36.81 4.25 0.04 0 1.00 0 0.94 0
Marsh 4 17.86 1.06
0.12 0
0.81 0.05
0.84 0
Marsh 5 17.55 0.83 0.56 0.09 0.68 0.07 0.57 0.06
Marsh 6 7.31 0.38
0.41 0.05
0.37 0.04
0.53 0.02
Marsh 7 31.60 3.33 0.07 0 0.97 0.03 0.91 0.01
Marsh 8 3.83 0.26
0.86 0.04
0.37 0.03
0.27 0.01
Marsh 9 12.86 0.99 0.48 0.15 0.54 0.04 0.61 0.08
Deciduous 1 3.86 0.18
1.23 0.04
0.11 0.01
0.08 0.01
Deciduous 2 4.19 0.30 1.25 0.04 0.15 0.01 0.10 0.01
Deciduous 3 4.74 0.20
1.10 0.05
0.10 0.01
0.09 0.01
Deciduous 4 4.45 0.24 1.28 0.02 0.10 0.01 0.06 0
Deciduous 5 5.26 0.28
1.01 0.03
0.12 0.01
0.09 0
Deciduous 6 4.36 0.20 0.97 0.03 0.13 0.01 0.09 0.01
Deciduous 7 5.07 0.24
1.17 0.04
0.11 0.01
0.04 0
Deciduous 8 5.43 0.31 0.75 0.07 0.17 0.02 0.19 0.03
Deciduous 9 6.19 0.38
1.22 0.03
0.12 0.01
0.05 0.01
Pine 1 6.86 0.39 1.41 0.05 0.10 0.01 0.04 0.01
Pine 2 6.38 0.38
1.35 0.03
0.11 0.01
0.03 0
Pine 3 5.95 0.28 1.30 0.07 0.10 0.01 0.04 0.01
Pine 4 6.95 0.28
1.44 0.04
0.07 0
0.02 0
Pine 5 6.81 0.35 1.38 0.02 0.07 0.01 0.03 0
Pine 6 5.69 0.75
1.26 0.05
0.11 0.01
0.05 0.01
Pine 7 4.74 0.26 1.23 0.05 0.10 0.01 0.06 0.01
Pine 8 5.57 0.32
1.29 0.02
0.10 0.01
0.11 0.01
Pine 9 4.12 0.23 1.32 0.04 0.11 0.01 0.09 0.01
Esker 1 4.55 0.24
1.34 0.03
0.08 0.01
0.03 0
Esker 2 4.17 0.17 1.35 0.02 0.06 0.01 0.03 0
Esker 3 3.81 0.23
1.27 0.03
0.11 0.01
0.04 0
Esker 4 4.14 0.18 1.30 0.04 0.08 0 0.04 0
Esker 5 3.90 0.21
1.40 0.02
0.05 0.01
0.02 0
Esker 6 4.00 0.22 1.34 0.02 0.07 0.01 0.03 0
Esker 7 3.95 0.16
1.33 0.04
0.06 0.01
0.03 0
Esker 8 3.64 0.20 1.32 0.05 0.08 0.01 0.03 0
Esker 9 4.40 0.20 1.32 0.05 0.10 0.01 0.04 0

58
Appendix 9: Soil penetrometer developed for this thesis and used to measure soil resistance and
strength (description in section: Field methods). Penetrometer body constructed of 2 m length,
1.5” schedule 40 steel pipe, and 1 m length penetration pin constructed of 1” solid steel (A). A
sliding weight (7 kg) was dropped from 1.5 m height onto the collar of the penetration pin (B &
C). A tape measure fixed to a stake was used to measure penetration depth to the nearest 0.5 cm.

59
Table 10: Univariate, linear regression models testing the effects of soil parameters (footing),
biting fly abundance, and forage biomass on summer bison activity (dung). Candidate, univariate
models were used for selection of variables to be used in multivariate, structural equation
models. Bison dung counts, soil parameters (soil moisture, bulk density, and penetration depth),
biting fly abundance (using two methods: sweep net and tabanid traps), and forage biomass
(divided into three groups: graminoids, forbs, and shrubs) were measured in 4 land-cover types
near Ronald Lake, Alberta between June and August 2016.
Model I.D. Model form df AIC ∆ AIC
7 Dung ~ Plant Biomass (Total) 2 87.6 -
10 Dung ~ (Graminoid + Shrub Biomass) 2 88.5 0.9
9 Dung ~ (Graminoid + Forb Biomass) 2 89.4 1.8
4 Dung ~ Soil Moisture (Lab) 2 90.7 3.1
3 Dung ~ Soil Moisture (In-situ) 2 90.8 3.3
5 Dung ~ Sweep Net 2 90.8 3.3
2 Dung ~ Soil Bulk Density (Inverse) 2 93.2 5.6
1 Dung ~ Soil Penetration 2 93.4 5.9
8 Dung ~ Graminoid Biomass 2 95.9 8.3
6 Dung ~ Tabanid Trap 2 102.7 15.1

60
Table 11: Univariate, linear regression models testing the effects of different forms of forage
biomass on winter bison activity (dung). Candidate, univariate models were used for selection of
variables to be used in multivariate, structural equation models. Bison dung counts and forage
biomass (divided into three groups: graminoids, forbs, and shrubs) were measured in 4 land-
cover types near Ronald Lake, Alberta between June and August 2016.
Model I.D. Model form df AIC ∆ AIC
4 Dung ~ (Graminoid + Shrub Biomass) 2 101.8 -
1 Dung ~ Vegetation Biomass (total) 2 102.2 0.4
2 Dung ~ Graminoid Biomass 2 102.2 0.4
3 Dung ~ (Graminoid + Forb Biomass) 2 102.3 0.5

61
Appendix 12: Linear regression of the effect of soil moisture content on bison summer activity
(dung). Soil moisture content and dung counts were measured from June to August 2016 for 4
land-cover types (n = 36) near Ronald Lake, Alberta.
A linear regression of summer dung count and percent soil moisture. Bison summer activity
(dung) was significantly negatively related to soil moisture (F1,34 = 16.84, S.E. = 0.83, R2 = 0.33,
p < 0.001).
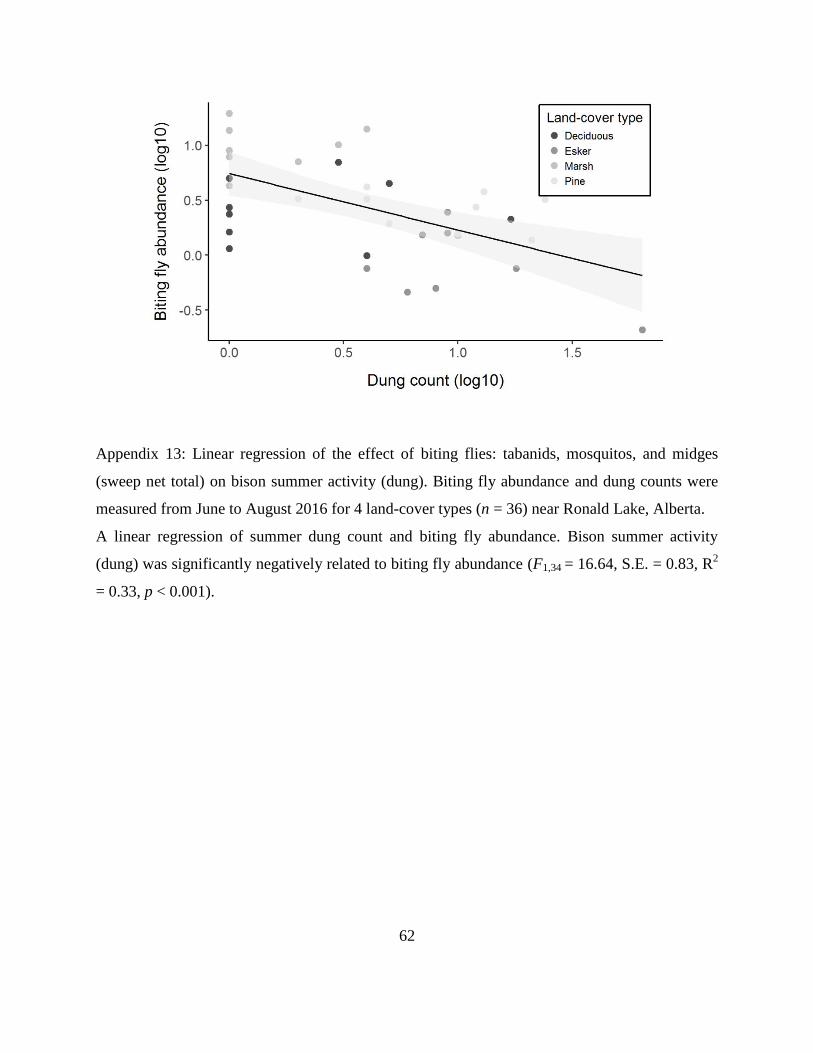
62
Appendix 13: Linear regression of the effect of biting flies: tabanids, mosquitos, and midges
(sweep net total) on bison summer activity (dung). Biting fly abundance and dung counts were
measured from June to August 2016 for 4 land-cover types (n = 36) near Ronald Lake, Alberta.
A linear regression of summer dung count and biting fly abundance. Bison summer activity
(dung) was significantly negatively related to biting fly abundance (F1,34 = 16.64, S.E. = 0.83, R2
= 0.33, p < 0.001).

63
Appendix 14: Linear regression of the effect of graminoid biomass on bison summer activity
(dung). Graminoid biomass and dung counts were measured in August 2016 for 4 land-cover
types (n = 36) near Ronald Lake, Alberta.
A linear regression of summer dung count and graminoid biomass. Bison summer activity (dung)
was significantly negatively related to graminoid biomass (F1,34 = 9.99, S.E. = 0.89, R2 = 0.45, p
= 0.003).

64
Appendix 15: Linear regression of the effect of graminoid biomass on bison winter activity
(dung). Graminoid biomass and dung counts were measured from June to August 2016 for 4
land-cover types (n = 36) near Ronald Lake, Alberta.
A linear regression of winter dung count and graminoid biomass. Bison winter activity (dung)
was not significantly related to graminoid biomass (F1,34 = 2.92, SE = 0.43, R2 = 0.08, p =
0.097).

65
Appendix 16: Mean percent soil moisture content for 4 land-cover types near Ronald Lake,
Alberta (n = 756). Soil moisture content was measured using a soil moisture probe (TDR) in July
2016.

66
Appendix 17: Mean soil bulk density estimate for 4 land-cover types near Ronald Lake, Alberta
(n = 180). Soil bulk density was measured using a 577 cm3 soil core measuring 15 cm in height x
7 cm in diameter. Soil cores were dried in a drying oven at 95°C for 48 hours and weighed.
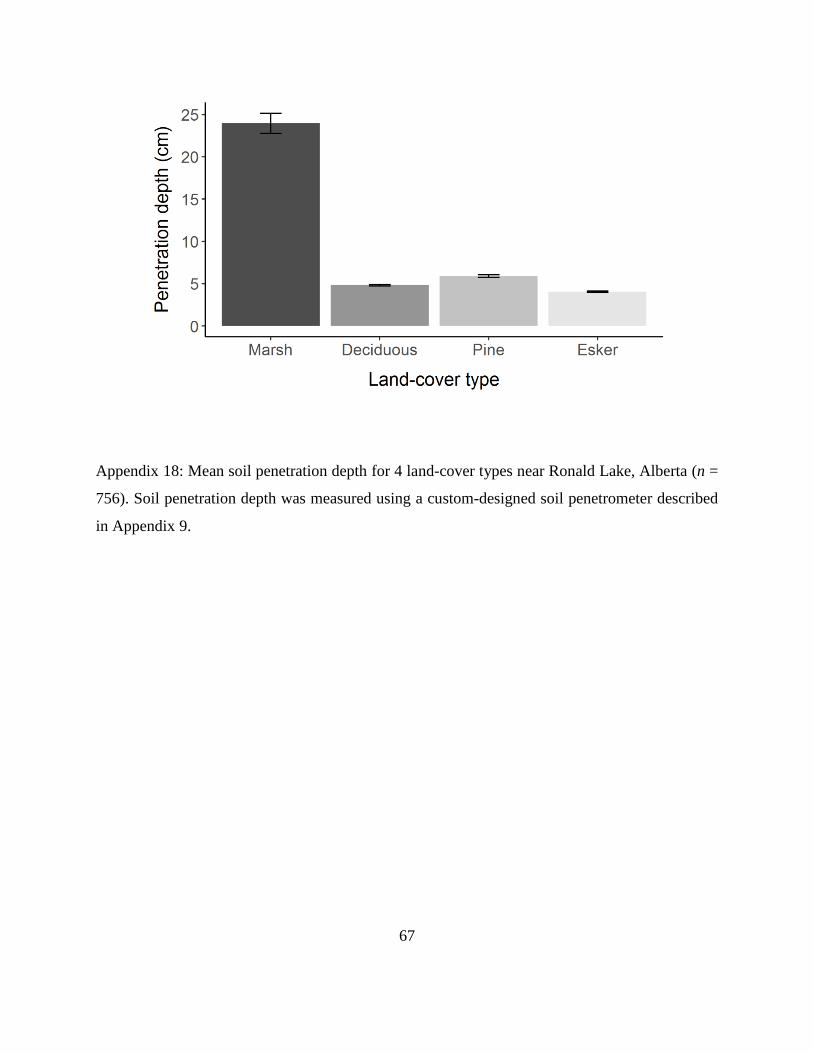
67
Appendix 18: Mean soil penetration depth for 4 land-cover types near Ronald Lake, Alberta (n =
756). Soil penetration depth was measured using a custom-designed soil penetrometer described
in Appendix 9.

68
Appendix 19: Mean tabanid (Diptera: Tabanidae) abundance from June to August 2016 for 4
land-cover types near Ronald Lake, Alberta. Graph is of mean number of horse flies (tabanids)
caught during a single sweep net event which consisted of 30 sweeps while walking a 50 m
transect (n = 2837).

69
Appendix 20: Mean mosquito (Diptera: Culicidae) abundance from June to August 2016 for 4
land-cover types near Ronald Lake, Alberta. Graph is of mean number of mosquitos caught
during a single sweep net event which consisted of 30 sweeps while walking a 50 m transect (n =
2837).

70
Appendix 21: Mean midge (Diptera: Ceratopogonidae) abundance from June to August 2016 for
4 land-cover types near Ronald Lake, Alberta. Graph is of mean number of midges caught during
a single sweep net event which consisted of 30 sweeps while walking a 50 m transect (n = 2837).
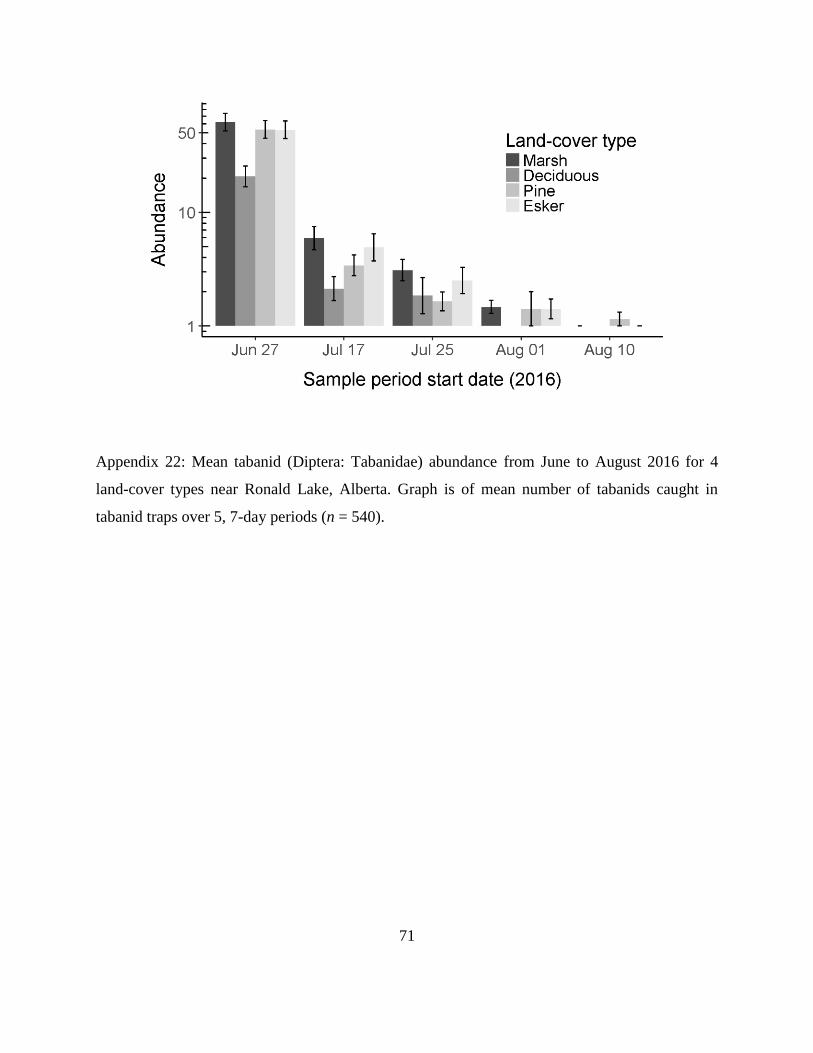
71
Appendix 22: Mean tabanid (Diptera: Tabanidae) abundance from June to August 2016 for 4
land-cover types near Ronald Lake, Alberta. Graph is of mean number of tabanids caught in
tabanid traps over 5, 7-day periods (n = 540).
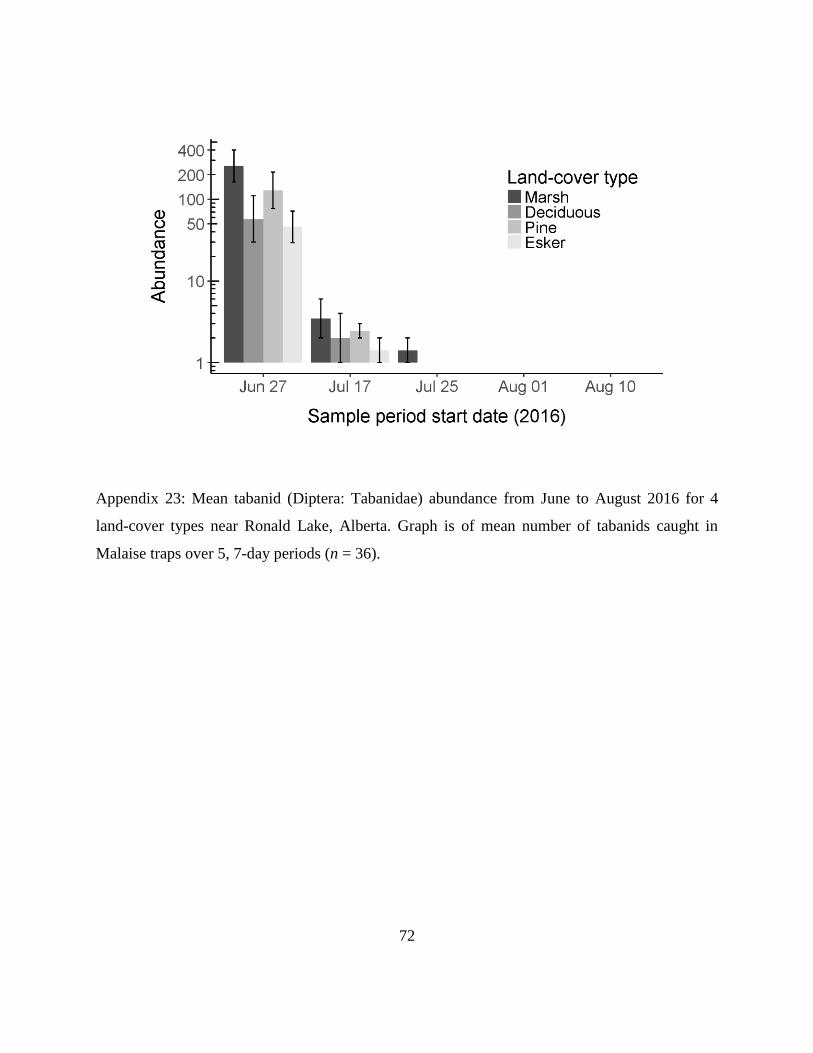
72
Appendix 23: Mean tabanid (Diptera: Tabanidae) abundance from June to August 2016 for 4
land-cover types near Ronald Lake, Alberta. Graph is of mean number of tabanids caught in
Malaise traps over 5, 7-day periods (n = 36).

73
Appendix 24: Mean abundance of tabanids, mosquitos, and midges (total) from June to August
2016 for 4 land-cover types near Ronald Lake, Alberta. Graph is of mean number of flies caught
during a single sweep net event which consisted of 30 sweeps while walking a 50 m transect (n =
2837).

74
Appendix 25: Mean tabanid (Diptera: Tabanidae) abundance from June to August 2016 for 4
land-cover types near Ronald Lake, Alberta. Graph is of mean number of horse flies caught
during a single sweep net event which consisted of 30 sweeps while walking a 50 m transect (n =
2837).

75
Appendix 26: Mean mosquito (Diptera: Culicidae) abundance from June to August 2016 for 4
land-cover types near Ronald Lake, Alberta. Graph is of mean number of horse flies caught
during a single sweep net event which consisted of 30 sweeps while walking a 50 m transect (n =
2837).

76
Appendix 29: Mean midge (Diptera: Ceratopogonidae) abundance from June to August 2016 for
4 land-cover types near Ronald Lake, Alberta. Graph is of mean number of horse flies caught
during a single sweep net event which consisted of 30 sweeps while walking a 50 m transect (n =
2837).