Embed Size (px)
Citation preview
University of Agriculture in KrakowDepartment of Water Engineering and Geotechnics
“Development of the complex condition framework for nursing talented students at the Univesity of West Hungary” project ID: TÁMOP - 4.2.2.B-10/1-2010-0018
Tomasz Koniarz
Content of heavy metals and phytotoxkit of bottom sediments collected from the Chancza reservoir
Introduction
Location
Characteristic of the reservoir
Collecting bottom sediment samples
Methodology
Results
Conclusions
References
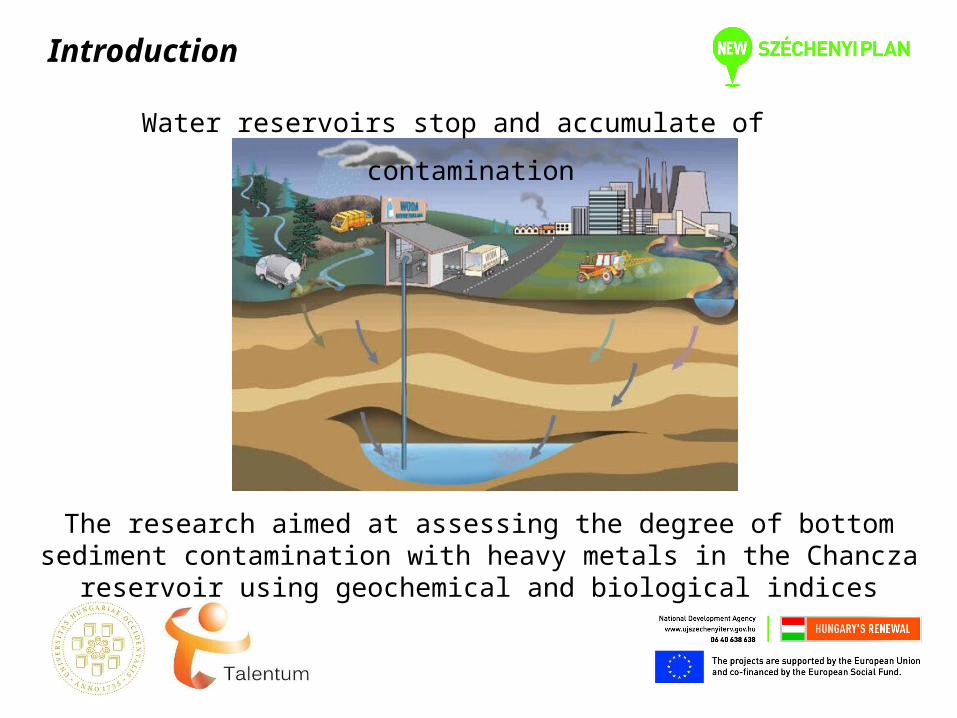
Introduction
Water reservoirs stop and accumulate of contamination
The research aimed at assessing the degree of bottom sediment contamination with heavy metals in the Chancza reservoir using
geochemical and biological indices
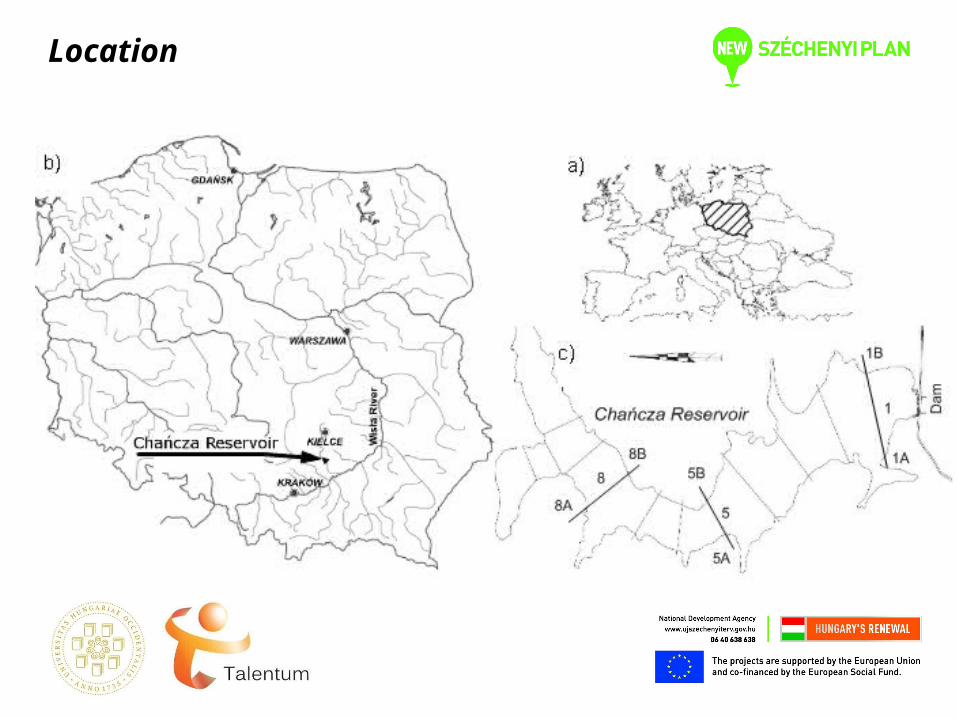
Location
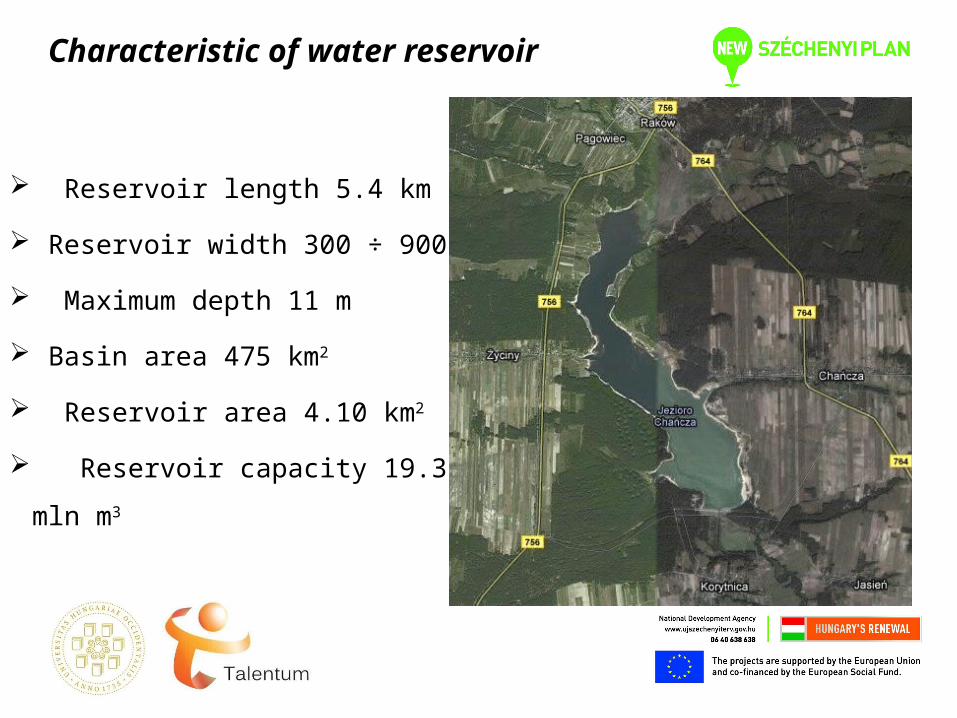
Characteristic of water reservoir
Reservoir length 5.4 km
Reservoir width 300 ÷ 900 m
Maximum depth 11 m
Basin area 475 km2
Reservoir area 4.10 km2
Reservoir capacity 19.31 mln m3
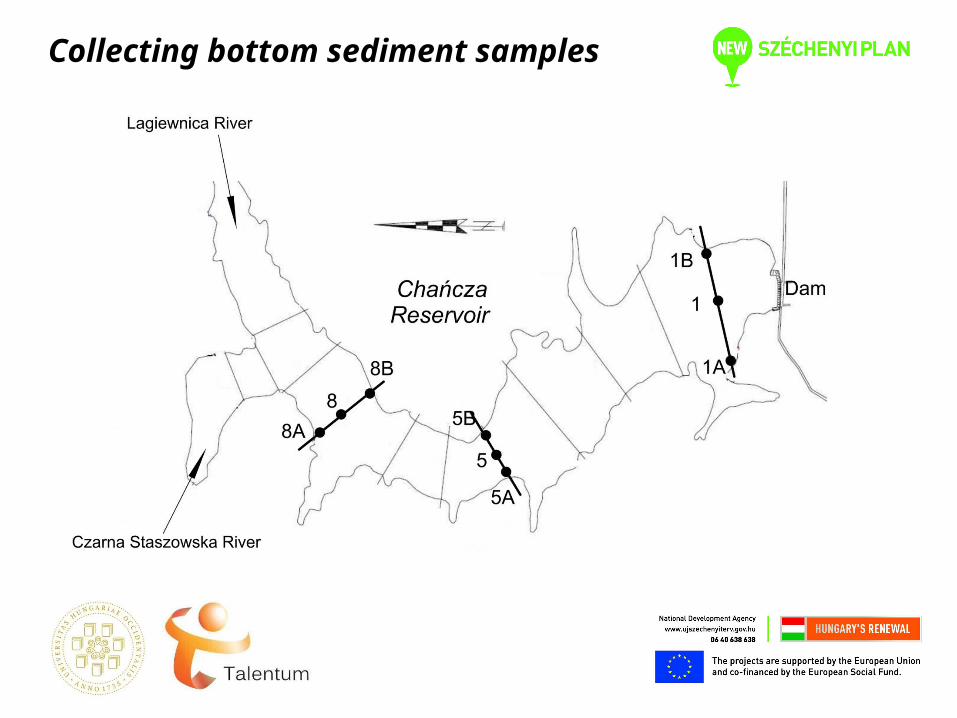
Collecting bottom sediment samples
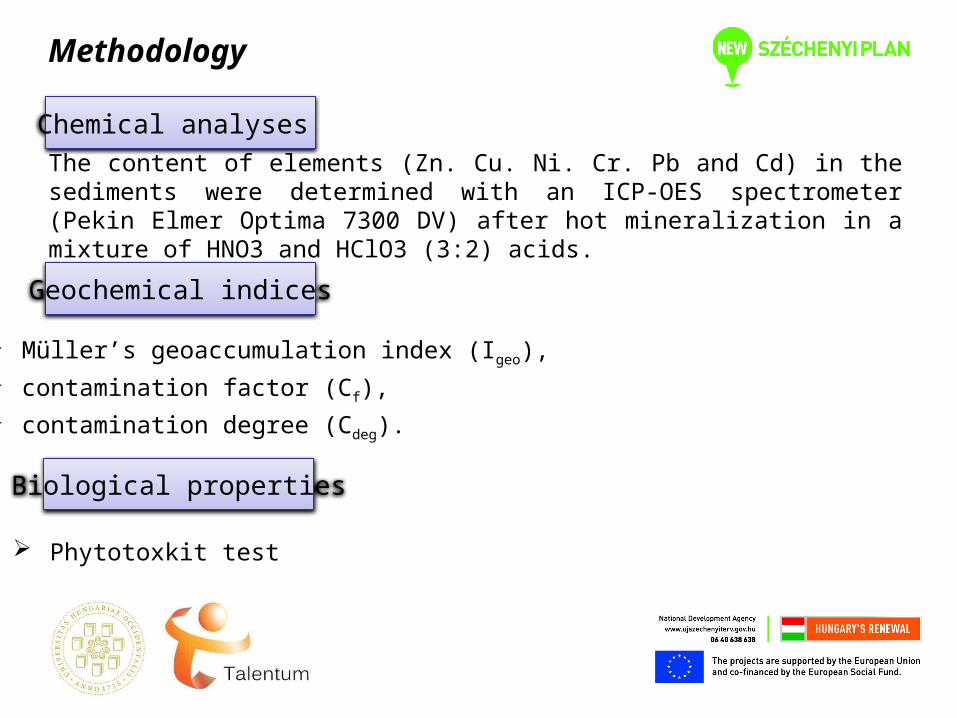
Chemical analyses The content of elements (Zn. Cu. Ni. Cr. Pb and Cd) in the sediments were determined with an ICP-OES spectrometer (Pekin Elmer Optima 7300 DV) after hot mineralization in a mixture of HNO3 and HClO3 (3:2) acids.
Geochemical indices
Biological properties
Phytotoxkit test
Müller’s geoaccumulation index (Igeo),
contamination factor (Cf),
contamination degree (Cdeg).
Methodology
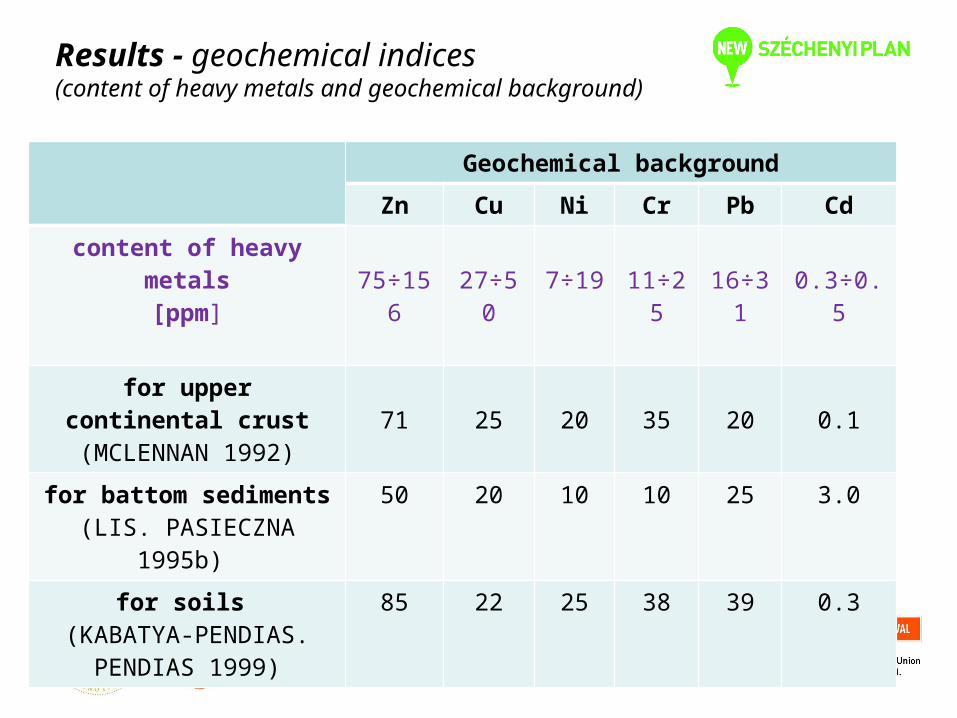
Results - geochemical indices(content of heavy metals and geochemical background)
Geochemical background
Zn Cu Ni Cr Pb Cd
content of heavy metals[ppm]
75÷156
27÷50
7÷19
11÷25
16÷31
0.3÷0.5
for upper continental crust
(MCLENNAN 1992)71 25 20 35 20 0.1
for battom sediments(LIS. PASIECZNA 1995b)
50 20 10 10 25 3.0
for soils (KABATYA-PENDIAS.
PENDIAS 1999)
85 22 25 38 39 0.3
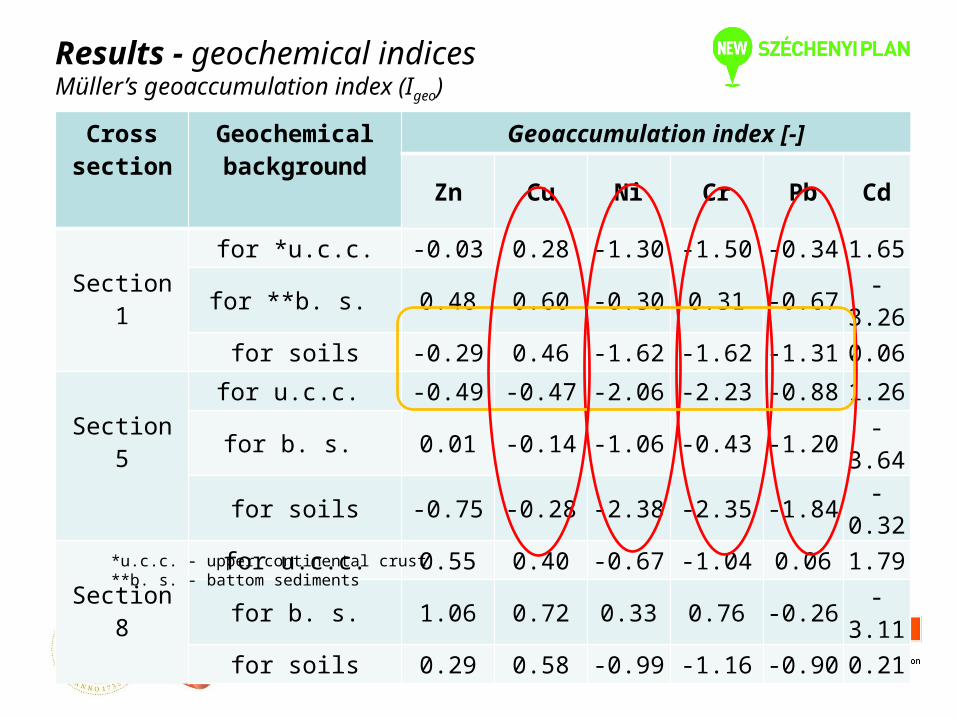
Results - geochemical indicesMüller’s geoaccumulation index (Igeo)
Cross section
Geochemical background
Geoaccumulation index [-]
Zn Cu Ni Cr Pb Cd
Section 1for *u.c.c. -0.03 0.28 -1.30 -1.50 -0.34 1.65
for **b. s. 0.48 0.60 -0.30 0.31 -0.67 -3.26
for soils -0.29 0.46 -1.62 -1.62 -1.31 0.06
Section 5for u.c.c. -0.49 -0.47 -2.06 -2.23 -0.88 1.26
for b. s. 0.01 -0.14 -1.06 -0.43 -1.20 -3.64
for soils -0.75 -0.28 -2.38 -2.35 -1.84 -0.32
Section 8for u.c.c. 0.55 0.40 -0.67 -1.04 0.06 1.79
for b. s. 1.06 0.72 0.33 0.76 -0.26 -3.11
for soils 0.29 0.58 -0.99 -1.16 -0.90 0.21*u.c.c. - upper continental crust**b. s. - battom sediments
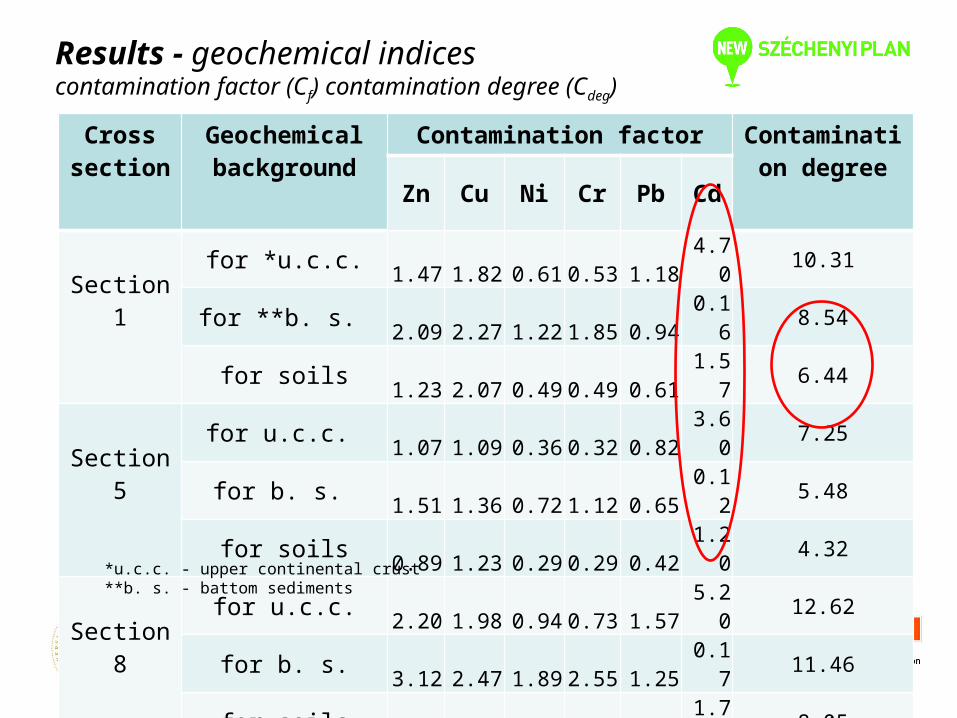
Results - geochemical indicescontamination factor (Cf) contamination degree (Cdeg)
Cross section
Geochemical background
Contamination factor Contamination degree
Zn Cu Ni Cr Pb Cd
Section 1for *u.c.c. 1.47 1.82 0.61 0.53 1.18 4.70 10.31
for **b. s. 2.09 2.27 1.22 1.85 0.94 0.16 8.54
for soils 1.23 2.07 0.49 0.49 0.61 1.57 6.44
Section 5for u.c.c. 1.07 1.09 0.36 0.32 0.82 3.60 7.25
for b. s. 1.51 1.36 0.72 1.12 0.65 0.12 5.48
for soils 0.89 1.23 0.29 0.29 0.42 1.20 4.32
Section 8for u.c.c. 2.20 1.98 0.94 0.73 1.57 5.20 12.62
for b. s. 3.12 2.47 1.89 2.55 1.25 0.17 11.46
for soils 1.84 2.25 0.76 0.67 0.80 1.73 8.05*u.c.c. - upper continental crust**b. s. - battom sediments
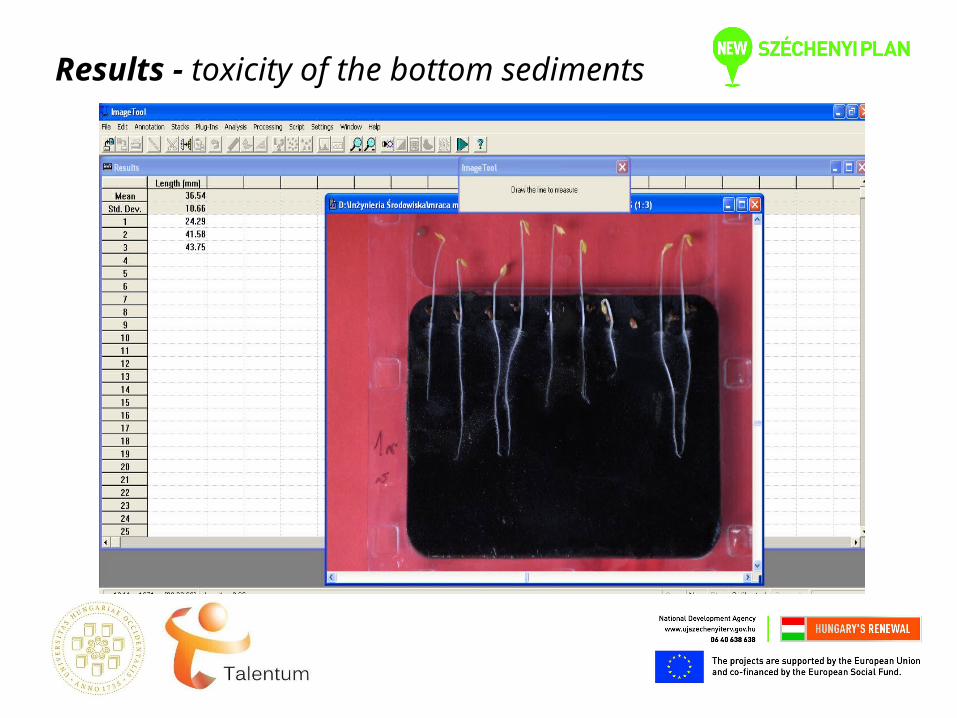
Results - toxicity of the bottom sediments
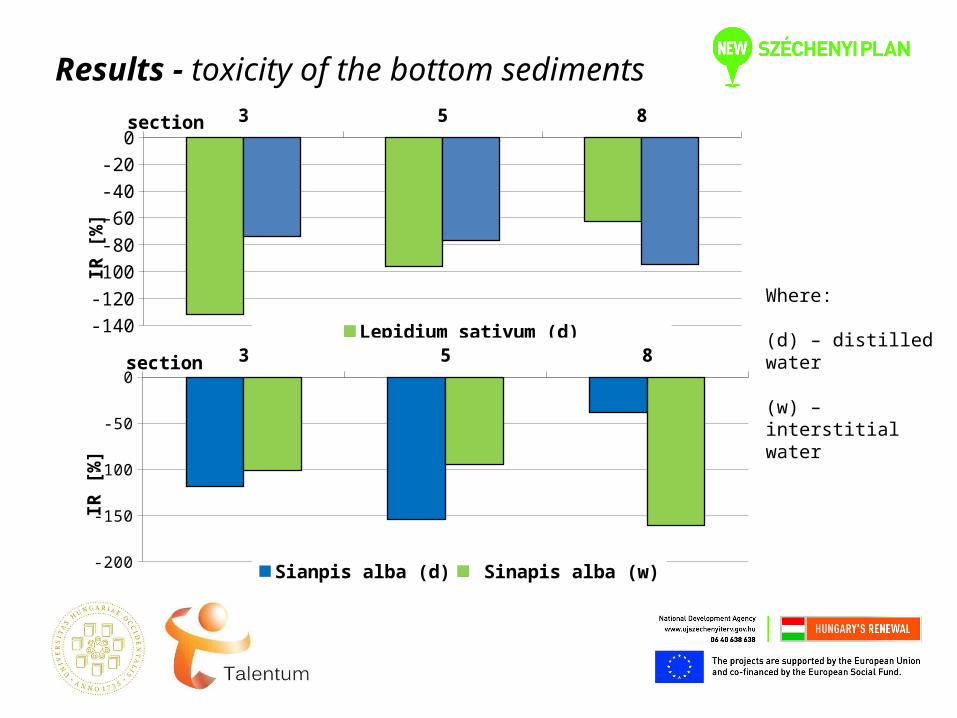
Results - toxicity of the bottom sediments
3 5 8
-140
-120
-100
-80
-60
-40
-20
0
Lepidium sativum (d) Lepidium sativum (w)
section
IR [
%]
3 5 8
-180-160-140-120-100
-80-60-40-20
0
Sianpis alba (d) Sinapis alba (w)
section
IR [
%]
Where:
(d) – distilled water (w) – interstitial water
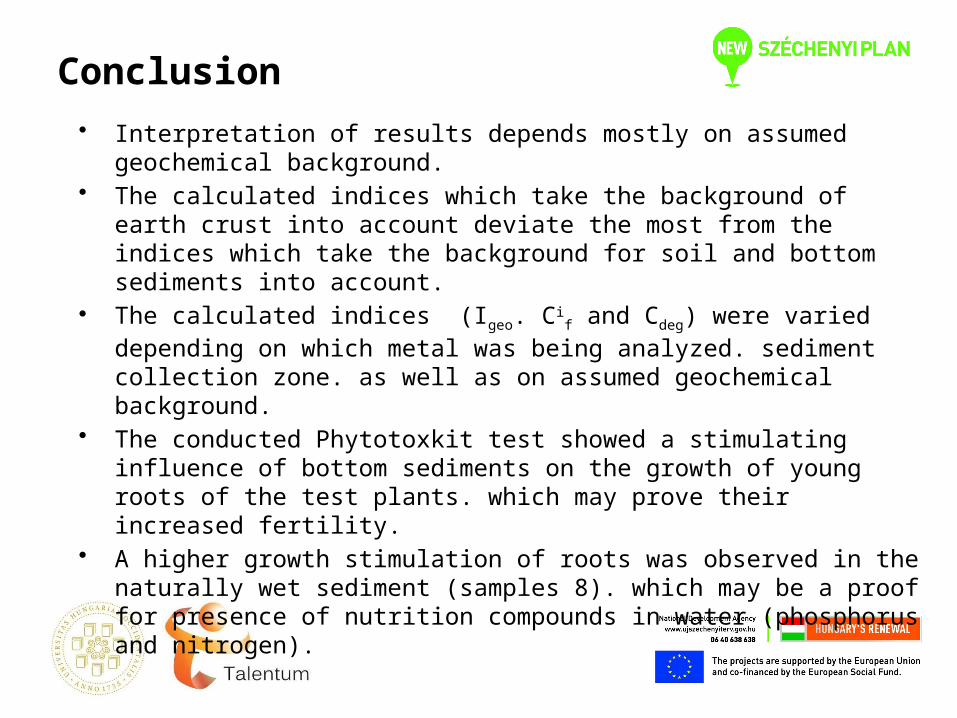
Conclusion • Interpretation of results depends mostly on assumed geochemical
background.• The calculated indices which take the background of earth crust into
account deviate the most from the indices which take the background for soil and bottom sediments into account.
• The calculated indices (Igeo. Cif and Cdeg) were varied depending on which
metal was being analyzed. sediment collection zone. as well as on assumed geochemical background.
• The conducted Phytotoxkit test showed a stimulating influence of bottom sediments on the growth of young roots of the test plants. which may prove their increased fertility.
• A higher growth stimulation of roots was observed in the naturally wet sediment (samples 8). which may be a proof for presence of nutrition compounds in water (phosphorus and nitrogen).
Reference HAKANSON. L. (1980): An ecological risk index for aquatic pollution control. A sedimentological
approach. Water Research. 14: 975-1001.
KABATA-PENDIAS. A. – PENDIAS. H. (1999): Biogeochemia pierwiastkow sladowych. PWN. Warszawa.
LAJCZAK. A. (1995). Studium nad zamulaniem wybranych zbiornikow zaporowych w dorzeczu Wisly. Mon. Komitetu Gospodarki Wodnej PAN. 8. 108 p.
LIS. J. – PASIECZNA. A. (1995b): Atlas geochemiczny Polski. Skala 1:250 000. PIG. Warszawa.
MADEYSKI. M. – TARNAWSKI. M. (2006): Infrastruktura i Ekologia Terenow Wiejskich. Ocena stanu ekologicznego osadow dennych wybranych małych zbiornikow wodnych.. PAN. Krakow. 4/3/2006: 107-116.
MCLENNAN. S.M. (1992). Continental Crust. In Encyclopedia of Earth Sciences. Vol. (1) (W.A. Nierenberg. Ed.). Kluwer. Dortrecht. The Netherlands. 581-592.
MULLER G. (1969): Index of geoaccumulation in sediments of the Rine River. Geojournal. 2: 108-118.
STEPHENS S.R. – ALLOWAY B.J. – PARKER A. – CARTER J.E. – HUDSON M.E. (2001) Changes in the leachability of metals from dredged canal sediments during drying and oxidation. Environ Pollut. 114. 407-413.
Thank you for your attention


![Geotechnics - C1 [Compatibility Mode]](https://img.pdfslide.us/doc/110x75/577d1d351a28ab4e1e8bd247/geotechnics-c1-compatibility-mode.jpg)