Embed Size (px)
Citation preview
Making Sense of Pensions www.xafinity.com
University of Aberdeen Superannuation and Life Assurance Scheme
Member presentation – Longevity / Life expectancy
6 June 2017
Jonathan Seed, Scheme Actuary
Making Sense of Pensions
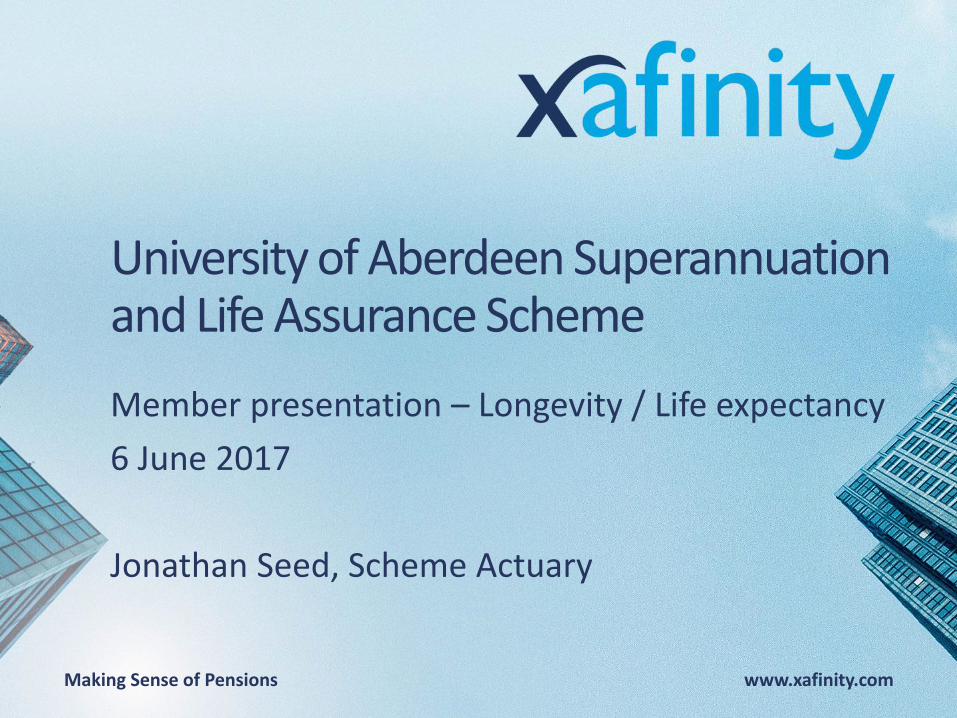
UASLAS - overview
• A pension scheme has two key numbers associated with it:
→ The value of its ‘assets’ – the ‘money’ the scheme holds
→ And the value of its ‘liabilities’ – how much money the scheme needs, in order to pay all the pensions that have been promised
– 2 –
Making Sense of Pensions – 3 –
Last year – we talked about assets, and how they are invested
Making Sense of Pensions
Assets – a recap from last year
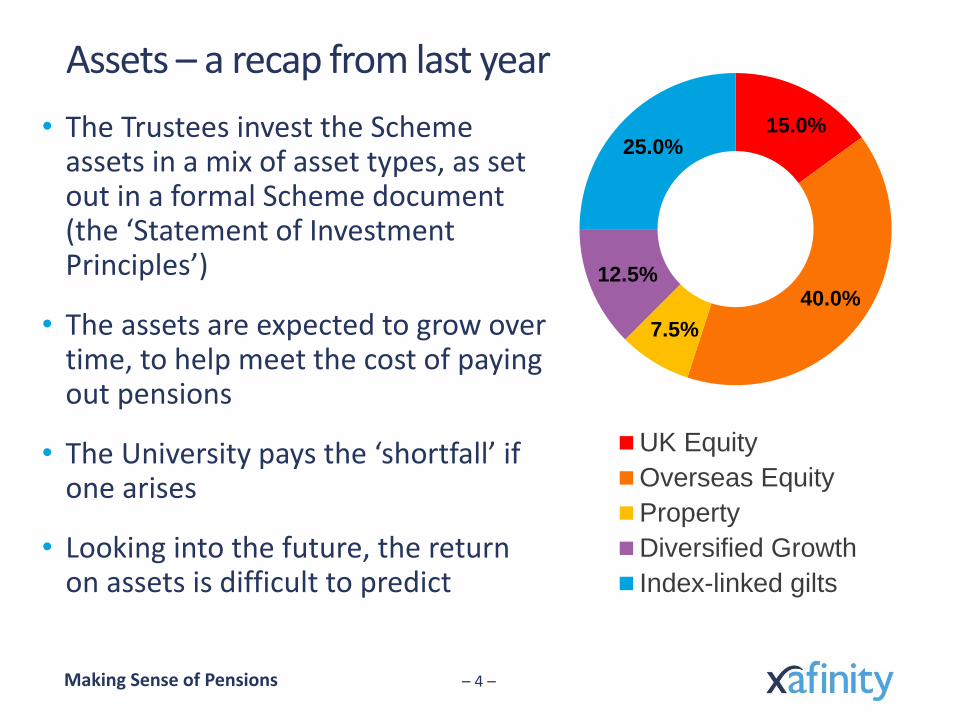
• The Trustees invest the Scheme assets in a mix of asset types, as set out in a formal Scheme document (the ‘Statement of Investment Principles’)
• The assets are expected to grow over time, to help meet the cost of paying out pensions
• The University pays the ‘shortfall’ if one arises
• Looking into the future, the return on assets is difficult to predict
– 4 –
15.0%
40.0%
7.5%
12.5%
25.0%
UK Equity
Overseas Equity
Property
Diversified Growth
Index-linked gilts

Making Sense of Pensions – 5 –
This year – let’s talk about liabilities
Making Sense of Pensions
This year we’re going to talk about the liability side
• Liabilities
→ The amount of money that a pension scheme needs to hold to pay benefits in full to ALL members
• This is actually easier to predict than the future return on assets
• We know with some degree of confidence how much pension has been promised (accrued) to date
• We know roughly when people will retire
• So we can look to the future and (with the help of some assumptions) work out what the Scheme expects to pay out over time
– 6 –

Making Sense of Pensions – 7 –
What are the scheme benefits?
Making Sense of Pensions
Scheme benefits
• The Scheme promises to pay each member the following:
→ A pension for life of 1/80th of final salary for each year of pensionable service up to 1 August 2011 plus 1/80th of revalued average salary for each year of service from 1 August 2011
→ A cash sum at retirement of 3 times this amount
• So the two key factors for estimating the benefits that will be paid are:
→ What will inflation / salary increases be between now and the member’s retirement?
→ How long will the member be paid this pension for? i.e. How long will they live?
– 8 –
Making Sense of Pensions
Scheme benefits – what do they look like?
– 9 –
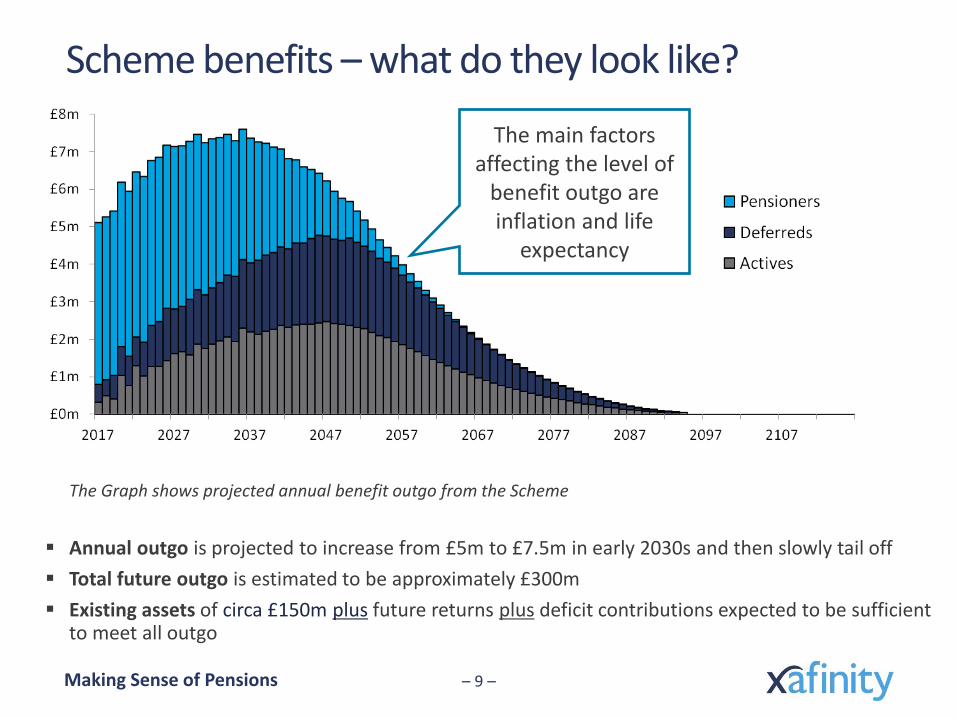
The Graph shows projected annual benefit outgo from the Scheme
Annual outgo is projected to increase from £5m to £7.5m in early 2030s and then slowly tail off
Total future outgo is estimated to be approximately £300m
Existing assets of circa £150m plus future returns plus deficit contributions expected to be sufficient to meet all outgo
The main factors affecting the level of
benefit outgo are inflation and life
expectancy
Making Sense of Pensions – 10 –
Longevity “the length or duration of life” Commonly called ‘life expectancy’
Making Sense of Pensions
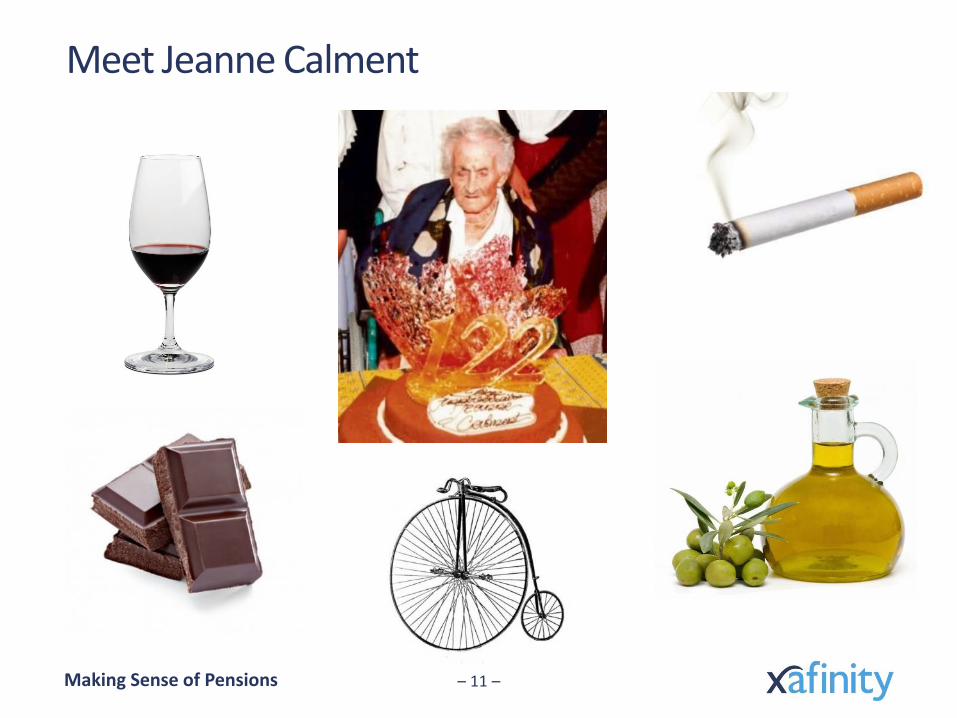
Meet Jeanne Calment
– 11 –
Making Sense of Pensions
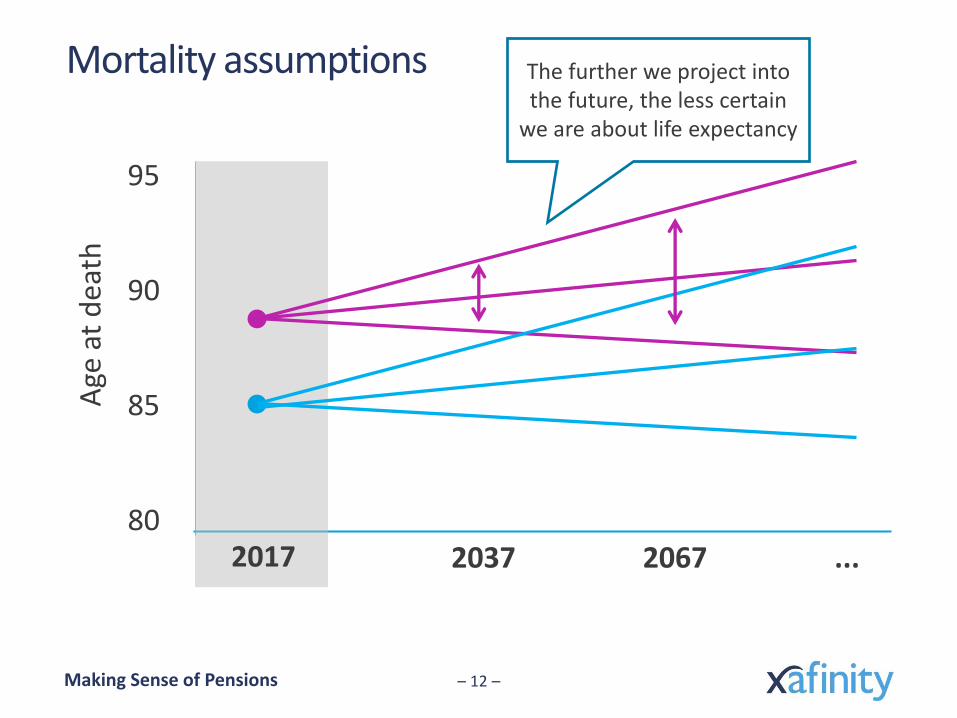
Mortality assumptions
– 12 –
Age
at
dea
th
95
90
85
80 2017 2037 2067 ...
The further we project into the future, the less certain
we are about life expectancy
Making Sense of Pensions
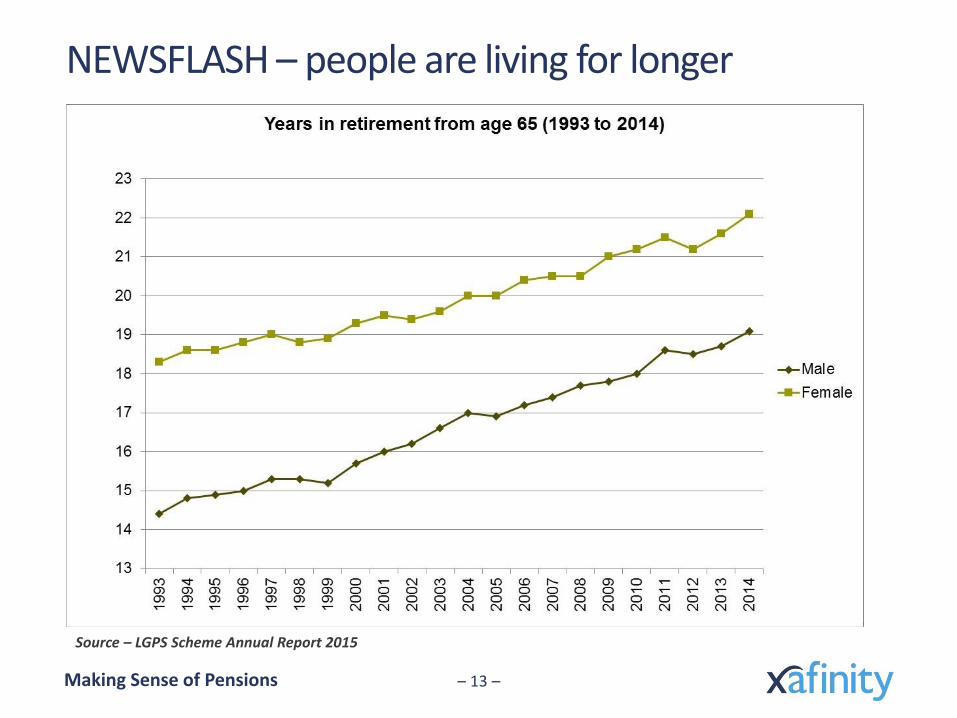
NEWSFLASH – people are living for longer
– 13 –
Source – LGPS Scheme Annual Report 2015
Making Sense of Pensions
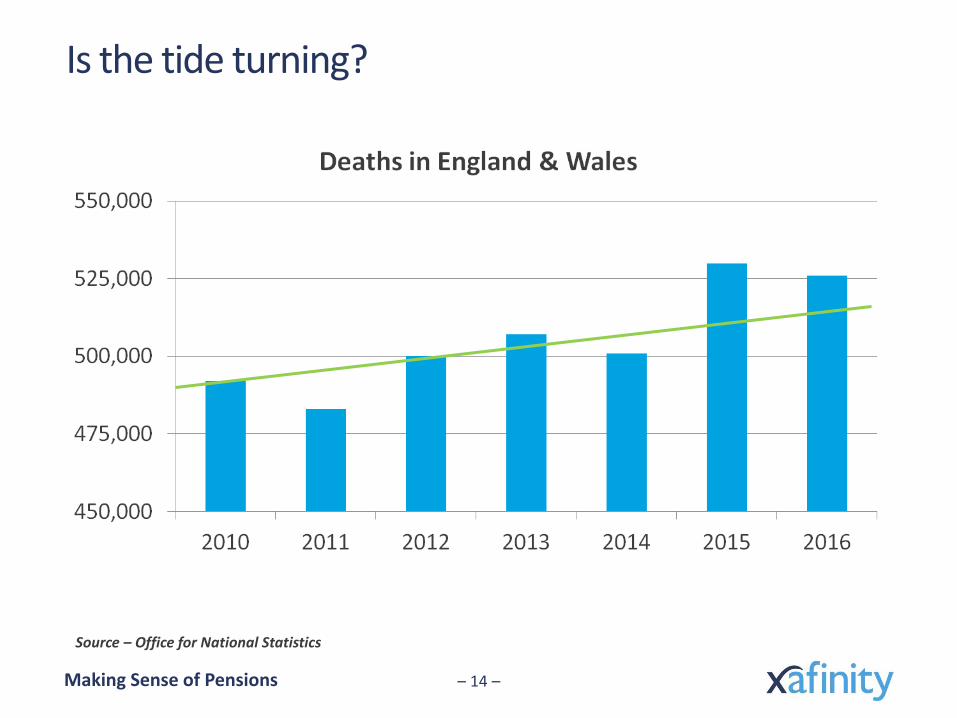
Is the tide turning?
– 14 –
Source – Office for National Statistics
Making Sense of Pensions
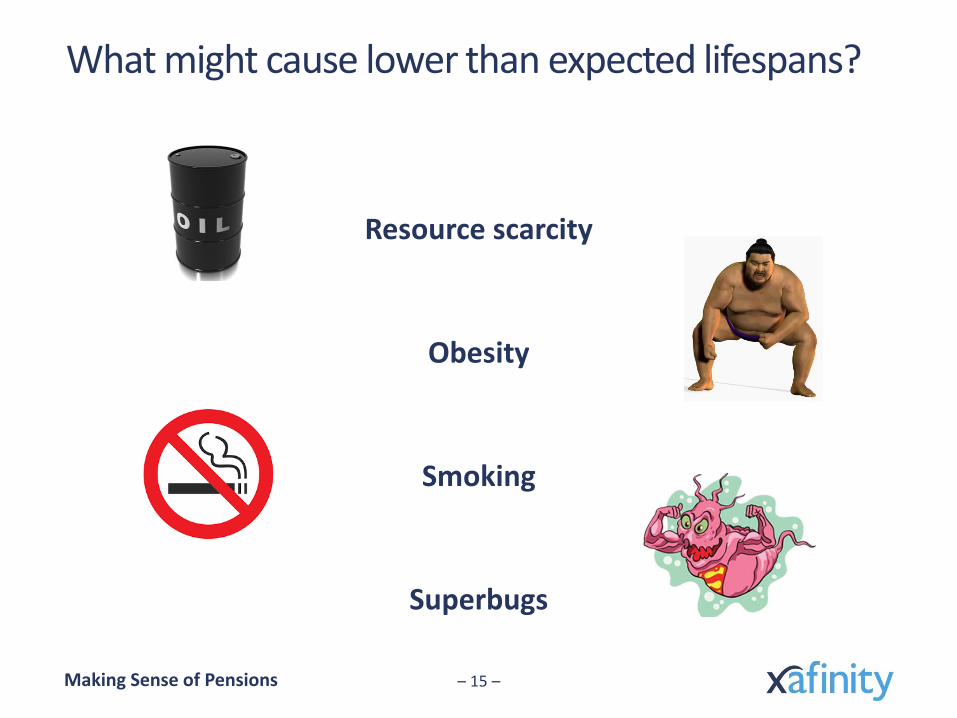
What might cause lower than expected lifespans?
– 15 –
Resource scarcity
Obesity
Smoking
Superbugs
Making Sense of Pensions
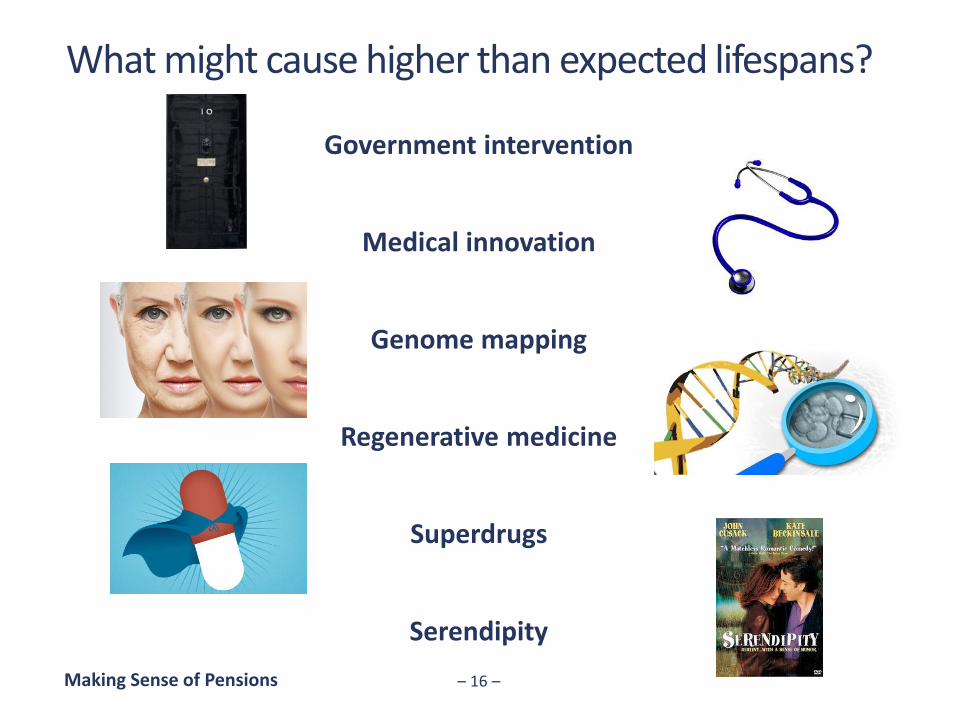
What might cause higher than expected lifespans?
– 16 –
Government intervention
Medical innovation
Genome mapping
Regenerative medicine
Superdrugs
Serendipity

Making Sense of Pensions – 17 –
Thank you – any questions?
Making Sense of Pensions
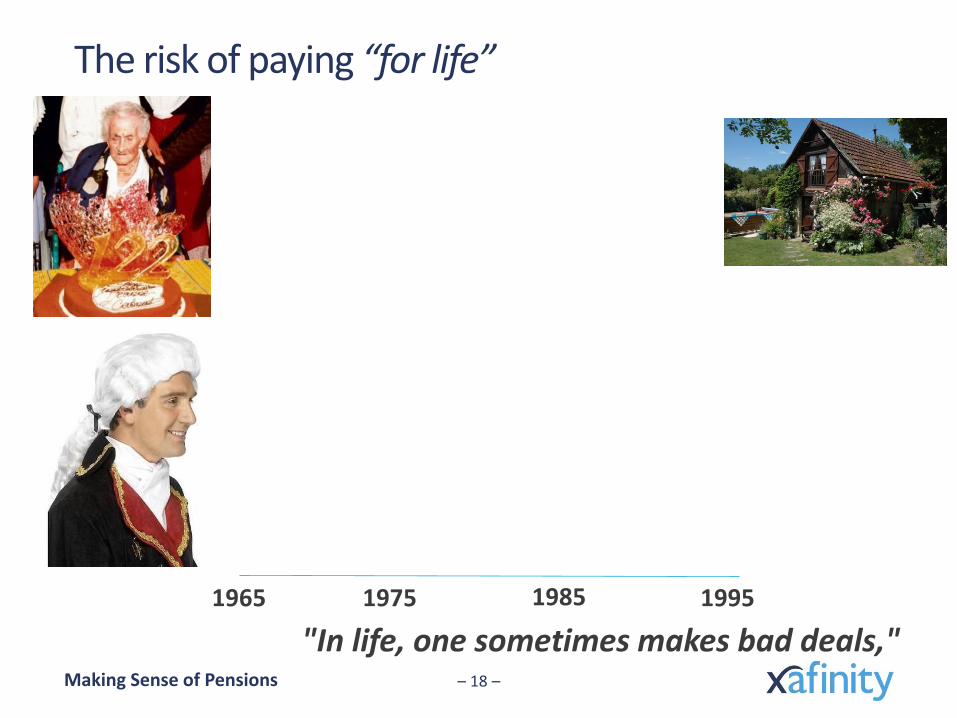
The risk of paying “for life”
– 18 –
"In life, one sometimes makes bad deals,"
1965 1985 1995 1975
Making Sense of Pensions – 19 –
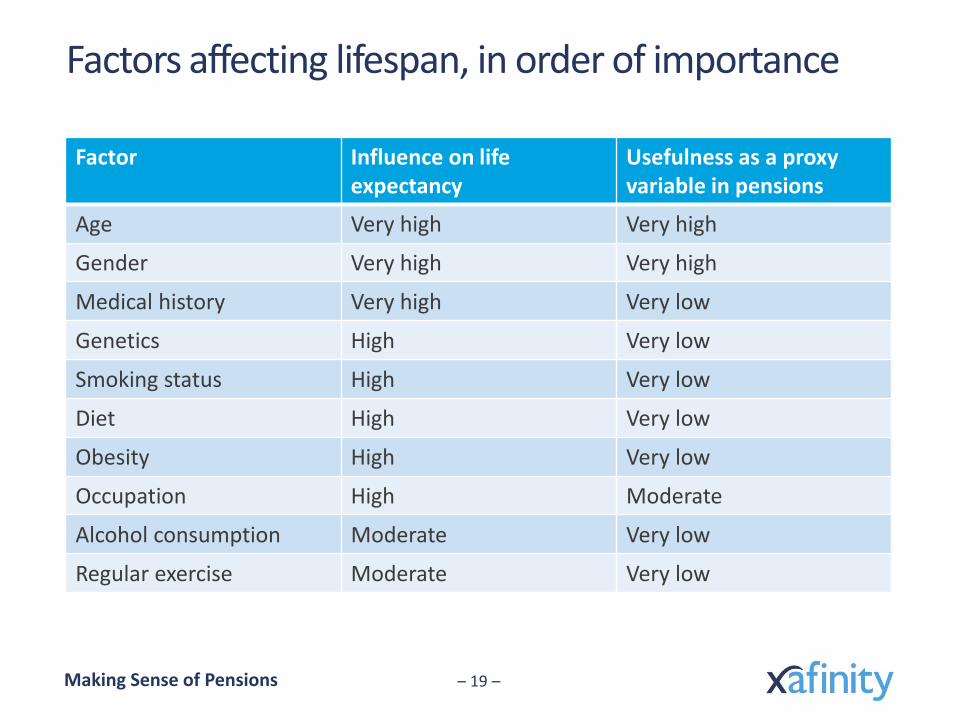
Factors affecting lifespan, in order of importance
Factor Influence on life expectancy
Usefulness as a proxy variable in pensions
Age Very high Very high
Gender Very high Very high
Medical history Very high Very low
Genetics High Very low
Smoking status High Very low
Diet High Very low
Obesity High Very low
Occupation High Moderate
Alcohol consumption Moderate Very low
Regular exercise Moderate Very low
Making Sense of Pensions – 20 –
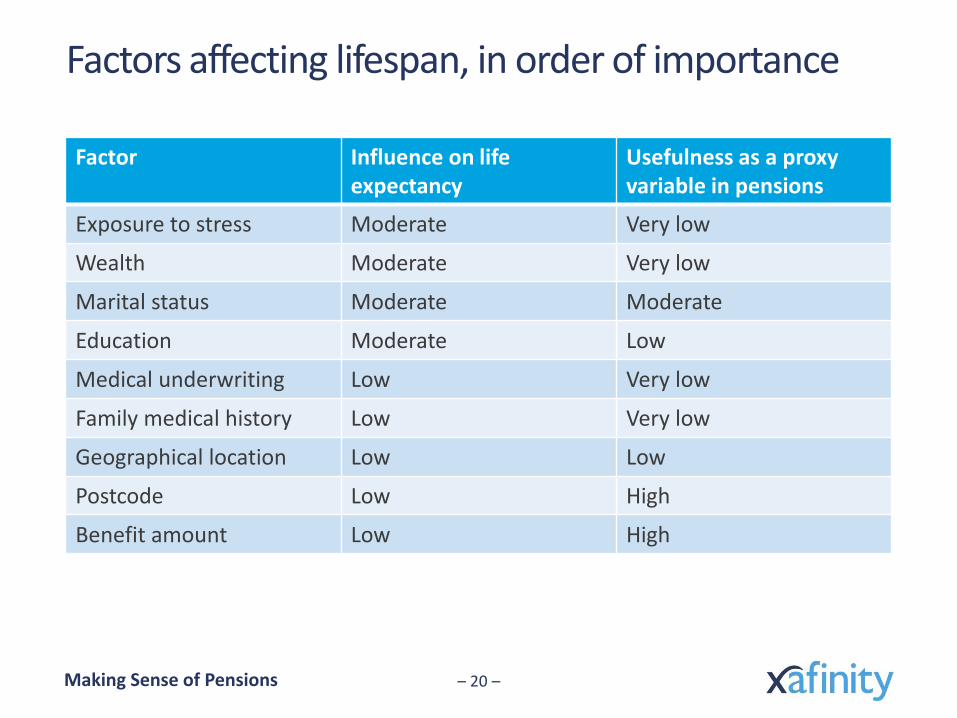
Factors affecting lifespan, in order of importance
Factor Influence on life expectancy
Usefulness as a proxy variable in pensions
Exposure to stress Moderate Very low
Wealth Moderate Very low
Marital status Moderate Moderate
Education Moderate Low
Medical underwriting Low Very low
Family medical history Low Very low
Geographical location Low Low
Postcode Low High
Benefit amount Low High