Embed Size (px)
Citation preview
March 9, 2016
University Lands: Strategizing for the
Long TermMark Houser, Chief Executive Officer
IPAA - Leaders in Industry Luncheon
University Lands Overview
2
Owns and manages surface and mineral
rights of 2.1+ million west Texas acres
History dating back to 1838
First oil discovery in 1923
~20,000 wells drilled to date
9,000 wells currently producing
>1,800 horizontal wells
>200 operators
Surface activities include:
Pipelines and power line easements
Grazing, ranching and hunting
Wind farms
Winery
Airports
Public schools
Water sales
Revenue Benefits the University of Texas
and Texas A&M University System via the
Permanent University Fund
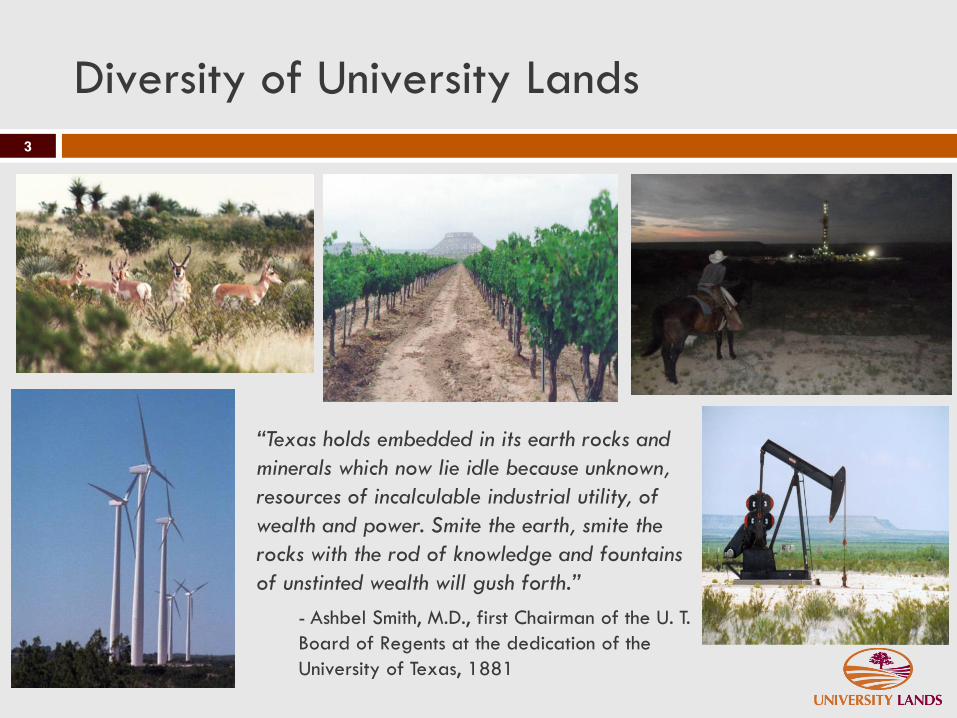
Diversity of University Lands
3
“Texas holds embedded in its earth rocks and
minerals which now lie idle because unknown,
resources of incalculable industrial utility, of
wealth and power. Smite the earth, smite the
rocks with the rod of knowledge and fountains
of unstinted wealth will gush forth.”
- Ashbel Smith, M.D., first Chairman of the U. T.
Board of Regents at the dedication of the
University of Texas, 1881
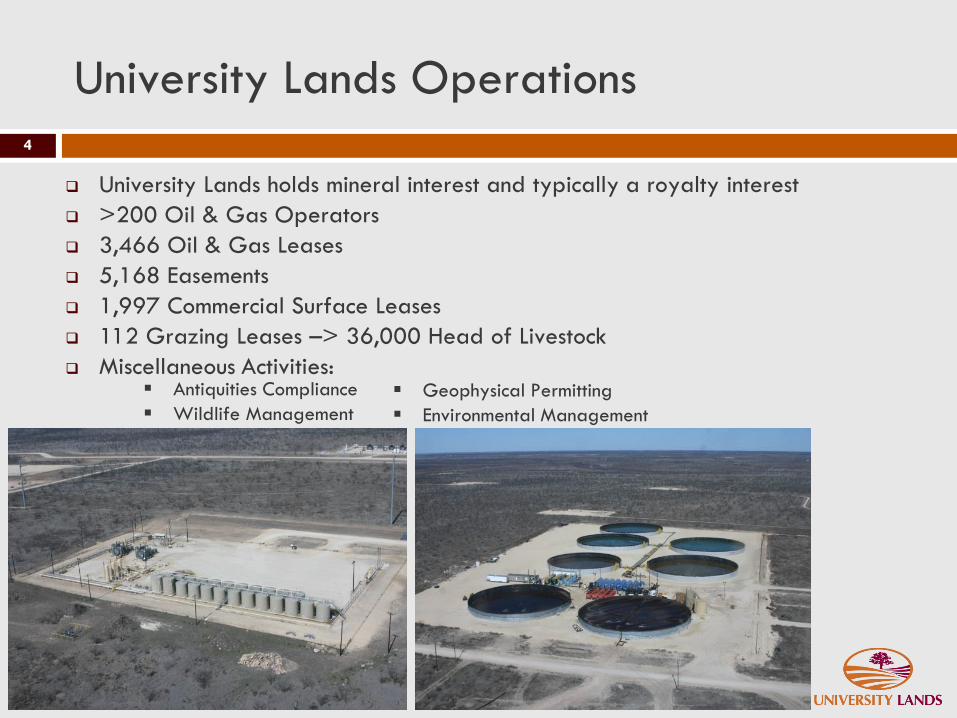
University Lands Operations
4
University Lands holds mineral interest and typically a royalty interest
>200 Oil & Gas Operators
3,466 Oil & Gas Leases
5,168 Easements
1,997 Commercial Surface Leases
112 Grazing Leases –> 36,000 Head of Livestock
Miscellaneous Activities:▪ Geophysical Permitting
▪ Environmental Management
▪ Antiquities Compliance
▪ Wildlife Management
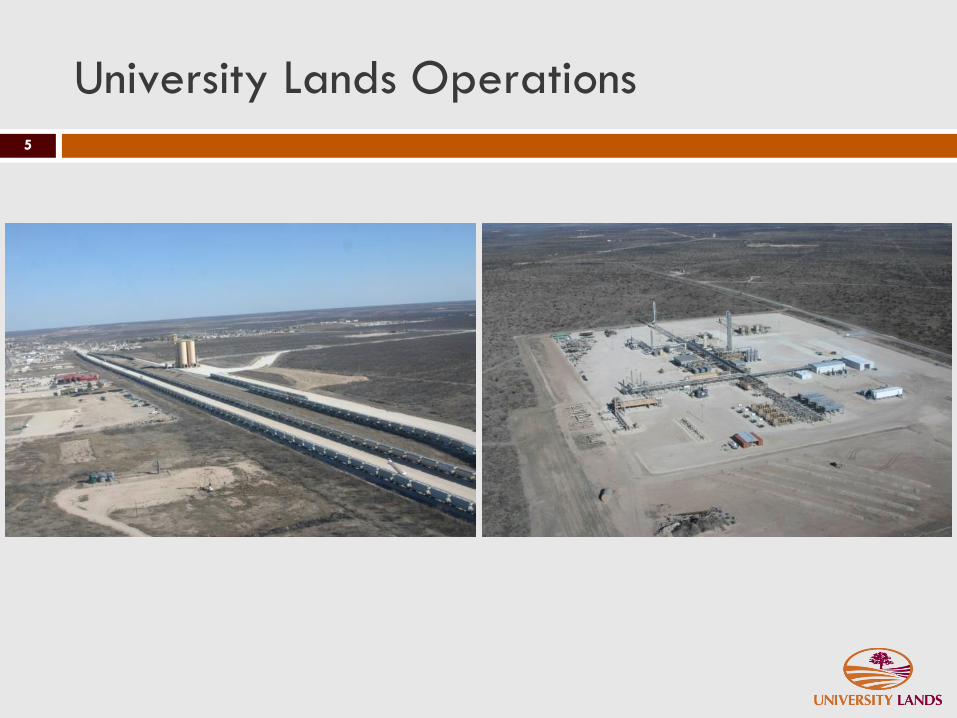
University Lands Operations
5

6
What’s all this
talk about a
wall?
There’s already
one there!!
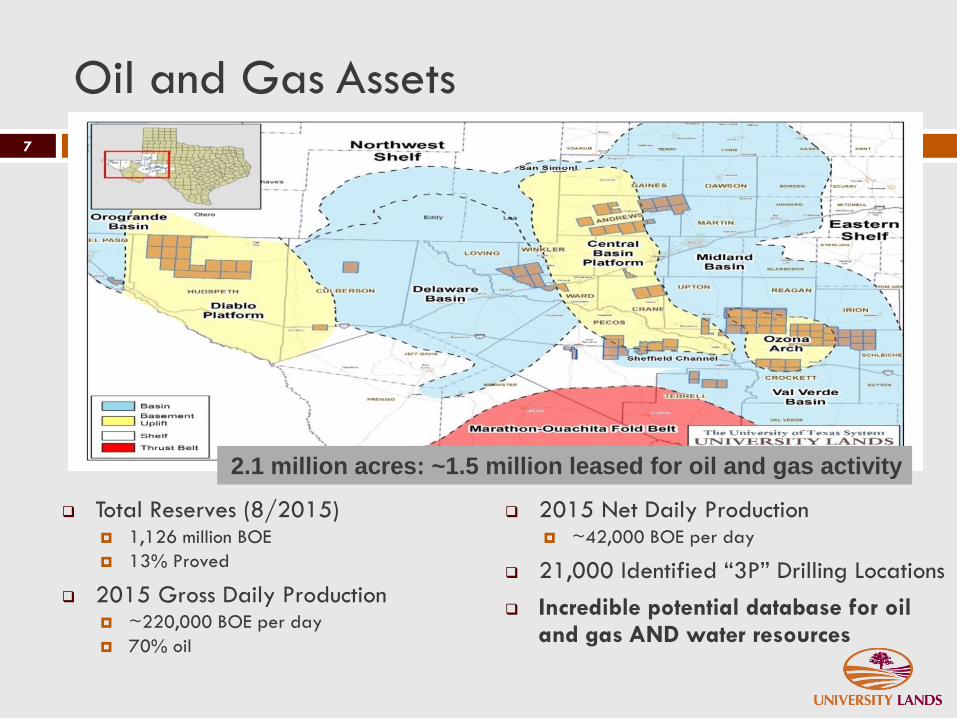
Oil and Gas Assets
7
Total Reserves (8/2015) 1,126 million BOE
13% Proved
2015 Gross Daily Production ~220,000 BOE per day
70% oil
2015 Net Daily Production ~42,000 BOE per day
21,000 Identified “3P” Drilling Locations
Incredible potential database for oil and gas AND water resources
2.1 million acres: ~1.5 million leased for oil and gas activity
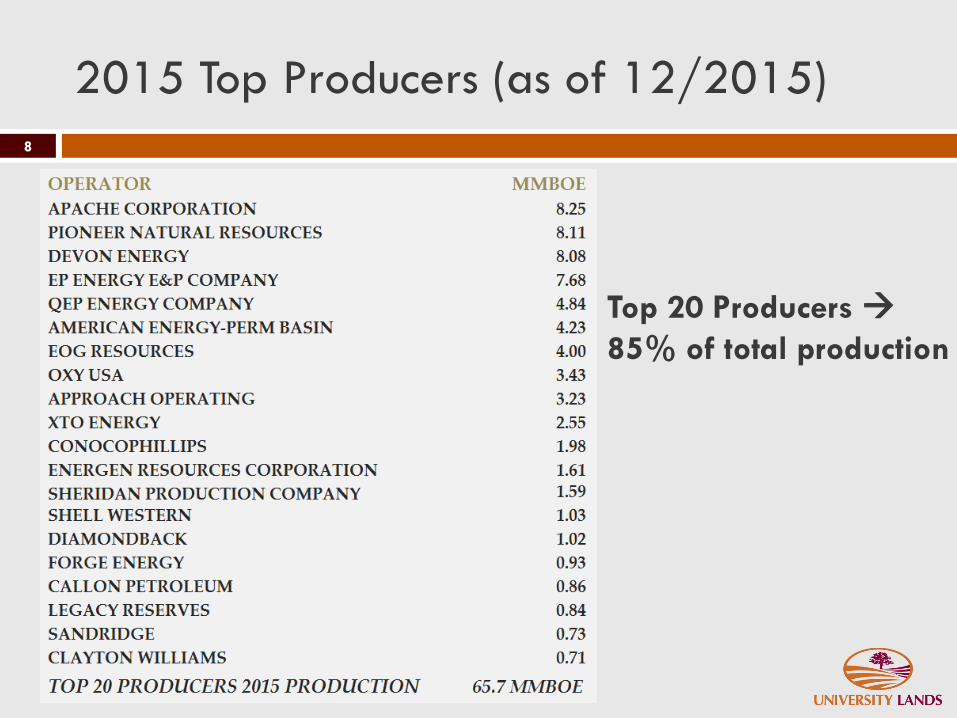
2015 Top Producers (as of 12/2015)
Top 20 Producers
85% of total production
8
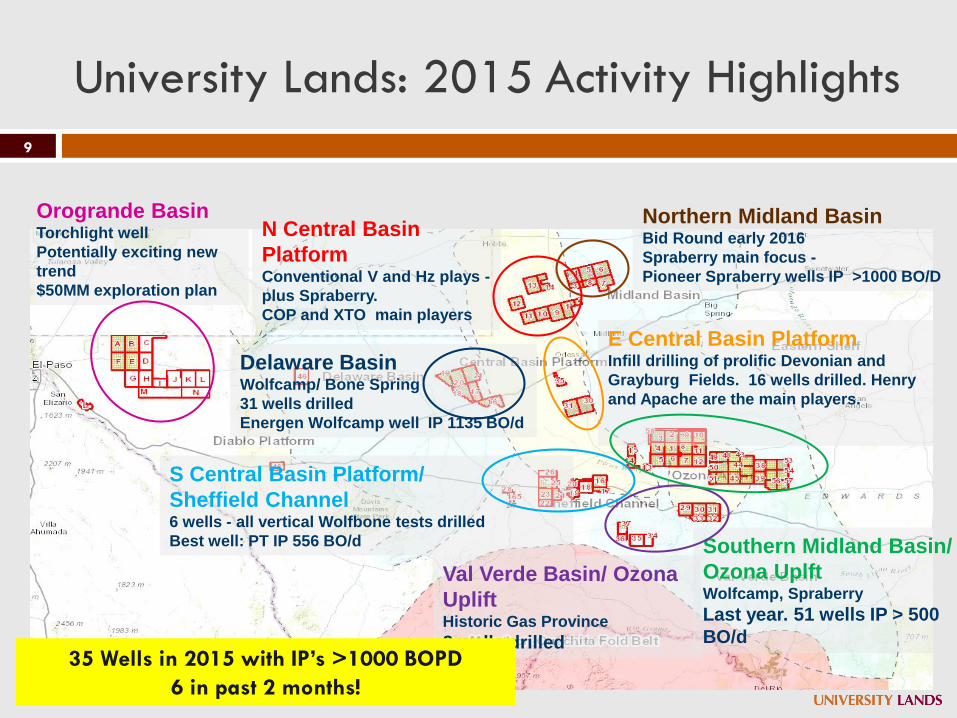
Orogrande BasinTorchlight well
Potentially exciting new
trend
$50MM exploration plan
Delaware BasinWolfcamp/ Bone Spring
31 wells drilled
Energen Wolfcamp well IP 1135 BO/d
Northern Midland BasinBid Round early 2016
Spraberry main focus -
Pioneer Spraberry wells IP >1000 BO/D
N Central Basin
PlatformConventional V and Hz plays -
plus Spraberry.
COP and XTO main players
Val Verde Basin/ Ozona
UpliftHistoric Gas Province
2 wells drilled
Southern Midland Basin/
Ozona UplftWolfcamp, Spraberry
Last year. 51 wells IP > 500
BO/d
E Central Basin PlatformInfill drilling of prolific Devonian and
Grayburg Fields. 16 wells drilled. Henry
and Apache are the main players.
S Central Basin Platform/
Sheffield Channel6 wells - all vertical Wolfbone tests drilled
Best well: PT IP 556 BO/d
University Lands: 2015 Activity Highlights
9
35 Wells in 2015 with IP’s >1000 BOPD
6 in past 2 months!
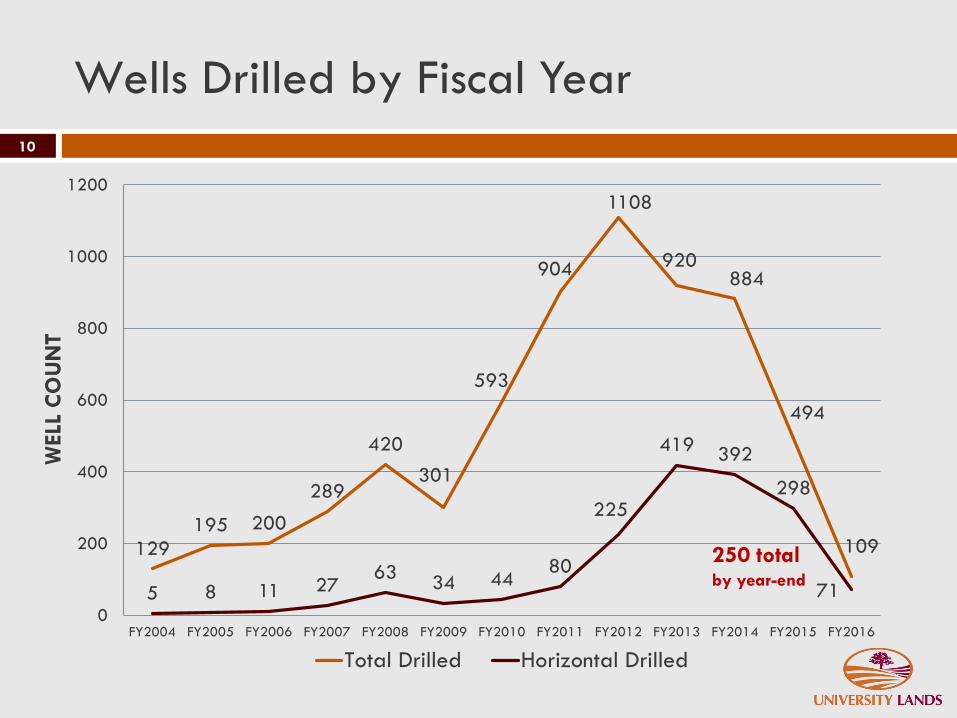
Wells Drilled by Fiscal Year
10
129
195 200
289
420
301
593
904
1108
920884
494
109
5 8 11 2763
34 4480
225
419392
298
71
0
200
400
600
800
1000
1200
FY2004 FY2005 FY2006 FY2007 FY2008 FY2009 FY2010 FY2011 FY2012 FY2013 FY2014 FY2015 FY2016
WELL
CO
UN
T
Total Drilled Horizontal Drilled
250 total by year-end
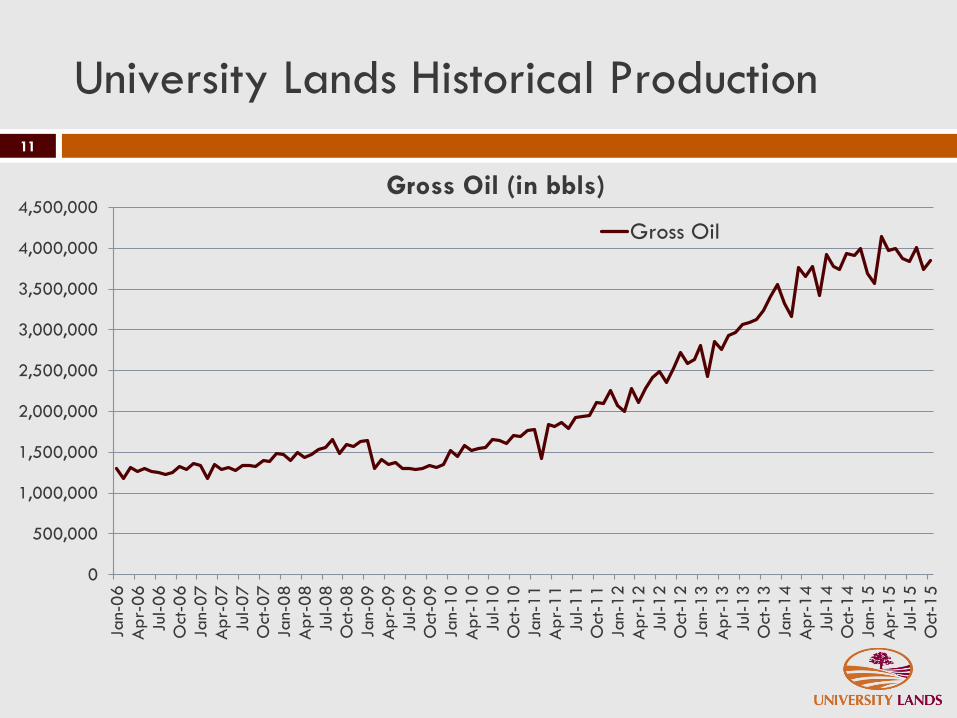
University Lands Historical Production
11
0
500,000
1,000,000
1,500,000
2,000,000
2,500,000
3,000,000
3,500,000
4,000,000
4,500,000
Jan-
06
Ap
r-06
Jul-0
6
Oct
-06
Jan-
07
Ap
r-07
Jul-0
7
Oct
-07
Jan-
08
Ap
r-08
Jul-0
8
Oct
-08
Jan-
09
Ap
r-09
Jul-0
9
Oct
-09
Jan-
10
Ap
r-10
Jul-1
0
Oct
-10
Jan-
11
Ap
r-11
Jul-1
1
Oct
-11
Jan-
12
Ap
r-12
Jul-1
2
Oct
-12
Jan-
13
Ap
r-13
Jul-1
3
Oct
-13
Jan-
14
Ap
r-14
Jul-1
4
Oct
-14
Jan-
15
Ap
r-15
Jul-1
5
Oct
-15
Gross Oil (in bbls)
Gross Oil
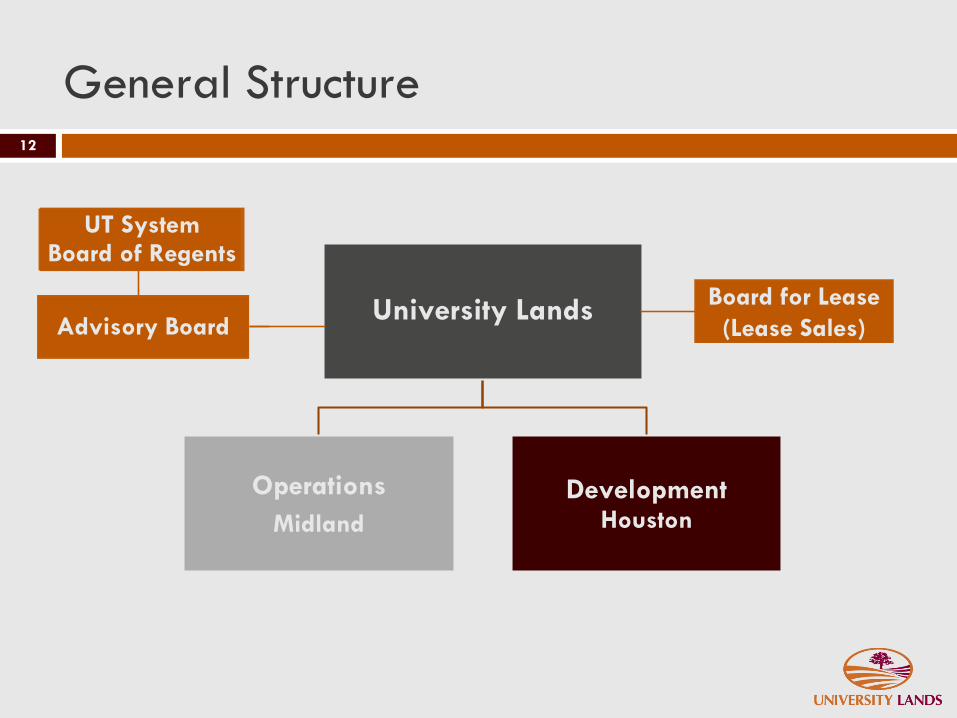
General Structure
University Lands
Operations
Midland
DevelopmentHouston
12
Board for Lease
Board for Lease
(Lease Sales)Advisory Board
UT SystemBoard of Regents
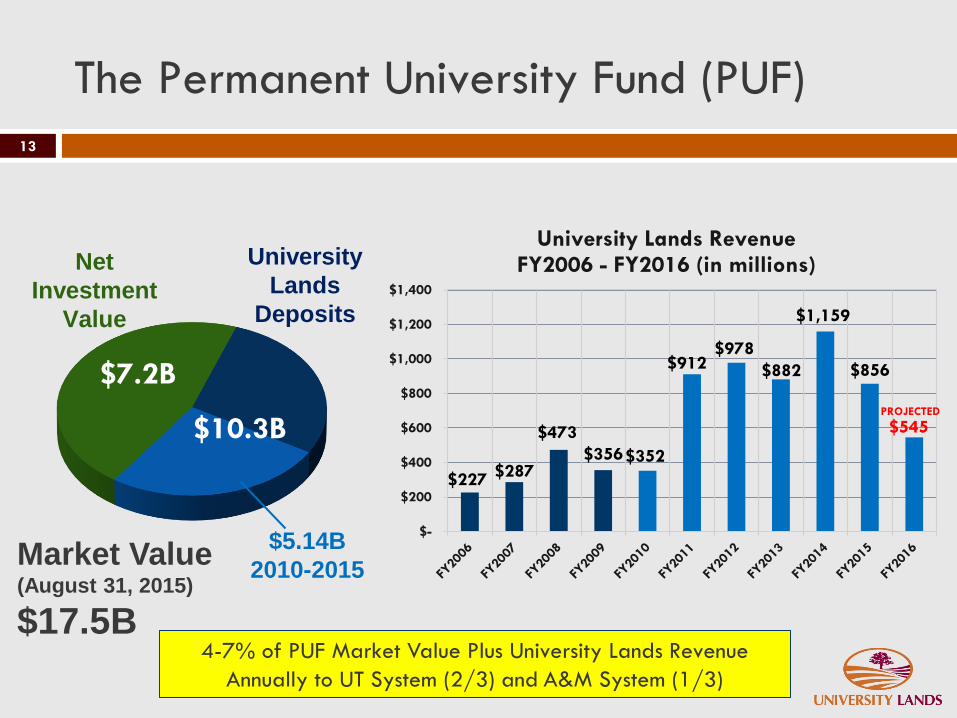
The Permanent University Fund (PUF)
University
Lands
Deposits
Net
Investment
Value
$7.2B
$10.3B
$5.14B
2010-2015Market Value (August 31, 2015)
$17.5B
13
$227$287
$473
$356$352
$912$978
$882
$1,159
$856
$545
$-
$200
$400
$600
$800
$1,000
$1,200
$1,400
University Lands Revenue FY2006 - FY2016 (in millions)
PROJECTED
4-7% of PUF Market Value Plus University Lands Revenue
Annually to UT System (2/3) and A&M System (1/3)
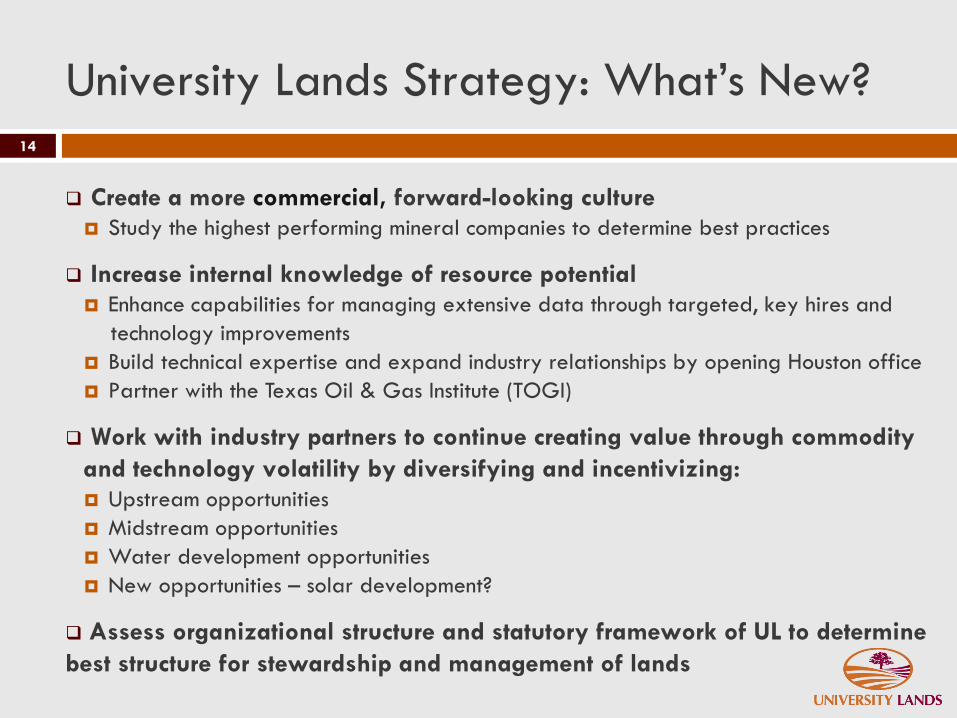
University Lands Strategy: What’s New?
Create a more commercial, forward-looking culture
Study the highest performing mineral companies to determine best practices
Increase internal knowledge of resource potential
Enhance capabilities for managing extensive data through targeted, key hires and
technology improvements
Build technical expertise and expand industry relationships by opening Houston office
Partner with the Texas Oil & Gas Institute (TOGI)
Work with industry partners to continue creating value through commodity
and technology volatility by diversifying and incentivizing:
Upstream opportunities
Midstream opportunities
Water development opportunities
New opportunities – solar development?
Assess organizational structure and statutory framework of UL to determine
best structure for stewardship and management of lands
14
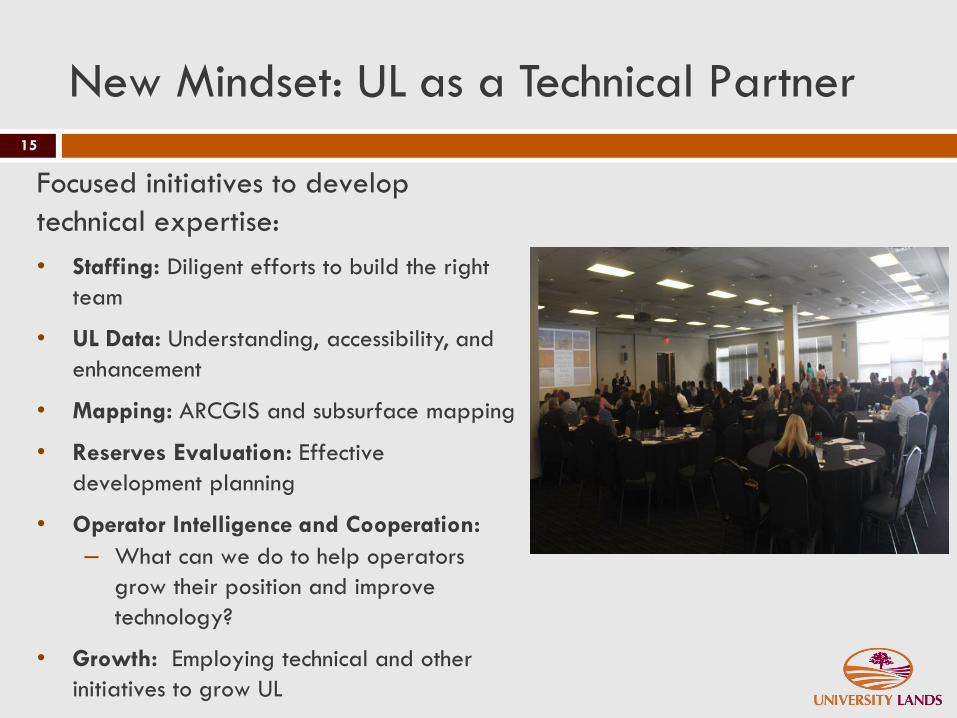
New Mindset: UL as a Technical Partner
Focused initiatives to develop
technical expertise:
• Staffing: Diligent efforts to build the right
team
• UL Data: Understanding, accessibility, and
enhancement
• Mapping: ARCGIS and subsurface mapping
• Reserves Evaluation: Effective
development planning
• Operator Intelligence and Cooperation:
– What can we do to help operators
grow their position and improve
technology?
• Growth: Employing technical and other
initiatives to grow UL
15
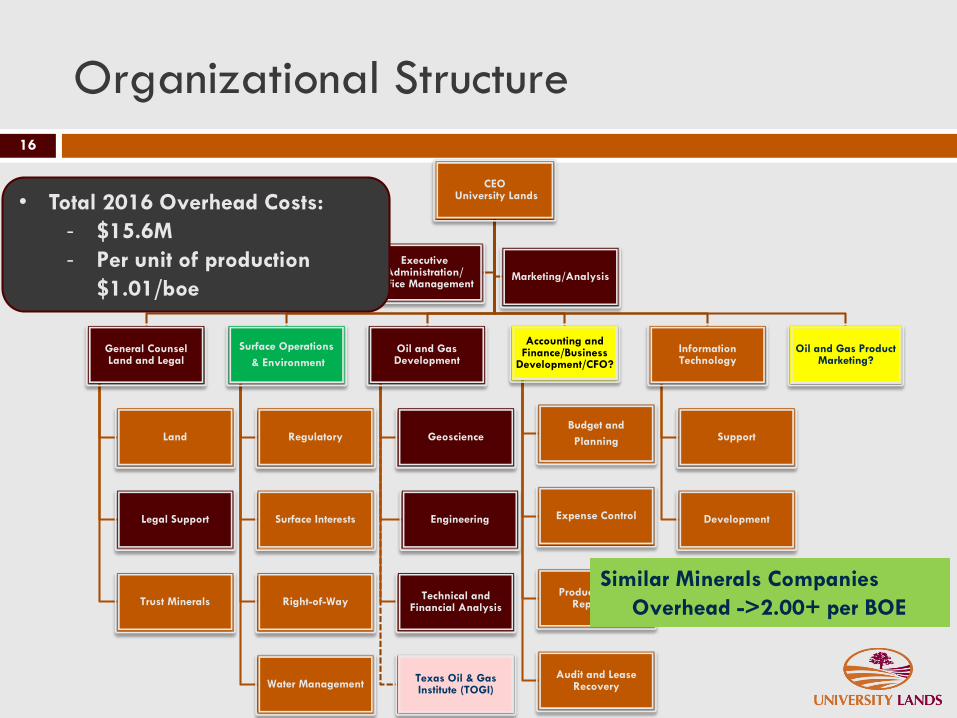
Organizational Structure
16
CEOUniversity Lands
General CounselLand and Legal
Land
Legal Support
Trust Minerals
Surface Operations
& Environment
Regulatory
Surface Interests
Right-of-Way
Water Management
Oil and Gas Development
Geoscience
Engineering
Technical and Financial Analysis
Texas Oil & Gas Institute (TOGI)
Accounting and Finance/Business
Development/CFO?
Budget and
Planning
Expense Control
Production and Reporting
Audit and Lease Recovery
Information Technology
Support
Development
Oil and Gas Product Marketing?
Executive Administration/
Office ManagementMarketing/Analysis
• Total 2016 Overhead Costs:
- $15.6M
- Per unit of production
$1.01/boe
Similar Minerals Companies
Overhead ->2.00+ per BOE
Oil Market Uncertainty17
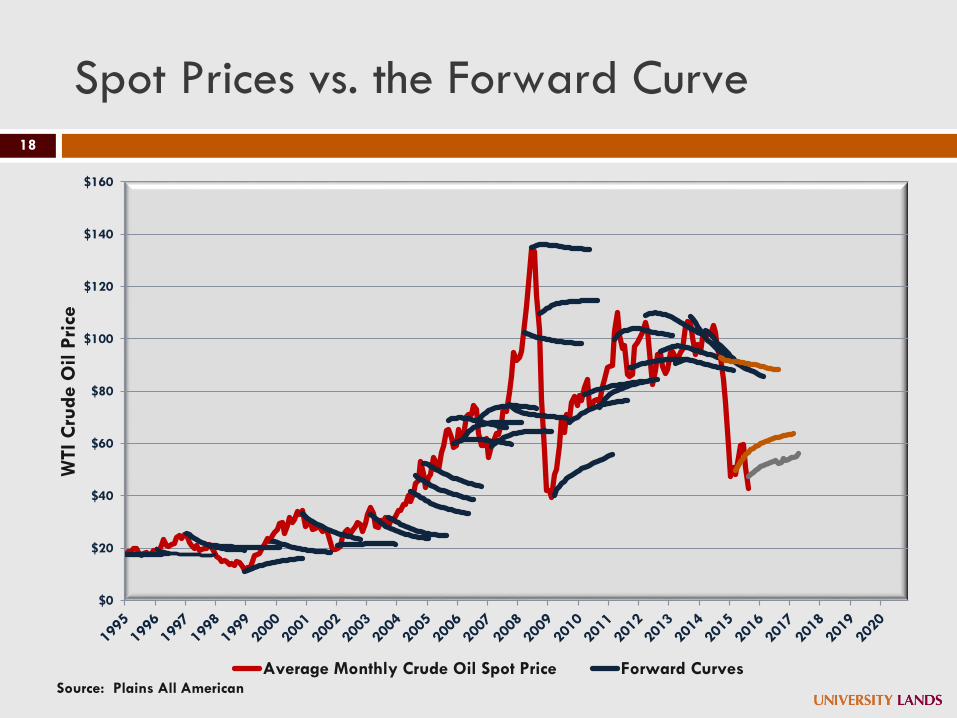
Spot Prices vs. the Forward Curve
$0
$20
$40
$60
$80
$100
$120
$140
$160
WTI
Cru
de O
il P
rice
Average Monthly Crude Oil Spot Price Forward CurvesSource: Plains All American
18
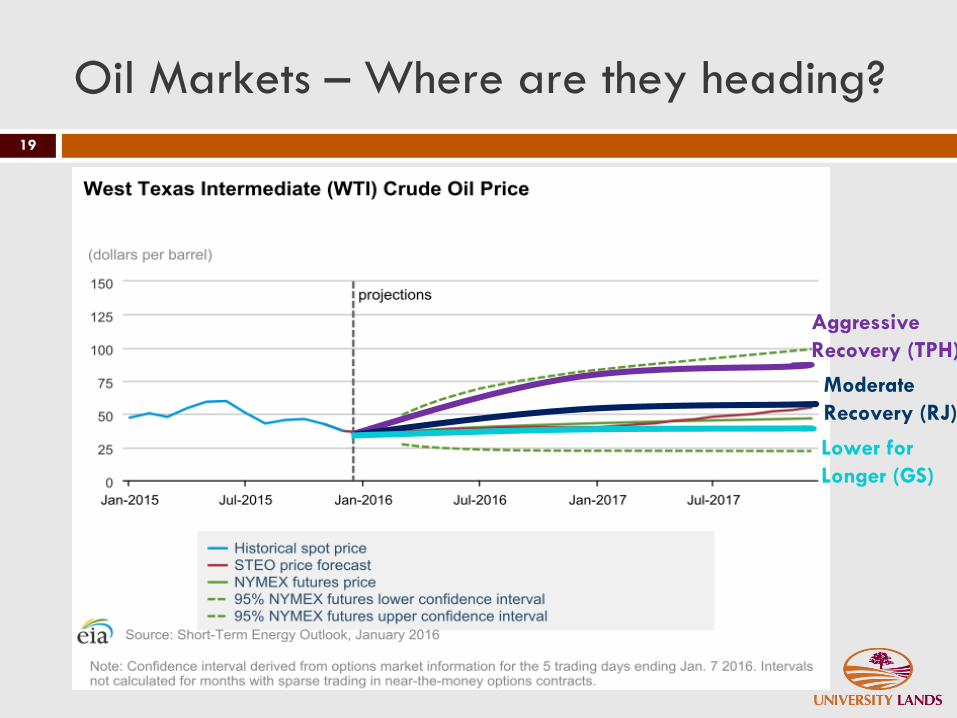
Oil Markets – Where are they heading?
19
Aggressive
Recovery (TPH)
Moderate
Recovery (RJ)
Lower for
Longer (GS)
© 2013 Raymond James & Associates, Inc., member New York Stock Exchange/SIPC. All rights reserved.
International Headquarters: The Raymond James Financial Center | 880 Carillon Parkway | St. Petersburg, Florida 33716 | 800 -248-8863
U.S. ResearchPublished by Raymond James & Associates
U.S. Research
© 2015 Raymond James & Associates, Inc., member New York Stock Exchange/SIPC. All rights reserved.
International Headquarters: The Raymond James Financial Center | 880 Carillon Parkway | St. Petersburg, Florida 33716 | 800 -248-8863
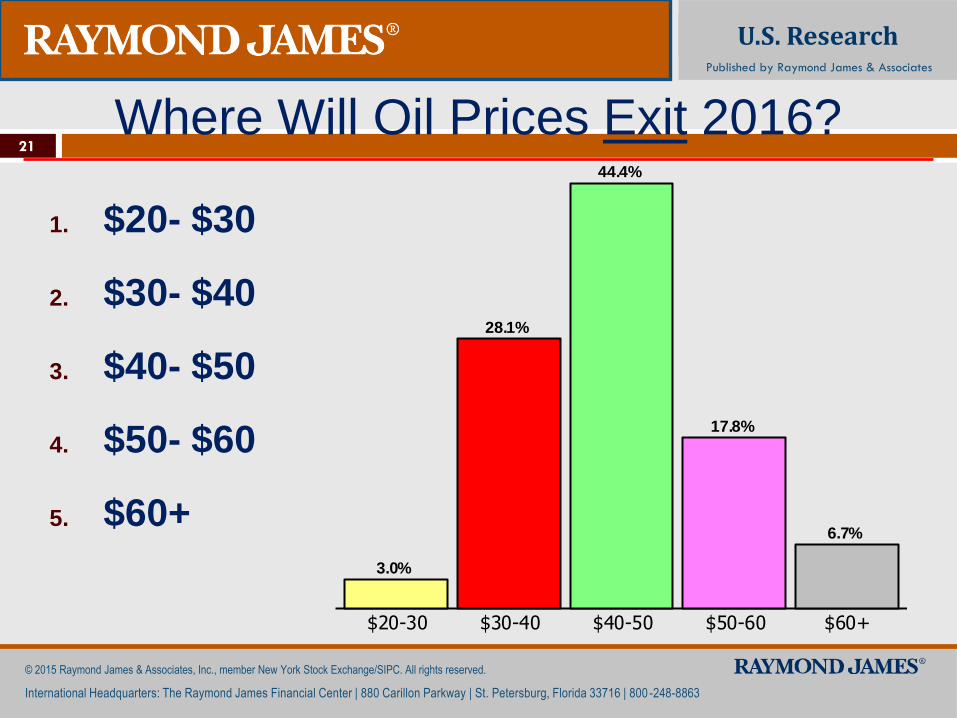
1. $20- $30
2. $30- $40
3. $40- $50
4. $50- $60
5. $60+
Where Will Oil Prices Exit 2016?
$20-30 $30-40 $40-50 $50-60 $60+
3.0%
28.1%
44.4%
17.8%
6.7%
21
© 2013 Raymond James & Associates, Inc., member New York Stock Exchange/SIPC. All rights reserved.
International Headquarters: The Raymond James Financial Center | 880 Carillon Parkway | St. Petersburg, Florida 33716 | 800 -248-8863
22
U.S. ResearchPublished by Raymond James & Associates
U.S. Research
© 2015 Raymond James & Associates, Inc., member New York Stock Exchange/SIPC. All rights reserved.
International Headquarters: The Raymond James Financial Center | 880 Carillon Parkway | St. Petersburg, Florida 33716 | 800 -248-8863
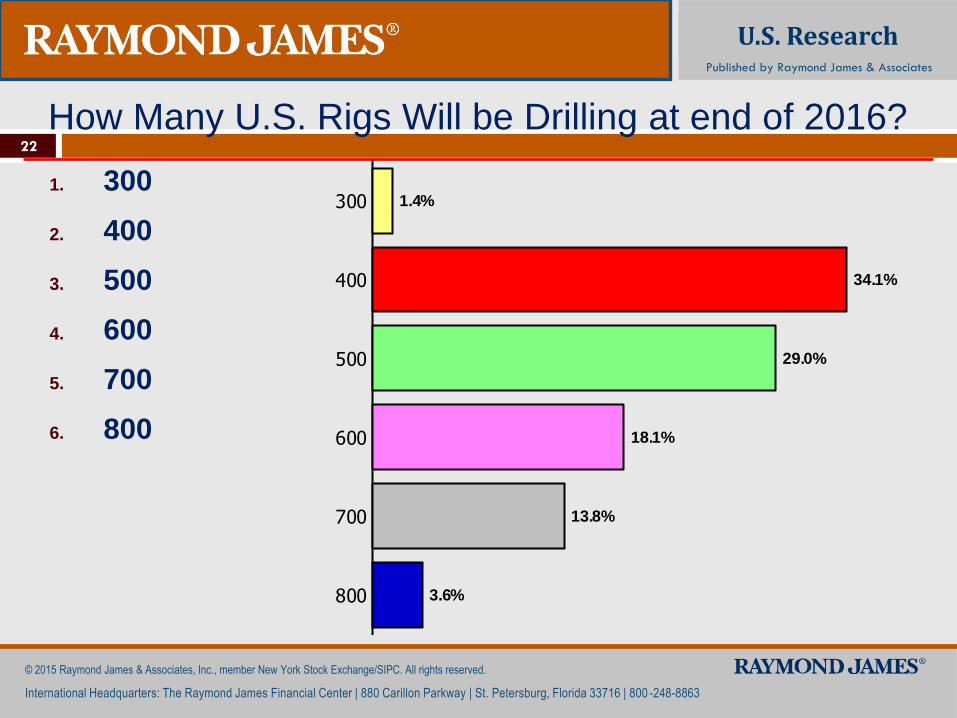
1. 300
2. 400
3. 500
4. 600
5. 700
6. 800
How Many U.S. Rigs Will be Drilling at end of 2016?
300
400
500
600
700
800
1.4%
34.1%
29.0%
18.1%
13.8%
3.6%
© 2013 Raymond James & Associates, Inc., member New York Stock Exchange/SIPC. All rights reserved.
International Headquarters: The Raymond James Financial Center | 880 Carillon Parkway | St. Petersburg, Florida 33716 | 800 -248-8863
U.S. ResearchPublished by Raymond James & Associates
U.S. Research
© 2015 Raymond James & Associates, Inc., member New York Stock Exchange/SIPC. All rights reserved.
International Headquarters: The Raymond James Financial Center | 880 Carillon Parkway | St. Petersburg, Florida 33716 | 800 -248-8863
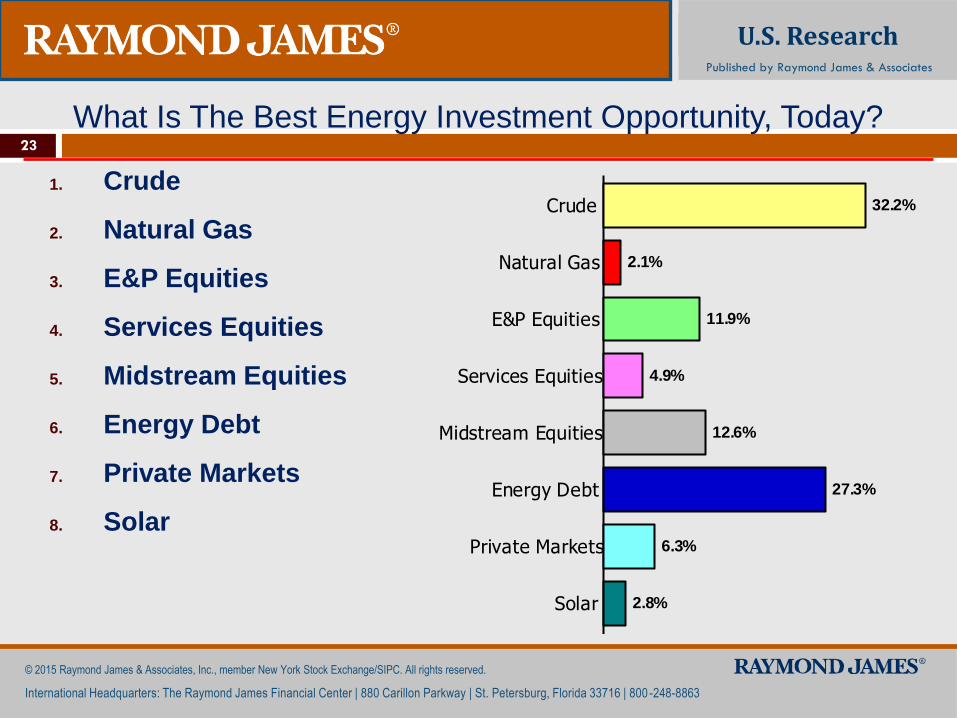
1. Crude
2. Natural Gas
3. E&P Equities
4. Services Equities
5. Midstream Equities
6. Energy Debt
7. Private Markets
8. Solar
What Is The Best Energy Investment Opportunity, Today?
Crude
Natural Gas
E&P Equities
Services Equities
Midstream Equities
Energy Debt
Private Markets
Solar
32.2%
2.1%
11.9%
4.9%
12.6%
27.3%
6.3%
2.8%
23
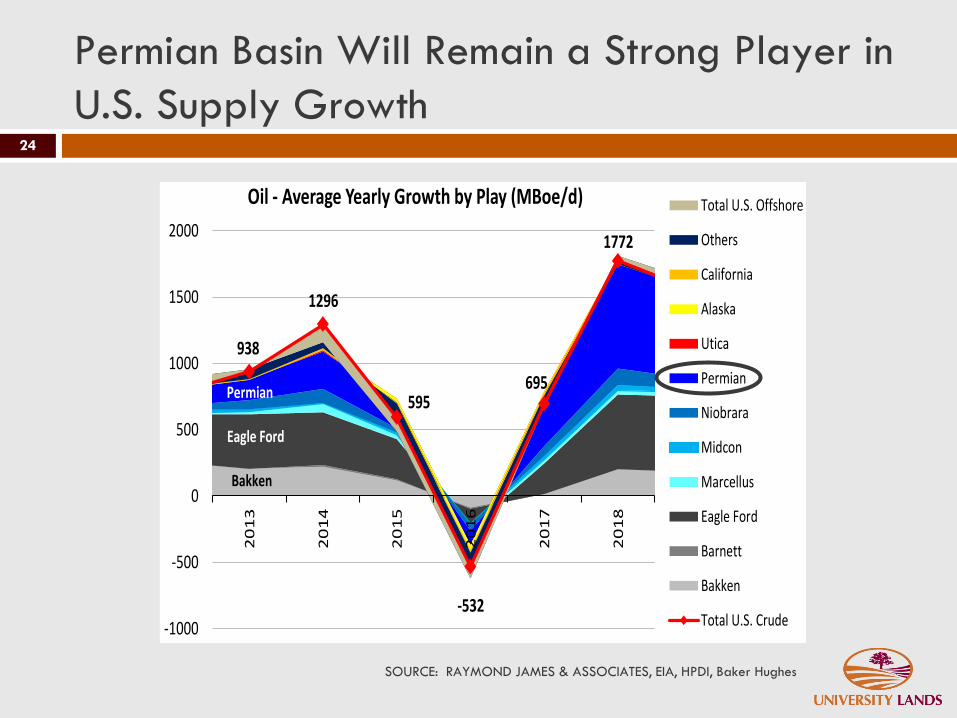
938
1296
595
-532
695
1772
-1000
-500
0
500
1000
1500
20002
01
3
20
14
20
15
20
16
20
17
20
18
Oil - Average Yearly Growth by Play (MBoe/d) Total U.S. Offshore
Others
California
Alaska
Utica
Permian
Niobrara
Midcon
Marcellus
Eagle Ford
Barnett
Bakken
Total U.S. Crude
Bakken
Eagle Ford
Permian
Permian Basin Will Remain a Strong Player in
U.S. Supply Growth
SOURCE: RAYMOND JAMES & ASSOCIATES, EIA, HPDI, Baker Hughes
24
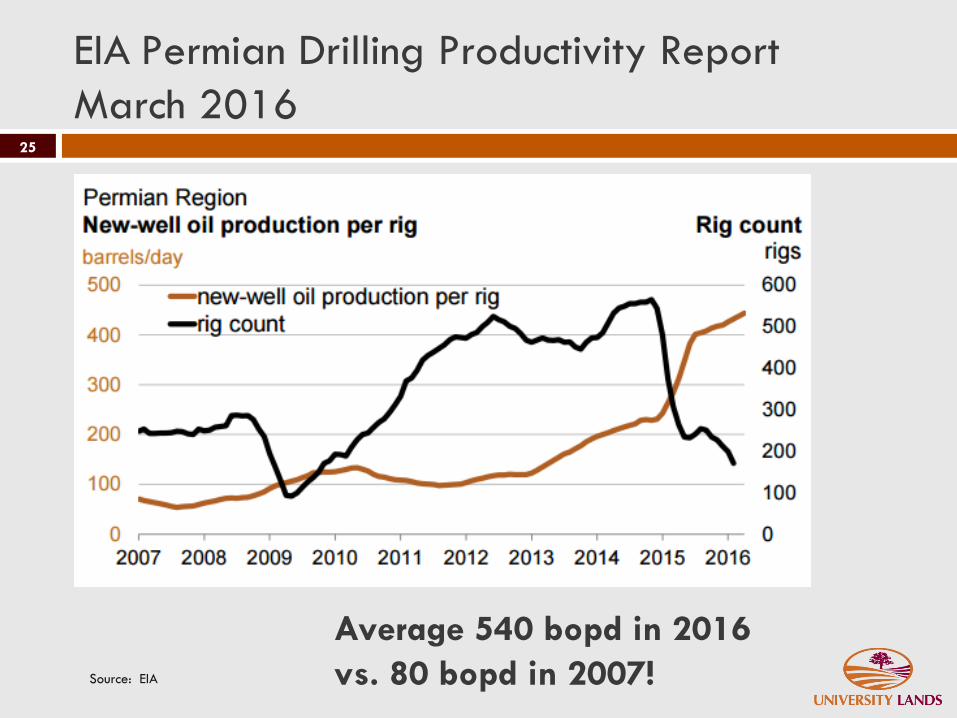
EIA Permian Drilling Productivity Report
March 201625
Source: EIA
Average 540 bopd in 2016
vs. 80 bopd in 2007!
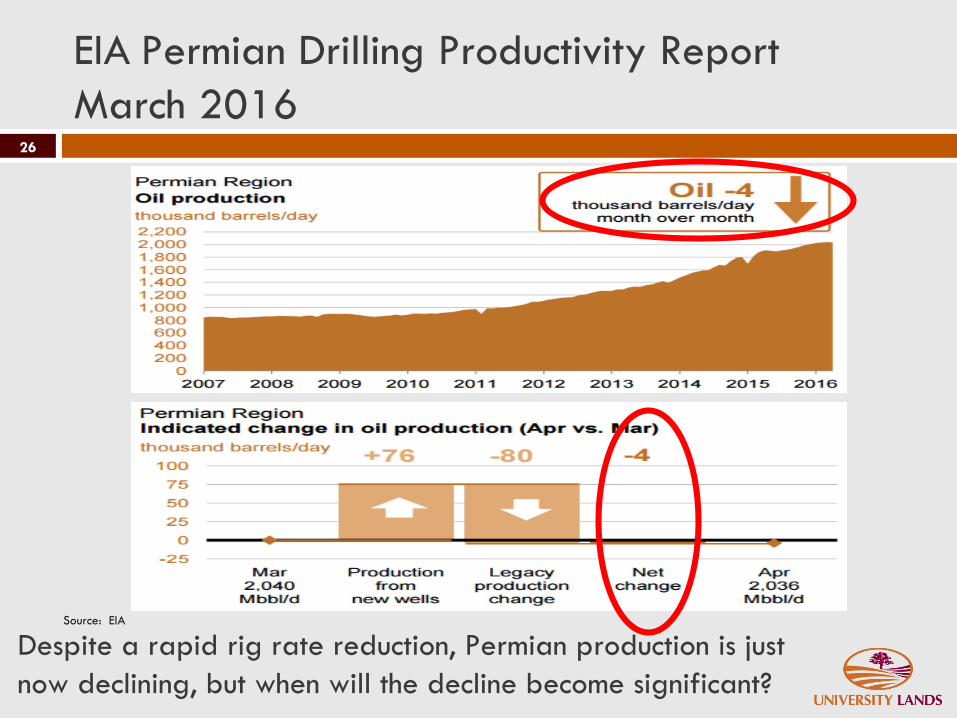
EIA Permian Drilling Productivity Report
March 201626
Source: EIA
Despite a rapid rig rate reduction, Permian production is just
now declining, but when will the decline become significant?
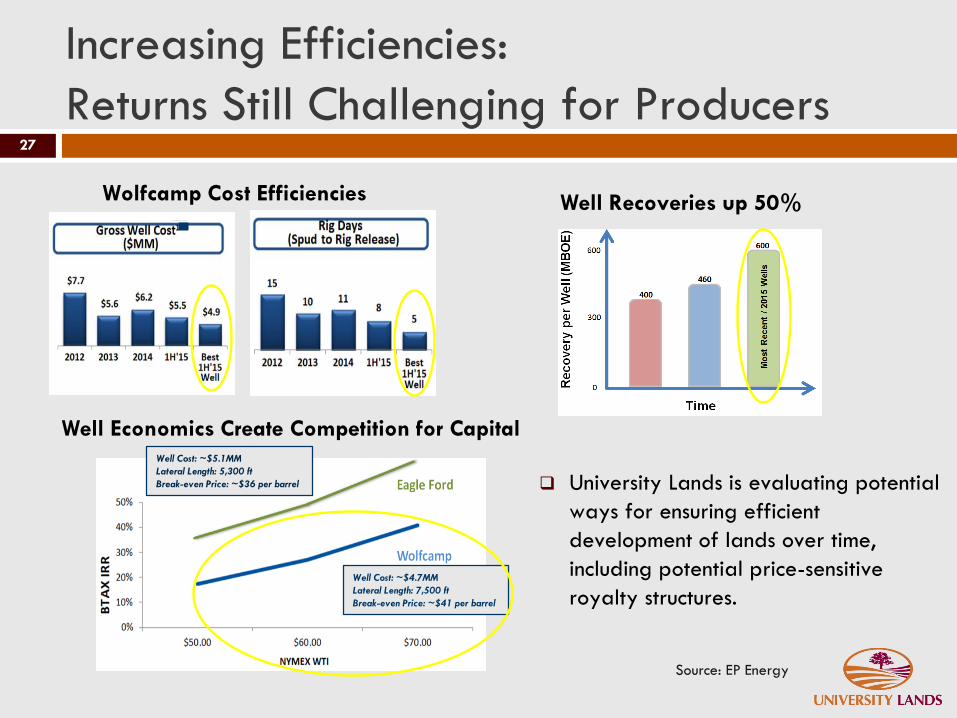
Wolfcamp Cost Efficiencies
Increasing Efficiencies:
Returns Still Challenging for Producers
Source: EP Energy
Well Economics Create Competition for Capital
Well Cost: ~$4.7MM
Lateral Length: 7,500 ft
Break-even Price: ~$41 per barrel
Well Cost: ~$5.1MM
Lateral Length: 5,300 ft
Break-even Price: ~$36 per barrel
Well Recoveries up 50%
University Lands is evaluating potential
ways for ensuring efficient
development of lands over time,
including potential price-sensitive
royalty structures.
27
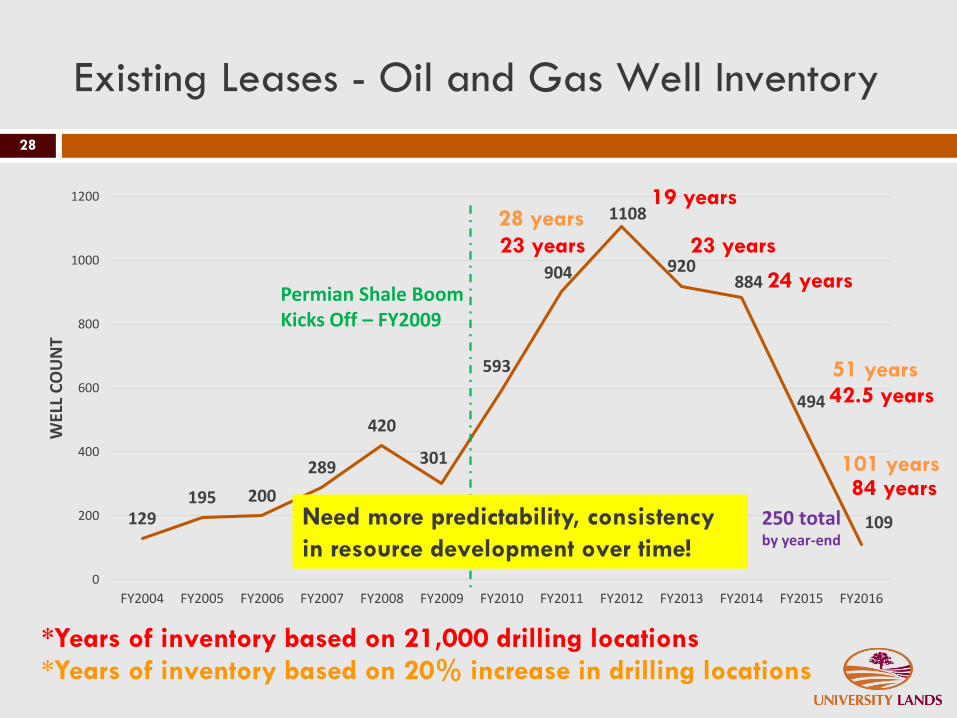
Existing Leases - Oil and Gas Well Inventory
28
129195 200
289
420
301
593
904
1108
920884
494
109
0
200
400
600
800
1000
1200
FY2004 FY2005 FY2006 FY2007 FY2008 FY2009 FY2010 FY2011 FY2012 FY2013 FY2014 FY2015 FY2016
WEL
L C
OU
NT
250 total by year-end
Permian Shale BoomKicks Off – FY2009
*Years of inventory based on 21,000 drilling locations
23 years
19 years
24 years
23 years
42.5 years
84 years
51 years
*Years of inventory based on 20% increase in drilling locations
28 years
101 years
Need more predictability, consistency
in resource development over time!
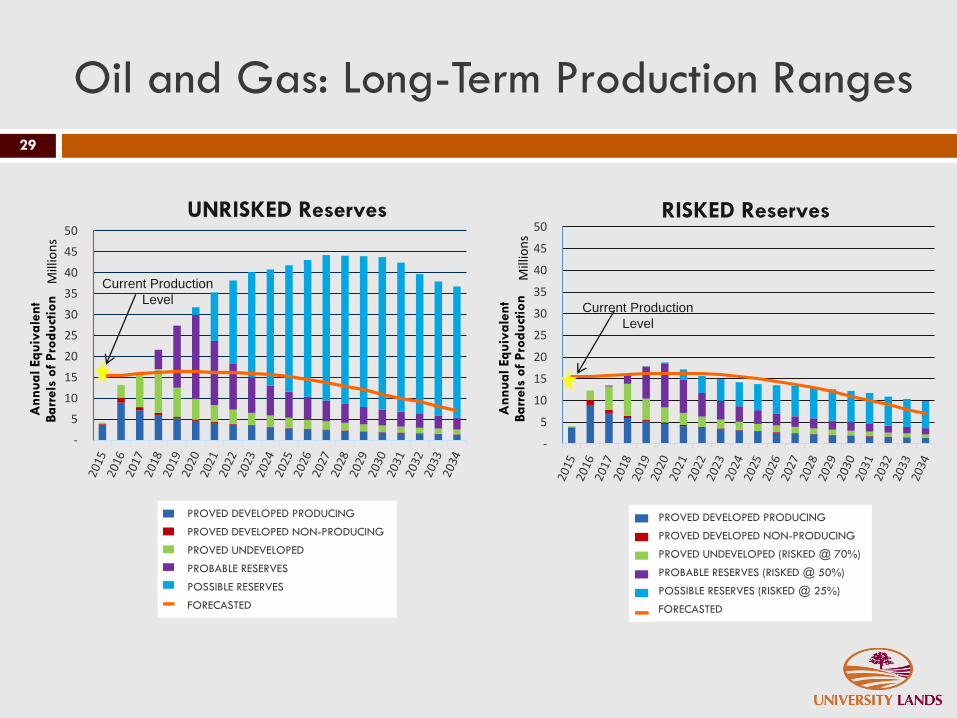
Oil and Gas: Long-Term Production Ranges
29
-
5
10
15
20
25
30
35
40
45
50
Ann
ua
l Equiv
ale
nt
Ba
rrels
of
Pro
duct
ion
Mill
ion
s
Current Production
Level
UNRISKED Reserves
-
5
10
15
20
25
30
35
40
45
50
Ann
ua
l Equiv
ale
nt
Ba
rrels
of
Pro
duct
ion
Mill
ion
s
Current Production
Level
RISKED Reserves
PROVED DEVELOPED PRODUCING
PROVED DEVELOPED NON-PRODUCING
PROVED UNDEVELOPED (RISKED @ 70%)
PROBABLE RESERVES (RISKED @ 50%)
POSSIBLE RESERVES (RISKED @ 25%)
FORECASTED
PROVED DEVELOPED PRODUCING
PROVED DEVELOPED NON-PRODUCING
PROVED UNDEVELOPED
PROBABLE RESERVES
POSSIBLE RESERVES
FORECASTED
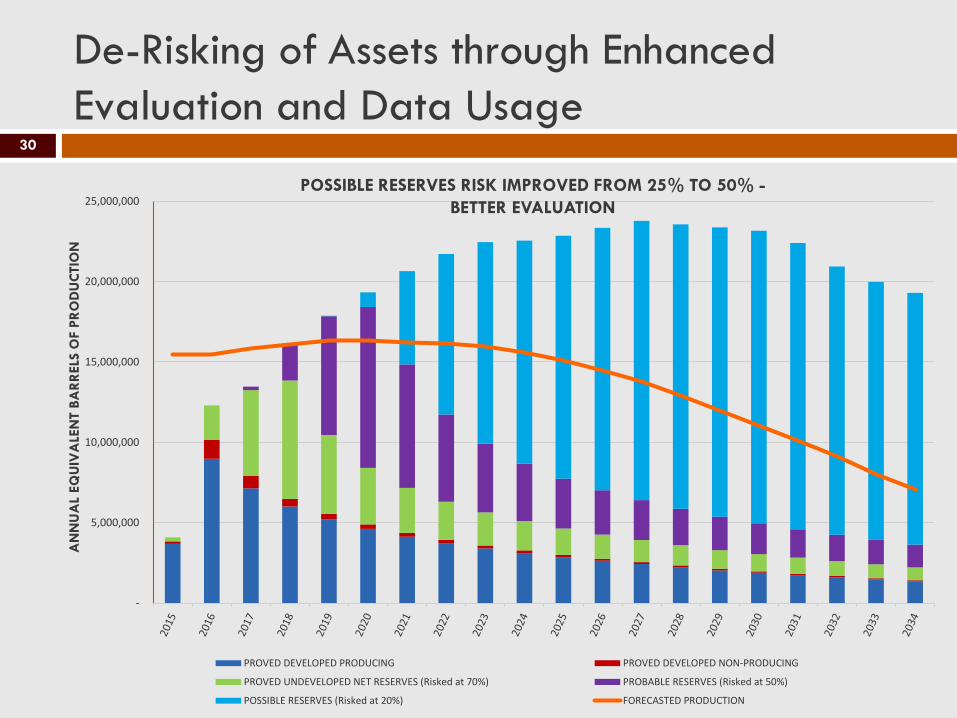
De-Risking of Assets through Enhanced
Evaluation and Data Usage30
-
5,000,000
10,000,000
15,000,000
20,000,000
25,000,000
PROVED DEVELOPED PRODUCING PROVED DEVELOPED NON-PRODUCING
PROVED UNDEVELOPED NET RESERVES (Risked at 70%) PROBABLE RESERVES (Risked at 50%)
POSSIBLE RESERVES (Risked at 20%) FORECASTED PRODUCTION
AN
NU
AL
EQ
UIV
ALE
NT B
AR
RELS
OF P
RO
DU
CTIO
N
POSSIBLE RESERVES RISK IMPROVED FROM 25% TO 50% -
BETTER EVALUATION
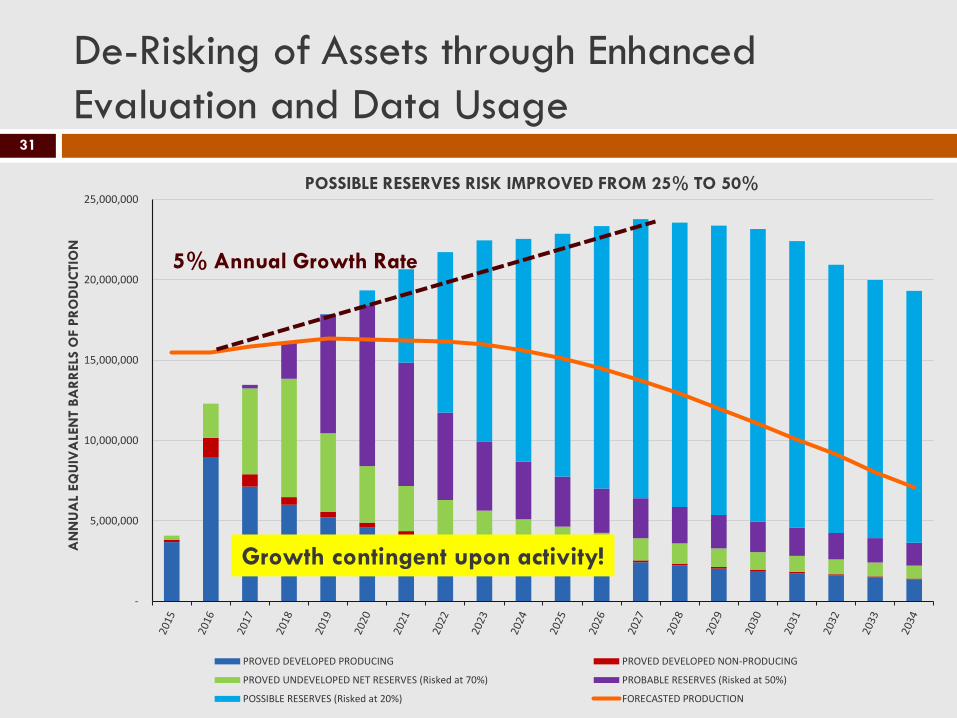
De-Risking of Assets through Enhanced
Evaluation and Data Usage31
-
5,000,000
10,000,000
15,000,000
20,000,000
25,000,000
PROVED DEVELOPED PRODUCING PROVED DEVELOPED NON-PRODUCING
PROVED UNDEVELOPED NET RESERVES (Risked at 70%) PROBABLE RESERVES (Risked at 50%)
POSSIBLE RESERVES (Risked at 20%) FORECASTED PRODUCTION
AN
NU
AL
EQ
UIV
ALE
NT B
AR
RELS
OF P
RO
DU
CTIO
N
5% Annual Growth Rate
POSSIBLE RESERVES RISK IMPROVED FROM 25% TO 50%
Growth contingent upon activity!
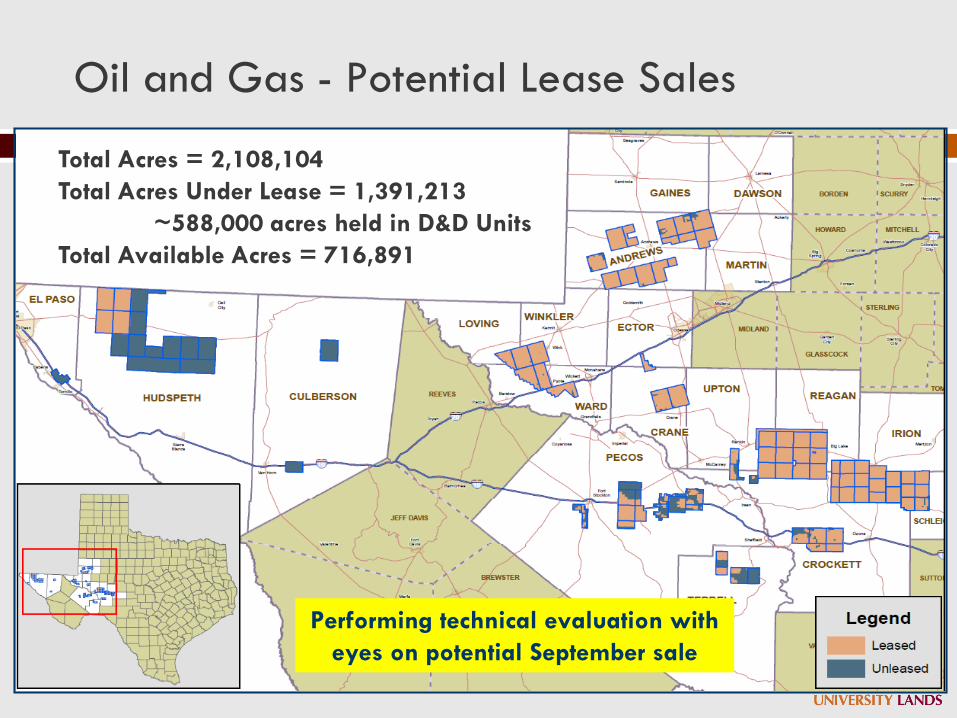
Oil and Gas - Potential Lease Sales
32
Total Acres = 2,108,104
Total Acres Under Lease = 1,391,213
~588,000 acres held in D&D Units
Total Available Acres = 716,891
Performing technical evaluation with
eyes on potential September sale
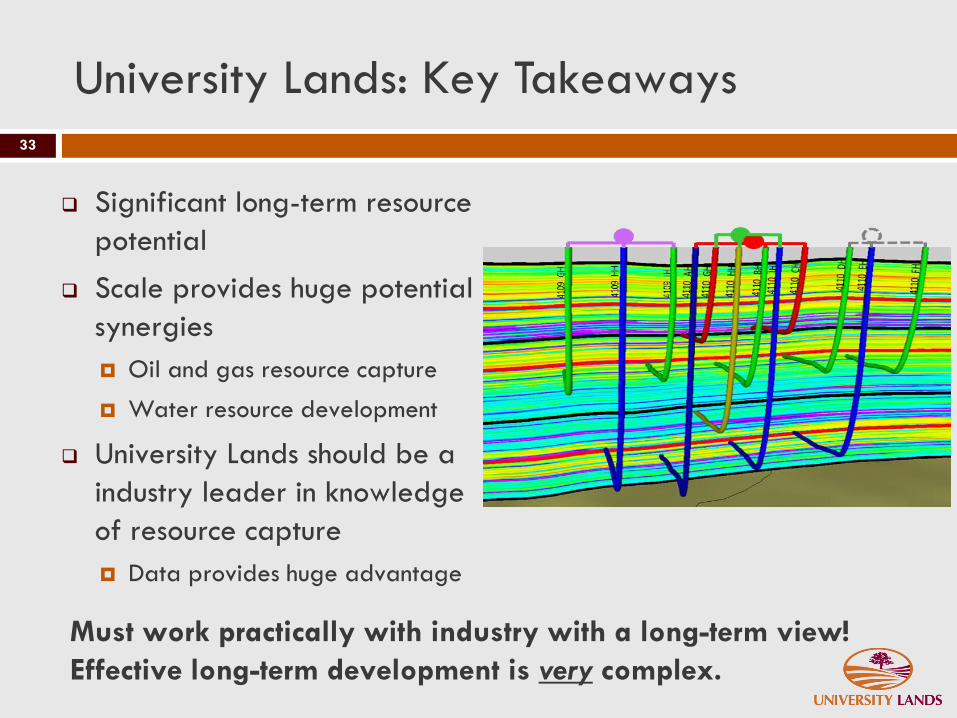
University Lands: Key Takeaways
33
Significant long-term resource
potential
Scale provides huge potential
synergies
Oil and gas resource capture
Water resource development
University Lands should be a
industry leader in knowledge
of resource capture
Data provides huge advantage
Must work practically with industry with a long-term view!
Effective long-term development is very complex.
33

34