Embed Size (px)
Citation preview

University of Wiseon.sin-Madison
,IRP Discussion Papers
George J. Borjas
THE SELF-EMPLOYMENTOF IMMIGRANTS
DP #783-85
Institute for.Research on PovertyDiscussion Paper No. 783-85
The Self-Employment of Immigrants
George J. Borjas
Department of EconomicsUniversity of California
Santa Barbara
Research AssociateNational Bureau of Economic Research
October 1985
This research was supported by grants from the RockefellerFoundation and by funds provided to the Institute for Researchon Poverty at the University of Wisconsin by the U.S. Departmentof Health and Human Services. The opinions expressed in thepaper are those of the author and do not necessarily reflectthe views of the Rockefeller Foundation, DHHS, or the Institute.
\_- .._-- -- - --_. ~------ - ------------ - -----_ .. _----_.._. __ ._-_._--_.. __..._-_.
,"
ABSTRACT
Self-employment represents an important component of the immigrant
experience in the U.S. labor market. Among large immigrant groups
self-employment rates exceed 15 percent of the labor force. This
paper begins the study of the immigrant self-employment experience
by analyzing self-employment rates and incomes of 18 immigrant cohorts
using the 1970 and 1980 U.S. Census. The major findings are these:
1. Assimilation has a sizable impact on self-employment prob
abilities: The longer the immigrant resides in the United States, the
higher the probability of self-employment.
2. There has been a rapid increase in the self-employment rates
experienced by recent immigrant cohorts as compared to earlier cohorts.
These across-cohort changes have been caused by the relative decline
of opportunities faced by immigrants in the salaried sector over the
last decades.
3. Immigrants are more likely to be self-employed than similarly
skilled native-born workers. A major reason for this differential is
that geographic enclaves of immigrants increase self-employment oppor
tunities, particularly for immigrants who share the same national
background as the residents of the enclave.
The Self-Employment of Immigrants
George J. Borjas
I. Introduction
The question of how immigrants do in the labor market has been studied
intensively in the last decade. Beginning with the work of Chiswick (1978)
this literature has demonstrated that earlier waves of immigrants have higher
earnings than more recent waves and that, in addition, the earnings of im-
.migrants who have been in the U.S. for 10-15 years (or longer) exceed the
earnings of the native-born. Recent work by Borjas (1985) questions the
validity of the inference often made from cro.ss-section studies that im~
migrants "assimilate" rapidly in the U.S. labor market. In fact, by fol-
lowing immigrant cohorts over a decade Borjas shows that the cross-section
studies confound secular changes in cohort quality with the assimilation
process and that most of the earnings growth captured by cross-section
regressions is due to a sizable decline in the quality of immigrants admitted
to the United States in the postwar period.
Despite the important insights provided by these studies of how im-
migrants do in the labor market, a potentially significant aspect of this
issue has been ignored. In particular, it is not uncommon in the socio-
logical literature to assert that a major channel for immigrant assimilation
has been the ample availability of self-employment opportunities for immi-
grants (see, for example, Bonacich and Modell, 1980; Cummings, 1980; and Pyong,
1984). ~hese studies argue that many immigrants begin their climb up the
ladder of economic success by becoming self-employed and catering to customers
from the "old country," i.e., consumers who have similar national backgrounds
II~--~_._------
2
and who demand products where immigrants have a comparative advantage in the
production process (due perhaps to language barriers or to the familiarity
with ethnic preferences). Since all studies in the earnings determination
literature discussed earlier ignore the self-employment option and/or
explicitly focus on the earnings of salaried workers it is possible that
these studies have provided an incomplete picture of how immigrants as-
similate in the labor market.
It must be noted, however, that the disinterest in the question of self-
employment among labor market participants is not restricted solely to the
immigration literature. In fact, the related questions of who are the self-
employed and how they do in the labor market have received only the most
tangential attention in labor economics. 1 This disinterest could, be
justified if self-employment was a numerically unimportant component of the
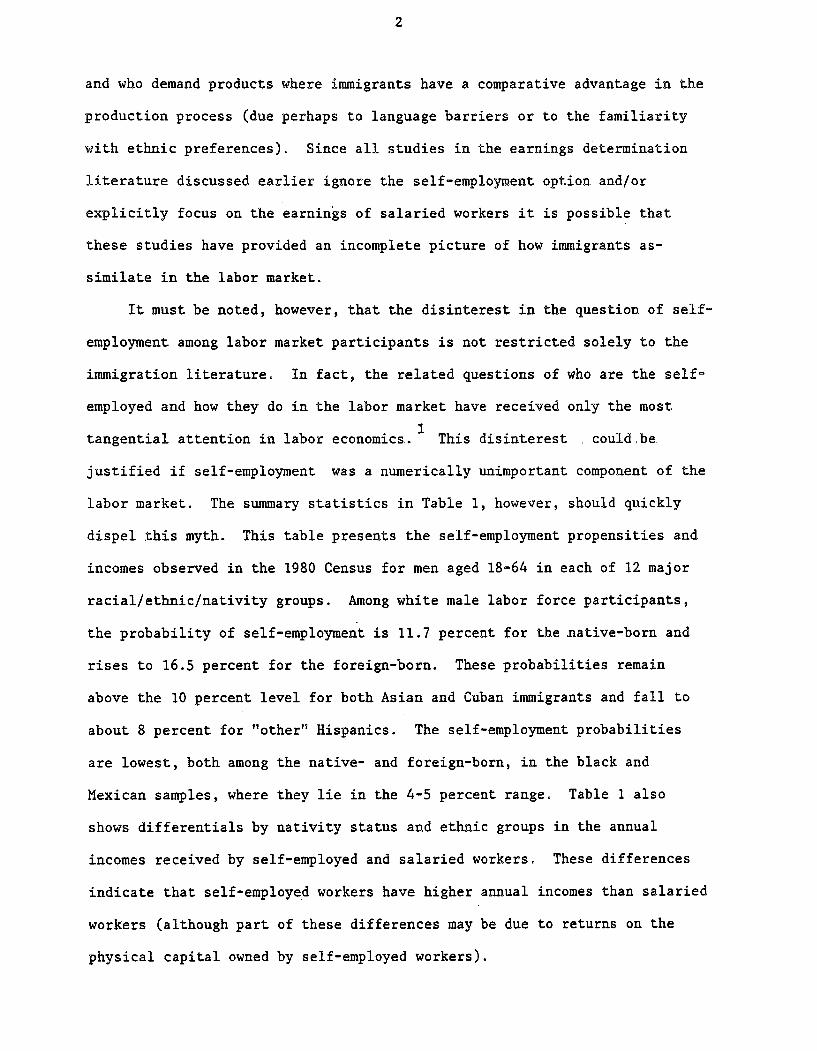
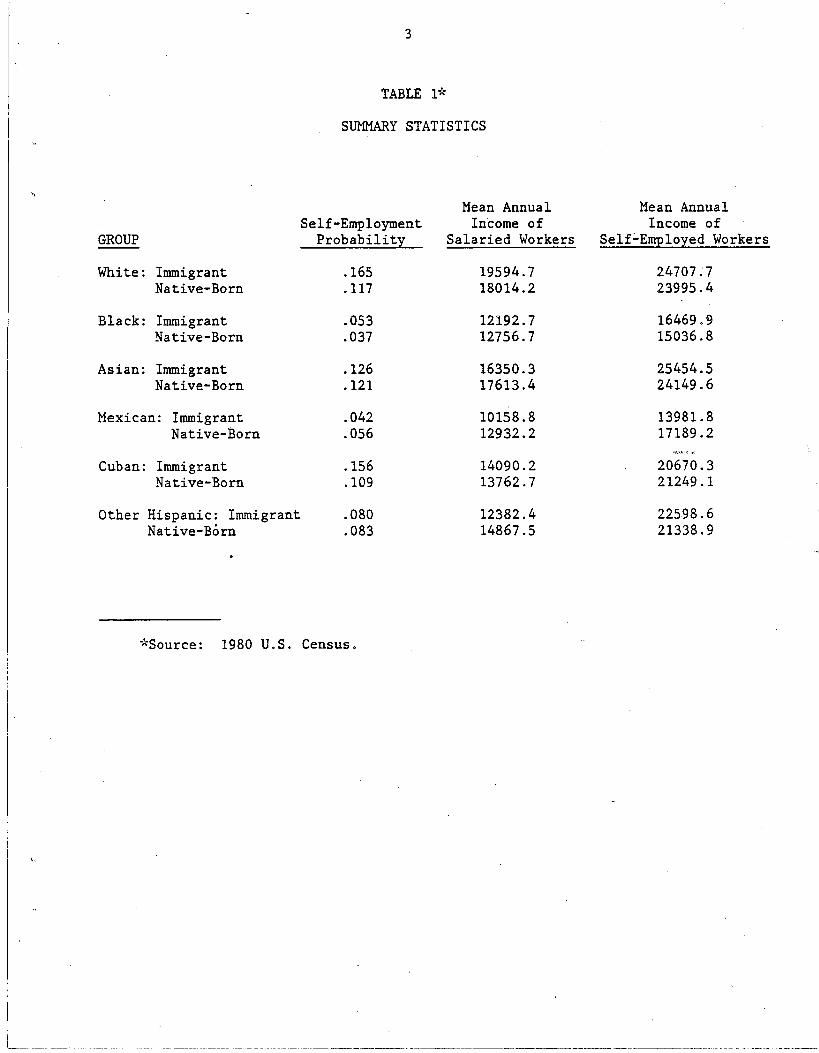
labor market. The summary statistics in Table 1, however, should quickly
dispel this myth. This table presents the self-employment propensities and
incomes observed in the 1980 Census for men aged 18-64 in each of 12 major
racial/ethnic/nativity groups. Among white male labor force participants,
the probability of self-employment is 11.7 percent for the native-born and
rises to 16.5 percent for the foreign-born. These probabilities remain
above the 10 percent level for both Asian and Cuban immigrants and fall to
about 8 percent for !lother" Hispanics. The self-employment probabilities
are lowest, both among the native- and foreign-born, in the black and
Mexican samples, where they lie in the 4-5 percent range. Table 1 also
shows differentials by nativity status and ethnic groups in the annual
incomes received by self-employed and salaried workers. These differences
indicate that self-employed workers have higher annual incomes than salaried
workers (although part of these differences may be due to returns on the
physical capital owned by self-employed workers).
3
TABLE 1*
SUMMARY STATISTICS
Mean Annual Mean AnnualSelf-Employment Income of Income of
GROUP Probability Salaried Workers Self~Employed Workers
White: Immigrant .165 19594.7 24707;7Native-Born .117 18014.2 23995.4
Black: Immigrant .053 12192.7 16469.9Native-Born .037 12756.7 15036.8
Asian: Immigrant .126 16350.3 25454.5Native-Born .121 17613.4 24149.6
Mexican: Immigrant .042 10158.8 13981. 8Native-Born .056 12932.2 17189.2
"".~.'='-': '.~.
Cuban: Immigrant .156 14090.2 20670.3Native-Born .109 13762.7 21249.1
Other Hispanic: Immigrant .080 12382.4 22598.6Native-Born .083 14867.5 21338.9
*Source: 1980 U.S. Census.
i__ ~_ ___ ~ _ ___~. .~ ~~ .___ __ __ _
4
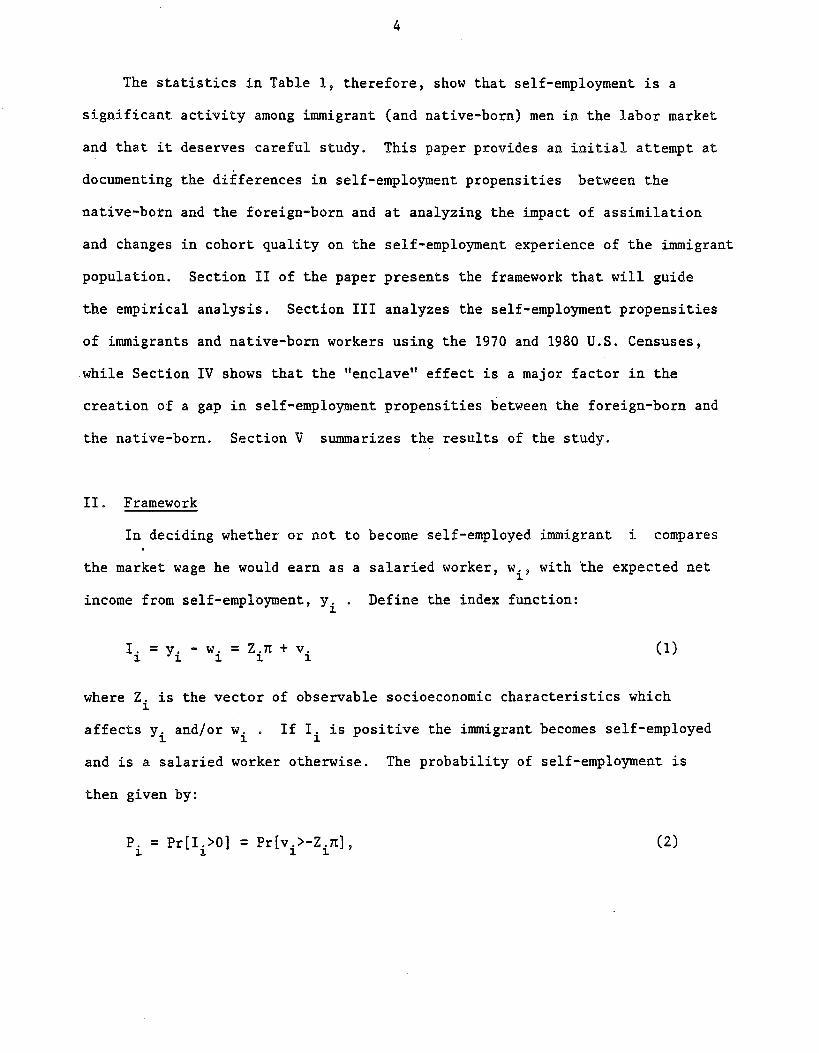
The statistics in Table 1, therefore, show that self-employment is a
significant activity among immigrant (and native-born) men in the labor market
and that it deserves careful study. This paper provides an initial attempt at
documenting the differences in self-employment propensities between the
native-born and the foreign-born and at analyzing the impact of assimilation
and changes in cohort quality on the self-employment experience of the immigrant
population. Section II of the paper presents the framework that will guide
the empirical analysis. Section III analyzes the self-employment propensities
of immigrants and native-born workers using the 1970 and 1980 U.S. Censuses,
while Section IV shows that the "enclave" effect is a major factor in the
creation of a gap in self-employment propensities between the foreign-born and
the native-born. Section V summarizes the results of the study.
II . Framework
In deciding whether or not to become self-employed immigrant i compares
the market wage he would earn as a salaried worker, w., with the expected net1.
income from self-employment, y.1.
I. =y. - w. =Z.n + v.1. 1. 1. 1. 1.
Define the index function:
(1)
where Z. is the vector of observable socioeconomic characteristics which1.
affects y. and/or w. . If I. is positive the immigrant becomes self-employed1. 1. 1.
and is a salaried worker otherwise. The probability of self-employment is
then given by:
P. =Pr[I.>O] =Pr[v.>-Z.n],1. 1. 1. 1.
(2)
5
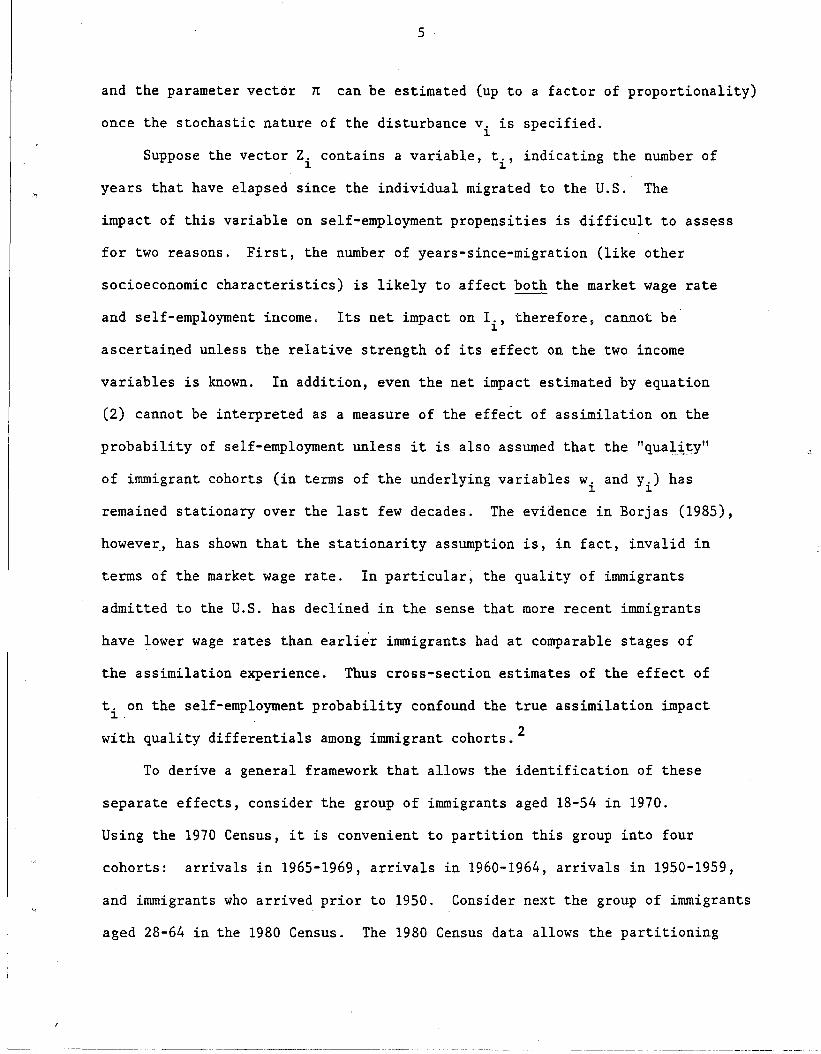
and the parameter vector n can be estimated (up to a factor of proportionality)
once the stochastic nature of the disturbance v. is specified.~
Suppose the vector Z. contains a variable, t., indicating the number of~ 1
years that have elapsed since the individual migrated to the U.S. The
impact of this variable on self-employment propensities is difficult to assess
for two reasons. First, the number of years-since-migration (like other
socioeconomic characteristics) is likely to affect both the market wage rate
and self-employment income. Its net impact on I., therefore, cannot be1
ascertained unless the relative strength of its effect on the two income
variables is known. In addition, even the net impact estimated by equation
(2) cannot be interpreted as a measure of the effect of assimilation on the
probability of self-employment unless it is also assumed that the i1 quali,ty"
of immigrant cohorts (in terms of the underlying variables w. and y.) has1. ~
remained stationary over the last few decades. The evidence in Borjas (1985),
however., has shown that the stationarity assumption is, in fact, invalid in
terms of the market wage rate. In particular, the quality of immigrants
admitted to the U.S. has declined in the sense that more recent immigrants
have lower wage rates than earlier immigrants had at comparable stages of
the assimilation experience. Thus cross-section estimates of the effect of
t. on the self-employment probability confound the true assimilation impact1.
with quality differentials among immigrant cohorts. 2
To derive a general framework that allows the identification of these
separate effects, consider the group of immigrants aged 18-54 in 1970.
Using the 1970 Census, it is convenient to partition this group into four
cohorts: arrivals in 1965-1969, arrivals in 1960-1964, arrivals in 1950-1959,
and immigrants who arrived prior to 1950. Consider next the group of immigrants
aged 28-64 in the 1980 Census. The 1980 Census data allows the partitioning
'--- -~-----------~----- ---~_.~._------

6
of this group of immigrants into six cohorts: arrivals in 1975-1979, arrivals
in 1970-1974, arrivals in 1965-1969, arrivals in 1960-1964, arrivals in 1950-1959,
and immigrants who arrived prior to 1950. Note that the last four cohorts
defined in the 1980 group exactly match the definitions of the cohorts from
the 1970 Census.3
Given these data, and assuming that the disturbance v.l.
follows a logistic distribution, two cross-section regressions can be estimated
by maximum likelihood:
(4)
where Pt is the probability of self-employment in Census year t, X is
a vector of socioeconomic characteristics, and the dummy variables indexing
years-since-immigration/cohort are defined by: D75=1 if immigrated in 1975
1979; D70=1 if immigrated in 1970-1974; D6S=1 if immigrated in 1965-1969;
D60=1 if immigrated in 1960-1964; DSO=l if immigrated in 1950-1959; and D40=1
if immigrated prior to 1950. By definition, the vector X in (3) and (4)
does not contain a constant term.
Consider cohort k, where Dk=l (k=40,SO,60,65). Let X give the mean
values of the socioeconomic characteristics for the immigrant group as of
1980. Define:
(5)
(6)
(7)
7
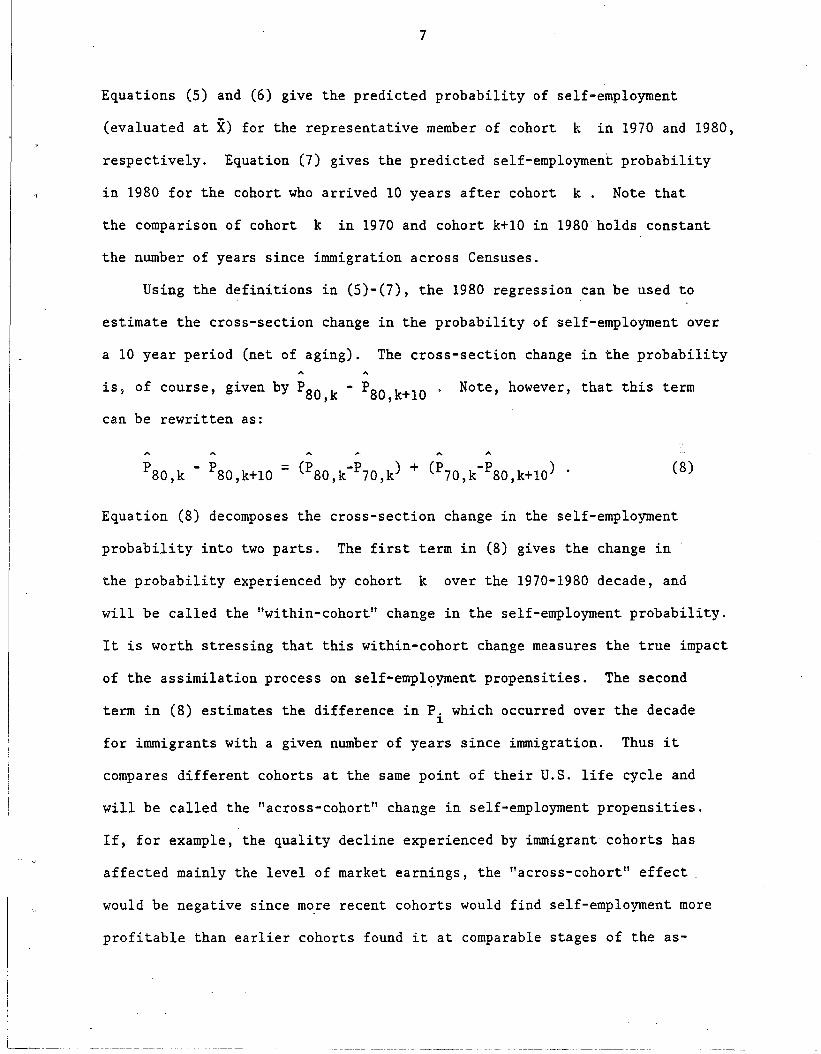
Equations (5) and (6) give the predicted probability of self-employment
(evaluated at X) for the representative member of cohort k in 1970 and 1980,
respectively. Equation (7) gives the predicted self-employment probability
in 1980 for the cohort who arrived 10 years after cohort k. Note that
the comparison of cohort k in 1970 and cohort k+10 in 1980 holds constant
the number of years since immigration across Censuses.
Using the definitions in (5)-(7), the 1980 regression can be used to
estimate the cross-section change in the probability of self-employment over
a 10 year period (net of aging). The cross-section change in the probability
is, of course, given by P80 ,k P80 ,k+10
can be rewritten as:
Note, however, that this term
P80 ,k - P80 ,k+10 = (P80 k-P70 k) + (P70 k-P80 k+10) ." "
(8)
Equation (8) decomposes the cross-section change in the self-employment
probability into two parts. The first term in (8) gives the change in
the probability experienced by cohort k over the 1970-1980 decade, and
will be called the "within-cohort" change in the self-employment probability.
It is worth stressing that this within-cohort change measures the true impact
of the assimilation process on self-empl~yment propensities. The second
term in (8) estimates the difference in P. which occurred over the decade1
for immigrants with a given number of years since immigration. Thus it
compares different cohorts at the same point of their U.s. life cycle and
will be called the "across-cohort" change in self-employment propensities.
If, for example, the quality decline experienced by immigrant cohorts has
affected mainly the level of market earnings, the "across-cohort" effect.
would be negative since more recent cohorts would find self-employment more
profitable than earlier cohorts found it at comparable stages of the as-

8
similation experience. The existence of quality differences among immigrant
cohorts, therefore, implies that the cross-section regression provides a
biased measure of the impact of assimilation on self-employment propensities.
It should be noted, however, that the within-cohort change defined in
equation (8) can also be a biased measure of the impact of assimilation if
aggregate labor market conditions changed sufficiently between 1970 and 1980.
For instance, if economic changes over the decade led to a relative decline
in the earnings of salaried workers, the probability of self-employment will
have experienced a secular increase during the period. This macro shift
in the probability will bias upwards the within-cohort change and, due to
the decomposition in (8), will impart a downward bias on the across-cohort
change. One possible solution to this pro~lem is simply to analyze the,
behavior of the self-employment probability of immigrants net of the changes
which occurred in the native-born population. 'Suppose the logit equations
determining self-employment propensities for the native-born are given by:
(9)
(10)
where the subscript "n" indicates native-born status. Define the self-
employment probability of a native-born worker statistically similar to
the average immigrant by:
(11)
p80,n
(12)
9
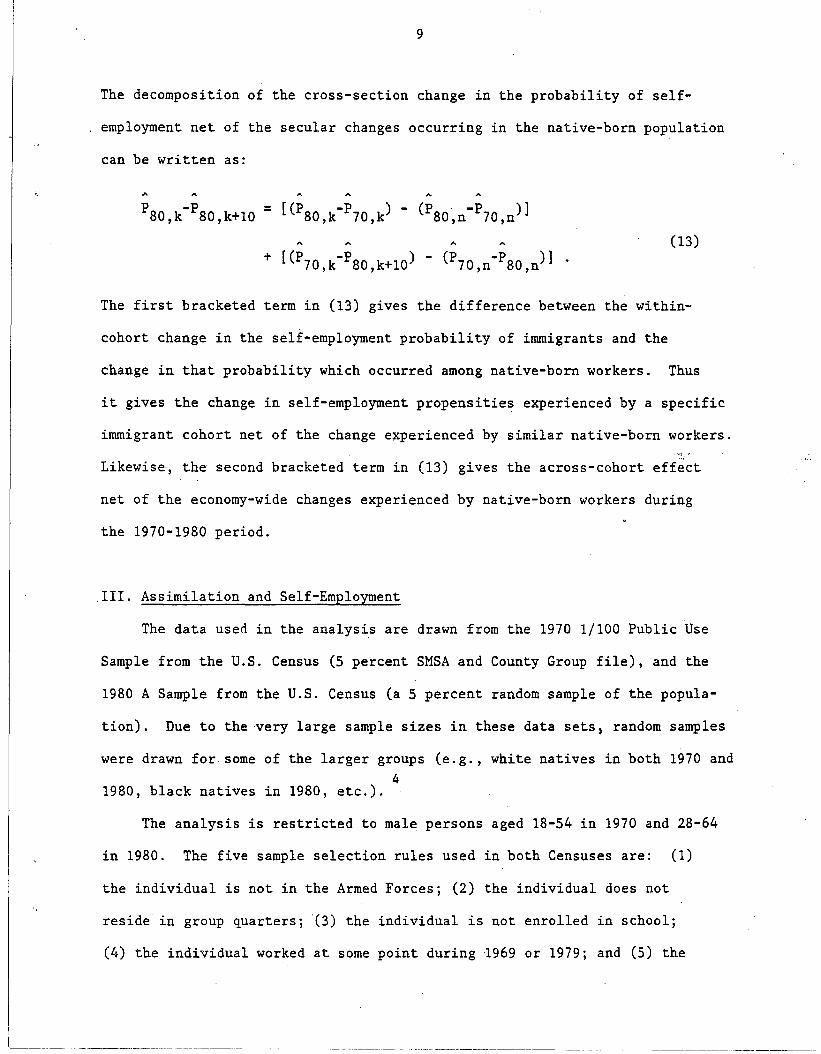
The decomposition of the cross-section change in the probability of self-
employment net of the secular changes occurring in the native-born population
can be written as:
(13)
The first bracketed term in (13) gives the difference between the within-
cohort change in the self-employment probability of immigrants and the
change in that probability which occurred among native-born workers. Thus
it gives the change in self-employment propensitie~ experienced by a specific
immigrant cohort net of the change experienced by similar native-born workers.
Likewise-, the second bracketed term in (13) gives the across-cohort effect
net of the economy-wide changes experienced by native-born workers during
the 1970-1980 period.
III. Assimilation and Self-Employment
The data used in the analys~s are drawn from the 1970 1/100 Public Use
Sample from the U.S. Census (5 percent SMSA and County Group file), and the
1980 A Sample from the U.S. Census (a 5 percent random sample of the popula-
tion). Due to the very large sample sizes in these data sets, random samples
were drawn for some of the larger groups (e.g., white natives in both 1970 and4
1980, black natives in 1980, etc.).
The analysis is restricted to male persons aged 18-54 in 1970 and 28-64
in 1980. The five sample selection rules used in both Censuses are: (1)
the individual is not in the Armed Forces; (2) the individual does not
reside in group quarters; -(3) the individual is not enrolled in school;
(4) the individual worked at some point during 1969 or 1979; and (5) the
~..__ .. _--------
10
individual resides in an SMSA. This last restriction prevents the analysis
from being biased by the prevalence of self-employment in the farm sector and
by the relative absence of immigrants in rural areas. Since previous re-
search has shown that major differences in economic status exist within the
male immigrant (and native-born) labor force, the study will be conducted
separately for each of six major immigrant groups; Mexican, Cuban, other
Hispanic, Asian, white, and black, where the "white" and "black" immigrant
samples contain the observations which are neither Hispanic nor Asian.5
Finally, the definition of self-employment is drawn from the class of worker
variables in the 1970 and 19S0 Censuses. An individual is classified as
self-employed if he is a self-employed worker (business not incorporated)
or if he is an employee of his own corporation. Unpaid family workers are
excluded from the analysis in this paper.
Before proceeding to the decomposition suggested by equations (S) and
(13) it is useful to describe the 19S0Census data in terms of a simple cross-
section regression. In particular, pool the native-born and foreign-born
samples in the 19S0 Census and estimate the logit regression:
PSO.Q.n(-lP)=Z.y+e.
- SO ~ ~(14)
where the vector Z. includes both socioeconomic variables and the years~
since-migration vector, and the native-born sample pooled with the immigrant
samples is the immigrant's racial/ethnic counterpart in the native-born
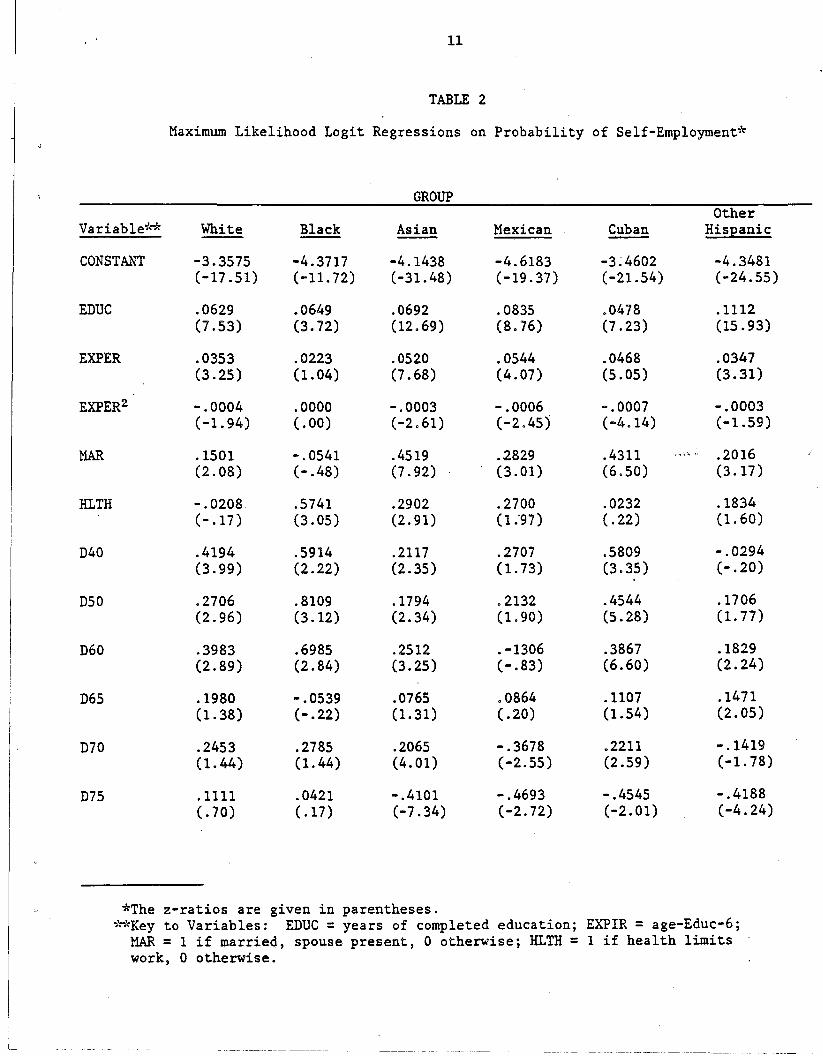
population. The maximum likelihood estimates of equation (14) are presented
in Table .2. Although the impact of the socioeconomic variables like education
and potential labor market experience are not the focus of the analysis, it
1_-
11
TABLE 2
Maximum Likelihood Logit Regressions on Probability of Self-Employment*
GROUPOther
Variable~'~ White Black Asian Mexican Cuban Hispanic--CONSTANT -3.3575 -4.3717 -4.1438 -4.6183 -3;4602 -4.3481
(-17 .51) (-11.72) (-31.48) (-19.37) (-21.54) (-24.55)
EDUC .0629 .0649 .0692 .0835 .0478 .1112(7.53) (3.72) 02.69) (8.76) (7.23) (15.93)
EXPER .0353 .0223 .0520 .0544 .0468 .0347(3.25) (1. 04) (7.68) (4.07) (5.05) (3.31)
EXPER2 -.0004 .0000 -.0003 -.0006 -.0007 -.0003(-1.94) (.00) (-2.61) (-2.45) (-4.14) (-1.59)
MAR .1501 -.0541 .4519 ..2829 .4311 v·,1';":'·'!.' .2016(2.08) (-.48) (7.92) (3.01) (6.50) (3.17)
HLTH -.0208 .5741 .2902 .2700 .0232 .1834(-.17) (3.05) (2.91) (1.'97) (.22) (1.60)
D40 .4194 .5914 .2117 .2707 .5809 -.0294(3.99) (2.22) (2.35) (1.73) (3.35) (-.20)
D50 .2706 .8109 .1794 .2132 .4544 .1706(2.96) (3.12) (2.34) (1. 90) (5.28) (1. 77)
D60 .3983 .6985 .2512 .-1306 .3867 .1829(2.89) (2.84) (3.25) (-.83) (6.60) (2.24)
D65 .1980 -.0539 .0765 .0864 .1107 .1471(1. 38) (-.22) (1. 31) (.20) 0.54) (2.05)
D70 .2453 .2785 .2065 -.3678 .2211 -.1419(1. 44) (1. 44) (4.01) (-2.55) (2.59) (-1. 78)
D75 .1111 .0421 -.4101 -.4693 -.4545 -.4188(.70) (.17) (-7.34) (-2.72) (-2.01) (-4.24)
*The z-ratios are given in parentheses.~~~Key to Variables: EDUC =years of completed education; EXPIR =age-Educ-6;
MAR =1 if married, spouse present, 0 othe~'ise; HLTH =1 if health limitswork, 0 otherwise.
12
is worth noting that the effect of these variables closely resembles their
impact in traditional human capital earnings functions. Of more concern to
the present study is the impact of the variables in the years-since-migration
vector, where the omitted dummy variable indicates if the individual is native
born. Two important findings are evident in the table. First, self-employment
probabilities are almost always larger for immigrants than for the native-born.
The exceptions to this result are usually found in the samples of immigrants
who have resided in the U.S. fewer than 5 years. For immigrants who have re
sided in this country longer than 10 years, however, Table 2 shows that, without
exception, the probability of self-employment is at least as large for immi
grants as it is for the native-born. A second important finding evident in
Table 2 is that the probability of self-employment is. not monotonically in
creasing with years-since-migration. For example, in the white sample the
logit coefficients of the years-since-migration dummies exhibit little
variance (and, in fact, are insignificantly different from each other) during
the 1950-1975 period. Roughly speaking, therefore, Table 2 suggests that, in
the absence of quality differences among immigrant cohorts, most of the gap in
self-employment propensities between the foreign-born and the native-born is
created within 5-10 years after immigration. This result differs markedly
from the conclusions reached in the cross-section regression on immigrant
earnings where it is found that immigrant earnings are a monotonically in
creasing function of years-since-migration.
However, as equations (8) and (13) make clear the cross-section re
gressions in Table 2 say nothing about the assimilation process since they
confound the true growth attributable to assimilation with quality differences
among immigrant cohorts. These decompositions are presented in Table 3
for 18 immigrant cohorts. Two important points should be made about the
I_~-
13
derivation of the statistics in Table 3. First, the vector of socioeconomic
characteristics, X, held constant in the logit self-employment regressions
includes the variables: years of completed schooling; years of labor market
experience (defined by Age-Schooling-6); years of labor market experience
squared; whether or not health limits work; and whether or not married
spouse present. Secondly, to minimize the large number of parameters to
be estimated by maximum likelihood, and due to the large number of observa
tions, the coefficients of the socioeconomic variables (Y70 , Yso' 070' 0SO)
are constrained so that Y70 =YSO =Y and 070 =0SO = 0. Thus the socio
economic variables are allowed to have a differential impact between the
native- and foreign-born samples, but this impact remained constant over
the decade. 6
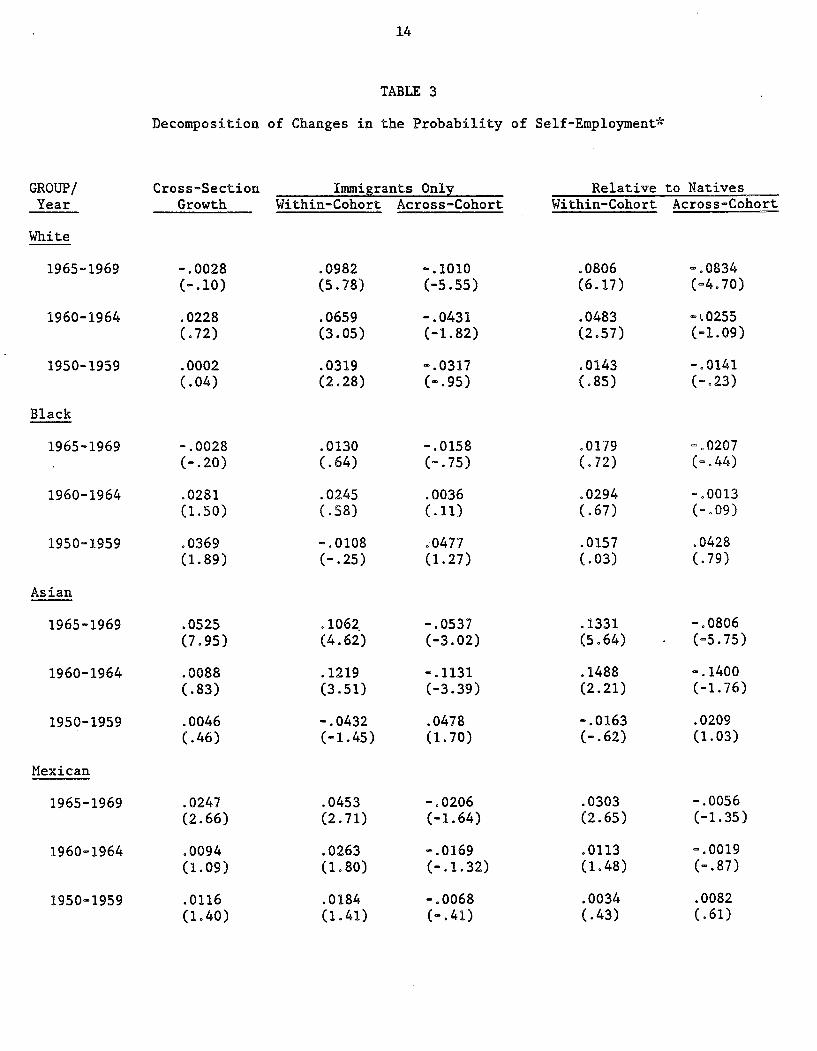
The results in Table 3 are best understood by illustrating their deriva
tion through an example. Consider the group of white men who arrived in
1965-1969. According to the 19S0 cross-section regression, the probability
of self-employment for these men is -.002S percentage points lower than
that of similarly skilled immigrants who arrived 10 years later. 7 Thus the
cross-section regression reveals little change in self-employment propensities
over time. Using equation (8), however, this quantity can be decomposed
into within- and across-cohort changes in self-employment probabilities.
This decomposition reveals that as of 19S0 this group of immigrants actually
had a self-employment probability that was 9.8 percentage points higher than
in 1970. Thus the cohort experienced a significant increase in self-employ
ment propensities. Yet, at the same time, this cohort as of 1970 had a
self-employment probability that was 10.1 percentage points lower than the
1980 self-employment probability of men who arrived in 1975-1979. Thus the
secular changes in the quality mix of these immigrant cohorts have led to
._-_._-~~-_.~~-
14
TABLE 3
Decomposition of Changes in the Probability of Self-Employment*
GROUP/ Cross-Section Immigrants Only Relative to NativesYear Growth Within-Cohort Across-Cohort Within-Cohort Across-Cohort
White
1965-1969 -.0028 .0982 -.1010 .0806 =.0834(-.10) (5.78) (-5.55) (6.17) (-4.70)
1960-1964 .0228 .0659 -.0431 .0483 -1.0255(.72) (3.05) (-1. 82) (2.57) (-1. 09)
1950-1959 .0002 .0319 -.0317 .0143 -.0141( .04) (2.28) (-.95) ( .85) (-.23)
Black
1965-1969 -.0028 .0130 -.0158 .0179 =.0207(-.20) (.64) (-.75) (.72) (-.44)
1960-1964 .0281 .0245 .0036 .0294 -.0013(1. 50) (.58) (.11) (.67) (-.09 )
1950-1959 .0369 =.0108 .0477 .0157 .0428(1. 89) (-.25) (1.27) (.03) (.79)
Asian
1965-1969 .0525 .1062. -.0537 .1331 -.0806(7.95) (4.62) (-3.02) (5.64) (-5.75)
1960-1964 .0088 .1219 - .1131 .1488 -.1400(.83) (3.51) (-3.39) (2.21) (-1.76)
1950-1959 .0046 -.0432 .0478 -.0163 .0209(.46) (-1.45) (1. 70) (-.62) (1.03)
Mexican
1965-1969 .0247 .0453 -.0206 .0303 -.0056(2.66) (2.71) (-1. 64) (2.65) (-1. 35)
1960-1964 .0094 .0263 -.0169 .0113 -.0019(1. 09) (1. 80) (-.1. 32) (1. 48) (-.87)
1950-1959 .0116 .0184 -.0068 .0034 .0082(1.40) (1.41) (-.41) ( .43) (.61)
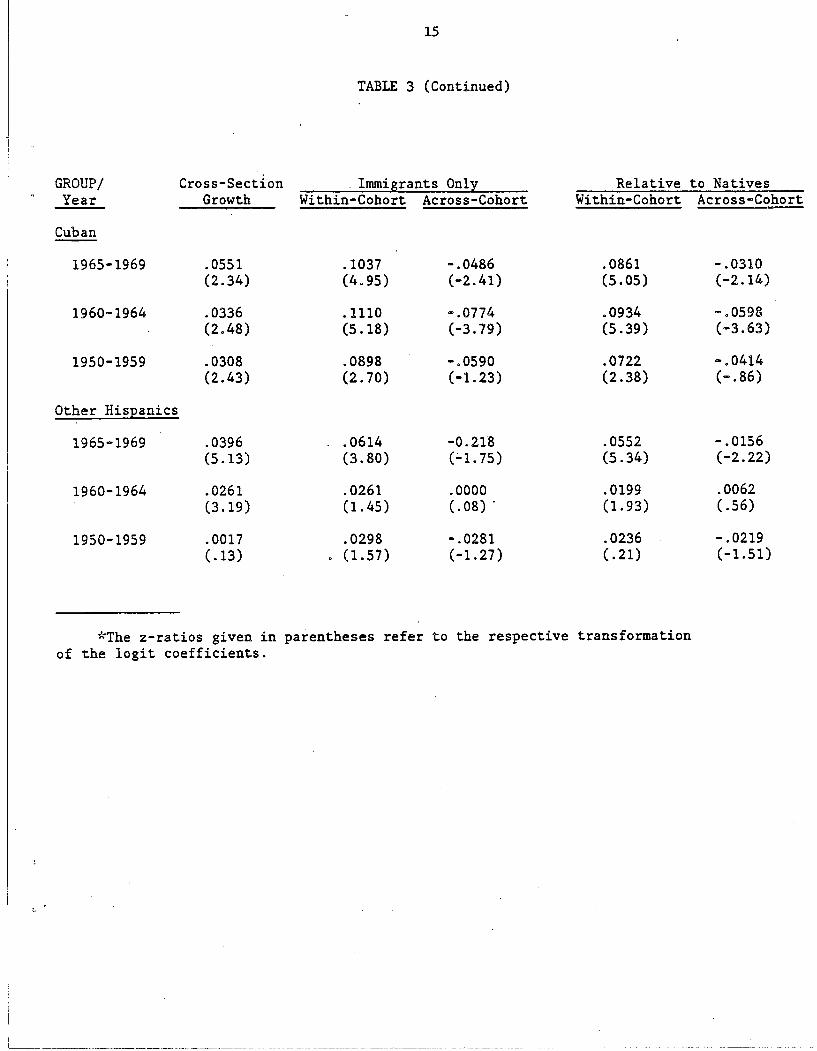
15
TABLE 3 (Continued)
GROUP/ Cross-Section . Immigrants Only Relative to NativesYear Growth Within-Cohort Across-Cohort Within-Cohort Across-Cohort
Cuban
1965-1969 .0551 .1037 -.0486 .0861 -.0310(2.34) (4.95) (-2.41) (5.05) (-2.14)
196000 1964 .0336 .1110 00.0774 .0934 00.0598(2.48) (5.18) (-3.79) (5.39) (-3.63)
1950-1959 .0308 .0898 -.0590 .0722 -.0414(2.43) (2.70) (-1.23) (2.38) (00.86)
Other Hispanics
1965-1969 .0396 .0614 -0.218 .0552 -.0156(5.13) (3.80) (~1.75) (5.34) (-2.22)
1960-1964 .0261 .0261 .0000 .0199 .0062(3.19) (1. 45) (.08) . (1. 93) ( .56)
1950-1959 .0017 .0298 -.0281 .0236 -.0219(.13) . (1.57) (-1.27) (.21) (-1.51)
*The z-ratios given in parentheses refer to the respective transformationof the logit coefficients.

16
an increase in self-employment propensities. In fact, the across-cohort
change wipes out the within-cohort change so that in the cross-section it
appears as if assimilation had no impact on the self-employment probability.
Of course, it may well be that these changes between 1970 and 1980
simply reflect economy-wide fluctuations in relative self-employment incomes.
The decomposition in equation (13) controls for this problem by netting out
the change in the self-employment probability achieved by the native-born
group. It should be noted, however, that the choice of the native-born re- r
ference group is somewhat arbitrary since the immigrant population can be
compared to a number of different racial/ethnic native-born men. In this
paper, each immigrant group (except for the Cubans) is compared to its
respective ethnic/racial native-born counterpart. In the Cuban case,
due to the small sample size.(and the even smaller number of self-employed
Cuban "natives") the Cuban immigrants are compared to white native-born
men.
The last two columns of Table 3 conduct the decomposition of the cross
section growth after netting out the change in the self-employment probabilities
of the native-born. In the case of the 1965-1969 white immigrant cohort, the
within-cohort change remains positive and significant and is approximately
8.1 percentage points. In other words, the self-employment probability of
white immigrants who arrived in 1965-1969 increased 8.1 percentage points
above the increased experienced by white native-born men over the 1970-1980
period. Similarly, the across-cohort change remains negative and significant
even after netting out the white native-born change so that, indeed, more
recent cohorts of immigrants are more likely to opt for self-employment
than earlier immigrants.
17
The remaining rows of Table 3 replicate the analysis for all other co-
horts in the six immigrant groups. Perhaps the major finding obtained from
these results is that there are sizable differences in the within- and across-
cohort changes experienced by immigrants both within and across national groups.
In general, however, the within-cohort change in the probability of self-
employment is positive, while the across-cohort change is negative. For
instance, in the decomposition that nets out the change in P. for the native1.
born, 17 out of 18 within-cohort effects are positive (and 11 of these effects
have a t-ratio exceeding unity), while 14 of the across-cohort effects are
.negative (with 9 of these effects having t-ratios above 1.0 in absolute value).
These results, therefore, are consistent with the hypothesis that as immigrants
assimilate in the United States the relative .gains from self-employment: increase.
In addition, the results in Table 3 also show the existence of a secular shift
in the relative gains of self-employment for immigrants. In other words, more
recent immigrant cohorts perceive self-employment as a relatively better employment
alternative than earlier immigrant cohorts.
IV. Enclaves and the Self-Employment of Immigrants
An important result in Section III was the finding that the probability
of self-employment of immigrants exceeds the probability of self-employment
of native-born men for practically all ethnic/racial groups. Although this
result can be explained in terms of the hypothesis that immigrants face
higher self-employment incomes (relative to the native-born), this explanation
does not really provide an understanding of why the nativity differences
exist. The sociological literature, however, has presented extensive anecdotal
evidence of how immigrants create enclaves by concentrating in specific
geographic areas, and of how these enclaves create and expand opportunities
1 . ._ ..... ~ _
18
for immigrants to become self-employed. These opportunities arise because
immigrants from a particular national group are assumed to have a comparative
advantage in serving the needs of consumers from that national group. The
comparative advantage, of course, is created by informational asymmetries
between the immigrants and the rest of the population, and these informational
asymmetries may include such factors as better knowledge of consumer preferences
and knowledge of the language spoken by the immigrant population.
This hypothesis can be easily tested by analyzing the self-employment
propensities of the three Hispanic groups (i.e., Mexicans, Cubans, and
other Hispanics) studied in the previous section. Since these three groups
are much more homogeneous in culture and language than the three other
groups analyzed earlier (namely, whites, blacks and Asians), it is likely
that enclaves of Hispanics may have opened up self-employment opportunities
for Hispanic immigrants. FormallY,the enclave hypothesis can be tested
by estimating the regression:
(15)
where Zi is a vector of socioeconomic characteristics, and qh is the fraction
of the SMSA's population that is Hispanic. 8 The enclave hypothesis implies
that A is positive. In addition, if equation (15) is estimated separately
in the foreign-born and native-born samples, and if immigrants are the main
beneficiaries of the self-employment opportunities opened up by the enclave,
one would expect that the impact of qh on the probability of self-employment
is larger in the immigrant than in the native-born sample.
Table 4 presents the estimated impact dp/dqh = ~p(1-p) for each of the
six Hispanic groups under study, where the derivative is evaluated at the mean
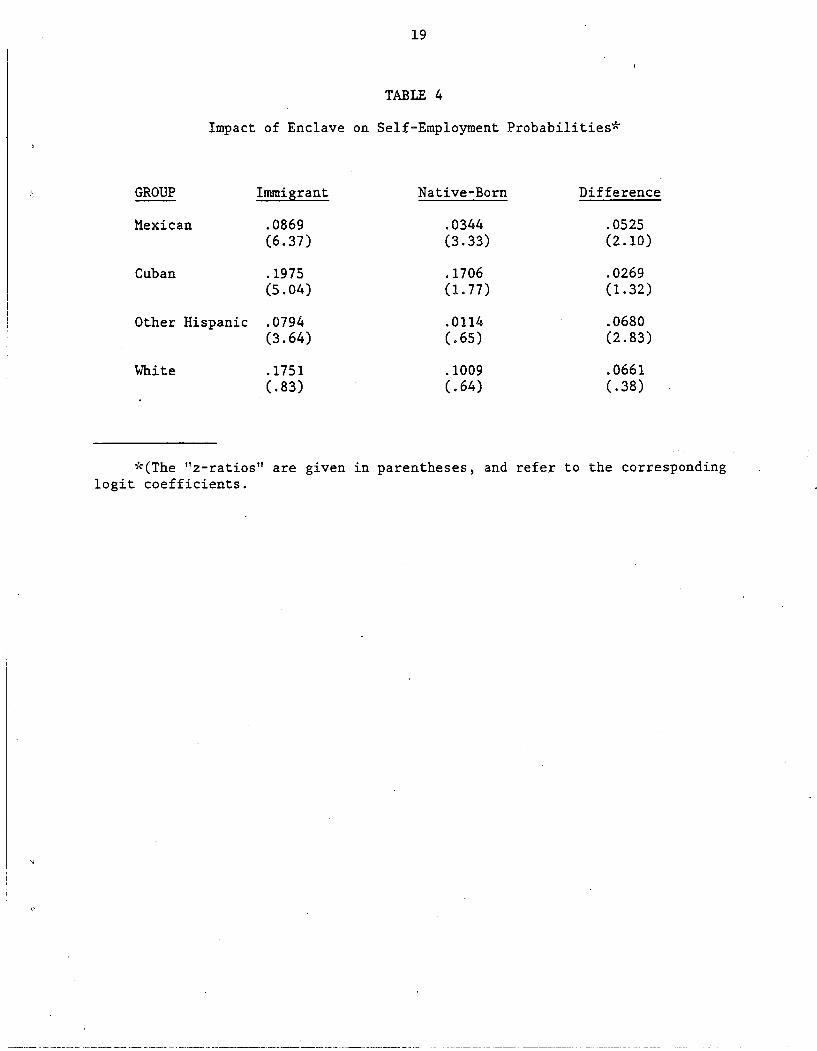
19
TABLE 4
Impact of Enclave on Self-Employment Probabilities*
GROUP Immigrant Native-Born Difference
Mexican .0869 .0344 .0525(6.37) (3.33) (2.10)
Cuban .1975 .1706 .0269(5.04) (1.77) (1.32)
Other Hispanic .0794 .0114 .0680(3.64) (.65) (2.83)
White .1751 .1009 .0661(.83) (.64) (.38)
~"(The "z-ratios" are given in parentheses, and refer to the correspondinglogit coefficients.
"
1__._- _._._. .. . . . _
20
self-employment probability of each group. For purposes of comparison the
table also presents the impact of qh on the self~employment probability of
non-Hispanic whites. Two important results are apparent. First, the coef
ficient A is indeed positive and significant in the Hispanic samples. That
is, Hispanics are more likely to be self-employed in areas which have larger
Hispanic populations. Moreover, note that the impact of qh in the non-Hispanic
white samples is insignificantly different from zero; hence the results for
Hispanics cannot be dismissed as reflecting some unknown area-specific effect.
Second, the impact of qh on the self-employment probability is larger for
immigrants than for the native-born, and this difference is significant in two
of the three Hispanic samples. Thus the enclave is indeed an important mechanism
in the creation of the gap in the self~employmentpropensities of the native-born
and the foreign-born. 9
v. Summary
Self-employment represents an important component of the immigrant exper
ience in the u.S. labor market. Its omission in earlier studies cannot be
justified by the presumption that self-employed workers represent a numerically
unimportant part of the immigrant labor force. In fact, among large immigrant
groups self-employment rates exceed 15 percent of the labor force. This paper
begins the study of the immigrant self-employment experience by analyzing the
self-employment rates of 18 immigrant cohorts using the 1970 and 1980 U.S.
Census. The major findings are:
1. Assimilation has a sizable impact on self-employment probabilities:
The long~r the immigrant resides in the United States, the higher the pro
bability of self-employment.

l~_
21
2. There has been a rapid increase in the self-employment rates exper
ienced by ~ecent immigrant cohorts as compared to earlier cohorts. These
across-cohort changes may have been caused by the relative decline of oppor
tunities faced by immigrants in the salaried sector over the last decades.
3. Immigrants are more likely to be self-employed than similarly
skilled native-born workers. A major reason for this differential is that
geographic enclaves of immigrants increase self-employment opportunities
particularly for immigrants who share the same national background as the
residents of the enclave.
The prevalence of self-employment among immigrants (and native-born
workers) in the labor market suggests that much additional work is needed
in this area. The analysis in this paper makes clear that continued research
of the self-employment option, and of self-employment incomes is likely to
greatly enhance our understanding of the immigrant assimilation process.
--~. --_.------ .._.._.
22
Notes
lRecent studies by Lazear and Moore (1984) and Wolpin (1977) have
been concerned with the question of why there exist smaller skill differ-
entials among the self-employed than among salaried workers. Studies by
Fuchs (1968, 1982) provide a descriptive analysis of the extent of self-
employment among older workers and in the service sector.
21n addition, non-random emigration of the immigrant population
biases the impact of t. on both market wage rates and self-employment in~
comes. See Borjas (1985) for a discussion of the biases introduced by the
high emigration rates of the foreign-born.
30f course, there are many reasons why, in actuality, the cohorts in
. the 1970 and 1980 Census data may not be perfectly matched. For instance,
the presence of emigration will lead to secular trends in the size (and
quality) of a specific immigrant cohort. Similarly, institutiona~ changes
in the Census enumeration procedures may lead to different counts of immi-
grants (and native-born persons) in particular cohorts across Censuses.
Finally, there may be age (and/or cohort) related differences in labor
supply and mortality rates which generate additional differences in the
size of the cohort samples included in the regressions over time. Note,
however, that all these problems will impart biases on both cross-section
and cohort analyses so that, in a sense. the cohort study presented below
nets out only one of the many sources of bias, that due to violations of
the assumption of stationarity in the quality of immigrants at the time of
entry.
4The sampling fractions for 1970 are: white native-born (.001 of the popu-
lation), all other groups (.01). The 1980 sampling factors are: black
natives (.00245), black immigrants (.01651), Mexican natives (.01652),
Mexican immigrants (.01638), white natives (.00042), white immigrants
23
(.00249), all other groups (.05).
5The Hispanic samples do not include the group of Puerto Rican men
since Puerto Ricans born in Puerto Rico are not asked the year they mi
grated to the u.s. by the Census.
6The t-ratios in Table 3 refer to the relevant transformations of
the 10git coefficients and are estimated from the covariance matrix of
the regression coefficients.
7Note that since the constraints Y70= Yao= Y and 010= 0ao= 0 have
been imposed on the estimates, the cross-section regressions in Table 2
are not directly comparable to the cross-section estimates in Table 3. In
particular, Table 2 constrains the socioeconomic variables to have the
same impact for the foreign- and native-born in the 19aO Census year,
while Table 3 allows a differential impact between the two groups but
assumes this difference is invariant to calendar year.
aThe analysis was also conducted with alternative definitions for the
variable qh. These specifications included such variables as percent
Mexican, percent Cuban, etc. The model in equation (15) does as good a job
in describing the enclave effect as the more detailed specification.
9It would be of interest, of course, to analyze - along similar lines
the relative levels of salaried and self-employment incomes. Unfortunately,
this extension of the work introduces the difficult technical problem of
correcting for sample selection biases both within and across immigrant co
horts. In addition, self-employment incomes, as reported in the Census, are
an amalgam of returns to human and physical capital. A complete study of
the income levels, therefore, will require much more detailed data on the
source and types of income of the self-employed.
24
References
Bonacich, Edna and Jon Modell. The Economic Basis of Ethnic Solidarity:Small Business in the Japanese American Community. Berkeley and LosAngeles: Univeristy of California Press, 1980.
Borjas, George J. "Assimilation, Changes in Cohort Quality, and the Earningsof Immigrants," Journal of Labor Economics, October 1985.
Chiswick, Barry R. "The Effect of Americanization on the Earnings of ForeignBorn Men," Journal of Political Economy, October 1978.
Cummings, Scott, editor.Business Enterprise .
Self-Help in Urban America: Patterns of MinorityNew York: Kenikart Press, 1980.
.Fuchs, Victor R. "Self-Employment and Labor Force Participation of OlderMales," Journal of Human Resources, Summer 1982.
The Service Economy. New York: National Bureau of EconomicResearch, 1968.
Lazear, Edward and John Moore. "Incentives and Earnings Profiles." QuarterlyJournal of Economics, May 1984.
Pyong, Cap Min. "From White-Collar Occupations to Small Business: KoreanImmigrants' Occupational Adjustment." Sociological Quarterly, 1984.
Wolpin, Kenneth. "Education and Screening." American Economics Review,December 1977.