Embed Size (px)
DESCRIPTION
University committee on faculty affairs October 8, 2013 budget and planning overview. Office of Planning and Budgets. MSU All Funds Revenues. 1990: $0.7B. 2012: $2.0B. Departmental $40M 6%. Auxiliary: $121M 17%. Tuition & Fees: $134M 19%. Auxiliary: $293M 14%. Tuition & Fees: - PowerPoint PPT Presentation
Citation preview

•1

Other:
$14M 2%
1990: $0.7B 2012: $2.0B
•Office of Planning and Budgets
•2
Tuition & Fees:
$134M 19%
Tuition & Fees:
$641M 31%
Auxiliary:
$121M 17%
Auxiliary:
$293M 14%
Appropriations:
$206M 30%
Appropriations:
$241M 12%
AgBio Research/MSUE
:
$38M 5%
AgBio Research/MSU
E:
$52M 3%
Sponsored Programs:
$137M 20%Sponsored Programs:
$443M 22%
Gifts:
$44M 6%
Gifts:
$174M 9%
Other:
$31M 1%
Departmental
$165M 8%
Departmental
$40M 6%
Ranking:
1)Appropriation
2)Sponsored Programs
3)Tuition & Fees
4)Auxiliary
5)Gifts
Ranking:
1)Tuition & Fees
2)Sponsored Programs
3)Auxiliary
4)Appropriation
5)Gifts
MSU All Funds Revenues

•3
By Fund
1990: $0.7B 2012: $2.0B
Fluctuations between annual revenue and expense totals vary with investment performance and state appropriations outcomes
MSU All Funds Expenses

•4
•State Appropriations SupportState Appropriations History
Appropriations down
$81M over 10 years
If increased at inflation, MSU appropriations
would be $166.6M more than current
levels

•5

•6
•7

Tuition & Fees / Cost of Attendance
Northwestern University $43,779University of Michigan $39,122Michigan State University $32,580Indiana University $31,484University of Illinois $29,102Penn State University $28,746Purdue University $28,702University of Wisconsin $26,628University of Iowa $26,279Ohio State University $25,450University of Nebraska $20,734University of Minnesota $18,774
Northwestern University $60,840University of Michigan $51,940Indiana University $44,568Penn State University $44,458Michigan State University $43,986University of Illinois $43,144Purdue University $42,010University of Wisconsin $40,988Ohio State University $40,902University of Iowa $40,054University of Nebraska $34,450University of Minnesota $29,774
Non-Resident Tuition & Fees Non-Resident Cost of Attendance
MSU ranks 3rd in the Big Ten for non-resident tuition and fees and 5th for cost of attendance
•8
Big Ten Non-Resident

Tuition & Fees / Cost of Attendance
Resident Tuition & Fees Resident Cost of Attendance
MSU ranks 6th in the Big Ten for resident tuition and fees and cost of attendance
Northwestern University $43,779Penn State University $16,444University of Illinois $14,960University of Minnesota $13,524University of Michigan $12,994Michigan State University $12,623University of Wisconsin $10,379Indiana University $10,034Ohio State University $10,034Purdue University $9,900University of Iowa $8,057University of Nebraska $7,984
Northwestern University $60,840Penn State University $32,156University of Illinois $29,002University of Michigan $25,812Ohio State University $24,850University of Minnesota $24,524Michigan State University $24,029University of Wisconsin $23,759Purdue University $23,208Indiana University $23,118University of Iowa $21,832University of Nebraska $21,700
•9
Big Ten Resident
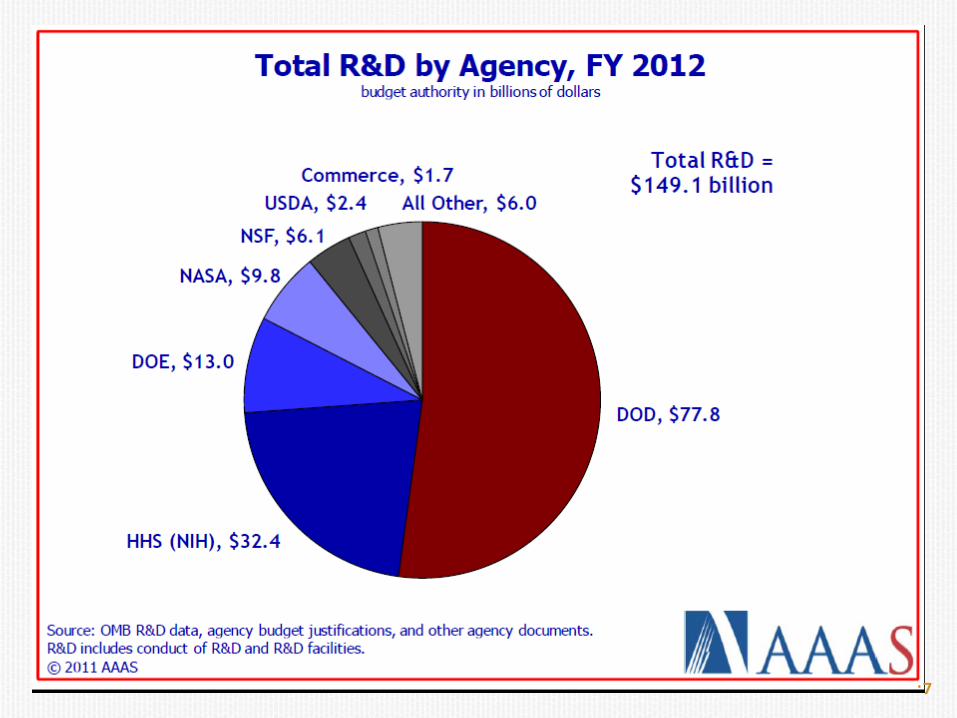
•10
MSU Endowment Status
•11
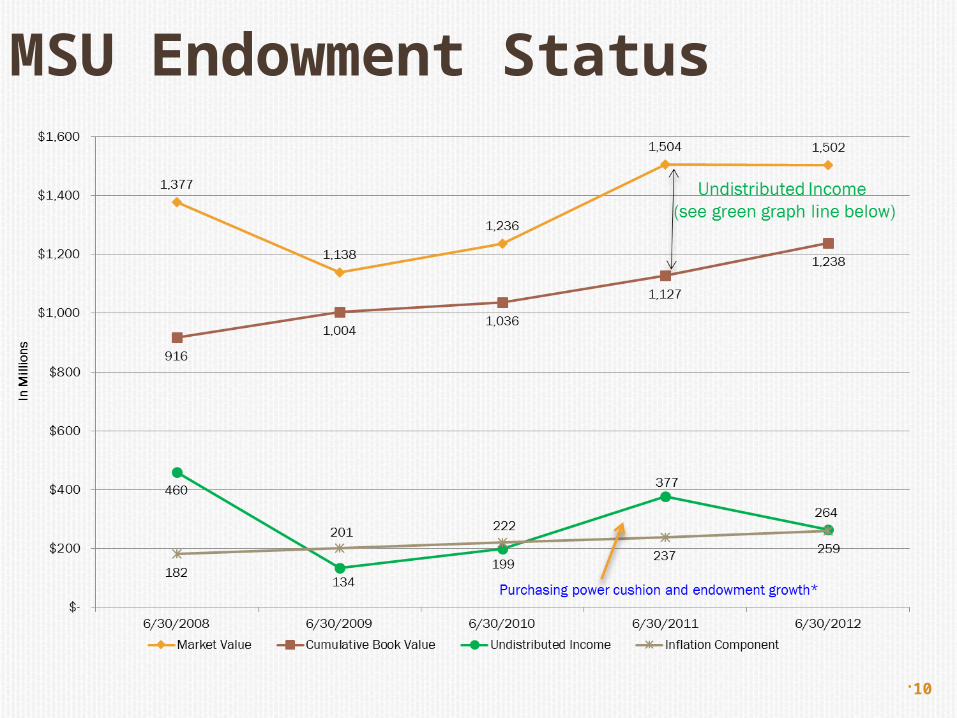
IPEDS 2010-11 reporting
Big Ten Revenues

•12
Big Ten Median & MSU
FY07-FY11
Big Ten Min Big Ten Median
Big Ten Max
As of 06/30/2011
Total Growth in Expenses
•13
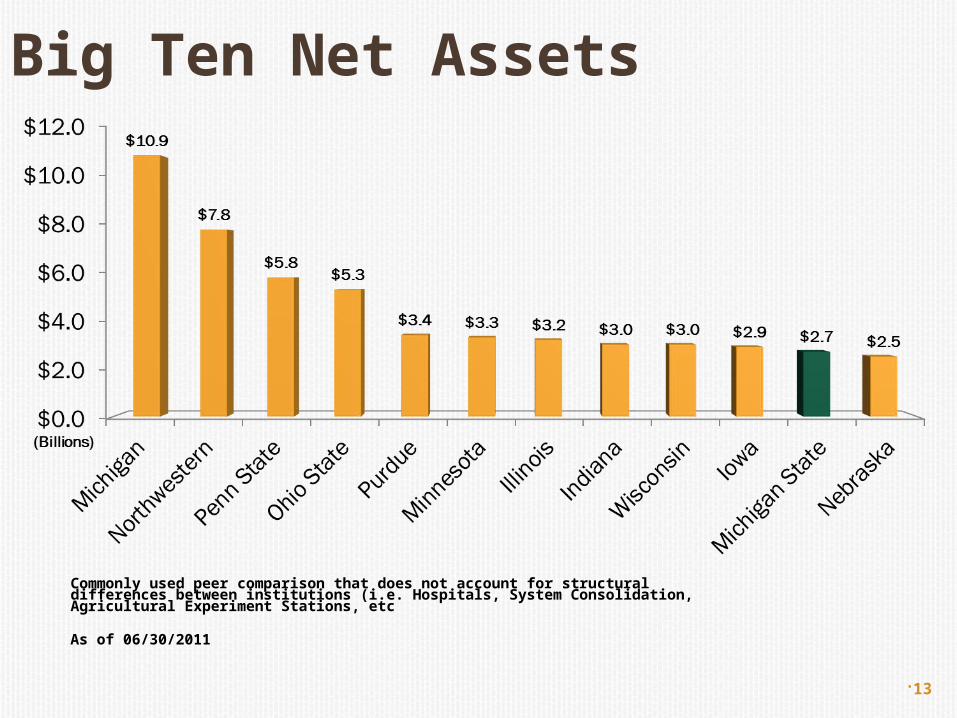
As of 06/30/2011
Commonly used peer comparison that does not account for structural differences between institutions (i.e. Hospitals, System Consolidation, Agricultural Experiment Stations, etc
Big Ten Net Assets

•14
Big Ten & MSU
FY07-FY11
Big Ten Min Big Ten Median
Big Ten Max
As of 06/30/2011
Total Growth in Unrestricted Net Assets

•15
Big Ten Median & MSU
FY07-FY11
Big Ten Min Big Ten Median
Big Ten Max
As of 06/30/2011
Total Growth in Debt
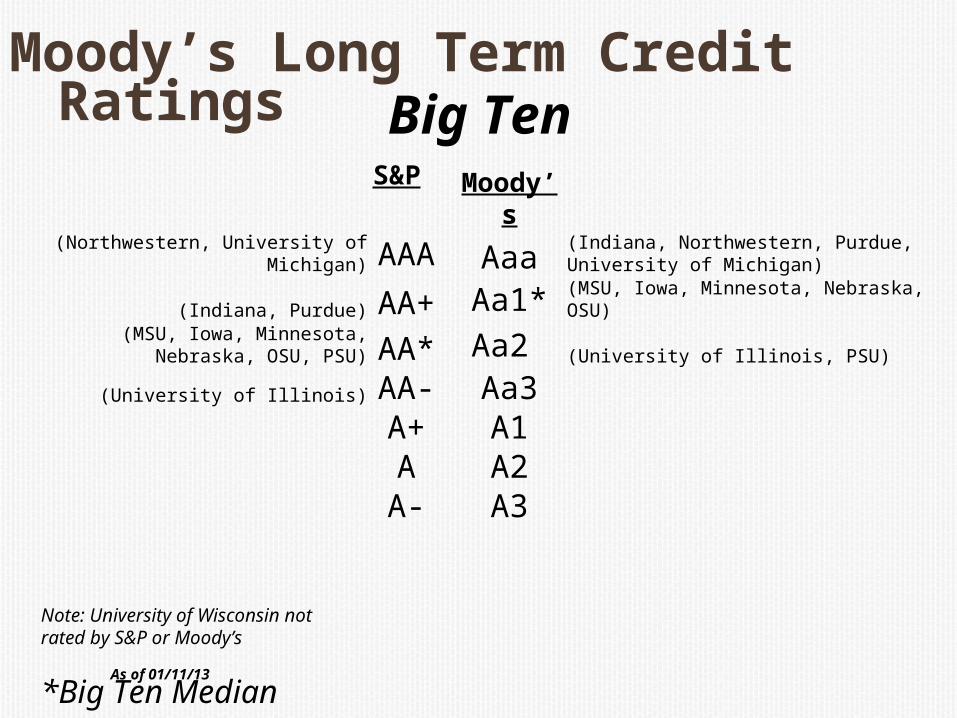
Moody’s Long Term Credit Ratings
S&P Moody’s
(Northwestern, University of Michigan) AAA Aaa(Indiana, Northwestern, Purdue, University of Michigan)
(Indiana, Purdue) AA+ Aa1* (MSU, Iowa, Minnesota, Nebraska, OSU)(MSU, Iowa, Minnesota, Nebraska, OSU,
PSU) AA* Aa2 (University of Illinois, PSU)
(University of Illinois) AA- Aa3A+ A1A A2A- A3
Note: University of Wisconsin not rated by S&P or Moody’s
*Big Ten Median
Big Ten
As of 01/11/13

*In addition to the above, MSU also has $81M in short-term commercial paper to be converted to long-term debt, and $143M in short-term commercial paper to be repaid by internal units
Outstanding debt includes issues 2000A, 2003A, 2005, 2007A, 2007B, 2010A, 2010C
Long Term Bonds
General Fund General Fund $338
Revenue Based Residential and Hospitality Services $169 Intercollegiate Athletics $57
Projects Parking Operations $47 Facility for Rare Isotope Beams $17 MSU College of Law $18 Recycling $12 Vet Oncology $5 National Superconducting Cyclotron Laboratory $5 Executive Development CenterAnaerobic Digestion Research and Ed. Center
Donor Supported Projects Secchia Center-CHM West MI $16 Wharton Center $13
Total $697*
Summary of Current Bonded Debt

Five Year Performance
Targeted range from 6-7
Adverse performance results mainly from loss of appropriations and negative investment returns
•18
Composite Financial Index

•19•Dollars in Thousands
Source: NSF Survey
Big Ten Comparison
Research Expenditures
2006 2010 20111 Yr.
ChangeU of M* $837,529 $1,184,445 $1,279,123 8.0%Wisconsin* $904,787 $1,029,295 $1,111,642 8.0%Minnesota* $609,918 $786,074 $847,419 7.8%OSU $643,283 $755,194 $832,126 10.2%PSU* $656,634 $770,449 $794,846 3.2%Purdue* $420,426 $548,980 $578,231 5.3%Illinois $524,680 $515,133 $545,669 5.9%MSU $388,845 $431,373 $454,248 5.3%Iowa* $356,169 $444,034 $443,893 0.0%Nebraska $214,053 $191,268 $235,296 23.0%Indiana* $378,212 $177,520 $184,096 3.7%
* Institutional numbers represent all campus amounts for 2006.
MSU Financial Data
•20
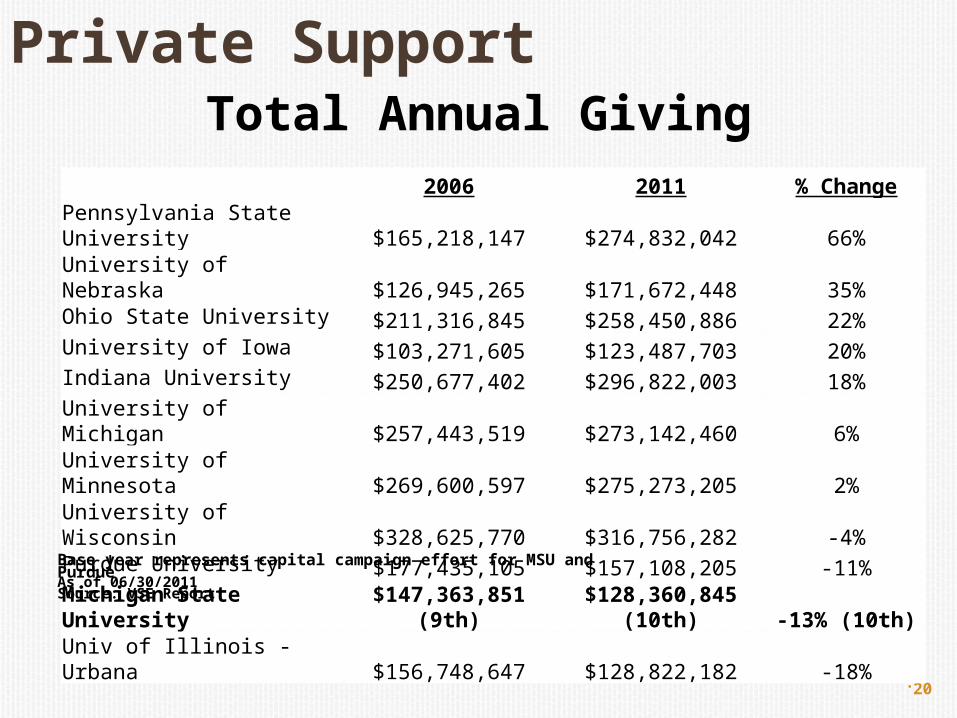
Total Annual Giving 2006 2011 % ChangePennsylvania State University $165,218,147 $274,832,042 66%University of Nebraska $126,945,265 $171,672,448 35%Ohio State University $211,316,845 $258,450,886 22%University of Iowa $103,271,605 $123,487,703 20%Indiana University $250,677,402 $296,822,003 18%University of Michigan $257,443,519 $273,142,460 6%University of Minnesota $269,600,597 $275,273,205 2%University of Wisconsin $328,625,770 $316,756,282 -4%Purdue University $177,435,105 $157,108,205 -11%Michigan State University $147,363,851 (9th) $128,360,845 (10th) -13% (10th)Univ of Illinois - Urbana $156,748,647 $128,822,182 -18%
As of 06/30/2011Source: VSE Report
Base year represents capital campaign effort for MSU and Purdue
Private Support

•21
Institutions with on campus hospitals, such as U of M, include patient donor support in the above calculations
Includes approximately $749M traditional endowment, $651M endowment trust and $318M MSU FoundationSOURCE: Council for Aid to Education reports
2006 2011 % ChangeUniversity of Michigan $5,652,262,026 $7,834,751,733 39%Purdue University $1,494,553,799 $2,001,600,855 34%Pennsylvania State University $1,389,600,000 $1,831,100,000 32%University of Iowa $832,869,000 $1,058,694,909 27%University of Wisconsin $1,639,014,521 $2,066,958,201 26%Indiana University $1,276,159,743 $1,574,815,344 23%Michigan State University $1,482,844,988 (6th) $1,718,100,760 (6th) 16% (7th)University of Minnesota $2,287,562,061 $2,514,007,307 10%University of Nebraska $1,153,559,000 $1,241,577,000 8%Univ of Illinois - Urbana $1,252,289,994 $1,132,625,790 -10%Ohio State University $1,996,839,412 $1,405,646,025 -30%
Endowment Market Value

•22
• Involves engagement of campus stakeholder groups
• Board of Trustees
• Academic governance
• ASMSU
• COGS
• Refines multi-year planning focused on improving the
value proposition for stakeholder
• University administrators
• Collective bargaining
groups
• RHA
• State policy makers
MSU Budget Process

Spartans Will.
•23
MSU Long-Term Planning

•24
Academic Initiatives• Creating a Campus-wide Strategy for data,
technology, teaching and learning
• Creating a campus climate to support interdisciplinary work
• Closing the graduation gap
• Fostering a healthier campus

•25
• An updated ten year analysis of eight critical university areas requiring long-term support because of current state and federal financial circumstances
• The eight categories are:
– Just-in-Time Facilities Renewal– Administrative Computing (EBSP, EBSP Transition,
Research Administration, SIS)– Specialized Research Space – Financial Aid – Health Care– F-RIB – Academic Quality – Energy/Other Regulatory Issues
Long-Term Financial Framework

November-December 2013Executive Branch
July 2014State appropriation
passed
January 20142013-14 executive
budget recommendation
March, April, May, 2014
Legislative hearings: House and Senate
State Appropriations Timeline
•26

June-October, 2013Trustees act on 2013-14
budgets and 2012-13 budget request
April-May, 2014Admin/Board discussion on
2014-15 budget guidelines
February - May 2014Budget Planning Meetings
Fall 2013Budget & Planning - Strategic Issues
June-July, 2014Board action on final 2014-15
budgets
June, 2014Preliminary 2015-16 operating
and capital outlay request formulated
August, 2014Administration consultation on
2015-16 budget request
October, 2014Trustees act on 2014-15 budget
request
MSU Internal Timeline
•27

Formula based on budget proposal
•Salary increments
•Operating support
•1% reallocation
Differential
•Program allocations
•Reductions
Operating UnitsSeparately
Reviewed Items
•Financial aid
•Utilities
•Health care
•Other benefits
•Financial framework
General Fund Budget Development
•28

• 29
Budget Guidelines Summary
Budget Item2011-12
Approved2012-13
Approved2013-14 Proposed
2014-15Preliminary
State Appropriations (15.0)% 1.6% 1.82% 2%
Tuition & Fees6.9% 3.6%
1.9% Lower Div
3.6% Upper Div
3.0% Lower Div
3.0% Upper Div
Financial Aid 10.0% 5.5% 4.5% 4.0%
Graduate Assistants 2.0% 2.0% 2.0% 2.0%
Faculty Salaries 2.0%* 2.0%* 2.25%** 2.0%*
Utilities 5.0% 4.0% 4.0% 4.0%***
Health Care 5.0% 5.0% 1.5% 5.0%
Framework-Academic Competitiveness
$2.0 $4.7 $2.0 $2.0
Balance $0 $0 $0 $0
•Preliminary 2013-14 budget approved by the BOT in June 2012 •*Includes 1.5% general merit, 0.5% college market, and 0.5% provost market pool•** Includes 1.5% general merit, 0.75% college market, and 0.5% provost market pool•***Infrastructure financing

•30
Higher education Price index average approximates 2.44% for most recent five year period (through 2012)
FY10 FY11 FY12 FY13 FY14 5 Year AverageBase 1.72% 1.10% 0.03% 2.97% 2.63% 1.69%
Financial aid 1.37% 1.10% 0.98% 0.64% 0.45% 0.91%Enrollment Growth 0.16% 0.00% 0.18% 0.14% 0.14% 0.12%Indirect Cost Pass-Through 0.02% 0.10% 0.27% 0.23% 0.00% 0.13%Revenue Based Initiative 1.17% 1.43% 1.67% 1.35% 0.76% 1.28%
Total 4.45% 3.73% 3.13% 5.33% 3.98% 4.12%
Budget Rates of Change

Thank You
•31