Embed Size (px)
Citation preview
University collaboration with local communities toward the formation of low carbon city in Bunkyo City.
Keisuke HanakiUniversity of Tokyo
ISCN symposium in Shanghai, 2010
2
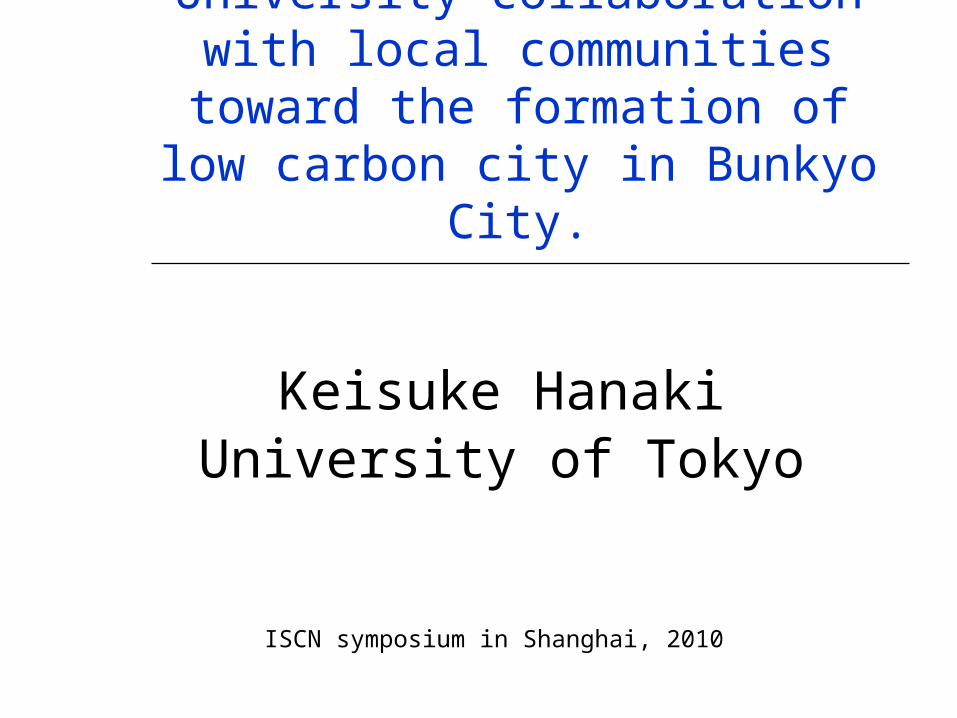
Location of campus
Kashiwa
Hongo
1,592,030 ㎡ Total floor area of UT
10 undergraduate school,15 graduate school, 11 institutes and 18 centers, etc.
(Todai Five main campuses: Hongo, Komaba1, Komaba2, Kashiwa, Shirokane)
ShirokaneKomaba 1 Komaba2
chiba
Tokyo
kanagawa
Saitama
Ibaraki
Tokyo core
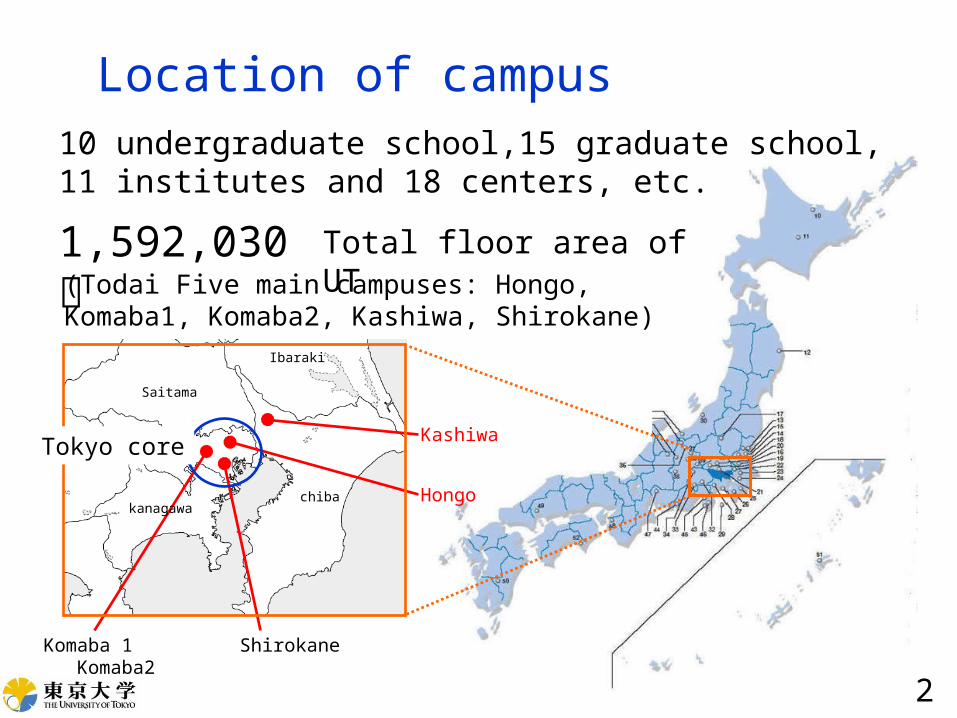
Size of Todai
3
Board, faculty, staff
undergraduate school
7,649
14,197
14,327 graduate school
36,173 members
891,000㎡148,000㎡119,000㎡83,000㎡
126,000㎡
Hongo
Komaba 1
Komaba 2
Shirokane
Kashiwa
1,369,000 ㎡
(86% of total floor area of whole UT)
Total floor area of Five main campus
Analysis of current facilities
4
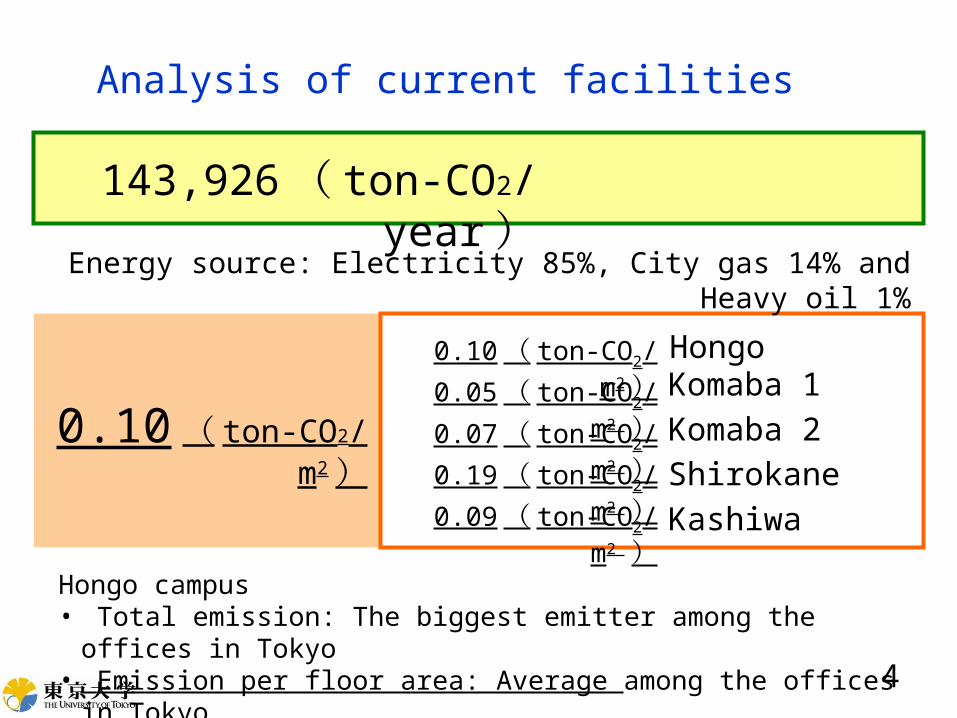
143,926 ( ton-CO2/year )
0.10 ( ton-CO2/m2 )
Energy source: Electricity 85%, City gas 14% and Heavy oil 1%
Hongo0.10 ( ton-CO2/ m2 )0.05 ( ton-CO2/ m2 )0.07 ( ton-CO2/ m2 )0.19 ( ton-CO2/ m2 )0.09 ( ton-CO2/ m2 )
Hongo campus• Total emission: The biggest emitter among the offices in Tokyo• Emission per floor area: Average among the offices in Tokyo
Komaba 1
Komaba 2
Shirokane
Kashiwa
5
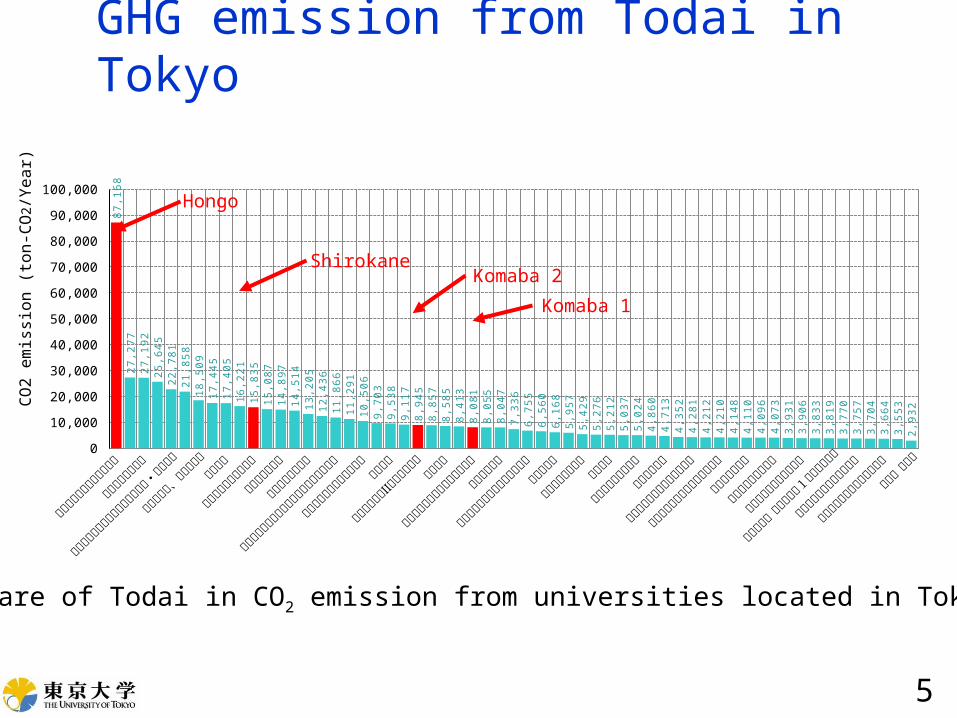
GHG emission from Todai in Tokyo
東京大学本郷キャンパス
東京医科歯科大学
慶應義塾大学信濃町キャンパス・大学病院
順天
堂大
学、
順天
堂医
院
昭和
大学
東京大学医科学研究所
日本
大学
医学
部
東京医科大学病院
公立大学首都大学東京南大沢キャンパス
青山学院青山キャンパス
明治
大学
Ⅱ
東京大学駒場キャンパス
玉川
学園
東京大学大学院総合文化研究科
電気
通信
大学
早稲田大学早稲田キャンパス
学習院大学
法政
大学
多摩
校舎
成蹊
学園
法政
大学
富士
見校
地
明治
薬科
大学
帝京大学八王子キャンパス
東京農工大学府中キャンパス
明星
大学
日野
校
工学
院大
学新
宿校
舎
東京理科大学神楽坂校舎
お茶の水女子大学大塚1キャンパス
法政
大学
小金
井校
地梶
野町
早稲田大学戸山キャンパス
昭和
女子
大学
0
10,000
20,000
30,000
40,000
50,000
60,000
70,000
80,000
90,000
100,000
87
,16
8
27
,27
7
27
,19
2
25
,64
5
22
,78
1
21
,85
8
18
,50
9
17
,44
5
17
,40
5
16
,22
1
15
,83
5
15
,08
7
14
,89
7
14
,51
4
13
,20
5
12
,43
6
11
,86
6
11
,29
1
10
,50
6
9,7
03
9
,53
8
9,1
17
8
,94
5
8,8
57
8
,58
5
8,4
13
8
,08
1
8,0
55
8
,04
7
7,3
36
6
,75
5
6,5
60
6
,16
8
5,9
57
5
,42
9
5,2
76
5
,21
2
5,0
37
5
,02
4
4,8
60
4
,71
3
4,3
52
4
,28
1
4,2
12
4
,21
0
4,1
48
4
,11
0
4,0
96
4
,07
3
3,9
31
3
,90
6
3,8
33
3
,81
9
3,7
70
3
,75
7
3,7
04
3
,66
4
3,5
53
2
,93
2
Hongo
ShirokaneKomaba 2
Komaba 1
CO
2 e
mis
sio
n (
ton
-CO
2/Y
ea
r)
Share of Todai in CO2 emission from universities located in Tokyo

6
Characteristics of Bunkyo City Bunkyo city (ward) is one of 23 cities in Tokyo
Metropolitan area Population: 178 thousands (2005)
Daytime population: 336 thousands Household: 97 thousands (2005) CO2 emission: 1.15 million t-CO2/year
6.46 t/nighttime population-year CO2 emission breakdown
Household sector: 25% Office, Commercial and service
sector: 52% Many universities
Bunkyo
Tokyo 23 cities (ward)
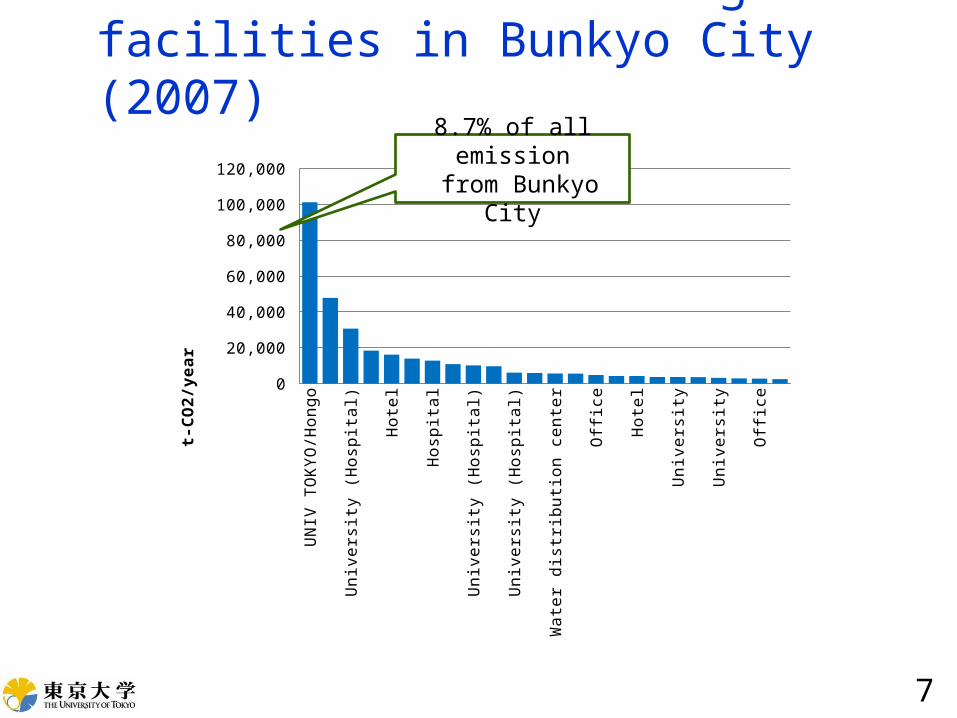
CO2 emissions from large facilities in Bunkyo City (2007)
7
UN
IV T
OK
YO
/Ho
ng
oH
ote
l/am
use
me
nt
Un
ive
rsity
(H
osp
ital)
Un
ive
rsity
(H
osp
ital)
Ho
tel
Offi
ceH
osp
ital
Offi
ceU
niv
ers
ity (
Ho
spita
l)O
ffice
Un
ive
rsity
(H
osp
ital)
Offi
ceW
ate
r d
istr
ibu
tion
ce
nte
rC
ity O
ffice
Offi
ceU
niv
ers
ityH
ote
lO
ffice
Un
ive
rsity
Offi
ceU
niv
ers
ityO
ffice
Offi
ceS
ew
era
ge
Pu
mp0
20,000
40,000
60,000
80,000
100,000
120,000 t-
CO
2/y
ea
r
8.7% of all emission from Bunkyo City

8
GHG emission reduction target
University target (2012) 15% reduction of non-experimental origin from 2006
Bunkyo city’s target (2014 & 2019)8% reduction from 2005
Cap and trade system of Tokyo Metropolitan Government (since April 2010)First compliance period: 2010-2014Target: 8% reduction from recent base years
(office and universities)
Campus GHG target
9
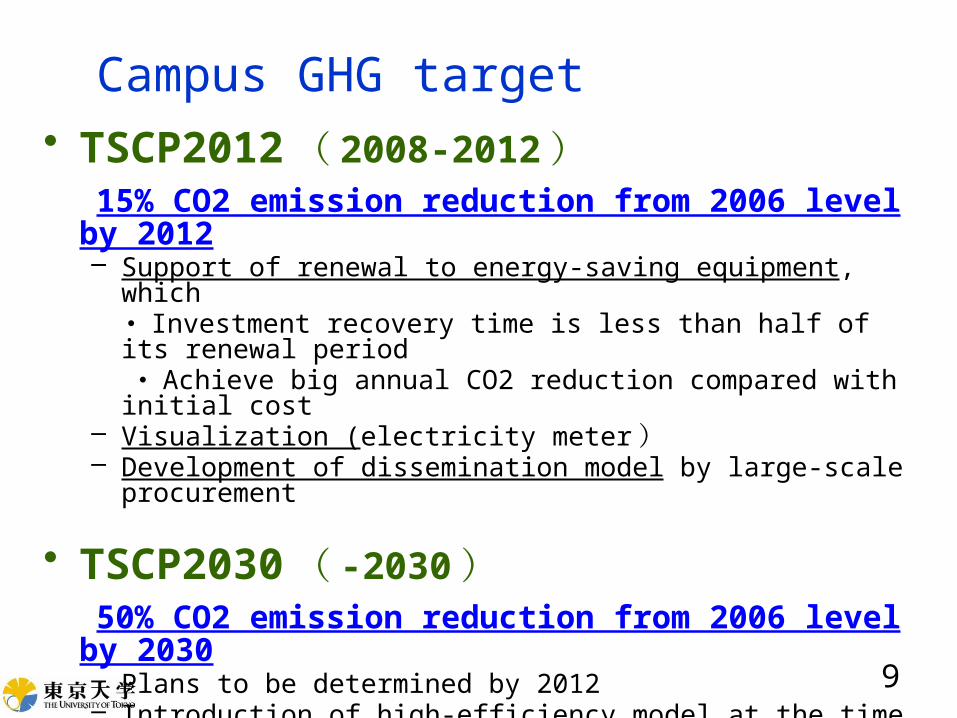
• TSCP2012 ( 2008-2012 ) 15% CO2 emission reduction from 2006 level by 2012
– Support of renewal to energy-saving equipment, which ・ Investment recovery time is less than half of its renewal period ・ Achieve big annual CO2 reduction compared with initial cost– Visualization (electricity meter )– Development of dissemination model by large-scale procurement
• TSCP2030 ( -2030 ) 50% CO2 emission reduction from 2006 level by 2030
– Plans to be determined by 2012– Introduction of high-efficiency model at the time of renewal of the
equipment's– Introduction of renewable energy ( Solar power, etc. )

GHG Reduction Plan & StrategiesTarget
10
2003 2004 2005 2006 2007 2008 2009 2010 2011 201290,000
100,000
110,000
120,000
130,000
140,000
150,000
12
0,8
16
13
0,9
32
13
3,5
47
13
5,7
39
14
3,5
35
14
3,9
26
14
1,0
00
12
1,4
86
Increase due to new hospital and super computer
Expectation
TSCP2012Target
Standard year
Ann
ual C
O2 e
mis
sion
(to
n-C
O2/Y
ear)
Annual CO2 emission in five main campuses
July 2008 to March reduction: 20134,300 ton-CO2/Year
Reduction of 19,500 ton-CO2/Year necessary after April 2010

GHG Reduction Plan & StrategiesFinancial incentive
11
Reflection in planAdditional measures
TSCP2012Master Plan
Plan examinationMeasures execution
Effect verification
Administrative office Department
Each school
TSCP promotion cost ・・・ rest
・・・ four years
【 Investment recovery time 】
Levy 4% of utility cost
Plan-Do-Check-Action Cycle on TSCP
Mechanism of promotion
• Levy 4% of utility cost in each department as TSCP promotion cost• Set TSCP promotion cost based on investment recovery time• In a long run, ensure equity among departments
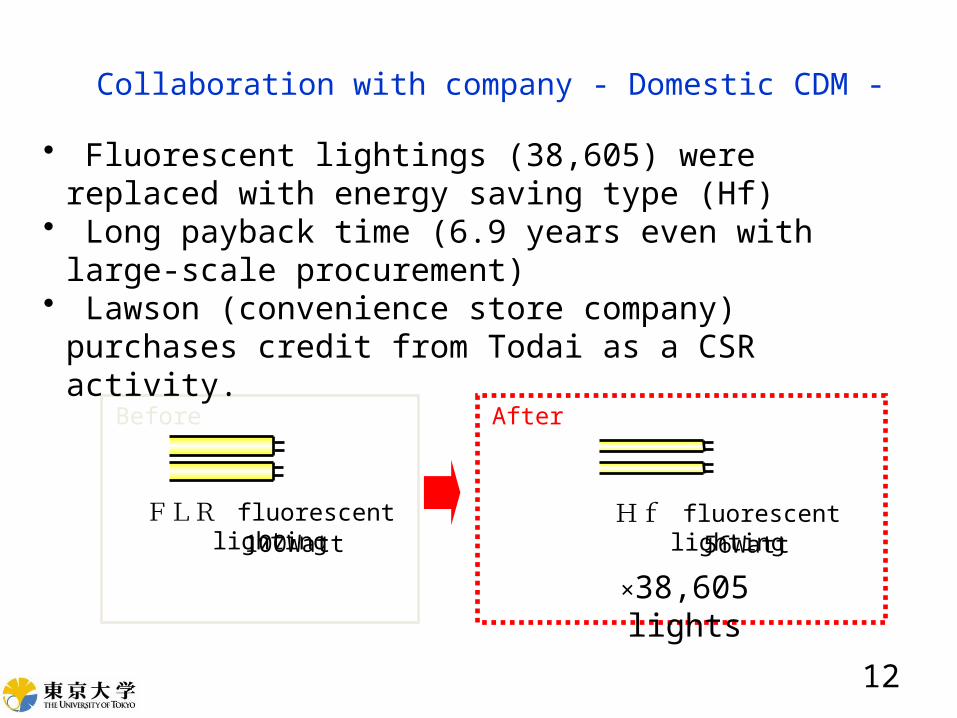
Collaboration with company - Domestic CDM -
12
FLR fluorescent lighting
Hf fluorescent lighting100Watt 56Watt
After
×38,605 lights
• Fluorescent lightings (38,605) were replaced with energy saving type (Hf)
• Long payback time (6.9 years even with large-scale procurement)
• Lawson (convenience store company) purchases credit from Todai as a CSR activity.
Before

13
Collaboration with Local NPO and other local universities Promotion of pro-environmental
behavior University: Analysis of consciousness
based on questionnaire survey NPO: Practice in primary schools and
small action in various meetings/events
14
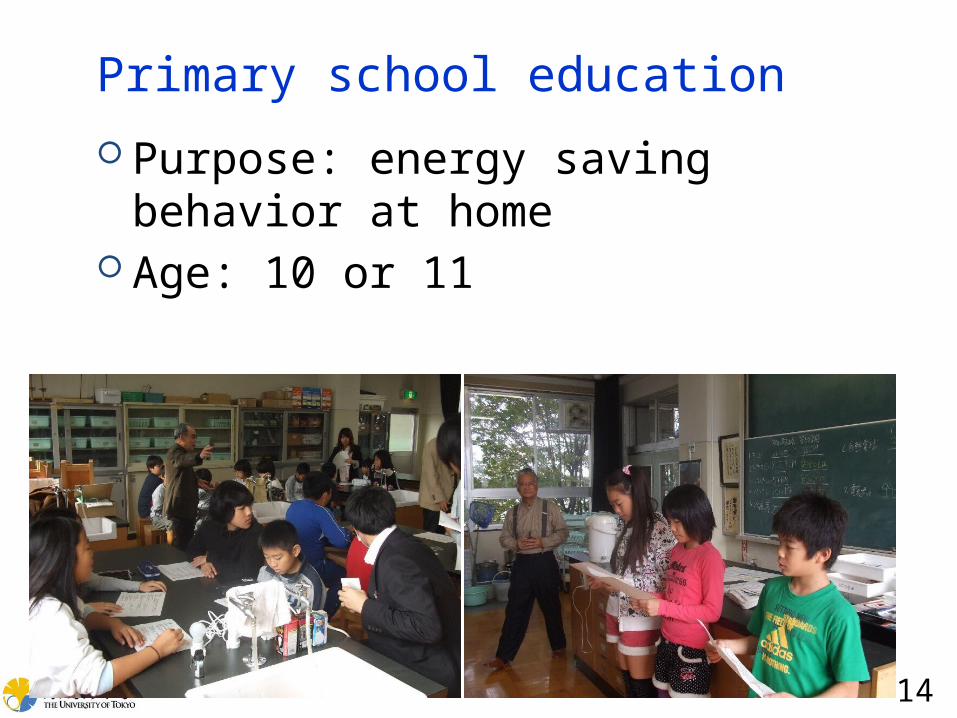
Primary school education
Purpose: energy saving behavior at home
Age: 10 or 11

15
Effect of behavior change of children at home
Started after the class
Started before the class
Not yet started
Stop doing
Frequent switch-off of the lighting 35 61 4 0
Moderate room temperature setting 22 61 9 9
Wise refrigerator use39 39 22 0
Stand-by power reduction 17 22 52 0
Water saving13 57 17 4

16
Kindergarten visit
Age: 5-6 Participation of students
from local universities

17
Continuing efforts
Involvements within universityPower of studentsRecognition by researchersTop initiatives
Collaboration with local communityParticipation of students
Volunteer basisacademic program basis (local internship)
Collaboration with local companies