Embed Size (px)
Citation preview
UNIVERSITI PUTRA MALAYSIA
APPLICATION OF REMOTE SENSING AND HYDROLOGICAL MODEL FOR RUNOFF ESTIMATION AND PREDICTION AT UPPER LANGAT
WATERSHED
WONG TAI HONG
FK 2004 40

APPLICATION OF REMOTE SENSING AND HYDROLOGICAL MODEL FOR RUNOFF ESTIMATION AND PREDICTION AT UPPER LANGAT
WATERSHED
By
WONG TAI HONG
Thesis Submitted to the School of Graduate Studies, Universiti Putra Malaysia, in Fulfilment of the Requirements for the Degree of Master of Science
March 2004

SPECIAL DEDICATION
All praise and glory are expressed to almighty Lord for His blessings and strengthen
me to complete this thesis
Utmost gratitude to my parents, Wong King Seng and Lau Kiin Hung
for their patience, faithfully and undying love for my success.
Beloved brothers, Tai Chiew, Tai Yong, and Tai Fung
for inspiring in me all the time
and
Finally, to my dearest wife “Lissa” (Chen Chai Khoon) who is always on my side,
never ending support, patience and encouragement.
ii
Abstract of thesis presented to the Senate of Universiti Putra Malaysia in fulfilment of the requirements for the degree of Master of Science
APPLICATION OF REMOTE SENSING AND HYDROLOGICAL MODEL FOR RUNOFF ESTIMATION AND PREDICTION AT UPPER LANGAT
WATERSHED
By
WONG TAI HONG
March 2004
Chairman : Associate Professor Shattri Mansor, Ph.D.
Faculty : Engineering
Rapid land development in recent years have degraded the environment and created a
need for watershed modeling to quantify the impacts. During land development
activities, natural flow paths in the watershed is normally being replaced or
supplemented by paved gutters, storm sewers, or other form of artificial drainage.
During rainfall, water remains above the land surface generating large amount of
runoff within a short time.
This study was carried out to evaluate the effectiveness of using HEC-HMS
hydrologic model, developed in the United States for predicting surface runoff from
tropical watershed. The current and future impacts of land development on runoff
rate were studied. The Upper Langat River Basin with a total area of 385km2 was
chosen for this study. The watershed is located in Selangor.
For this study, various datasets including topographical, hydrometeorological, river
cross-section and land use data were used. The land use map was derived from
iii
Landsat TM images. In order to extract land use information from remotely sensed
data, two classification techniques were examined, namely pixel-based and object
oriented classification. The result shows that the object oriented classification
provides better accuracy (91.429%) as compared to pixel-based classification which
has an overall accuracy of 81.667%.
The results from model application and statistical analysis show that HEC-HMS
estimated an average gap of 27% at moderate flow. During heavy rainfall, the
designed model seriously overestimated the runoff with an average gap of 70%. As a
conclusion, the HEC-HMS provides a conservative estimate of runoff output.
It was also observed that the impact of land development on peak flow is directly
proportional. Land development of 24.40km2 in year 1994 caused a peak flow of
74.62m3/s while in 1999, 50.23km2 of land development caused the peak flow of
84.04m3/s. In the proposed MSC land use plan for the year 2020, total area of
148.14km2 will be developed. This development is predicted to cause 128.15m3/s of
peak flow. Therefore, it is important for urban planner to take into consideration the
effect of the urbanization on the rate of runoff before developing a desired area. A
well designed drainage system must be put in place during land development in order
to prevent the flooding.
iv

Abstrak tesis yang dikemukakan kepada Senat Universiti Putra Malaysia sebagai memenuhi keperluan untuk Ijazah Master Sains
APPLIKASI PENDERIAAN JAUH DAN MODEL HIDROLOGI UNTUK PENAKSIRAN DAN RAMALAN ALIRAN LALUAN DI HULU LEMBAH
LANGAT
Oleh
WONG TAI HONG
March 2004
Pengerusi : Profesor Madya Shattri Mansor, Ph.D.
Fakulti : Kejuruteraan
Ancaman pembangunan tanah yang pesat terhadap alam sekitar di Malaysia dalam
beberapa tahun ini mencetuskan keperluan pemodelan lembangan sungai demi
mengetahui kesannya. Semasa aktiviti pembandaran, aliran laluan semulajadi dalam
sesuatu tadahan airbiasanya akan berubah atau bertukar kepada parit berturap,
pembetung ribut, atau pembuatan sistem saliran daripada unsur-unsur lain. Semasa
hujan, air itu akan terkumpul di atas permukaan bumi dan mengalir dengan jumlah
besar dalam masa yang singkat.
Kajian ini telah dijalankan untuk menguji keberkesanan perisian HEC-HMS model
hidrologi yang dihasilkan oleh Negara Amerika untuk menganggar aliran permukaan
dari sebuah tadahan air yang berskala lembangan. Kesan semasa and masa depan
guna tanah terhadap aliran permukaan juga telah dikaji. Hulu Lembah Sungai Langat
dengan jumlah keluasan 380 km2 telah dipilih untuk kajian ini. Kawasan tadahan air
ini terletak di Negeri Selangor.
v
Untuk kajian ini, pelbagai jenis data telah digunakan termasuk topografi, hidrocuaca,
keratan rentas sungai, dan data guna tanah. Peta guna tanah diperolehi daripada imej
Landsat TM. Untuk memperolehi informasi guna tanah daripada data penderiaan jauh,
dua teknik pengelasan telah diujikajikan, iaitu pengelasan berasaskan piksel dan
pengelasan berasaskan objek. Keputusan pengelasan menunjukan bahawa pengelasan
berasaskan objek memberi ketepatan yang lebih baik (91.429%) berbanding dengan
pengelasan berasaskan piksel yang cuma mencatat 81.667% ketepatan
keseluruhannya.
Keputusan daripada pengunaan model dan analisis statistik menunjukkan bahawa
HEC-HMS mencatat perbezaan purata sebanyak 27% pada aliran laluan serdehana.
Semasa hujan lebat, ia telah terlebih anggar aliran permukaan dengan serius,
mencatatkan perbezaan purata sebanyak 70%.
Tambahan pula, adalah ditemui bahawa perhubungan di antara pembangunan dan
pengaliran puncak bertambah berkadar terus. 24.40km2 keluasan pembangunan pada
tahun 1994 mengakibatkan 74.62m3/s. Pada tahun 1999 pula, 50.23km2 keluasan
pembangunan telah mencatatkan pengaliran puncak sebanyak 84.04m3/s. Cadangan
pelan guna tanah MSC untuk tahun 2020, jumlah kawasan sebanyak 148.14km2 akan
dibangunkan. Pembangunan ini ia diramalkan mencatat aliran kemuncak sebanyak
128.15m3/s. Ini adalah penting kepada perancang bandar untuk mengambil kira kesan
pembangunan terhadap kadar pengaliran permukaan sebelum membangunkan sesuatu
kawasan yang diingini. Satu sistem saliran yang baik perlu diambil kira semasa
pembangunan demi mencegah banjir.
vi
ACKNOWLEDGEMENTS
Praise to almighty Lord for His blessings, endless love and guidance
throughout the study.
With a deep sense of gratitude the author would like to acknowledge his
project supervisory team Assoc. Prof. Dr. Shattri Mansor, Dr. Muhamad Radzali
Mispan, Assoc. Prof. Dr. Noordin Ahmad and Assoc. Prof. Dr. Wan Nor Azmin
Sulaiman for their invaluable guidance, constructive suggestions and encouragement
throughout the duration of this project.
Sincere thanks are extended to En. Azmi and his staffs from Hydrology
Branch of Drainage and Irrigation Department. Thanks are also extended to the staff
of the Department of Agriculture Malaysia for providing the land use maps of study
area, the staff of Malaysian Meteorological Services, the staff of Malaysian Centre for
Remote Sensing (MACRES), and staff of PUAS (M) Berhad for providing related
hydrometeorological and satellite data used in this study.
Special thanks extended to En. Zulhazmi from Puncak Niaga (M) Sdn. Bhd.,
Ms. Yong Siew Fong from KTA Tenaga Sdn. Bhd for their valuable guidance and
support in the technical part. Gratitude also to Dr. Abdul Rashid Mohamed Shariff,
Ong You Shu, Teoh Chin Chuang, Lawal Billa, Dr. Hamid and others members in the
lab for their encouragement and ideas.
Lastly, the author would like to express his sincere appreciation to his family
especially to his lovely wife for their undying love, patience, encouragement and
continues supports during the course of study.
vii

I certify that an Examination Committee met on 2nd March 2004 to conduct the final examination of Wong Tai Hong on his Master of Science thesis entitled “Application of Remote Sensing and Hydrological Model for Runoff Estimation and Prediction at Upper Langat Watershed” in accordance with Universiti Pertanian Malaysia (Higher Degree) Act 1980 and Universiti Putra Malaysia (Higher Degree) Regulation 1981. The committee recommends that the candidate be awarded the relevant degree. Members of the Examination Committees are as follows: AHMAD RODZI MAHMUD, Ph.D. Associate Professor Faculty of Engineering Universiti Putra Malaysia (Chairman) SHATTRI MANSOR, Ph.D. Associate Professor Institute of Advanced Technology Universiti Putra Malaysia (Member) MUHAMAD RADZALI MISPAN, Ph.D. Malaysian Agricultural Research and Development Institute (MARDI) 43400 Serdang Malaysia (Member) NOORDIN AHMAD, Ph.D. Associate Professor Faculty of Engineering Universiti Putra Malaysia (Member) WAN NOR AZMIN SULAIMAN, Ph.D. Associate Professor Faculty of Science and Environmental Studies Universiti Putra Malaysia (Member) _________________________________________ GULAM RUSUL RAHMAT ALI, Ph.D. Professor/Deputy Dean
School of Graduate Studies, Universiti Putra Malaysia. Date:
viii
This thesis submitted to the Senate of Universiti Putra Malaysia and has been accepted as fulfilment of the requirements for the degree of Master of Science. The members of the Supervisory Committee as follows: SHATTRI MANSOR, Ph.D. Associate Professor Institute of Advanced Technology Universiti Putra Malaysia (Chairman) MOHAMAD RADZALI MISPAN, Ph.D. Malaysian Agricultural Research and Development Institute (MARDI) Malaysia (Member) NOORDIN AHMAD, Ph.D. Associate Professor Faculty of Engineering Universiti Putra Malaysia (Member) WAN NOR AZMIN SULAIMAN, Ph.D. Associate Professor Faculty of Science and Environmental Studies Universiti Putra Malaysia (Member) _____________________ AINI IDERIS, Ph.D. Professor/Dean School of Graduate Studies Universiti Putra Malaysia Date:
ix

DECLARATION
I hereby declare that the thesis is based on my original work except for quotations and citations which have been duly acknowledged. I also declare that it has not been previously or concurrently submitted for any other degree at UPM or other institutions.
__________________
WONG TAI HONG
Date:
x

TABLE OF CONTENTS
Page DEDICATION ii ABSTRACT iii ABSTRAK v ACKNOWLEDGEMENTS vii APPROVAL viii DECLARATION x LIST OF TABLES xiv LIST OF FIGURES xvi LIST OF ABBREVIATIONS xx CHAPTER 1 INTRODUCTION 1.1
1.2 1.3
General Statement of Problem Objective
1.1 1.2 1.4
2 LITERATURE REVIEW 2.1 Introduction 2.1 2.2 The Use of Remote Sensing in Hydrology 2.2 2.3 Watershed 2.4 2.3.1 Digital Elevation Model (DEM) 2.6 2.3.2 Watershed Extraction from DEMs 2.6 2.4 Runoff 2.7 2.5 Average Precipitation 2.9 2.6 Relations between Precipitation and Runoff 2.10 2.7 Image Processing 2.11 2.7.1 Radiometric Correction 2.11 2.7.2 Multiple-date Image Normalization Using
Regression 2.12
2.7.3 Geometric Correction 2.13 2.8 Remote Sensing Image Analysis 2.14 2.8.1 Principal Component Analysis (PCA) 2.14 2.8.2 Normalized Difference Vegetation Indexes (NDVI) 2.17 2.9 Extracting Information from Remote Sensing Data 2.19 2.9.1 Supervised Classification 2.20 2.9.2 Maximum Likelihood Classifier 2.21 2.10 Object Oriented Image Analysis 2.22 2.10.1 Multiresolution Segmentation 2.23 2.10.2 Classification 2.24 2.11 Change Detection 2.25 2.12 The Relationship Between Land Use Change and Rate of
Runoff 2.26
xi

2.13 Watershed Modeling System 2.28 2.13.1 Rainfall-Runoff Simulation Modeling 2.29 2.13.2 Modeling Approach 2.30 2.13.3 The Loss Model 2.32 2.13.4 Transform Model 2.34 2.13.5 Recession Baseflow Method 2.35 2.13.6 Routing Model 2.37 2.14 Model Calibration and Simulation 2.37 3 METHODOLOGY 3.1 Description of the Study Area 3.1 3.1.1 Climate 3.3 3.1.2 Vegetation Cover 3.4 3.1.3 Topography and Hydrology 3.4 3.1.4 Geology and Soil 3.4 3.2 Data Acquisition 3.7 3.3 Data Processing and Management 3.7 3.3.1 Image Processing 3.8 3.3.2 Geometric Correction 3.9 3.3.3 Atmospheric Correction 3.11 3.3.4 Normalization 3.11 3.3.5 Watershed Delineation 3.12 3.3.6 Image Transformation 3.15 3.3.7 Object Oriented Image Analysis 3.15 3.3.8 Post Classification Analysis 3.18 3.3.9 Land Use Change Detection 3.18 3.4 Hydrological Data 3.18 3.5 Rainfall-Runoff Simulation Modeling 3.19 3.5.1 Basin Model Component 3.19 3.5.2 Meteorologic Model Component 3.20 3.5.3 Control Specification Component 3.20 3.6 Model Selection 3.21 3.7 Urban Effects 3.22 3.8 Summary 3.23 4 RESULTS AND DISCUSSION 4.1 Pre-processing 4.1 4.1.1 Geometric Corrected Images 4.1 4.1.2 Subset Image 4.4 4.1.3 Atmospheric Correction 4.5 4.1.4 Normalization Process 4.7 4.1.5 Watershed Delineation 4.11 4.1.6 Image Transformation 4.13 4.2 Information Extraction 4.2.1 Visual Interpretation 4.20 4.2.2 Pixel Based Classification 4.22 4.2.3 Polygon Based Classification 4.25 4.2.3.1 NDVI Transformation 4.26 4.2.3.2 Steps by Steps Classification 4.27
xii

4.2.4 Comparison between Pixel Based and Object Oriented Classification
4.33
4.2.5 Post Classification Analysis 4.35 4.3 Historical Data Analysis 4.38 4.3.1 Rainfall Analysis 4.38 4.3.2 Streamflow Analysis 4.39 4.4 HEC-HMS Databases and Data Estimation 4.41 4.4.1 Basin Model 4.41 4.4.2 Meteorological Model 4.47 4.4.3 Control Specification 4.48 4.5 Model Calibration 4.55 4.6 Simulation Flow Results 4.55 4.7 Urbanization and Runoff Correlation 4.66 5 CONCLUSIONS AND RECOMMENDATIONS 5.1 Conclusions 5.1 5.2 Future Recommendations
5.3
REFERENCES R.1 APPENDICES A.1 BIODATA OF THE AUTHOR B.1
xiii
Table
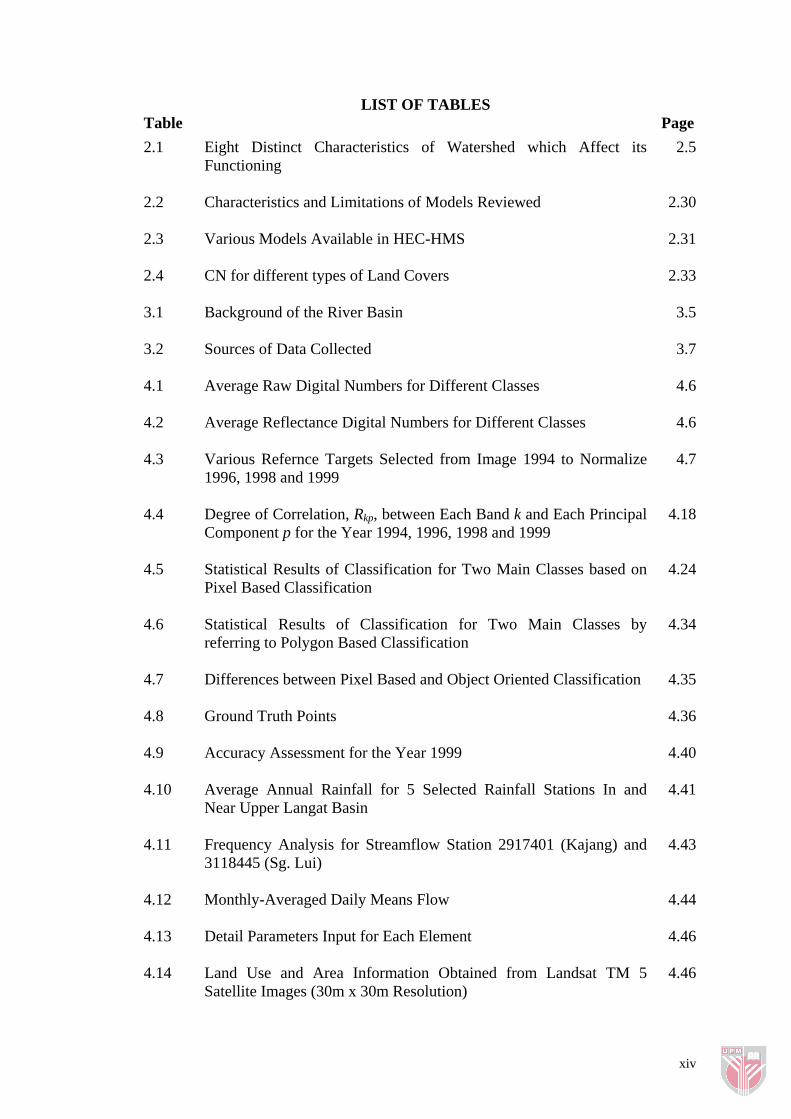
LIST OF TABLES
Page
2.1 Eight Distinct Characteristics of Watershed which Affect its Functioning
2.5
2.2 Characteristics and Limitations of Models Reviewed
2.30
2.3 Various Models Available in HEC-HMS
2.31
2.4 CN for different types of Land Covers
2.33
3.1 Background of the River Basin 3.5
3.2 Sources of Data Collected
3.7
4.1 Average Raw Digital Numbers for Different Classes
4.6
4.2 Average Reflectance Digital Numbers for Different Classes
4.6
4.3 Various Refernce Targets Selected from Image 1994 to Normalize 1996, 1998 and 1999
4.7
4.4 Degree of Correlation, Rkp, between Each Band k and Each Principal Component p for the Year 1994, 1996, 1998 and 1999
4.18
4.5 Statistical Results of Classification for Two Main Classes based on Pixel Based Classification
4.24
4.6 Statistical Results of Classification for Two Main Classes by referring to Polygon Based Classification
4.34
4.7 Differences between Pixel Based and Object Oriented Classification
4.35
4.8 Ground Truth Points
4.36
4.9 Accuracy Assessment for the Year 1999
4.40
4.10 Average Annual Rainfall for 5 Selected Rainfall Stations In and Near Upper Langat Basin
4.41
4.11 Frequency Analysis for Streamflow Station 2917401 (Kajang) and 3118445 (Sg. Lui)
4.43
4.12 Monthly-Averaged Daily Means Flow
4.44
4.13 Detail Parameters Input for Each Element
4.46
4.14 Land Use and Area Information Obtained from Landsat TM 5 Satellite Images (30m x 30m Resolution)
4.46
xiv
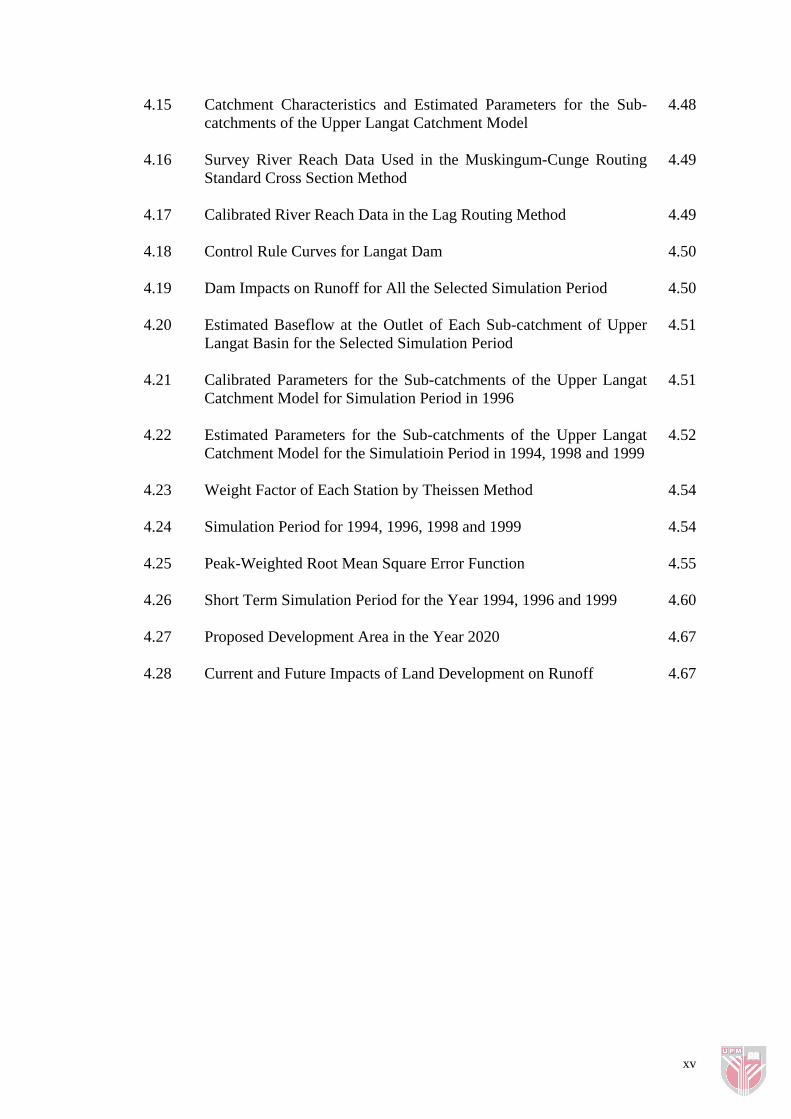
4.15 Catchment Characteristics and Estimated Parameters for the Sub-catchments of the Upper Langat Catchment Model
4.48
4.16 Survey River Reach Data Used in the Muskingum-Cunge Routing Standard Cross Section Method
4.49
4.17 Calibrated River Reach Data in the Lag Routing Method
4.49
4.18 Control Rule Curves for Langat Dam
4.50
4.19 Dam Impacts on Runoff for All the Selected Simulation Period
4.50
4.20 Estimated Baseflow at the Outlet of Each Sub-catchment of Upper Langat Basin for the Selected Simulation Period
4.51
4.21 Calibrated Parameters for the Sub-catchments of the Upper Langat Catchment Model for Simulation Period in 1996
4.51
4.22 Estimated Parameters for the Sub-catchments of the Upper Langat Catchment Model for the Simulatioin Period in 1994, 1998 and 1999
4.52
4.23 Weight Factor of Each Station by Theissen Method
4.54
4.24 Simulation Period for 1994, 1996, 1998 and 1999
4.54
4.25
Peak-Weighted Root Mean Square Error Function 4.55
4.26 Short Term Simulation Period for the Year 1994, 1996 and 1999
4.60
4.27 Proposed Development Area in the Year 2020
4.67
4.28 Current and Future Impacts of Land Development on Runoff
4.67
xv

Figure
LIST OF FIGURES
Page
2.1 Hydrology Cycle
2.2
2.2 Typical Representation of Watershed Runoff
2.8
2.3 Surface Reflectance Reference
2.12
2.4 Typical Spectral Reflectance Characteristics for Healthy Green Grass, dead or Senesing Grass and Bare Dry Soil for the Wavelength Interval from 0.4 to 1.1 µm
2.18
2.5 Equiprobability contours defined by a maximum likelihood classifier
2.21
2.6 Impacts of Development on Stream flow
2.27
2.7 Initial Baseflow Recession
2.36
2.8 Baseflow Model Illustration
2.36
2.9 Schematic of Calibration Procedure
2.38
3.1 The Location of Upper Langat Watershed
3.2
3.2 Average monthly rainfall for 6 selected Rainfall Stations in and near Upper langat Basin based on over 25 years historical records.
3.3
3.3 Automatic Rainfall and Flow Stations located at near and in the Upper Langat Basin
3.6
3.4 Sequence of Landsat TM Image Processing
3.8
3.5 Sequence of Raw Images geometric Correction 3.9
3.6 Digitized Contour Lines in 20 m Intervals
3.12
3.7 Watershed Delineation diagram flow
3.13
3.8 The Flow of Classifying an Image in eCognition
3.17
3.9 The Basin Modeling Component
3.20
3.10 Schematic Diagram Showing Overall Procedure of the Study
3.23
4.1 RMS Error for Overall results and at Each GCPs
4.2
4.2 The GCPs were Picked Well Distributed over the Entire Image
4.2
4.3 Registered SPOT-P image through Image to Map Registration Technique
4.3
xvi

4.4 Subset Landsat TM Image 1999 (Band TM 4, TM 5, TM 3)
4.4
4.5 Classes Signature based on Raw Digital Numbers
4.6
4.6 Classes Signature based on Reflectance
4.6
4.7 Normalization on Band 1, 2, 3, 4, 5 and 7, Landsat TM 1996 by referring to Landsat TM 1994
4.8
4.8 Normalization on Band 1, 2, 3, 4, 5 and 7, Landsat TM 1998 by referring to Landsat TM 1994
4.9
4.9 Normalization on Band 1, 2, 3, 4, 5 and 7, Landsat TM 1999 by referring to Landsat TM 1994
4.10
4.10 DEM Band that Have Been Generated for Watershed Delineation
4.11
4.11 Upper Langat Watershed Shown on Landsat TM 1999
4.12
4.12 The 3 D view of the Watershed (viewing point at 415803.921mE, 332469.824mN, 45°)
4.13
4.13 Principal Components Channels of Image 1994
4.14
4.14 Principal Components Channels of Image 1996
4.15
4.15 Principal Components Channels of Image 1998
4.16
4.16 Principal Components Channels of Image 1999
4.17
4.17 Landuse Identification (a) Downstream Area (b) Upstream Area
4.21
4.18 Pixel based Classification Results in Pseudo Color Layer at Downstream (Set 1) and Upstream Area (Set 2) with (a) original; (b) 3 x 3 mode filter; (c) 5 x 5 mode filter; (d) 7 x 7 mode filter
4.23
4.19 Hierarchical net of image objects derived from image segmentation level 1 (5 pixels scale parameter), level 2 (15 pixels scale parameter) and level 3 (30 pixels scale parameter)
4.25
4.20 NDVI Feature View
4.26
4.21 Setting the Null Class
4.27
4.22 Separation of Vegetation Area (Bright Green) and Non-Vegetation Area (Orange)
4.28
4.23 Water Class (Blue) Separated from Non-Vegetation Area
4.29
4.24 Setting the DEM parameter to determine the Cloud Cover (White) 4.30
xvii

4.25 The Build Up Area (Orange) and Bare or Clear Land (Yellow) have been Separated from Build-up Area class
4.31
4.26 Object Oriented Classification Results from Landsat TM images (a) Date captured: 28 Nov 1994; (b) Date captured: 25 May 1996; (c) Date captured: 8 Feb 1998; (d) Date captured: 11 Feb 1999
4.32
4.27 Comparison between pixel based and polygon based classification (a) pixel-based at downstream area; (b) polygon-based at downstream area; (c) pixel-based at upstream area; (d) polygon-based at upstream area
4.33
4.28 Random Sample Points (Dark Blue) and 15 Ground Truth Points (Red) for Accuracy Assessment
4.37
4.29a Ground Truthing Site View (Point 1 to Point 8)
4.38
4.29b Ground Truthing Site View (Point 9 to Point 15)
4.39
4.30 Isohyetal Plot for Average Annual Rainfall for the Upper Langat Watershed
4.42
4.31 Subbasin Location in the Watershed
4.45
4.32 The Application of Theissen Method onto the Watershed
4.53
4.33 Comparison of the Simulated and Observed Hydrographs for the Calibration in the year of 1996
4.56
4.34 Comparison of the Simulated and Observed Hydrographs for the Verification in the year of 1994
4.57
4.35 Comparison of the Simulated and Observed Hydrographs for the Verification in the year of 1998
4.58
4.36 Comparison of the Simulated and Observed Hydrographs for the Verification in the year of 1999
4.59
4.37 Comparison of the Simulated and Observed Hydrographs for the Calibration in the year of 1996
4.61
4.38 Comparison of the Simulated and Observed Hydrographs for the Verification in the year of 1996
4.62
4.39 Comparison of the Simulated and Observed Hydrographs for the Verification in the year of 1994
4.63
4.40 Comparison of the Simulated and Observed Hydrographs for the Verification in the year of 1999
4.64
xviii

4.41 Current and Future Land Development Impacts to the Rate of Runoff
4.68
xix

LIST OF ABBREVIATIONS
3D 3 Dimensional
ASCE American Society of Civil Engineers
CN Curve Number
DEM Digital Elevation Model
DID Department of Irrigation and Drainage
DN Digital Number
DOA Department of Agriculture, Malaysia
DLG Digital Line Graph
DTM Digital Terrain Model
FEMA Federal Emergency Management Agency
GCP Ground Control Points
HEC-HMS Hydrologic Engineering Center – Hydrologic Modeling System
PDP Planning and Design Procedure
JPBD Town and Country Planning Department
JUPEM Survey and Mapping Department of Malaysia
MACRES Malaysian Centre of Remote Sensing
MSMAM Urban Stormwater Management Manual for Malaysia
NDVI Normalization Differential Vegetation Index
NN Nearest Neighbor
PCA Principal Component Analysis
PUAS Perbadanan Urus Air Selangor Berhad
RMS Root Mean Square
RSO Rectified Skew Orthomophic Projection
SCS Soil Conservation Service
SMA Soil Moisture Accounting
VIR Visible infrared
VIS Visible
VDEMINT Grid DEM from vector layer
xx

CHAPTER 1
INTRODUCTION
1.1 General
When development replaces natural landscapes with impervious surfaces, the amount
of rainfall that runs over the surface of the land greatly increases. A serious problem
that relates to runoff is flooding. Flood severity is caused by increased rainfall
intensity, duration, reduced infiltration capacity and in addition such factors like
forest clearance, the blatant burning of forest and urbanization. More over, floods can
cause death and at the same time bring damage to houses, buildings, plantation,
livestock, etc.
Landuse will alter a watershed’s response to precipitation. The most common effect is
the reduction of infiltration especially on impervious surfaces, which significantly
increase erosion, discharge and volume of storm runoff in a watershed. Then again,
land development changes the pattern and distribution of runoff where natural flow
paths in the watershed will be replaced or supplemented by paved gutters, storm
sewers, or other elements of artificial drainage. The porous and varied terrain of
natural landscapes like forests, grasslands, vegetation and wetlands can trap rainwater
and allow it to slowly flow into the ground. Nevertheless, runoff will not slowly
percolate into the ground in nonporous urban landscapes such as include roads,
sidewalks, parking lots and buildings. The water will in this case remains above the
surface and form massive runoff.
1.1
The need for improved methods for resource management and environmental
assessment especially in Malaysia is vital. Remote sensing data can provide the
reliable and timely information over a huge area. It is a fast and efficient system of
data collection, processing, storage, retrieval and updating the land cover information.
This study evaluates the feasibility of applying a remote sensing technique to obtain
the land use information and its’ changes, hence apply as parameter input and factor
to the public domain software, Hydrologic Engineering Center – Hydrologic
Modeling System, (HEC-HMS) in order to simulate the rainfall-runoff during the
selected simulation period and analyze the impacts of urbanization to the rate of
runoff.
1.2 Statement of Problem
On site data acquisition for watershed and land use studies is labour intensive, time
consuming and expensive especially when the watershed is large and located in an
inaccessible area. The application of remote sensing for data collection makes the
coverage of extensive basins possible. Remote sensing may be the only way to obtain
input data for remote and inaccessible areas, and a large number of basins in a
particular region. In addition also, remote sensing provides fast, up to date, high
accuracy and even cost effective data for watershed study.
The conventional method of extracting information from remote sensing data is in
pixel basic. This conventional classification approaches to image analysis produces a
characteristic, inconsistent salt-and-pepper classification, this method is however far
from being capable of extracting objects of interest. It is able to carry out the
1.2
classification parameter based on the spectral properties of each band that is available
in the image only. Difficulties increased when dealing with temporal data where the
spectral information represent the cloud cover and shadow occurred in optical remote
sensing data always mix up with urbanization area, water body and vegetation classes.
The object-oriented approach brings the supervised classification process into
polygon base. It makes the remote sensing data contents manageable by performing
the segmentation process. Beyond that, additional information such as criteria, textual
or contextual information of the segments can be described in an appropriate way to
derive improved classification results.
Malaysia has experienced the effects of erosion and flash flood. These phenomena
have partly been attributed to the degradation of natural environmental and water
yield, possibly caused by forest and plantation clearance for greatly urbanization
development. These activities and their rate of persistent are apparently unchecked in
recent year. The land use information that extracted from temporal remote sensed data
can shows the trends of land development through out the years. This information can
be used as a parameter input to a hydrological modeling to check on the impacts of
current development and future development to the rate of runoff. It is important for
urban planner to take into consideration effects of the urbanization on the rate of
runoff before developing a desire area. A well drainage landscape must be taken into
consideration during land development in order to prevent runoff and flash flood
phenomena.
1.3

1.3 Objective
The overall aim of this research is to examine the trend of urbanization as a
contributing factor to the surface runoff. In order to fulfill this aim, this study attempts
to meet the following specific objectives:
1. To detect the change of land development based on remotely sensed data and
compare the object oriented and pixel based classification techniques.
2. To access the effectiveness of remote sensed data in hydrological model for
surface runoff estimation and prediction.
1.4