Embed Size (px)
Citation preview
i
UNIVERSITI MALAYA
ORIGINAL LITERARY WORK DECLARATION
Name of Candidate: Kow Kien Woh (I.C./Passport No:
Registration/ Matric. No.: KHA090059
Name of Degree: Doctor of Philosophy
Title of Project/Paper/Research Report/Dissertation/Thesis (“this work”):
Synthesis and characterizations of bamboo leaf based carbon-opacified silica aerogel (COSA)
Field of Study: Advanced Materials
I do solemnly and sincerely declare that:
(1) I am the sole author/ writer of this work; (2) This Work is original; (3) Any use of any work in which copyright exists was done by way of fair dealing
and for permitted purposes and any excerpt or extract from, or reference to or reproduction of any copyright work has been disclosed expressly and sufficiently and the title of the Work and its authorship have been acknowledged in this work;
(4) I do not have any actual knowledge nor do I ought reasonably to know that the making of this work constitutes an infringement of any copyright work;
(5) I hereby assign all and every tights in the copyright to this Work to the University of Malaya (“UM”), who henceforth shall be owner of the copyright in this Work and that any reproduction or use in any form or by any means whatsoever is prohibited without the written consent of UM having been first had and obtained;
(6) I am fully aware that if in the course of making this Work I have infringed any copyright whether I intentionally or otherwise, I may be subject to legal action or any other action as may be determined by UM.
Candidate’s signature: Date:
Subscribed and solemnly declared before,
Witness’s signature : Date: Name : Designation
ii
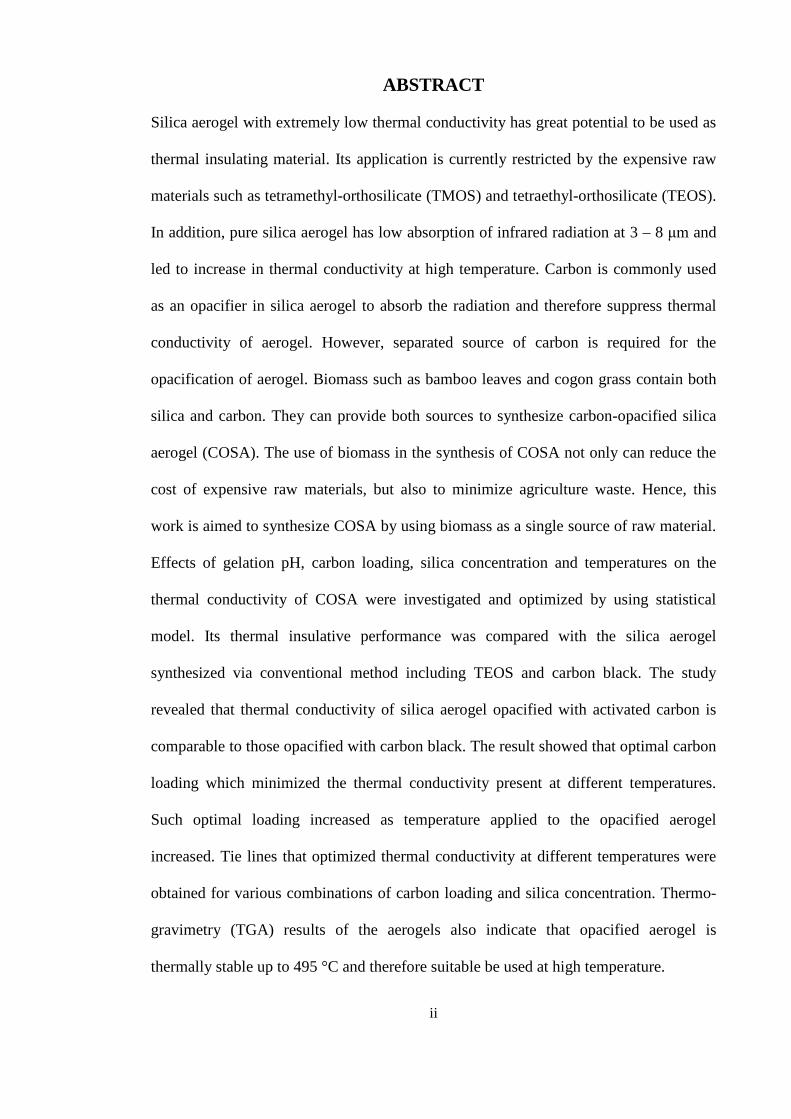
ABSTRACT
Silica aerogel with extremely low thermal conductivity has great potential to be used as
thermal insulating material. Its application is currently restricted by the expensive raw
materials such as tetramethyl-orthosilicate (TMOS) and tetraethyl-orthosilicate (TEOS).
In addition, pure silica aerogel has low absorption of infrared radiation at 3 – 8 μm and
led to increase in thermal conductivity at high temperature. Carbon is commonly used
as an opacifier in silica aerogel to absorb the radiation and therefore suppress thermal
conductivity of aerogel. However, separated source of carbon is required for the
opacification of aerogel. Biomass such as bamboo leaves and cogon grass contain both
silica and carbon. They can provide both sources to synthesize carbon-opacified silica
aerogel (COSA). The use of biomass in the synthesis of COSA not only can reduce the
cost of expensive raw materials, but also to minimize agriculture waste. Hence, this
work is aimed to synthesize COSA by using biomass as a single source of raw material.
Effects of gelation pH, carbon loading, silica concentration and temperatures on the
thermal conductivity of COSA were investigated and optimized by using statistical
model. Its thermal insulative performance was compared with the silica aerogel
synthesized via conventional method including TEOS and carbon black. The study
revealed that thermal conductivity of silica aerogel opacified with activated carbon is
comparable to those opacified with carbon black. The result showed that optimal carbon
loading which minimized the thermal conductivity present at different temperatures.
Such optimal loading increased as temperature applied to the opacified aerogel
increased. Tie lines that optimized thermal conductivity at different temperatures were
obtained for various combinations of carbon loading and silica concentration. Thermo-
gravimetry (TGA) results of the aerogels also indicate that opacified aerogel is
thermally stable up to 495 °C and therefore suitable be used at high temperature.
iii
ABSTRAK Aerogel silika dengan kekonduksian haba yang amat rendah mempunyai potensi untuk
digunakan sebagai bahan penebat haba. Aplikasinya kini adalah terhad oleh bahan
mentah yang mahal seperti tetramethyl-orthosilicate (TMOS) dan tetramethyl-
orthosilicate (TEOS). Satu lagi kelemahan aerogel silika tulen adalah penyerapan
radiasi pada panjang gelombang (3-8 μm) yang rendah. Karbon biasanya digunakan
sebagai agen opasifikasi aerogel silika untuk menyerap radiasi tersebut dan
menggurangkan kekonduksian haba aerogel pada suhu tinggi. Sumber karbon
opasikifasi aerogel perlu disedia secara berasingan. Daun buluh dan lalang
mengandungi jumlah silika amorfus dan karbon yang tinggi. Biojisim tersebut boleh
diguna menyediakan kedua-dua sumber silika dan karbon yang diperlukan untuk
mensintesis aerogel silika yang diopasifikasi karbon (COSA). Kegunaan daun buluh
dalam sintesis COSA boleh mengurangkan kos bahan mentah yang mahal dan
mengurangkan sisa pertanian. Kerja ini bertujuan untuk mensintesis COSA dengan
mengguna biojism sebagai sumber bahan tungal. Kesan pH, kadar karbon, kepekatan
silika dan suhu kepada kekonduksian haba telah disiasat dan dioptimakan dengan model
statistik. Keberkesanannya juga dibandingkan dengan aerogel silika lain yang
dihasilkan daripada TEOS and karbon hitam. Keputusan menunjukkan kekonduksian
haba aerogel silika yang diopasifikasi oleh karbon aktif adalah berbandingan dengan
yang diopasifikasi dengan karbon hitam. Keputusan juga menunjukkan terdapat kadar
optimal karbon yang meminimakan kekonduksian haba pada suhu berlainan dan kadar
tersebut bertambah apabila suhu menaik. Garis-kait telah diterbit bagi pelbagai
gabungan kadar karbon dan kepekatan silika bertujuan meminimakan kekonduksian
haba aerogel. Analisis thermo-gravimetri (TGA) menunjukkan aerogel teropasikasi
adalah stabil sampai 495 oC dan sesuai diguna pada suhu tinggi.
iv
ACKNOWLEDGEMENTS
I am indebted to my supervisor Dr. Rozita Yusoff who has never stop from
motivating, encouraging and giving support as well as sincere guidance to me in this
research work. My special gratitude is also extended to my co-supervisor Ir. Prof. Dr.
Abdul Aziz Abdul Raman for his efforts throughout the years as good and supportive
supervisor. I am also thankful to them for the painstaking task of reviewing this thesis.
The unflagging support given by my colleagues, especially Joseph Ho and Chan
Chung Hung are gratefully acknowledged. I would also like to thank other post graduate
students in the department for their companionship over the last few years. I have also
been fortunate to receive the supports from our helpful department staffs, Pn. Norhaya
and En. Jalaluddin, for not only allowed me to carry out experimental work but also
assisted me in setting up experimental apparatus. Special thanks to BERNAS
(Padiberas Nasional) Berhad in sponsoring rice husks to the department throughout the
project.
Finally, I am very grateful to my family for their endless support, love and
encouragement during completion of this research work. Any further comments and
suggestions for improvement of the thesis would be gratefully received.
v
TABLE OF CONTENTS
Page
Original literary work declaration Abstract Abstrak Acknowledgements
i
ii
iii
iv
Table of contents
v
List of tables
ix
List of figures
xi
Notations
xvi
Symbols
xviii
Chapter 1 Introductions
1.1 Background
1.2 Problem statement 1.3 Objectives 1.4 Framework of thesis
1 3 4 5
Chapter 2 Literature review
2.1 Silica aerogel
2.1.1 Properties and uses of silica aerogel
2.1.2 Syntheses of silica aerogel
6 7
2.2 Bio-silica
2.2.1 Forms of silica
2.2.2 Amorphous silica from biomasses
20
21
vi
Page
2.3 Thermal transfer in silica aerogel
2.3.1 Convection
2.3.2 Conduction
2.3.3 Radiation
25
26
29 2.4 Carbon as opacifiers
2.4.1 Activated carbon as opacifier 2.5 Summary
32
34
Chapter 3 Research methodology
3.1 Flow of research
36
3.2 Materials and apparatus
3.2.1 Materials
3.2.2 Apparatus
37
38
3.3 Extraction and characterizations of bio-silica
3.3.1 Extraction of silica
3.3.2 Characterizations of bio-silica
39
43
3.4 Synthesis and characterization of silica aerogel from bamboo leaf silica (BLS)
3.4.1 Preparation of water glass
3.4.2 Syntheses of silica aerogel
3.4.3 Characterizations of silica aerogel
43
46
51
3.5 Synthesis and characterizations of activated carbon from bamboo leaf
3.5.1 Carbonization and activation of carbon
53
vii
Page
3.6 Optimization of thermal conductivity via carbon opacification 3.6.1 Synthesis and characterizations of carbon opacified aerogel 3.6.2 Optimizations of thermal conductivity
55
56
Chapter 4 Synthesis of bamboo leaf aerogel
4.1 Extraction and characterizations of bio-silica
4.1.1 Ash content after combustion
4.1.1.1 Combustion in electric furnace
4.1.1.2 Thermo-gravimetric analysis (TGA)
4.1.2 Silica content by EDX
4.1.3 CHNS - carbon content and organic matters
4.1.4 XRD and amorphicity
4.1.5 Determination of kinetic parameters
4.1.6 Summary
58
58
60
65
70
71
76
81
4.2 Preparation of water glass as precursor
4.2.1 Optimization of silica yield (ξ) in water glass 4.2.2 Characterizations of water glass
4.2.3 Summary
82
88
89
4.3 Synthesis of silica aerogel
4.3.1 Hydrogels
4.3.1.1 Opacity of hydrogels
4.3.1.2 Particle sizes of hydrosols
4.3.1.3 Removal of salts from hydrogels
90
94
95
viii
Page
4.3.2 Aerogels
4.3.2.1 Visual observation
4.3.2.2 Density, porosity, shrinkage and amorphicity
4.3.2.3 Microstructure and fractal dimensions
4.3.2.4 Adsorption properties
4.3.2.5 Chemical groups on surface
4.3.2.6 Thermal conductivity
4.3.2.7 Thermal stability
4.3.2.8 Summary
96
97
101
103
110
111
115
116
Chapter 5 Opacification of bamboo leaf aerogel
5.1 Synthesis and characterizations of activated carbon
5.1.1 Carbonization
5.1.2 Properties of activated carbon
5.1.3 Summary
5.2 Opacification of silica aerogel with activated carbon
5.2.1 Effect of temperature 5.2.2 Effect of carbon loading
5.2.3 Effect of silica concentration in water glass
5.2.4 Modeling and optimization 5.2.5 Comparisons with other aerogels 5.2.6 Summary
117
125
129
129
132
135
140
153
158
ix
Page
Chapter 6 Conclusions and recommendations
6.1 Conclusions 6.2 Novelty and contributions 6.3 Recommendations for future work
159
162
163
References
164
List of publications
176
Appendix – Originality report generated by turnitin software 177
x
LIST OF TABLES Page
Table 2.1 Molecular structures of TMOS and TEOS
8
Table 2.2 Properties of silica aerogels obtained via APD using various silylation agents
19
Table 2.3
Common polymorphs of crystalline silica
20
Table 3.1
List of materials 37
Table 3.2 List of apparatus
38 - 39
Table 3.3 Selected processing parameters that may affect the silica yield (ξ) in water glass
44
Table 4.1 Statistical analyses of ash content based on t-statistics at 95% level of confidence
59
Table 4.2
ANOVA & t-statistics analyses of ash content from TGA at 95% level of confidence
64
Table 4.3 Purity of silica and silica content in raw biomass estimated based on EDX †
67
Table 4.4 Summary of ANOVA on potassium leaching based on coded parameters
69
Table 4.5 Elemental analysis of CHNS †
70
Table 4.6 Effect of processing parameters on the silica yield in water glass †
83
Table 4.7 Time of gelation
90
Table 4.8 α-parameter of samples
91
Table 4.9 Table 4.10 Table 4.11
Fractals structural parameters determined by SAXS Comparison of specific surface area obtained via various methods Thermal conductivities calculated based on Eq. 4.8 – 4.12 compared with total conductivity measured in Figure 4.29.
102
108
112
Table 5.1
Summary of ANOVA on carbonization of bamboo leaf based on coded parameters
119
xi
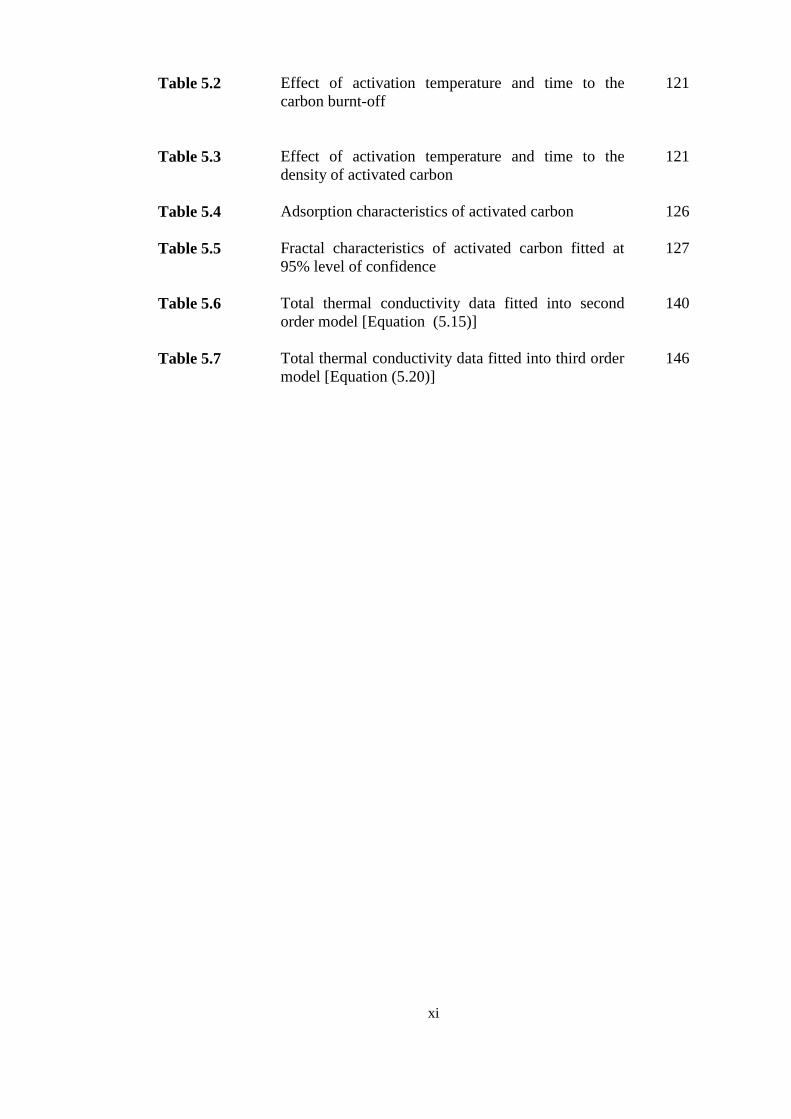
Table 5.2 Table 5.3 Table 5.4 Table 5.5 Table 5.6 Table 5.7
Effect of activation temperature and time to the carbon burnt-off Effect of activation temperature and time to the density of activated carbon Adsorption characteristics of activated carbon Fractal characteristics of activated carbon fitted at 95% level of confidence Total thermal conductivity data fitted into second order model [Equation (5.15)] Total thermal conductivity data fitted into third order model [Equation (5.20)]
121
121
126
127
140
146
xii
LIST OF FIGURES
Page
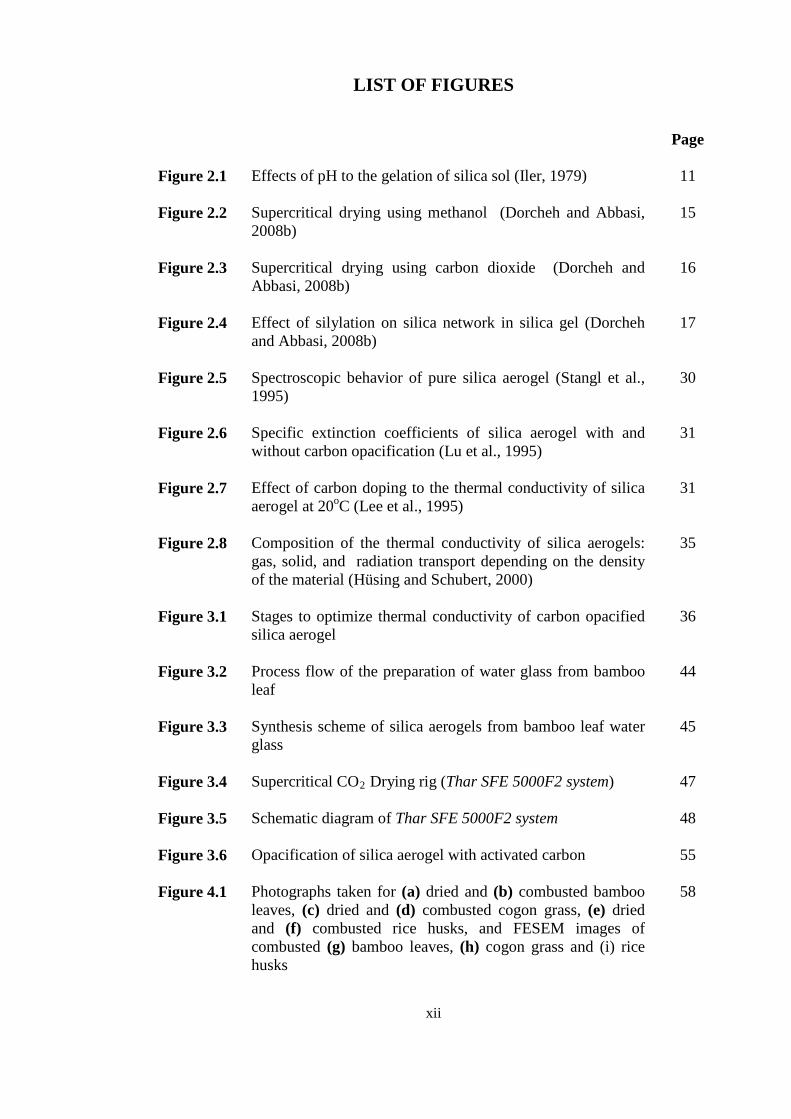
Figure 2.1 Effects of pH to the gelation of silica sol (Iler, 1979) 11
Figure 2.2 Supercritical drying using methanol (Dorcheh and Abbasi, 2008b)
15
Figure 2.3 Supercritical drying using carbon dioxide (Dorcheh and Abbasi, 2008b)
16
Figure 2.4 Effect of silylation on silica network in silica gel (Dorcheh and Abbasi, 2008b)
17
Figure 2.5 Spectroscopic behavior of pure silica aerogel (Stangl et al., 1995)
30
Figure 2.6 Specific extinction coefficients of silica aerogel with and without carbon opacification (Lu et al., 1995)
31
Figure 2.7 Effect of carbon doping to the thermal conductivity of silica aerogel at 20oC (Lee et al., 1995)
31
Figure 2.8 Composition of the thermal conductivity of silica aerogels: gas, solid, and radiation transport depending on the density of the material (Hüsing and Schubert, 2000)
35
Figure 3.1 Stages to optimize thermal conductivity of carbon opacified silica aerogel
36
Figure 3.2 Process flow of the preparation of water glass from bamboo leaf
44
Figure 3.3 Synthesis scheme of silica aerogels from bamboo leaf water glass
45
Figure 3.4 Supercritical CO2 Drying rig (Thar SFE 5000F2 system)
47
Figure 3.5 Schematic diagram of Thar SFE 5000F2 system
48
Figure 3.6 Opacification of silica aerogel with activated carbon
55
Figure 4.1 Photographs taken for (a) dried and (b) combusted bamboo leaves, (c) dried and (d) combusted cogon grass, (e) dried and (f) combusted rice husks, and FESEM images of combusted (g) bamboo leaves, (h) cogon grass and (i) rice husks
58
xiii
Page
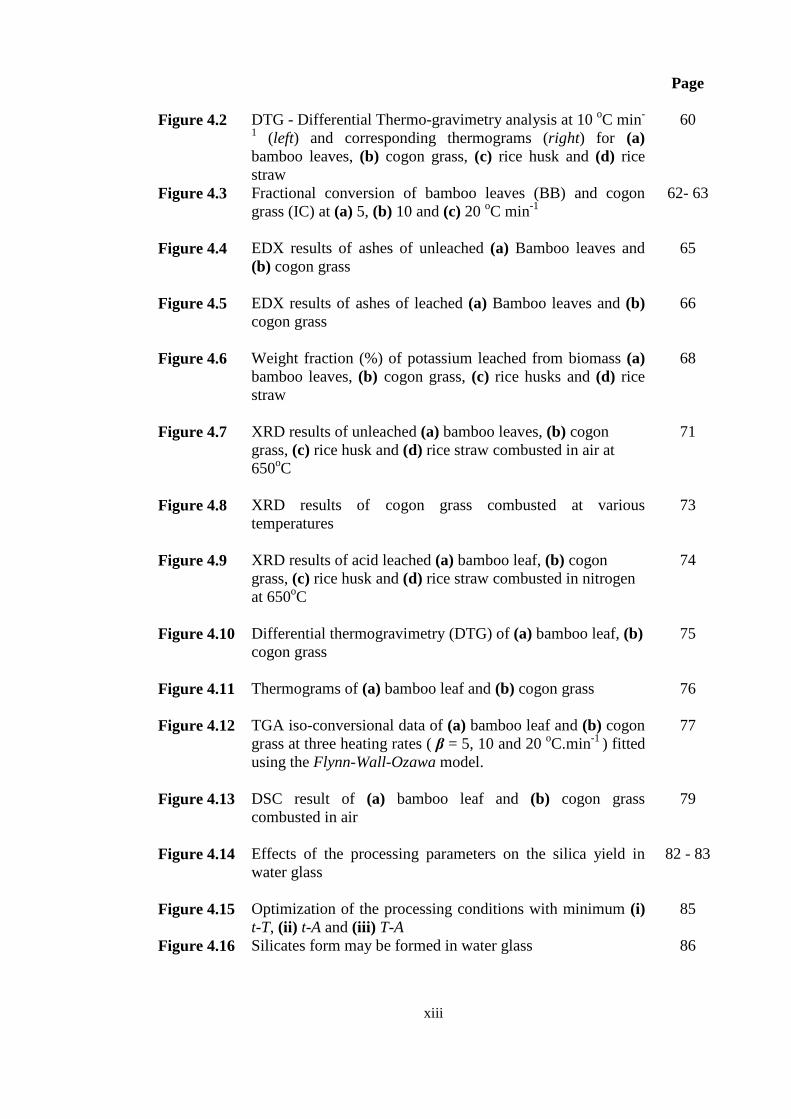
Figure 4.2 DTG - Differential Thermo-gravimetry analysis at 10 oC min-
1 (left) and corresponding thermograms (right) for (a) bamboo leaves, (b) cogon grass, (c) rice husk and (d) rice straw
60
Figure 4.3 Fractional conversion of bamboo leaves (BB) and cogon grass (IC) at (a) 5, (b) 10 and (c) 20 oC min-1
62- 63
Figure 4.4 EDX results of ashes of unleached (a) Bamboo leaves and (b) cogon grass
65
Figure 4.5 EDX results of ashes of leached (a) Bamboo leaves and (b) cogon grass
66
Figure 4.6 Weight fraction (%) of potassium leached from biomass (a) bamboo leaves, (b) cogon grass, (c) rice husks and (d) rice straw
68
Figure 4.7 XRD results of unleached (a) bamboo leaves, (b) cogon grass, (c) rice husk and (d) rice straw combusted in air at 650oC
71
Figure 4.8 XRD results of cogon grass combusted at various temperatures
73
Figure 4.9 XRD results of acid leached (a) bamboo leaf, (b) cogon grass, (c) rice husk and (d) rice straw combusted in nitrogen at 650oC
74
Figure 4.10 Differential thermogravimetry (DTG) of (a) bamboo leaf, (b) cogon grass
75
Figure 4.11 Thermograms of (a) bamboo leaf and (b) cogon grass
76
Figure 4.12 TGA iso-conversional data of (a) bamboo leaf and (b) cogon grass at three heating rates ( β = 5, 10 and 20 oC.min-1 ) fitted using the Flynn-Wall-Ozawa model.
77
Figure 4.13 DSC result of (a) bamboo leaf and (b) cogon grass combusted in air
79
Figure 4.14 Effects of the processing parameters on the silica yield in water glass
82 - 83
Figure 4.15 Optimization of the processing conditions with minimum (i) t-T, (ii) t-A and (iii) T-A
85
Figure 4.16 Silicates form may be formed in water glass
86
xiv
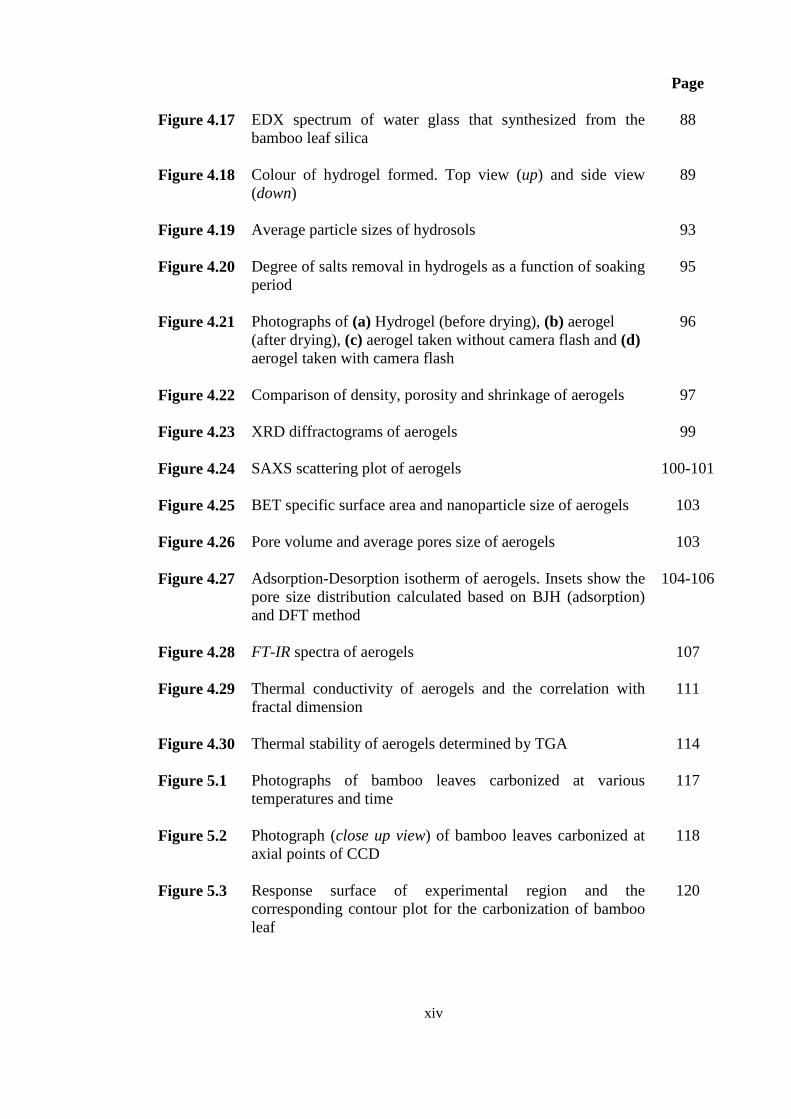
Page
Figure 4.17 EDX spectrum of water glass that synthesized from the bamboo leaf silica
88
Figure 4.18 Colour of hydrogel formed. Top view (up) and side view (down)
89
Figure 4.19 Average particle sizes of hydrosols
93
Figure 4.20 Degree of salts removal in hydrogels as a function of soaking period
95
Figure 4.21 Photographs of (a) Hydrogel (before drying), (b) aerogel (after drying), (c) aerogel taken without camera flash and (d) aerogel taken with camera flash
96
Figure 4.22 Comparison of density, porosity and shrinkage of aerogels 97
Figure 4.23 XRD diffractograms of aerogels
99
Figure 4.24 SAXS scattering plot of aerogels 100-101
Figure 4.25 BET specific surface area and nanoparticle size of aerogels 103
Figure 4.26 Pore volume and average pores size of aerogels
103
Figure 4.27 Adsorption-Desorption isotherm of aerogels. Insets show the pore size distribution calculated based on BJH (adsorption) and DFT method
104-106
Figure 4.28 FT-IR spectra of aerogels
107
Figure 4.29 Thermal conductivity of aerogels and the correlation with fractal dimension
111
Figure 4.30 Thermal stability of aerogels determined by TGA
114
Figure 5.1 Photographs of bamboo leaves carbonized at various temperatures and time
117
Figure 5.2 Photograph (close up view) of bamboo leaves carbonized at axial points of CCD
118
Figure 5.3 Response surface of experimental region and the corresponding contour plot for the carbonization of bamboo leaf
120
xv
Page
Figure 5.4 Response surface of carbon burnt off and the corresponding contour plot for the activation of bio-char
122
Figure 5.5 Response surface of density and the corresponding contour plot for the activation of bio-char
123
Figure 5.6 EDX spectrum of activated carbon
125
Figure 5.7 EDX spectra of (a) activated carbon compared with (b) carbon black N330
125
Figure 5.8 Infrared absorption of activated carbon and carbon black N330
126
Figure 5.9 Linear dependence of total thermal conductivity to T 3 at various carbon loading (0-25 wt%). (a) 3.22 wt%, (b) 4.25 wt% and (c) 10 wt% of silica concentration in water glass. Regressed equations are shown following the sequence of increasing carbon loading from top to bottom
129-130
Figure 5.10 Effect of carbon loading to total thermal conductivity at various temperatures (30 – 300 oC). (a) 3.22 wt%, (b) 4.25 wt% and (c) 10 wt% of silica concentration in water glass
132-133
Figure 5.11 Effect of silica concentration in water glass to total thermal conductivity of opacified aerogel (25 wt% carbon) at various temperatures (30 – 300 oC)
134
Figure 5.12 (a) Estimated effect of aerogel density to the total thermal conductivity and (b) Minima of Tλ at various temperatures. Total thermal conductivity was estimated using equation (5.3) with C =1, ϕ =1.5, average e = 40 m2 kg-1, sρ = 2.2 g cm-3, n =1, average BETS = 400 m2 g-1 and p =1 bar
135
Figure 5.13 Response surface of total thermal conductivity fitted with second order model at (a) 30 oC, (b) 100 oC, (c) 200 oC and (d) 300 oC.
141-142
Figure 5.14 Optimal tie lines to minimize total thermal conductivity of opacified aerogel at various temperatures based on equation (5.18)
144
Figure 5.15 Optimal tie lines to minimize total thermal conductivity of opacified aerogel with various silica concentrations based on equation (5.18)
144
xvi
Page
Figure 5.16 Response surface of total thermal conductivity fitted with third order model at (a) 30 oC, (b) 100 oC, (c) 200 oC and (d) 300 oC.
147-148
Figure 5.17 Optimal tie lines to minimize total thermal conductivity of opacified aerogel at various temperatures based on equation (5.23)
149
Figure 5.18 Optimal tie lines to minimize total thermal conductivity of opacified aerogel with various silica concentrations based on equation (5.23)
150
Figure 5.19 Optimal tie lines to minimize total thermal conductivity of opacified aerogel at a given temperature obtained from solutions of equations (5.23) and (5.25)
152
Figure 5.20 Comparison of thermal conductivity of bamboo leaf aerogels opacified activated carbon and carbon black. Both types of aerogel are synthesized with 4.25 wt% of silica concentration and 1 – 25 wt% of carbon loading. (I) and (II) are rotated views to illustrate the comparison clearly.
153
Figure 5.21 Comparison of thermal conductivity of aerogels bamboo leaf aerogels with TEOS aerogels. Both types of aerogel are synthesized with 4.25 wt% of silica concentration and opacified with 0 – 25 wt% of activated carbon. (I) and (II) are rotated views to illustrate the comparison clearly.
155
Figure 5.22 Bulk density of bamboo leaf aerogels compared with TEOS aerogels. All aerogels were synthesized with 4.25 wt% silica concentration and opacified with 1 – 25 wt% of activated carbon.
156
xvii
NOTATIONS
Abbreviations
ABPR Automated Back Pressure Regulator
APD Ambient pressure drying
BB Bamboo leaf
BET Brunauer–Emmett–Teller
BJH Barrett-Joyner-Halenda
CCD Central composite design
COSA Carbon-opacified silica aerogel
CVD Chemical vapor deposition
DFT Density Functional Theory
DLCA Diffusion-Limited-Clusters-Aggregation
DSC Differential scanning calorimeter
DTG Differential Thermo-gravimetric Analysis
EDX Energy Dispersive X-Ray
EtMeIm+ Tf 2N- 1-ethyl-3-methylimidazolium bis amide
FT-IR Fourier transform infrared spectroscopy
HMDS Hexamethyl-dislioxane
HMDZ Hexamethyl-disilazane
IC Cogon grass
ICP-AES Inductively Coupled Plasma–Atomic Emission Spectroscopy
LHV Lower heating value
MOR Modulus of rupture
MTES Methyl-triethoxysilane
xviii
MTMS Methyl-trimethoxysilane
PEDS Polyethoxydisiloxane
RF Resorcinol – formaldehyde
SAXS Small angle X-ray scattering
SCFD Supercritical fluid drying
TEOS Tetraethyl-orthosilicate
TGA Thermogravimetric analysis
TMCS Trimethyl-chlorosilane
TMES Trimethyl-ethoxysilane
TMOS Tetramethyl-orthosilicate
XRD X-ray diffractometer
xix
Symbols
ashW ash content
tW instantaneous weight percentage of biomass residue in TGA
fW final weight percentage of ash remained in TGA
β heating rate of TGA
aE activation energy
2SiOM
molar mass of silica
SiW weight percentage of silicon in ash
lchW weight percentage of the biomass residue that remained after acid leaching
NaOHV
NaOH volume reacted with silica in dissolution
φ purity of silica determined by EDX
BSm mass of bio-silica used in the NaOH dissolution
SiM molar mass of silicon
aeρ bulk density of aerogel
sρ true density of aerogel
aeV volume of aerogel
hydV volume of hydrogel
( )I q
scaterring intensity of SAXS
SD surface fractal dimension
Γ gamma function
ζ characteristics length of a fractal structure
xx
SV
surface per unit volume ratio
PK Porod’s law constant
SAXSS
specific surface area determined by SAXS
charX
percentage bio-char produced per gram of biomass carbonized
0W initial weight of biomass used in carbonization
RW weight of residue remained after carbonization
burntC
carbon burnt off in carbonization
charW
weight of bio-char used in activation
acW weight of activated carbon produced after activation
CΘ carbon loading in opacification
acm mass of activated carbon used in opacification
silicam
mass of silica used in opacification
wgm mass of water glass
Si Θ silica concentration in water glass
pd particle diameter
Qn
local number of bridging oxygen between silicon atoms
fD apparent mass fractal dimension
gλ gaseous thermal conductivity
rλ radiative thermal conductivity
sλ solid thermal conductivity
Tλ total thermal conductivity
xxi
BETS BET specific surface area
e specific Rosseland mean extinction coefficients
sλ true solid thermal conductivity
iτ regressed coefficients of parameters for second order model
γi
regressed coefficients of parameters for third order model
mV molar volume
gd diameter gas molecules
gµ dynamic viscosity of gas
gρ density of gas
a radius of the pore
A frequency factor
C pre-factor that depends on the interconnectivity of particles in aerogels
e sample thickness to determine Rayleigh number
P capillary pressure
Π porosity
R universal gas constant
ϕ constant depends on the interconnectivity of solid particles
α size parameter of light scattering
β thermal expansion coefficient of gas
σ Stefan – Boltzman constant
𝑘𝐵 Boltzman constant
𝑙𝑚 mean free path of gas molecules,
xxii
A agitation speed
a primary particle size determined by SAXS
C concentration of NaOH in water glass
D mass fractal dimension
g gravitational acceleration
g(α) integral conversion function
K permeability coefficient
m0 initial mass of biomass used in furnace combustion
mash mass of ash collected after furnace combustion
n refaractive index of aerogel
p pressure
q scattering vector of SAXS
r radius of curvature
R volume-to-mass ratio in water glass
Ra Rayleigh number
S solubility of particle with radius r
S0 solubility of silica with flat surface
T absolute temperature
X fractional conversion in TGA
α degree of conversion
γSL specific energy of solid-liquid interface
γSV specific energy of solid-vapor interface
ΔT temperature difference
ξ silica yield in NaOH dissolution
1
CHAPTER 1
INTRODUCTION
1.1 Background
Silica aerogel is well known as the lightest solid that consists of amorphous 3-
dimensional silica network with > 96% of its volume is filled with air. Aerogel was first
invented by Steven Kistler in 1930s by using supercritical fluid drying (SCFD) of silica
gel (Kistler, 1931, Kistler, 1932). This technique had successfully dried silica gel
without collapsing its internal network. The result was a porous material (80-99.8%
porosity) with extremely low density. Other unique properties of silica aerogel are
including high specific surface area, low thermal conductivity, ultra-low dielectric
constant and low refractive index. These special properties made aerogel a suitable
material to be used in thermal insulation, acoustic barriers, supercapacitors, catalytic
support, adsorption and studies of high energy physics (Dorcheh and Abbasi, 2008a).
Among the applications of silica aerogel, its thermal insulating property has
received much attention from researchers. Thermal conductivity of silica aerogel is
lower than still air and equivalent to the thermal insulation R-value of polyurethane
foam used in refrigerators. Its R-value can be further enhanced when aerogel is used
under partial vacuum (~0.1 atm), thus giving a much more energy efficient insulating
material (Dorcheh and Abbasi, 2008a).
Heat transfer in silica aerogel occurred in three modes; i.e. solid conductivity
through silica network, gaseous conductivity through open pores, and radiation. Since
silica network consist of many “dead ends”, solid thermal conduction occurs through
various tortuous paths and thus not effective in transferring heat. Gaseous conductivity
can be suppressed if the mean free path of air is lengthened to exceed the pore size in
aerogel. This can be achieved easily by applying modest vacuum pressure because silica
2
aerogel consists mainly of mesopores (2-50 nm). For radiative transport in silica
aerogel, it is mainly caused by its low absorption coefficients for wavelengths in 3-8
μm, i.e. in the region of infrared. Under vacuum condition, the heat transfer in silica
aerogel is attributed to solid and radiative components; each contributed about half of
the heat passes. At elevated temperature ( >200oC), the radiative transport in silica
aerogel becomes the dominant mode of heat transfer. Therefore, the radiative transport
must be suppressed if silica aerogel is used for insulation purposes at high temperature.
Researchers had attempted to opacify silica aerogel with carbon because carbon has
good absorption in infrared region. Thermal conductivity of carbon-opacified silica
aerogel (COSA) under room condition is ranged from 0.013 to 0.018 W.m-1.K-1
(Dorcheh and Abbasi, 2008a).
Carbon opacification was carried out mainly by dispersing stable carbon into
pure silica aerogel. In such cases, external carbon sources are required. Both amorphous
silica and carbon can be obtained from bamboo leaf and cogon grass upon pyrolysis.
Thus they have great potential to be cheap raw materials for the production of COSA.
Bamboo leaf is the agricultural waste commonly arises from paper production. It is
normally burnt in open landfills in which airborne pollutants are the direct consequence
of this open burning. Cogon grass (Imperata cylindrica) is considered as one of the
worst invasive weeds which had infested more than 500 million hectares of land
worldwide (Lowe S, 2004, MacDonald, 2007) because it is pyrogenic, rhizomatous
perennial, hardly decompose, unpalatable and allelopathic. There is very limited
reported work on the silica content in cogon grass. Some literature speculated cogon
grass is rich in silica, hence can be considered as another potential candidate to produce
high purity bio-silica. However, no information or data had been reported to support
such statement. Rice husk, which contains averagely 20 wt% of silica, was previously
used to synthesize pure silica aerogel without any opacification (Li and Wang, 2008,
3
Tang and Wang, 2005). To the best of author’s knowledge, rice husk is the only
biomass attempted to synthesize silica aerogel. Hence, rice husk was used as a
comparison biomass throughout this study.
1.2 Problem statement
Conventionally, silica aerogel is mostly produced by using expensive precursors
such as tetramethyl orthosilicate (TMOS) and tetraethyl orthosilicate (TEOS). Both of
these materials are hazardous, especially TMOS can cause blindness (Dorcheh and
Abbasi, 2008a). By using biomass such as bamboo leaf and cogon grass, it not only
eliminates these problems but also helps to convert agriculture waste to value added
product. However, attempt on synthesizing COSA using bamboo leaf and cogon grass
had not been reported so far. Hence, in this work, it is expected that silica and carbon
content in bamboo leaf and cogon grass can be utilized as a new alternative source to
produce COSA. Parameters in the extraction of silica and carbon, gelation, and
opacification are expected to influence the characteristics of aerogel produced. Such
parameters will be studied to optimize the performance of COSA produced as a thermal
insulating material.
4
1.3 Objectives
This work is aimed to:
(i) investigate the suitability of bio-silica extracted from bamboo leaf and cogon
grass to synthesize silica aerogel;
(ii) synthesize and characterize silica aerogel using silica extracted from bamboo
leaf;
(iii) opacify and characterize the silica aerogel that opacified with activated carbon
(COSA);
(iv) develop correlations on the processing parameters that optimize performance of
COSA as thermal insulating material; and
(v) compare the thermal insulation performance of COSA with aerogels synthesized
using TEOS and carbon black.
5
1.3 Framework of thesis
The thesis contains six chapters and the content of each chapter are outlined as
follows:
Chapter 1 introduces the background and objectives of this research.
Chapter 2 presents the synthesis and opacification process of silica aerogel. Sources
and potential of selected biomass in synthesizing aerogel are discussed.
Theory on various modes of heat transfer is also introduced in this
chapter.
Chapter 3 describes the research methodology for the synthesis, opacification and
optimization of bamboo leaf aerogel.
Chapter 4 discuss on the extraction of silica from biomass and synthesis of aerogel
from the extracted silica. Optimization of silica dissolution to form water
glass is also detailed in this chapter.
Chapter 5 focuses on the opacification of silica aerogel obtained. Various statistical
models are developed to optimize the performance of opacified aerogel.
Chapter 6 concludes all the findings in this work and recommends relevant future
direction of this research. The chapter also highlights the novelty
contributed by this study
6
CHAPTER 2
LITERATURE REVIEW
2.1 Silica aerogel
2.1.1 Properties and uses of silica aerogel
Aerogel is referred as airy solid where 80-99% of its volume is filled with air.
This gives rise to its extremely low density, which reaching a minimum density of 0.003
g.cm-3 (Dorcheh and Abbasi, 2008b). Among many types of aerogel, silica aerogel has
the unusual properties including high specific surface area, 500 – 1200 m2.g-1 (Fricke
and Emmerling, 1992a), low thermal conductivity, 0.005 W.m-1.K-1 (Jensen et al., 2004,
Schultz et al., 2005), ultra-low dielectric constant, (k =1.0 – 2.0) and low refractive
index (1.005) (Fricke and Emmerling, 1992b, Fricke, 1988).
The extraordinary characteristics of silica aerogel make it suitable be used in
many engineering applications. For instance, super-capacitor can be made from silica
aerogel due to its ultra-low dielectric constant (Du et al., 2009, Mohanan and Brock,
2004). In nuclear studies, the low refractive index of silica aerogel had been used to
detect Cherenkov’s radiation (Brajnik et al., 1994, Brajnik et al., 1995, Fricke and
Emmerling, 1998, Carlson et al., 1995). Silica aerogel is also used in chemical
industries as absorbent to remove toxic compounds from wastes (Liu et al., 2009,
Hrubesh et al., 2001, Standeker et al., 2007, Rao et al., 2007b). Other engineering
applications include acoustics barrier (Wang et al., 2010), catalyst (Cutrufello et al.,
2011, Pajonk, 1991) and catalytic support (Dominguez et al., 2010, Dominguez et al.,
2008, Tai et al., 2009, Dias et al., 2006).
Among the applications of silica aerogel, its thermal insulating property has
received much attention from researchers. Thermal conductivity of silica aerogel is
lower than still air, i.e. ranged from 0.017 – 0.02 W.m-1.K-1 at room condition (Fricke et
7
al., 1987, Hummer et al., 1992, Hummer et al., 1993, Wei et al., 2009a, Wei et al.,
2011). When aerogel is used under partial vacuum (~0.1atm), its R-value can be
increased to R20 per inch (Hrubesh and Pekala, 1994). Glazing was built by using the
translucent properties of silica aerogel coupled with its low thermal conductivity (Reim
et al., 2002, Reim et al., 2005).
2.1.2 Synthesis of silica aerogel
The properties of silica aerogel can be altered easily by many parameters involved in the
synthesis. Hence, it is crucial to understand the process to synthesize aerogel with
desired characteristics. Synthesis of silica aerogel can be generally divided into four
stages:
(a) Sol preparation
Suspension of solid colloidal particles ranged in 1-1000 nm is termed as sol. In a
sol-gel process, particles in sol are polymerized to form 3-dimensional rigid gel network.
The most common type of sol used in synthesis of silica aerogel is silicon alkoxides
such as silicon tetra-methoxide (more known as tetramethyl orthosilicate, TMOS) and
silica tetra-ethoxide (more known as tetraethyl orthosilicate, TEOS). Table 2.1 shows
molecular structures of TMOS and TEOS.
Despite their toxicity, TMOS and TEOS are being commonly used to synthesize
silica aerogel due to their purity and ease to hydrolyze in water (Brinker and Scherer,
1990). The partial hydrolysis of such alkoxides in water produces intermediate sol,
which condense and polymerize to form gel. Equation (2.1) shows the formation of sol
from the hydrolysis of alkoxides:
2Si OR H O Si OH ROH≡ − + ↔ ≡ − + (2.1)
8
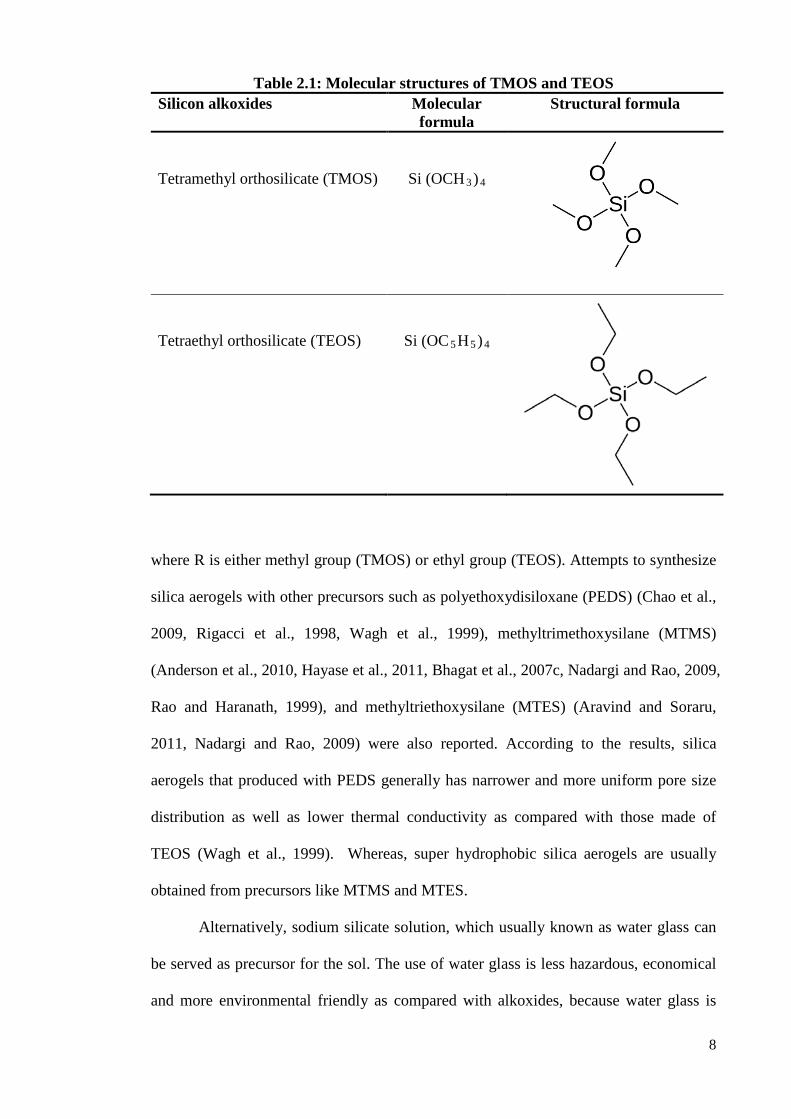
Table 2.1: Molecular structures of TMOS and TEOS Silicon alkoxides Molecular
formula Structural formula
Tetramethyl orthosilicate (TMOS)
Si (OCH3 )4
Tetraethyl orthosilicate (TEOS)
Si (OC5 H5 )4
where R is either methyl group (TMOS) or ethyl group (TEOS). Attempts to synthesize
silica aerogels with other precursors such as polyethoxydisiloxane (PEDS) (Chao et al.,
2009, Rigacci et al., 1998, Wagh et al., 1999), methyltrimethoxysilane (MTMS)
(Anderson et al., 2010, Hayase et al., 2011, Bhagat et al., 2007c, Nadargi and Rao, 2009,
Rao and Haranath, 1999), and methyltriethoxysilane (MTES) (Aravind and Soraru,
2011, Nadargi and Rao, 2009) were also reported. According to the results, silica
aerogels that produced with PEDS generally has narrower and more uniform pore size
distribution as well as lower thermal conductivity as compared with those made of
TEOS (Wagh et al., 1999). Whereas, super hydrophobic silica aerogels are usually
obtained from precursors like MTMS and MTES.
Alternatively, sodium silicate solution, which usually known as water glass can
be served as precursor for the sol. The use of water glass is less hazardous, economical
and more environmental friendly as compared with alkoxides, because water glass is
9
non-toxic and cheap. Graded in term of molar ratio Na2 O:SiO2 , water glass is
manufactured by dissolving sources of amorphous silica into sodium hydroxide solution
as shown in reaction equation (2.2):
2 2 2 2 SiO 2 NaOH Na O SiO H On n+ → ⋅ + (2.2)
When sodium silicate reacts with acidic solution as in equation (2.3), monomers
of silicic acid are formed:
2 3 2 4Na SiO H O 2 H Si(OH) 2Na+ ++ + → + (2.3)
However, the molar ratios of Na2 O:SiO2 reported in previous studies are greatly
varied from 1:0.43 (Shi et al., 2010) to 1:3.4 (Hwang et al., 2008, Rao et al., 2001). It is
remains unclear how this molar ratio will affect the thermal conductivity of silica
aerogel synthesized. High molar ratio may lead to over hydrolysis, but low molar ratio
may also cause difficulty in gelation. The author of this work suspects that it is not the
molar ratio that contributes to the gelation but rather the concentration of SiO2 in the
water glass solution. Low concentration of SiO2 as the consequence of several dilution
may cause the oligomers formed sparsely in the liquor and are not able to develop into
3-dimensional network. The study on the effect of SiO2 concentration to the gelation is
thus one of the objectives in this work.
(b) Gelation
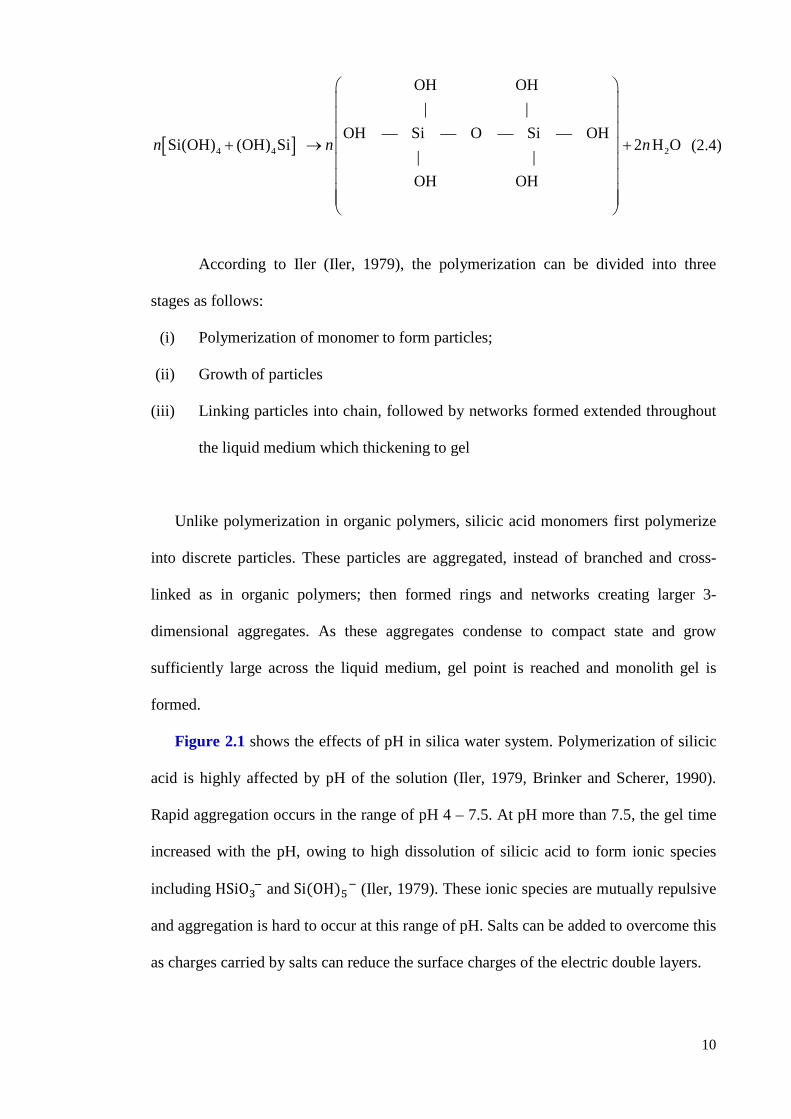
Monomers of silicic acid gelled as the consequence of the condensation sol
which followed by polymerization. Equation (2.4) shows the polymerization of silicic
acid formed by sodium silicate:
10
[ ]4 4 2
OH OH
| |OH — Si — O — Si — OH
Si(OH) (OH) Si 2 H O| |OH OH
n n n
+ → +
(2.4)
According to Iler (Iler, 1979), the polymerization can be divided into three
stages as follows:
(i) Polymerization of monomer to form particles;
(ii) Growth of particles
(iii) Linking particles into chain, followed by networks formed extended throughout
the liquid medium which thickening to gel
Unlike polymerization in organic polymers, silicic acid monomers first polymerize
into discrete particles. These particles are aggregated, instead of branched and cross-
linked as in organic polymers; then formed rings and networks creating larger 3-
dimensional aggregates. As these aggregates condense to compact state and grow
sufficiently large across the liquid medium, gel point is reached and monolith gel is
formed.
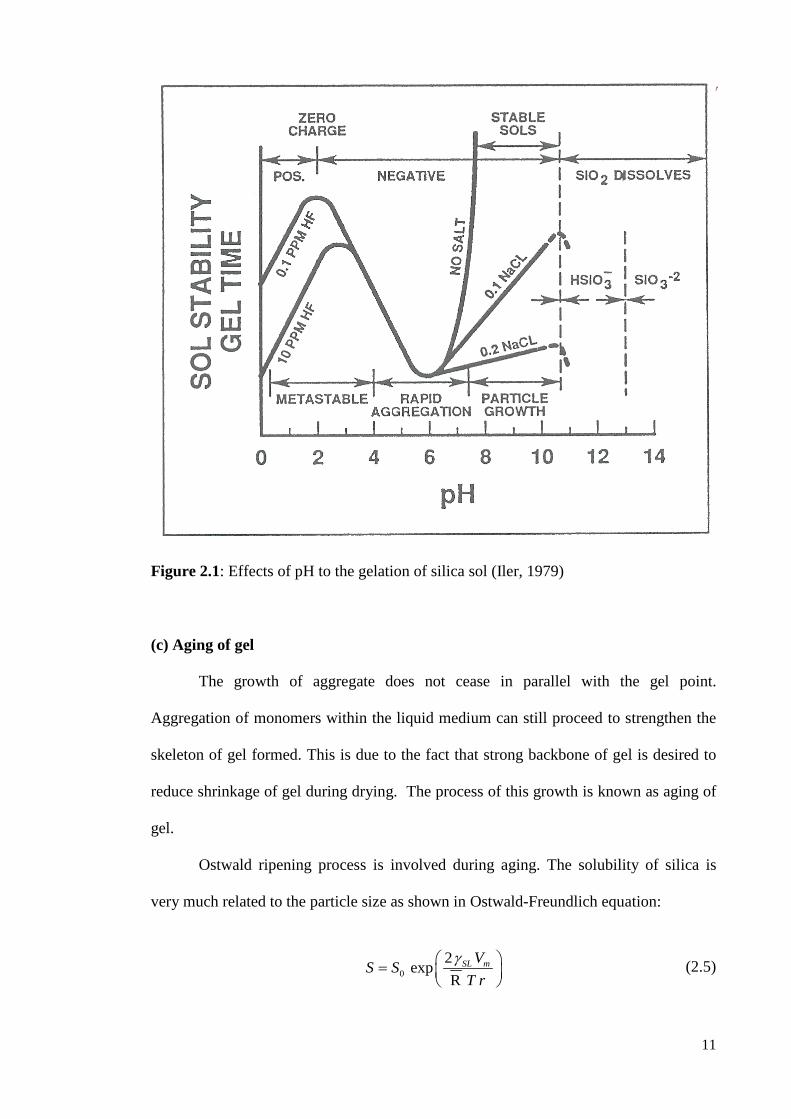
Figure 2.1 shows the effects of pH in silica water system. Polymerization of silicic
acid is highly affected by pH of the solution (Iler, 1979, Brinker and Scherer, 1990).
Rapid aggregation occurs in the range of pH 4 – 7.5. At pH more than 7.5, the gel time
increased with the pH, owing to high dissolution of silicic acid to form ionic species
including HSiO3 − and Si(OH)5 − (Iler, 1979). These ionic species are mutually repulsive
and aggregation is hard to occur at this range of pH. Salts can be added to overcome this
as charges carried by salts can reduce the surface charges of the electric double layers.
11
Figure 2.1: Effects of pH to the gelation of silica sol (Iler, 1979)
(c) Aging of gel
The growth of aggregate does not cease in parallel with the gel point.
Aggregation of monomers within the liquid medium can still proceed to strengthen the
skeleton of gel formed. This is due to the fact that strong backbone of gel is desired to
reduce shrinkage of gel during drying. The process of this growth is known as aging of
gel.
Ostwald ripening process is involved during aging. The solubility of silica is
very much related to the particle size as shown in Ostwald-Freundlich equation:
02 expR
SL mVS ST r
γ =
(2.5)
12
where
S : solubility of particle with radius r
S0 : solubility of silica with flat surface
𝛾𝑆𝑆 : liquid-solid interfacial energy, 50-100 ergs.cm-2 for amorphous silica (Iler,
1979)
𝑉𝑚 : molar volume (27.2 cm3 for amorphous silica) (Iler, 1979)
R : universal gas constant (8.3 × 10⁷ergs.mol-1. K-1)
T : absolute temperature (K)
r : radius of curvature (cm)
From equation (2.5), small particles tend to dissolve more into the liquid
medium. As the neck (where two larger particles are in contact) has negative curvature
(r < 0), the dissolved particles will re-precipitate at the neck and toughening the
structure. Despite aging helps to strengthen the gel, it is reported that prolong aging
caused coarsening of structure (Haereid et al., 1995a) and also increase in density of gel
owing to severe shrinkage (Rao et al., 2004).
Modulus of rupture (MOR) and shear modulus (G) of gel are generally used as
proxy to the degree of aging. They indicate the strength of gel along the aging period.
Factors such as aging temperature and aging time had already been investigated
extensively (Haereid et al., 1995a, Rangarajan and Lira, 1991, Rao et al., 2004,
Reichenauer, 2004, Bangi et al., 2008b, He et al., 2009, Strom et al., 2007, Hdach et al.,
1990). Generally, the results show that the optimum aging period is about 3 hours
(Bangi et al., 2008b, Haereid et al., 1995a, Strom et al., 2007). For aging temperature, it
has a range resulted in optimum MOR and shear modulus of aerogel. The maximum
MOR and shear modulus attained at various temperatures do not vary much but the
13
aging time required to reach such maximum can be greatly reduced at higher
temperature (Haereid et al., 1995a, Reichenauer, 2004).
Silica based organic solvents are sometimes added during aging to strengthen
the gel. Solvents such as TEOS/ethanol (Hwang et al., 2007, He et al., 2009, Haereid et
al., 1995b, Einarsrud and Nilsen, 1998a, Einarsrud and Nilsen, 1998b), hexamethyl-
disilazane (HMDZ) (Bhagat et al., 2007b) and trimethylchlorosilane (TMCS) (Wei et al.,
2007, Bhagat et al., 2008, Shlyakhtina and Oh, 2008) are used in aging not only to add
new monomers but also to promote crosslinking to silica network in wet gel. The
aerogel produced with these solvents are hydrophobic due to the addition of alkyl
groups on the surface of the gel.
As an alternative, ionic liquid with zero vapor pressure was used in aging. It
would be an advantage to age silica gel in ionic liquid where no vaporization can occur
within the gel network, which led to shrinkage and cracks. Dai (Dai et al., 2000) had
aged silica hydrogel in ionic liquid 1-ethyl-3-methylimidazolium bis amide
( EtMeIm+ Tf 2N- ) and the results is encouraging as no shrinkage were observed in
aerogel obtained. In spite of that, there is no follow-up study been reported. This is most
probably due to economic infeasibility of using high cost ionic liquid.
(d) Drying of gel
Drying of wet gel is most critical step in the synthesis of aerogel. Enormous
capillary pressure is induced by nano-pores within the gel during drying process. Its
magnitude may reach 100 - 200 MPa (Brinker and Scherer, 1990, Scherer and Smith,
1995), and collapse of gel is an inevitable consequence of drying the gel rapidly under
room pressure. The dry collapsed gel is known as xerogel, which has very high density
as compared with aerogel.
14
During drying, the liquid on the outer surface of gel is evaporated and the inner
pores together with its solid wall are exposed to liquid and vapor. The three solid-liquid,
solid-vapor and liquid-vapor interfaces produced capillary pressure on the wall of pore,
i.e. the solid skeleton of the gel. By assuming pores within the gel are in cylindrical
shape, the capillary pressure can be estimated using equation (2.6):
2 ( )SV SLPa
γ γ−= − (2.6)
where
P : Capillary pressure (J.m-3)
γSV : Specific energy of solid-vapor interface (J.m-3)
γSL : Specific energy of solid-liquid interface (J.m-3)
a : Radius of the pore (m)
The inverse relation between P and a explains the reason the capillary pressure
increases drastically as pore size within the gel approaches nanometer range. In addition,
the non-uniformity in pore size worsens the scenario. Should the pore size is uniform
throughout the gel, or at least distributed narrowly, capillary pressure will be balanced
in every direction, thus only very little shrinkage will occur in drying.
In the early of 1930s, Kistler (Kistler, 1931, Kistler, 1932) had dried the gel
successfully using supercritical fluid technique. It is well known when a fluid enters
supercritical state, the liquid-vapor boundary becomes indistinguishable and forms a
homogenous fluid. Consequently, the liquid within the pores is converted into
supercritical fluid without collapsing the gel network. The supercritical fluid is then
being brought into gas phase by lowering the pressure gradually at temperature higher
than its critical temperature to ensure no condensation occurs. Aerogel is produced as
the gas within the pores is replaced with air under room conditions. Kistler’s original
attempt used alcohol as solvent in supercritical drying instead of water, which present in
15
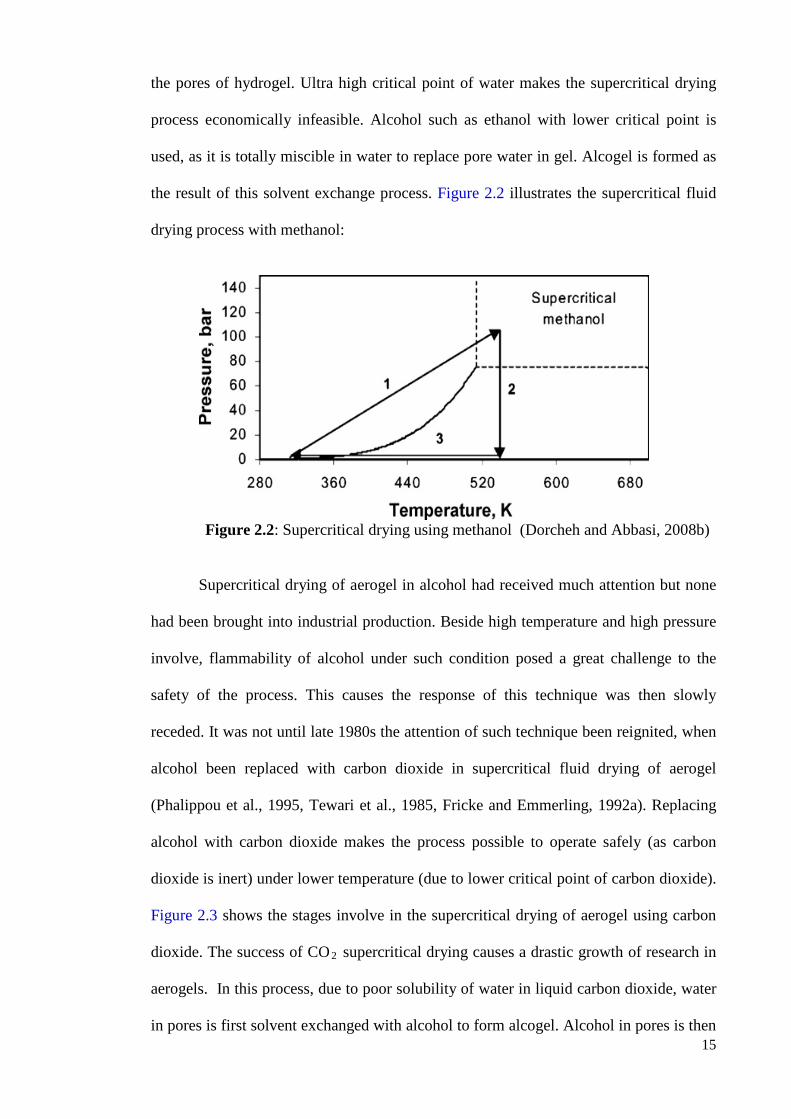
the pores of hydrogel. Ultra high critical point of water makes the supercritical drying
process economically infeasible. Alcohol such as ethanol with lower critical point is
used, as it is totally miscible in water to replace pore water in gel. Alcogel is formed as
the result of this solvent exchange process. Figure 2.2 illustrates the supercritical fluid
drying process with methanol:
Figure 2.2: Supercritical drying using methanol (Dorcheh and Abbasi, 2008b)
Supercritical drying of aerogel in alcohol had received much attention but none
had been brought into industrial production. Beside high temperature and high pressure
involve, flammability of alcohol under such condition posed a great challenge to the
safety of the process. This causes the response of this technique was then slowly
receded. It was not until late 1980s the attention of such technique been reignited, when
alcohol been replaced with carbon dioxide in supercritical fluid drying of aerogel
(Phalippou et al., 1995, Tewari et al., 1985, Fricke and Emmerling, 1992a). Replacing
alcohol with carbon dioxide makes the process possible to operate safely (as carbon
dioxide is inert) under lower temperature (due to lower critical point of carbon dioxide).
Figure 2.3 shows the stages involve in the supercritical drying of aerogel using carbon
dioxide. The success of CO2 supercritical drying causes a drastic growth of research in
aerogels. In this process, due to poor solubility of water in liquid carbon dioxide, water
in pores is first solvent exchanged with alcohol to form alcogel. Alcohol in pores is then
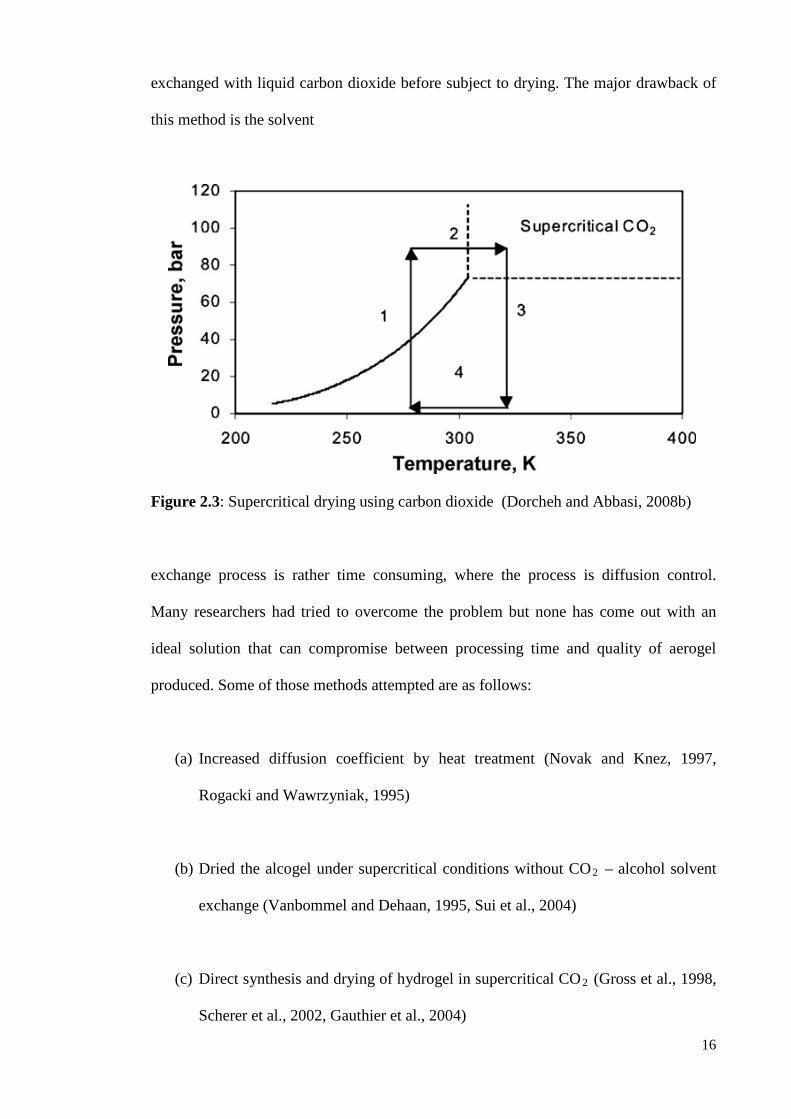
16
exchanged with liquid carbon dioxide before subject to drying. The major drawback of
this method is the solvent
Figure 2.3: Supercritical drying using carbon dioxide (Dorcheh and Abbasi, 2008b)
exchange process is rather time consuming, where the process is diffusion control.
Many researchers had tried to overcome the problem but none has come out with an
ideal solution that can compromise between processing time and quality of aerogel
produced. Some of those methods attempted are as follows:
(a) Increased diffusion coefficient by heat treatment (Novak and Knez, 1997,
Rogacki and Wawrzyniak, 1995)
(b) Dried the alcogel under supercritical conditions without CO2 – alcohol solvent
exchange (Vanbommel and Dehaan, 1995, Sui et al., 2004)
(c) Direct synthesis and drying of hydrogel in supercritical CO2 (Gross et al., 1998,
Scherer et al., 2002, Gauthier et al., 2004)
17
It is found that conditions during supercritical drying including temperature (as
long as higher than critical temperature), extraction time, depressurizing temperature,
and depressurizing rate has no effect on the density and porosity of silica aerogel
formed (Tamon et al., 1998). However, the surface characteristics of aerogel produced
is dependent on the solvent used in supercritical drying, i.e. hydrophobic with alcohols
but hydrophilic with carbon dioxide (Tajiri et al., 1995).
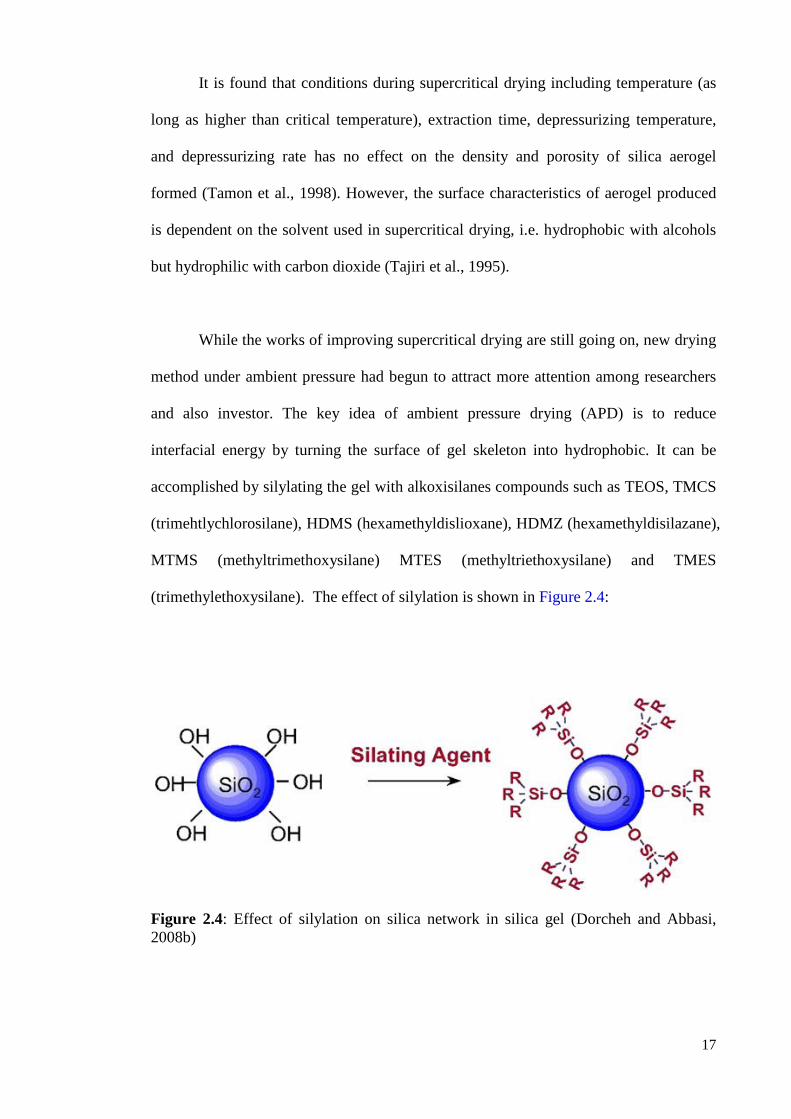
While the works of improving supercritical drying are still going on, new drying
method under ambient pressure had begun to attract more attention among researchers
and also investor. The key idea of ambient pressure drying (APD) is to reduce
interfacial energy by turning the surface of gel skeleton into hydrophobic. It can be
accomplished by silylating the gel with alkoxisilanes compounds such as TEOS, TMCS
(trimehtlychlorosilane), HDMS (hexamethyldislioxane), HDMZ (hexamethyldisilazane),
MTMS (methyltrimethoxysilane) MTES (methyltriethoxysilane) and TMES
(trimethylethoxysilane). The effect of silylation is shown in Figure 2.4:
Figure 2.4: Effect of silylation on silica network in silica gel (Dorcheh and Abbasi, 2008b)
18
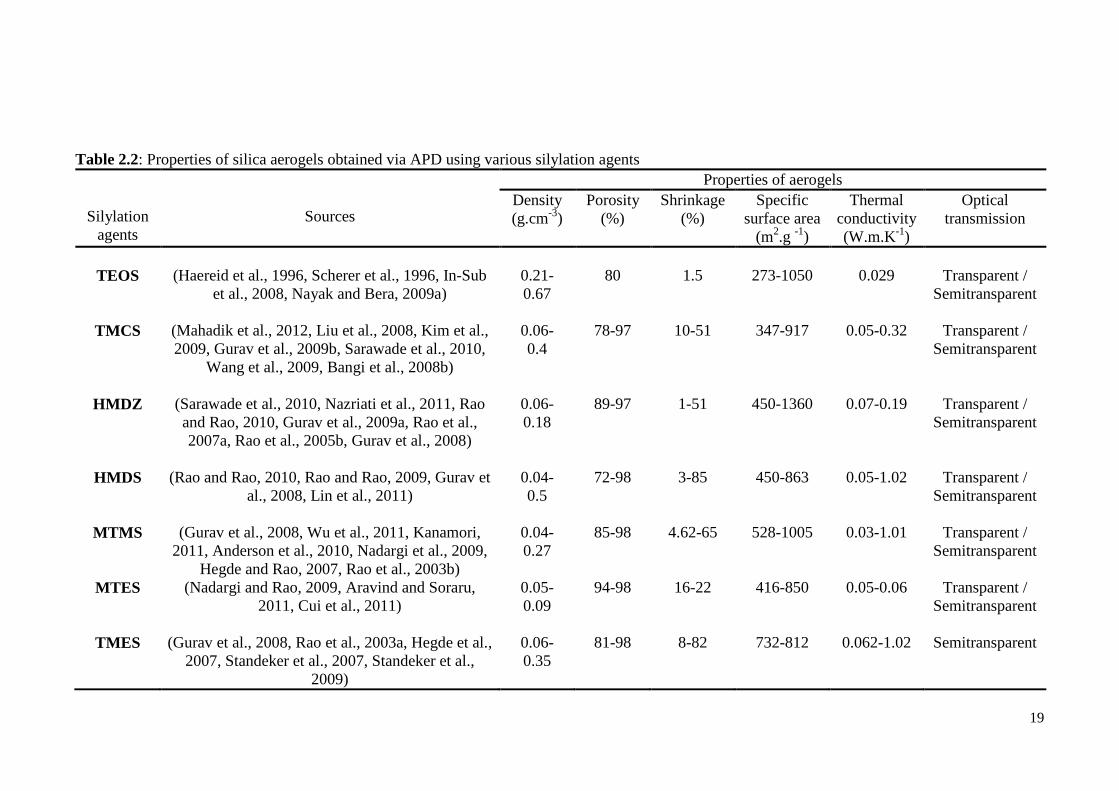
As the hydroxyl groups on the surface are replaced with alkyl group, water in
hydrogel is being displaced from the gel. The gel obtained is then soaked in other
hydrophobic solvents such as hexane and heptane and is dried in oven under ambient
pressure. Table 2.2 shows the summarized properties of aerogel obtained via silylation
corresponding to agents commonly used. Generally, silylated aerogels suffers wider
degree of shrinkage as compared with supercritical fluid drying, depending on the
silylating condition.
19
Table 2.2: Properties of silica aerogels obtained via APD using various silylation agents
Silylation
agents
Sources
Properties of aerogels Density (g.cm-3)
Porosity (%)
Shrinkage (%)
Specific surface area
(m2.g -1)
Thermal conductivity (W.m.K-1)
Optical transmission
TEOS
(Haereid et al., 1996, Scherer et al., 1996, In-Sub
et al., 2008, Nayak and Bera, 2009a)
0.21-0.67
80
1.5
273-1050
0.029
Transparent /
Semitransparent
TMCS
(Mahadik et al., 2012, Liu et al., 2008, Kim et al., 2009, Gurav et al., 2009b, Sarawade et al., 2010,
Wang et al., 2009, Bangi et al., 2008b)
0.06- 0.4
78-97
10-51
347-917
0.05-0.32
Transparent /
Semitransparent
HMDZ
(Sarawade et al., 2010, Nazriati et al., 2011, Rao and Rao, 2010, Gurav et al., 2009a, Rao et al., 2007a, Rao et al., 2005b, Gurav et al., 2008)
0.06-0.18
89-97
1-51
450-1360
0.07-0.19
Transparent /
Semitransparent
HMDS
(Rao and Rao, 2010, Rao and Rao, 2009, Gurav et
al., 2008, Lin et al., 2011)
0.04- 0.5
72-98
3-85
450-863
0.05-1.02
Transparent /
Semitransparent
MTMS
(Gurav et al., 2008, Wu et al., 2011, Kanamori,
2011, Anderson et al., 2010, Nadargi et al., 2009, Hegde and Rao, 2007, Rao et al., 2003b)
0.04-0.27
85-98
4.62-65
528-1005
0.03-1.01
Transparent /
Semitransparent
MTES
(Nadargi and Rao, 2009, Aravind and Soraru, 2011, Cui et al., 2011)
0.05-0.09
94-98 16-22 416-850 0.05-0.06 Transparent / Semitransparent
TMES
(Gurav et al., 2008, Rao et al., 2003a, Hegde et al., 2007, Standeker et al., 2007, Standeker et al.,
2009)
0.06-0.35
81-98 8-82 732-812 0.062-1.02 Semitransparent
20
2.2 Bio-silica
It is known that some biomass like rice husk contains considerable amount of
silica, which can be used to synthesize silica aerogel (Nayak and Bera, 2009a, Hou,
2003, Li and Wang, 2008, Li et al., 2007, Tang and Wang, 2005). Silica in the form of
silicic acid in soil is normally absorbed by plants as a result of water consumption
(Motomura et al., 2002). It was then distributed in stems and leaf of the plant in the
form of amorphous silica. The family of plants like Equisetaceae (horsetail),
Cyperaceae (sedges) and Poaceae (true grasses) are especially well known of its uptake
of sililic acid (Motomura et al., 2006). Hence in this work, two biomasses i.e. bamboo
leaf (bambusa heterostachya) and cogon grass (imperata cylindrica), were used as
sources to produce aerogel. For the best of author’s knowledge, similar attempt has
never been reported by other sources prior to this work. Bio-silica is also obtained from
rice husk for the purpose of comparison.
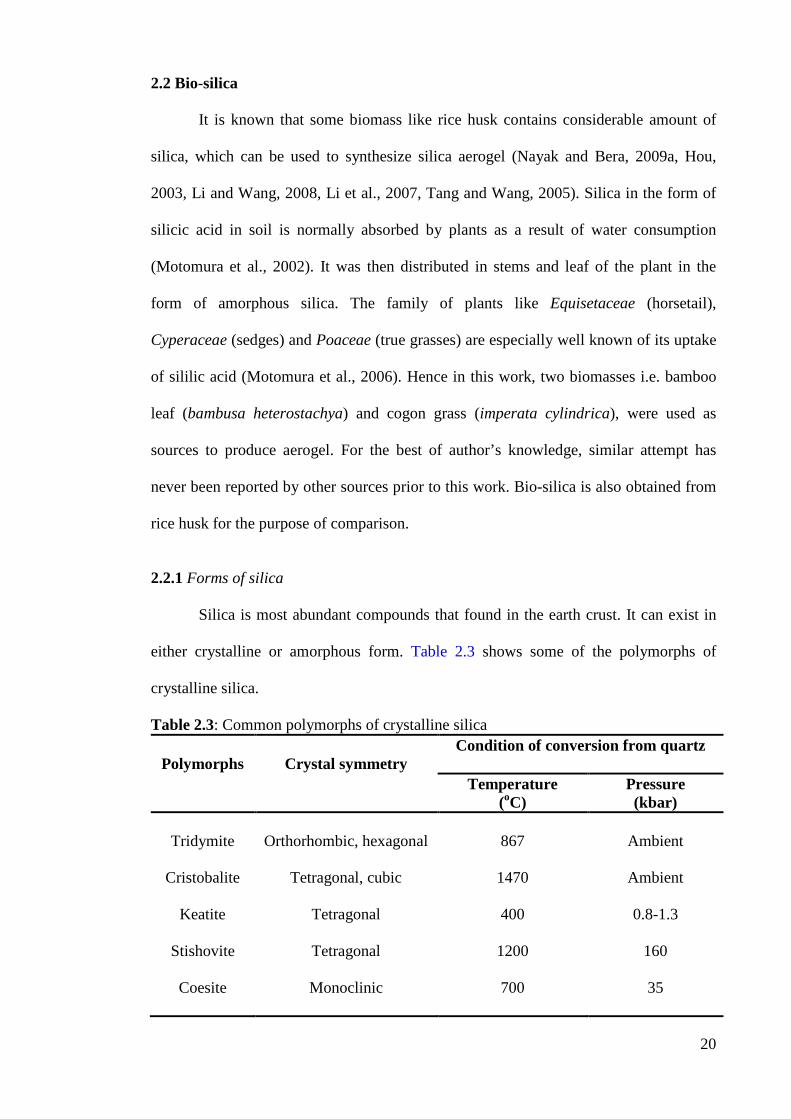
2.2.1 Forms of silica
Silica is most abundant compounds that found in the earth crust. It can exist in
either crystalline or amorphous form. Table 2.3 shows some of the polymorphs of
crystalline silica.
Table 2.3: Common polymorphs of crystalline silica
Polymorphs
Crystal symmetry Condition of conversion from quartz
Temperature
(oC) Pressure (kbar)
Tridymite
Orthorhombic, hexagonal 867 Ambient
Cristobalite
Tetragonal, cubic 1470 Ambient
Keatite
Tetragonal 400 0.8-1.3
Stishovite
Tetragonal 1200 160
Coesite
Monoclinic 700 35
21
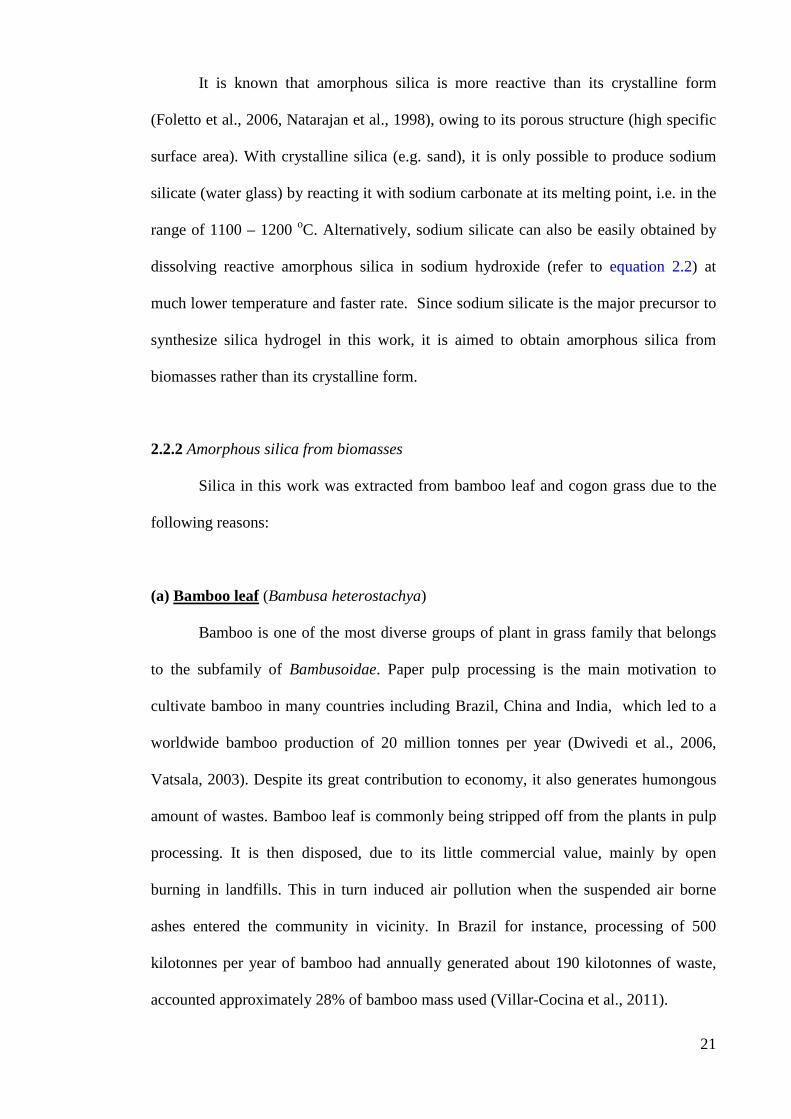
It is known that amorphous silica is more reactive than its crystalline form
(Foletto et al., 2006, Natarajan et al., 1998), owing to its porous structure (high specific
surface area). With crystalline silica (e.g. sand), it is only possible to produce sodium
silicate (water glass) by reacting it with sodium carbonate at its melting point, i.e. in the
range of 1100 – 1200 oC. Alternatively, sodium silicate can also be easily obtained by
dissolving reactive amorphous silica in sodium hydroxide (refer to equation 2.2) at
much lower temperature and faster rate. Since sodium silicate is the major precursor to
synthesize silica hydrogel in this work, it is aimed to obtain amorphous silica from
biomasses rather than its crystalline form.
2.2.2 Amorphous silica from biomasses
Silica in this work was extracted from bamboo leaf and cogon grass due to the
following reasons:
(a) Bamboo leaf (Bambusa heterostachya)
Bamboo is one of the most diverse groups of plant in grass family that belongs
to the subfamily of Bambusoidae. Paper pulp processing is the main motivation to
cultivate bamboo in many countries including Brazil, China and India, which led to a
worldwide bamboo production of 20 million tonnes per year (Dwivedi et al., 2006,
Vatsala, 2003). Despite its great contribution to economy, it also generates humongous
amount of wastes. Bamboo leaf is commonly being stripped off from the plants in pulp
processing. It is then disposed, due to its little commercial value, mainly by open
burning in landfills. This in turn induced air pollution when the suspended air borne
ashes entered the community in vicinity. In Brazil for instance, processing of 500
kilotonnes per year of bamboo had annually generated about 190 kilotonnes of waste,
accounted approximately 28% of bamboo mass used (Villar-Cocina et al., 2011).
22
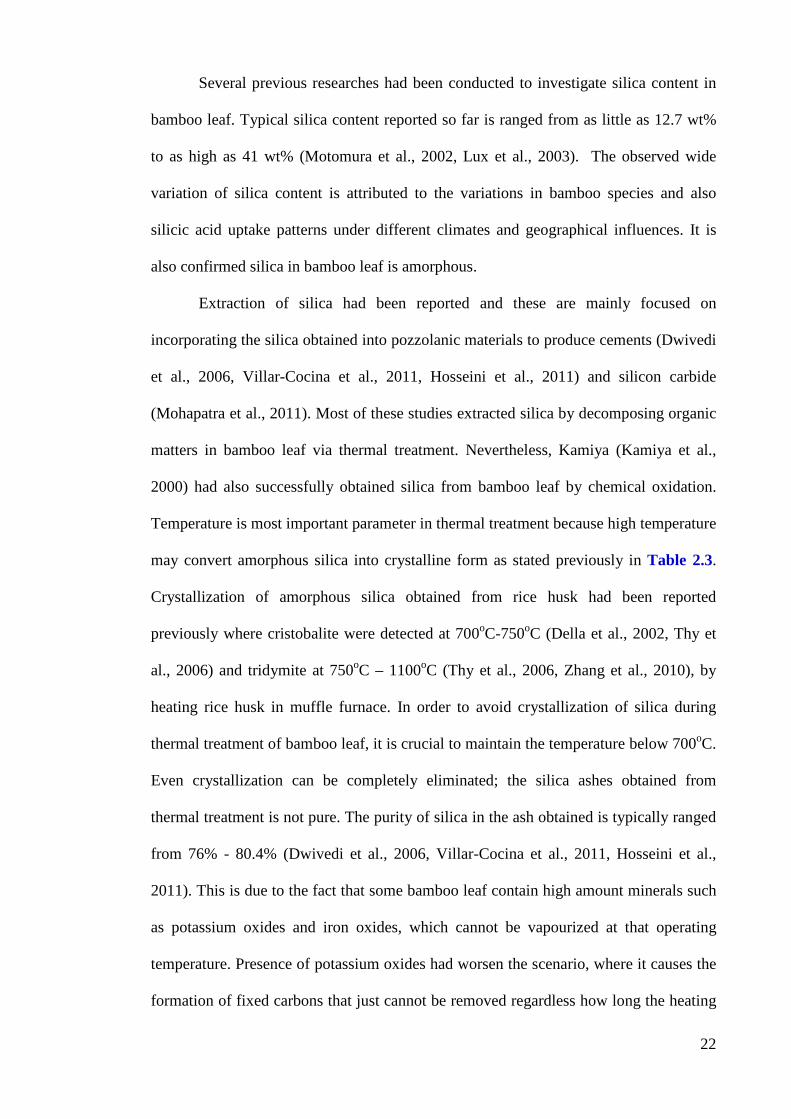
Several previous researches had been conducted to investigate silica content in
bamboo leaf. Typical silica content reported so far is ranged from as little as 12.7 wt%
to as high as 41 wt% (Motomura et al., 2002, Lux et al., 2003). The observed wide
variation of silica content is attributed to the variations in bamboo species and also
silicic acid uptake patterns under different climates and geographical influences. It is
also confirmed silica in bamboo leaf is amorphous.
Extraction of silica had been reported and these are mainly focused on
incorporating the silica obtained into pozzolanic materials to produce cements (Dwivedi
et al., 2006, Villar-Cocina et al., 2011, Hosseini et al., 2011) and silicon carbide
(Mohapatra et al., 2011). Most of these studies extracted silica by decomposing organic
matters in bamboo leaf via thermal treatment. Nevertheless, Kamiya (Kamiya et al.,
2000) had also successfully obtained silica from bamboo leaf by chemical oxidation.
Temperature is most important parameter in thermal treatment because high temperature
may convert amorphous silica into crystalline form as stated previously in Table 2.3.
Crystallization of amorphous silica obtained from rice husk had been reported
previously where cristobalite were detected at 700oC-750oC (Della et al., 2002, Thy et
al., 2006) and tridymite at 750oC – 1100oC (Thy et al., 2006, Zhang et al., 2010), by
heating rice husk in muffle furnace. In order to avoid crystallization of silica during
thermal treatment of bamboo leaf, it is crucial to maintain the temperature below 700oC.
Even crystallization can be completely eliminated; the silica ashes obtained from
thermal treatment is not pure. The purity of silica in the ash obtained is typically ranged
from 76% - 80.4% (Dwivedi et al., 2006, Villar-Cocina et al., 2011, Hosseini et al.,
2011). This is due to the fact that some bamboo leaf contain high amount minerals such
as potassium oxides and iron oxides, which cannot be vapourized at that operating
temperature. Presence of potassium oxides had worsen the scenario, where it causes the
formation of fixed carbons that just cannot be removed regardless how long the heating
23
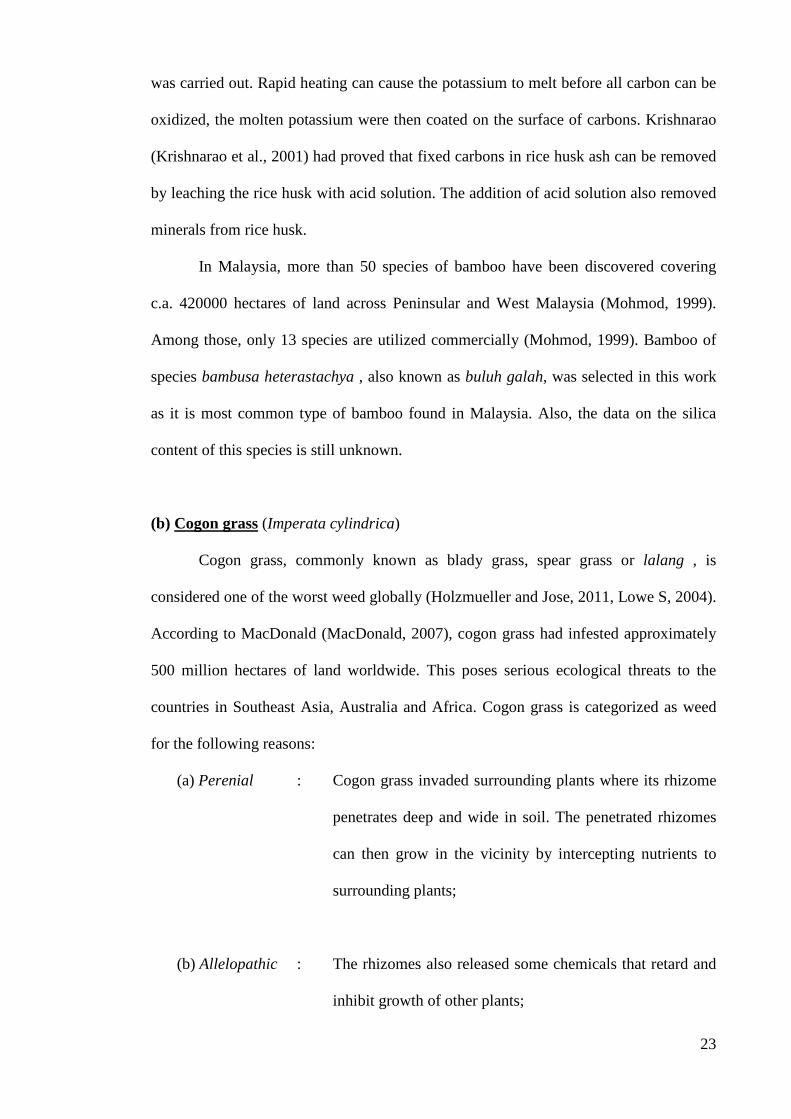
was carried out. Rapid heating can cause the potassium to melt before all carbon can be
oxidized, the molten potassium were then coated on the surface of carbons. Krishnarao
(Krishnarao et al., 2001) had proved that fixed carbons in rice husk ash can be removed
by leaching the rice husk with acid solution. The addition of acid solution also removed
minerals from rice husk.
In Malaysia, more than 50 species of bamboo have been discovered covering
c.a. 420000 hectares of land across Peninsular and West Malaysia (Mohmod, 1999).
Among those, only 13 species are utilized commercially (Mohmod, 1999). Bamboo of
species bambusa heterastachya , also known as buluh galah, was selected in this work
as it is most common type of bamboo found in Malaysia. Also, the data on the silica
content of this species is still unknown.
(b) Cogon grass (Imperata cylindrica)
Cogon grass, commonly known as blady grass, spear grass or lalang , is
considered one of the worst weed globally (Holzmueller and Jose, 2011, Lowe S, 2004).
According to MacDonald (MacDonald, 2007), cogon grass had infested approximately
500 million hectares of land worldwide. This poses serious ecological threats to the
countries in Southeast Asia, Australia and Africa. Cogon grass is categorized as weed
for the following reasons:
(a) Perenial : Cogon grass invaded surrounding plants where its rhizome
penetrates deep and wide in soil. The penetrated rhizomes
can then grow in the vicinity by intercepting nutrients to
surrounding plants;
(b) Allelopathic : The rhizomes also released some chemicals that retard and
inhibit growth of other plants;
24
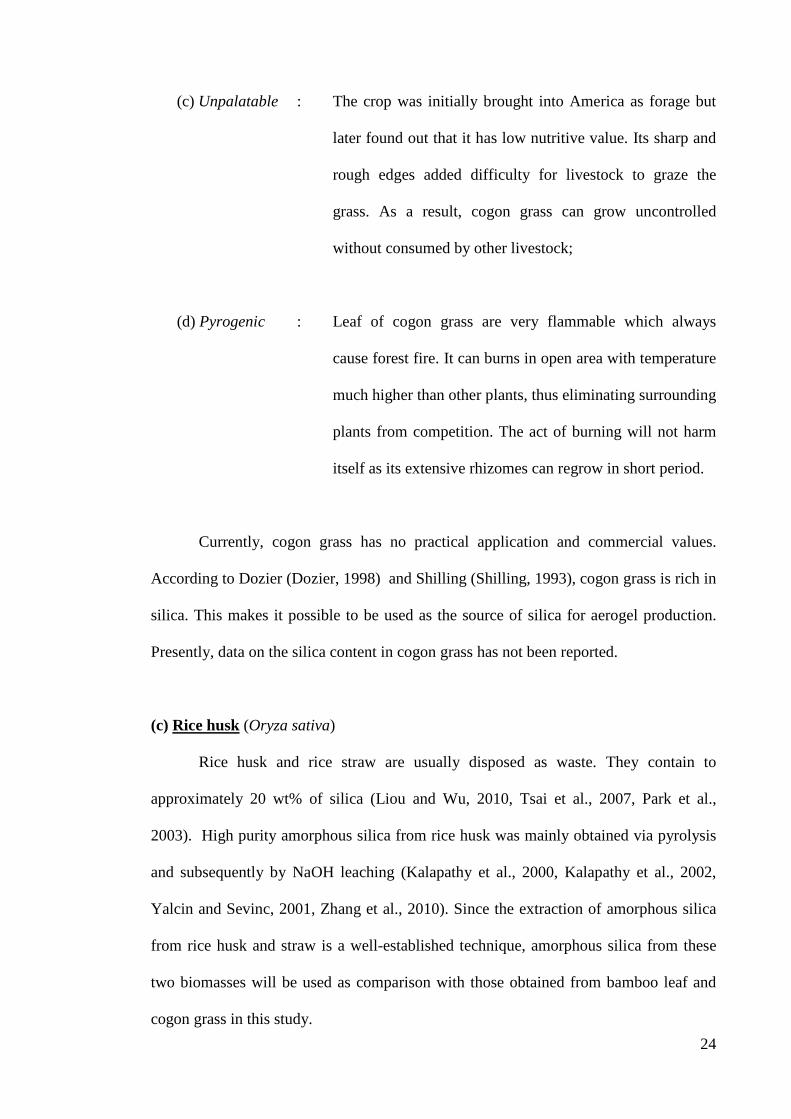
(c) Unpalatable : The crop was initially brought into America as forage but
later found out that it has low nutritive value. Its sharp and
rough edges added difficulty for livestock to graze the
grass. As a result, cogon grass can grow uncontrolled
without consumed by other livestock;
(d) Pyrogenic : Leaf of cogon grass are very flammable which always
cause forest fire. It can burns in open area with temperature
much higher than other plants, thus eliminating surrounding
plants from competition. The act of burning will not harm
itself as its extensive rhizomes can regrow in short period.
Currently, cogon grass has no practical application and commercial values.
According to Dozier (Dozier, 1998) and Shilling (Shilling, 1993), cogon grass is rich in
silica. This makes it possible to be used as the source of silica for aerogel production.
Presently, data on the silica content in cogon grass has not been reported.
(c) Rice husk (Oryza sativa)
Rice husk and rice straw are usually disposed as waste. They contain to
approximately 20 wt% of silica (Liou and Wu, 2010, Tsai et al., 2007, Park et al.,
2003). High purity amorphous silica from rice husk was mainly obtained via pyrolysis
and subsequently by NaOH leaching (Kalapathy et al., 2000, Kalapathy et al., 2002,
Yalcin and Sevinc, 2001, Zhang et al., 2010). Since the extraction of amorphous silica
from rice husk and straw is a well-established technique, amorphous silica from these
two biomasses will be used as comparison with those obtained from bamboo leaf and
cogon grass in this study.
25
2.3 Thermal transfer in silica aerogel
One of the aims of this work in to synthesize aerogel from biomasses and use as
thermal insulation material. It is then crucial to understand the routes of thermal transfer
in silica aerogels, so that to suppress the thermal conductivity in best possible ways.
Three conventional thermal transfers, namely conduction, convection and radiation, in
silica aerogel will be discussed. This not only helps to explain the ultralow thermal
conductivity of silica aerogel but also highlighting the conditions where thermal
resistivity of silica aerogel diminished; indicating its decreased effectiveness as thermal
insulant.
2.3.1 Convection
Among the three possible routes, convective transfer has the least contribution to
the total thermal conductivity of silica aerogel. Convective transfer usually involves a
fluid flow in the scale that is comparable with the scale of sample. As the size of
particles and pores in silica aerogel are in the ranged of nanometer, convective flow
hardly occur within such medium. In fact, it is reported that free convection of gas in
porous medium with pore size smaller than 1 mm is negligible (Lee et al., 2002,
Hrubesh and Pekala, 1994). In a more theoretical way, the tendency of free convection
to conduction of gas can be estimated by Rayleigh number:
g
g g
g K e TRa
β ρµ λ
∆=
(2.7)
where
Ra : Rayleigh number (dimensionless)
g : Gravitational acceleration in m.s-2
26
β : Thermal expansion coefficient of gas, 3.43 K-1 for air at 20oC
K : Permeability coefficient (dimensionless)
e : Sample thickness, 1 mm
ΔT : Temperature difference, 10 K
𝜌𝑔 : Density of gas, 1.2 kg. m-3 for air
𝜇𝑔 : Dynamic viscosity of gas, 1.86 × 10⁻⁵ kg.m-1.s-1 for air
𝜆𝑔 : Thermal conductivity of gas, 0.024 W.m-1. K-1 for air
For porous medium, the K value can be estimated by Carman- Kozeny equation:
( )
2p
2
173 1
dK
Π=
−Π (2.8)
where
Π : Porosity (dimensionless), averagely 0.8 for silica aerogel
pd : Particle diameter in nm, i.e., averagely 50 nm for silica aerogel
The resulted Rayleigh number is much smaller than unity, thus, heat transfer of
gas in aerogel favors conduction than convection.
2.3.2 Conduction
Conduction of heat in aerogel occurs through both solid network and also gas
that filled the pores. In aerogel, the solid network formed by aggregates of silica
particles creates long and torturous path for conduction with many dead ends. Heat
conduction through these dead ends is highly ineffective, hence causing the solid
network to have very low thermal conductivity. According to Zeng et al. (Zeng et al.,
1995a), the intrinsic solid conductivity of silica is only 1.34 W.m-1.K-1. However, the
porous structure of aerogel altered its solid conductivity making aerogel to have solid
conductivity less than 0.1 W.m-1.K-1 (Wei et al., 2009a). The solid conductivity of
27
aerogel is related to the structure of solid network formed, which in turn dependent on
the conditions during gel synthesis. Density of aerogel is usually a proxy of its solid
conductivity. Generally, denser aerogels have higher solid conductivity. Equation (2.9)
(Zeng et al., 1995a, Lu et al., 1995), shows the solid conductivity of monolithic aerogels
scaled with density:
aes C ϕλ ρ= (2.9)
where
𝜆𝑠 : solid conductivity of aerogel
C : pre-factor that depends on interconnectivity of particles in aerogel
aeρ : density of aerogel
ϕ : constant which is depended on the interconnectivity of solid particles,
usually 1.5 for silica aerogel
The parameters in sol-gel processing play an important role in determining the
density of aerogel produced. Thus, by manipulating these parameters, solid conductivity
of aerogel can be controlled. Such parameters include concentration of silica precursors
used, pH of catalyst and aging of gel. As these parameters are varied, the rate of
dissolution and re-precipitation silica particles will change, altering the density of
aerogel formed. Generally, density of aerogel increased with concentration of precursors
(Moner-Girona et al., 2003a, Moner-Girona et al., 2002, Moner-Girona et al., 2003b,
Ehrburgerdolle et al., 1995), pH of catalyst (Deng et al., 2000, Mezza et al., 1999, Wu et
al., 2000, Alaoui et al., 1998, Rao et al., 2005a), and aging time (Rao et al., 2004,
Smitha et al., 2006).
Comparing with conduction of solid network, gas conduction in aerogel can be
suppressed much easily. The efficiency of gas conduction is dependent on the mean free
path of gas molecules. If the mean free path of gas molecules is large, molecules
28
travelled longer distance to conduct heat. The mean free path of gas molecules are
related to the pressure as:
22
Bm
g
k Tld Pπ
= (2.10)
where
𝑙𝑚 : mean free path of gas molecules,
𝑘𝐵 : Boltzman constant, 1.38 × 10⁻²³ J.K-1
T : absolute temperature in K
𝑑𝑔 : diameter gas molecules, typically 3.53 × 10⁻¹⁰ m for air
P : pressure in Pa
Thus, the mean free path of air molecules at 25 oC and 1 atmospheric pressure is
estimated to be 75 nm. The mean free path is comparatively large to pores size of
aerogel. As pore size in aerogel is averagely 50 nm, air molecules are very unlikely to
collide with each other to transfer energy and therefore the conduction of gas in pore is
partially supressed. Kuhn et al. reported that the gas thermal conductivity in silica
aerogel under ambient condition is only about 0.01 W.m-1.K-1 (Kuhn et al., 1995), i.e.
only half of the conductivity in free air. Further lowering the pressure to one-hundredth
of atmospheric pressure will cause the mean free path to increase by 100 folds. As a
results, the gas thermal conductivity becomes negligibly small. According to Lee et al.
(Lee et al., 1995, Smith et al., 1998), the total thermal conductivity of silica aerogel was
supressed to 0.007 W.m-1.K-1 at one-hundredth of atmospheric pressure attributed to the
decrease in gas conductivity. However, further reduction in thermal conductivity was
not significant at pressure lower than that.
29
2.3.3 Radiation
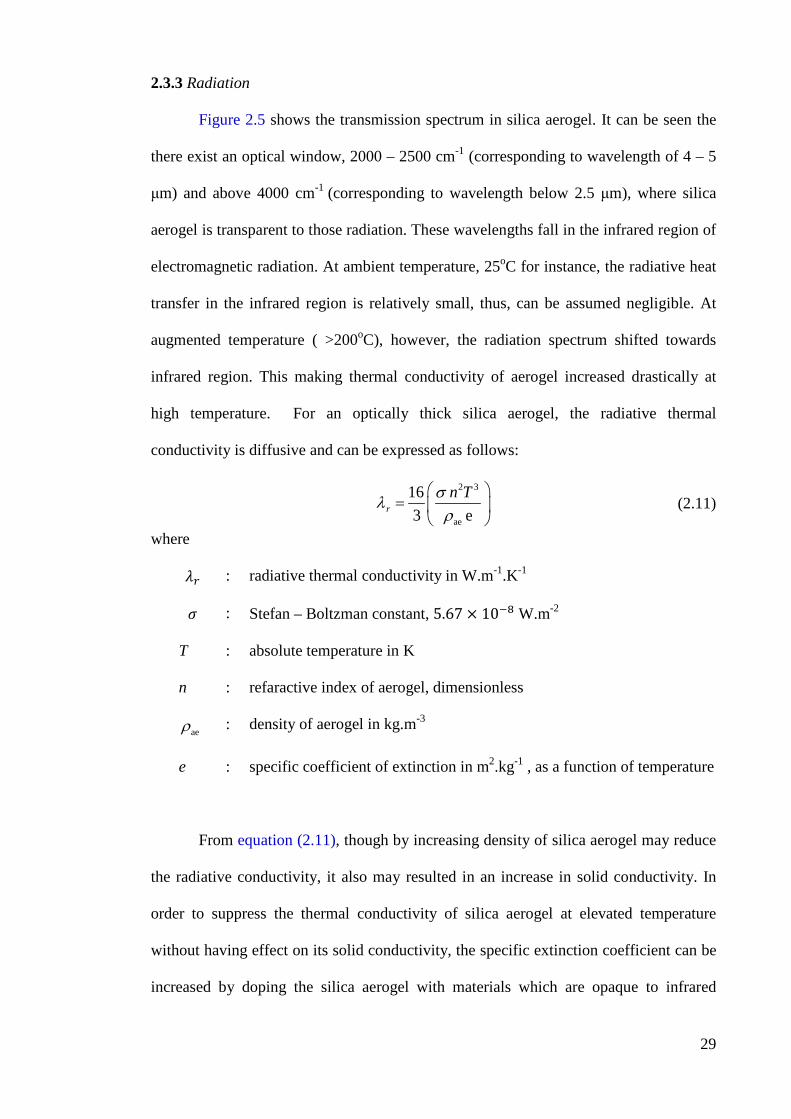
Figure 2.5 shows the transmission spectrum in silica aerogel. It can be seen the
there exist an optical window, 2000 – 2500 cm-1 (corresponding to wavelength of 4 – 5
μm) and above 4000 cm-1 (corresponding to wavelength below 2.5 μm), where silica
aerogel is transparent to those radiation. These wavelengths fall in the infrared region of
electromagnetic radiation. At ambient temperature, 25oC for instance, the radiative heat
transfer in the infrared region is relatively small, thus, can be assumed negligible. At
augmented temperature ( >200oC), however, the radiation spectrum shifted towards
infrared region. This making thermal conductivity of aerogel increased drastically at
high temperature. For an optically thick silica aerogel, the radiative thermal
conductivity is diffusive and can be expressed as follows:
2 3
ae
163 er
n Tσλρ
=
(2.11)
where
𝜆𝑟 : radiative thermal conductivity in W.m-1.K-1
𝜎 : Stefan – Boltzman constant, 5.67 × 10⁻⁸ W.m-2
T : absolute temperature in K
n : refaractive index of aerogel, dimensionless
aeρ : density of aerogel in kg.m-3
e : specific coefficient of extinction in m2.kg-1 , as a function of temperature
From equation (2.11), though by increasing density of silica aerogel may reduce
the radiative conductivity, it also may resulted in an increase in solid conductivity. In
order to suppress the thermal conductivity of silica aerogel at elevated temperature
without having effect on its solid conductivity, the specific extinction coefficient can be
increased by doping the silica aerogel with materials which are opaque to infrared
30
radiation. Carbon black is one of the best candidates for this purpose. Many researchers
had tried to integrate carbon black into silica aerogel to lower its radiative transfer.
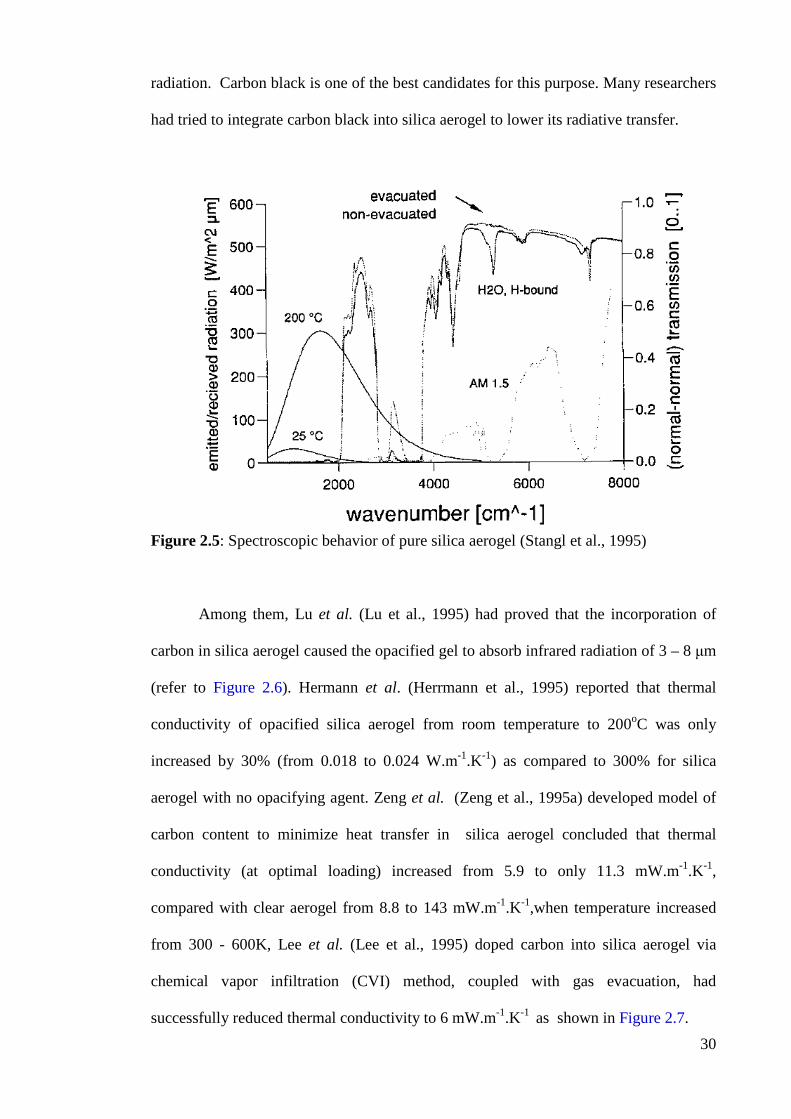
Figure 2.5: Spectroscopic behavior of pure silica aerogel (Stangl et al., 1995)
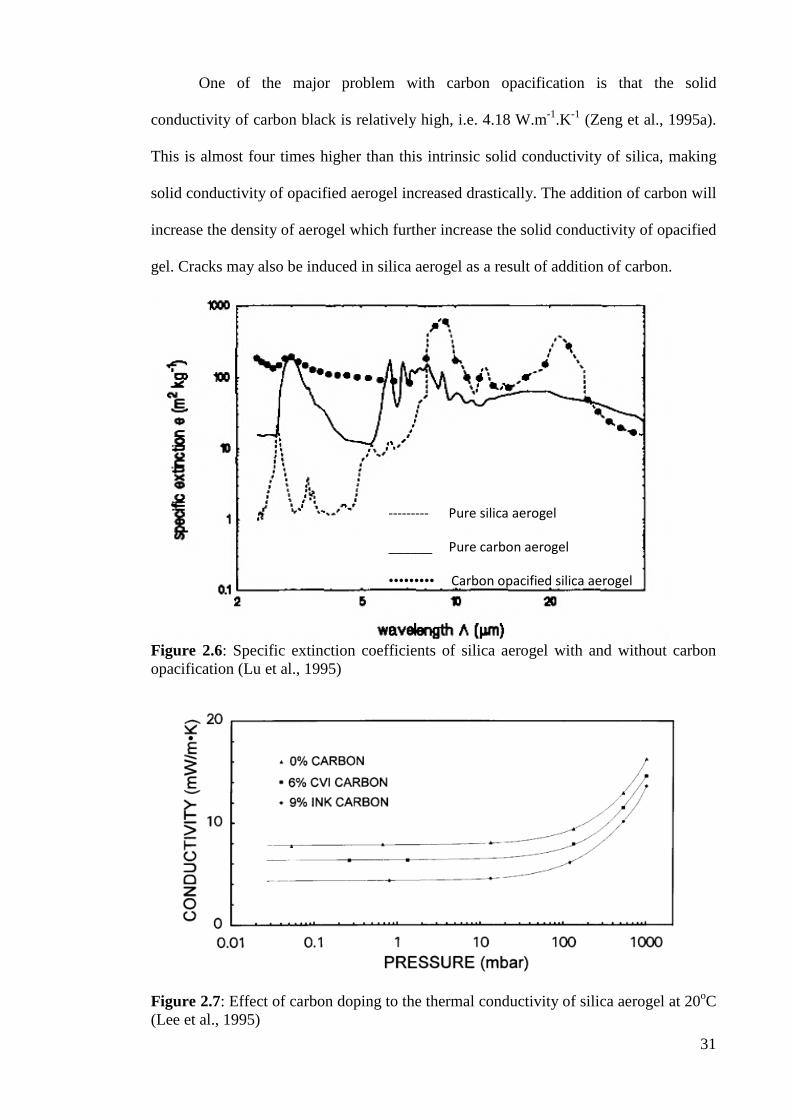
Among them, Lu et al. (Lu et al., 1995) had proved that the incorporation of
carbon in silica aerogel caused the opacified gel to absorb infrared radiation of 3 – 8 μm
(refer to Figure 2.6). Hermann et al. (Herrmann et al., 1995) reported that thermal
conductivity of opacified silica aerogel from room temperature to 200oC was only
increased by 30% (from 0.018 to 0.024 W.m-1.K-1) as compared to 300% for silica
aerogel with no opacifying agent. Zeng et al. (Zeng et al., 1995a) developed model of
carbon content to minimize heat transfer in silica aerogel concluded that thermal
conductivity (at optimal loading) increased from 5.9 to only 11.3 mW.m-1.K-1,
compared with clear aerogel from 8.8 to 143 mW.m-1.K-1,when temperature increased
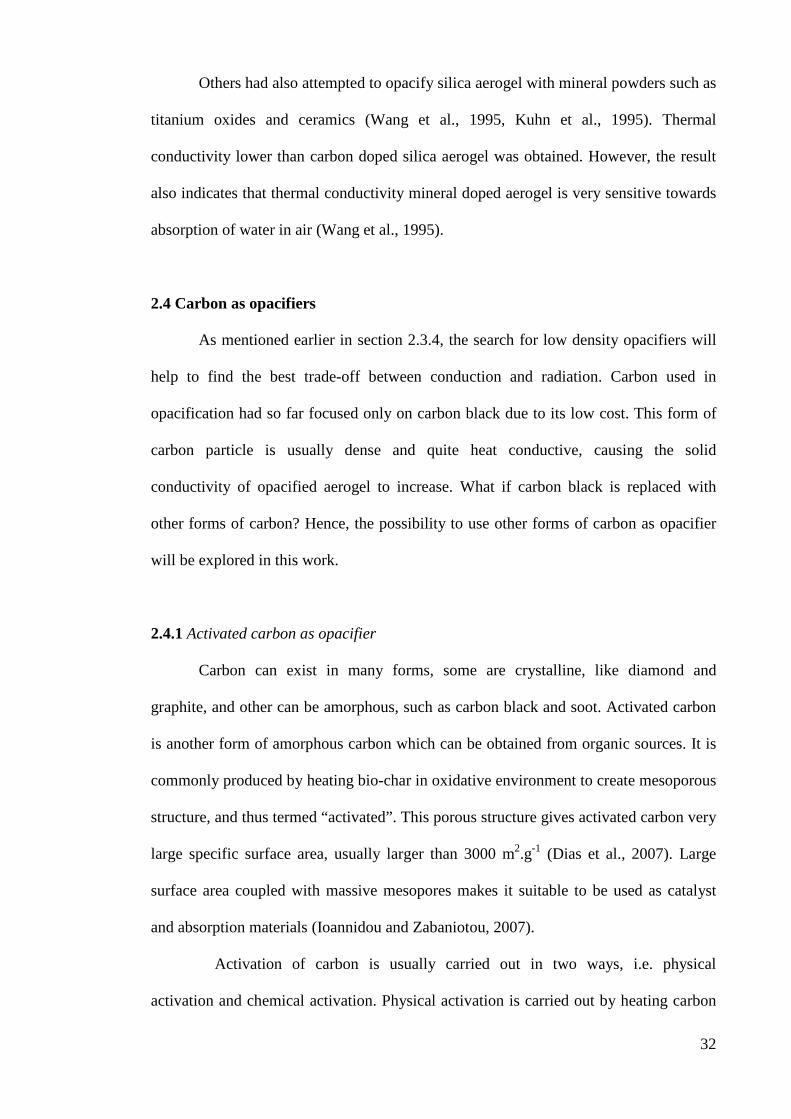
from 300 - 600K, Lee et al. (Lee et al., 1995) doped carbon into silica aerogel via
chemical vapor infiltration (CVI) method, coupled with gas evacuation, had
successfully reduced thermal conductivity to 6 mW.m-1.K-1 as shown in Figure 2.7.
31
One of the major problem with carbon opacification is that the solid
conductivity of carbon black is relatively high, i.e. 4.18 W.m-1.K-1 (Zeng et al., 1995a).
This is almost four times higher than this intrinsic solid conductivity of silica, making
solid conductivity of opacified aerogel increased drastically. The addition of carbon will
increase the density of aerogel which further increase the solid conductivity of opacified
gel. Cracks may also be induced in silica aerogel as a result of addition of carbon.
Figure 2.6: Specific extinction coefficients of silica aerogel with and without carbon opacification (Lu et al., 1995)
Figure 2.7: Effect of carbon doping to the thermal conductivity of silica aerogel at 20oC (Lee et al., 1995)
--------- Pure silica aerogel
______ Pure carbon aerogel
••••••••• Carbon opacified silica aerogel
32
Others had also attempted to opacify silica aerogel with mineral powders such as
titanium oxides and ceramics (Wang et al., 1995, Kuhn et al., 1995). Thermal
conductivity lower than carbon doped silica aerogel was obtained. However, the result
also indicates that thermal conductivity mineral doped aerogel is very sensitive towards
absorption of water in air (Wang et al., 1995).
2.4 Carbon as opacifiers
As mentioned earlier in section 2.3.4, the search for low density opacifiers will
help to find the best trade-off between conduction and radiation. Carbon used in
opacification had so far focused only on carbon black due to its low cost. This form of
carbon particle is usually dense and quite heat conductive, causing the solid
conductivity of opacified aerogel to increase. What if carbon black is replaced with
other forms of carbon? Hence, the possibility to use other forms of carbon as opacifier
will be explored in this work.
2.4.1 Activated carbon as opacifier
Carbon can exist in many forms, some are crystalline, like diamond and
graphite, and other can be amorphous, such as carbon black and soot. Activated carbon
is another form of amorphous carbon which can be obtained from organic sources. It is
commonly produced by heating bio-char in oxidative environment to create mesoporous
structure, and thus termed “activated”. This porous structure gives activated carbon very
large specific surface area, usually larger than 3000 m2.g-1 (Dias et al., 2007). Large
surface area coupled with massive mesopores makes it suitable to be used as catalyst
and absorption materials (Ioannidou and Zabaniotou, 2007).
Activation of carbon is usually carried out in two ways, i.e. physical
activation and chemical activation. Physical activation is carried out by heating carbon
33
with oxidative gases such as steam and carbon dioxide under very high temperature
(700 oC – 1100 oC) (Dias et al., 2007). Activated carbon obtained in this way can
normally achieve a surface area of more than 1500 m2.g-1. Alternatively, activation also
can be carried at lower temperature (400 oC) by impregnating char with chemicals such
as zinc chloride, sodium hydroxide, potassium hydroxide or phosphoric acid. Though
chemical activation has the advantage of lower activation temperature and time, it is
inevitably contaminated by those chemicals and additional washing step is needed.
Activated carbon may replace carbon black as opacifier in silica aerogel. There
are several obvious advantages to use activated carbon silica aerogel. First, it is
extremely light weight where the density of activated carbon can be as low as 0.75
kg.m-3 (Plantard et al., 2010). This can reduce the overall density of opacified aerogel
and thus to limit the solid conductivity within a reasonable range. Second, the porous
structure activated carbon may exhibit very different solid conductivity as compared to
carbon black. So far only very limited data reported on the conductivity of activated
carbon. According to Kuwagaki (Kuwagaki et al., 2003) the conductivity of activated
carbon is in the range of 0.17 – 0.28 W.m-1.K-1. This is in agreement with the values
predicted by Jones (Jones, 1998), ranging from 0.15 – 0.27 W.m-1.K-1. These limited
data suggested that the thermal conductivity of activated carbon, due to its porous
structure, is at least an order of magnitude smaller than carbon black. Third, the thermal
stability of activated carbon at high temperature is expected to be higher than carbon
black, and this can retard the deterioration of carbon aerogel for high temperature
applications.
Despite these advantages, the absorption of radiation by activated carbon
remains uncertain. The optical window of silica aerogel is between 3 – 8 μm, activated
carbon as opacifier should be able to absorb this specific range of infrared radiation.
The author cannot find any data on the spectral properties of activated carbon. Thus, it
34
is one of the objectives in this work to determine the effect of opacifying aerogel with
activated carbon to its thermal conductivity. Some encouraging results were reported
where resorcinol – formaldehyde (RF) carbon aerogel (Lu et al., 1995), with density and
porosity comparable with activated carbon, absorbed near infrared radiation. Lazar et al.
(Lazar et al., 2005) investigated infrared absorption of amorphous carbon thin films via
chemical vapor deposition (CVD) method and found that thin films absorbed part of the
radiation in 2.5 – 13.8 μm. It is then expected that activated carbon, which is also
amorphous in nature, to have same absorption in near infrared region.
In this study, activated carbon produced from bamboo leaf was used to opacify
silica aerogel. As amorphous silica is obtained by combusting carbon in this biomass,
making use of the carbon as opacifier may not only improve the thermal resistance of
aerogel but also reduce CO2 release to the environment in the processing.
2.5 Summary
Synthesis of silica aerogel using alkoxides such TMOS and TEOS is costly and
hazardous. By using bamboo leaf to synthesize silica aerogel, it not only eliminates
these problems but also helps to convert the agriculture waste to value added product.
The relation between the three modes of heat transfer in silica aerogel is intricate. As the
convection is negligible and gas conduction can be greatly reduced under partial
vacuum, the overall thermal conductivity is mainly contributed by solid conduction and
radiation. At high temperature ( >200 oC), the influence of radiative transfer starts to
outweigh conduction and become major mode of heat transfer. Though the relation is
complex, they are all related to the density of aerogel produced, as shown in Figure 2.8.
On one hand, lower radiative conductivity can be achieved by increasing the density of
aerogel as expected from equation (2.11). On the other hand, increase in density causes
the solid conductivity increase exponentially as in equation (2.9). A minimum point
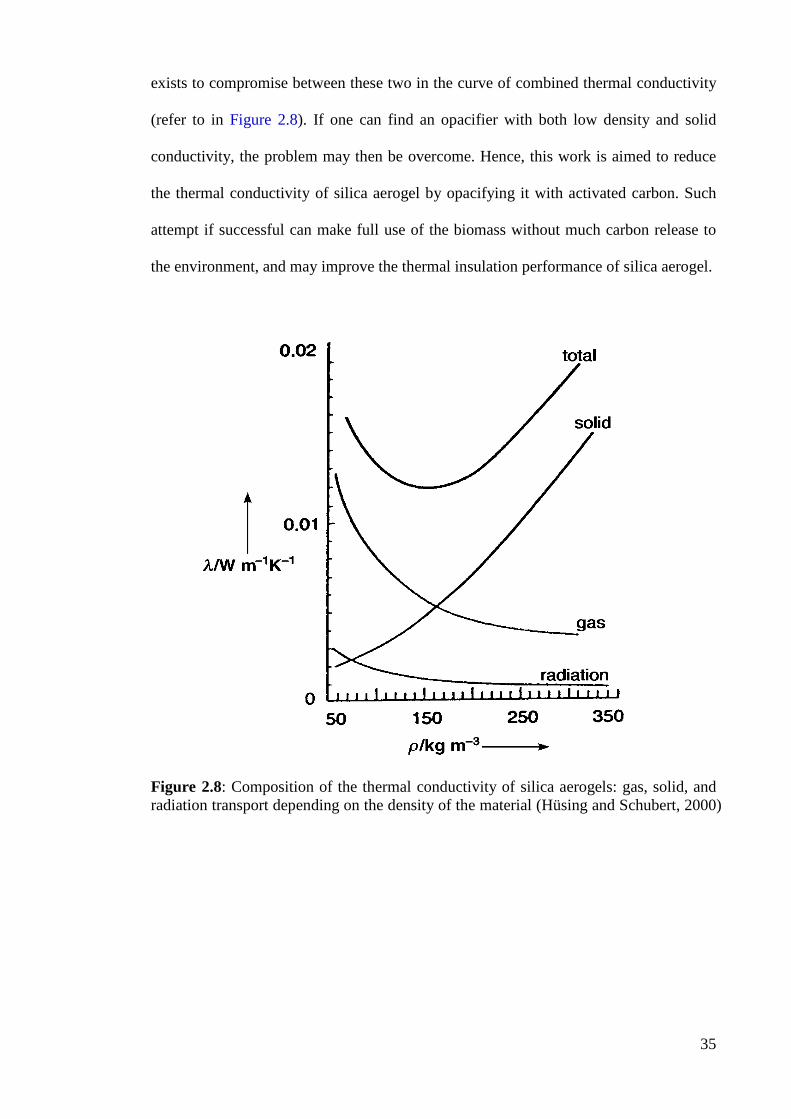
35
exists to compromise between these two in the curve of combined thermal conductivity
(refer to in Figure 2.8). If one can find an opacifier with both low density and solid
conductivity, the problem may then be overcome. Hence, this work is aimed to reduce
the thermal conductivity of silica aerogel by opacifying it with activated carbon. Such
attempt if successful can make full use of the biomass without much carbon release to
the environment, and may improve the thermal insulation performance of silica aerogel.
Figure 2.8: Composition of the thermal conductivity of silica aerogels: gas, solid, and radiation transport depending on the density of the material (Hüsing and Schubert, 2000)
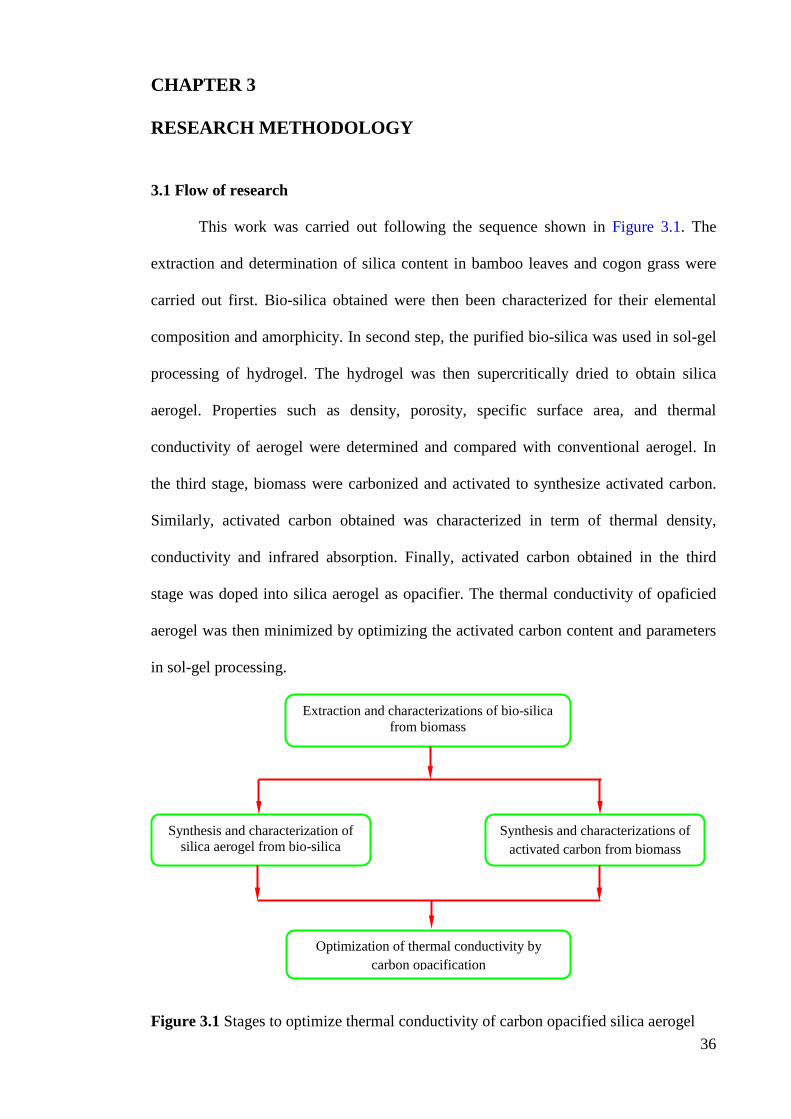
36
CHAPTER 3
RESEARCH METHODOLOGY
3.1 Flow of research
This work was carried out following the sequence shown in Figure 3.1. The
extraction and determination of silica content in bamboo leaves and cogon grass were
carried out first. Bio-silica obtained were then been characterized for their elemental
composition and amorphicity. In second step, the purified bio-silica was used in sol-gel
processing of hydrogel. The hydrogel was then supercritically dried to obtain silica
aerogel. Properties such as density, porosity, specific surface area, and thermal
conductivity of aerogel were determined and compared with conventional aerogel. In
the third stage, biomass were carbonized and activated to synthesize activated carbon.
Similarly, activated carbon obtained was characterized in term of thermal density,
conductivity and infrared absorption. Finally, activated carbon obtained in the third
stage was doped into silica aerogel as opacifier. The thermal conductivity of opaficied
aerogel was then minimized by optimizing the activated carbon content and parameters
in sol-gel processing.
Figure 3.1 Stages to optimize thermal conductivity of carbon opacified silica aerogel
Extraction and characterizations of bio-silica from biomass
Synthesis and characterization of silica aerogel from bio-silica
Synthesis and characterizations of activated carbon from biomass
Optimization of thermal conductivity by carbon opacification
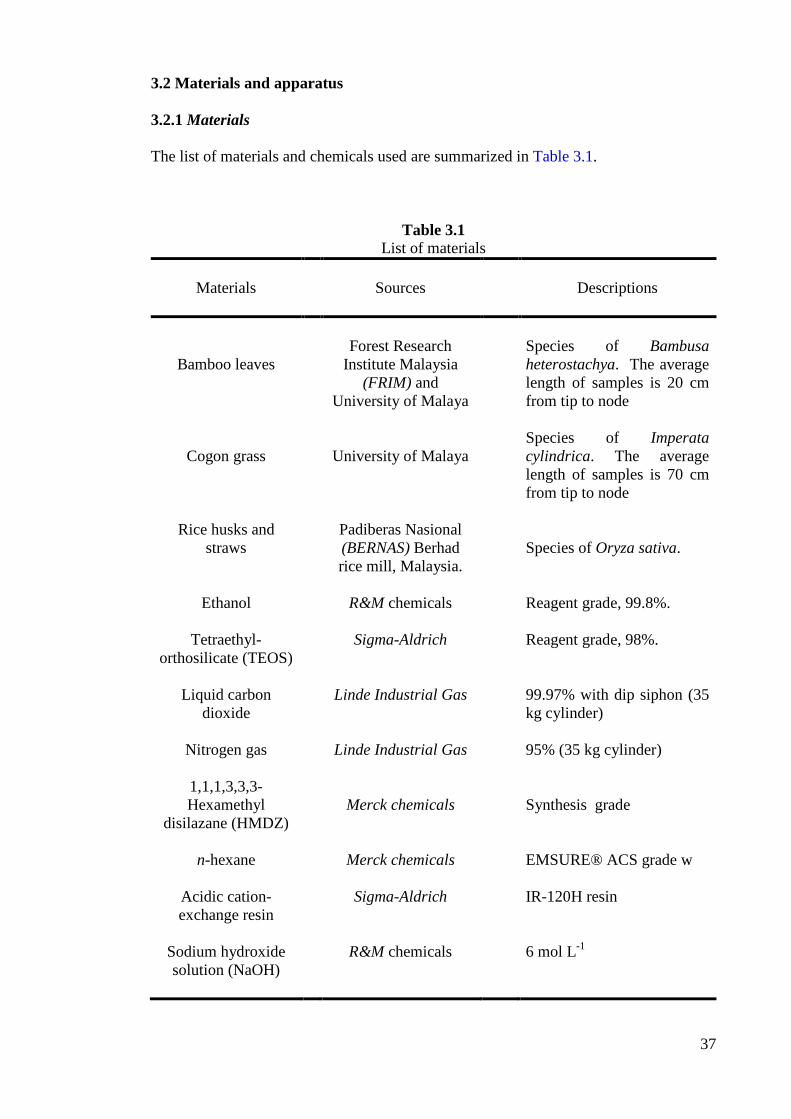
37
3.2 Materials and apparatus
3.2.1 Materials
The list of materials and chemicals used are summarized in Table 3.1.
Table 3.1 List of materials
Materials
Sources
Descriptions
Bamboo leaves
Forest Research
Institute Malaysia (FRIM) and
University of Malaya
Species of Bambusa heterostachya. The average length of samples is 20 cm from tip to node
Cogon grass
University of Malaya
Species of Imperata cylindrica. The average length of samples is 70 cm from tip to node
Rice husks and straws
Padiberas Nasional (BERNAS) Berhad rice mill, Malaysia.
Species of Oryza sativa.
Ethanol R&M chemicals Reagent grade, 99.8%.
Tetraethyl-orthosilicate (TEOS)
Sigma-Aldrich Reagent grade, 98%.
Liquid carbon dioxide
Linde Industrial Gas 99.97% with dip siphon (35 kg cylinder)
Nitrogen gas
Linde Industrial Gas 95% (35 kg cylinder)
1,1,1,3,3,3-Hexamethyl
disilazane (HMDZ)
Merck chemicals
Synthesis grade
n-hexane
Merck chemicals EMSURE® ACS grade w
Acidic cation-exchange resin
Sigma-Aldrich IR-120H resin
Sodium hydroxide solution (NaOH)
R&M chemicals 6 mol L-1
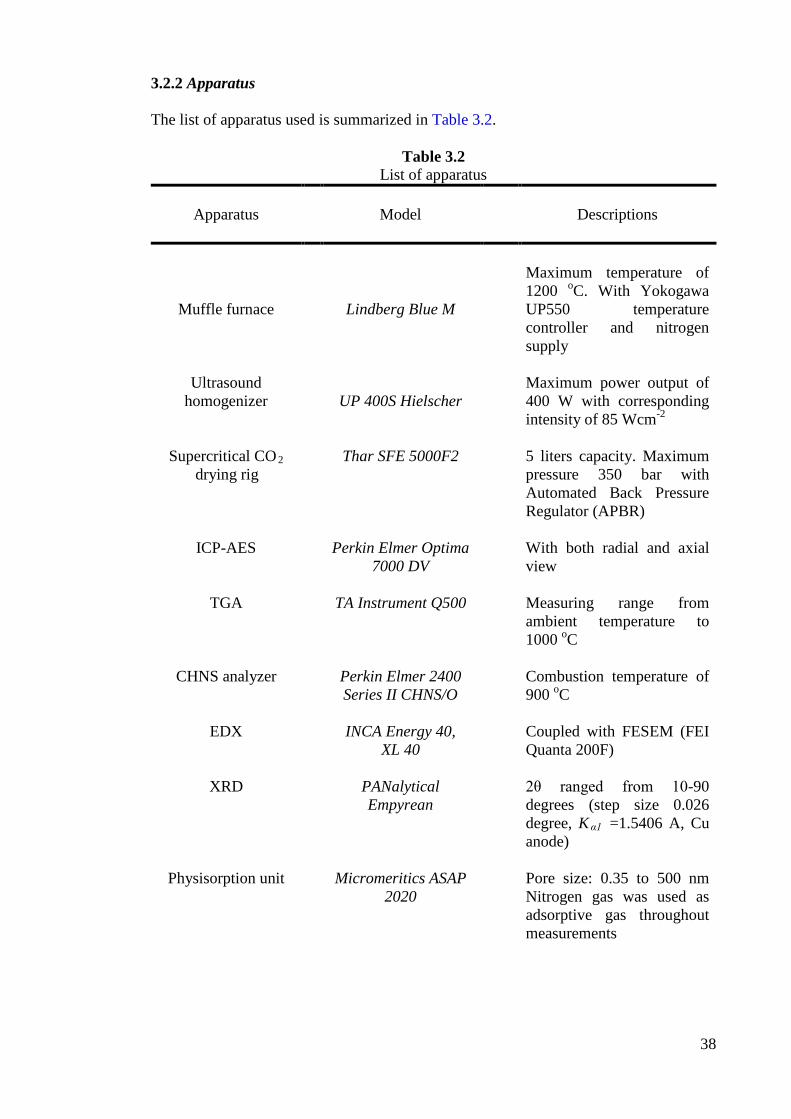
38
3.2.2 Apparatus
The list of apparatus used is summarized in Table 3.2.
Table 3.2 List of apparatus
Apparatus
Model
Descriptions
Muffle furnace
Lindberg Blue M
Maximum temperature of 1200 oC. With Yokogawa UP550 temperature controller and nitrogen supply
Ultrasound homogenizer
UP 400S Hielscher
Maximum power output of 400 W with corresponding intensity of 85 Wcm-2
Supercritical CO2 drying rig
Thar SFE 5000F2
5 liters capacity. Maximum pressure 350 bar with Automated Back Pressure Regulator (APBR)
ICP-AES Perkin Elmer Optima 7000 DV
With both radial and axial view
TGA
TA Instrument Q500 Measuring range from ambient temperature to 1000 oC
CHNS analyzer Perkin Elmer 2400 Series II CHNS/O
Combustion temperature of 900 oC
EDX
INCA Energy 40, XL 40
Coupled with FESEM (FEI Quanta 200F)
XRD
PANalytical Empyrean
2θ ranged from 10-90 degrees (step size 0.026 degree, Kα1 =1.5406 A, Cu anode)
Physisorption unit
Micromeritics ASAP 2020
Pore size: 0.35 to 500 nm Nitrogen gas was used as adsorptive gas throughout measurements
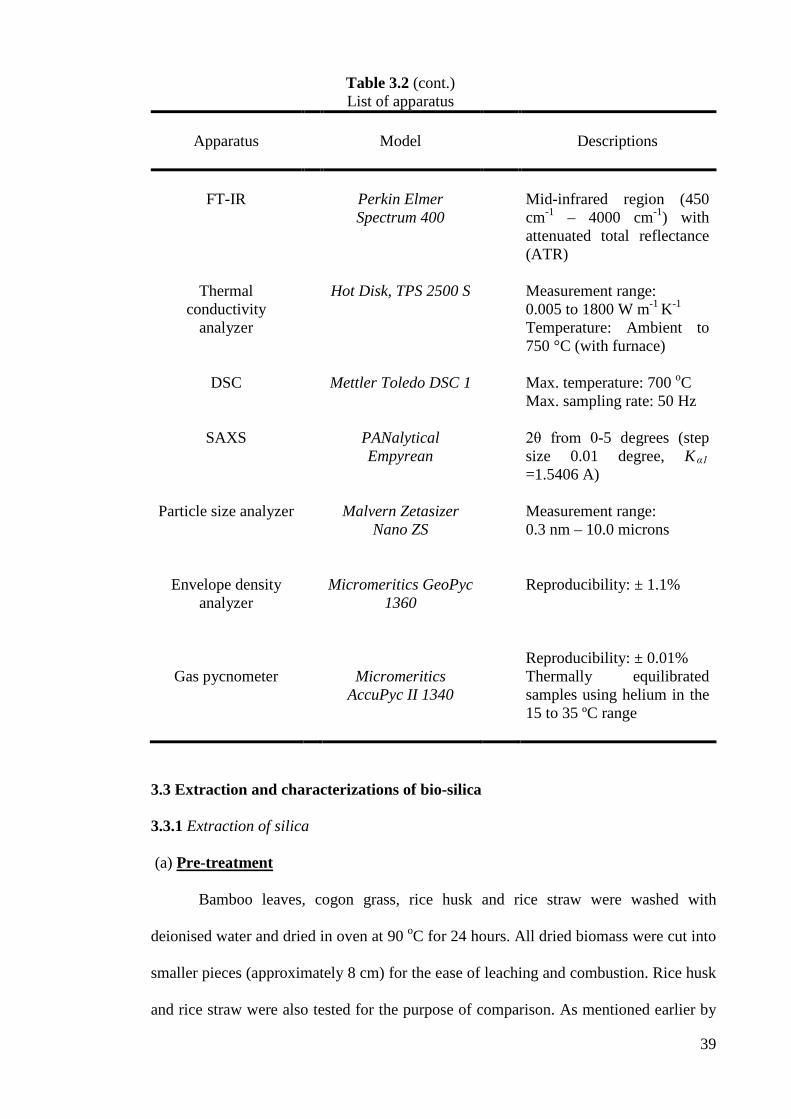
39
Table 3.2 (cont.) List of apparatus
Apparatus
Model
Descriptions
FT-IR
Perkin Elmer Spectrum 400
Mid-infrared region (450 cm-1 – 4000 cm-1) with attenuated total reflectance (ATR)
Thermal conductivity
analyzer
Hot Disk, TPS 2500 S Measurement range: 0.005 to 1800 W m-1 K-1
Temperature: Ambient to 750 °C (with furnace)
DSC Mettler Toledo DSC 1 Max. temperature: 700 oC Max. sampling rate: 50 Hz
SAXS PANalytical
Empyrean 2θ from 0-5 degrees (step
size 0.01 degree, Kα1 =1.5406 A)
Particle size analyzer Malvern Zetasizer Nano ZS
Measurement range: 0.3 nm – 10.0 microns
Envelope density analyzer
Micromeritics GeoPyc 1360
Reproducibility: ± 1.1%
Gas pycnometer
Micromeritics
AccuPyc II 1340
Reproducibility: ± 0.01% Thermally equilibrated samples using helium in the 15 to 35 ºC range
3.3 Extraction and characterizations of bio-silica
3.3.1 Extraction of silica
(a) Pre-treatment
Bamboo leaves, cogon grass, rice husk and rice straw were washed with
deionised water and dried in oven at 90 oC for 24 hours. All dried biomass were cut into
smaller pieces (approximately 8 cm) for the ease of leaching and combustion. Rice husk
and rice straw were also tested for the purpose of comparison. As mentioned earlier by
40
Krishnarao (Krishnarao et al., 2001), the purity of silica obtained from rice husks was
lowered by minerals such as potassium in biomass. Thus for all biomass, comparison
tests were carried out to investigate the purity of silica, with and without leaching using
hydrochloric acid. During the acid leaching, two parameters, namely duration of
leaching and concentration of hydrochloric acid were varied. A 22 factorial experimental
design was used to study the effect of these parameters on the amount of potassium
leached. The leached samples were filtered and the filtrates were analyzed with ICP-
AES (Inductively Coupled Plasma – Atomic Emission Spectroscopy, Model: Perkin
Elmer Optima 7000 DV) to determine the amount of potassium leached. All samples
were diluted with deionized water prior to analysis to suit the calibrated range of ICP-
AES.
(b) Thermal decomposition of organic compounds
The elemental compositions of the major elements in raw biomass such as
carbon, hydrogen, nitrogen and sulfur were determined by CHNS analyzer (Model:
Perkin Elmer 2400 Series II CHNS/O). Biomass was ball milled and sieved prior to
combustion in CHNS analyzer. The lower heating value (LHV) of bamboo leaf and
cogon grass was determined using differential scanning calorimeter (DSC, Model:
Mettler Toledo DSC 1) from 25 oC to 500 oC at 5 oC min-1 in air. The LHV was then
calculated by integrating the DSC data for the corresponding temperature ranges.
Both leached and unleached biomass was combusted in an electric muffle
furnace (Model: Lindberg Blue M, with Yokogawa UP550 temperature controller) at
650oC for four hours. Samples were combusted in air and heating rate of 10 oC min-1 in
the presence of air. Samples were loaded into porcelain crucibles during heating to
prevent contamination due to high temperature. Ashes collected after combustion was
41
weighed, ball milled and sieved prior to characterizations. Ash content, which mainly
composed of silica, was calculated as follows:
ashash
0
Ash content, W (wt%) = mm
(3.1)
where
m ash = mass of ash collected after combustion
m0 = initial mass of biomass used in combustion
In order to confirm sufficient time taken for the combustion to ensure
decomposition of all organic compound, biomass were also combusted using TGA
(Thermogravimetric analysis, Model: TA Instrument Q500). Samples were heated from
30oC to 650oC via three heating rates of 5, 10 and 20 oC min-1, followed by isothermal
heating at 650oC for 3 hours. The samples were then heated up to 1000oC. Ash content
obtained from TGA was then compared with the ash content obtained via electric
muffle furnace. The fractional conversion of organic matters in biomass (i.e. excluded
ashes) was calculated based on the equation (3.2):
f
100Fractional conversion, 100
tWXW
−=
− (3.2)
where tW = instantaneous weight percentage of biomass residue
during combustion
fW = final weight percentage of ash remained after combustion
(c) Determination of kinetics parameters in thermal decomposition
Combustion of biomass was analyzed using TGA. Samples were heated from
30 oC to 650 oC at 5, 10 and 20 oC min-1 followed by isothermal heating at 650 oC for 3
hours. The activation energy and frequency factor of combustion were obtained by
fitting the non-isothermal iso-conversional kinetics data to the Flynn-Wall-Ozawa
42
model with the degree of conversion, α, in the range of 0.39 < α < 0.64. α can be
calculated using equation (3.3) as follows:
t
f
1 W = 1 W
α −−
(3.3)
The Flynn-Wall-Ozawa model was chosen for the fitting because it is suitable
for biomass such as cogon grass that contains mainly cellulose (Fisher et al., 2002). To
determine the activation energy and frequency factor of the first decomposition, non-
isothermal iso-conversional TGA data at three different rates were fitted with the Flynn-
Wall-Ozawa model as shown in equation (3.4):
( )
a aA ln = ln 5.331 1.052 R R T
E Eg
βα
− − (3.4)
where β = heating rate in oC min-1,
A = frequency factor in min-1,
aE = activation energy in J mol-1,
R = universal constant 8.314 J mol-1 K-1,
T = absolute temperature in K,
α = degree of conversion,
( )g α = integral conversion function. Both activation energy and
frequency can be obtained from the plot of ln β against the reciprocal of T . By
assuming the decomposition is a phase-boundary controlled reaction with a contracting
area, the integral conversion function can be approximated using equation (3.5)
(Jankovic, 2008) as follows:
( ) ( )12 = 1 1g α α− − (3.5)
43
3.3.2 Characterizations of bio-silica
Purity of bio-silica obtained from combustion was determined by EDX (Energy
Dispersive X-Ray, Model: INCA Energy 400) analysis. As the elemental composition of
silicon in the ash was determined by EDX, the silica content in biomass can be
calculated using equation (3.6). By assuming all the silicon is in the form of SiO2 , the
silica content can be estimated as follows:
2SiOSi ash lch
Si
MSilica content (wt%) = W W W
M× × × (3.6)
where
2SiOM = molar mass of silica, i.e., 60.084 g mol-1;
SiM = molar mass of silicon, i.e., 28.086 g mol-1;
SiW = weight percentage of silicon in ash, which is determined using EDX; ashW is the weight percentage of ash after combustion;
lchW = weight percentage of the biomass residue that remained after acid leaching.
In order to confirm that the silica obtained is amorphous, bio-silica were tested
with XRD (X-ray diffractometer, Model: PANalytical Empyrean). The XRD with 2θ
ranged from 10-90 degrees (step size 0.026 degree, Kα1 =1.5406 A, Cu anode) was
used to check for the formation of any crystalline structure.
3.4 Synthesis and characterization of silica aerogel from bamboo leaf silica (BLS)
3.4.1 Preparation of water glass
Water glass (sodium silicate solution) was prepared by dissolving the bamboo
leaf silica into sodium hydroxide solution (2 mol L-1) without heating. It was then
filtered and the filtrate obtained is sodium silicate solution. The silica yield in the water
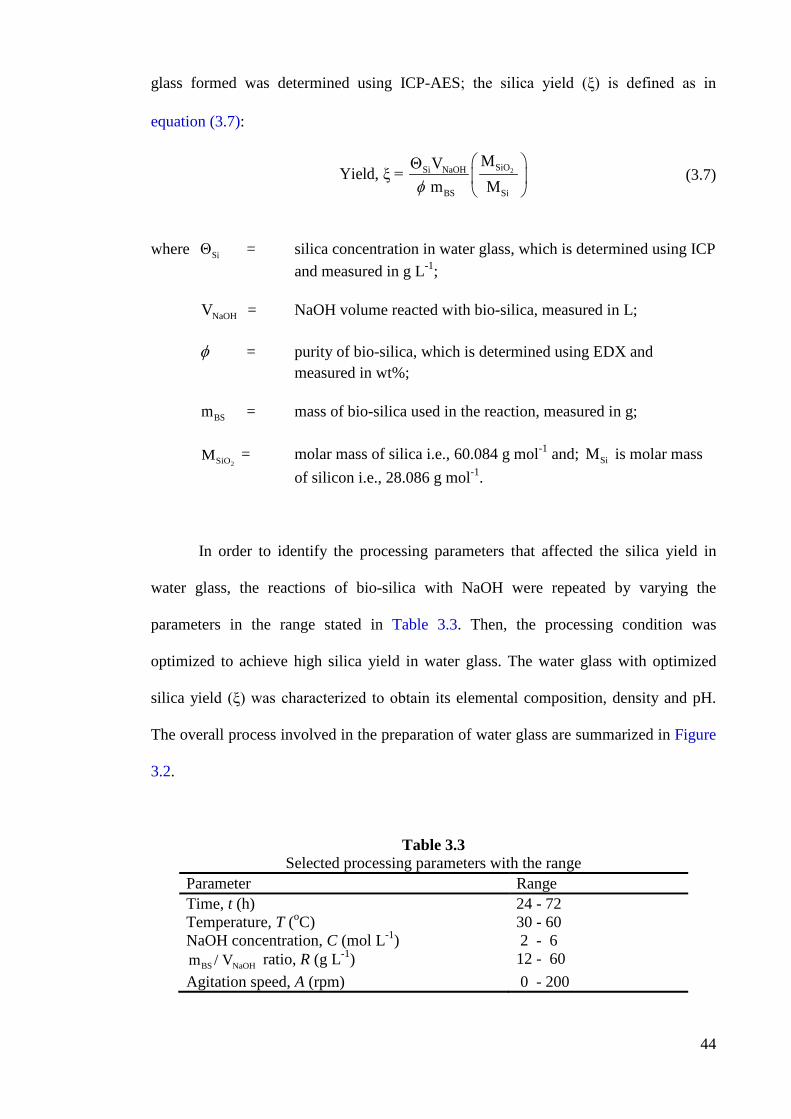
44
glass formed was determined using ICP-AES; the silica yield (ξ) is defined as in
equation (3.7):
2SiOSi NaOH
BS Si
MVYield, ξ = m Mφ
Θ
(3.7)
where SiΘ = silica concentration in water glass, which is determined using ICP
and measured in g L-1;
NaOHV = NaOH volume reacted with bio-silica, measured in L;
φ = purity of bio-silica, which is determined using EDX and measured in wt%;
BSm = mass of bio-silica used in the reaction, measured in g;
2SiOM = molar mass of silica i.e., 60.084 g mol-1 and; SiM is molar mass of silicon i.e., 28.086 g mol-1.
In order to identify the processing parameters that affected the silica yield in
water glass, the reactions of bio-silica with NaOH were repeated by varying the
parameters in the range stated in Table 3.3. Then, the processing condition was
optimized to achieve high silica yield in water glass. The water glass with optimized
silica yield (ξ) was characterized to obtain its elemental composition, density and pH.
The overall process involved in the preparation of water glass are summarized in Figure
3.2.
Table 3.3 Selected processing parameters with the range
Parameter Range Time, t (h) 24 - 72 Temperature, T (oC) 30 - 60 NaOH concentration, C (mol L-1) 2 - 6
BS NaOHm / V ratio, R (g L-1) 12 - 60 Agitation speed, A (rpm) 0 - 200
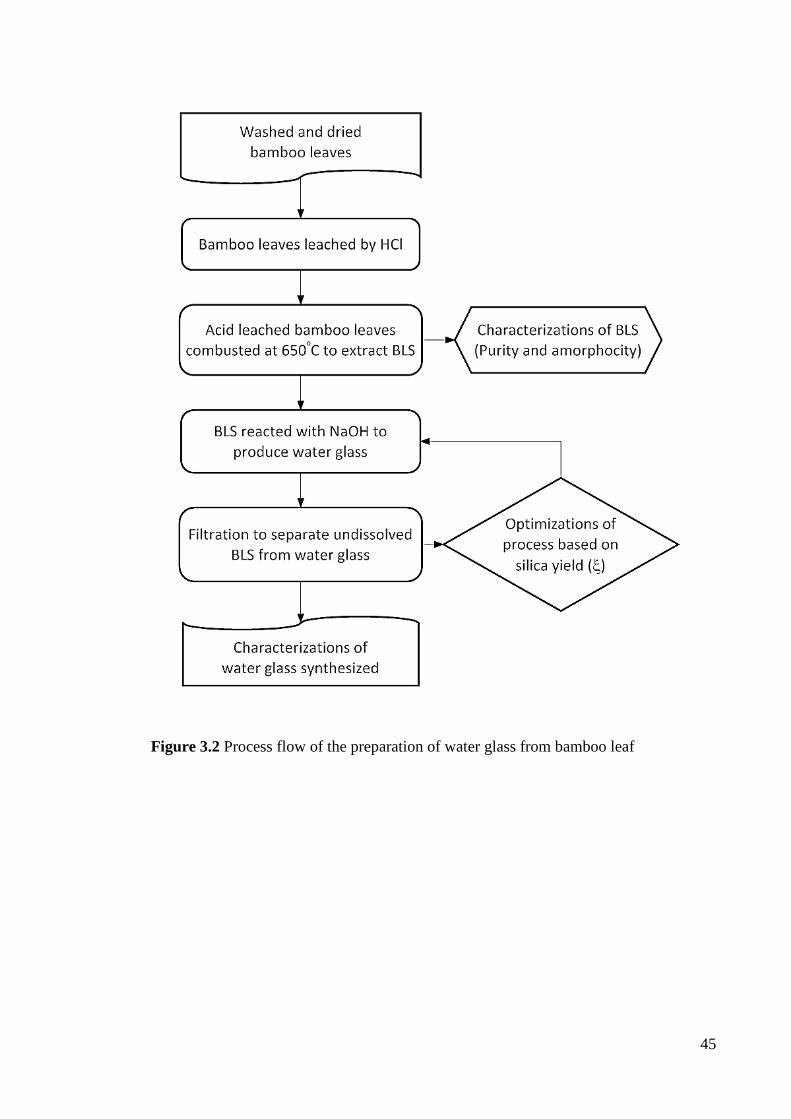
45
Figure 3.2 Process flow of the preparation of water glass from bamboo leaf
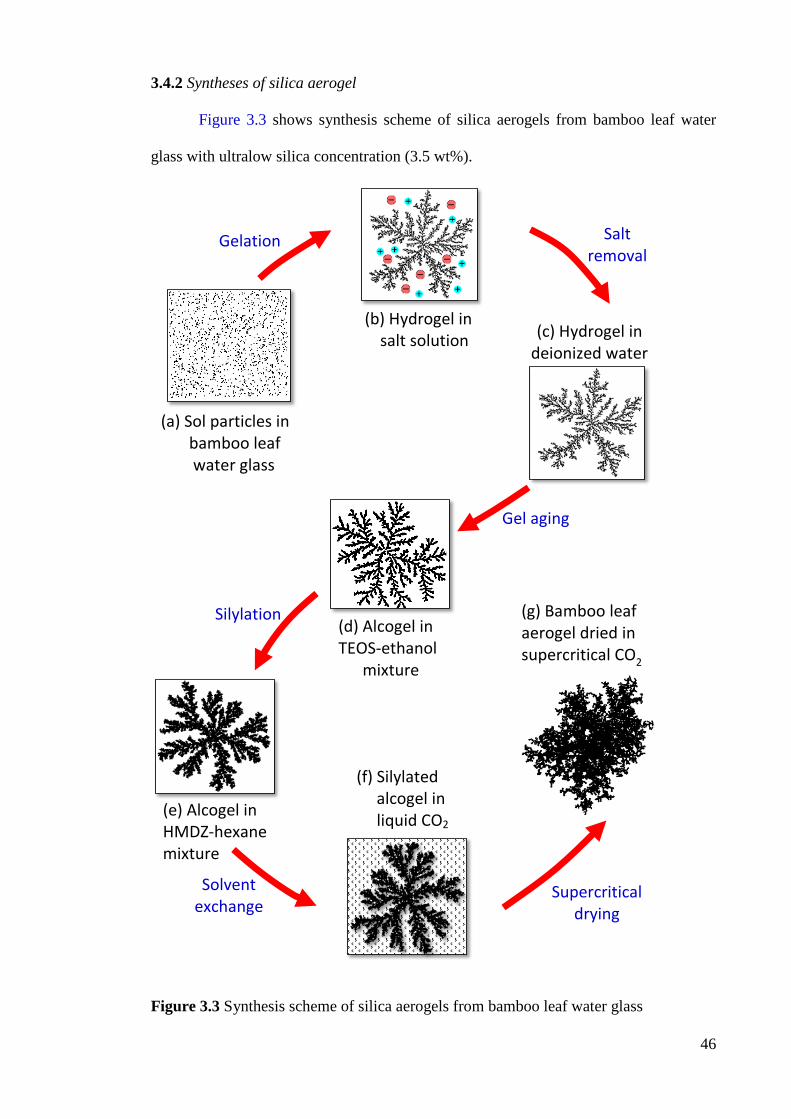
46
3.4.2 Syntheses of silica aerogel
Figure 3.3 shows synthesis scheme of silica aerogels from bamboo leaf water
glass with ultralow silica concentration (3.5 wt%).
Figure 3.3 Synthesis scheme of silica aerogels from bamboo leaf water glass
(a) Sol particles in bamboo leaf water glass
(b) Hydrogel in salt solution
(c) Hydrogel in deionized water
(d) Alcogel in TEOS-ethanol mixture
(e) Alcogel in HMDZ-hexane mixture
(f) Silylated alcogel in liquid CO2
(g) Bamboo leaf aerogel dried in supercritical CO2
Gelation
Salt removal
Gel aging
Solvent exchange
Silylation
Supercritical drying
47
The synthesis of aerogels began with the dilution of water glass obtained in section
3.4.1. In order to synthesize low density aerogel, water glass with ultralow silica
concentration was prepared by diluting the water glass from R = 60 g L-1 (5.25 wt%
silica) to 40 g L-1 (3.5 wt% silica). Such R value was chosen based on the preliminary
studies which showed that R smaller than 36 g L-1 gave hydrogels that collapsed easily
in solvent exchange. In order to study the effect of gelation pH, water glass (3.5 wt%
silica) was gelled in the following conditions:
(i) ion exchange column (sample ID: BLG 3.5E) – water glass was flow into
Amberlite resin column (length ≈ 60 cm, inner diameter 10.7 mm). The resulted
silicic acid with (pH 4.5) was let to gel at ambient condition;
(ii) precipitated silica (sample ID: BLG 3.5B) – HCl was added drop-by-drop to
water glass (HCl : water glass = 1:2 v/v) until precipitate formed at pH ≈ 9.5;
(iii) water glass-into acid (sample ID: BLG 3.5N) – excessive acid (2 ml) was added
into water glass (6 ml) in a single step. The resulted silicic acid had pH 4.5. The
pH was then adjusted again to ~7 by adding 0.025 ml of NaOH. The pH of the
resulted was 4.5 and was then adjusted to pH 7. The mixture formed was let to
gel at ambient condition.
The salts in the hydrogel were then removed by soaking in deionized water.
Deionized water was replaced for every 4 hours. The degree of salt removal was
determined as sodium percentage remained in dried gel using EDX analysis. The salt-
free gel was then aged in ethanol. It was observed in the preliminary study that the gel
shrunk severely in absolute ethanol. Therefore, hydrogel was aged in TEOS-ethanol
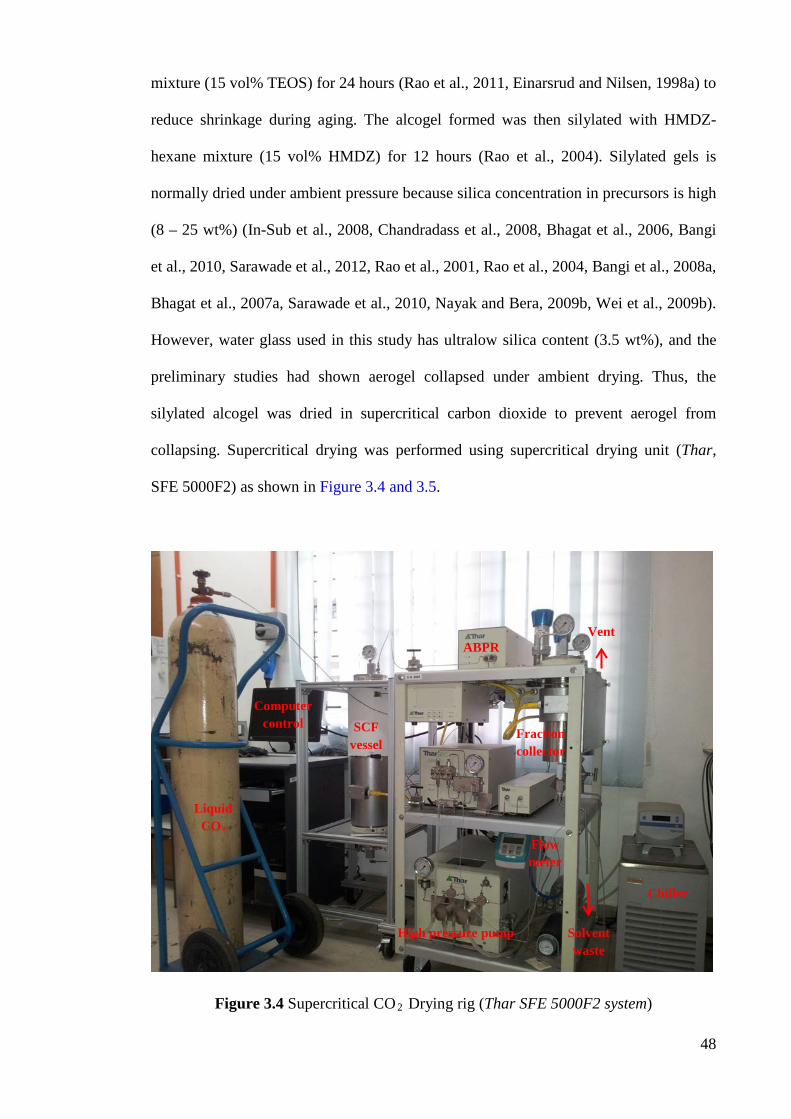
48
mixture (15 vol% TEOS) for 24 hours (Rao et al., 2011, Einarsrud and Nilsen, 1998a) to
reduce shrinkage during aging. The alcogel formed was then silylated with HMDZ-
hexane mixture (15 vol% HMDZ) for 12 hours (Rao et al., 2004). Silylated gels is
normally dried under ambient pressure because silica concentration in precursors is high
(8 – 25 wt%) (In-Sub et al., 2008, Chandradass et al., 2008, Bhagat et al., 2006, Bangi
et al., 2010, Sarawade et al., 2012, Rao et al., 2001, Rao et al., 2004, Bangi et al., 2008a,
Bhagat et al., 2007a, Sarawade et al., 2010, Nayak and Bera, 2009b, Wei et al., 2009b).
However, water glass used in this study has ultralow silica content (3.5 wt%), and the
preliminary studies had shown aerogel collapsed under ambient drying. Thus, the
silylated alcogel was dried in supercritical carbon dioxide to prevent aerogel from
collapsing. Supercritical drying was performed using supercritical drying unit (Thar,
SFE 5000F2) as shown in Figure 3.4 and 3.5.
Figure 3.4 Supercritical CO2 Drying rig (Thar SFE 5000F2 system)
Liquid CO2
Chiller
ABPR
SCF vessel
High pressure pump
Flow meter
Computer control
Vent
Solvent waste
Fraction collector
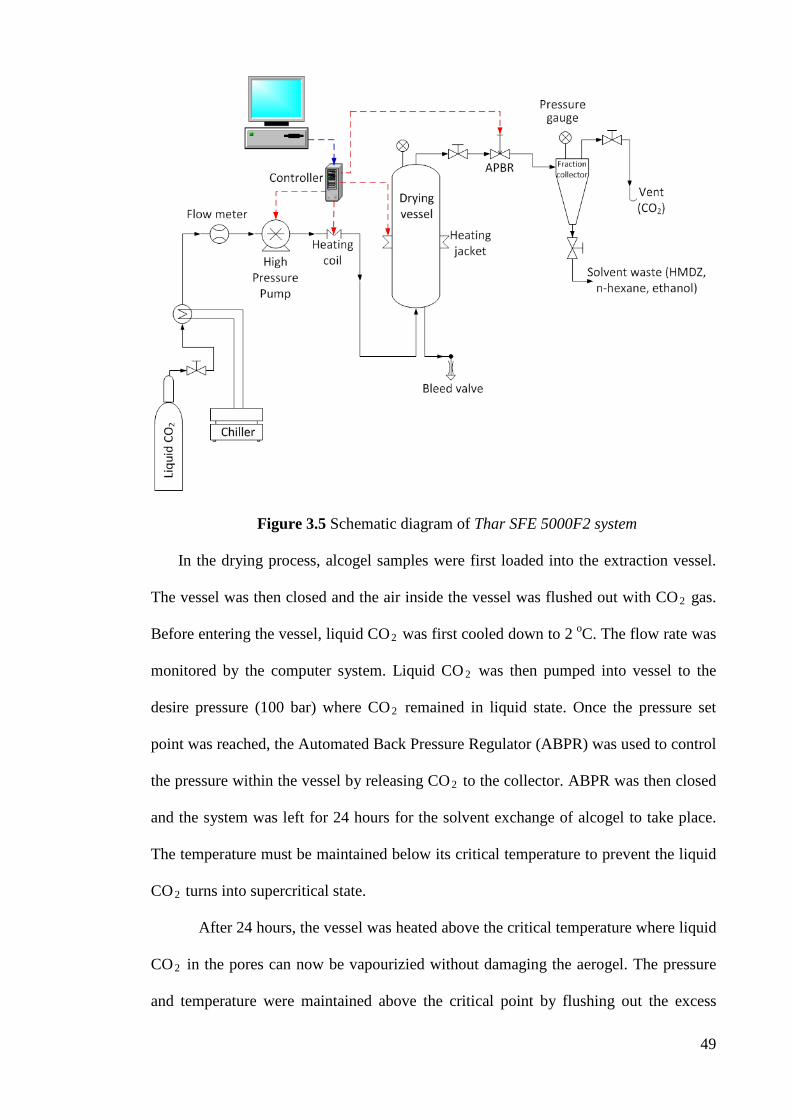
49
Figure 3.5 Schematic diagram of Thar SFE 5000F2 system
In the drying process, alcogel samples were first loaded into the extraction vessel.
The vessel was then closed and the air inside the vessel was flushed out with CO2 gas.
Before entering the vessel, liquid CO2 was first cooled down to 2 oC. The flow rate was
monitored by the computer system. Liquid CO 2 was then pumped into vessel to the
desire pressure (100 bar) where CO2 remained in liquid state. Once the pressure set
point was reached, the Automated Back Pressure Regulator (ABPR) was used to control
the pressure within the vessel by releasing CO2 to the collector. ABPR was then closed
and the system was left for 24 hours for the solvent exchange of alcogel to take place.
The temperature must be maintained below its critical temperature to prevent the liquid
CO2 turns into supercritical state.
After 24 hours, the vessel was heated above the critical temperature where liquid
CO2 in the pores can now be vapourizied without damaging the aerogel. The pressure
and temperature were maintained above the critical point by flushing out the excess
50
CO2 from the vessel at 25 g.min-1 (100 bar, 45oC) for 4 hours. After the drying
completed, the vessel was depressurized at 2 bar min-1 to ambient pressure; while
maintaining the temperature above 40oC. Finally, vessel was cooled down to room
temperature and aerogel was unloaded from the vessel.
For comparison purpose, TEOS aerogels with two different silica concentrations
were synthesized as follow:
(i) TEOS aerogel with ultralow silica concentration (3.5 wt%, sample ID: TEOS
3.5) – TEOS was hydrolyzed with dilute HCl and DI water at pH 4.5. The pH
was then adjusted to ~7 by adding NaOH. Hydrogel formed was further
processed as in Figure 3.3.
(ii) TEOS aerogel with high silica concentration (15 wt%, sample ID: TEOS 15) –
TEOS was hydrolyzed with dilute HCl and DI water at pH 4.5. The pH was
then adjusted to ~7 by adding NaOH. Hydrogel formed was aged in ethanol for
24 hours without adding TEOS and then supercritically dried without silylation.
Conventionally, silica aerogel are synthesized with high concentration of TEOS
(>10 wt%) without silylation (Rao et al., 2001, Chandradass et al., 2008, Wei et
al., 2009b, In-Sub et al., 2008). Thus, TEOS 15 is used to highlight the
difference between aerogels with high and ultralow silica concentration. In
addition, TEOS 15 with high silica concentration can be dried supercritically
without silylation. It can then be used as control experiment to study the effect
of silylation.
TEOS was chosen as comparison because it is the most common alkoxide
precursor to synthesize aerogel. In addition, it is less hazardous as compared to TMOS.
51
3.4.3 Characterizations of silica aerogel
Time for gelation was estimated as time when precursor’s mixtures did not fall
and remained rigid, when its container was slanted at 90 degrees. The particle size
distribution of silica sol near gel point was determined using dynamic light scaterring
(Model: Malvern Zetasizer Nano ZS). The salt content in hydrogel for various soaked
periods was determined indirectly as the sodium element remained in gel by using EDX.
XRD was also used to detect any formation of crystals. The porosity of aerogels was
calculated based on bulk density ( aeρ ) and true density ( sρ ) as in equation (3.8):
ae
s
Porosity, = 1 ρρ
Π − (3.8)
where the bulk density ( aeρ ) and true density ( sρ ) of silica aerogels were determined
using the density analyzer (Model: Micromeritics GeoPyc 1360) and the gas
pycnometer (Model: Micromeritics AccuPyc II 1340). Volume of aerogel ( aeV ) and the
volume of hydrogel ( hydV ) was measured to estimate the shrinkage of aerogel using
equation (3.9):
ae
hyd
Shrinkage (%) = 1 100%VV
− ×
(3.9)
The fractal structure was studied using data of SAXS (Small angle X-ray
scattering, PANalytical Empyrean) with 2θ from 0-5 degrees (step size 0.01 degree, Kα1
=1.5406 A). In order to interpret the SAXS data, its scattering intensity was ( )I q
plotted as a function of scattering vector ( ) ( )4π λ sin 2q q= of SAXS, where λ is the
wavelength of X-ray and q is the scattering angle. It is well known that porous
medium obeys the power law ( ) α I q q α− , where α can be determined as the slope of
lg I against lg q . In the linear regime, the surface fractal dimension ( SD ) can be
calculated using the following equation (Donatti et al., 2001a, Donatti et al., 2001b):
52
6SD α= − (3.10) where 2α is the slope in the linear region and SD is typically 2 3SD≤ ≤ . For particles
with smooth surface, 2SD = . Scattering intensity relations will then reduce to
( ) 4 α I q q− , which is the well-known Porod’s law. For monodispersed aerogel, real
mass fractal dimension ( D ) is approximated to the apparent mass dimension ( fD ),
which can be determined as the slope ( 1α ) at low-q regime (q < 0.015 A-1) (Martin,
1986). In case the aerogel is highly polydispersed, the scattering data at the same regime
is fitted into the following model (Freltoft et al., 1986, Vacher et al., 1988, Vollet et al.,
2006, Teixeira, 1988) to obtain the real mass fractal dimension ( D ):
( ) ( )( ) ( )
( )( )( )
31
2 2 2
sin 1 arctan=A 1
1 1D
D qI q D
q D q
ζζ
ζ ζ−
− Γ −− +
(3.11)
where A = constant,
( )1DΓ − = gamma function of 1D − , and
ζ = characteristics length of a fractal structure.
The fractal structure diminishes at a length scale larger than ζ and becomes
homogeneous. In addition, the surface per unit volume ( SV ) ratio in nm-1 was
determined using equation (3.12) as follows:
( )π 1 PKSV Q
= Π −Π
(3.12)
where PK = the Porod’s law constant:
( ) 4lim P qK I q q
→∞= (3.13)
53
and Q = the invariant of the system:
( )2
0Q q I q dq
∞= ∫ (3.14)
Using the SV ratio obtained, the corresponding specific surface area ( SAXSS ) in
m2 g-1 can then be calculated as:
ae
1000SAXS
SSVρ
=
(3.15)
where aeρ = bulk density of aerogel in g.cm-3.
Adsorption characteristics including adsorption-desorption isotherm, BET
specific surface area, total pore volume, BJH and DFT pore size distributions, and
nanoparticle size of aerogels were characterized by physisorption unit (Model:
Micromeritics ASAP 2020) in nitrogen atmosphere. The chemical functional groups on
aerogel surface were studied using Fourier transform infrared spectroscopy (FT-IR,
Model: Perkin Elmer Spectrum 400) which was equipped with attenuated total
reflectance (ATR). Thermal conductivity of aerogels was measured by thermal analyzer
(Model: Hot Disk, TPS 2500S) which uses transient hot disk method. The stability of
aerogels at elevated temperature (30 – 550oC) was studied by TGA in air via heating
rate of 5 oC min-1.
3.5 Synthesis and characterizations of activated carbon from bamboo leaf
3.5.1 Carbonization and activation of carbon
Two steps chemical activation was applied in this study, where bamboo leaf was
first carbonized and then activated chemically. Two steps activation is more effective in
producing high quality activated carbon (Ioannidou and Zabaniotou, 2007). Bamboo
leaf was first leached with hydrochloric acid (2 mol L-1) to remove its minerals content.
54
It was then carbonized in muffle furnace (Model: Lindberg Blue M) to obtain bio-char.
In order to retain maximum amount of carbon in bio-char, effects of carbonization
temperature and time were investigated. Temperature range of 300 oC – 450 oC and
time range of 25 min – 45 min were chosen for the study. The samples were loaded only
when the furnace reached the targeted temperature and the temperature was maintained
constant throughout the carbonization period. Samples were carbonized in nitrogen inert
atmosphere. The percentage bio-char produced per gram of biomass carbonized ( charX )
is determined using equation (3.16) as follows:
char0
100%RWXW
= × (3.16)
where 0W = initial weight of biomass used in carbonization, and
RW = weight of residue remained after carbonization. It is aimed to
optimize the temperature and time of carbonization to retain maximum amount of bio-
char.
For the removal of silica from bio-char, bio-char was mixed with NaOH (2 mol
L-1) solution. NaOH was chosen because it can leach out silica from bio-char and at the
same time bio-char was pretreated for chemical activation. The NaOH impregnated bio-
char was activated in air at various temperatures and time. Based on previous research
done on other biomass (Ioannidou and Zabaniotou, 2007, Dias et al., 2007), effects of
activation temperatures and time on the carbon burnt off of activated carbon was
investigated by varying temperature from 450 oC – 550 oC and time from 30 min – 90
min. The carbon burnt off ( burntC ) in carbonization or activation is calculated as:
char acburnt
char
100%W WCW
−= ×
(3.17)
55
where charW = weight of bio-char used in activation, and
acW = weight of activated carbon produced.
The bulk density of activated carbon produced was determined using density
analyzer. As stated previously in section 2.3.3, the addition of carbon black into aerogel
causes the solid conductivity to increase. Thus, the solid conductivity of carbon in the
composite may be reduced if porous carbon with low density is used. Hence, it is also
aimed to minimize the density of activated carbon produced by varying the activation
temperature and time. The activated carbons produced were washed thoroughly with
deionized water to remove salts and residue of NaOH. The carbon burnt off and bulk
density of activated carbon synthesized was determined to obtain the best combination
of temperature and time to activate the bamboo leaf.
3.6 Optimization of thermal conductivity via carbon opacification
3.6.1 Synthesis and characterizations of carbon opacified aerogel
Activated carbon produced in section 3.5 was doped into aerogel to opacify
silica aerogel. The doping of activated carbon was carried out into precursor (sodium
silicate) prior to gelation. In order to avoid agglomeration of activated carbon in
aerogel, it was first ultrasonicated (Model: UP 400S Hielscher, maximum power output
of 400 W) with water glass prior to adjustment of pH with acid. Hydrogels formed were
aged in mother liquor for 24 hours and then washed with deioniozed water for every 8
hours of time interval. Solvent exchange was then carried out by soaking the salt free
hydrogel in ethanol and the fresh ethanol was exchanged for every 8 hours. Solvent
exchange was further carried out by replacing ethanol with HMDZ and n-hexane prior
to supercritical drying as described in section 3.4.2. The thermal conductivity of
opacified aerogels was determined to optimize the performance of aerogel. The
opacification process of bamboo lead aerogel is summarized in Figure 3.6.
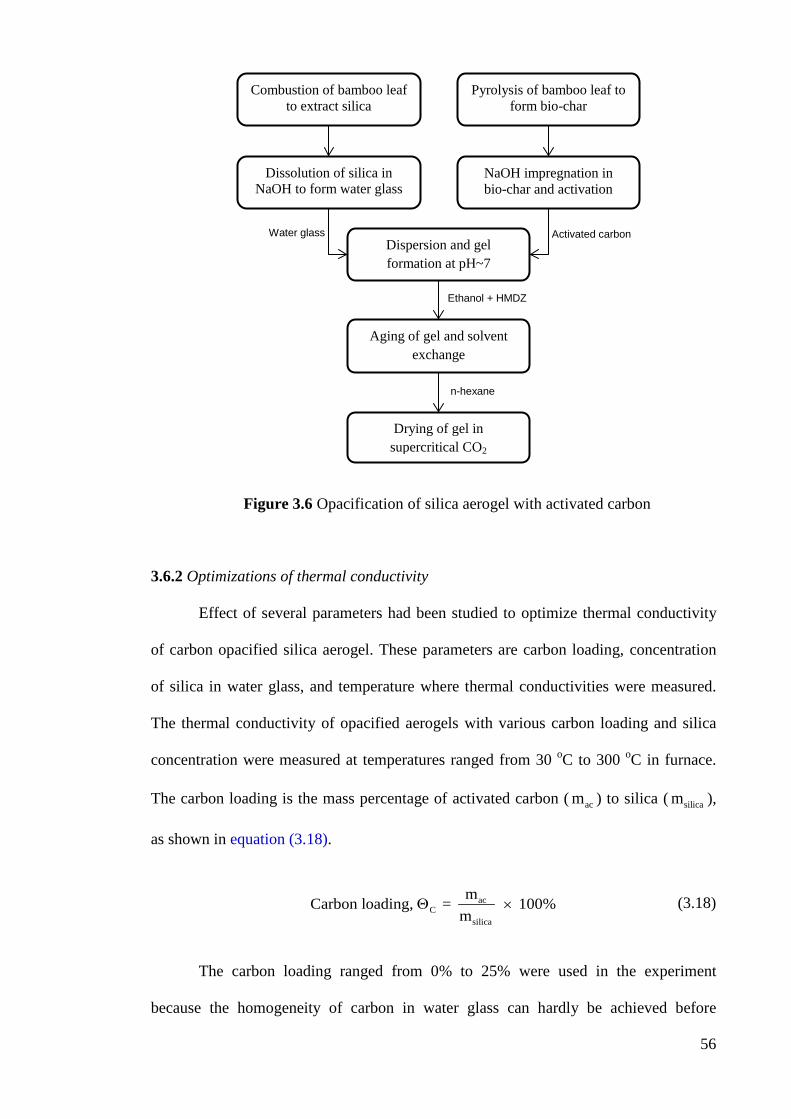
56
Figure 3.6 Opacification of silica aerogel with activated carbon
3.6.2 Optimizations of thermal conductivity
Effect of several parameters had been studied to optimize thermal conductivity
of carbon opacified silica aerogel. These parameters are carbon loading, concentration
of silica in water glass, and temperature where thermal conductivities were measured.
The thermal conductivity of opacified aerogels with various carbon loading and silica
concentration were measured at temperatures ranged from 30 oC to 300 oC in furnace.
The carbon loading is the mass percentage of activated carbon ( acm ) to silica ( silicam ),
as shown in equation (3.18).
ac
sil caC
i
mCarbon loading, = 100%m
Θ × (3.18)
The carbon loading ranged from 0% to 25% were used in the experiment
because the homogeneity of carbon in water glass can hardly be achieved before
Combustion of bamboo leaf to extract silica
Dissolution of silica in NaOH to form water glass
Dispersion and gel formation at pH~7
Aging of gel and solvent exchange
Pyrolysis of bamboo leaf to form bio-char
NaOH impregnation in bio-char and activation
Drying of gel in supercritical CO2
Water glass Activated carbon
Ethanol + HMDZ
n-hexane
57
gelation under higher loading. Furthermore, an optimal carbon loading exist as a result
of the increase in solid conductivity under high carbon loading. Such optimal carbon
loading was modeled in between 8% to 30% for temperature ranged from 30 oC to
300 oC (Zeng et al., 1995 ).
The silica concentration in water glass was varied from 3.22 wt% to 10 wt%
where the silica concentration is determined as:
Sisilica
w
g
mSilica concentration, = 100%m
Θ × (3.19)
where silicam = mass of silica in water glass in g, and
wgm = mass of water glass in g.
Viscous slurry of silica in sodium hydroxide solution is formed when the silica
concentration exceeded 10 wt% and the dissolution of silica to form water glass become
harder. Thus a maximum 10 wt% of silica concentration is used in this work. Optimal
combination of carbon loading and silica concentration to minimize thermal
conductivity of aerogel at each temperature level was determined. Statistical
correlations and tie-lines for such optimal combinations were developed.
For comparison purposes, aerogels were opacified with carbon black with the
same carbon loading range. TEOS aerogels with same carbon loading and silica
concentration range were also prepared.
58
RESULTS AND DISCUSSION CHAPTER 4 SYNTHESIS OF BAMBOO LEAF AEROGEL Results obtained are reported based on the two major sections, i.e., (i) synthesis
of bamboo leaf aerogel and (ii) opacification of bamboo leaf aerogel (COSA). In this
chapter, the extraction of amorphous silica and the synthesis of silica aerogel will be
discussed.
4.1 Extraction and characterization of bio-silica
Silica content of various biomasses were determined and compared. The purity
and amorphicity of silica obtained using EDX and XRD with regards to potassium
content were discussed. Finally, statistical analysis was carried out on the removal of
potassium in biomasses by acid leaching.
4.1.1 Ash content after combustion
4.1.1.1 Combustion in electric furnace
Figure 4.1 shows the photographs taken for bamboo leaves and cogon grass
before and after the combustion. As can be seen in Figure 4.1(b and g), the ashes of
bamboo leaves remained intact in shape as prior to combustion (refer to Figure 4.1(a)).
This shows that the bamboo leaves contain high amount of silica that are uniformly
distributed along the leaves. In contrast, ashes of cogon grass are obviously the residue
from its parallel veins. Hence, the silica in cogon grass is mainly distributed in its
parallel veins. Unlike bamboo leaves, ashes of cogon grass contain many black particles
which was suspected to be fixed carbon. Fixed carbon is carbon that cannot be removed
by simple thermal decomposition. Rice husks as comparison had shown little formation
of black particles.
Among the four biomasses, bamboo leaf and cogon grass have the highest and
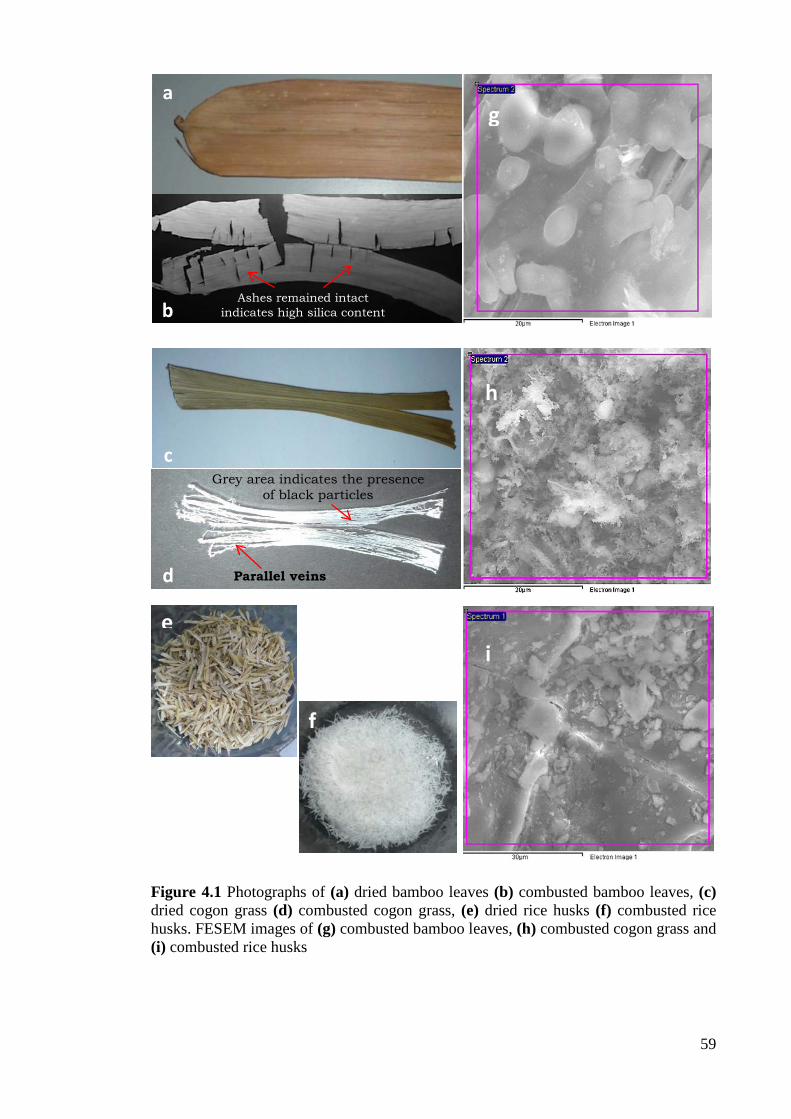
59
Figure 4.1 Photographs of (a) dried bamboo leaves (b) combusted bamboo leaves, (c) dried cogon grass (d) combusted cogon grass, (e) dried rice husks (f) combusted rice husks. FESEM images of (g) combusted bamboo leaves, (h) combusted cogon grass and (i) combusted rice husks
a
b
g
c
d
h
Parallel veins
Grey area indicates the presence of black particles
Ashes remained intact indicates high silica content
e
f
i
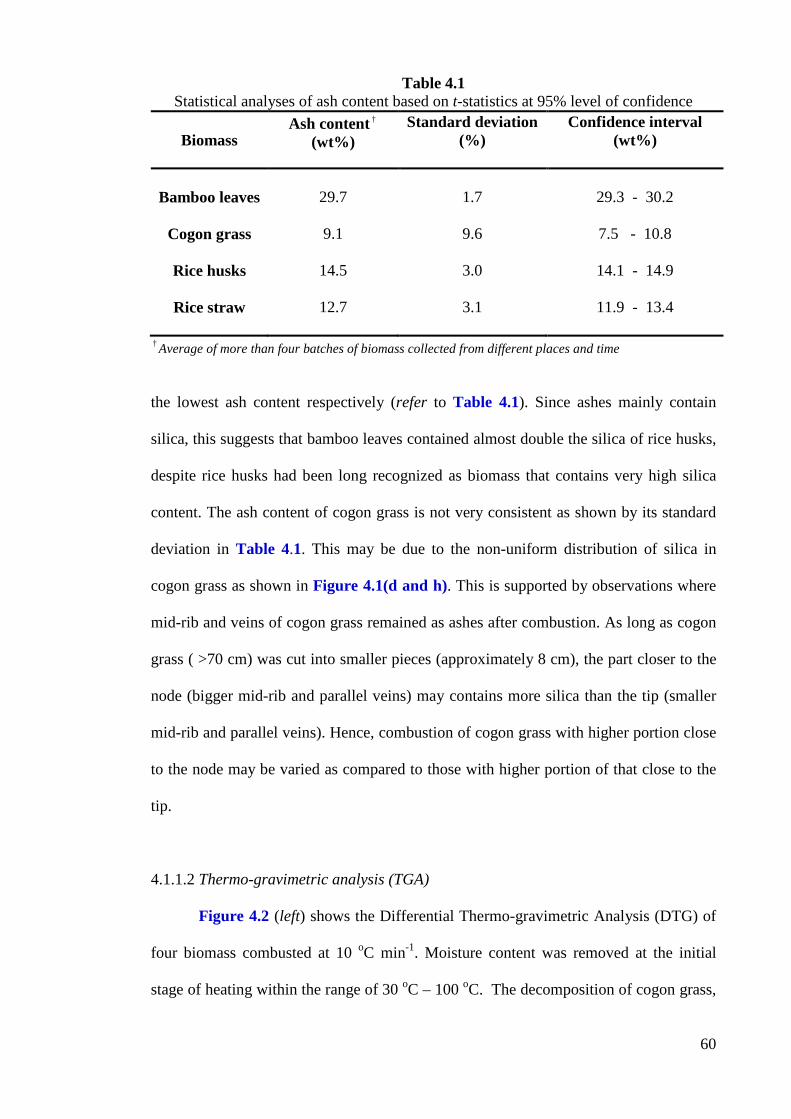
60
Table 4.1 Statistical analyses of ash content based on t-statistics at 95% level of confidence
Biomass
Ash content † (wt%)
Standard deviation (%)
Confidence interval (wt%)
Bamboo leaves
Cogon grass
Rice husks
Rice straw
29.7
9.1
14.5
12.7
1.7
9.6
3.0
3.1
29.3 - 30.2
7.5 - 10.8
14.1 - 14.9
11.9 - 13.4
† Average of more than four batches of biomass collected from different places and time
the lowest ash content respectively (refer to Table 4.1). Since ashes mainly contain
silica, this suggests that bamboo leaves contained almost double the silica of rice husks,
despite rice husks had been long recognized as biomass that contains very high silica
content. The ash content of cogon grass is not very consistent as shown by its standard
deviation in Table 4.1. This may be due to the non-uniform distribution of silica in
cogon grass as shown in Figure 4.1(d and h). This is supported by observations where
mid-rib and veins of cogon grass remained as ashes after combustion. As long as cogon
grass ( >70 cm) was cut into smaller pieces (approximately 8 cm), the part closer to the
node (bigger mid-rib and parallel veins) may contains more silica than the tip (smaller
mid-rib and parallel veins). Hence, combustion of cogon grass with higher portion close
to the node may be varied as compared to those with higher portion of that close to the
tip.
4.1.1.2 Thermo-gravimetric analysis (TGA)
Figure 4.2 (left) shows the Differential Thermo-gravimetric Analysis (DTG) of
four biomass combusted at 10 oC min-1. Moisture content was removed at the initial
stage of heating within the range of 30 oC – 100 oC. The decomposition of cogon grass,
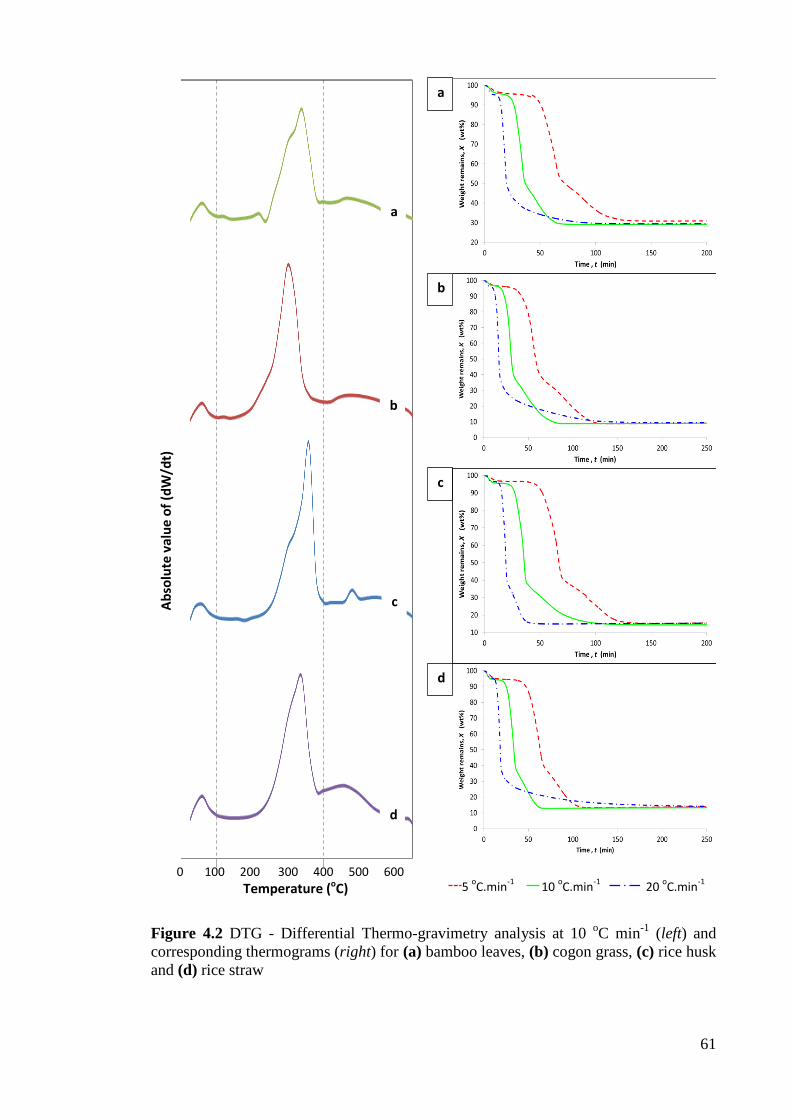
61
Figure 4.2 DTG - Differential Thermo-gravimetry analysis at 10 oC min-1 (left) and corresponding thermograms (right) for (a) bamboo leaves, (b) cogon grass, (c) rice husk and (d) rice straw
a
b
d
c
5 oC.min-1 10 oC.min-1 20 oC.min-1 0 100 200 300 400 500 600
Temperature (oC)
Abso
lute
val
ue o
f (dW
/dt)
A
B
C
D
a
b
c
d
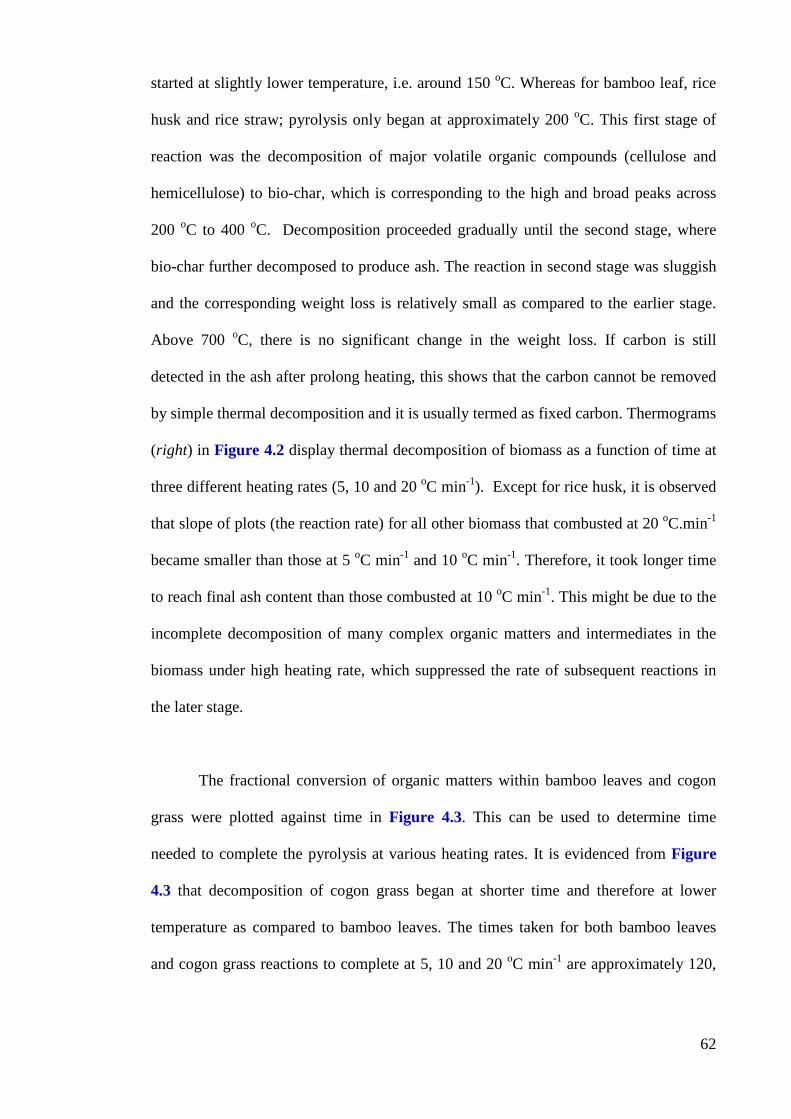
62
started at slightly lower temperature, i.e. around 150 oC. Whereas for bamboo leaf, rice
husk and rice straw; pyrolysis only began at approximately 200 oC. This first stage of
reaction was the decomposition of major volatile organic compounds (cellulose and
hemicellulose) to bio-char, which is corresponding to the high and broad peaks across
200 oC to 400 oC. Decomposition proceeded gradually until the second stage, where
bio-char further decomposed to produce ash. The reaction in second stage was sluggish
and the corresponding weight loss is relatively small as compared to the earlier stage.
Above 700 oC, there is no significant change in the weight loss. If carbon is still
detected in the ash after prolong heating, this shows that the carbon cannot be removed
by simple thermal decomposition and it is usually termed as fixed carbon. Thermograms
(right) in Figure 4.2 display thermal decomposition of biomass as a function of time at
three different heating rates (5, 10 and 20 oC min-1). Except for rice husk, it is observed
that slope of plots (the reaction rate) for all other biomass that combusted at 20 oC.min-1
became smaller than those at 5 oC min-1 and 10 oC min-1. Therefore, it took longer time
to reach final ash content than those combusted at 10 oC min-1. This might be due to the
incomplete decomposition of many complex organic matters and intermediates in the
biomass under high heating rate, which suppressed the rate of subsequent reactions in
the later stage.
The fractional conversion of organic matters within bamboo leaves and cogon
grass were plotted against time in Figure 4.3. This can be used to determine time
needed to complete the pyrolysis at various heating rates. It is evidenced from Figure
4.3 that decomposition of cogon grass began at shorter time and therefore at lower
temperature as compared to bamboo leaves. The times taken for both bamboo leaves
and cogon grass reactions to complete at 5, 10 and 20 oC min-1 are approximately 120,
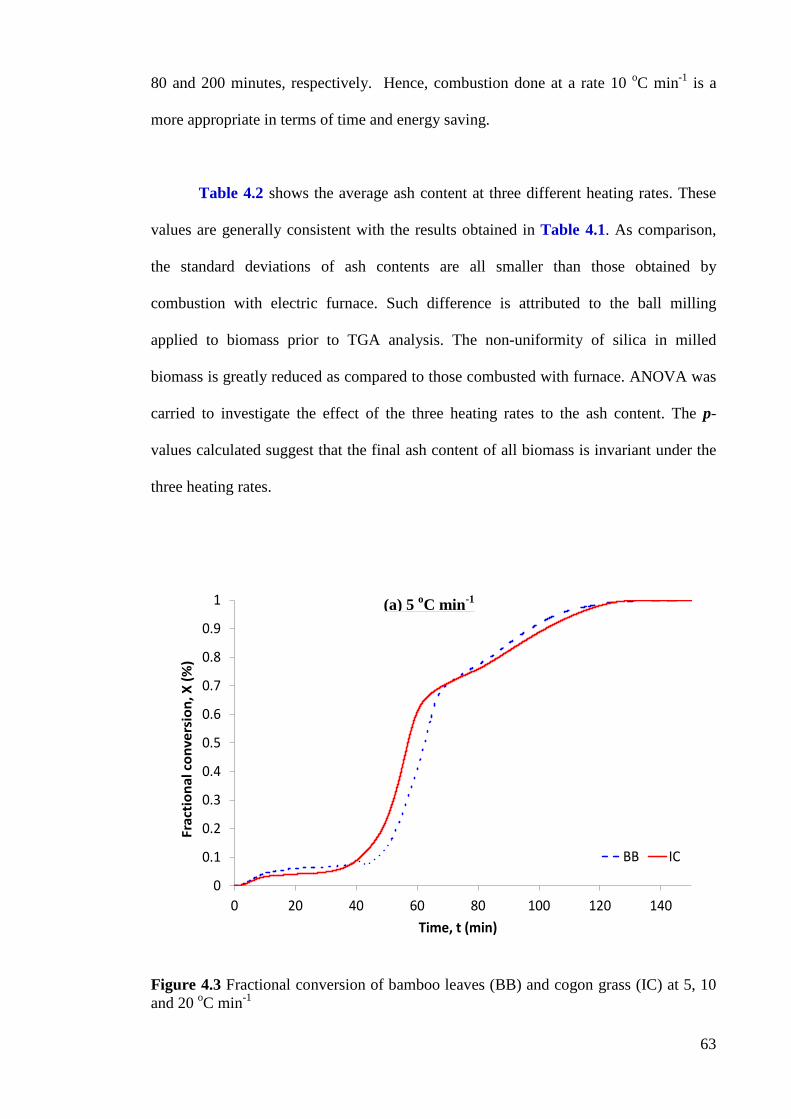
63
80 and 200 minutes, respectively. Hence, combustion done at a rate 10 oC min-1 is a
more appropriate in terms of time and energy saving.
Table 4.2 shows the average ash content at three different heating rates. These
values are generally consistent with the results obtained in Table 4.1. As comparison,
the standard deviations of ash contents are all smaller than those obtained by
combustion with electric furnace. Such difference is attributed to the ball milling
applied to biomass prior to TGA analysis. The non-uniformity of silica in milled
biomass is greatly reduced as compared to those combusted with furnace. ANOVA was
carried to investigate the effect of the three heating rates to the ash content. The p-
values calculated suggest that the final ash content of all biomass is invariant under the
three heating rates.
Figure 4.3 Fractional conversion of bamboo leaves (BB) and cogon grass (IC) at 5, 10 and 20 oC min-1
0
0.1
0.2
0.3
0.4
0.5
0.6
0.7
0.8
0.9
1
0 20 40 60 80 100 120 140
Frac
tiona
l con
vers
ion,
X (%
)
Time, t (min)
BB IC
(a) 5 oC min-1
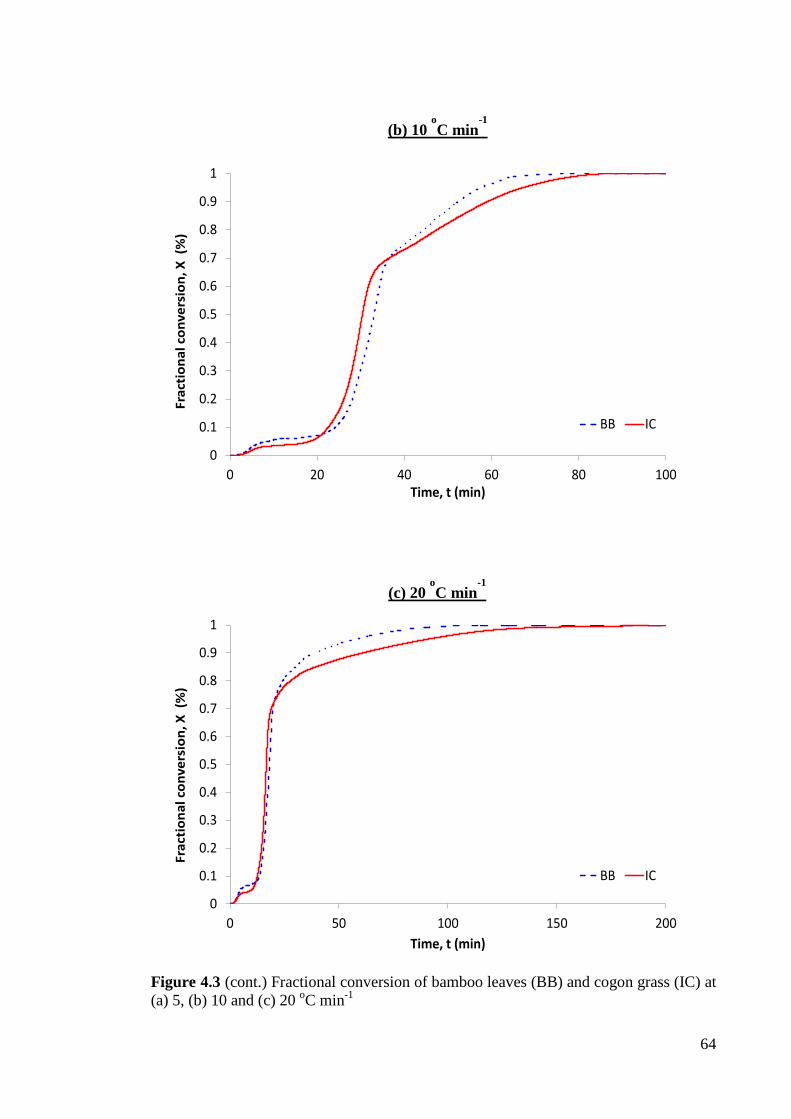
64
Figure 4.3 (cont.) Fractional conversion of bamboo leaves (BB) and cogon grass (IC) at (a) 5, (b) 10 and (c) 20 oC min-1
0
0.1
0.2
0.3
0.4
0.5
0.6
0.7
0.8
0.9
1
0 50 100 150 200
Frac
tion
al c
onve
rsio
n, X
(%
)
Time, t (min)
BB IC
(c) 20 oC min
-1
0
0.1
0.2
0.3
0.4
0.5
0.6
0.7
0.8
0.9
1
0 20 40 60 80 100
Frac
tion
al c
onve
rsio
n, X
(%
)
Time, t (min)
BB IC
(b) 10 oC min
-1
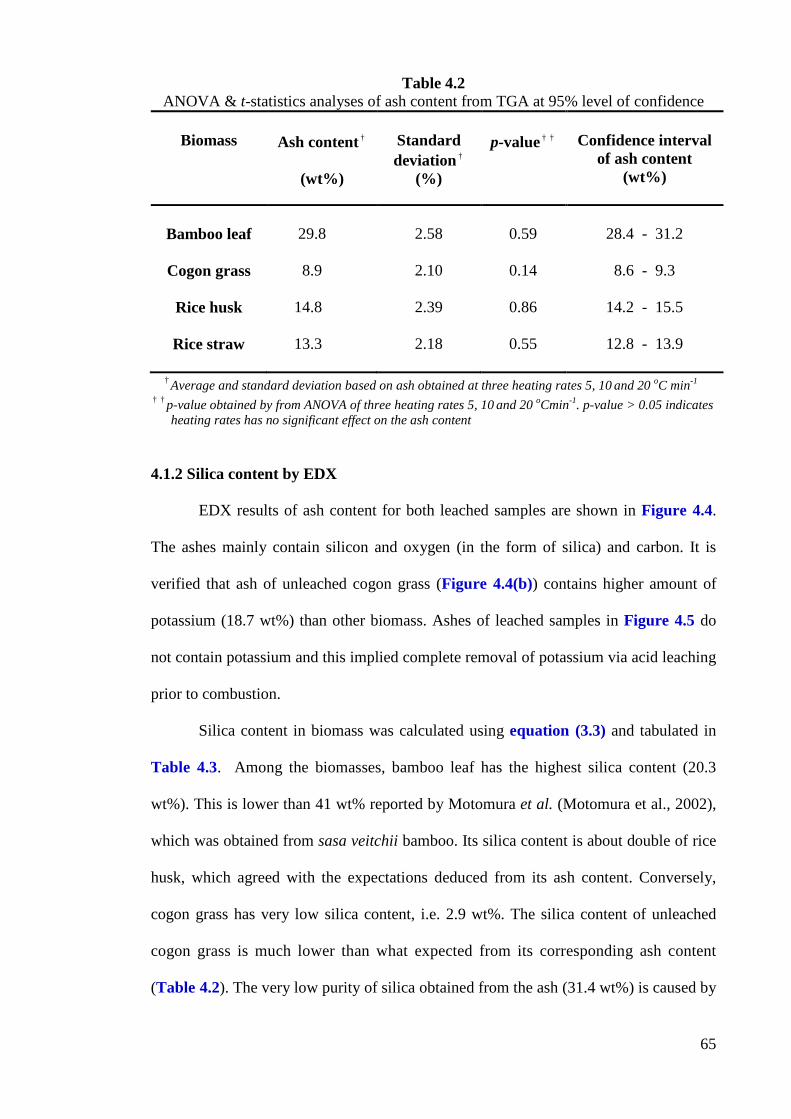
65
Table 4.2 ANOVA & t-statistics analyses of ash content from TGA at 95% level of confidence
Biomass
Ash content †
(wt%)
Standard deviation †
(%)
p-value † †
Confidence interval
of ash content (wt%)
Bamboo leaf
Cogon grass
Rice husk
Rice straw
29.8
8.9
14.8
13.3
2.58
2.10
2.39
2.18
0.59
0.14
0.86
0.55
28.4 - 31.2
8.6 - 9.3
14.2 - 15.5
12.8 - 13.9
† Average and standard deviation based on ash obtained at three heating rates 5, 10 and 20 oC min-1 † † p-value obtained by from ANOVA of three heating rates 5, 10 and 20 oCmin-1. p-value > 0.05 indicates heating rates has no significant effect on the ash content
4.1.2 Silica content by EDX
EDX results of ash content for both leached samples are shown in Figure 4.4.
The ashes mainly contain silicon and oxygen (in the form of silica) and carbon. It is
verified that ash of unleached cogon grass (Figure 4.4(b)) contains higher amount of
potassium (18.7 wt%) than other biomass. Ashes of leached samples in Figure 4.5 do
not contain potassium and this implied complete removal of potassium via acid leaching
prior to combustion.
Silica content in biomass was calculated using equation (3.3) and tabulated in
Table 4.3. Among the biomasses, bamboo leaf has the highest silica content (20.3
wt%). This is lower than 41 wt% reported by Motomura et al. (Motomura et al., 2002),
which was obtained from sasa veitchii bamboo. Its silica content is about double of rice
husk, which agreed with the expectations deduced from its ash content. Conversely,
cogon grass has very low silica content, i.e. 2.9 wt%. The silica content of unleached
cogon grass is much lower than what expected from its corresponding ash content
(Table 4.2). The very low purity of silica obtained from the ash (31.4 wt%) is caused by
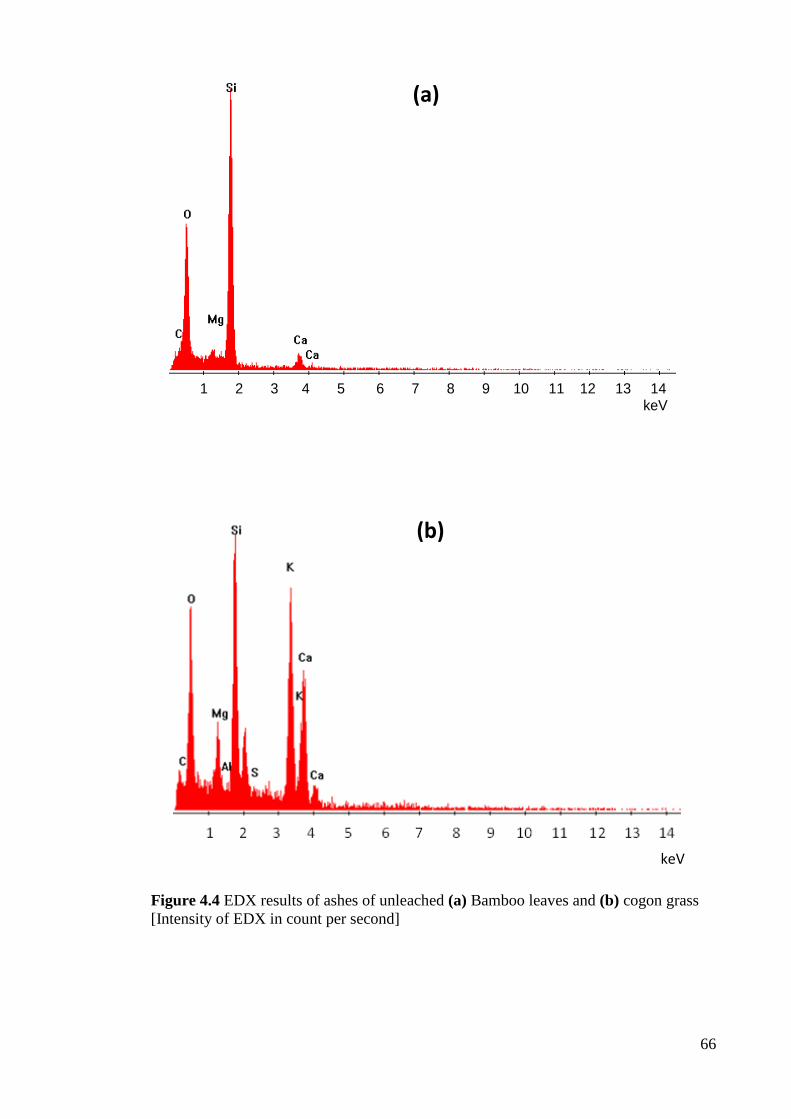
66
Figure 4.4 EDX results of ashes of unleached (a) Bamboo leaves and (b) cogon grass [Intensity of EDX in count per second]
1 2 3 4 5 6 7 8 9 10 11 12 13 14 keV
(a)
(b)
keV
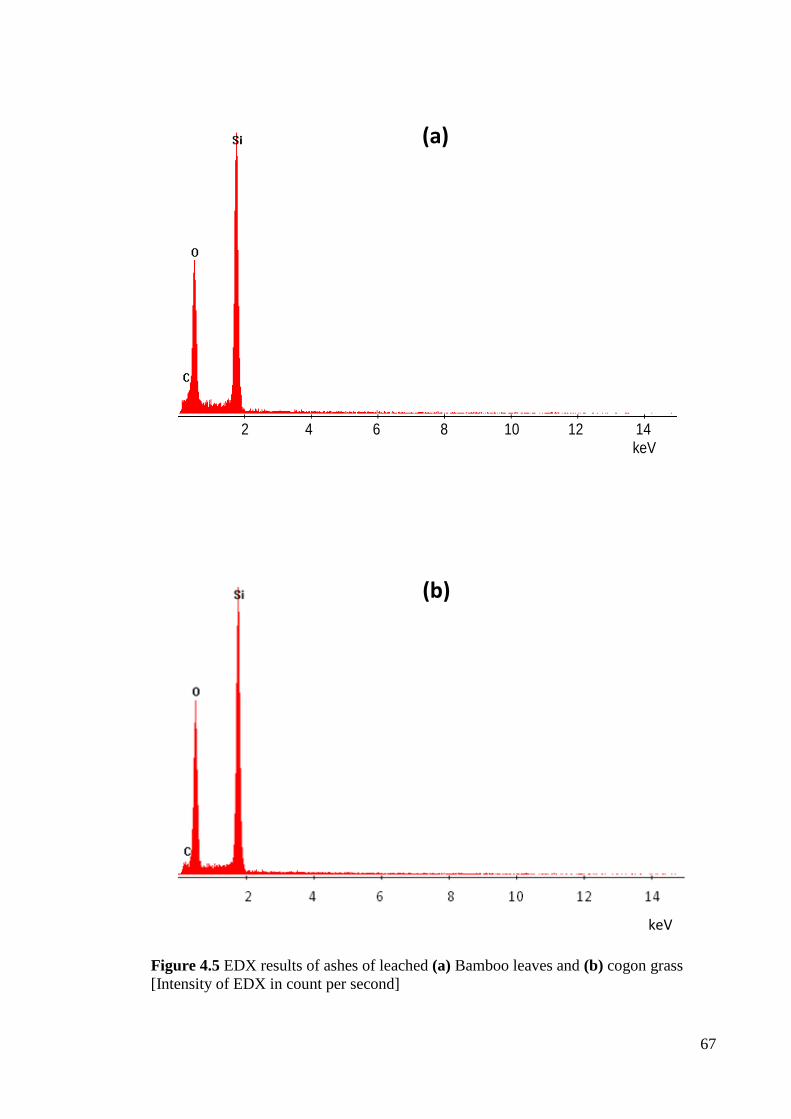
67
Figure 4.5 EDX results of ashes of leached (a) Bamboo leaves and (b) cogon grass [Intensity of EDX in count per second]
2 4 6 8 10 12 14 keV
(b)
(a)
keV
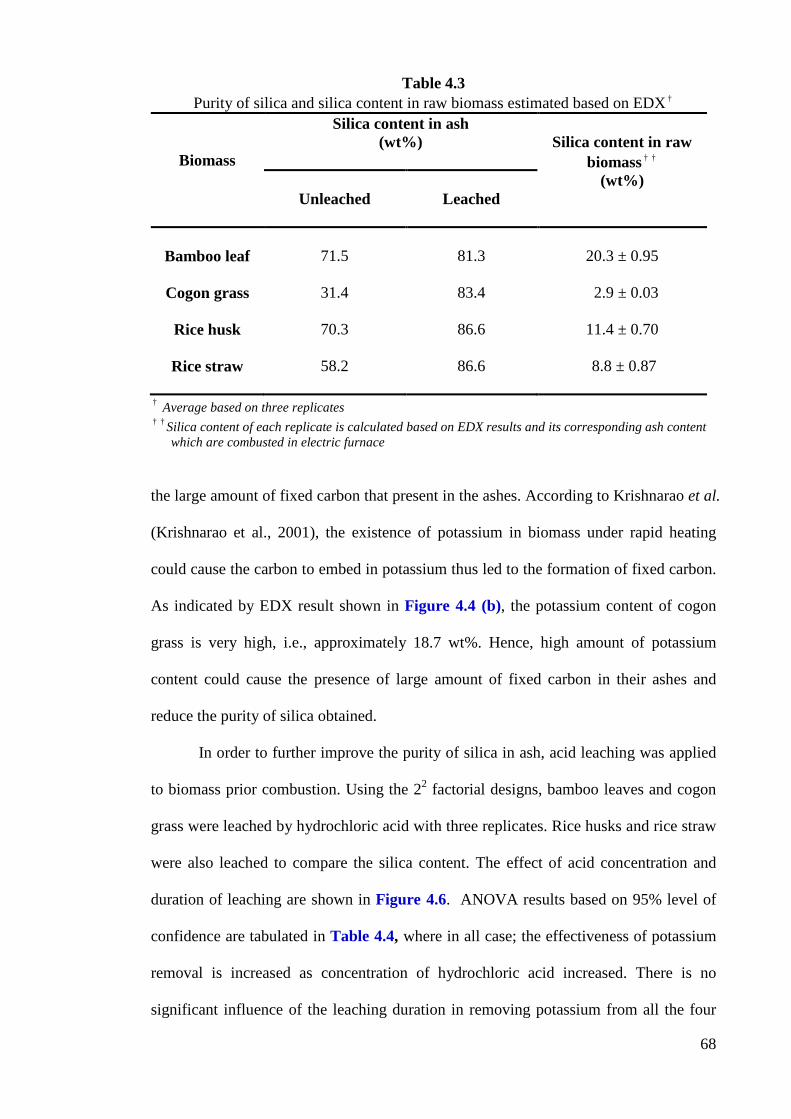
68
Table 4.3 Purity of silica and silica content in raw biomass estimated based on EDX †
Biomass
Silica content in ash (wt%)
Silica content in raw
biomass † † (wt%)
Unleached
Leached
Bamboo leaf
Cogon grass
Rice husk
Rice straw
71.5
31.4
70.3
58.2
81.3
83.4
86.6
86.6
20.3 ± 0.95
2.9 ± 0.03
11.4 ± 0.70
8.8 ± 0.87
† Average based on three replicates † † Silica content of each replicate is calculated based on EDX results and its corresponding ash content which are combusted in electric furnace
the large amount of fixed carbon that present in the ashes. According to Krishnarao et al.
(Krishnarao et al., 2001), the existence of potassium in biomass under rapid heating
could cause the carbon to embed in potassium thus led to the formation of fixed carbon.
As indicated by EDX result shown in Figure 4.4 (b), the potassium content of cogon
grass is very high, i.e., approximately 18.7 wt%. Hence, high amount of potassium
content could cause the presence of large amount of fixed carbon in their ashes and
reduce the purity of silica obtained.
In order to further improve the purity of silica in ash, acid leaching was applied
to biomass prior combustion. Using the 22 factorial designs, bamboo leaves and cogon
grass were leached by hydrochloric acid with three replicates. Rice husks and rice straw
were also leached to compare the silica content. The effect of acid concentration and
duration of leaching are shown in Figure 4.6. ANOVA results based on 95% level of
confidence are tabulated in Table 4.4, where in all case; the effectiveness of potassium
removal is increased as concentration of hydrochloric acid increased. There is no
significant influence of the leaching duration in removing potassium from all the four
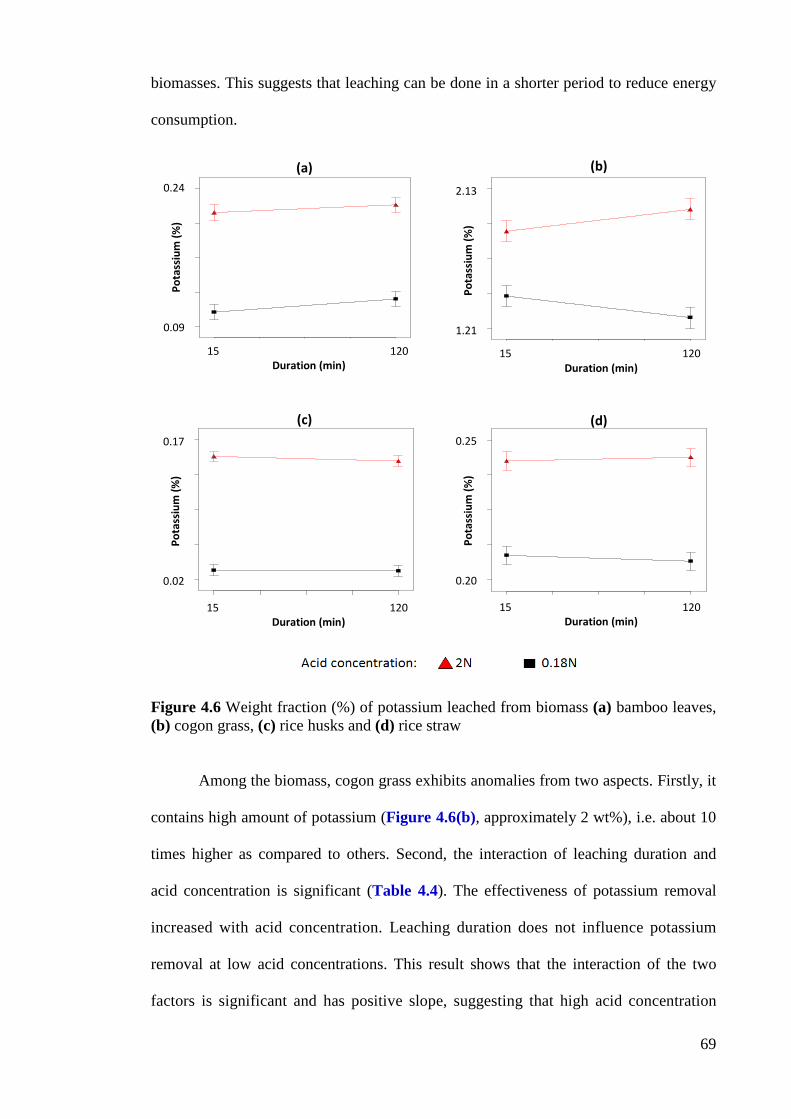
69
biomasses. This suggests that leaching can be done in a shorter period to reduce energy
consumption.
Figure 4.6 Weight fraction (%) of potassium leached from biomass (a) bamboo leaves, (b) cogon grass, (c) rice husks and (d) rice straw
Among the biomass, cogon grass exhibits anomalies from two aspects. Firstly, it
contains high amount of potassium (Figure 4.6(b), approximately 2 wt%), i.e. about 10
times higher as compared to others. Second, the interaction of leaching duration and
acid concentration is significant (Table 4.4). The effectiveness of potassium removal
increased with acid concentration. Leaching duration does not influence potassium
removal at low acid concentrations. This result shows that the interaction of the two
factors is significant and has positive slope, suggesting that high acid concentration
15.00 41.25 67.50 93.75 120.00
Duration (min)
Potas
sium
leach
ed (%
)
0.02
0.0575
0.095
0.1325
0.17
15 120 Duration (min)
0.17
0.02
Pota
ssiu
m (%
)
15.00 41.25 67.50 93.75 120.00
Duration (min)
Potas
sium
leach
ed(%
)
1.31
1.515
1.72
1.925
2.13
15 120 Duration (min)
2.13 1.21
Pota
ssiu
m (%
)
15.00 41.25 67.50 93.75 120.00
Duration (min)
Potas
sium
leach
ed (%
)
0.09
0.1275
0.165
0.2025
0.24
15 120 Duration (min)
0.24 0.09
Pota
ssiu
m (%
)
15.00 41.25 67.50 93.75 120.00
Duration (min)
Potas
sium
leach
ed (%
)
0.2
0.2375
0.275
0.3125
0.35
15 120 Duration (min)
0.25 0.20
Pota
ssiu
m (%
)
(a) (b)
(c) (d)
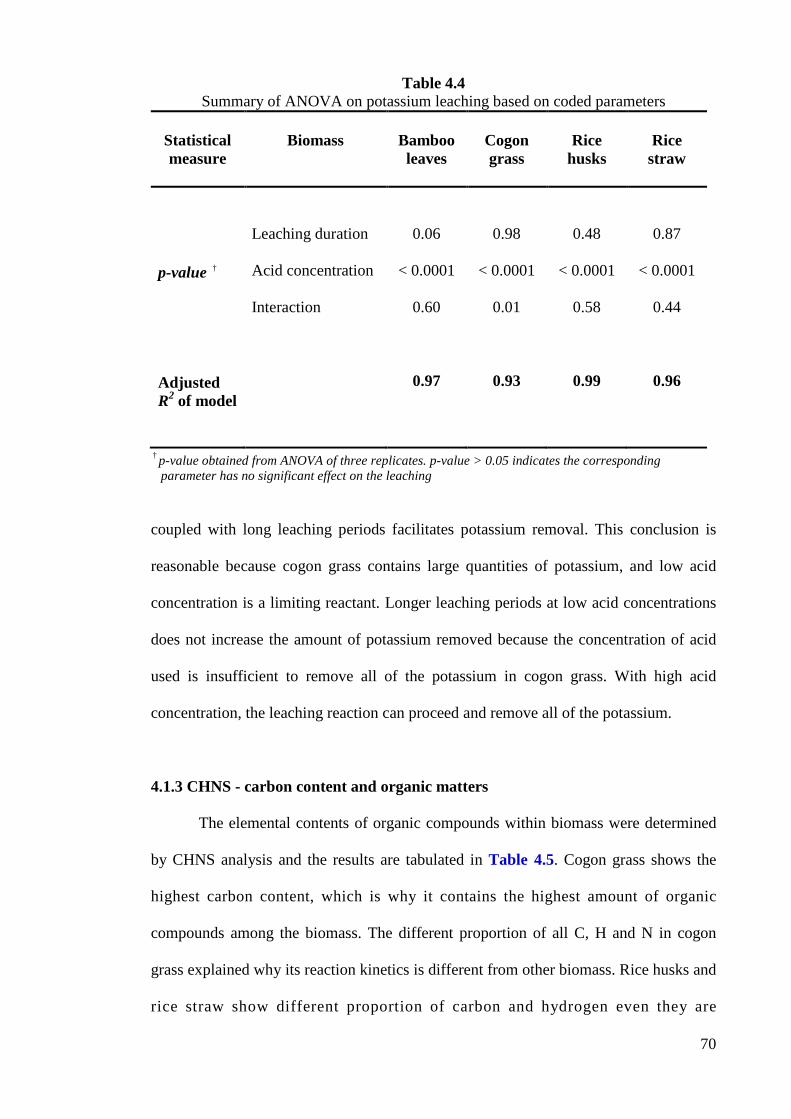
70
Table 4.4 Summary of ANOVA on potassium leaching based on coded parameters
Statistical measure
Biomass
Bamboo leaves
Cogon grass
Rice
husks
Rice
straw
p-value † Adjusted R2 of model
Leaching duration Acid concentration Interaction
0.06
< 0.0001
0.60
0.97
0.98
< 0.0001
0.01
0.93
0.48
< 0.0001
0.58
0.99
0.87
< 0.0001
0.44
0.96
† p-value obtained from ANOVA of three replicates. p-value > 0.05 indicates the corresponding parameter has no significant effect on the leaching
coupled with long leaching periods facilitates potassium removal. This conclusion is
reasonable because cogon grass contains large quantities of potassium, and low acid
concentration is a limiting reactant. Longer leaching periods at low acid concentrations
does not increase the amount of potassium removed because the concentration of acid
used is insufficient to remove all of the potassium in cogon grass. With high acid
concentration, the leaching reaction can proceed and remove all of the potassium.
4.1.3 CHNS - carbon content and organic matters
The elemental contents of organic compounds within biomass were determined
by CHNS analysis and the results are tabulated in Table 4.5. Cogon grass shows the
highest carbon content, which is why it contains the highest amount of organic
compounds among the biomass. The different proportion of all C, H and N in cogon
grass explained why its reaction kinetics is different from other biomass. Rice husks and
rice straw show different proportion of carbon and hydrogen even they are
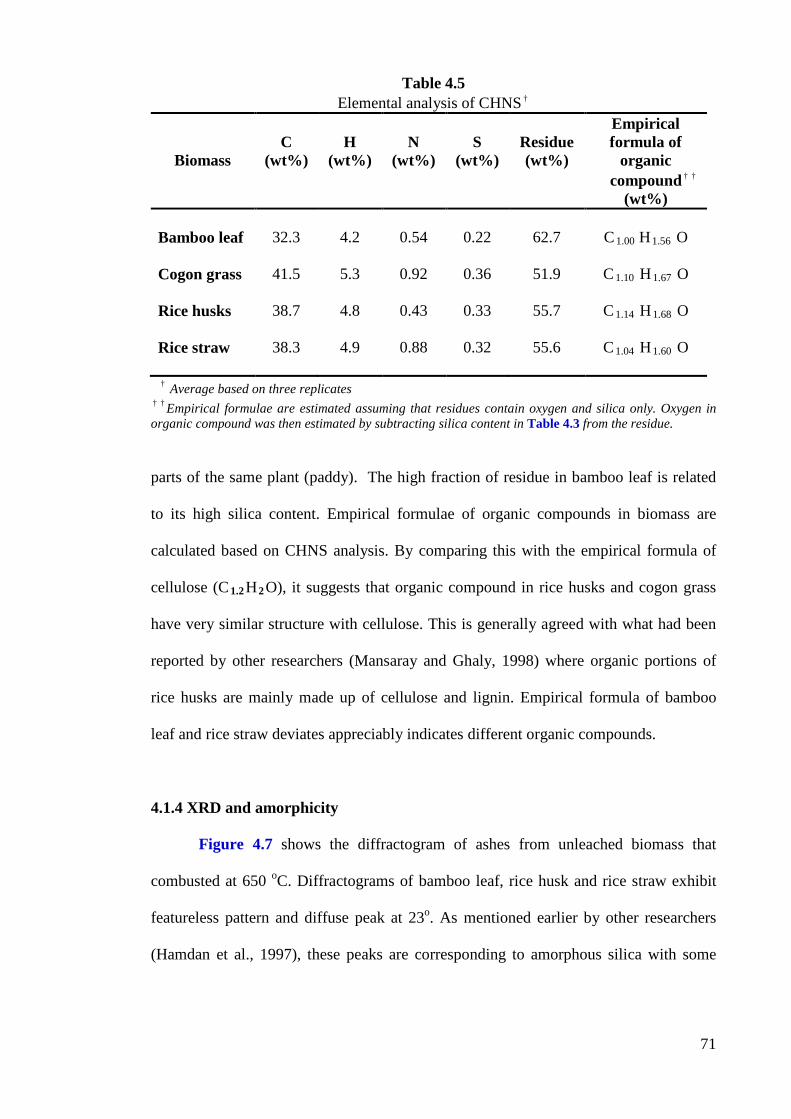
71
Table 4.5 Elemental analysis of CHNS †
Biomass
C
(wt%)
H
(wt%)
N
(wt%)
S
(wt%)
Residue (wt%)
Empirical formula of
organic compound † †
(wt%) Bamboo leaf Cogon grass Rice husks Rice straw
32.3
41.5
38.7
38.3
4.2
5.3
4.8
4.9
0.54
0.92
0.43
0.88
0.22
0.36
0.33
0.32
62.7
51.9
55.7
55.6
C1.00 H1.56 O
C1.10 H1.67 O
C1.14 H1.68 O
C1.04 H1.60 O
† Average based on three replicates † † Empirical formulae are estimated assuming that residues contain oxygen and silica only. Oxygen in organic compound was then estimated by subtracting silica content in Table 4.3 from the residue.
parts of the same plant (paddy). The high fraction of residue in bamboo leaf is related
to its high silica content. Empirical formulae of organic compounds in biomass are
calculated based on CHNS analysis. By comparing this with the empirical formula of
cellulose (C 1.2 H2 O), it suggests that organic compound in rice husks and cogon grass
have very similar structure with cellulose. This is generally agreed with what had been
reported by other researchers (Mansaray and Ghaly, 1998) where organic portions of
rice husks are mainly made up of cellulose and lignin. Empirical formula of bamboo
leaf and rice straw deviates appreciably indicates different organic compounds.
4.1.4 XRD and amorphicity
Figure 4.7 shows the diffractogram of ashes from unleached biomass that
combusted at 650 oC. Diffractograms of bamboo leaf, rice husk and rice straw exhibit
featureless pattern and diffuse peak at 23o. As mentioned earlier by other researchers
(Hamdan et al., 1997), these peaks are corresponding to amorphous silica with some
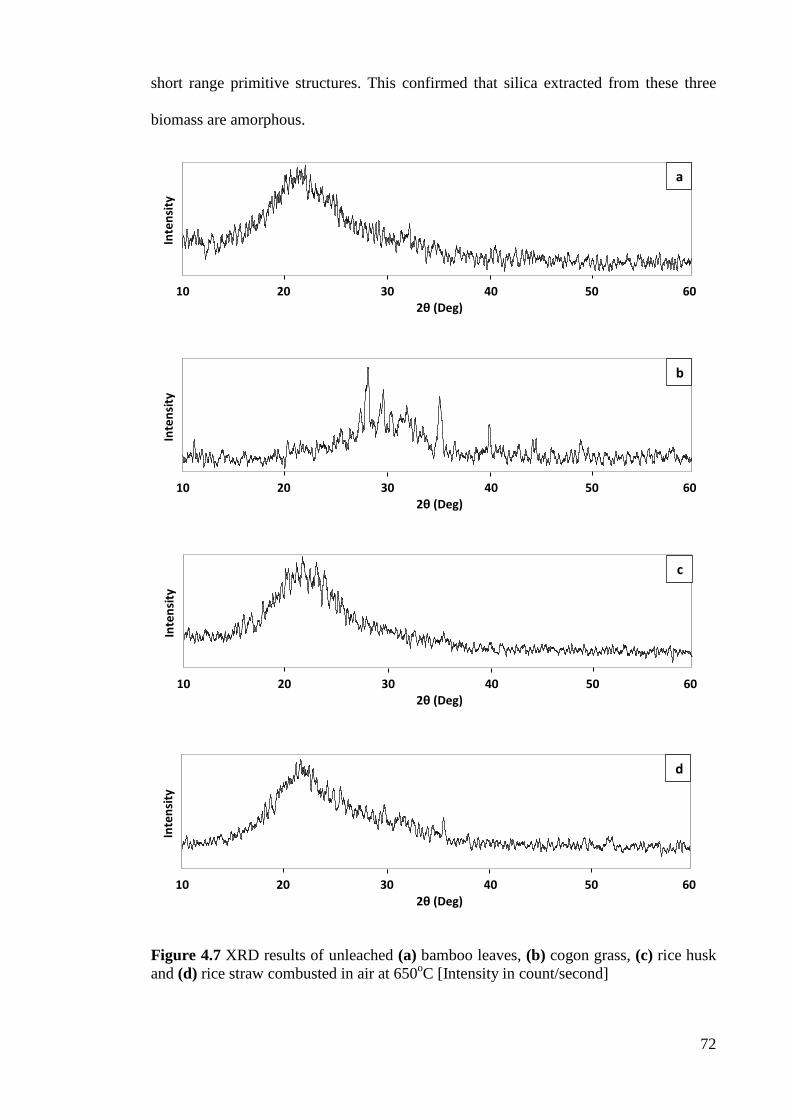
72
short range primitive structures. This confirmed that silica extracted from these three
biomass are amorphous.
Figure 4.7 XRD results of unleached (a) bamboo leaves, (b) cogon grass, (c) rice husk and (d) rice straw combusted in air at 650oC [Intensity in count/second]
10 20 30 40 50 60
Inte
nsity
2θ (Deg)
a
10 20 30 40 50 60
Inte
nsity
2θ (Deg)
b
10 20 30 40 50 60
Inte
nsity
2θ (Deg)
d
10 20 30 40 50 60
Inte
nsity
2θ (Deg)
c
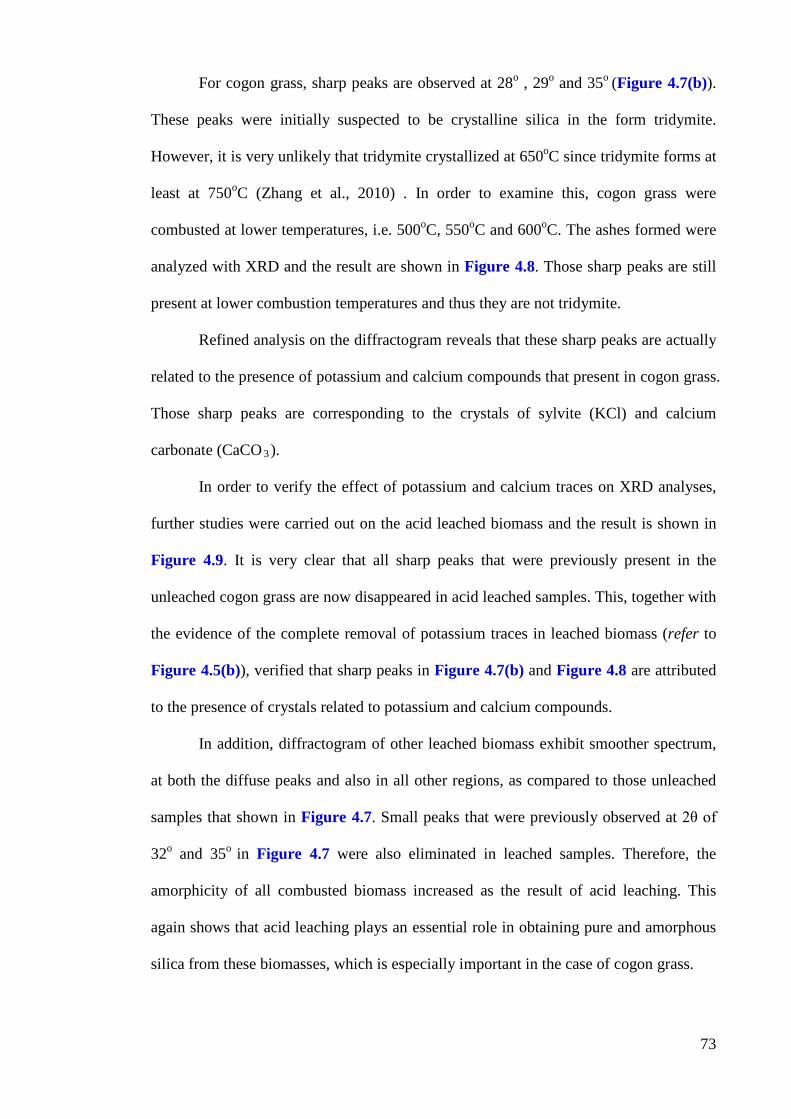
73
For cogon grass, sharp peaks are observed at 28o , 29o and 35o (Figure 4.7(b)).
These peaks were initially suspected to be crystalline silica in the form tridymite.
However, it is very unlikely that tridymite crystallized at 650oC since tridymite forms at
least at 750oC (Zhang et al., 2010) . In order to examine this, cogon grass were
combusted at lower temperatures, i.e. 500oC, 550oC and 600oC. The ashes formed were
analyzed with XRD and the result are shown in Figure 4.8. Those sharp peaks are still
present at lower combustion temperatures and thus they are not tridymite.
Refined analysis on the diffractogram reveals that these sharp peaks are actually
related to the presence of potassium and calcium compounds that present in cogon grass.
Those sharp peaks are corresponding to the crystals of sylvite (KCl) and calcium
carbonate (CaCO3 ).
In order to verify the effect of potassium and calcium traces on XRD analyses,
further studies were carried out on the acid leached biomass and the result is shown in
Figure 4.9. It is very clear that all sharp peaks that were previously present in the
unleached cogon grass are now disappeared in acid leached samples. This, together with
the evidence of the complete removal of potassium traces in leached biomass (refer to
Figure 4.5(b)), verified that sharp peaks in Figure 4.7(b) and Figure 4.8 are attributed
to the presence of crystals related to potassium and calcium compounds.
In addition, diffractogram of other leached biomass exhibit smoother spectrum,
at both the diffuse peaks and also in all other regions, as compared to those unleached
samples that shown in Figure 4.7. Small peaks that were previously observed at 2θ of
32o and 35o in Figure 4.7 were also eliminated in leached samples. Therefore, the
amorphicity of all combusted biomass increased as the result of acid leaching. This
again shows that acid leaching plays an essential role in obtaining pure and amorphous
silica from these biomasses, which is especially important in the case of cogon grass.
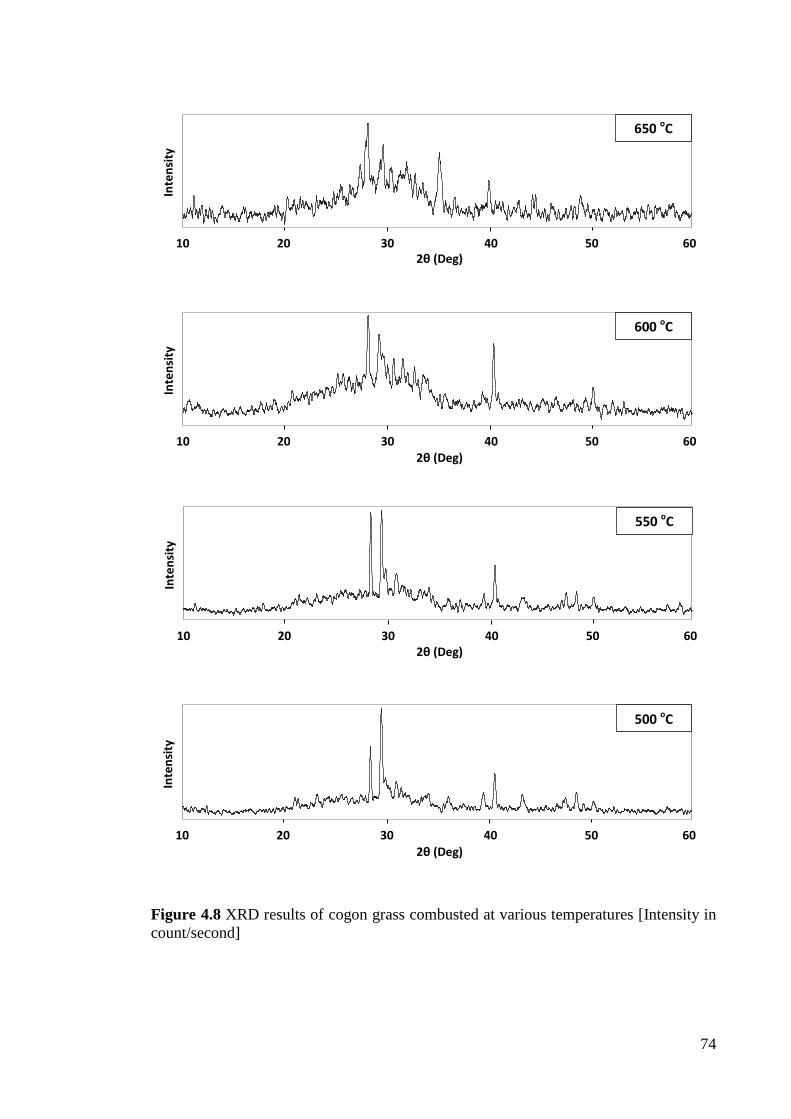
74
Figure 4.8 XRD results of cogon grass combusted at various temperatures [Intensity in count/second]
10 20 30 40 50 60
Inte
nsity
2θ (Deg)
650 oC
10 20 30 40 50 60
Inte
nsity
2θ (Deg)
600 oC
10 20 30 40 50 60
Inte
nsity
2θ (Deg)
550 oC
10 20 30 40 50 60
Inte
nsity
2θ (Deg)
500 oC
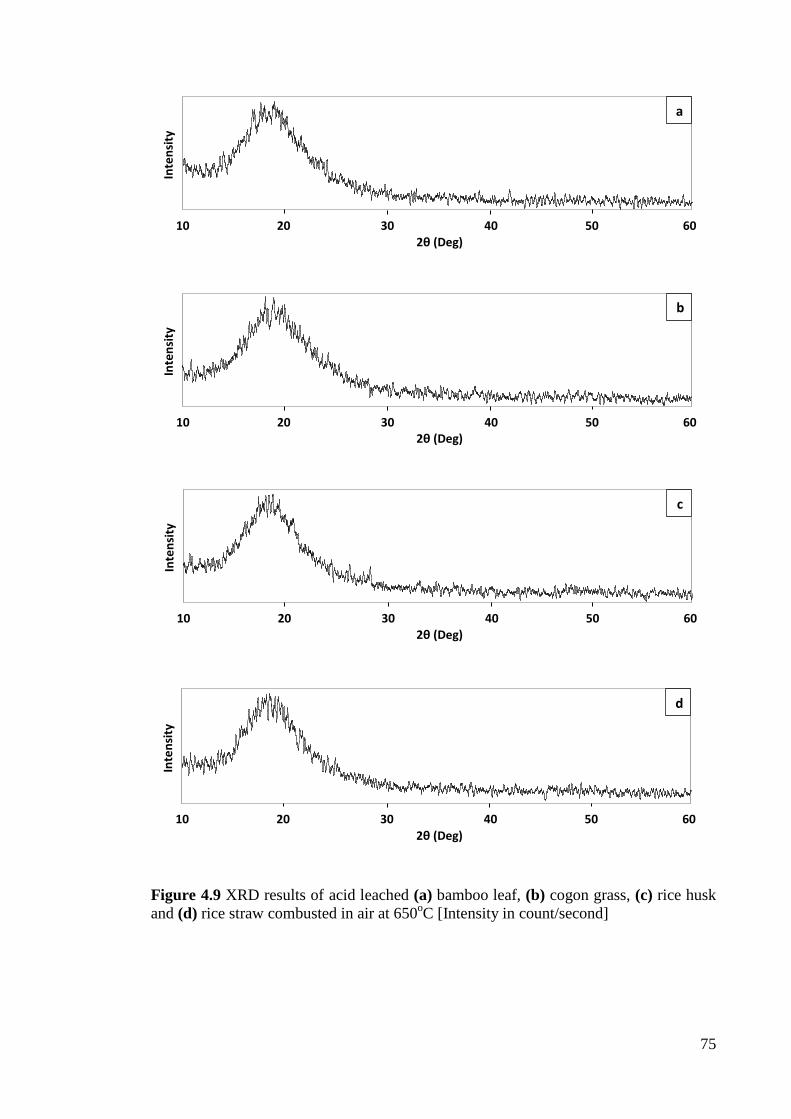
75
Figure 4.9 XRD results of acid leached (a) bamboo leaf, (b) cogon grass, (c) rice husk and (d) rice straw combusted in air at 650oC [Intensity in count/second]
10 20 30 40 50 60
Inte
nsity
2θ (Deg)
a
10 20 30 40 50 60
Inte
nsity
2θ (Deg)
c
10 20 30 40 50 60
Inte
nsity
2θ (Deg)
d
10 20 30 40 50 60
Inte
nsity
2θ (Deg)
b
76
4.1.5 Determination of kinetic parameters
Figure 4.10 shows the DTG of bamboo leaf and cogon grass obtained under
three heating rates. The decomposition of bamboo leaf and cogon grass began at
Figure 4.10 Differential thermogravimetry (DTG) of (a) bamboo leaf , (b) cogon grass
(a)
(b)
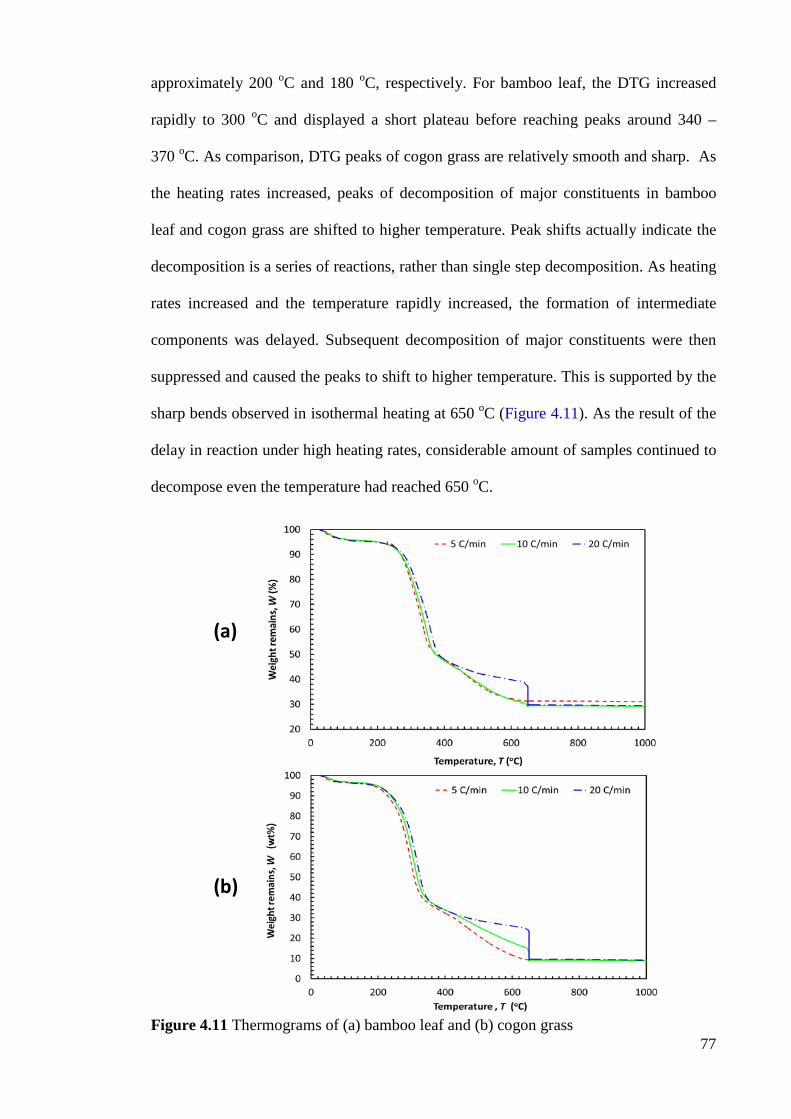
77
approximately 200 oC and 180 oC, respectively. For bamboo leaf, the DTG increased
rapidly to 300 oC and displayed a short plateau before reaching peaks around 340 –
370 oC. As comparison, DTG peaks of cogon grass are relatively smooth and sharp. As
the heating rates increased, peaks of decomposition of major constituents in bamboo
leaf and cogon grass are shifted to higher temperature. Peak shifts actually indicate the
decomposition is a series of reactions, rather than single step decomposition. As heating
rates increased and the temperature rapidly increased, the formation of intermediate
components was delayed. Subsequent decomposition of major constituents were then
suppressed and caused the peaks to shift to higher temperature. This is supported by the
sharp bends observed in isothermal heating at 650 oC (Figure 4.11). As the result of the
delay in reaction under high heating rates, considerable amount of samples continued to
decompose even the temperature had reached 650 oC.
Figure 4.11 Thermograms of (a) bamboo leaf and (b) cogon grass
(a)
(b)
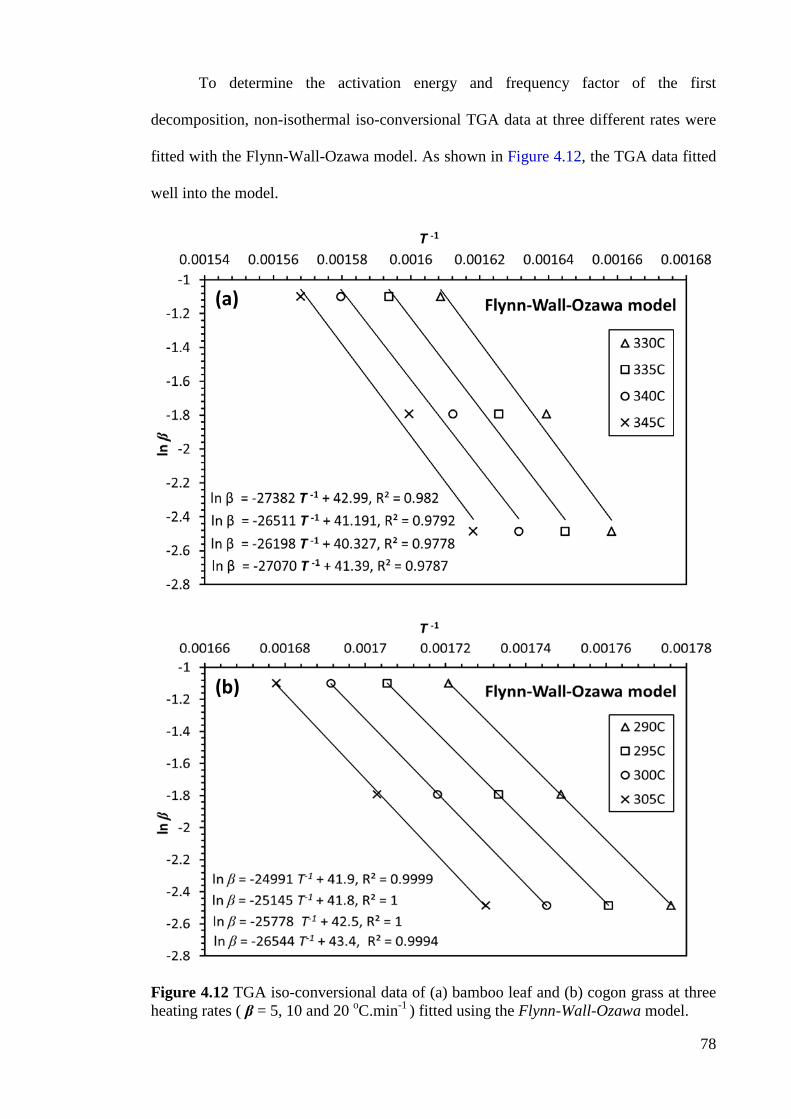
78
To determine the activation energy and frequency factor of the first
decomposition, non-isothermal iso-conversional TGA data at three different rates were
fitted with the Flynn-Wall-Ozawa model. As shown in Figure 4.12, the TGA data fitted
well into the model.
Figure 4.12 TGA iso-conversional data of (a) bamboo leaf and (b) cogon grass at three heating rates ( β = 5, 10 and 20 oC.min-1 ) fitted using the Flynn-Wall-Ozawa model.
(a)
(b)
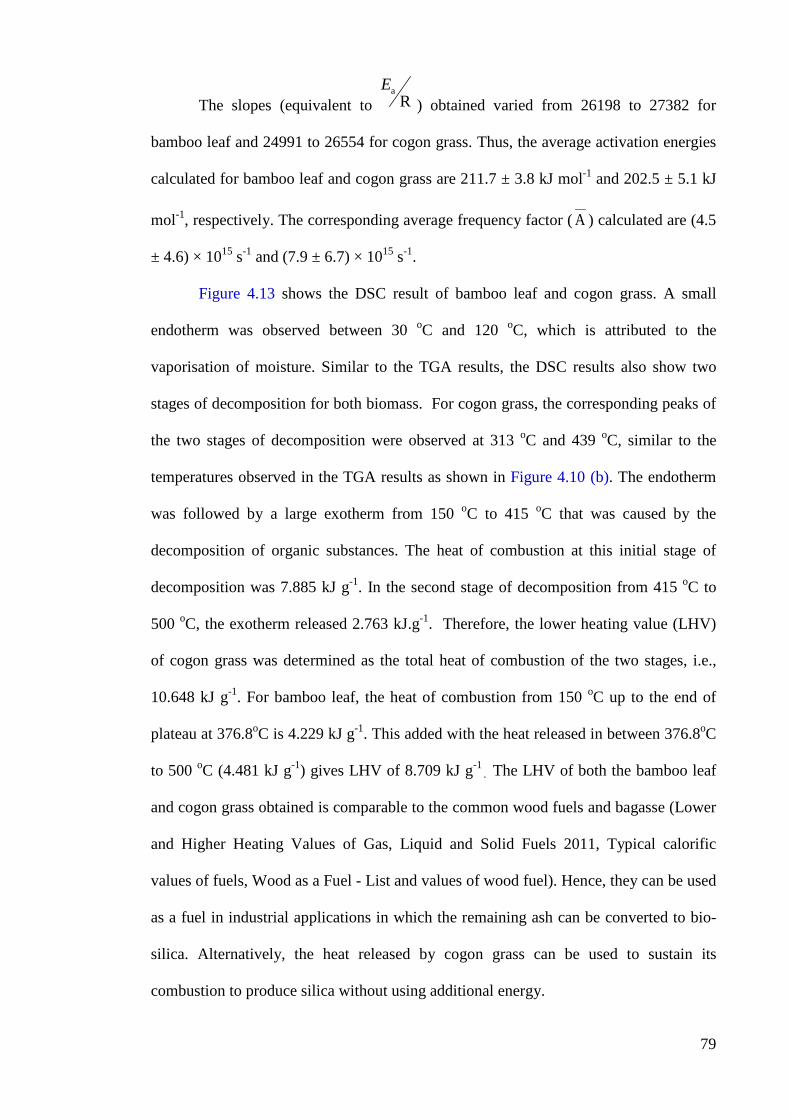
79
The slopes (equivalent to a
RE
) obtained varied from 26198 to 27382 for
bamboo leaf and 24991 to 26554 for cogon grass. Thus, the average activation energies
calculated for bamboo leaf and cogon grass are 211.7 ± 3.8 kJ mol-1 and 202.5 ± 5.1 kJ
mol-1, respectively. The corresponding average frequency factor ( A ) calculated are (4.5
± 4.6) × 1015 s-1 and (7.9 ± 6.7) × 1015 s-1.
Figure 4.13 shows the DSC result of bamboo leaf and cogon grass. A small
endotherm was observed between 30 oC and 120 oC, which is attributed to the
vaporisation of moisture. Similar to the TGA results, the DSC results also show two
stages of decomposition for both biomass. For cogon grass, the corresponding peaks of
the two stages of decomposition were observed at 313 oC and 439 oC, similar to the
temperatures observed in the TGA results as shown in Figure 4.10 (b). The endotherm
was followed by a large exotherm from 150 oC to 415 oC that was caused by the
decomposition of organic substances. The heat of combustion at this initial stage of
decomposition was 7.885 kJ g-1. In the second stage of decomposition from 415 oC to
500 oC, the exotherm released 2.763 kJ.g-1. Therefore, the lower heating value (LHV)
of cogon grass was determined as the total heat of combustion of the two stages, i.e.,
10.648 kJ g-1. For bamboo leaf, the heat of combustion from 150 oC up to the end of
plateau at 376.8oC is 4.229 kJ g-1. This added with the heat released in between 376.8oC
to 500 oC (4.481 kJ g-1) gives LHV of 8.709 kJ g-1. The LHV of both the bamboo leaf
and cogon grass obtained is comparable to the common wood fuels and bagasse (Lower
and Higher Heating Values of Gas, Liquid and Solid Fuels 2011, Typical calorific
values of fuels, Wood as a Fuel - List and values of wood fuel). Hence, they can be used
as a fuel in industrial applications in which the remaining ash can be converted to bio-
silica. Alternatively, the heat released by cogon grass can be used to sustain its
combustion to produce silica without using additional energy.
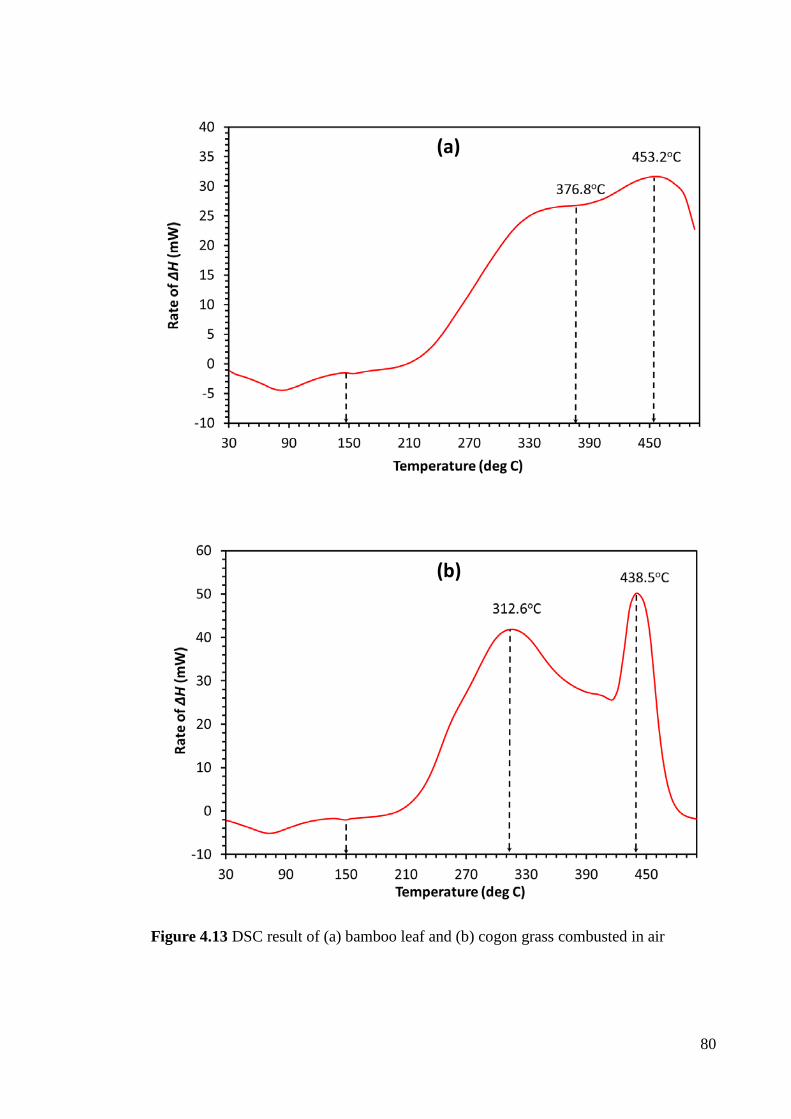
80
Figure 4.13 DSC result of (a) bamboo leaf and (b) cogon grass combusted in air
(a)
(b)
81
4.1.6 Summary
From the results in section 4.1, it revealed that bamboo leaves has great potential
to produce high purity amorphous silica. The silica content in bamboo leaves (20.3 wt%
± 0.95) is even higher than rice husks. Interestingly, unlike speculated previously in
other literatures (Shilling, 1993, Dozier, 1998), cogon grass has very low silica content
(2.9 wt% ± 0.03). This confusion may be the result of assuming the ash of cogon grass
contains mainly silica. By subtracting the high amount of fixed carbon that cannot be
removed by combustion, the remained silica content is much lower than what was
expected from its ash. Despite its low silica content, silica extraction of cogon grass is
still an alternative to reduce its undesired abundance. Based on the 10 metric tons of
cogon grass can be cut down per hectare of land (Kohli et al., 2008), a conserve
estimate on 500 million hectares of infested land can provide 145 million metric tons of
amorphous silica reserve. In addition, based on the calculated kinetic parameters and
LHV, the heat released (10648 kJ g-1) during decomposition may also be reused to
sustain the combustion of cogon grass, or be channeled to other applications as a zero-
cost fuel. However, the removal of potassium from cogon grass is essential in ensuring
the purity and quality of amorphous silica to be extracted. Based on the calculated
kinetic parameters and LHV, the heat released during decomposition may also be reused
to sustain the combustion of bamboo leaf and cogon grass, or be channeled to other
applications as a zero-cost fuel.
Based on the result, only silica from bamboo leaves was further produced in
large amount and used to synthesize water glass as precursor for silica aerogel. The
characteristics of water glass produced are reported in section 4.2.
82
4.2 Preparation of water glass as precursor
The bamboo leaf silica obtained in section 4.1 was dissolved to prepare water
glass. Effect of processing parameters including temperature, time, agitation speed,
concentration of NaOH, ratio of silica mass to NaOH volume to the silica yield (ξ) in
water glass was investigated and optimized.
4.2.1 Optimization of silica yield (ξ) in water glass
The effect of five selected processing parameters on the silica yield in water glass was
studied, and the results are shown in Figure 4.14. Among these parameters, the time, the
temperature and the agitation speed generally have stronger influence on the silica yield
than the NaOH concentration and the mass-to-volume ratio. The silica yield increased
as the time (Figure 4.14(a-d)), the temperature (Figure 4.14(a, e-g)) or the agitation
speed (Figure 4.14(d, g, i-j)) increased. This relationship is expected because these three
factors contribute to the increase in diffusion and reaction rate of BLS in the NaOH
solution. The temperature generated the largest response on the silica yield when it was
increased, followed by the agitation speed and the time. Hence, a silica yield that
approaches unity can be achieved in a shorter time at elevated temperatures. Similarly,
the silica yield can be increased when higher agitation speed or longer reaction time is
applied, but the effect is less significant for high temperature. By comparison, the
NaOH concentration and the mass-to volume ratio have no significant effect on ξ.
However, they exhibit some interaction as can be seen in Figure 4.14(h). The
corresponding ANOVA regression model is summarized in Table 4.6.
With the adjusted R2 value of 0.97, the model is sufficiently explained using the
five proposed processing parameters. equation (4.1) shows the model with the involved
regressed coefficients of processing parameters.
( )1ξ = 90.7 + 268.7 43.7 48.9 47.9 518610000
t T C R A− − + − (4.1)
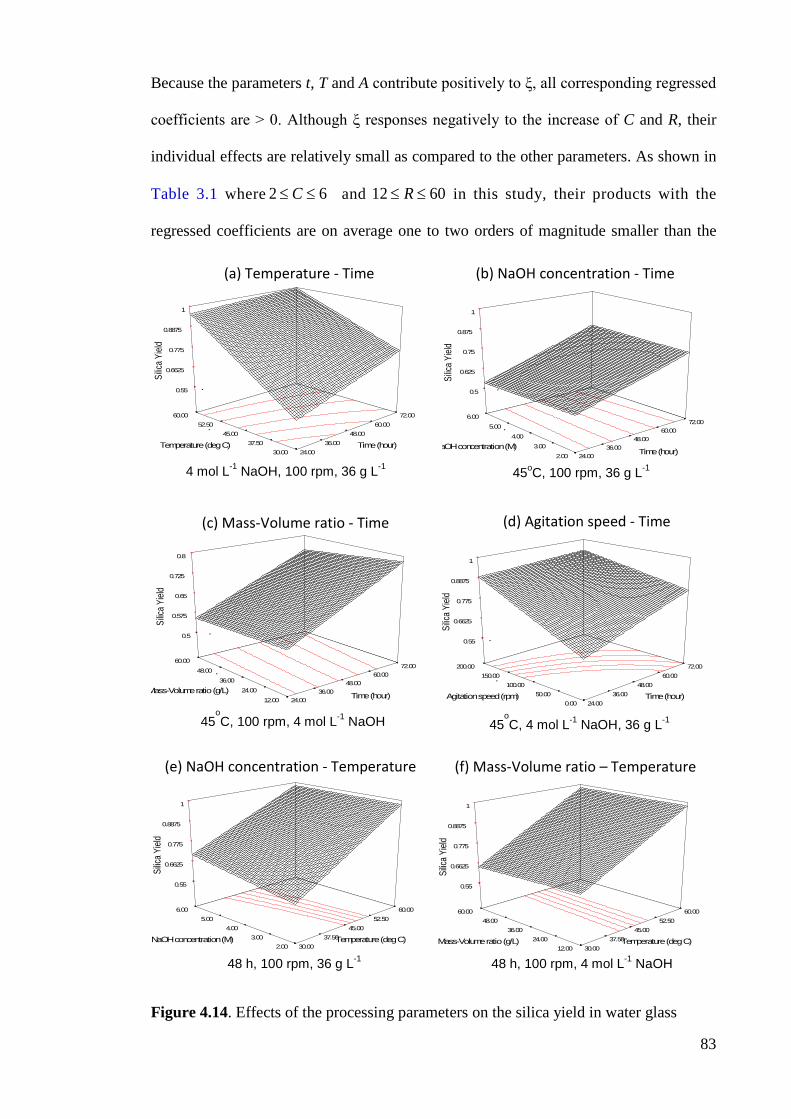
83
Because the parameters t, T and A contribute positively to ξ, all corresponding regressed
coefficients are > 0. Although ξ responses negatively to the increase of C and R, their
individual effects are relatively small as compared to the other parameters. As shown in
Table 3.1 where 2 6C≤ ≤ and 12 60R≤ ≤ in this study, their products with the
regressed coefficients are on average one to two orders of magnitude smaller than the
Figure 4.14. Effects of the processing parameters on the silica yield in water glass
24.00 36.00
48.00 60.00
72.00
30.00 37.50
45.00 52.50
60.00
0.55
0.6625
0.775
0.8875
1
Silic
a Yiel
d
Time (hour) Temperature (deg C)
24.00 36.00
48.00 60.00
72.00
0.00 50.00
100.00 150.00
200.00
0.55
0.6625
0.775
0.8875
1
Silic
a Yiel
d
Time (hour) Agitation speed (rpm)
30.00 37.50
45.00 52.50
60.00
2.00 3.00
4.00 5.00
6.00
0.55
0.6625
0.775
0.8875
1
Silic
a Yiel
d
Temperature (deg C) NaOH concentration (M)
30.00 37.50
45.00 52.50
60.00
12.00 24.00
36.00 48.00
60.00
0.55
0.6625
0.775
0.8875
1
Silic
a Yiel
d
Temperature (deg C) Mass-Volume ratio (g/L)
(a) Temperature - Time (b) NaOH concentration - Time
(c) Mass-Volume ratio - Time (d) Agitation speed - Time
(e) NaOH concentration - Temperature (f) Mass-Volume ratio – Temperature
24.00 36.00
48.00 60.00
72.00
12.00 24.00
36.00 48.00
60.00
0.5
0.575
0.65
0.725
0.8
Silic
a Yiel
d
Time (hour) Mass-Volume ratio (g/L)
24.00 36.00
48.00 60.00
72.00
2.00 3.00
4.00 5.00
6.00
0.5
0.625
0.75
0.875
1
Silic
a Yiel
d Time (hour)
aOH concentration (M)
4 mol L-1 NaOH, 100 rpm, 36 g L-1 45oC, 100 rpm, 36 g L-1
45oC, 100 rpm, 4 mol L-1 NaOH 45
oC, 4 mol L-1 NaOH, 36 g L-1
48 h, 100 rpm, 36 g L-1 48 h, 100 rpm, 4 mol L-1 NaOH
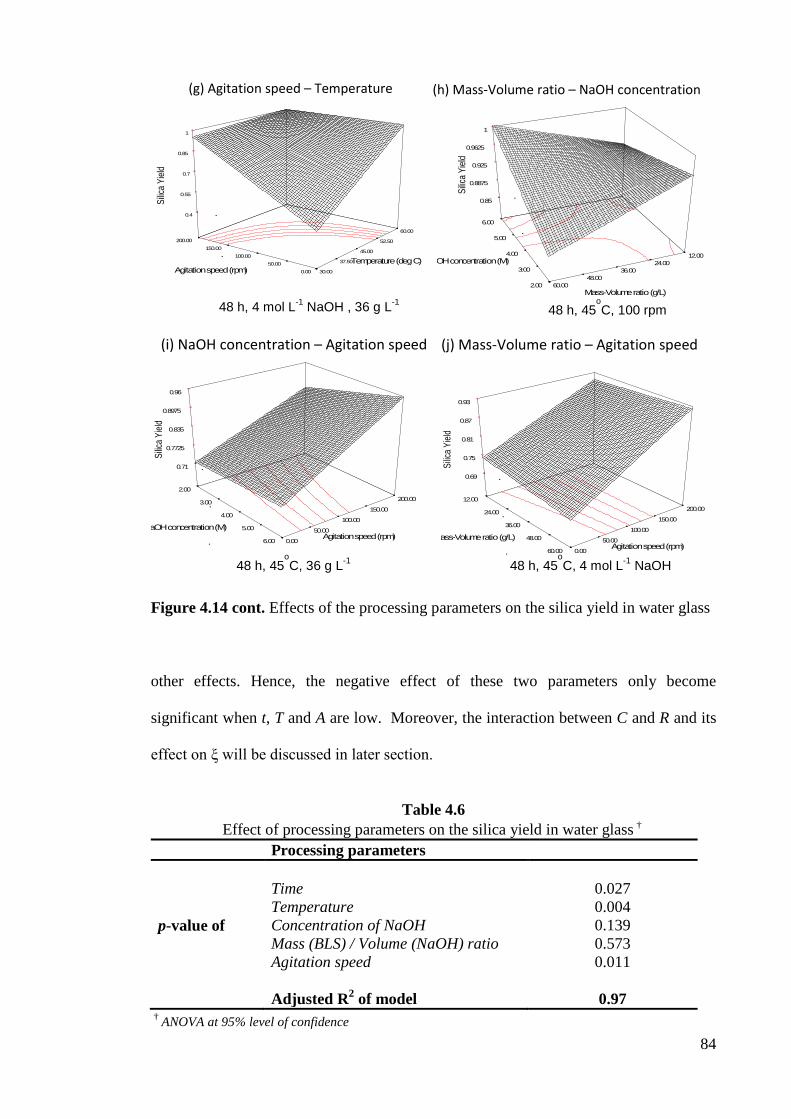
84
Figure 4.14 cont. Effects of the processing parameters on the silica yield in water glass
other effects. Hence, the negative effect of these two parameters only become
significant when t, T and A are low. Moreover, the interaction between C and R and its
effect on ξ will be discussed in later section.
Table 4.6
Effect of processing parameters on the silica yield in water glass † Processing parameters p-value of
Time Temperature Concentration of NaOH Mass (BLS) / Volume (NaOH) ratio Agitation speed Adjusted R2 of model
0.027 0.004 0.139 0.573 0.011
0.97
† ANOVA at 95% level of confidence
2.00
3.00
4.00
5.00
6.00 0.00
50.00
100.00
150.00
200.00
0.71
0.7725
0.835
0.8975
0.96
Silic
a Yiel
d
aOH concentration (M) Agitation speed (rpm)
12.00
24.00
36.00
48.00
60.00 0.00
50.00
100.00
150.00
200.00
0.69
0.75
0.81
0.87
0.93
Silic
a Yiel
d
Mass-Volume ratio (g/L) Agitation speed (rpm)
(g) Agitation speed – Temperature (h) Mass-Volume ratio – NaOH concentration
(i) NaOH concentration – Agitation speed (j) Mass-Volume ratio – Agitation speed
2.00
3.00
4.00
5.00
6.00
12.00 24.00
36.00 48.00
60.00
0.85
0.8875
0.925
0.9625
1
Silic
a Yiel
d
OH concentration (M)
Mass-Volume ratio (g/L)
30.00
37.50
45.00
52.50
60.00
0.00 50.00
100.00 150.00
200.00
0.4
0.55
0.7
0.85
1
Silic
a Yiel
d
Temperature (deg C) Agitation speed (rpm)
48 h, 4 mol L-1 NaOH , 36 g L-1 48 h, 45
oC, 100 rpm
48 h, 45oC, 36 g L-1 48 h, 45
oC, 4 mol L-1 NaOH
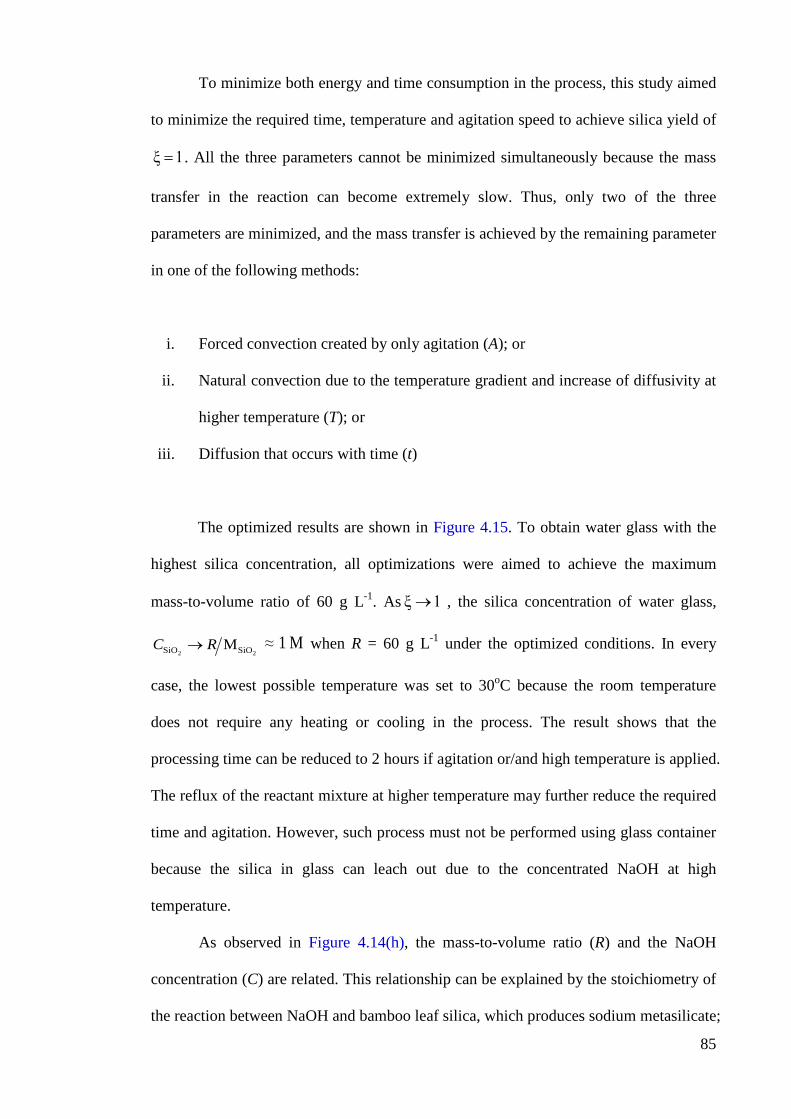
85
To minimize both energy and time consumption in the process, this study aimed
to minimize the required time, temperature and agitation speed to achieve silica yield of
ξ 1= . All the three parameters cannot be minimized simultaneously because the mass
transfer in the reaction can become extremely slow. Thus, only two of the three
parameters are minimized, and the mass transfer is achieved by the remaining parameter
in one of the following methods:
i. Forced convection created by only agitation (A); or
ii. Natural convection due to the temperature gradient and increase of diffusivity at
higher temperature (T); or
iii. Diffusion that occurs with time (t)
The optimized results are shown in Figure 4.15. To obtain water glass with the
highest silica concentration, all optimizations were aimed to achieve the maximum
mass-to-volume ratio of 60 g L-1. As ξ 1→ , the silica concentration of water glass,
2 2SiO SiOMC R→ ≈ 1 M when R = 60 g L-1 under the optimized conditions. In every
case, the lowest possible temperature was set to 30oC because the room temperature
does not require any heating or cooling in the process. The result shows that the
processing time can be reduced to 2 hours if agitation or/and high temperature is applied.
The reflux of the reactant mixture at higher temperature may further reduce the required
time and agitation. However, such process must not be performed using glass container
because the silica in glass can leach out due to the concentrated NaOH at high
temperature.
As observed in Figure 4.14(h), the mass-to-volume ratio (R) and the NaOH
concentration (C) are related. This relationship can be explained by the stoichiometry of
the reaction between NaOH and bamboo leaf silica, which produces sodium metasilicate;
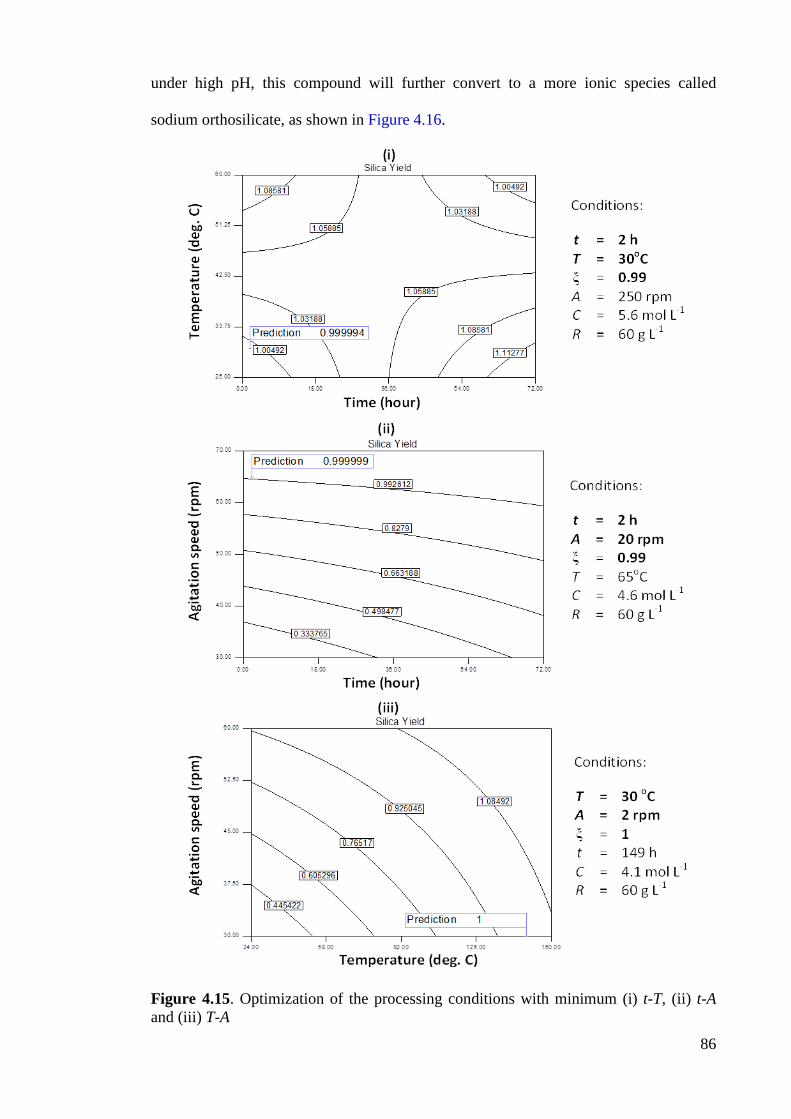
86
under high pH, this compound will further convert to a more ionic species called
sodium orthosilicate, as shown in Figure 4.16.
Figure 4.15. Optimization of the processing conditions with minimum (i) t-T, (ii) t-A and (iii) T-A
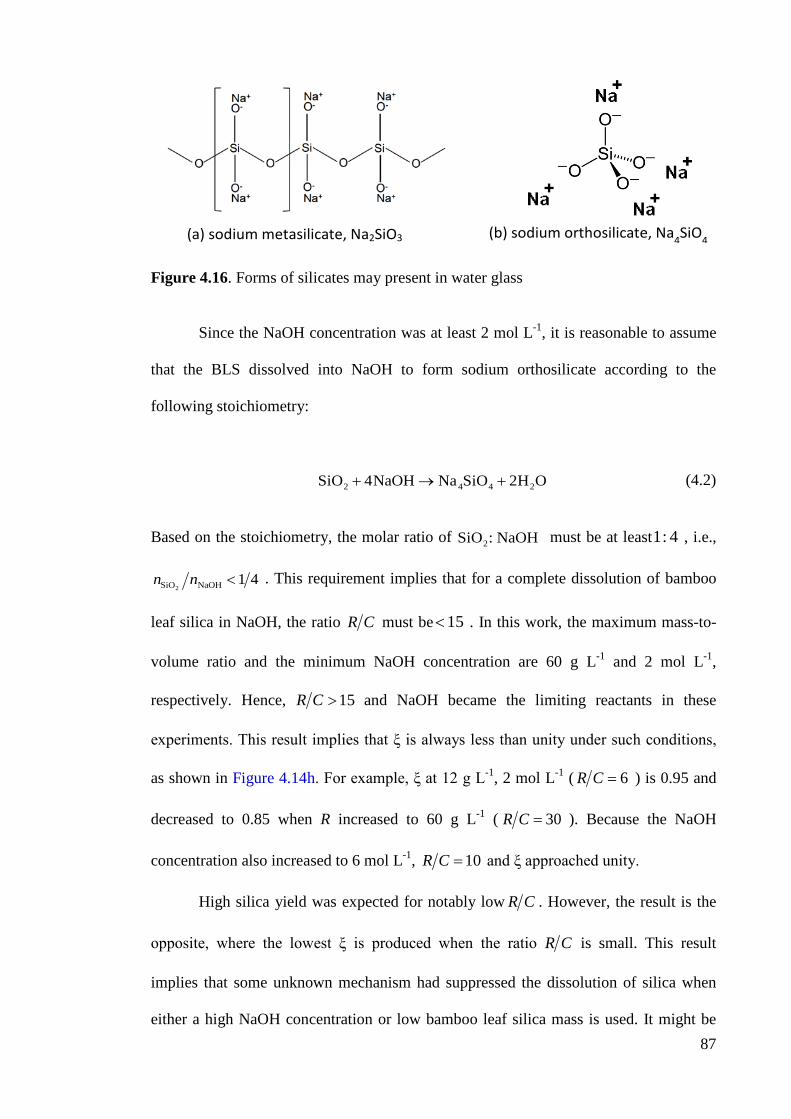
87
Figure 4.16. Forms of silicates may present in water glass
Since the NaOH concentration was at least 2 mol L-1, it is reasonable to assume
that the BLS dissolved into NaOH to form sodium orthosilicate according to the
following stoichiometry:
2 4 4 2SiO 4NaOH Na SiO 2H O+ → + (4.2)
Based on the stoichiometry, the molar ratio of 2SiO : NaOH must be at least1: 4 , i.e.,
2SiO NaOH 1 4n n < . This requirement implies that for a complete dissolution of bamboo
leaf silica in NaOH, the ratio R C must be 15< . In this work, the maximum mass-to-
volume ratio and the minimum NaOH concentration are 60 g L-1 and 2 mol L-1,
respectively. Hence, 15R C > and NaOH became the limiting reactants in these
experiments. This result implies that ξ is always less than unity under such conditions,
as shown in Figure 4.14h. For example, ξ at 12 g L-1, 2 mol L-1 ( 6R C = ) is 0.95 and
decreased to 0.85 when R increased to 60 g L-1 ( 30R C = ). Because the NaOH
concentration also increased to 6 mol L-1, 10R C = and ξ approached unity.
High silica yield was expected for notably low R C . However, the result is the
opposite, where the lowest ξ is produced when the ratio R C is small. This result
implies that some unknown mechanism had suppressed the dissolution of silica when
either a high NaOH concentration or low bamboo leaf silica mass is used. It might be
(a) sodium metasilicate, Na2SiO3 (b) sodium orthosilicate, Na4SiO4
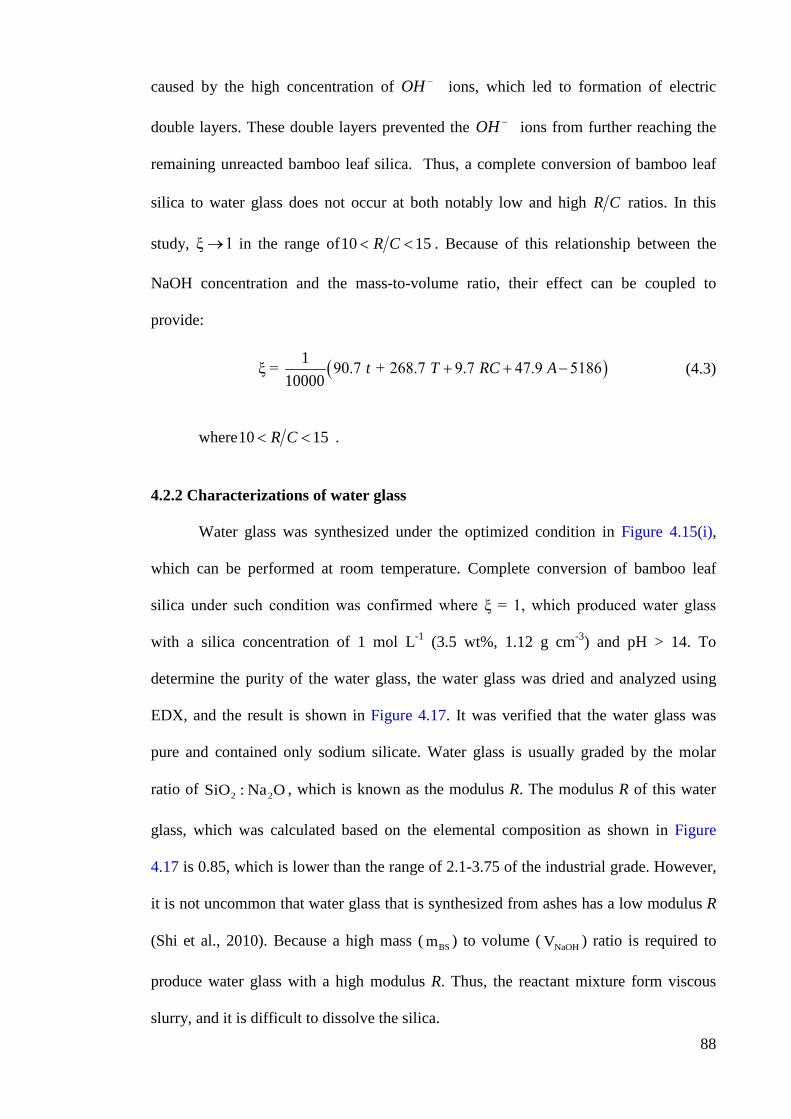
88
caused by the high concentration of OH − ions, which led to formation of electric
double layers. These double layers prevented the OH − ions from further reaching the
remaining unreacted bamboo leaf silica. Thus, a complete conversion of bamboo leaf
silica to water glass does not occur at both notably low and high R C ratios. In this
study, ξ 1→ in the range of10 15R C< < . Because of this relationship between the
NaOH concentration and the mass-to-volume ratio, their effect can be coupled to
provide:
( )1ξ = 90.7 + 268.7 9.7 47.9 518610000
t T RC A+ + − (4.3)
where10 15R C< < .
4.2.2 Characterizations of water glass
Water glass was synthesized under the optimized condition in Figure 4.15(i),
which can be performed at room temperature. Complete conversion of bamboo leaf
silica under such condition was confirmed where ξ = 1, which produced water glass
with a silica concentration of 1 mol L-1 (3.5 wt%, 1.12 g cm-3) and pH > 14. To
determine the purity of the water glass, the water glass was dried and analyzed using
EDX, and the result is shown in Figure 4.17. It was verified that the water glass was
pure and contained only sodium silicate. Water glass is usually graded by the molar
ratio of 2 2SiO : Na O , which is known as the modulus R. The modulus R of this water
glass, which was calculated based on the elemental composition as shown in Figure
4.17 is 0.85, which is lower than the range of 2.1-3.75 of the industrial grade. However,
it is not uncommon that water glass that is synthesized from ashes has a low modulus R
(Shi et al., 2010). Because a high mass ( BSm ) to volume ( NaOHV ) ratio is required to
produce water glass with a high modulus R. Thus, the reactant mixture form viscous
slurry, and it is difficult to dissolve the silica.
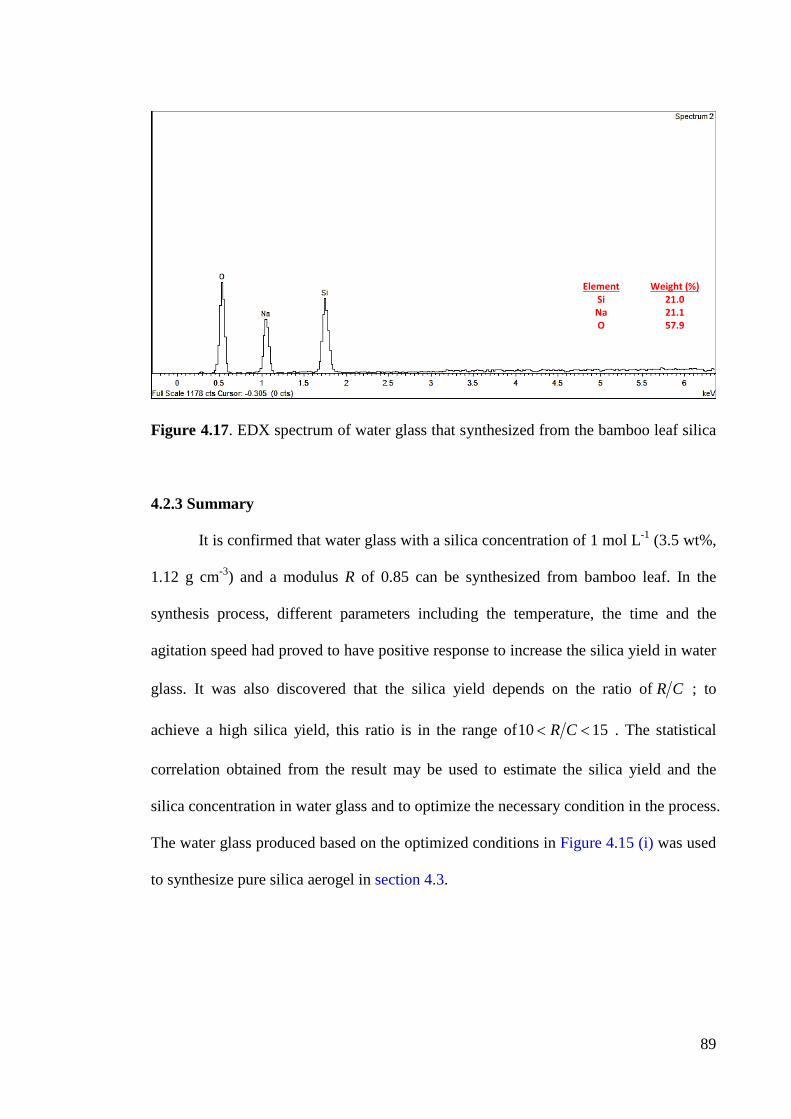
89
Figure 4.17. EDX spectrum of water glass that synthesized from the bamboo leaf silica
4.2.3 Summary
It is confirmed that water glass with a silica concentration of 1 mol L-1 (3.5 wt%,
1.12 g cm-3) and a modulus R of 0.85 can be synthesized from bamboo leaf. In the
synthesis process, different parameters including the temperature, the time and the
agitation speed had proved to have positive response to increase the silica yield in water
glass. It was also discovered that the silica yield depends on the ratio of R C ; to
achieve a high silica yield, this ratio is in the range of10 15R C< < . The statistical
correlation obtained from the result may be used to estimate the silica yield and the
silica concentration in water glass and to optimize the necessary condition in the process.
The water glass produced based on the optimized conditions in Figure 4.15 (i) was used
to synthesize pure silica aerogel in section 4.3.
Element Weight (%) Si 21.0 Na 21.1 O 57.9
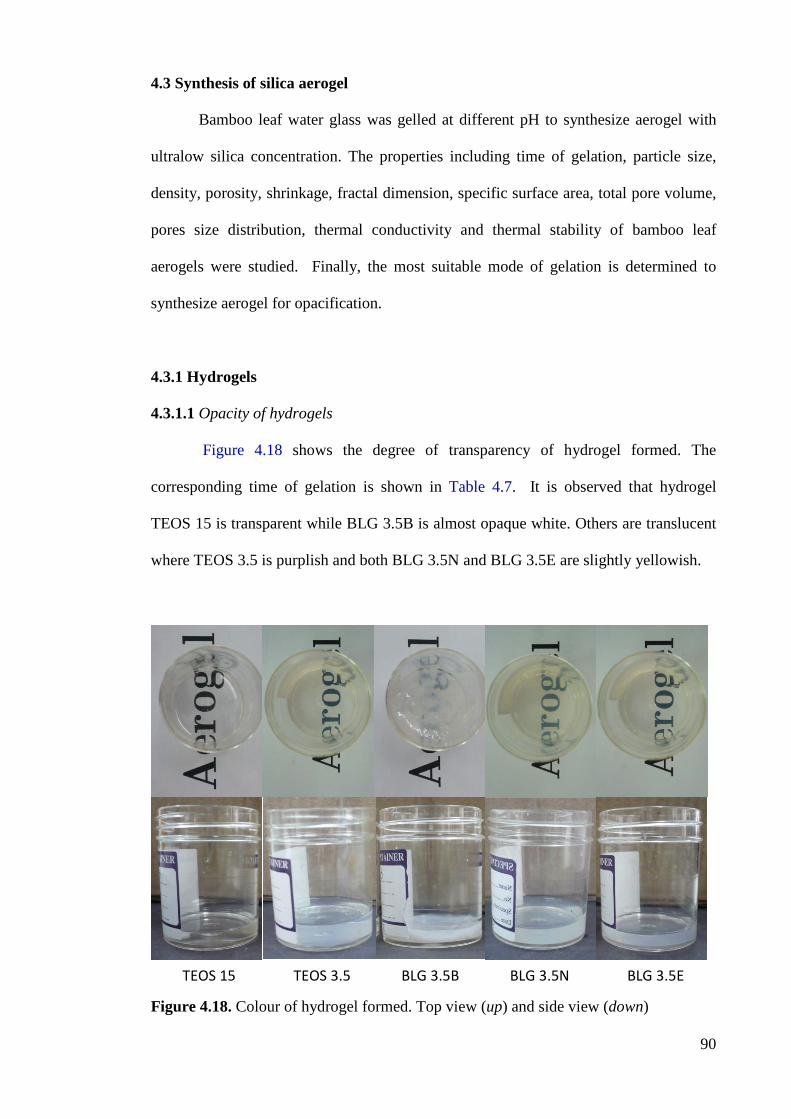
90
4.3 Synthesis of silica aerogel
Bamboo leaf water glass was gelled at different pH to synthesize aerogel with
ultralow silica concentration. The properties including time of gelation, particle size,
density, porosity, shrinkage, fractal dimension, specific surface area, total pore volume,
pores size distribution, thermal conductivity and thermal stability of bamboo leaf
aerogels were studied. Finally, the most suitable mode of gelation is determined to
synthesize aerogel for opacification.
4.3.1 Hydrogels 4.3.1.1 Opacity of hydrogels
Figure 4.18 shows the degree of transparency of hydrogel formed. The
corresponding time of gelation is shown in Table 4.7. It is observed that hydrogel
TEOS 15 is transparent while BLG 3.5B is almost opaque white. Others are translucent
where TEOS 3.5 is purplish and both BLG 3.5N and BLG 3.5E are slightly yellowish.
Figure 4.18. Colour of hydrogel formed. Top view (up) and side view (down)
TEOS 15 TEOS 3.5 BLG 3.5B BLG 3.5N BLG 3.5E
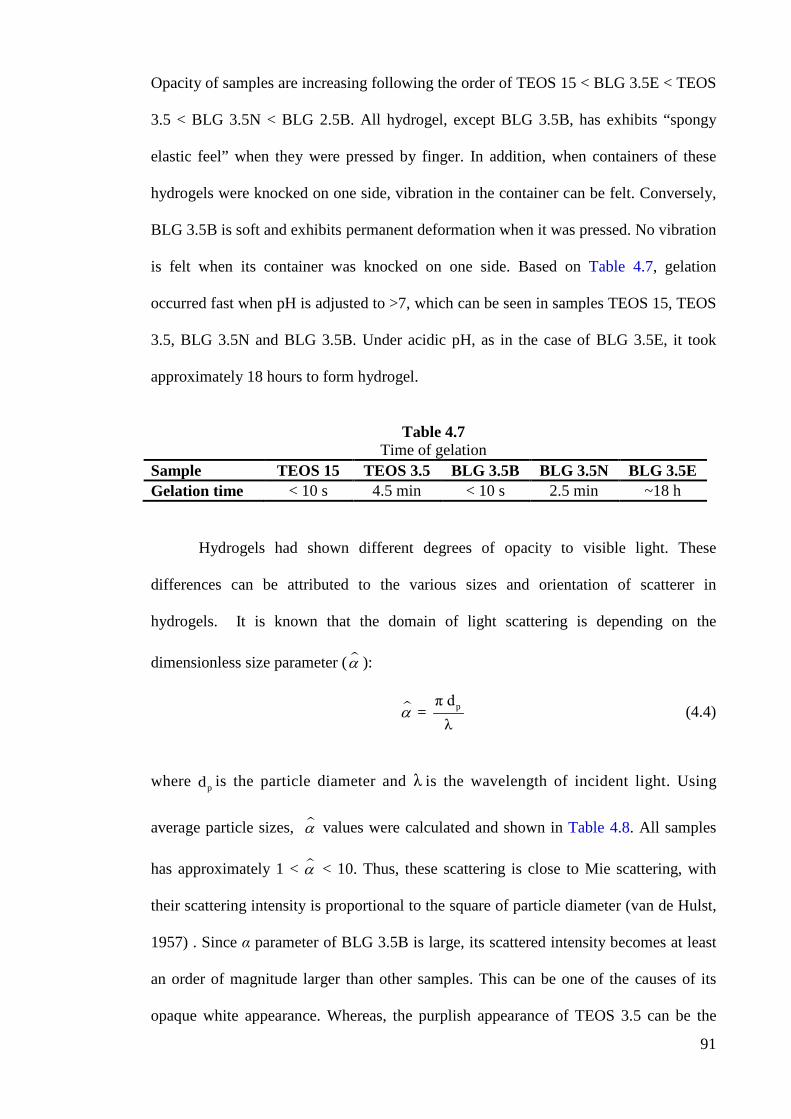
91
Opacity of samples are increasing following the order of TEOS 15 < BLG 3.5E < TEOS
3.5 < BLG 3.5N < BLG 2.5B. All hydrogel, except BLG 3.5B, has exhibits “spongy
elastic feel” when they were pressed by finger. In addition, when containers of these
hydrogels were knocked on one side, vibration in the container can be felt. Conversely,
BLG 3.5B is soft and exhibits permanent deformation when it was pressed. No vibration
is felt when its container was knocked on one side. Based on Table 4.7, gelation
occurred fast when pH is adjusted to >7, which can be seen in samples TEOS 15, TEOS
3.5, BLG 3.5N and BLG 3.5B. Under acidic pH, as in the case of BLG 3.5E, it took
approximately 18 hours to form hydrogel.
Table 4.7
Time of gelation Sample TEOS 15 TEOS 3.5 BLG 3.5B BLG 3.5N BLG 3.5E Gelation time < 10 s 4.5 min < 10 s 2.5 min ~18 h
Hydrogels had shown different degrees of opacity to visible light. These
differences can be attributed to the various sizes and orientation of scatterer in
hydrogels. It is known that the domain of light scattering is depending on the
dimensionless size parameter ( α ):
pπ d =
λα (4.4)
where pd is the particle diameter and λ is the wavelength of incident light. Using
average particle sizes, α values were calculated and shown in Table 4.8. All samples
has approximately 1 < α < 10. Thus, these scattering is close to Mie scattering, with
their scattering intensity is proportional to the square of particle diameter (van de Hulst,
1957) . Since α parameter of BLG 3.5B is large, its scattered intensity becomes at least
an order of magnitude larger than other samples. This can be one of the causes of its
opaque white appearance. Whereas, the purplish appearance of TEOS 3.5 can be the
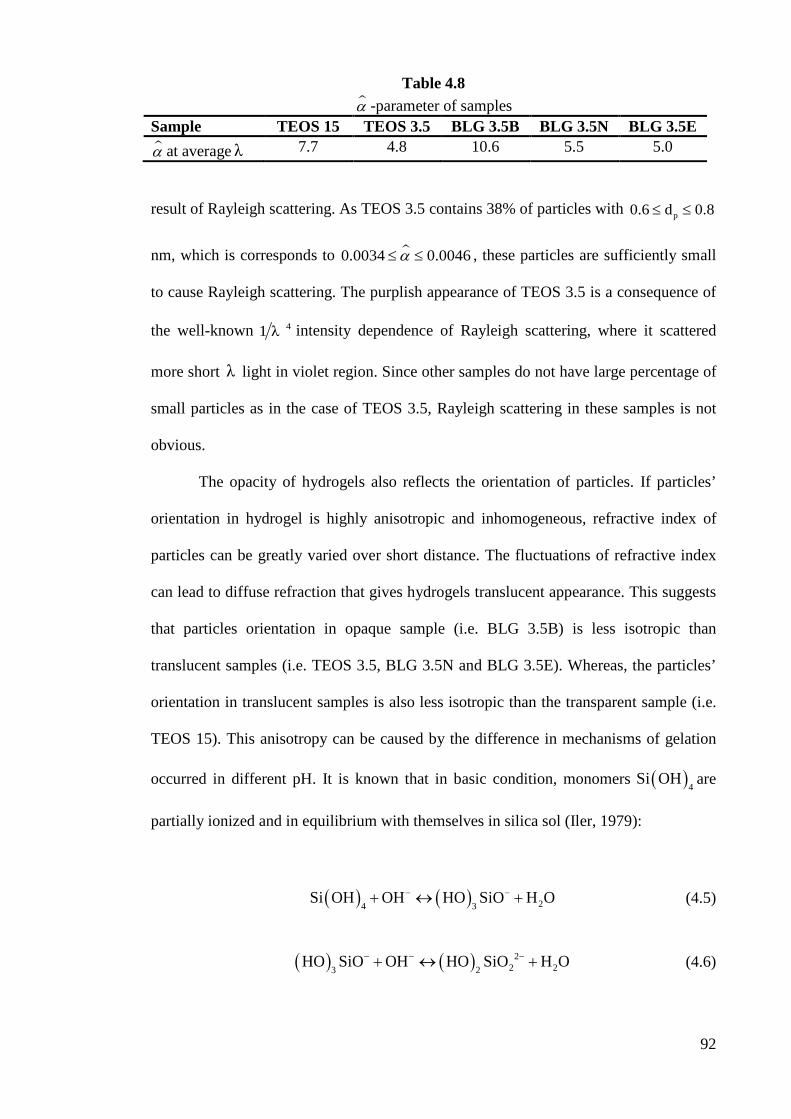
92
Table 4.8 α -parameter of samples
Sample TEOS 15 TEOS 3.5 BLG 3.5B BLG 3.5N BLG 3.5E α at average λ 7.7 4.8 10.6 5.5 5.0
result of Rayleigh scattering. As TEOS 3.5 contains 38% of particles with p0.6 d 0.8≤ ≤
nm, which is corresponds to 0.0034 0.0046α≤ ≤ , these particles are sufficiently small
to cause Rayleigh scattering. The purplish appearance of TEOS 3.5 is a consequence of
the well-known 41 λ intensity dependence of Rayleigh scattering, where it scattered
more short λ light in violet region. Since other samples do not have large percentage of
small particles as in the case of TEOS 3.5, Rayleigh scattering in these samples is not
obvious.
The opacity of hydrogels also reflects the orientation of particles. If particles’
orientation in hydrogel is highly anisotropic and inhomogeneous, refractive index of
particles can be greatly varied over short distance. The fluctuations of refractive index
can lead to diffuse refraction that gives hydrogels translucent appearance. This suggests
that particles orientation in opaque sample (i.e. BLG 3.5B) is less isotropic than
translucent samples (i.e. TEOS 3.5, BLG 3.5N and BLG 3.5E). Whereas, the particles’
orientation in translucent samples is also less isotropic than the transparent sample (i.e.
TEOS 15). This anisotropy can be caused by the difference in mechanisms of gelation
occurred in different pH. It is known that in basic condition, monomers ( )4Si OH are
partially ionized and in equilibrium with themselves in silica sol (Iler, 1979):
( ) ( ) 24 3Si OH OH HO SiO H O− −+ ↔ + (4.5)
( ) ( ) 22 23 2
HO SiO OH HO SiO H O− − −+ ↔ + (4.6)
93
In addition, other polymeric ionic species including 3HSiO − and ( )5Si OH − also
can present in the sol solution (Iler, 1979). When pH of sol decreased (pH ~ 9), some of
these ionic species condensed to form siloxane bond. However, due to ionic repulsion,
only part of these ionic sites can turn into siloxane bond. As a result, the local number
of bridging oxygen between silicon atoms ( Qn , 0 4n≤ ≤ ) can varied greatly across the
gel. This agreed with NMR study reported (Li et al., 2013), where the percentage of Qn
in gel formed in base (pH 9.9) shown the order of 3 4 2Q Q Q> > (51:31:18 %). The
NMR results also shown that gel formed at pH 3 has 4 3 2Q Q Q> > (57:37:6 %), i.e. 2Q
and 3Q present in gels formed at pH 9.9 has greatly outnumber those formed at pH 3.
The distribution of 2 4Q Q− becomes less narrow in gel formed in basic condition. This
causes significant fluctuations in density and refractive index in the gel, inducing severe
diffuse refraction which makes gel opaque.
Conversely, under acidic condition, ( )4Si OH monomers condensed slowly in
quasi-equilibrium manner. Siloxane bonds formed are more isotropic (higher fraction of
4Q ). Therefore, refraction index is relatively constant across the hydrogel, which
making them transparent or translucent. BLG 3.5E gelled very slowly (Table 4.7) in
acidic pH, the non-uniformity in the gel is low and therefore more transparent than
others. TEOS 3.5 and BLG 3.5N that gelled at pH 7 are less transparent than BLG 3.5E
because gelation occurred fast in neutral pH, and induced certain degree of non-
uniformity in the density of gel. However, this is different when the concentration of
silica is high in TEOS 15. As silica concentration increased, monomers of silicic acid
are sufficiently close to each other and tend to condense all the four silanol groups at
high rate. Hence, most silicon has 4Q and refractive index is constant. This makes
TEOS 15 transparent.
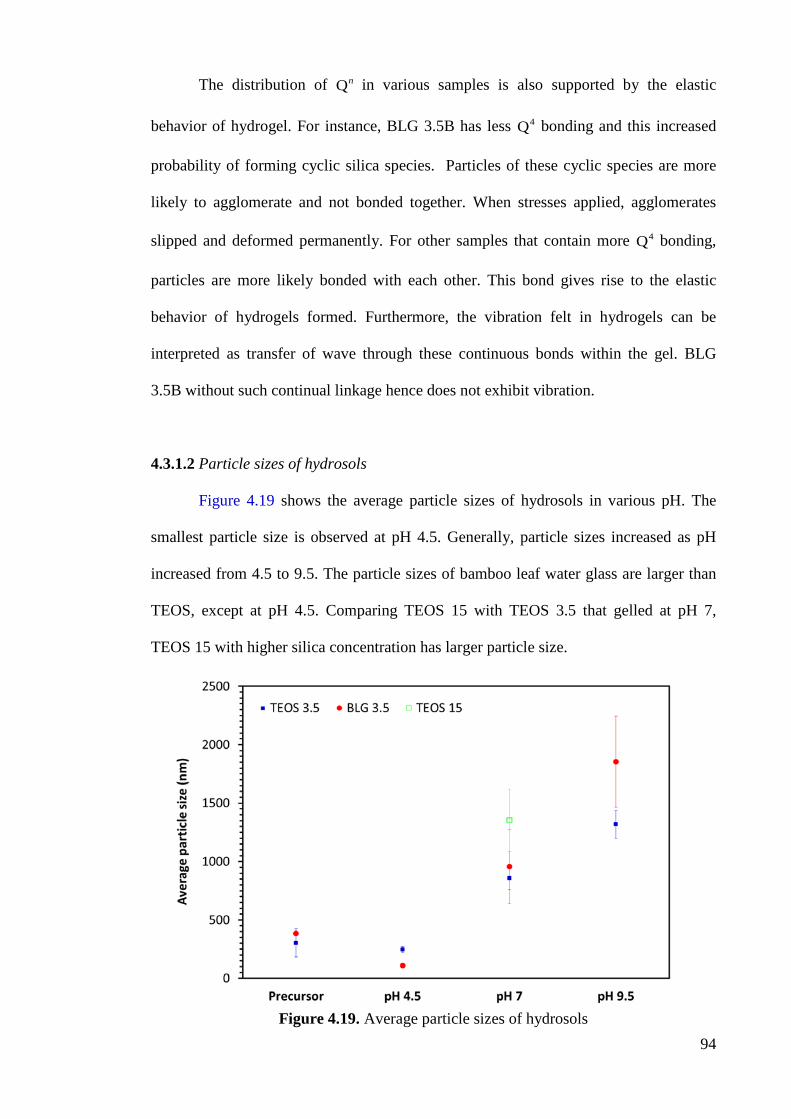
94
The distribution of Qn in various samples is also supported by the elastic
behavior of hydrogel. For instance, BLG 3.5B has less 4Q bonding and this increased
probability of forming cyclic silica species. Particles of these cyclic species are more
likely to agglomerate and not bonded together. When stresses applied, agglomerates
slipped and deformed permanently. For other samples that contain more 4Q bonding,
particles are more likely bonded with each other. This bond gives rise to the elastic
behavior of hydrogels formed. Furthermore, the vibration felt in hydrogels can be
interpreted as transfer of wave through these continuous bonds within the gel. BLG
3.5B without such continual linkage hence does not exhibit vibration.
4.3.1.2 Particle sizes of hydrosols
Figure 4.19 shows the average particle sizes of hydrosols in various pH. The
smallest particle size is observed at pH 4.5. Generally, particle sizes increased as pH
increased from 4.5 to 9.5. The particle sizes of bamboo leaf water glass are larger than
TEOS, except at pH 4.5. Comparing TEOS 15 with TEOS 3.5 that gelled at pH 7,
TEOS 15 with higher silica concentration has larger particle size.
Figure 4.19. Average particle sizes of hydrosols
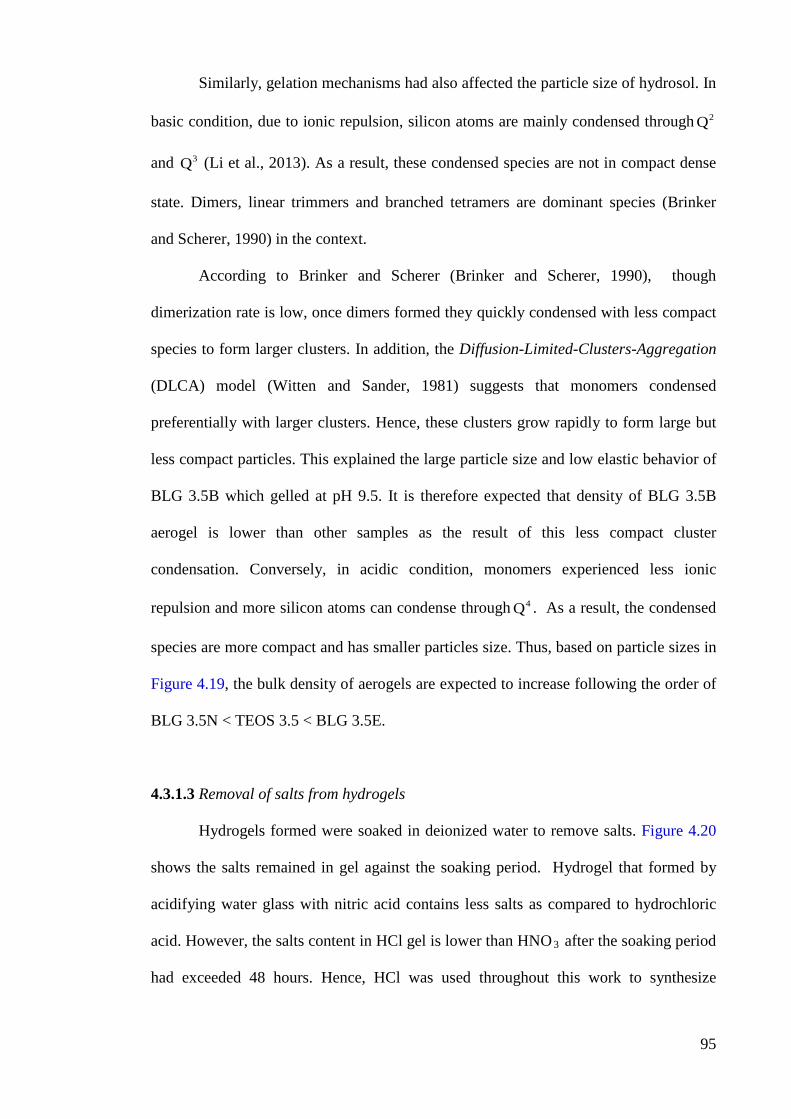
95
Similarly, gelation mechanisms had also affected the particle size of hydrosol. In
basic condition, due to ionic repulsion, silicon atoms are mainly condensed through 2Q
and 3Q (Li et al., 2013). As a result, these condensed species are not in compact dense
state. Dimers, linear trimmers and branched tetramers are dominant species (Brinker
and Scherer, 1990) in the context.
According to Brinker and Scherer (Brinker and Scherer, 1990), though
dimerization rate is low, once dimers formed they quickly condensed with less compact
species to form larger clusters. In addition, the Diffusion-Limited-Clusters-Aggregation
(DLCA) model (Witten and Sander, 1981) suggests that monomers condensed
preferentially with larger clusters. Hence, these clusters grow rapidly to form large but
less compact particles. This explained the large particle size and low elastic behavior of
BLG 3.5B which gelled at pH 9.5. It is therefore expected that density of BLG 3.5B
aerogel is lower than other samples as the result of this less compact cluster
condensation. Conversely, in acidic condition, monomers experienced less ionic
repulsion and more silicon atoms can condense through 4Q . As a result, the condensed
species are more compact and has smaller particles size. Thus, based on particle sizes in
Figure 4.19, the bulk density of aerogels are expected to increase following the order of
BLG 3.5N < TEOS 3.5 < BLG 3.5E.
4.3.1.3 Removal of salts from hydrogels
Hydrogels formed were soaked in deionized water to remove salts. Figure 4.20
shows the salts remained in gel against the soaking period. Hydrogel that formed by
acidifying water glass with nitric acid contains less salts as compared to hydrochloric
acid. However, the salts content in HCl gel is lower than HNO3 after the soaking period
had exceeded 48 hours. Hence, HCl was used throughout this work to synthesize
96
aerogel. Hydrogels formed were soaked in deionized water for 48 hours before
subjected to further processing.
Figure 4.20. Degree of salts removal in hydrogels as a function of soaking period
4.3.2 Aerogels 4.3.2.1 Visual observation
Figure 4.21 shows appearance of silica aerogel synthesized from bio-silica
before and after supercritical drying. Aerogels obtained are white in colour with little
bluish ray scattered off the surface. This is due to Rayleigh scattering where short
wavelength visible light are scattered by nano size particles within aerogel. It was seems
that aerogels obtained are not transparent. However, it is then discovered that when
intense light are directed on aerogels, part of the light transmitted through the aerogel
giving off yellowish light on surrounding objects. This is evidenced from Figure 4.21(c
& d), where photographs were taken on aerogels with and without camera flash. As
light in blue region was scattered more by silica aerogel, light with longer wavelength
(next to infrared region) transmitted through the aerogel which produced yellowish
image.
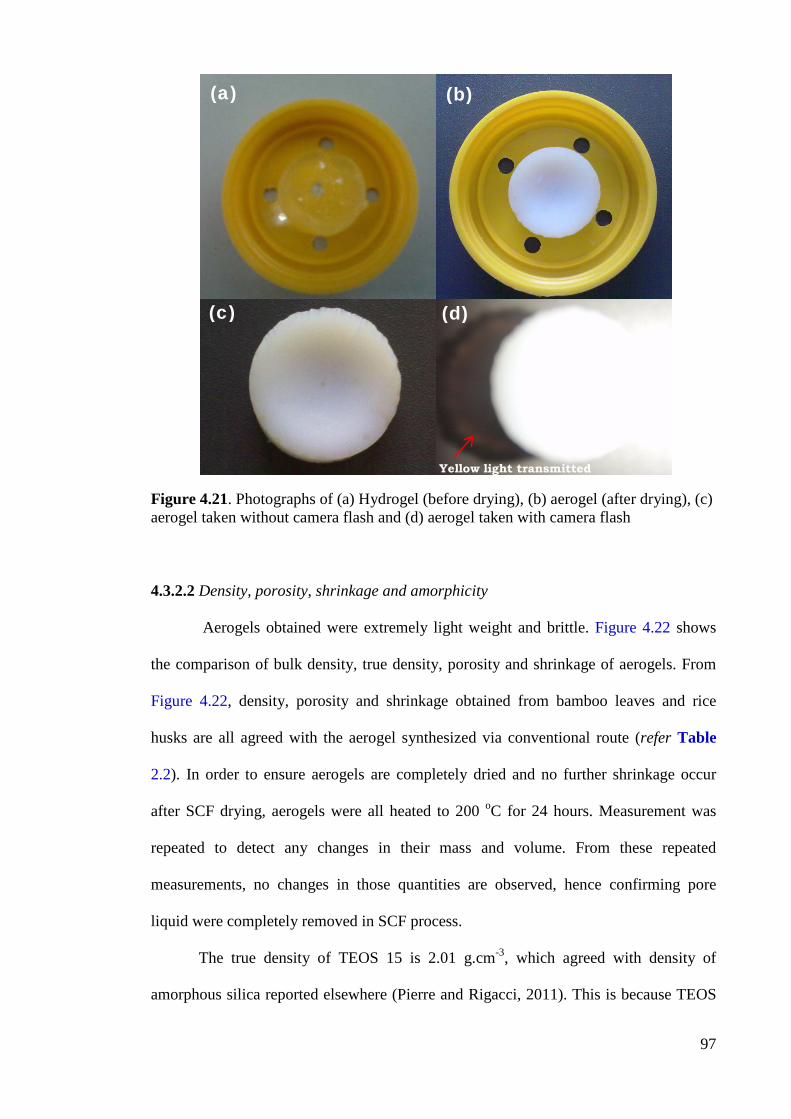
97
Figure 4.21. Photographs of (a) Hydrogel (before drying), (b) aerogel (after drying), (c) aerogel taken without camera flash and (d) aerogel taken with camera flash
4.3.2.2 Density, porosity, shrinkage and amorphicity
Aerogels obtained were extremely light weight and brittle. Figure 4.22 shows
the comparison of bulk density, true density, porosity and shrinkage of aerogels. From
Figure 4.22, density, porosity and shrinkage obtained from bamboo leaves and rice
husks are all agreed with the aerogel synthesized via conventional route (refer Table
2.2). In order to ensure aerogels are completely dried and no further shrinkage occur
after SCF drying, aerogels were all heated to 200 oC for 24 hours. Measurement was
repeated to detect any changes in their mass and volume. From these repeated
measurements, no changes in those quantities are observed, hence confirming pore
liquid were completely removed in SCF process.
The true density of TEOS 15 is 2.01 g.cm-3, which agreed with density of
amorphous silica reported elsewhere (Pierre and Rigacci, 2011). This is because TEOS
(a) (b)
(c) (d)
Yellow light transmitted
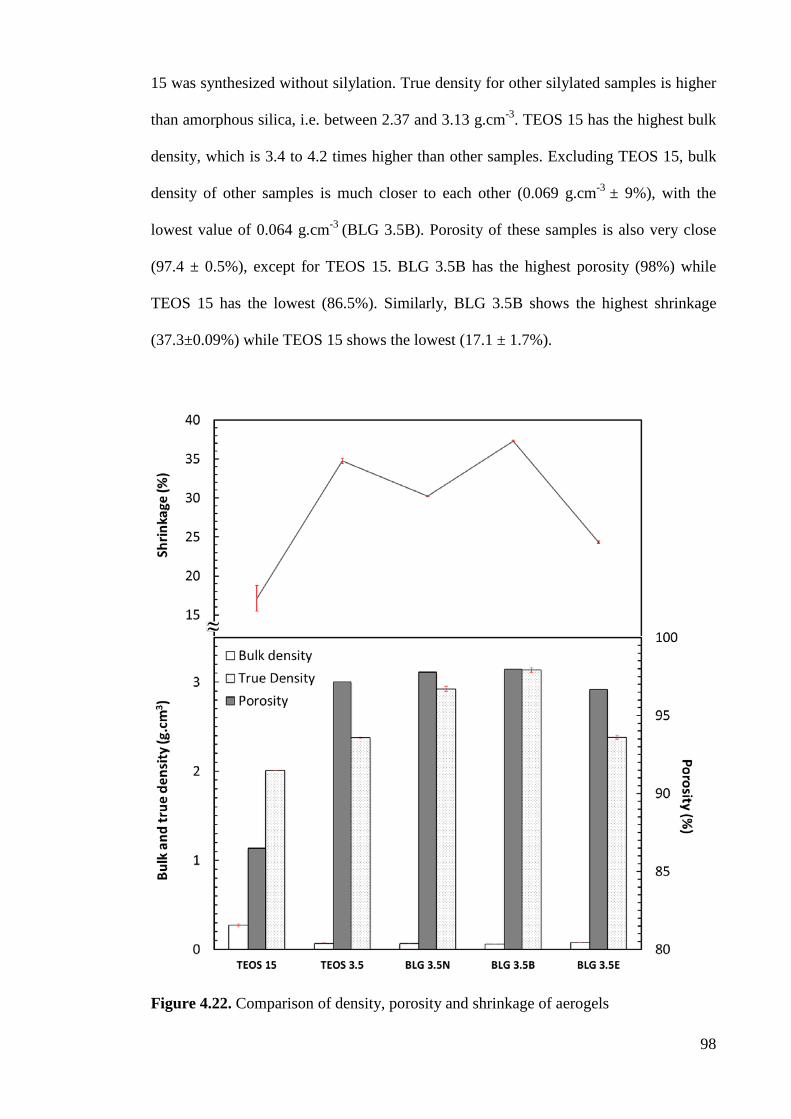
98
15 was synthesized without silylation. True density for other silylated samples is higher
than amorphous silica, i.e. between 2.37 and 3.13 g.cm-3. TEOS 15 has the highest bulk
density, which is 3.4 to 4.2 times higher than other samples. Excluding TEOS 15, bulk
density of other samples is much closer to each other (0.069 g.cm-3 ± 9%), with the
lowest value of 0.064 g.cm-3 (BLG 3.5B). Porosity of these samples is also very close
(97.4 ± 0.5%), except for TEOS 15. BLG 3.5B has the highest porosity (98%) while
TEOS 15 has the lowest (86.5%). Similarly, BLG 3.5B shows the highest shrinkage
(37.3±0.09%) while TEOS 15 shows the lowest (17.1 ± 1.7%).
Figure 4.22. Comparison of density, porosity and shrinkage of aerogels
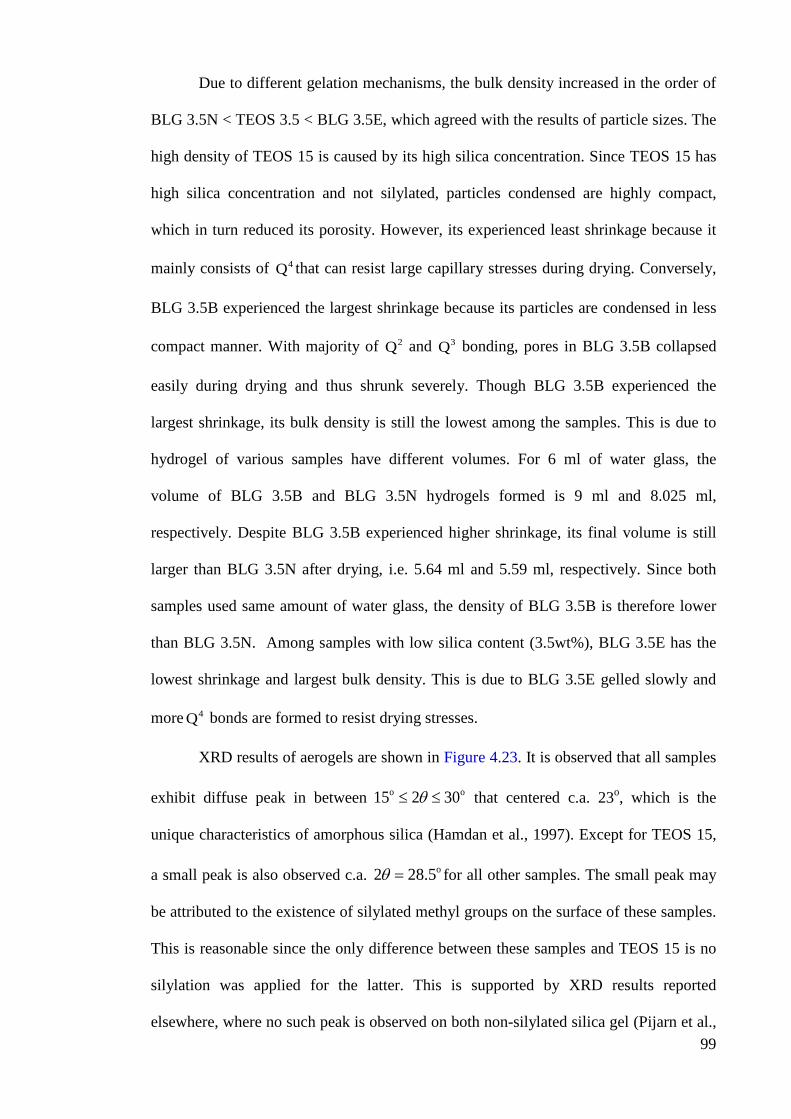
99
Due to different gelation mechanisms, the bulk density increased in the order of
BLG 3.5N < TEOS 3.5 < BLG 3.5E, which agreed with the results of particle sizes. The
high density of TEOS 15 is caused by its high silica concentration. Since TEOS 15 has
high silica concentration and not silylated, particles condensed are highly compact,
which in turn reduced its porosity. However, its experienced least shrinkage because it
mainly consists of 4Q that can resist large capillary stresses during drying. Conversely,
BLG 3.5B experienced the largest shrinkage because its particles are condensed in less
compact manner. With majority of 2Q and 3Q bonding, pores in BLG 3.5B collapsed
easily during drying and thus shrunk severely. Though BLG 3.5B experienced the
largest shrinkage, its bulk density is still the lowest among the samples. This is due to
hydrogel of various samples have different volumes. For 6 ml of water glass, the
volume of BLG 3.5B and BLG 3.5N hydrogels formed is 9 ml and 8.025 ml,
respectively. Despite BLG 3.5B experienced higher shrinkage, its final volume is still
larger than BLG 3.5N after drying, i.e. 5.64 ml and 5.59 ml, respectively. Since both
samples used same amount of water glass, the density of BLG 3.5B is therefore lower
than BLG 3.5N. Among samples with low silica content (3.5wt%), BLG 3.5E has the
lowest shrinkage and largest bulk density. This is due to BLG 3.5E gelled slowly and
more 4Q bonds are formed to resist drying stresses.
XRD results of aerogels are shown in Figure 4.23. It is observed that all samples
exhibit diffuse peak in between o o15 2 30q≤ ≤ that centered c.a. 23o, which is the
unique characteristics of amorphous silica (Hamdan et al., 1997). Except for TEOS 15,
a small peak is also observed c.a. o2 28.5q = for all other samples. The small peak may
be attributed to the existence of silylated methyl groups on the surface of these samples.
This is reasonable since the only difference between these samples and TEOS 15 is no
silylation was applied for the latter. This is supported by XRD results reported
elsewhere, where no such peak is observed on both non-silylated silica gel (Pijarn et al.,
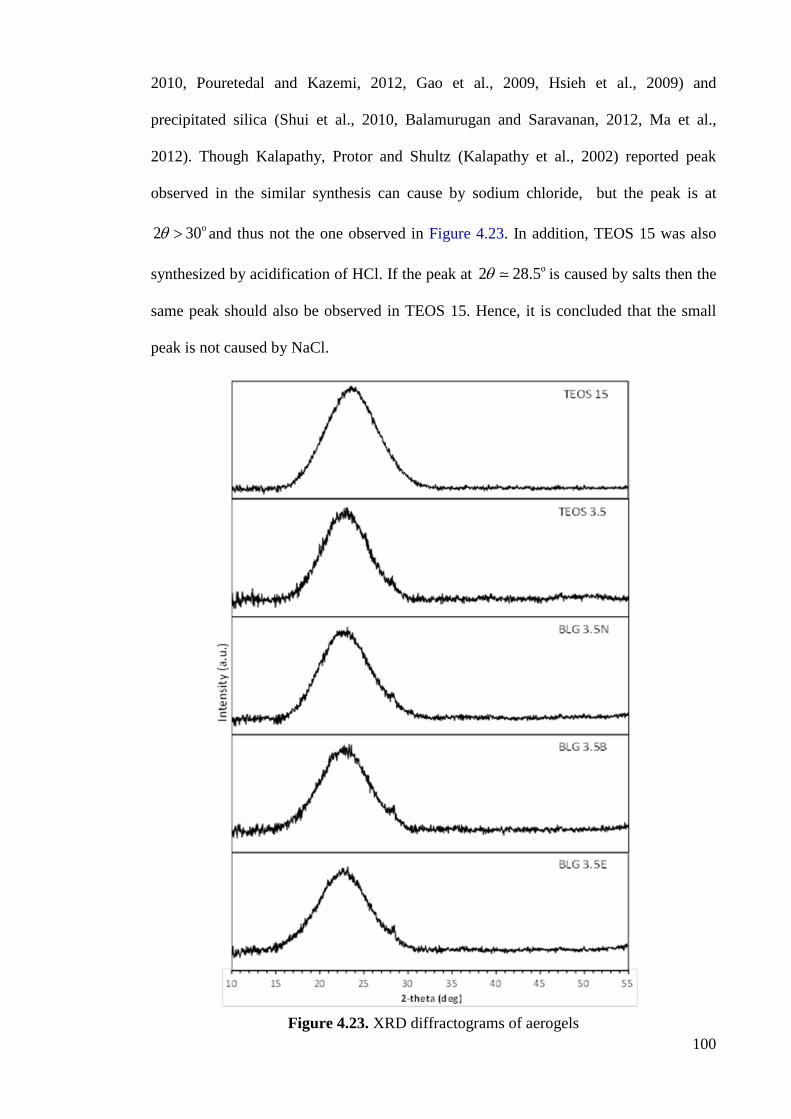
100
2010, Pouretedal and Kazemi, 2012, Gao et al., 2009, Hsieh et al., 2009) and
precipitated silica (Shui et al., 2010, Balamurugan and Saravanan, 2012, Ma et al.,
2012). Though Kalapathy, Protor and Shultz (Kalapathy et al., 2002) reported peak
observed in the similar synthesis can cause by sodium chloride, but the peak is at
o2 30q > and thus not the one observed in Figure 4.23. In addition, TEOS 15 was also
synthesized by acidification of HCl. If the peak at o2 28.5q . is caused by salts then the
same peak should also be observed in TEOS 15. Hence, it is concluded that the small
peak is not caused by NaCl.
Figure 4.23. XRD diffractograms of aerogels
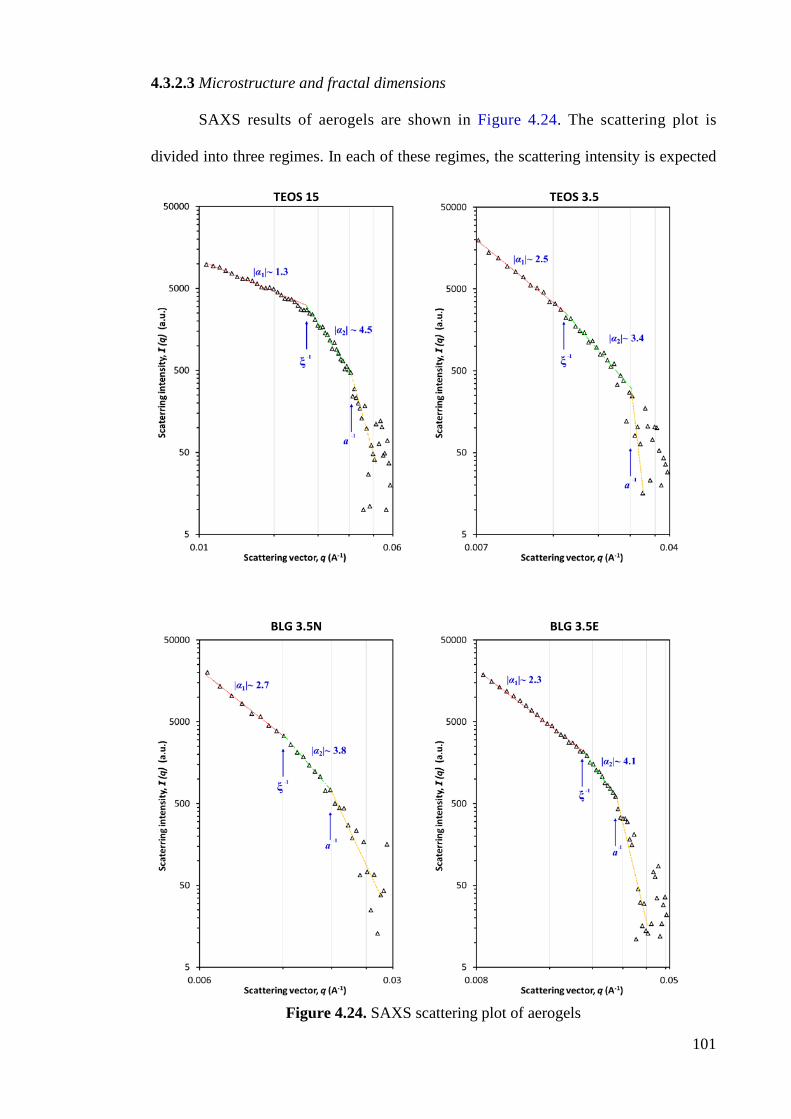
101
4.3.2.3 Microstructure and fractal dimensions
SAXS results of aerogels are shown in Figure 4.24. The scattering plot is
divided into three regimes. In each of these regimes, the scattering intensity is expected
Figure 4.24. SAXS scattering plot of aerogels
TEOS 15 TEOS 3.5
BLG 3.5N BLG 3.5E
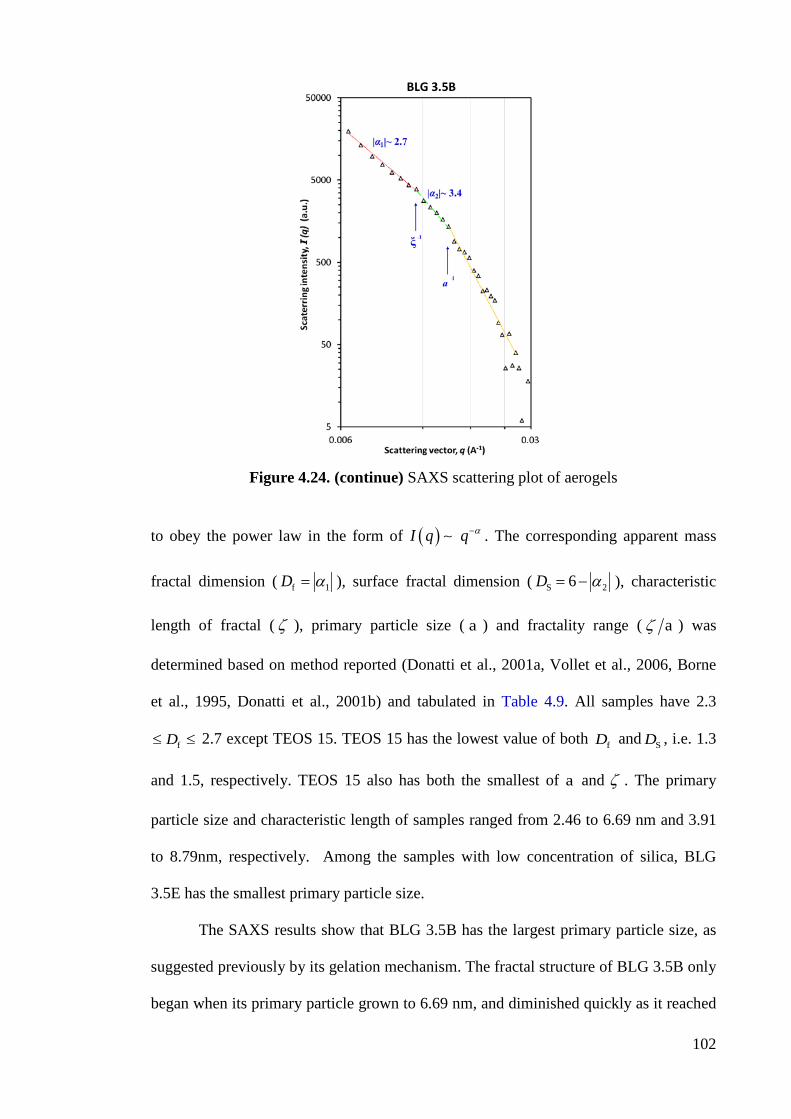
102
Figure 4.24. (continue) SAXS scattering plot of aerogels
to obey the power law in the form of ( ) I q q α−
− . The corresponding apparent mass
fractal dimension ( f 1D α= ), surface fractal dimension ( S 26D α= − ), characteristic
length of fractal ( ζ ), primary particle size ( a ) and fractality range ( aζ ) was
determined based on method reported (Donatti et al., 2001a, Vollet et al., 2006, Borne
et al., 1995, Donatti et al., 2001b) and tabulated in Table 4.9. All samples have 2.3
fD≤ ≤ 2.7 except TEOS 15. TEOS 15 has the lowest value of both fD and SD , i.e. 1.3
and 1.5, respectively. TEOS 15 also has both the smallest of a and ζ . The primary
particle size and characteristic length of samples ranged from 2.46 to 6.69 nm and 3.91
to 8.79nm, respectively. Among the samples with low concentration of silica, BLG
3.5E has the smallest primary particle size.
The SAXS results show that BLG 3.5B has the largest primary particle size, as
suggested previously by its gelation mechanism. The fractal structure of BLG 3.5B only
began when its primary particle grown to 6.69 nm, and diminished quickly as it reached
BLG 3.5B
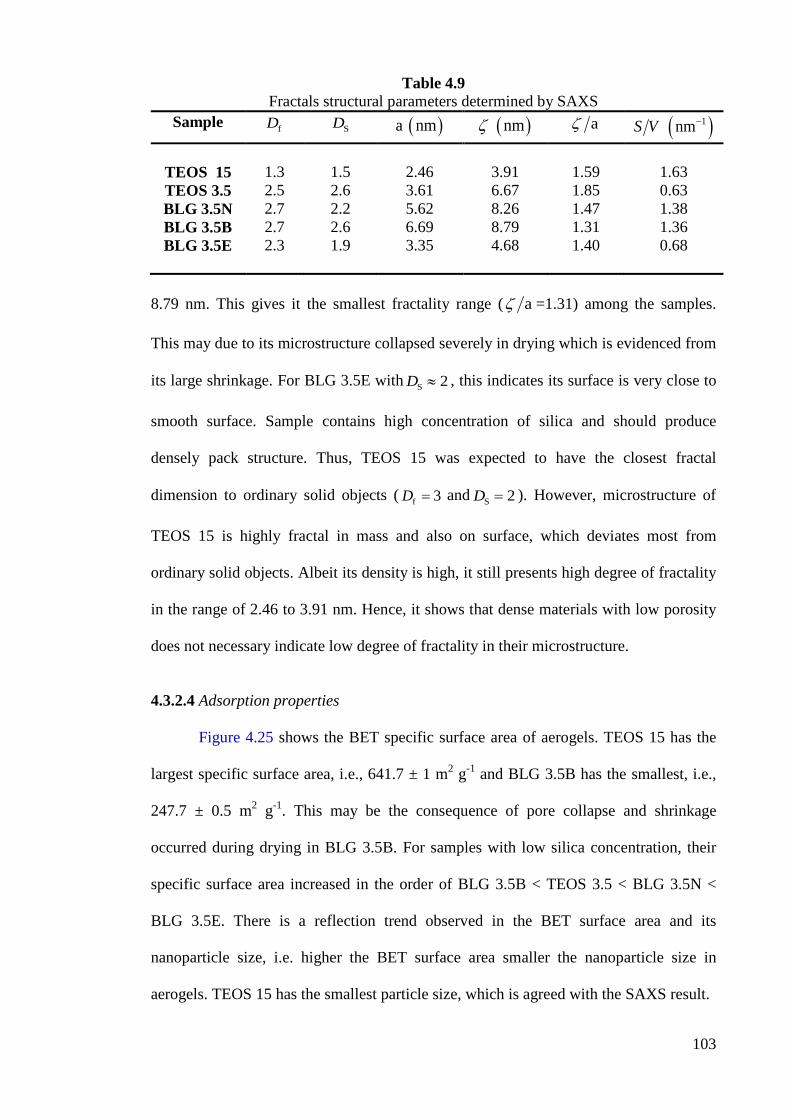
103
Table 4.9 Fractals structural parameters determined by SAXS
Sample fD SD ( )a nm ( ) nmζ aζ ( )1 nmS V −
TEOS 15 TEOS 3.5 BLG 3.5N BLG 3.5B BLG 3.5E
1.3 2.5 2.7 2.7 2.3
1.5 2.6 2.2 2.6 1.9
2.46 3.61 5.62 6.69 3.35
3.91 6.67 8.26 8.79 4.68
1.59 1.85 1.47 1.31 1.40
1.63 0.63 1.38 1.36 0.68
8.79 nm. This gives it the smallest fractality range ( aζ =1.31) among the samples.
This may due to its microstructure collapsed severely in drying which is evidenced from
its large shrinkage. For BLG 3.5E with S 2D ≈ , this indicates its surface is very close to
smooth surface. Sample contains high concentration of silica and should produce
densely pack structure. Thus, TEOS 15 was expected to have the closest fractal
dimension to ordinary solid objects ( f 3D = and S 2D = ). However, microstructure of
TEOS 15 is highly fractal in mass and also on surface, which deviates most from
ordinary solid objects. Albeit its density is high, it still presents high degree of fractality
in the range of 2.46 to 3.91 nm. Hence, it shows that dense materials with low porosity
does not necessary indicate low degree of fractality in their microstructure.
4.3.2.4 Adsorption properties
Figure 4.25 shows the BET specific surface area of aerogels. TEOS 15 has the
largest specific surface area, i.e., 641.7 ± 1 m2 g-1 and BLG 3.5B has the smallest, i.e.,
247.7 ± 0.5 m2 g-1. This may be the consequence of pore collapse and shrinkage
occurred during drying in BLG 3.5B. For samples with low silica concentration, their
specific surface area increased in the order of BLG 3.5B < TEOS 3.5 < BLG 3.5N <
BLG 3.5E. There is a reflection trend observed in the BET surface area and its
nanoparticle size, i.e. higher the BET surface area smaller the nanoparticle size in
aerogels. TEOS 15 has the smallest particle size, which is agreed with the SAXS result.
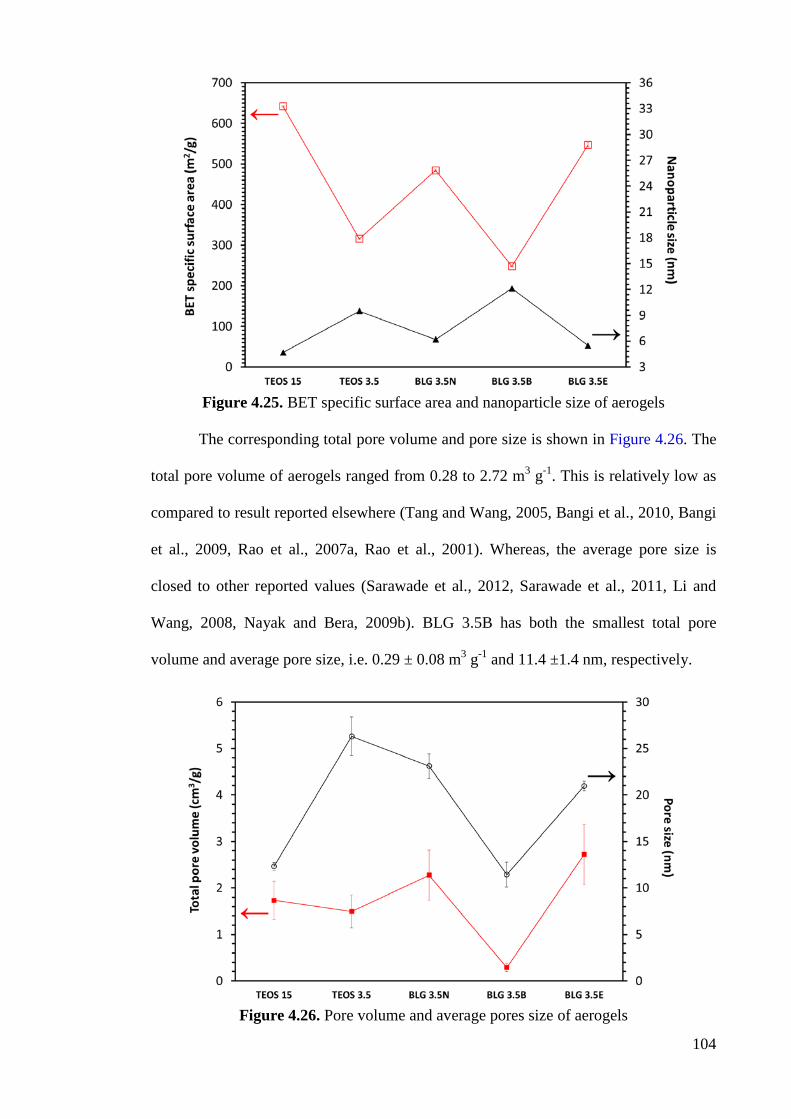
104
Figure 4.25. BET specific surface area and nanoparticle size of aerogels
The corresponding total pore volume and pore size is shown in Figure 4.26. The
total pore volume of aerogels ranged from 0.28 to 2.72 m3 g-1. This is relatively low as
compared to result reported elsewhere (Tang and Wang, 2005, Bangi et al., 2010, Bangi
et al., 2009, Rao et al., 2007a, Rao et al., 2001). Whereas, the average pore size is
closed to other reported values (Sarawade et al., 2012, Sarawade et al., 2011, Li and
Wang, 2008, Nayak and Bera, 2009b). BLG 3.5B has both the smallest total pore
volume and average pore size, i.e. 0.29 ± 0.08 m3 g-1 and 11.4 ±1.4 nm, respectively.
Figure 4.26. Pore volume and average pores size of aerogels
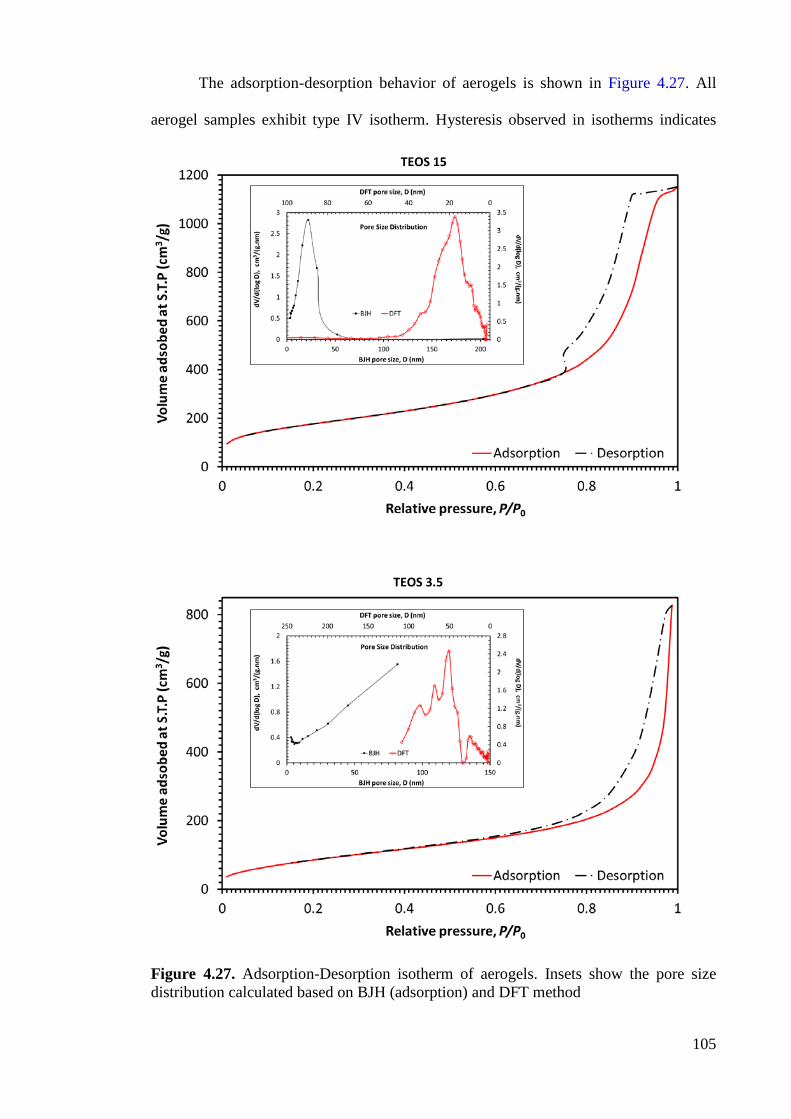
105
The adsorption-desorption behavior of aerogels is shown in Figure 4.27. All
aerogel samples exhibit type IV isotherm. Hysteresis observed in isotherms indicates
Figure 4.27. Adsorption-Desorption isotherm of aerogels. Insets show the pore size distribution calculated based on BJH (adsorption) and DFT method
TEOS 15
TEOS 3.5
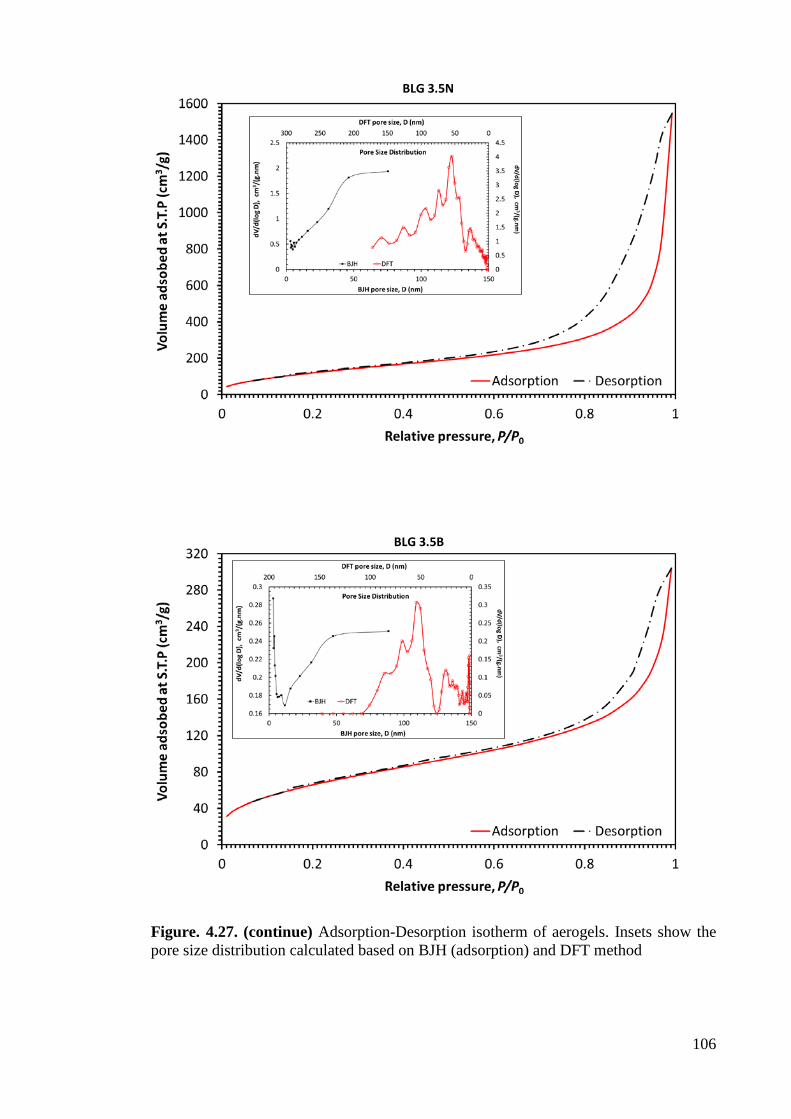
106
Figure. 4.27. (continue) Adsorption-Desorption isotherm of aerogels. Insets show the pore size distribution calculated based on BJH (adsorption) and DFT method
BLG 3.5N
BLG 3.5B
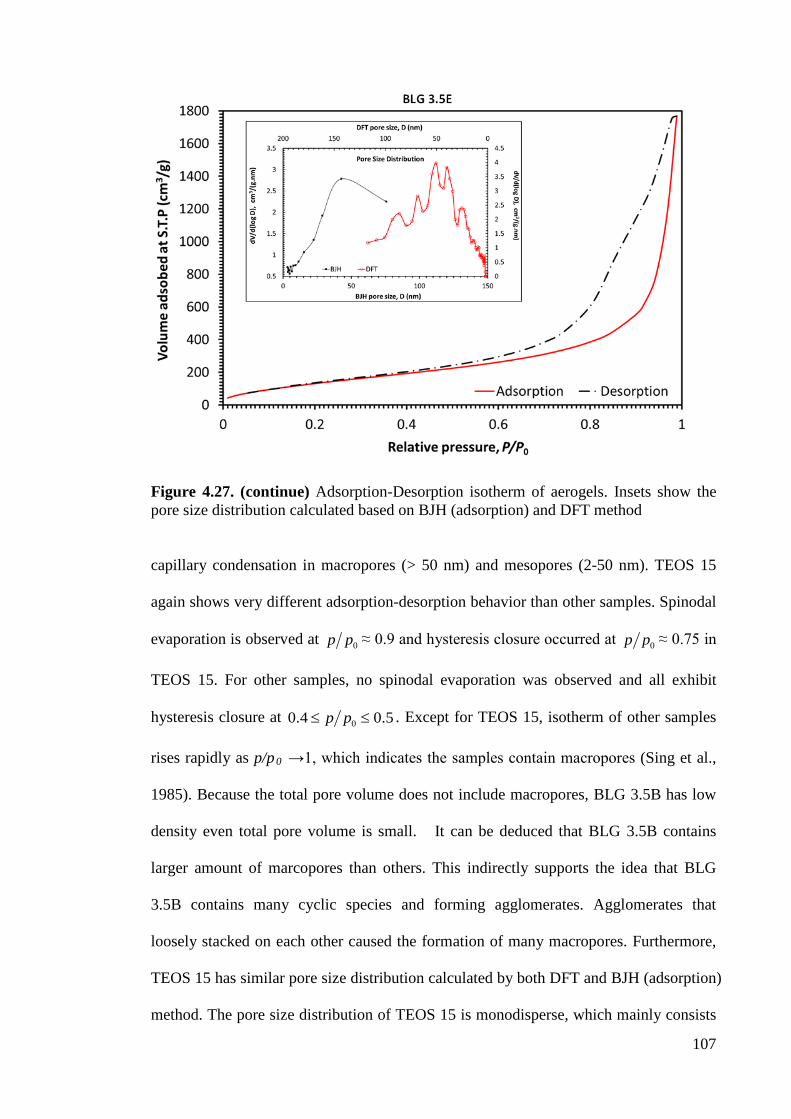
107
Figure 4.27. (continue) Adsorption-Desorption isotherm of aerogels. Insets show the pore size distribution calculated based on BJH (adsorption) and DFT method
capillary condensation in macropores (> 50 nm) and mesopores (2-50 nm). TEOS 15
again shows very different adsorption-desorption behavior than other samples. Spinodal
evaporation is observed at 0p p ≈ 0.9 and hysteresis closure occurred at 0p p ≈ 0.75 in
TEOS 15. For other samples, no spinodal evaporation was observed and all exhibit
hysteresis closure at 00.4 0.5p p≤ ≤ . Except for TEOS 15, isotherm of other samples
rises rapidly as p/p0 →1, which indicates the samples contain macropores (Sing et al.,
1985). Because the total pore volume does not include macropores, BLG 3.5B has low
density even total pore volume is small. It can be deduced that BLG 3.5B contains
larger amount of marcopores than others. This indirectly supports the idea that BLG
3.5B contains many cyclic species and forming agglomerates. Agglomerates that
loosely stacked on each other caused the formation of many macropores. Furthermore,
TEOS 15 has similar pore size distribution calculated by both DFT and BJH (adsorption)
method. The pore size distribution of TEOS 15 is monodisperse, which mainly consists
108
of mesopores that centered c.a. 20 nm. For other samples, the pore size distributions
calculated by DFT are very different from those calculated via BJH (adsorption) method.
The BJH pore size distribution of these samples mainly consists of macropores (> 50
nm). The BJH pore size distribution of BLG 3.5B is also different from others, where it
contains large proportion of small pores (< 5nm). Unlike result calculated via BJH
method, DFT pore size distribution of samples with low silica concentration show high
degree of polydispersity. These samples have the largest proportion of pores in size of ≈
50 nm. They also contain relatively high proportion of pores in size of approximately 25,
80 and 100 nm. Among all samples, only TEOS 15 and BLG 3.5B contains micropores
(< 2 nm), i.e. 1.9% and 9.3% respectively. The existence of micropores in TEOS 15 and
BLG 3.5B causes their average pore size was only about half of other samples.
The adsorption-desorption isotherms with hysteresis closure at 0p p ≈ 0.4 can
be interpreted as the existence of considerable amount of medium and small mesopores
in the samples. This explains the very different pore size distribution obtained via BJH
and DFT method. As BJH can underestimate size of small to medium mesopores, it
failed to detect micropores (Lowell et al., 2004). The difference also indicates the
assumption of cylindrical pores in BJH method is inappropriate in this context, except
in TEOS 15. The pore size distribution of TEOS 15 estimated by both BJH and DFT
methods are similar. This suggests that TEOS 15 has different pore geometry than other
samples, i.e. TEOS 15 mainly consists of cylindrical pores. The development of
micropores in TEOS 15 and BLG 3.5B may be correlated to their rapid gelation (refer
to Table 4.7). Hence, it is proposed if particles condensed quickly to induce “instant”
rigidity on gel, it can prevent sequential growth on particles and eventually preserve
micropores formed in early stage of condensation. On the other hand, if sol particles
took longer time to gel (TEOS 3.5, BLG 3.5N and BLG 3.5E), particles are allowed to
grow slowly in the proximity of micropores. This may eliminate proportion of
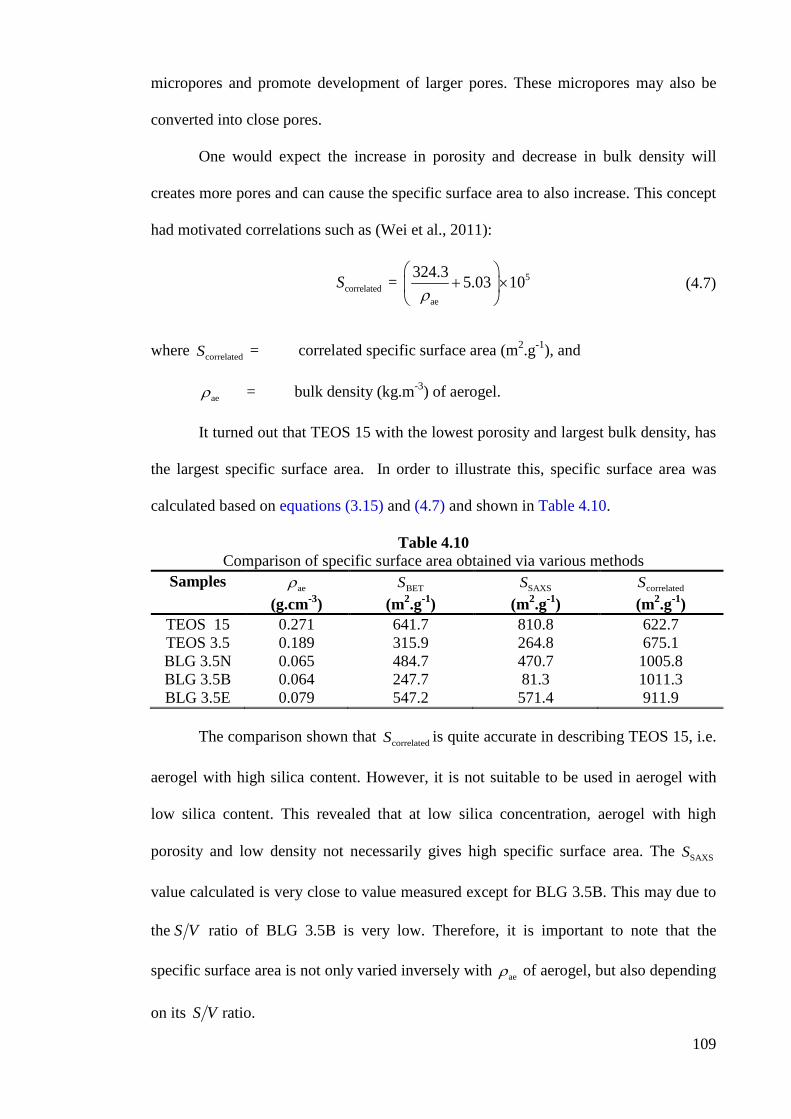
109
micropores and promote development of larger pores. These micropores may also be
converted into close pores.
One would expect the increase in porosity and decrease in bulk density will
creates more pores and can cause the specific surface area to also increase. This concept
had motivated correlations such as (Wei et al., 2011):
5correlated
ae
324.3 = 5.03 10Sρ
+ ×
(4.7)
where correlatedS = correlated specific surface area (m2.g-1), and
aeρ = bulk density (kg.m-3) of aerogel.
It turned out that TEOS 15 with the lowest porosity and largest bulk density, has
the largest specific surface area. In order to illustrate this, specific surface area was
calculated based on equations (3.15) and (4.7) and shown in Table 4.10.
Table 4.10 Comparison of specific surface area obtained via various methods
Samples aeρ (g.cm-3)
BETS (m2.g-1)
SAXSS (m2.g-1)
correlatedS (m2.g-1)
TEOS 15 TEOS 3.5 BLG 3.5N BLG 3.5B BLG 3.5E
0.271 0.189 0.065 0.064 0.079
641.7 315.9 484.7 247.7 547.2
810.8 264.8 470.7 81.3 571.4
622.7 675.1 1005.8 1011.3 911.9
The comparison shown that correlatedS is quite accurate in describing TEOS 15, i.e.
aerogel with high silica content. However, it is not suitable to be used in aerogel with
low silica content. This revealed that at low silica concentration, aerogel with high
porosity and low density not necessarily gives high specific surface area. The SAXSS
value calculated is very close to value measured except for BLG 3.5B. This may due to
the S V ratio of BLG 3.5B is very low. Therefore, it is important to note that the
specific surface area is not only varied inversely with aeρ of aerogel, but also depending
on its S V ratio.
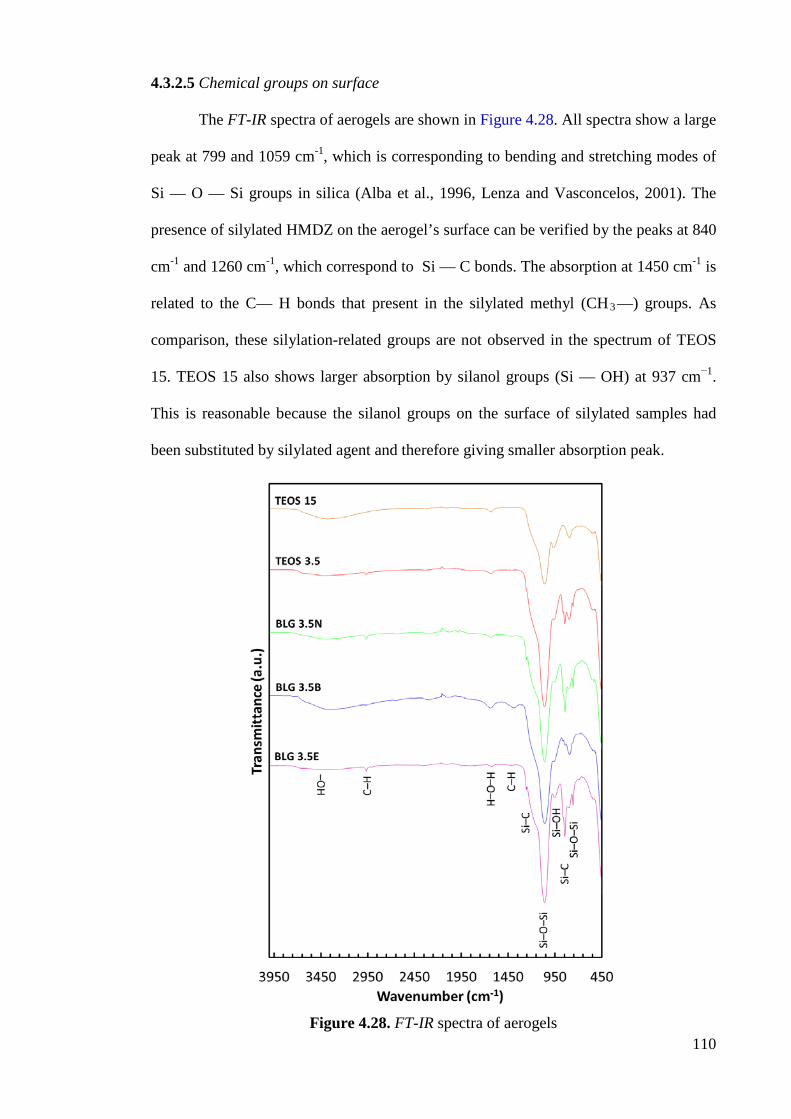
110
4.3.2.5 Chemical groups on surface
The FT-IR spectra of aerogels are shown in Figure 4.28. All spectra show a large
peak at 799 and 1059 cm-1, which is corresponding to bending and stretching modes of
Si — O — Si groups in silica (Alba et al., 1996, Lenza and Vasconcelos, 2001). The
presence of silylated HMDZ on the aerogel’s surface can be verified by the peaks at 840
cm-1 and 1260 cm-1, which correspond to Si — C bonds. The absorption at 1450 cm-1 is
related to the C— H bonds that present in the silylated methyl (CH3 —) groups. As
comparison, these silylation-related groups are not observed in the spectrum of TEOS
15. TEOS 15 also shows larger absorption by silanol groups (Si — OH) at 937 cm−1.
This is reasonable because the silanol groups on the surface of silylated samples had
been substituted by silylated agent and therefore giving smaller absorption peak.
Figure 4.28. FT-IR spectra of aerogels
111
Both TEOS 15 and BLG 3.5B had shown broad peak around 3431 cm−1, which
is caused by — OH bond in water molecules and silonol groups. This is common for
TEOS 15 as it is not being silylated and thus its surface is covered by silanol groups.
The non-silylated TEOS 15 is hygroscopic in nature and tends to absorb water vapor.
However, it is uncommon for BLG 3.5B to have such absorption since it is silylated.
BLG 3.5B also shows relative large absorption at 1639 cm-1, which is related to bending
modes of the water molecules adsorbed. In addition, absorption by Si — C bonds of
BLG 3.5B is less intense than other silylated samples, which indicates lower degree of
silylation. However, BLG 3.5B is proven hydrophobic as it repelled water. This paradox
can be resolved if the outer surface of its agglomerates is covered by silylation agent but
the inner surface is not. As the outer surface is silylated, it resists liquid water
penetration due to high surface tension of water. On the other hand, the inner surface of
agglomerate is not silylated, water vapor with lower surface tension can penetrate into
inner surface and adsorbed on it. This is again consistent with the idea that BLG 3.5B is
made up of cyclic species which gelled rapidly. The cyclic species causes it inner
surface difficult be silylated by large HMDZ molecules due to steric hindrance. As a
result, the degree of silylation on BLG 3.5B is lower than other samples. In contrast,
molecules of water vapor are smaller and have low surface tension, which allowed them
to penetrate and adsorbed onto its inner surface easily.
4.3.2.6 Thermal conductivity
The thermal conductivity of aerogels measured at ambient condition is shown in
Figure 4.29. The thermal conductivity measured is generally agreed with range reported
elsewhere (Rao et al., 2007a, In-Sub et al., 2008, Zeng et al., 1995a, Zhao et al., 2012).
TEOS 15 has the highest conductivity while BLG 3.5E has the lowest. Among samples
with low silica concentration, BLG 3.5B has the highest thermal conductivity. For the
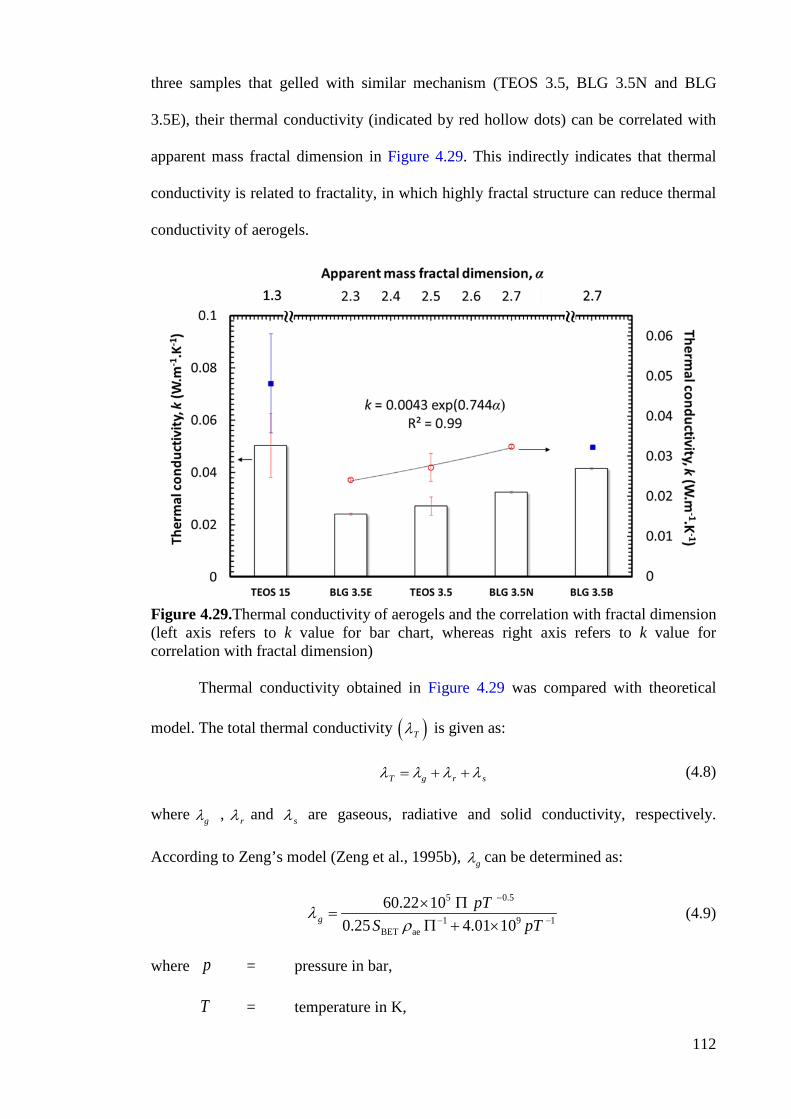
112
three samples that gelled with similar mechanism (TEOS 3.5, BLG 3.5N and BLG
3.5E), their thermal conductivity (indicated by red hollow dots) can be correlated with
apparent mass fractal dimension in Figure 4.29. This indirectly indicates that thermal
conductivity is related to fractality, in which highly fractal structure can reduce thermal
conductivity of aerogels.
Figure 4.29.Thermal conductivity of aerogels and the correlation with fractal dimension (left axis refers to k value for bar chart, whereas right axis refers to k value for correlation with fractal dimension)
Thermal conductivity obtained in Figure 4.29 was compared with theoretical
model. The total thermal conductivity ( )Tλ is given as:
T g r sλ λ λ λ= + + (4.8)
where gλ , rλ and sλ are gaseous, radiative and solid conductivity, respectively.
According to Zeng’s model (Zeng et al., 1995b), gλ can be determined as:
5 0.5
1 9 1BET ae
60.22 100.25 4.01 10g
pTS pT
λρ
−
− −
× Π=
Π + × (4.9)
where p = pressure in bar,
T = temperature in K,
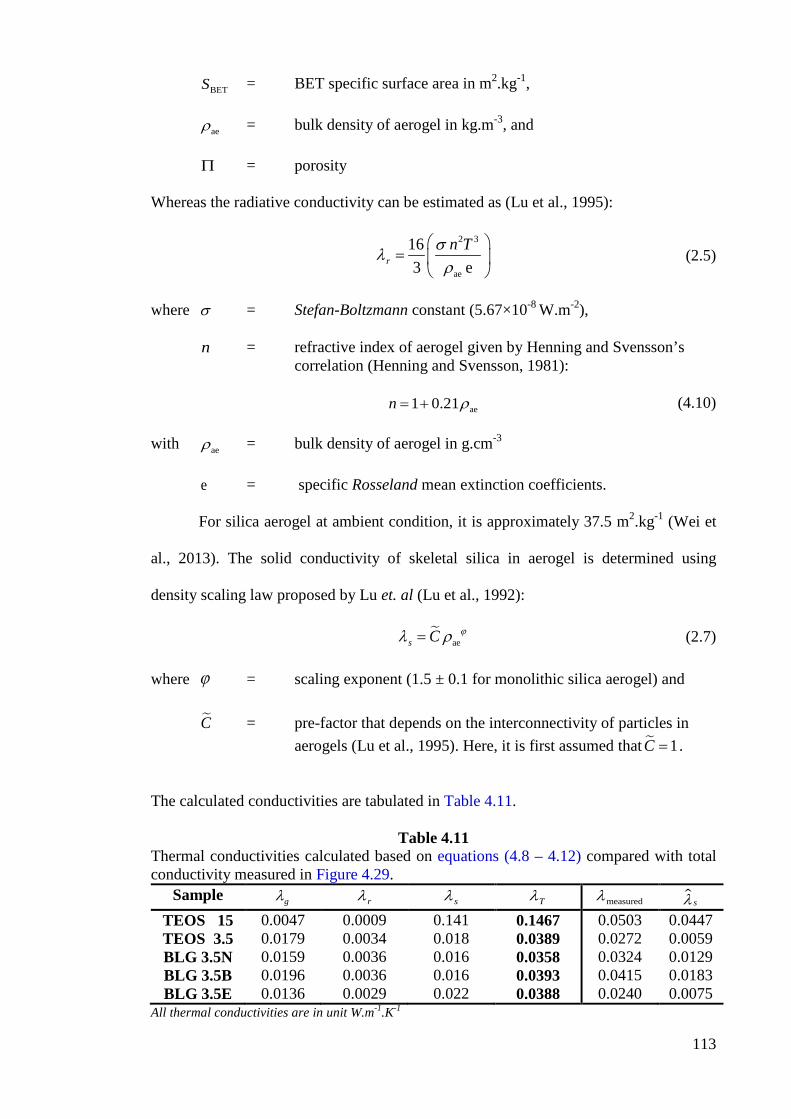
113
BETS = BET specific surface area in m2.kg-1,
aeρ = bulk density of aerogel in kg.m-3, and
Π = porosity
Whereas the radiative conductivity can be estimated as (Lu et al., 1995):
2 3
ae
163 er
n Tσλρ
=
(2.5)
where σ = Stefan-Boltzmann constant (5.67×10⁻⁸ W.m-2),
n = refractive index of aerogel given by Henning and Svensson’s correlation (Henning and Svensson, 1981):
ae1 0.21n ρ= + (4.10) with aeρ = bulk density of aerogel in g.cm-3
e = specific Rosseland mean extinction coefficients.
For silica aerogel at ambient condition, it is approximately 37.5 m2.kg-1 (Wei et
al., 2013). The solid conductivity of skeletal silica in aerogel is determined using
density scaling law proposed by Lu et. al (Lu et al., 1992):
aes C ϕλ ρ= (2.7)
where ϕ = scaling exponent (1.5 ± 0.1 for monolithic silica aerogel) and
C = pre-factor that depends on the interconnectivity of particles in aerogels (Lu et al., 1995). Here, it is first assumed that 1C = .
The calculated conductivities are tabulated in Table 4.11.
Table 4.11 Thermal conductivities calculated based on equations (4.8 – 4.12) compared with total conductivity measured in Figure 4.29.
Sample gλ rλ sλ Tλ measuredλ
sλ TEOS 15 TEOS 3.5 BLG 3.5N BLG 3.5B BLG 3.5E
0.0047 0.0179 0.0159 0.0196 0.0136
0.0009 0.0034 0.0036 0.0036 0.0029
0.141 0.018 0.016 0.016 0.022
0.1467 0.0389 0.0358 0.0393 0.0388
0.0503 0.0272 0.0324 0.0415 0.0240
0.0447 0.0059 0.0129 0.0183 0.0075
All thermal conductivities are in unit W.m-1.K-1
114
It can be seen that the calculated values tend to overestimate the total thermal
conductivity. This is due to the pre-factor value 1C = assumed in equation (4.11) may
not be realistic. In order to elaborate this, the true solid conductivity sλ is calculated by
subtracting gλ and rλ from measuredλ :
measureds g rλ λ λ λ= − − (4.11)
Except BLG 3.5B, the sλ values obtained (Table 4.11) are found to correlate
well with equation (4.11), where the regressed parameters are 1.46ϕ = and 0.3C = .
Reversed calculation of equation (4.11) on sample BLG 3.5B gives very different value
1.14C = . This indicates interconnectivity of particles in BLG 3.5B is very different
from others. This again suggests that gelation mechanism of BLG 3.5B in basic
condition has affected the structure and properties of the aerogel formed. The extremely
low thermal conductivity of aerogel is commonly attributed to its particles that
connected with “torturous” path which ended with many “dead ends”. As mentioned
earlier, monomers of BLG 3.5B that gelled in basic pH exhibits ionic repulsion on their
surface. The formation of individual, rather spherical particles is probable. These
particles are not “torturous linked” as in common aerogel. Without the compact links
( 4Q ) between particles, these large spherical particles in BLG 3.5B can collapsed easily
during drying. As those large particles touched each other, it provides large amount of
contact points for heat transfer. This is reflected by its high interconnectivity inferred
from its high value of 1.14C = . This is also supported by the very low degree of
fractality (Table 4.9) observed in BLG 3.5B.
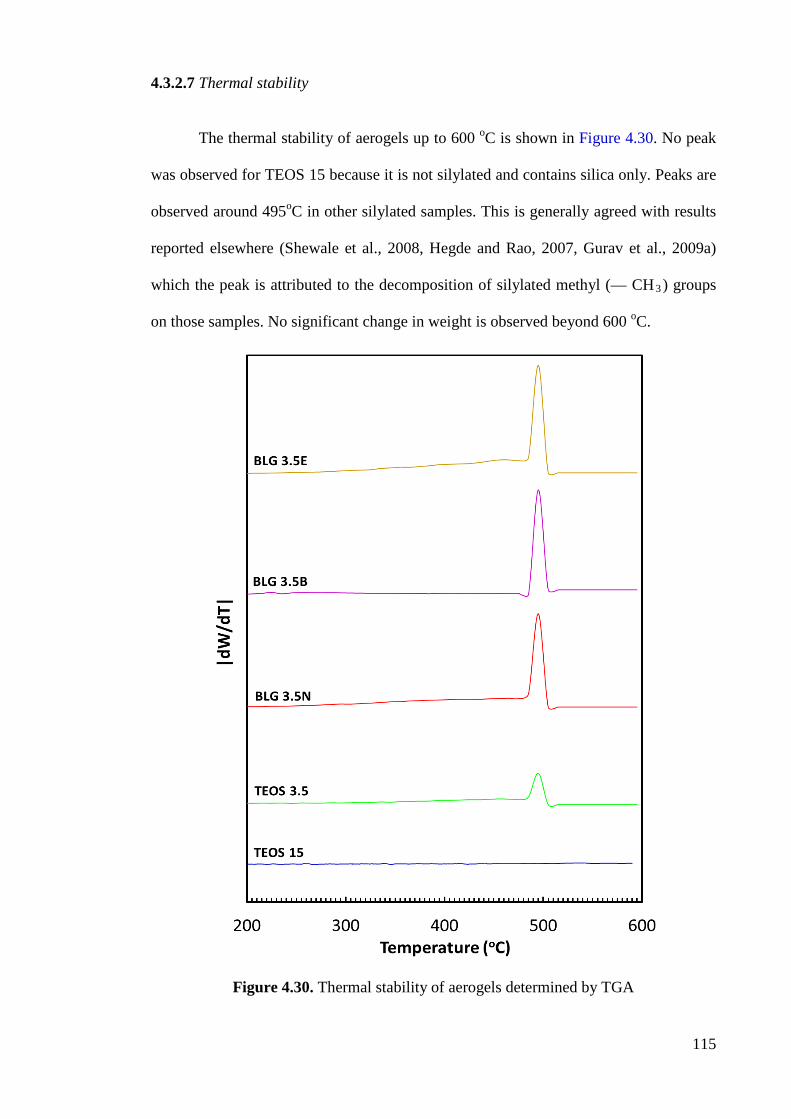
115
4.3.2.7 Thermal stability The thermal stability of aerogels up to 600 oC is shown in Figure 4.30. No peak
was observed for TEOS 15 because it is not silylated and contains silica only. Peaks are
observed around 495oC in other silylated samples. This is generally agreed with results
reported elsewhere (Shewale et al., 2008, Hegde and Rao, 2007, Gurav et al., 2009a)
which the peak is attributed to the decomposition of silylated methyl (— CH3 ) groups
on those samples. No significant change in weight is observed beyond 600 oC.
Figure 4.30. Thermal stability of aerogels determined by TGA
116
4.3.2.8 Summary
Silica aerogel was successfully synthesized using bamboo leaf as silica source.
The properties of aerogel obtained are comparable to the aerogel synthesized with
TEOS. The pH of gelation is proven to have significant effect on the properties of
aerogel formed. Aerogel synthesized in acidic condition exhibits more attractive
properties, including low shrinkage (24.3%), large specific surface area (547.2 m2 g-1),
large pore volume (2.72 cm3 g-1) and low thermal conductivity (0.024 W m-1 K-1).
Whereas, aerogel synthesized in basic condition has very different properties. It has
small pore volume (0.287 cm3 g-1) and pore size (11.44 nm), large primary particles
(6.69 nm), small specific surface area (247.7 m2 g-1), low degree of fractality (6.69),
strong absorption of water, and high thermal conductivity (0.0415 W m-1 K-1). The
properties of aerogel synthesized at neutral pH are very similar with those gelled in
acidic condition. However, its gelation period (2.5 min) is much shorter than gel formed
at acidic pH (18 h). Due to this reason, water glass was gelled at neutral pH in section
5.2 for the opacification purpose.
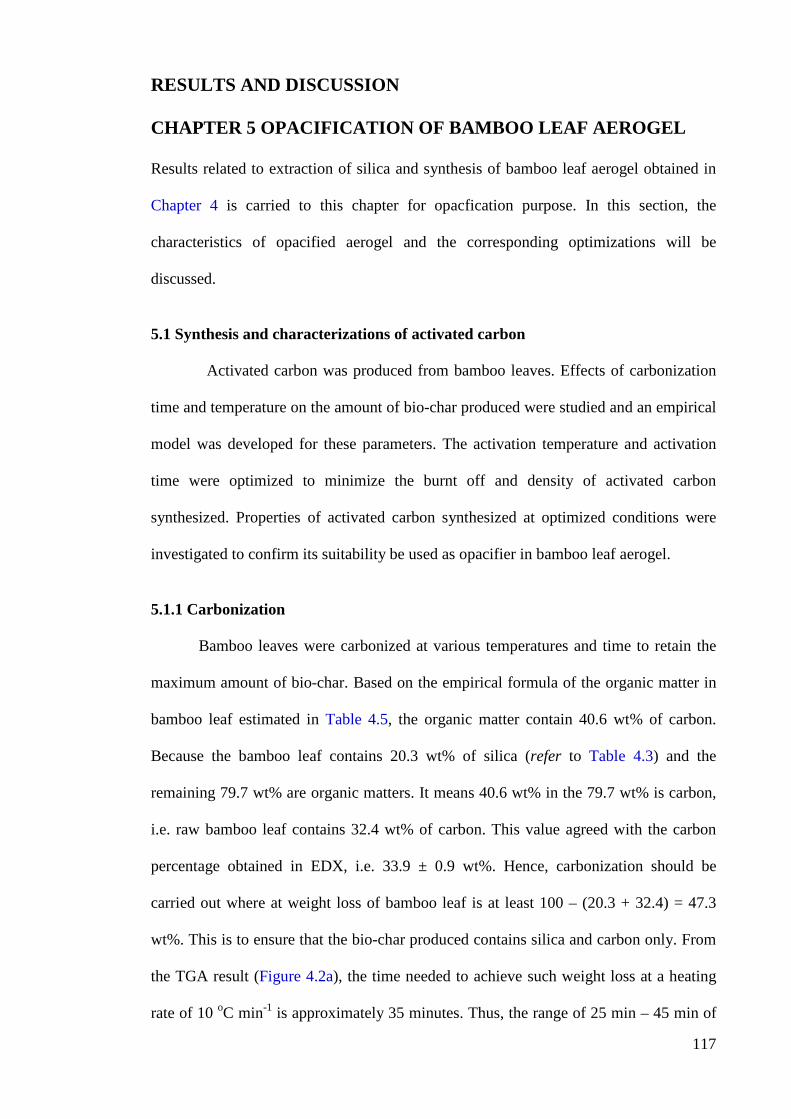
117
RESULTS AND DISCUSSION CHAPTER 5 OPACIFICATION OF BAMBOO LEAF AEROGEL Results related to extraction of silica and synthesis of bamboo leaf aerogel obtained in
Chapter 4 is carried to this chapter for opacfication purpose. In this section, the
characteristics of opacified aerogel and the corresponding optimizations will be
discussed.
5.1 Synthesis and characterizations of activated carbon
Activated carbon was produced from bamboo leaves. Effects of carbonization
time and temperature on the amount of bio-char produced were studied and an empirical
model was developed for these parameters. The activation temperature and activation
time were optimized to minimize the burnt off and density of activated carbon
synthesized. Properties of activated carbon synthesized at optimized conditions were
investigated to confirm its suitability be used as opacifier in bamboo leaf aerogel.
5.1.1 Carbonization
Bamboo leaves were carbonized at various temperatures and time to retain the
maximum amount of bio-char. Based on the empirical formula of the organic matter in
bamboo leaf estimated in Table 4.5, the organic matter contain 40.6 wt% of carbon.
Because the bamboo leaf contains 20.3 wt% of silica (refer to Table 4.3) and the
remaining 79.7 wt% are organic matters. It means 40.6 wt% in the 79.7 wt% is carbon,
i.e. raw bamboo leaf contains 32.4 wt% of carbon. This value agreed with the carbon
percentage obtained in EDX, i.e. 33.9 ± 0.9 wt%. Hence, carbonization should be
carried out where at weight loss of bamboo leaf is at least 100 – (20.3 + 32.4) = 47.3
wt%. This is to ensure that the bio-char produced contains silica and carbon only. From
the TGA result (Figure 4.2a), the time needed to achieve such weight loss at a heating
rate of 10 oC min-1 is approximately 35 minutes. Thus, the range of 25 min – 45 min of
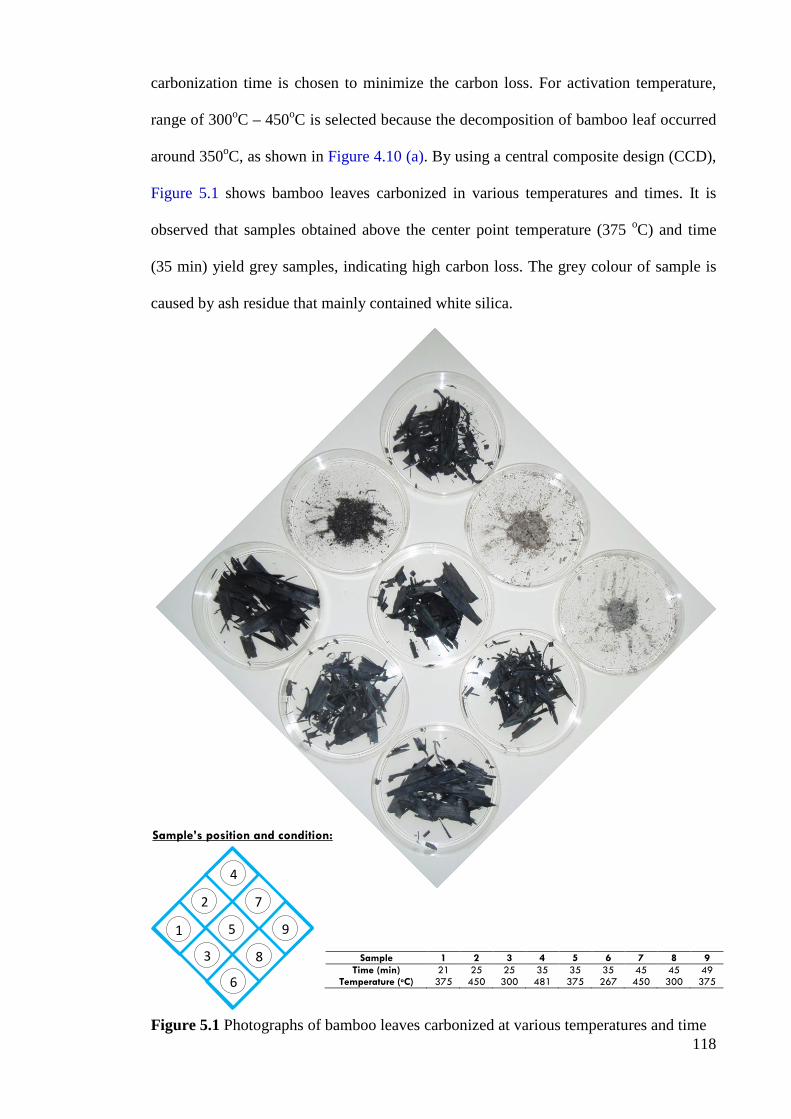
118
1
2 4
3 5
7
6 8
9
carbonization time is chosen to minimize the carbon loss. For activation temperature,
range of 300oC – 450oC is selected because the decomposition of bamboo leaf occurred
around 350oC, as shown in Figure 4.10 (a). By using a central composite design (CCD),
Figure 5.1 shows bamboo leaves carbonized in various temperatures and times. It is
observed that samples obtained above the center point temperature (375 oC) and time
(35 min) yield grey samples, indicating high carbon loss. The grey colour of sample is
caused by ash residue that mainly contained white silica.
Figure 5.1 Photographs of bamboo leaves carbonized at various temperatures and time
Sample 1 2 3 4 5 6 7 8 9 Time (min) 21 25 25 35 35 35 45 45 49
Temperature (oC) 375 450 300 481 375 267 450 300 375
Sample’s position and condition:
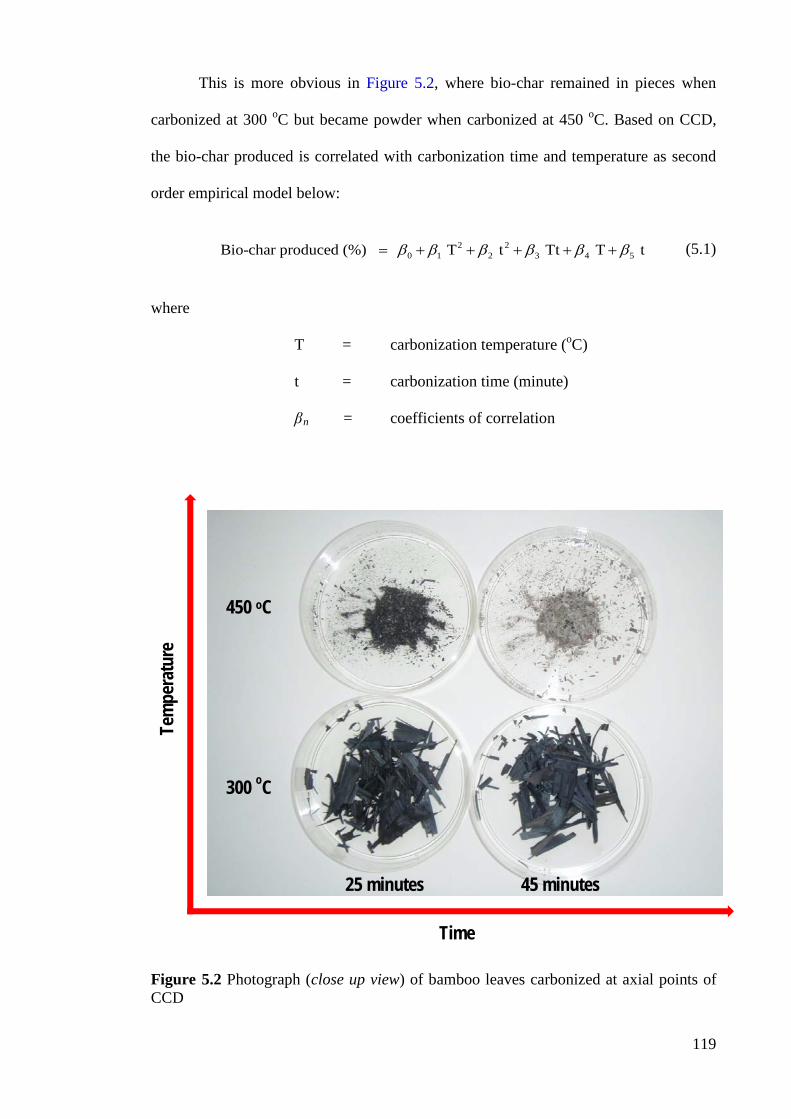
119
This is more obvious in Figure 5.2, where bio-char remained in pieces when
carbonized at 300 oC but became powder when carbonized at 450 oC. Based on CCD,
the bio-char produced is correlated with carbonization time and temperature as second
order empirical model below:
2 2
0 1 2 3 4 5Bio-char produced (%) T t Tt T t β β β β β β= + + + + + (5.1)
where
T = carbonization temperature (oC)
t = carbonization time (minute)
βn = coefficients of correlation
Figure 5.2 Photograph (close up view) of bamboo leaves carbonized at axial points of CCD
450 oC
300 oC
25 minutes 45 minutes
Tem
pera
ture
Time
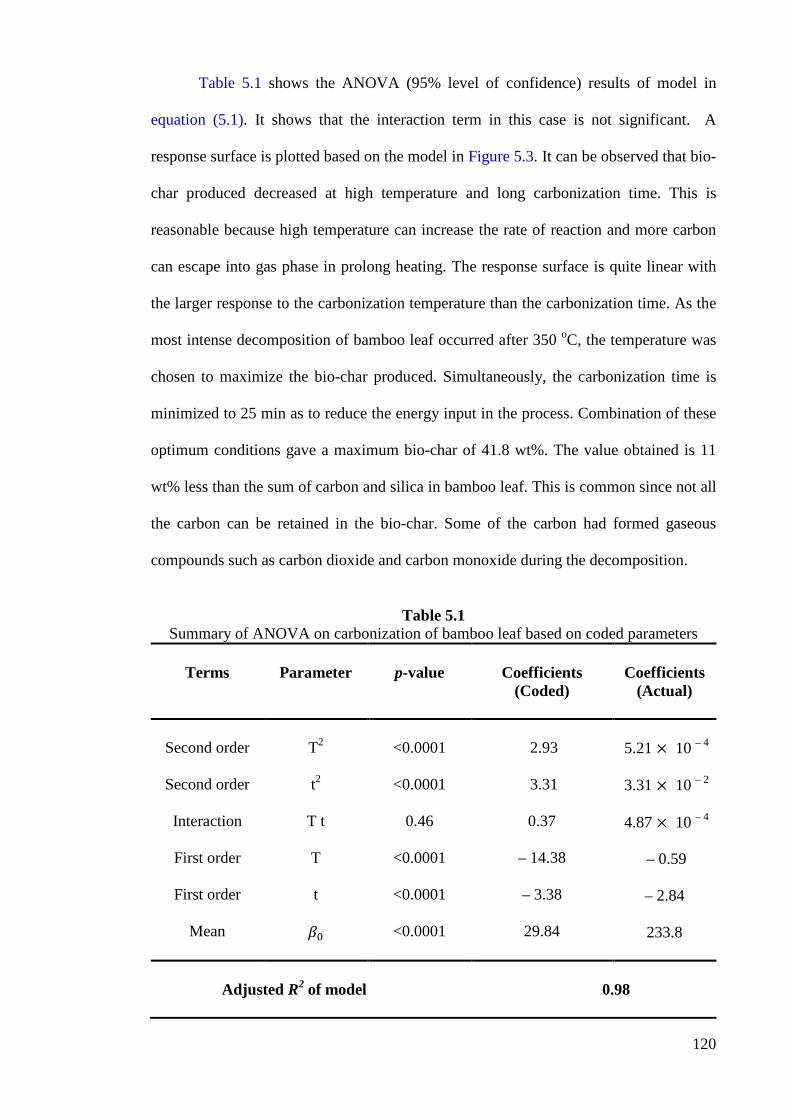
120
Table 5.1 shows the ANOVA (95% level of confidence) results of model in
equation (5.1). It shows that the interaction term in this case is not significant. A
response surface is plotted based on the model in Figure 5.3. It can be observed that bio-
char produced decreased at high temperature and long carbonization time. This is
reasonable because high temperature can increase the rate of reaction and more carbon
can escape into gas phase in prolong heating. The response surface is quite linear with
the larger response to the carbonization temperature than the carbonization time. As the
most intense decomposition of bamboo leaf occurred after 350 oC, the temperature was
chosen to maximize the bio-char produced. Simultaneously, the carbonization time is
minimized to 25 min as to reduce the energy input in the process. Combination of these
optimum conditions gave a maximum bio-char of 41.8 wt%. The value obtained is 11
wt% less than the sum of carbon and silica in bamboo leaf. This is common since not all
the carbon can be retained in the bio-char. Some of the carbon had formed gaseous
compounds such as carbon dioxide and carbon monoxide during the decomposition.
Table 5.1
Summary of ANOVA on carbonization of bamboo leaf based on coded parameters
Terms
Parameter
p-value
Coefficients
(Coded)
Coefficients
(Actual)
Second order
Second order
Interaction
First order
First order
Mean
T2
t2
T t
T t 𝛽0
<0.0001
<0.0001
0.46
<0.0001
<0.0001
<0.0001
2.93
3.31
0.37
– 14.38
– 3.38
29.84
5.21 × 10 – 4
3.31 × 10 – 2 4.87 × 10 – 4
– 0.59
– 2.84
233.8
Adjusted R2 of model 0.98
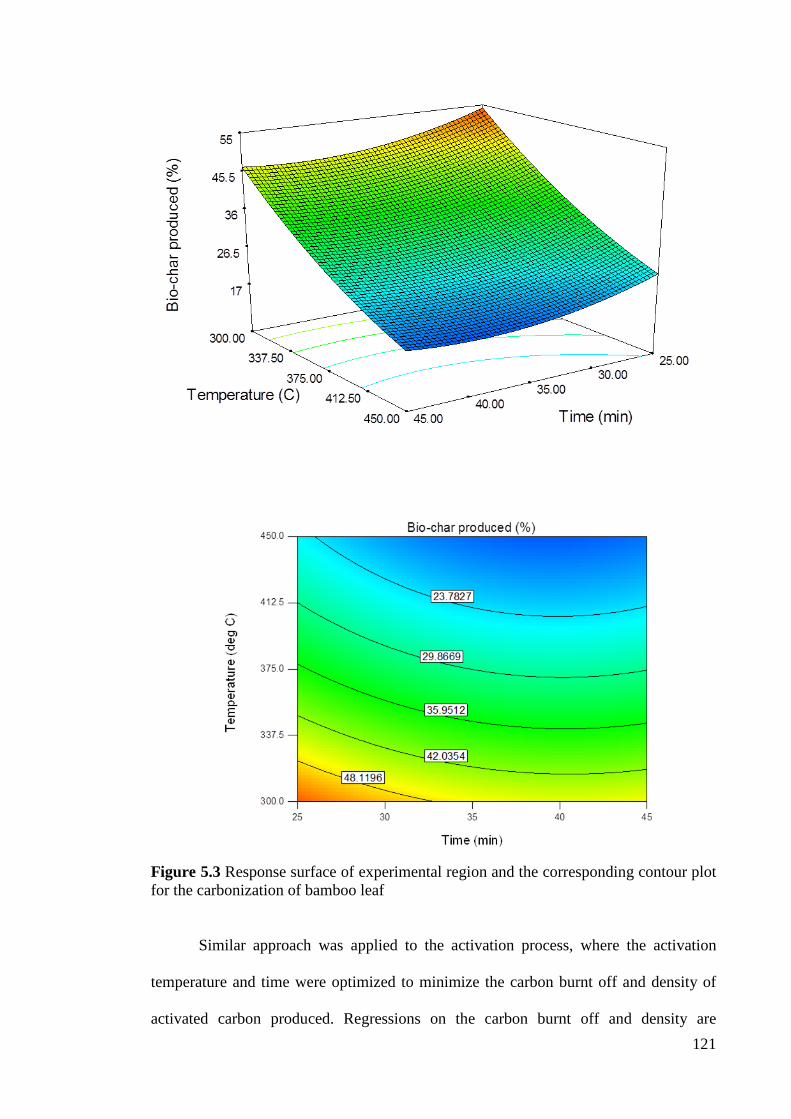
121
Figure 5.3 Response surface of experimental region and the corresponding contour plot for the carbonization of bamboo leaf
Similar approach was applied to the activation process, where the activation
temperature and time were optimized to minimize the carbon burnt off and density of
activated carbon produced. Regressions on the carbon burnt off and density are
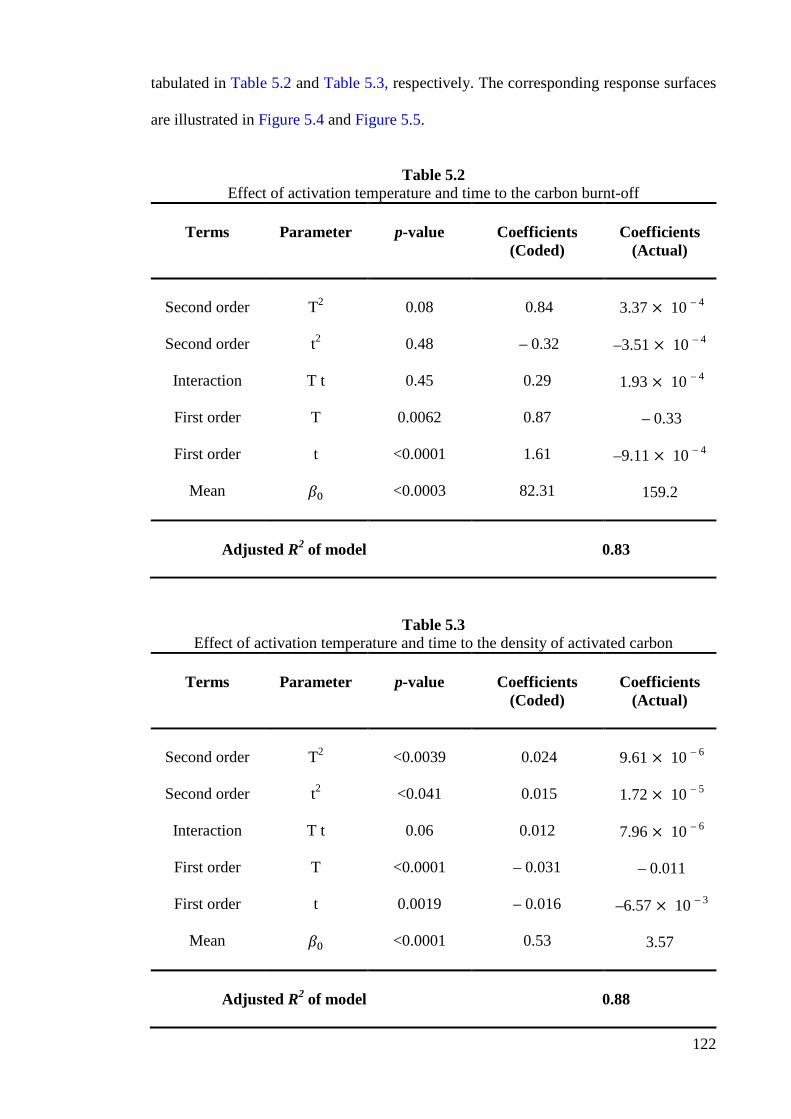
122
tabulated in Table 5.2 and Table 5.3, respectively. The corresponding response surfaces
are illustrated in Figure 5.4 and Figure 5.5.
Table 5.2
Effect of activation temperature and time to the carbon burnt-off
Terms
Parameter
p-value
Coefficients
(Coded)
Coefficients
(Actual)
Second order
Second order
Interaction
First order
First order
Mean
T2
t2
T t
T t 𝛽0
0.08
0.48
0.45
0.0062
<0.0001
<0.0003
0.84
– 0.32
0.29
0.87
1.61
82.31
3.37 × 10 – 4
–3.51 × 10 – 4 1.93 × 10 – 4
– 0.33
–9.11 × 10 – 4
159.2
Adjusted R2 of model 0.83
Table 5.3 Effect of activation temperature and time to the density of activated carbon
Terms
Parameter
p-value
Coefficients
(Coded)
Coefficients
(Actual)
Second order
Second order
Interaction
First order
First order
Mean
T2
t2
T t
T t 𝛽0
<0.0039
<0.041
0.06
<0.0001
0.0019
<0.0001
0.024
0.015
0.012
– 0.031
– 0.016
0.53
9.61 × 10 – 6
1.72 × 10 – 5
7.96 × 10 – 6
– 0.011
–6.57 × 10 – 3
3.57
Adjusted R2 of model 0.88
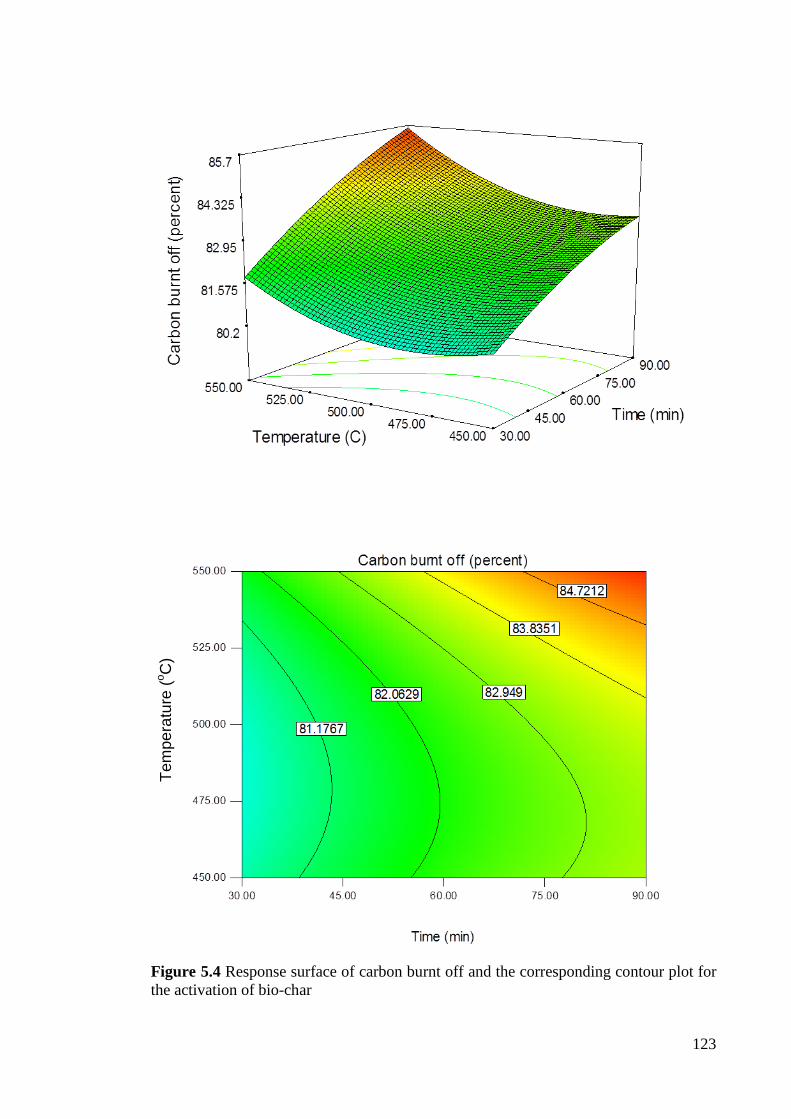
123
Figure 5.4 Response surface of carbon burnt off and the corresponding contour plot for the activation of bio-char
Tem
pera
ture
(o C)
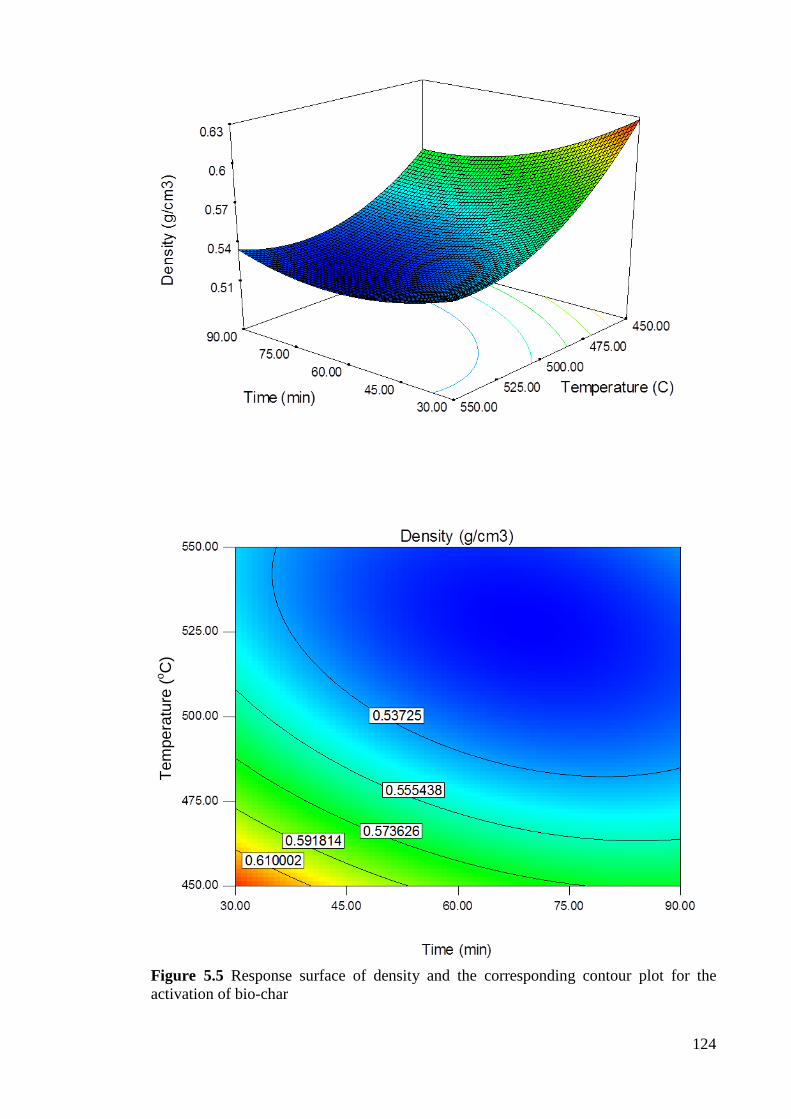
124
Figure 5.5 Response surface of density and the corresponding contour plot for the activation of bio-char
Tem
pera
ture
(o C)
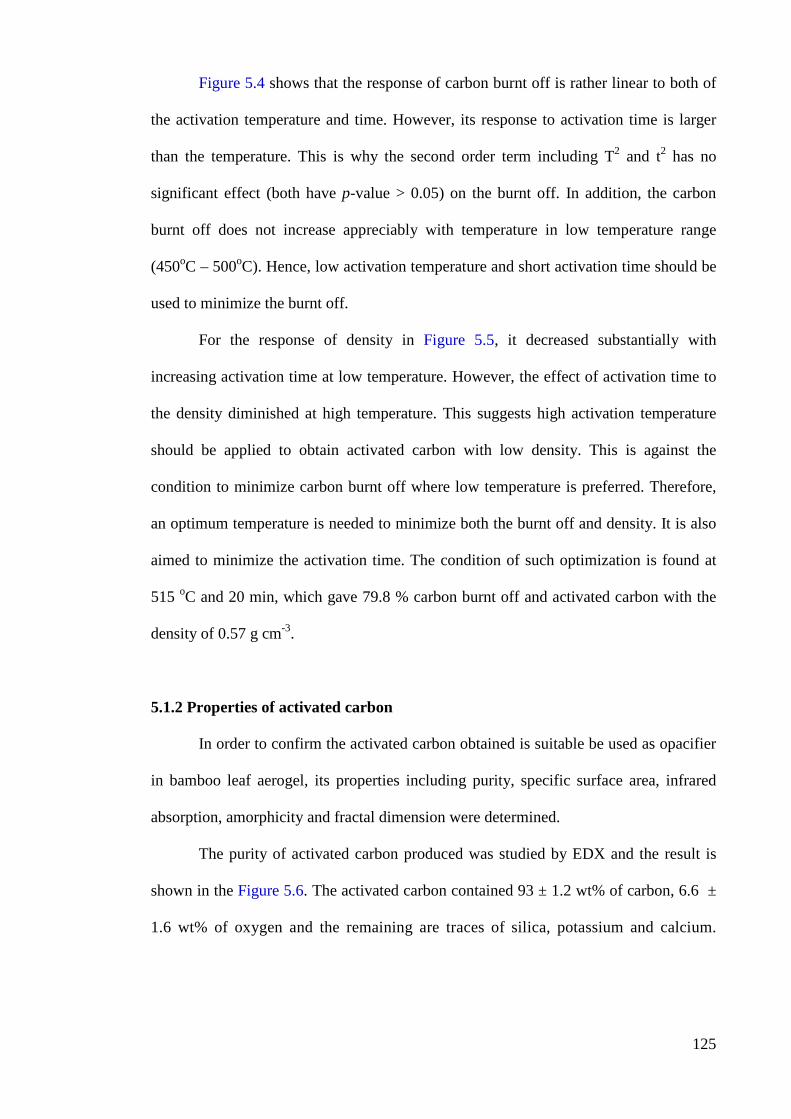
125
Figure 5.4 shows that the response of carbon burnt off is rather linear to both of
the activation temperature and time. However, its response to activation time is larger
than the temperature. This is why the second order term including T2 and t2 has no
significant effect (both have p-value > 0.05) on the burnt off. In addition, the carbon
burnt off does not increase appreciably with temperature in low temperature range
(450oC – 500oC). Hence, low activation temperature and short activation time should be
used to minimize the burnt off.
For the response of density in Figure 5.5, it decreased substantially with
increasing activation time at low temperature. However, the effect of activation time to
the density diminished at high temperature. This suggests high activation temperature
should be applied to obtain activated carbon with low density. This is against the
condition to minimize carbon burnt off where low temperature is preferred. Therefore,
an optimum temperature is needed to minimize both the burnt off and density. It is also
aimed to minimize the activation time. The condition of such optimization is found at
515 oC and 20 min, which gave 79.8 % carbon burnt off and activated carbon with the
density of 0.57 g cm-3.
5.1.2 Properties of activated carbon
In order to confirm the activated carbon obtained is suitable be used as opacifier
in bamboo leaf aerogel, its properties including purity, specific surface area, infrared
absorption, amorphicity and fractal dimension were determined.
The purity of activated carbon produced was studied by EDX and the result is
shown in the Figure 5.6. The activated carbon contained 93 ± 1.2 wt% of carbon, 6.6 ±
1.6 wt% of oxygen and the remaining are traces of silica, potassium and calcium.
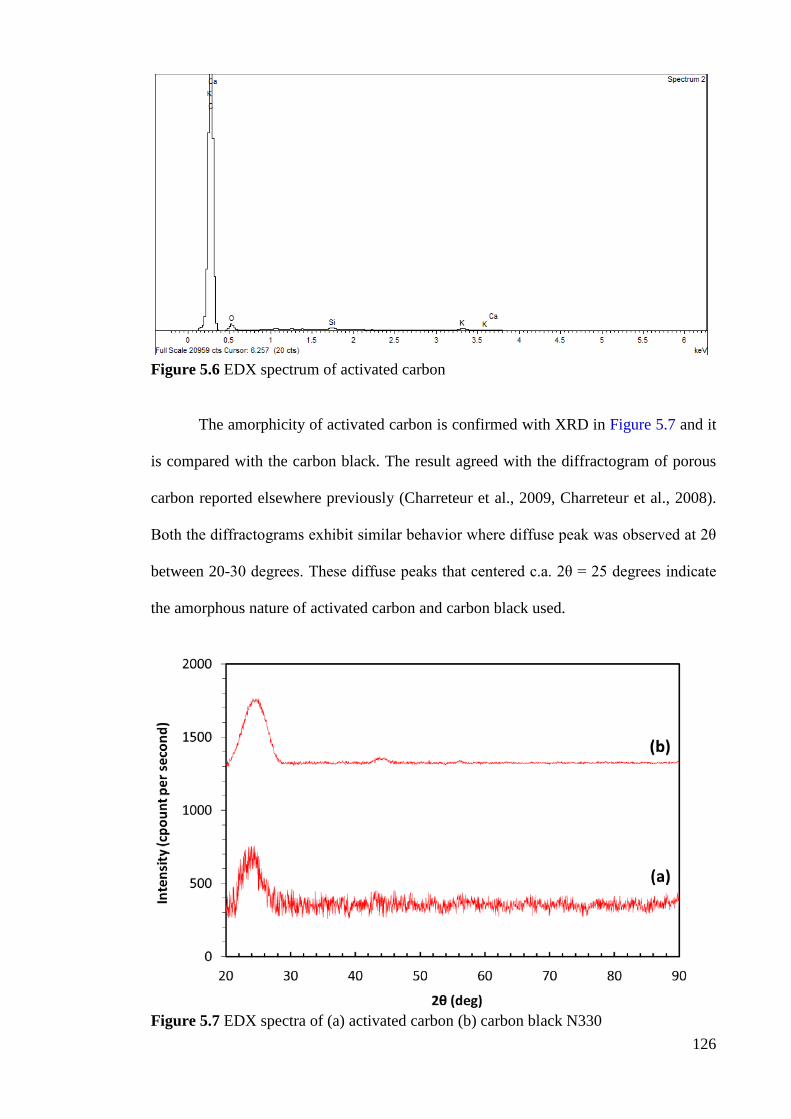
126
Figure 5.6 EDX spectrum of activated carbon The amorphicity of activated carbon is confirmed with XRD in Figure 5.7 and it
is compared with the carbon black. The result agreed with the diffractogram of porous
carbon reported elsewhere previously (Charreteur et al., 2009, Charreteur et al., 2008).
Both the diffractograms exhibit similar behavior where diffuse peak was observed at 2θ
between 20-30 degrees. These diffuse peaks that centered c.a. 2θ = 25 degrees indicate
the amorphous nature of activated carbon and carbon black used.
Figure 5.7 EDX spectra of (a) activated carbon (b) carbon black N330
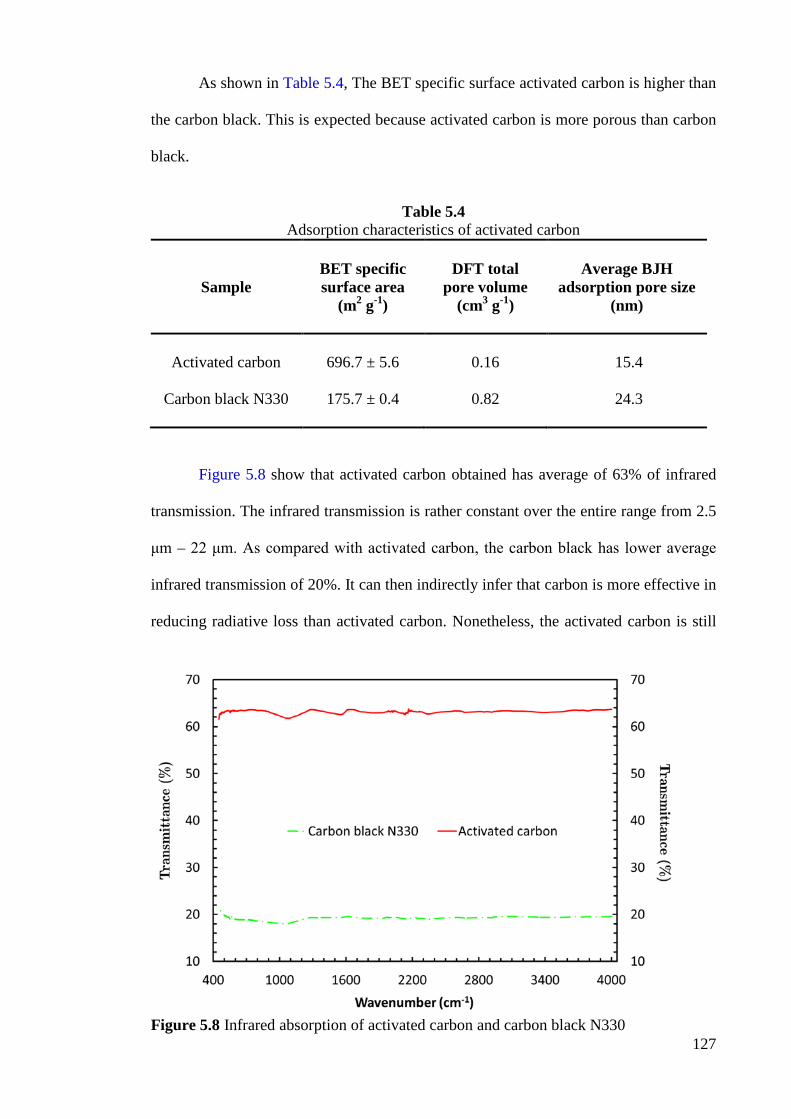
127
As shown in Table 5.4, The BET specific surface activated carbon is higher than
the carbon black. This is expected because activated carbon is more porous than carbon
black.
Table 5.4
Adsorption characteristics of activated carbon
Sample
BET specific surface area
(m2 g-1)
DFT total
pore volume (cm3 g-1)
Average BJH
adsorption pore size (nm)
Activated carbon
Carbon black N330
696.7 ± 5.6
175.7 ± 0.4
0.16
0.82
15.4
24.3
Figure 5.8 show that activated carbon obtained has average of 63% of infrared
transmission. The infrared transmission is rather constant over the entire range from 2.5
μm – 22 μm. As compared with activated carbon, the carbon black has lower average
infrared transmission of 20%. It can then indirectly infer that carbon is more effective in
reducing radiative loss than activated carbon. Nonetheless, the activated carbon is still
Figure 5.8 Infrared absorption of activated carbon and carbon black N330
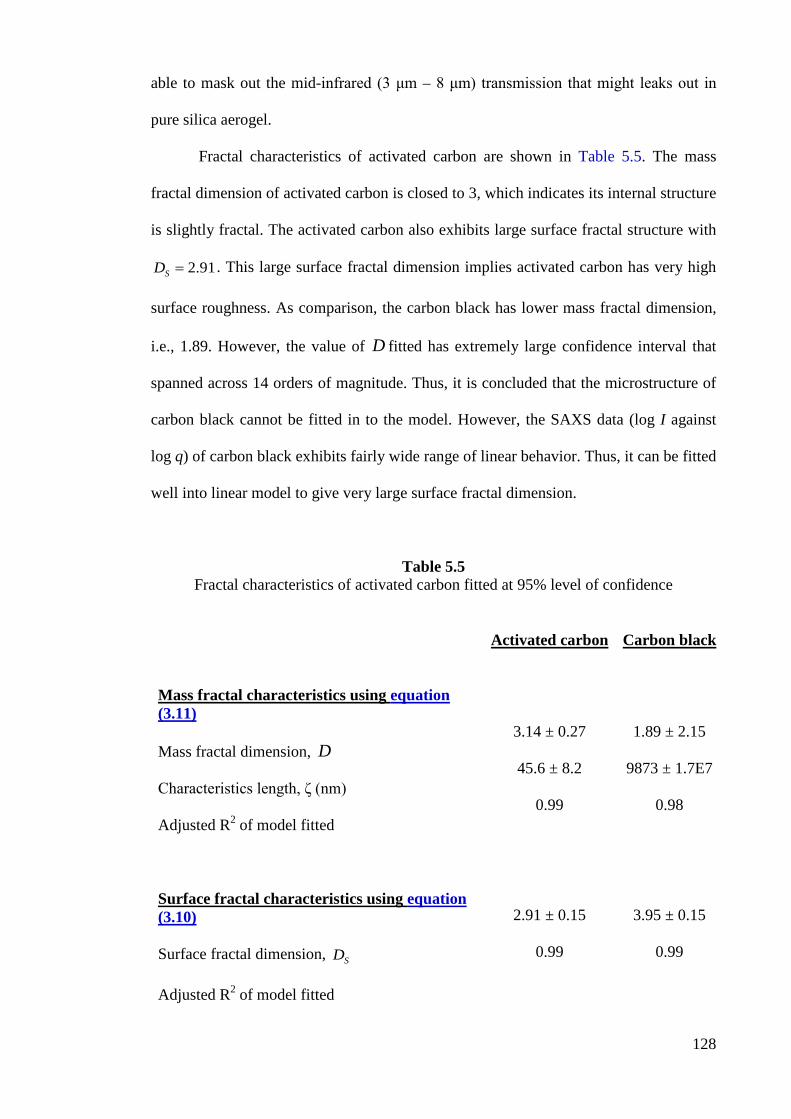
128
able to mask out the mid-infrared (3 μm – 8 μm) transmission that might leaks out in
pure silica aerogel.
Fractal characteristics of activated carbon are shown in Table 5.5. The mass
fractal dimension of activated carbon is closed to 3, which indicates its internal structure
is slightly fractal. The activated carbon also exhibits large surface fractal structure with
2.91SD = . This large surface fractal dimension implies activated carbon has very high
surface roughness. As comparison, the carbon black has lower mass fractal dimension,
i.e., 1.89. However, the value of D fitted has extremely large confidence interval that
spanned across 14 orders of magnitude. Thus, it is concluded that the microstructure of
carbon black cannot be fitted in to the model. However, the SAXS data (log I against
log q) of carbon black exhibits fairly wide range of linear behavior. Thus, it can be fitted
well into linear model to give very large surface fractal dimension.
Table 5.5 Fractal characteristics of activated carbon fitted at 95% level of confidence
Activated carbon
Carbon black
Mass fractal characteristics using equation (3.11)
Mass fractal dimension, D Characteristics length, ζ (nm) Adjusted R2 of model fitted
Surface fractal characteristics using equation (3.10)
Surface fractal dimension, SD Adjusted R2 of model fitted
3.14 ± 0.27
45.6 ± 8.2
0.99
2.91 ± 0.15
0.99
1.89 ± 2.15
9873 ± 1.7E7
0.98
3.95 ± 0.15
0.99
129
5.1.3 Summary
Activated carbon was successfully synthesized from bamboo leaf. The condition
of carbonization and activation was optimized to reduce carbon burnt off and density.
The activated carbon synthesized exhibits desired properties for opacification of silica
aerogel such as high purity, low transmission of mid-infrared ray and highly fractal
microstructure.
5.2 Opacification of silica aerogel with activated carbon
Silica aerogel were opacified with activated carbon produced to optimize its
thermal conductivity. Factors including carbon loading, silica concentration on water
glass and temperature were studied. Effects of these parameters were combined to
develop an empirical model. The regressed model was used to derive an optimal carbon
loading – silica concentration tie line that minimized the thermal conductivity at various
temperatures. The thermal conductivity of aerogels opacified with activated carbon was
also compared with those opacified with carbon black.
5.2.1 Effect of temperature
It is known that the total thermal conductivity of aerogel is the sum of three
mode of heat transfer as stated in equation (4.8):
T g r sλ λ λ λ= + + (4.8)
where the radiative transfer ( rλ ) is expressed in equation (2.5) as:
( )2 3
ae
163 eT g s
n Tσλ λ λρ
= + +
(5.2)
Hence, total thermal conductivity increased with temperature as shown in Figure 5.9.
Assuming that gλ , sλ and e are fairly weak functions of temperature, the total thermal
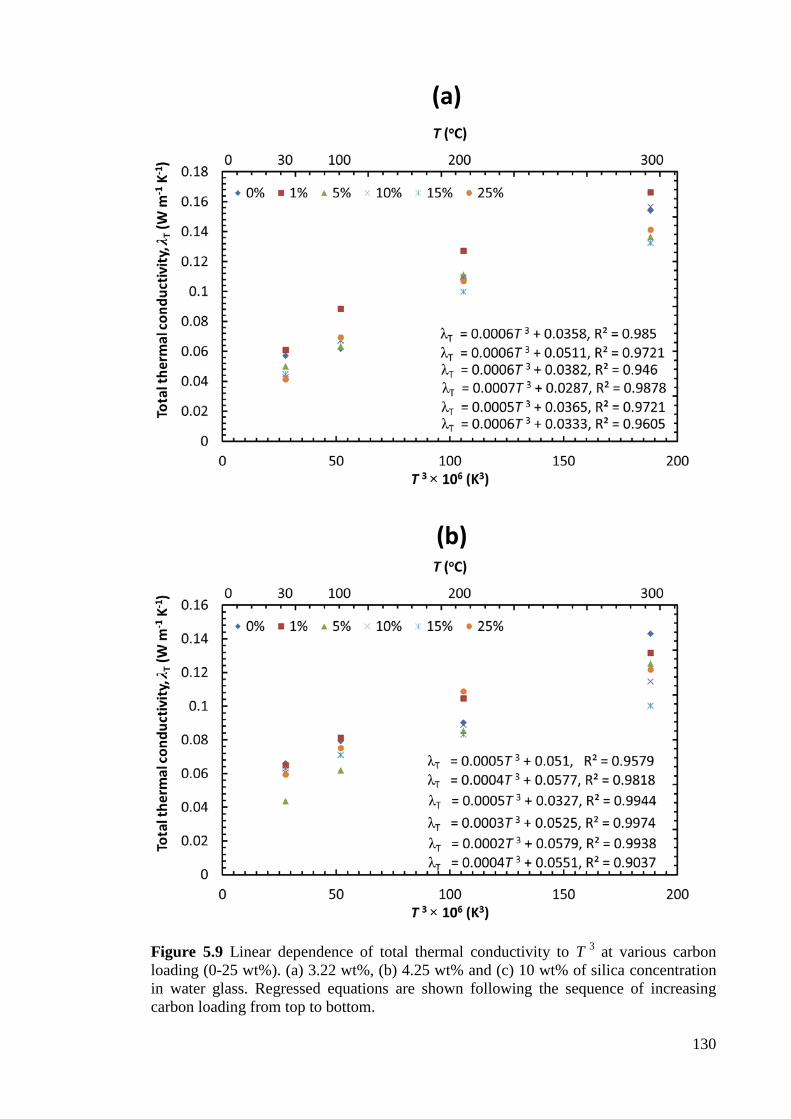
130
Figure 5.9 Linear dependence of total thermal conductivity to T 3 at various carbon loading (0-25 wt%). (a) 3.22 wt%, (b) 4.25 wt% and (c) 10 wt% of silica concentration in water glass. Regressed equations are shown following the sequence of increasing carbon loading from top to bottom.
(a)
(b)
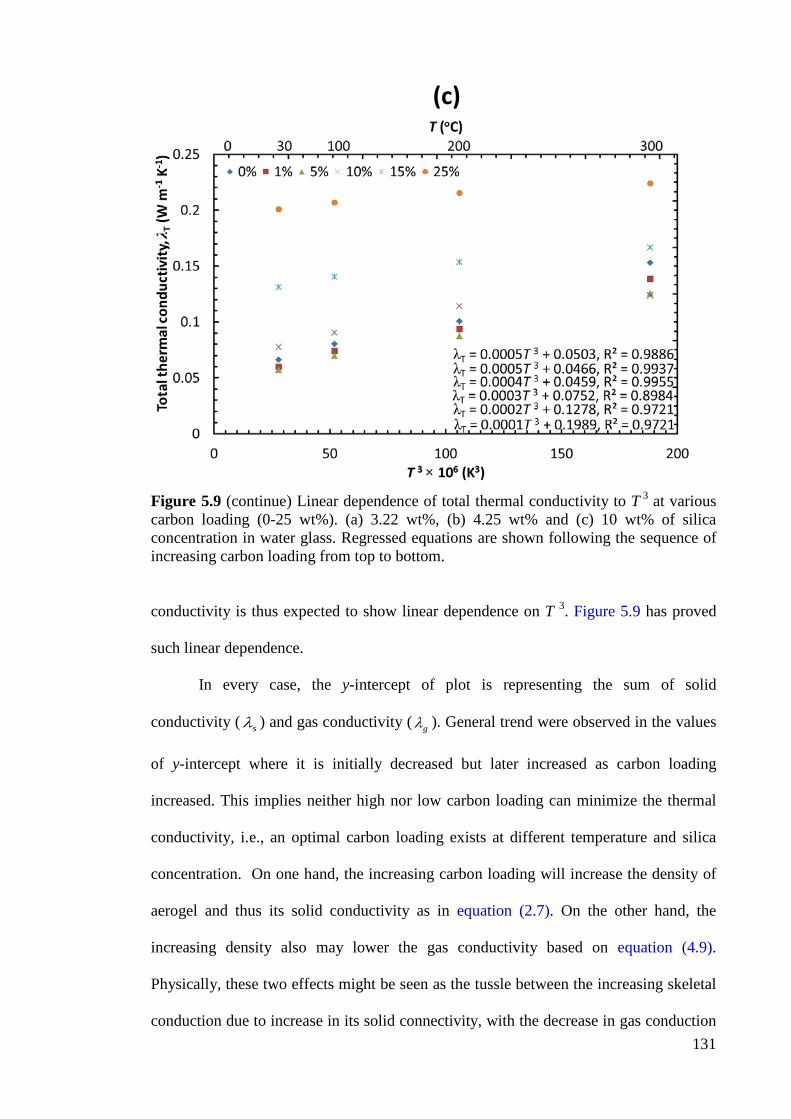
131
Figure 5.9 (continue) Linear dependence of total thermal conductivity to T 3 at various carbon loading (0-25 wt%). (a) 3.22 wt%, (b) 4.25 wt% and (c) 10 wt% of silica concentration in water glass. Regressed equations are shown following the sequence of increasing carbon loading from top to bottom.
conductivity is thus expected to show linear dependence on T 3. Figure 5.9 has proved
such linear dependence.
In every case, the y-intercept of plot is representing the sum of solid
conductivity ( sλ ) and gas conductivity ( gλ ). General trend were observed in the values
of y-intercept where it is initially decreased but later increased as carbon loading
increased. This implies neither high nor low carbon loading can minimize the thermal
conductivity, i.e., an optimal carbon loading exists at different temperature and silica
concentration. On one hand, the increasing carbon loading will increase the density of
aerogel and thus its solid conductivity as in equation (2.7). On the other hand, the
increasing density also may lower the gas conductivity based on equation (4.9).
Physically, these two effects might be seen as the tussle between the increasing skeletal
conduction due to increase in its solid connectivity, with the decrease in gas conduction
(c)
132
due to pore size reduction; while the density of aerogel increased. Hence, an optimal
carbon loading exists as the balance of these two effects.
Similarly, the increase of silica concentration from 3.22 – 10 wt% caused the
aerogel density to increase. It is observed that the y-intercepts of plots generally
increased when silica concentration of water glass increased. This can be interpreted as
effect of the increase in solid conduction is greater than the decrease in gas conduction,
as the density of aerogel increased. Slope of plots had shown the opposite trend where it
decreased with increasing silica concentration. Since the slope contributes positively to
radiative transfer, it indicates reduction of r λ at higher silica concentration. Such
observation can be attributed to the inverse relation of rλ with aerogel density ( aeρ )
shown in equation (2.5). As a result, the increase in solid conduction ( sλ ) is offset by
the reduction in gas conduction ( gλ ) and radiative transfer ( rλ ). Hence, optimal silica
concentration shall also exist to minimize the total thermal conductivity. This effect is
better illustrated by combining the three modes of heat transfer in term of aerogel
density as follow:
2 3 5 0.5
ae 1 9 1ae BET ae
Solid conduction Gas conductionRadiation
16 60.22 10 3 e 0.25 4.01 10T
n T pTCS pT
ϕ σλ ρρ ρ
−
− −
× Π= + + Π + ×
(5.3)
5.2.2 Effect of carbon loading
It is known that carbon doped into aerogel can reduce the radiative conductivity
but also increased the solid conductivity. This is confirmed in Figure 5.10 where all plot
show a local minimum as carbon loading increased. However, the addition of small
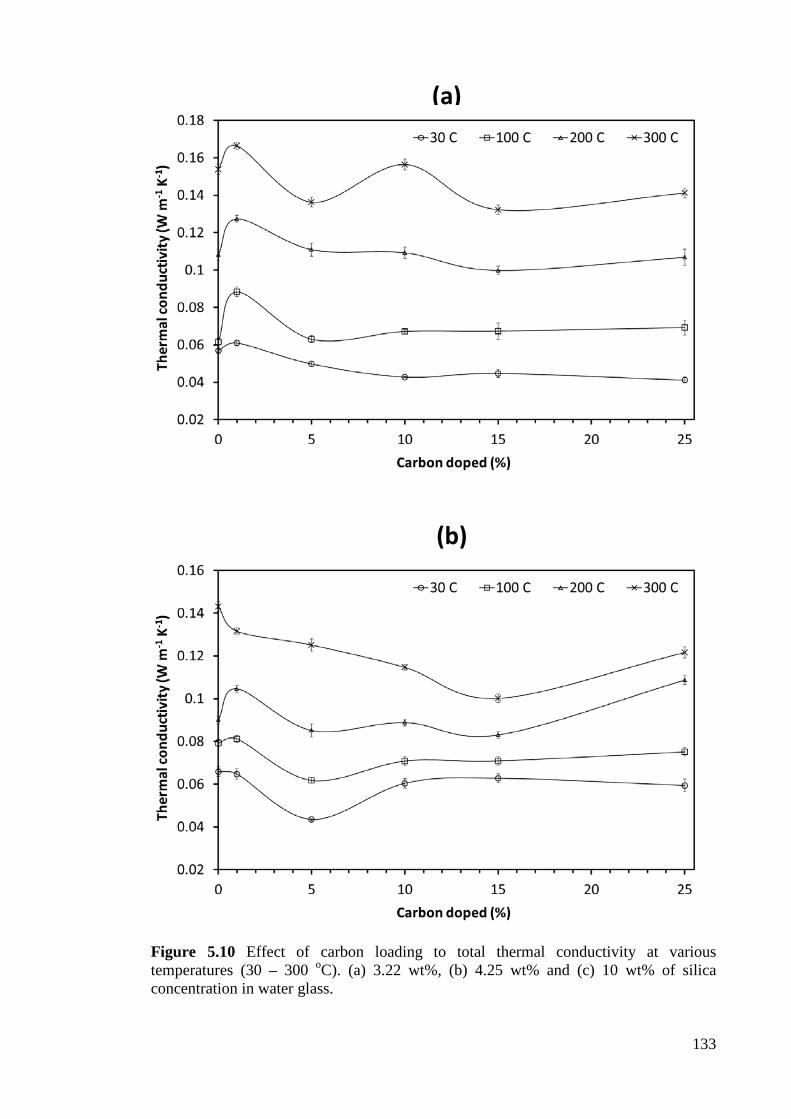
133
Figure 5.10 Effect of carbon loading to total thermal conductivity at various temperatures (30 – 300 oC). (a) 3.22 wt%, (b) 4.25 wt% and (c) 10 wt% of silica concentration in water glass.
(a)
(b)
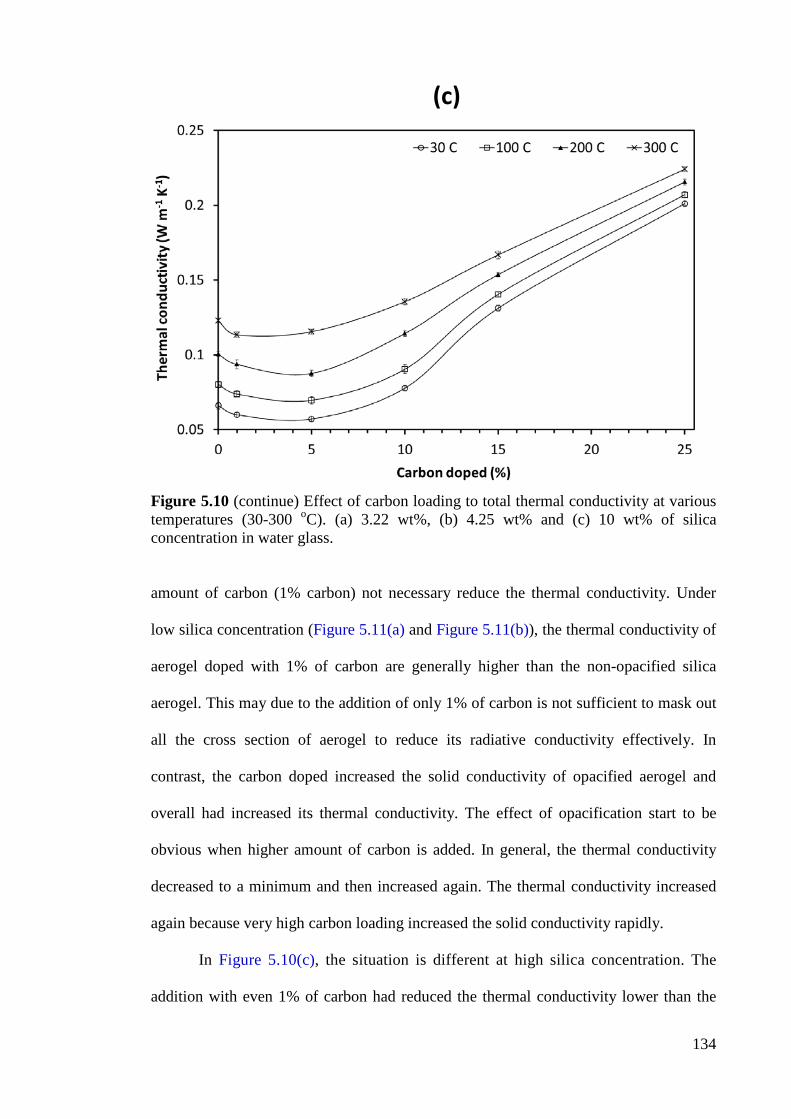
134
Figure 5.10 (continue) Effect of carbon loading to total thermal conductivity at various temperatures (30-300 oC). (a) 3.22 wt%, (b) 4.25 wt% and (c) 10 wt% of silica concentration in water glass.
amount of carbon (1% carbon) not necessary reduce the thermal conductivity. Under
low silica concentration (Figure 5.11(a) and Figure 5.11(b)), the thermal conductivity of
aerogel doped with 1% of carbon are generally higher than the non-opacified silica
aerogel. This may due to the addition of only 1% of carbon is not sufficient to mask out
all the cross section of aerogel to reduce its radiative conductivity effectively. In
contrast, the carbon doped increased the solid conductivity of opacified aerogel and
overall had increased its thermal conductivity. The effect of opacification start to be
obvious when higher amount of carbon is added. In general, the thermal conductivity
decreased to a minimum and then increased again. The thermal conductivity increased
again because very high carbon loading increased the solid conductivity rapidly.
In Figure 5.10(c), the situation is different at high silica concentration. The
addition with even 1% of carbon had reduced the thermal conductivity lower than the
(c)
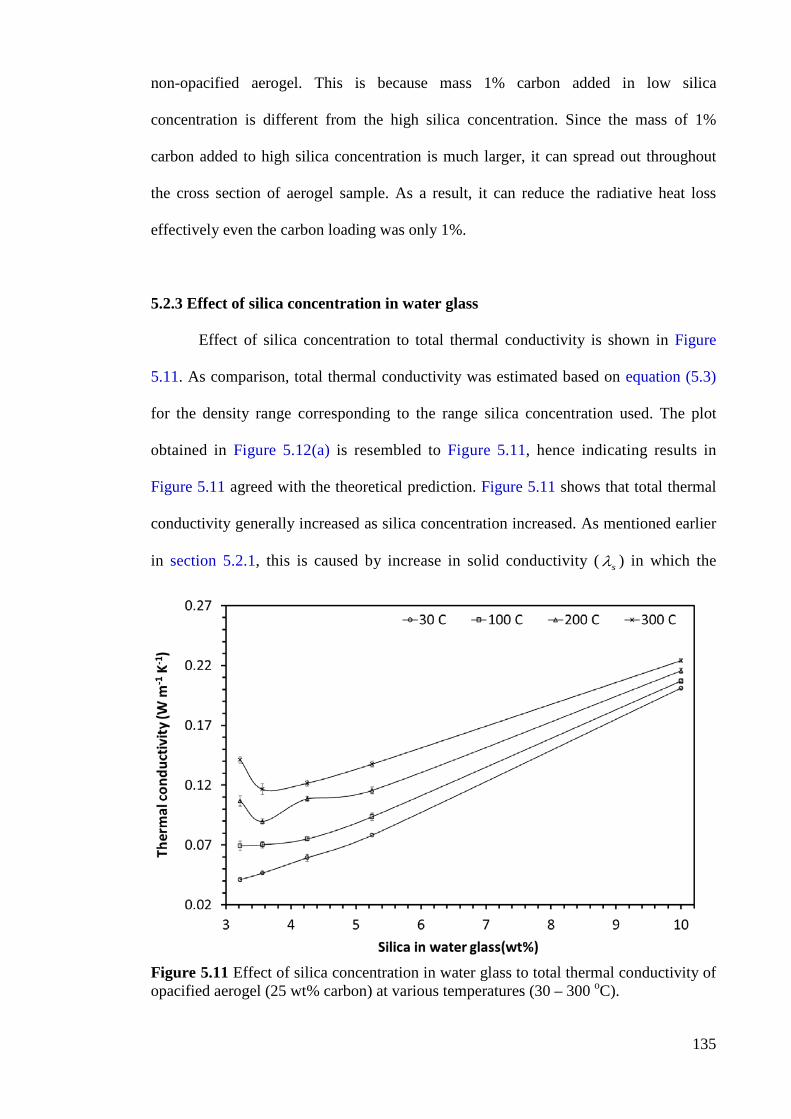
135
non-opacified aerogel. This is because mass 1% carbon added in low silica
concentration is different from the high silica concentration. Since the mass of 1%
carbon added to high silica concentration is much larger, it can spread out throughout
the cross section of aerogel sample. As a result, it can reduce the radiative heat loss
effectively even the carbon loading was only 1%.
5.2.3 Effect of silica concentration in water glass
Effect of silica concentration to total thermal conductivity is shown in Figure
5.11. As comparison, total thermal conductivity was estimated based on equation (5.3)
for the density range corresponding to the range silica concentration used. The plot
obtained in Figure 5.12(a) is resembled to Figure 5.11, hence indicating results in
Figure 5.11 agreed with the theoretical prediction. Figure 5.11 shows that total thermal
conductivity generally increased as silica concentration increased. As mentioned earlier
in section 5.2.1, this is caused by increase in solid conductivity ( sλ ) in which the
Figure 5.11 Effect of silica concentration in water glass to total thermal conductivity of opacified aerogel (25 wt% carbon) at various temperatures (30 – 300 oC).
(c)
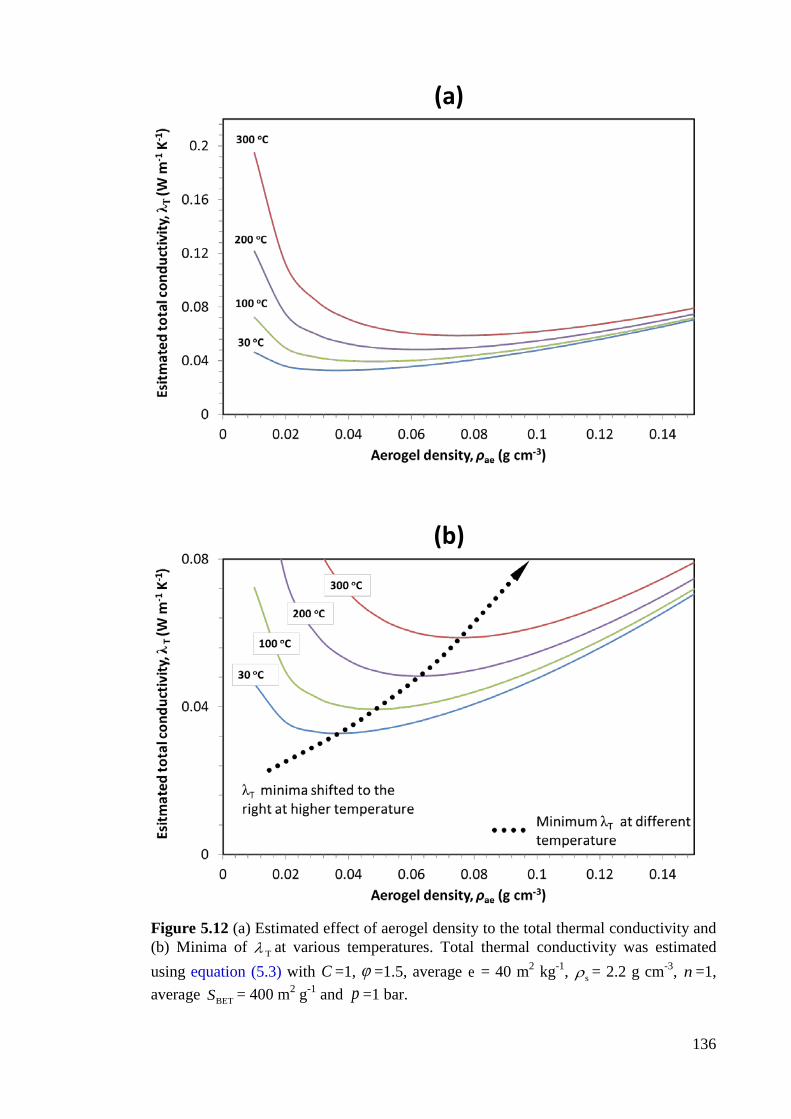
136
Figure 5.12 (a) Estimated effect of aerogel density to the total thermal conductivity and (b) Minima of Tλ at various temperatures. Total thermal conductivity was estimated using equation (5.3) with C =1, ϕ =1.5, average e = 40 m2 kg-1, sρ = 2.2 g cm-3, n =1, average BETS = 400 m2 g-1 and p =1 bar.
(a)
(b)
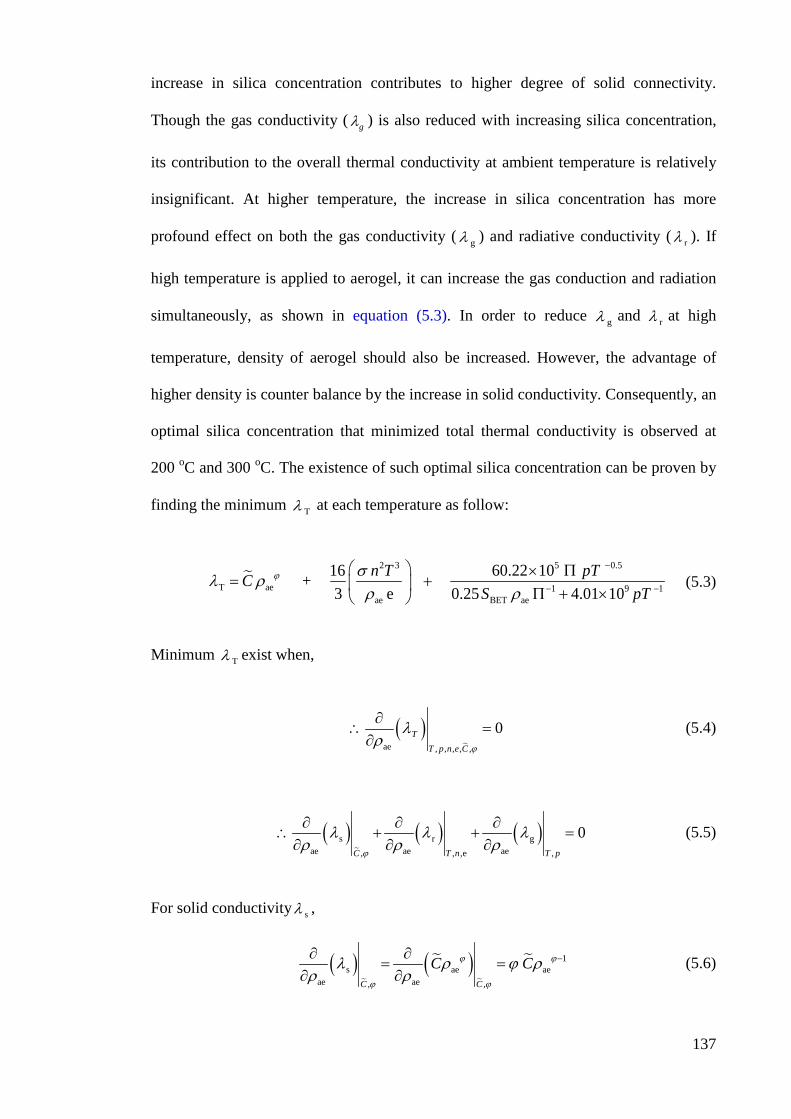
137
increase in silica concentration contributes to higher degree of solid connectivity.
Though the gas conductivity ( gλ ) is also reduced with increasing silica concentration,
its contribution to the overall thermal conductivity at ambient temperature is relatively
insignificant. At higher temperature, the increase in silica concentration has more
profound effect on both the gas conductivity ( gλ ) and radiative conductivity ( rλ ). If
high temperature is applied to aerogel, it can increase the gas conduction and radiation
simultaneously, as shown in equation (5.3). In order to reduce gλ and rλ at high
temperature, density of aerogel should also be increased. However, the advantage of
higher density is counter balance by the increase in solid conductivity. Consequently, an
optimal silica concentration that minimized total thermal conductivity is observed at
200 oC and 300 oC. The existence of such optimal silica concentration can be proven by
finding the minimum Tλ at each temperature as follow:
2 3 5 0.5
T ae 1 9 1ae BET ae
16 60.22 10 + 3 e 0.25 4.01 10
n T pTCS pT
ϕ σλ ρρ ρ
−
− −
× Π= + Π + ×
(5.3)
Minimum Tλ exist when,
( )ae , , , , ,
0TT p n e C ϕ
λρ∂
∴ =∂
(5.4)
( )
( ) ( )s r gae ae ae, , ,e ,
0C T n T pϕ
λ λ λρ ρ ρ∂ ∂ ∂
∴ + + =∂ ∂ ∂
(5.5)
For solid conductivity sλ ,
( )
( )
1s ae ae
ae ae, ,C C
C Cϕ ϕ
ϕ ϕ
λ ρ ϕ ρρ ρ
−∂ ∂= =
∂ ∂ (5.6)
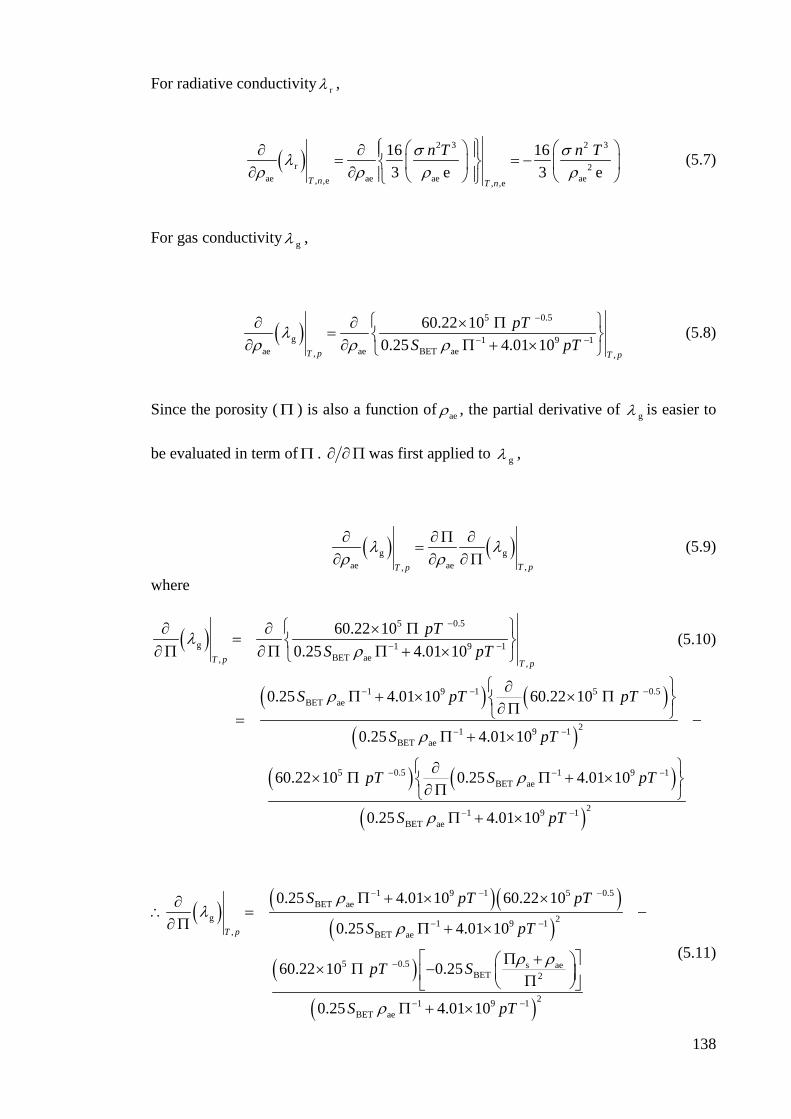
138
For radiative conductivity rλ ,
( )2 3 2 3
r 2ae ae ae ae, ,e , ,e
16 16 3 e 3 e
T n T n
n T n Tσ σλρ ρ ρ ρ
∂ ∂ = = − ∂ ∂ (5.7)
For gas conductivity gλ ,
( )5 0.5
g 1 9 1ae ae BET ae, ,
60.22 100.25 4.01 10
T p T p
pTS pT
λρ ρ ρ
−
− −
∂ ∂ × Π= ∂ ∂ Π + ×
(5.8)
Since the porosity (Π ) is also a function of aeρ , the partial derivative of gλ is easier to
be evaluated in term ofΠ . ∂ ∂Π was first applied to gλ ,
( ) ( )g gae ae ,, T pT p
λ λρ ρ∂ ∂Π ∂
=∂ ∂ ∂Π
(5.9)
where
( )5 0.5
g 1 9 1BET ae, ,
60.22 100.25 4.01 10T p T p
pTS pT
λρ
−
− −
∂ ∂ × Π= ∂Π ∂Π Π + ×
(5.10)
( ) ( )
( )
( ) ( )
( )
1 9 1 5 0.5BET ae
21 9 1BET ae
5 0.5 1 9 1BET ae
21 9 1BET ae
0.25 4.01 10 60.22 10
0.25 4.01 10
60.22 10 0.25 4.01 10
0.25 4.01 10
S pT pT
S pT
pT S pT
S pT
ρ
ρ
ρ
ρ
− − −
− −
− − −
− −
∂Π + × × Π ∂Π = −
Π + ×
∂× Π Π + × ∂Π
Π + ×
( ) ( )( )( )
( )
( )
1 9 1 5 0.5BET ae
g 21 9 1, BET ae
5 0.5 s aeBET 2
21 9 1BET ae
0.25 4.01 10 60.22 10
0.25 4.01 10
60.22 10 0.25
0.25 4.01 10
T p
S pT pT
S pT
pT S
S pT
ρλ
ρ
ρ ρ
ρ
− − −
− −
−
− −
Π + × ×∂∴ = −∂Π Π + ×
Π + × Π − Π Π + ×
(5.11)
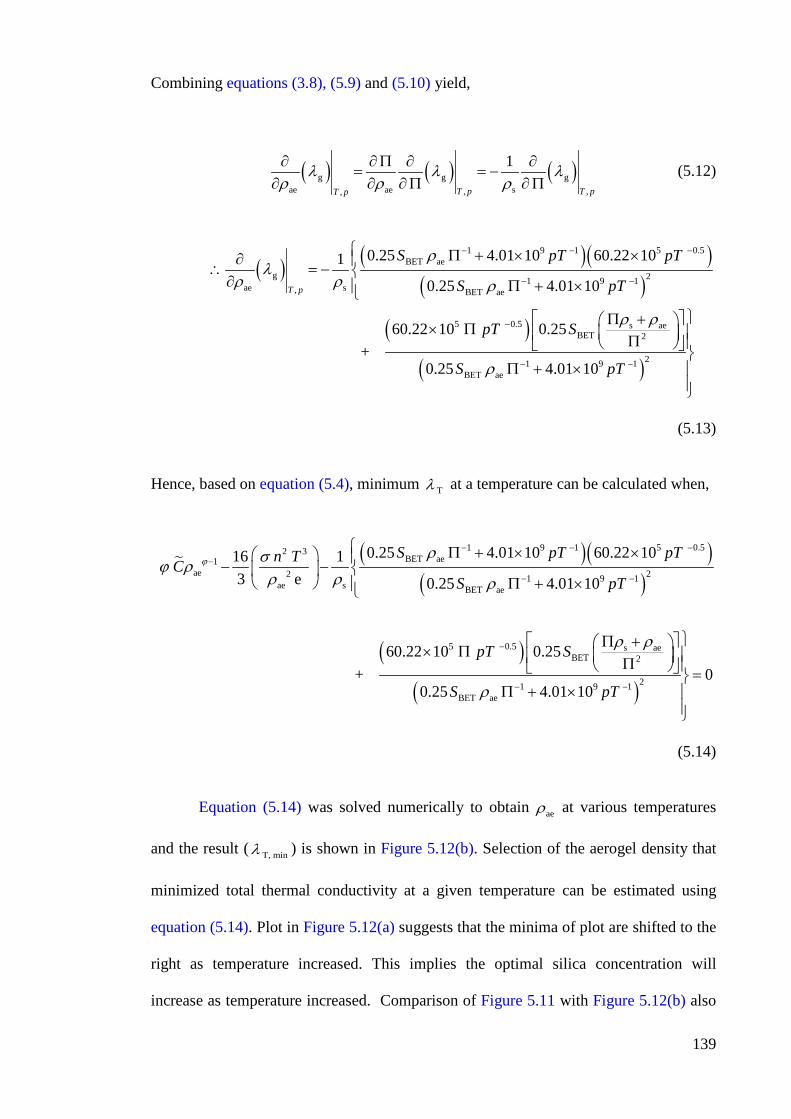
139
Combining equations (3.8), (5.9) and (5.10) yield,
( ) ( ) ( )g g gae ae s, ,,
1
T p T pT p
λ λ λρ ρ ρ∂ ∂Π ∂ ∂
= = −∂ ∂ ∂Π ∂Π
(5.12)
( ) ( )( )( )
( )
1 9 1 5 0.5BET ae
g 21 9 1ae s, BET ae
5 0.5 s aeBET 2
1 9BET ae
0.25 4.01 10 60.22 101
0.25 4.01 10
60.22 10 0.25 +
0.25 4.01 10
T p
S pT pT
S pT
pT S
S p
ρλ
ρ ρ ρ
ρ ρ
ρ
− − −
− −
−
−
Π + × ×∂ ∴ = − ∂ Π + ×
Π + × Π Π Π + ×( )21T −
(5.13)
Hence, based on equation (5.4), minimum Tλ at a temperature can be calculated when,
( )( )( )
( )
1 9 1 5 0.52 3BET ae1
ae 22 1 9 1ae s BET ae
5 0.5 s aeBET 2
0.25 4.01 10 60.22 1016 13 e 0.25 4.01 10
60.22 10 0.25 +
S pT pTn TCS pT
pT S
ϕρσϕ ρ
ρ ρ ρ
ρ ρ
− − −−
− −
−
Π + × × − − Π + ×
Π + × Π Π
( )21 9 1BET ae
00.25 4.01 10S pTρ − −
=
Π + ×
(5.14)
Equation (5.14) was solved numerically to obtain aeρ at various temperatures
and the result ( T, minλ ) is shown in Figure 5.12(b). Selection of the aerogel density that
minimized total thermal conductivity at a given temperature can be estimated using
equation (5.14). Plot in Figure 5.12(a) suggests that the minima of plot are shifted to the
right as temperature increased. This implies the optimal silica concentration will
increase as temperature increased. Comparison of Figure 5.11 with Figure 5.12(b) also
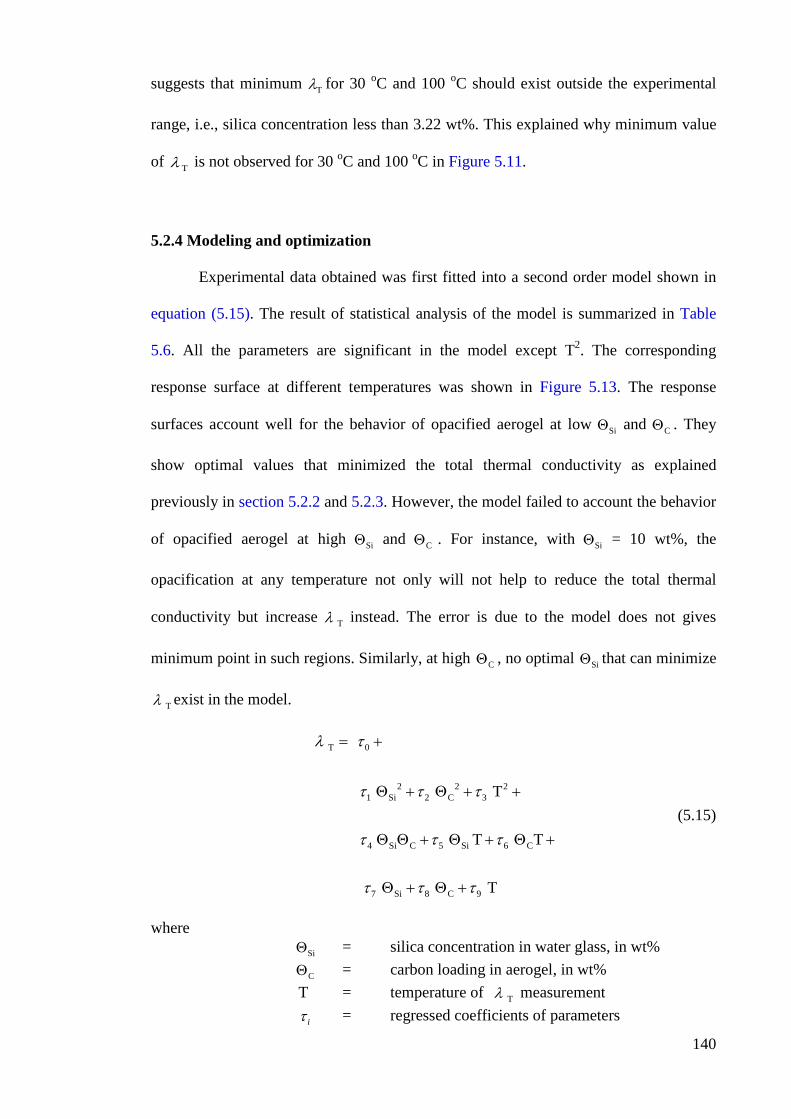
140
suggests that minimum Tλ for 30 oC and 100 oC should exist outside the experimental
range, i.e., silica concentration less than 3.22 wt%. This explained why minimum value
of Tλ is not observed for 30 oC and 100 oC in Figure 5.11.
5.2.4 Modeling and optimization
Experimental data obtained was first fitted into a second order model shown in
equation (5.15). The result of statistical analysis of the model is summarized in Table
5.6. All the parameters are significant in the model except T2. The corresponding
response surface at different temperatures was shown in Figure 5.13. The response
surfaces account well for the behavior of opacified aerogel at low SiΘ and CΘ . They
show optimal values that minimized the total thermal conductivity as explained
previously in section 5.2.2 and 5.2.3. However, the model failed to account the behavior
of opacified aerogel at high SiΘ and CΘ . For instance, with SiΘ = 10 wt%, the
opacification at any temperature not only will not help to reduce the total thermal
conductivity but increase Tλ instead. The error is due to the model does not gives
minimum point in such regions. Similarly, at high CΘ , no optimal SiΘ that can minimize
Tλ exist in the model.
T 0
2 21 Si 2 C 3
4 Si C Si C
2
5 6
7 8Si C 9
T T
T
T
λ τ
τ τ τ
τ τ τ
τ τ τ
= +
+Θ Θ +
Θ Θ Θ Θ
+
Θ
+ + +
+ +Θ
(5.15)
where SiΘ = silica concentration in water glass, in wt% CΘ = carbon loading in aerogel, in wt% T = temperature of T λ measurement
iτ = regressed coefficients of parameters
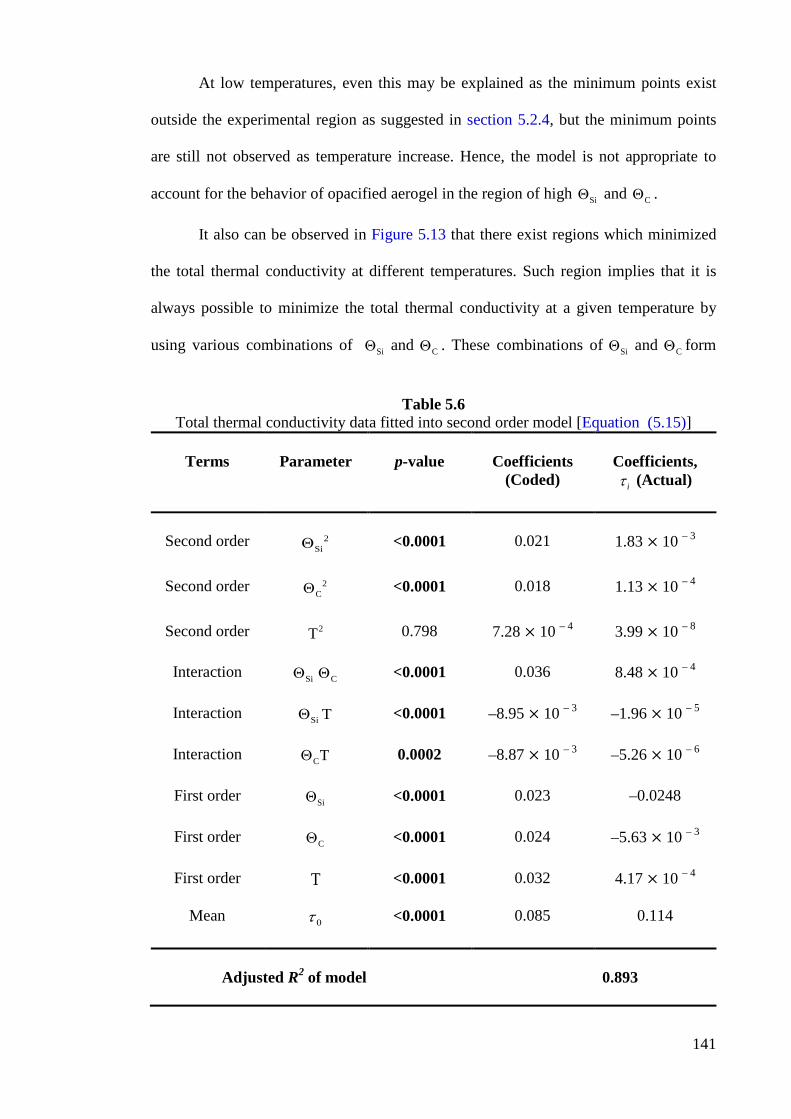
141
At low temperatures, even this may be explained as the minimum points exist
outside the experimental region as suggested in section 5.2.4, but the minimum points
are still not observed as temperature increase. Hence, the model is not appropriate to
account for the behavior of opacified aerogel in the region of high SiΘ and CΘ .
It also can be observed in Figure 5.13 that there exist regions which minimized
the total thermal conductivity at different temperatures. Such region implies that it is
always possible to minimize the total thermal conductivity at a given temperature by
using various combinations of SiΘ and CΘ . These combinations of SiΘ and CΘ form
Table 5.6
Total thermal conductivity data fitted into second order model [Equation (5.15)]
Terms
Parameter
p-value
Coefficients
(Coded)
Coefficients,
iτ (Actual)
Second order
2
SiΘ
<0.0001
0.021
1.83 × 10 – 3
Second order 2
CΘ <0.0001 0.018 1.13 × 10 – 4 Second order 2T 0.798 7.28 × 10 – 4 3.99 × 10 – 8
Interaction Si CΘ Θ <0.0001 0.036 8.48 × 10 – 4
Interaction Si TΘ <0.0001 –8.95 × 10 – 3 –1.96 × 10 – 5
Interaction CTΘ 0.0002 –8.87 × 10 – 3 –5.26 × 10 – 6
First order SiΘ <0.0001 0.023 –0.0248
First order CΘ <0.0001 0.024 –5.63 × 10 – 3
First order T <0.0001 0.032 4.17 × 10 – 4
Mean 0τ <0.0001 0.085 0.114
Adjusted R2 of model 0.893
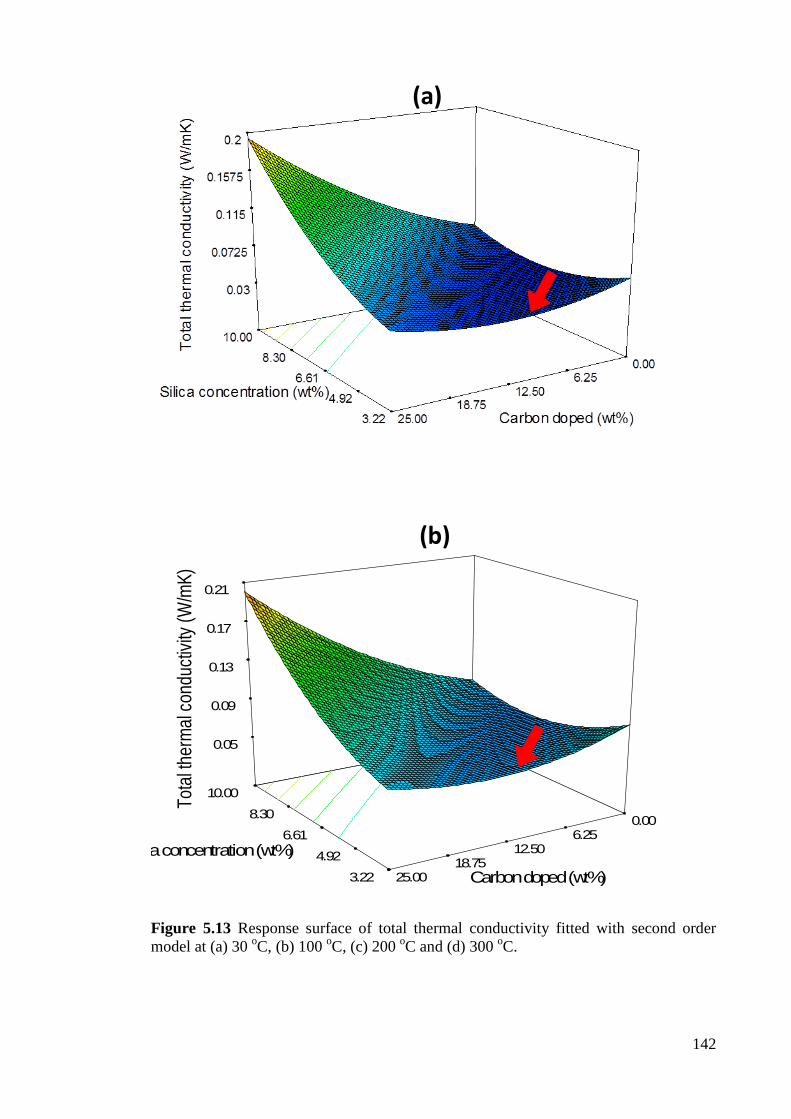
142
Figure 5.13 Response surface of total thermal conductivity fitted with second order model at (a) 30 oC, (b) 100 oC, (c) 200 oC and (d) 300 oC.
(a)
(b)
3.22 4.92
6.61 8.30
10.00
0.00 6.25
12.50 18.75
25.00
0.05
0.09
0.13
0.17
0.21
Tota
l ther
mal c
ondu
ctivit
y (W
/mK)
ca concentration (wt%)
Carbon doped (wt%)
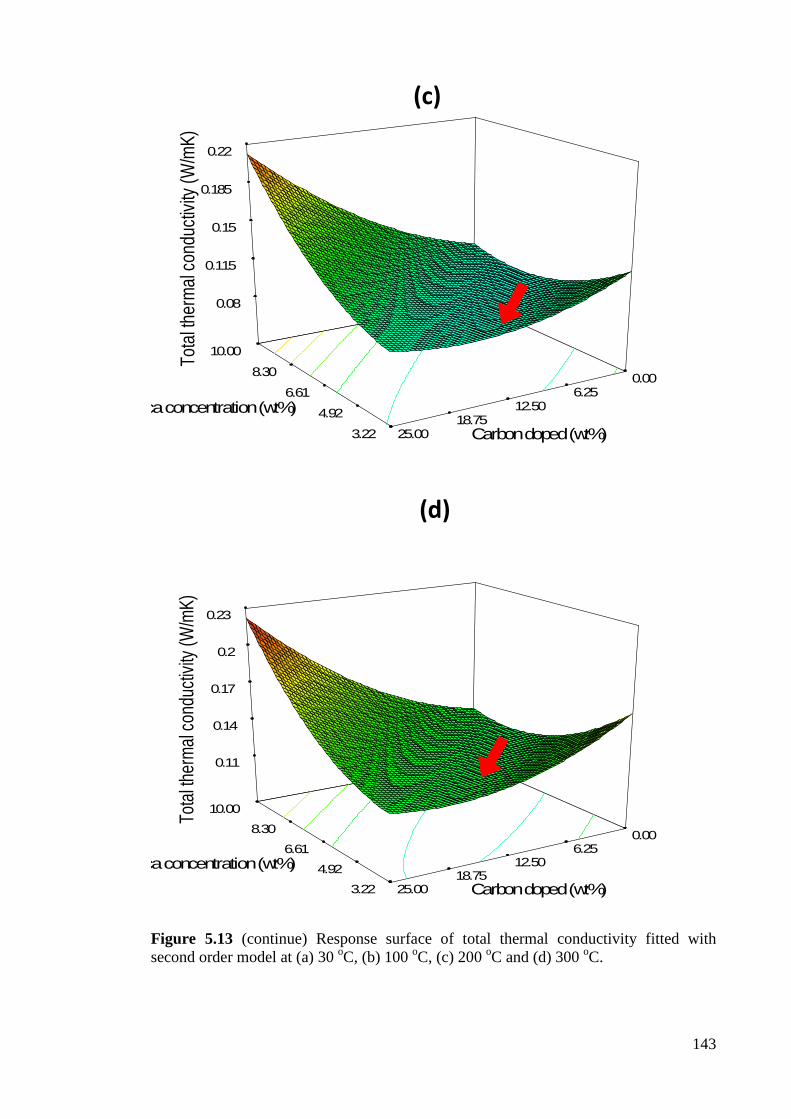
143
Figure 5.13 (continue) Response surface of total thermal conductivity fitted with second order model at (a) 30 oC, (b) 100 oC, (c) 200 oC and (d) 300 oC.
(c)
(d)
3.22 4.92
6.61 8.30
10.00
0.00 6.25
12.50 18.75
25.00
0.08
0.115
0.15
0.185
0.22
Tota
l ther
mal c
ondu
ctivit
y (W
/mK)
ca concentration (wt%)
Carbon doped (wt%)
3.22 4.92
6.61 8.30
10.00
0.00 6.25
12.50 18.75
25.00
0.11
0.14
0.17
0.2
0.23
Tota
l ther
mal c
ondu
ctivit
y (W
/mK)
ca concentration (wt%)
Carbon doped (wt%)
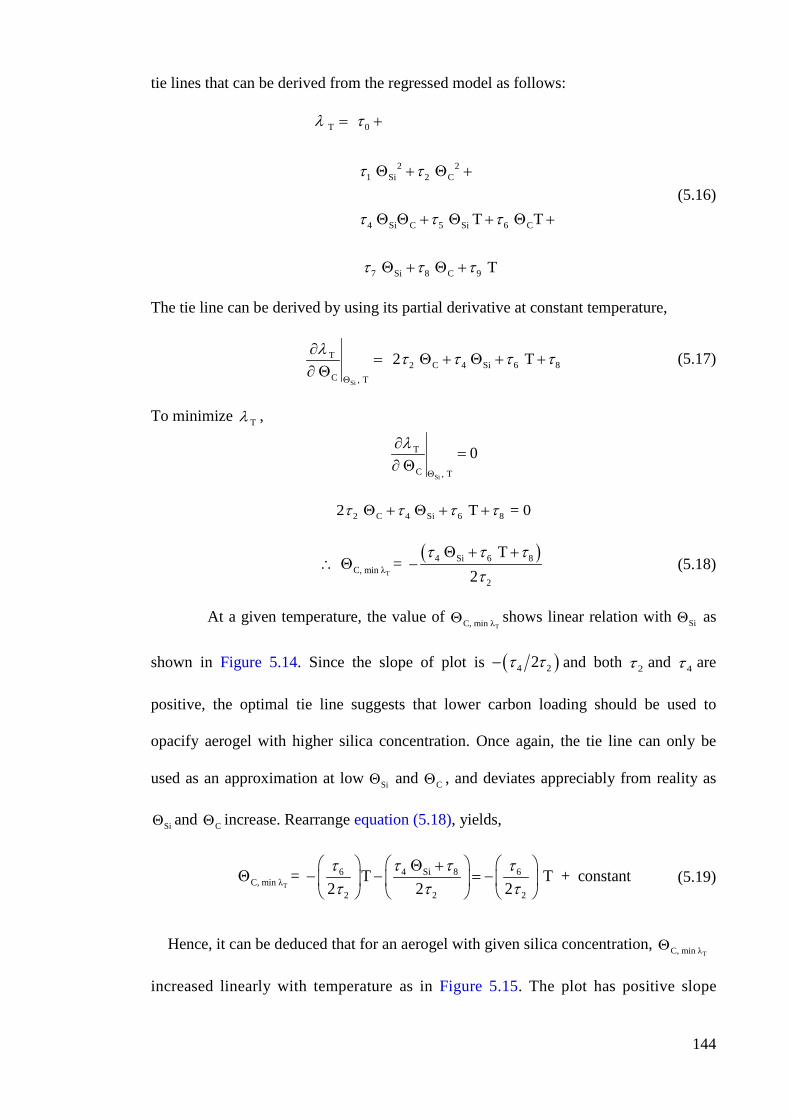
144
tie lines that can be derived from the regressed model as follows:
T 0
2 21 Si 2 C
4 Si C Si5 6
S 8
C
C7 i 9
T T
T
λ τ
τ τ
τ τ τ
τ τ τ
= +
+ +
+
Θ Θ
Θ Θ Θ
Θ Θ
+
+
Θ +
+
(5.16)
The tie line can be derived by using its partial derivative at constant temperature,
Si
TC 4 Si
C , 2 8
T6 2 T λ τ τ τ τ
Θ
∂= +Θ + +
∂ ΘΘ (5.17)
To minimize Tλ ,
Si
T
C , T
0 λ
Θ
∂=
∂ Θ
C 4 Si2 6 82 T = 0τ τ τ τ+ + +Θ Θ
( )
T
4 SiC, min λ
6 8
2
2
=T
τ τ τ
τΘ + +
∴ Θ − (5.18)
At a given temperature, the value of
TC, min λΘ shows linear relation with SiΘ as
shown in Figure 5.14. Since the slope of plot is ( )24 2τ τ− and both 2τ and 4τ are
positive, the optimal tie line suggests that lower carbon loading should be used to
opacify aerogel with higher silica concentration. Once again, the tie line can only be
used as an approximation at low SiΘ and CΘ , and deviates appreciably from reality as
SiΘ and CΘ increase. Rearrange equation (5.18), yields,
T
4 Si6 8 6
2 2 2C, min λ T T + con stant
2=
2 2 τ τ τ τ
τ τ τ Θ
Θ − − = −
+
(5.19)
Hence, it can be deduced that for an aerogel with given silica concentration, TC, min λΘ
increased linearly with temperature as in Figure 5.15. The plot has positive slope
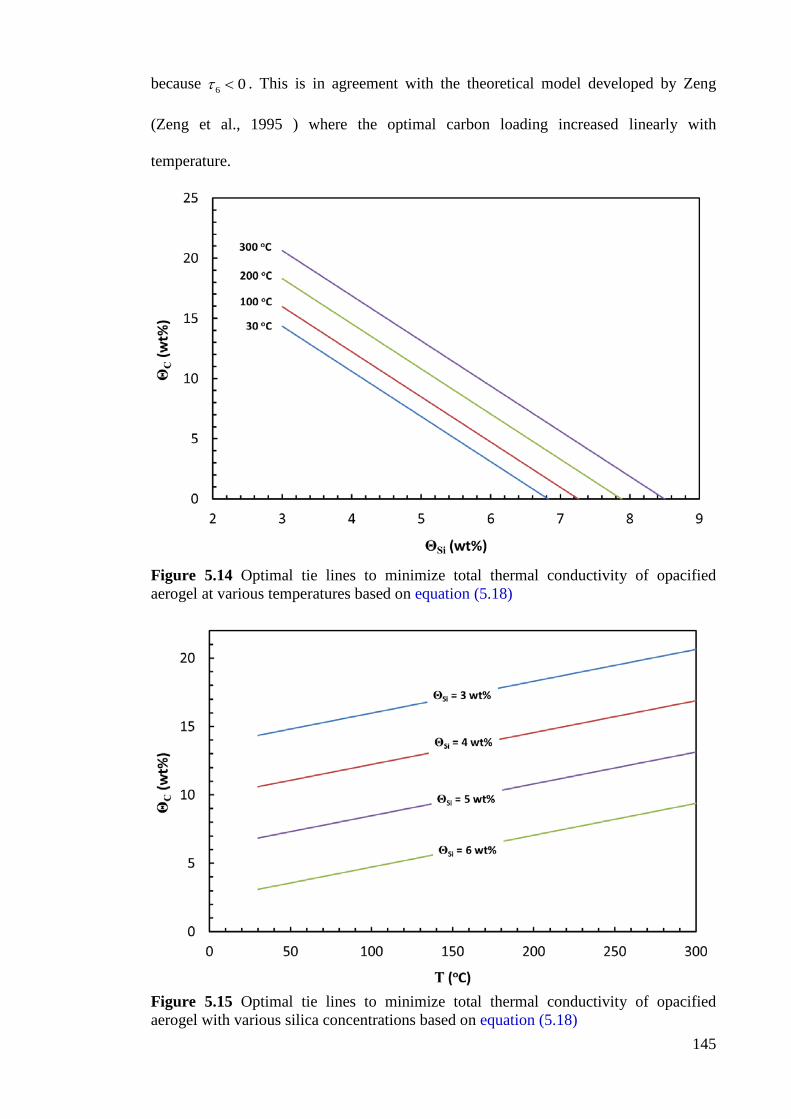
145
because 6 0τ < . This is in agreement with the theoretical model developed by Zeng
(Zeng et al., 1995 ) where the optimal carbon loading increased linearly with
temperature.
Figure 5.14 Optimal tie lines to minimize total thermal conductivity of opacified aerogel at various temperatures based on equation (5.18)
Figure 5.15 Optimal tie lines to minimize total thermal conductivity of opacified aerogel with various silica concentrations based on equation (5.18)
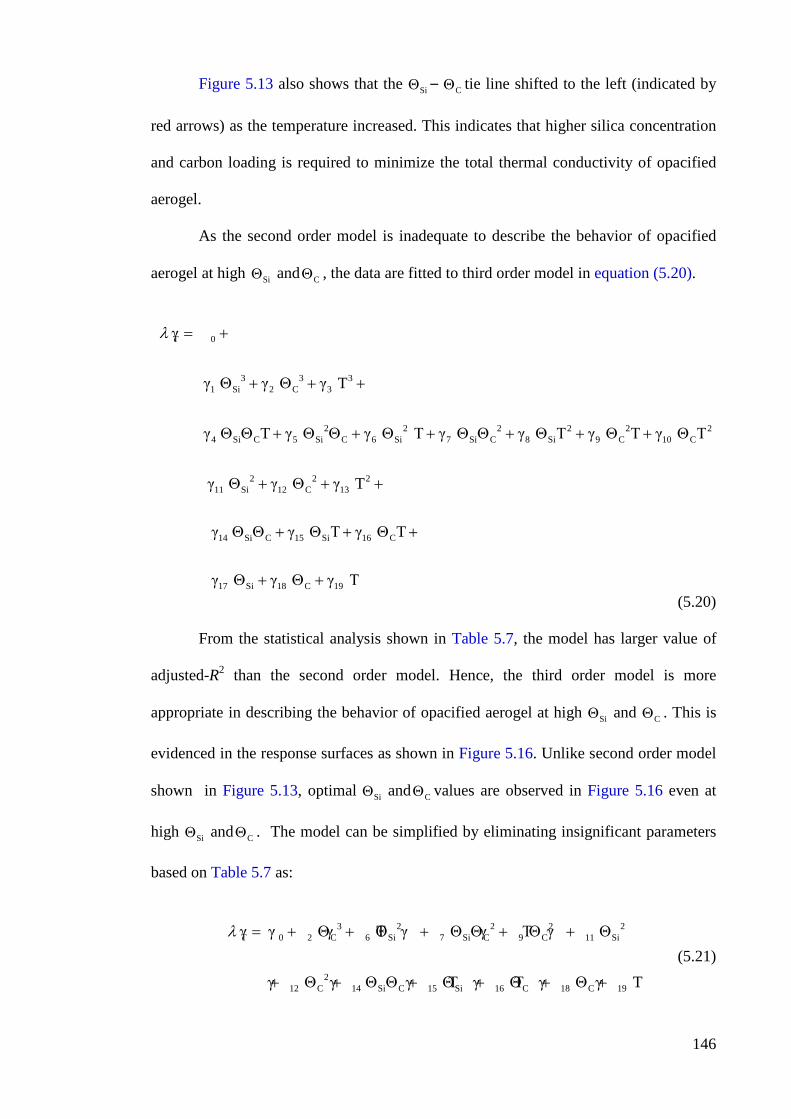
146
Figure 5.13 also shows that the SiΘ – CΘ tie line shifted to the left (indicated by
red arrows) as the temperature increased. This indicates that higher silica concentration
and carbon loading is required to minimize the total thermal conductivity of opacified
aerogel.
As the second order model is inadequate to describe the behavior of opacified
aerogel at high SiΘ and CΘ , the data are fitted to third order model in equation (5.20).
T 0
1 Si 2 C 3
4 Si C Si C Si Si C Si C C
Si C
1
3 3 3
2 2 2 2 2 25 6 7 8 9 10
2 2 211 12 13
4 Si 15C C1Si 6
γ
γ γ γ
γ γ γ T γ γ T γ T
T
T γ T
γ γ γ
γ γ T γ
T
T
λ = +
+ +
+
Θ Θ +
Θ Θ Θ Θ Θ Θ Θ Θ Θ Θ
Θ Θ +
Θ Θ Θ Θ
+ + + + +
+ +
+ + +
17 19C18Si γ γ γ T Θ +Θ+
(5.20)
From the statistical analysis shown in Table 5.7, the model has larger value of
adjusted-R2 than the second order model. Hence, the third order model is more
appropriate in describing the behavior of opacified aerogel at high SiΘ and CΘ . This is
evidenced in the response surfaces as shown in Figure 5.16. Unlike second order model
shown in Figure 5.13, optimal SiΘ and CΘ values are observed in Figure 5.16 even at
high SiΘ and CΘ . The model can be simplified by eliminating insignificant parameters
based on Table 5.7 as:
T 0 2 C Si Si C C Si
C 14 Si C Si
3 2 2 2 26 7 9 11
212 15 16 18C C 19
γ γ γ T γ γ T γ
γ γ γ T γ T γ γ
T
λ Θ + Θ Θ Θ Θ Θ
Θ Θ Θ Θ
= + + + +
+ + + + + +Θ Θ
(5.21)
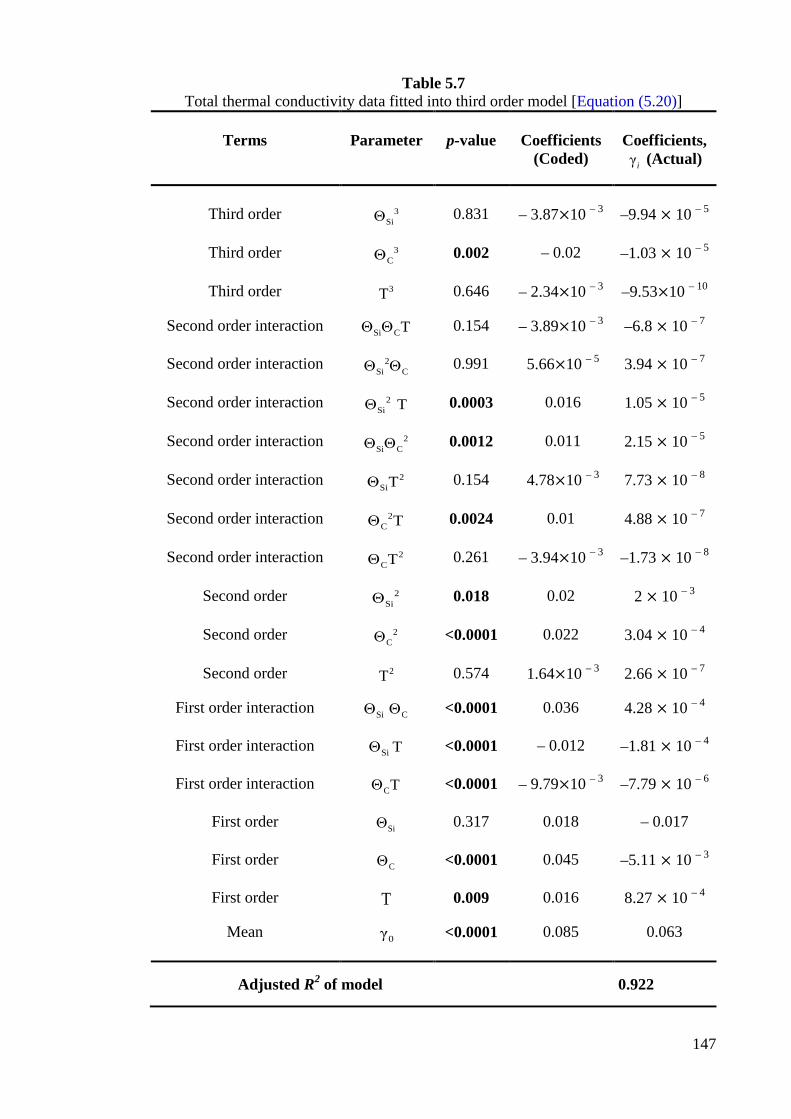
147
Table 5.7 Total thermal conductivity data fitted into third order model [Equation (5.20)]
Terms
Parameter
p-value
Coefficients
(Coded)
Coefficients, γi (Actual)
Third order
3
SiΘ
0.831
– 3.87×10 – 3
–9.94 × 10 – 5
Third order 3
CΘ 0.002 – 0.02 –1.03 × 10 – 5
Third order 3T 0.646 – 2.34×10 – 3 –9.53×10 – 10
Second order interaction Si CTΘ Θ 0.154 – 3.89×10 – 3 –6.8 × 10 – 7
Second order interaction Si C
2Θ Θ 0.991 5.66×10 – 5 3.94 × 10 – 7
Second order interaction 2Si T Θ 0.0003 0.016 1.05 × 10 – 5
Second order interaction
Si C2Θ Θ 0.0012 0.011 2.15 × 10 – 5
Second order interaction 2
SiTΘ 0.154 4.78×10 – 3 7.73 × 10 – 8
Second order interaction 2C TΘ 0.0024 0.01 4.88 × 10 – 7
Second order interaction 2
CTΘ 0.261 – 3.94×10 – 3 –1.73 × 10 – 8
Second order 2SiΘ 0.018 0.02 2 × 10 – 3
Second order 2
CΘ <0.0001 0.022 3.04 × 10 – 4
Second order 2T 0.574 1.64×10 – 3 2.66 × 10 – 7
First order interaction Si CΘ Θ <0.0001 0.036 4.28 × 10 – 4
First order interaction Si TΘ <0.0001 – 0.012 –1.81 × 10 – 4
First order interaction CTΘ <0.0001 – 9.79×10 – 3 –7.79 × 10 – 6
First order SiΘ 0.317 0.018 – 0.017
First order CΘ <0.0001 0.045 –5.11 × 10 – 3
First order T 0.009 0.016 8.27 × 10 – 4
Mean 0γ <0.0001 0.085 0.063 Adjusted R2 of model 0.922
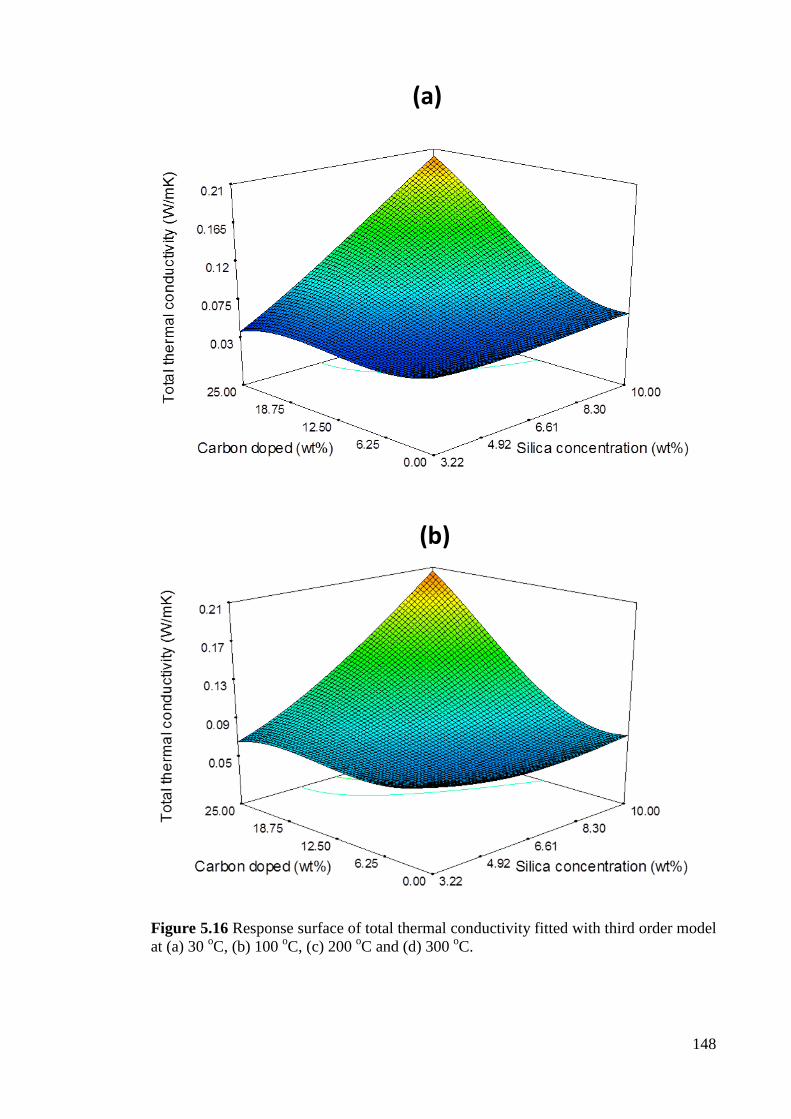
148
Figure 5.16 Response surface of total thermal conductivity fitted with third order model at (a) 30 oC, (b) 100 oC, (c) 200 oC and (d) 300 oC.
(a)
(b)
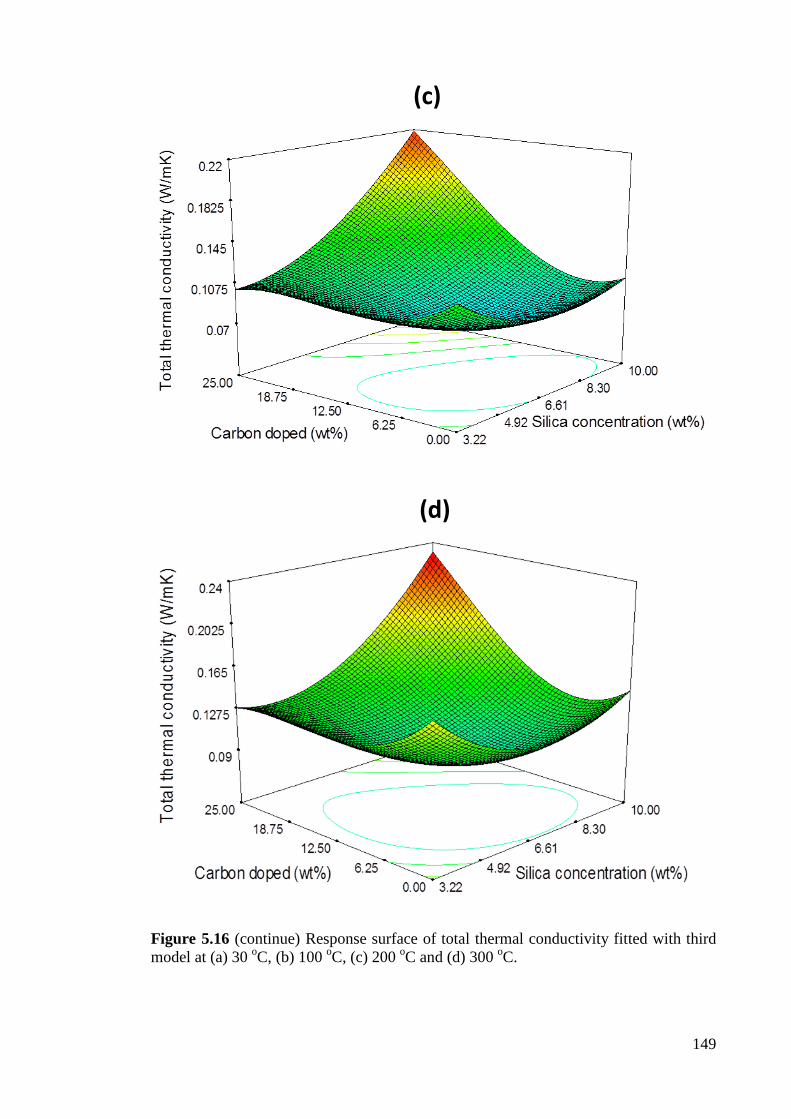
149
Figure 5.16 (continue) Response surface of total thermal conductivity fitted with third model at (a) 30 oC, (b) 100 oC, (c) 200 oC and (d) 300 oC.
(c)
(d)
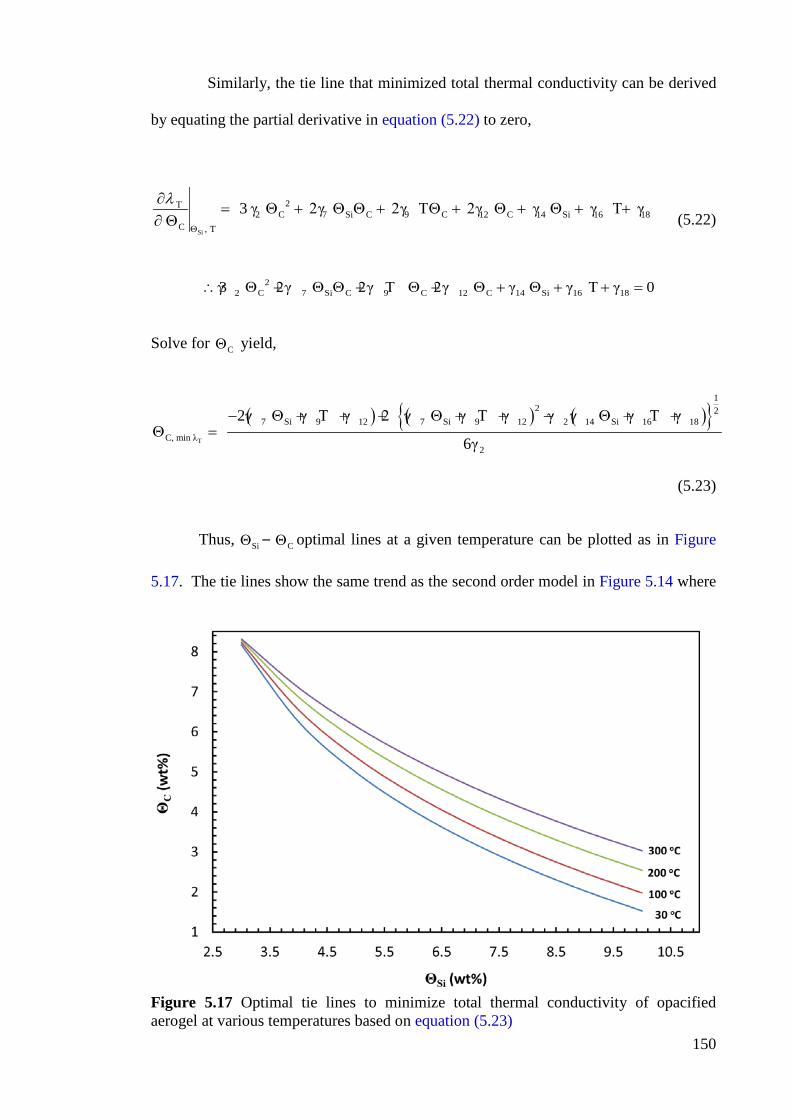
150
Similarly, the tie line that minimized total thermal conductivity can be derived
by equating the partial derivative in equation (5.22) to zero,
Si
27 9 12
T2 C Si C C C 14 Si
C 6
,1 1
T8 3 γ 2γ 2γ T 2γ γ γ T γ
λ
Θ
∂= + + + + +Θ +
ΘΘ
∂Θ Θ Θ Θ
(5.22)
2 C Si C C C 14 S2
7 9 12 16 18i 3γ 2γ 2γ T 2γ γ γ T γ 0∴ + + + + +Θ Θ +Θ Θ Θ Θ =
Solve for CΘ yield,
( ) ( ) ( ){ }T
7
12 2
Si Si 2 14 Si
C, min
9 12 7 9 12 1
λ2
6 18 2γ γ T γ 2 γ γ T γ γ γ γ T γ
6γ
Θ Θ Θ− + + + + + − + +=Θ
(5.23)
Thus, SiΘ – CΘ optimal lines at a given temperature can be plotted as in Figure
5.17. The tie lines show the same trend as the second order model in Figure 5.14 where
Figure 5.17 Optimal tie lines to minimize total thermal conductivity of opacified aerogel at various temperatures based on equation (5.23)
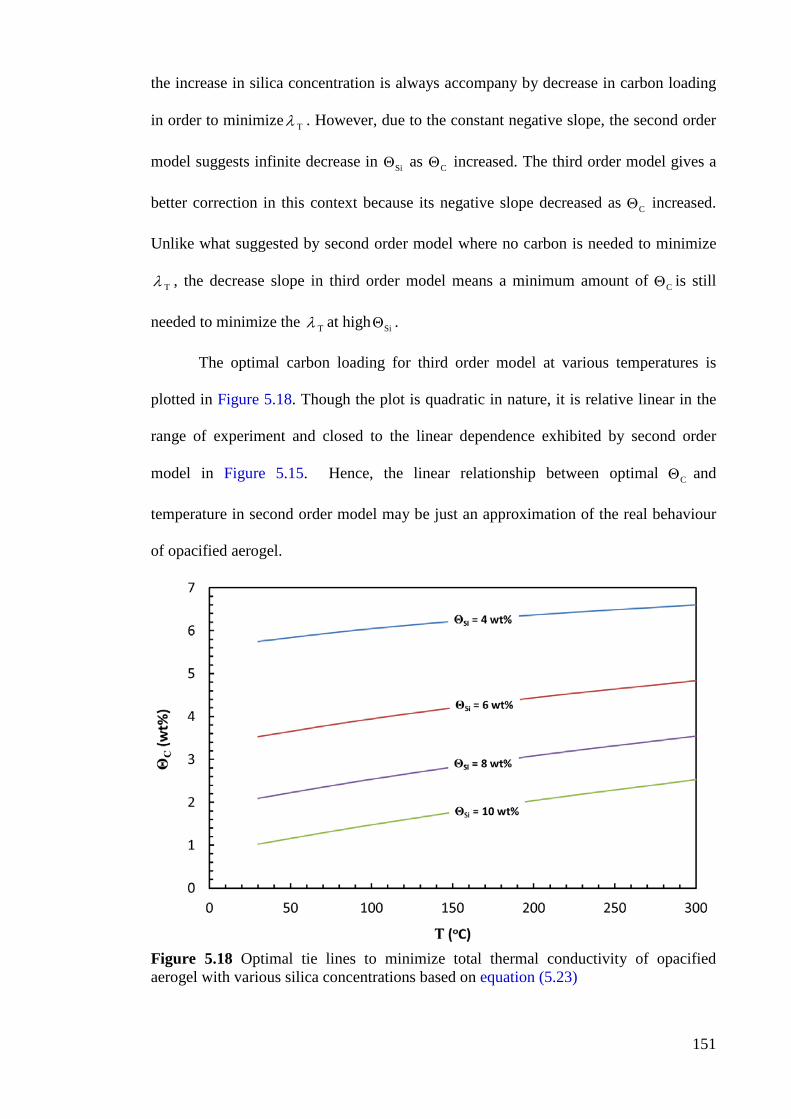
151
the increase in silica concentration is always accompany by decrease in carbon loading
in order to minimize Tλ . However, due to the constant negative slope, the second order
model suggests infinite decrease in SiΘ as CΘ increased. The third order model gives a
better correction in this context because its negative slope decreased as CΘ increased.
Unlike what suggested by second order model where no carbon is needed to minimize
Tλ , the decrease slope in third order model means a minimum amount of CΘ is still
needed to minimize the Tλ at high SiΘ .
The optimal carbon loading for third order model at various temperatures is
plotted in Figure 5.18. Though the plot is quadratic in nature, it is relative linear in the
range of experiment and closed to the linear dependence exhibited by second order
model in Figure 5.15. Hence, the linear relationship between optimal CΘ and
temperature in second order model may be just an approximation of the real behaviour
of opacified aerogel.
Figure 5.18 Optimal tie lines to minimize total thermal conductivity of opacified aerogel with various silica concentrations based on equation (5.23)
152
Another difference between the response surfaces of second order (Figure 5.13)
and third order (Figure 5.16) model is that second order model has relatively flat
minimum line (indicated by red arrow in Figure 5.13). Whereas, a local minimum point
in third order model becomes more obvious as temperature increased. This implies at a
given temperature, the minimum total thermal conductivity is confined in a rather small
region in third order model. In second order model, the minimum at a given
temperature is more robust to different combinations of – . In contrast, the
minimum at a given temperature in third order model requires only a specific
combination of – . Deviation of this specific combination of – will cause
the to increase significantly, despite the partial minimum in respect to either
or can still be obtained by utilizing the tie lines in Figure 5.17. In order to find
the exact minimum of at a given temperature using third order model, the partial
derivative of equation (5.21) in respect to is given as,
C
2 TSi C Si 14 C
Si , T6 7 11 15 2 γ γ 2γ γ γ T
λ
Θ
∂= + + +Θ+Θ Θ Θ
∂ Θ (5.24)
The partial minimum of in respect to is obtained by equating equation
(5.24) to zero, which yield,
( )
( )T
7 14 15
6 11
2C C
Si, m n2
i λ
γ γ γ T =
γ γ γ2
+ +Θ Θ∴ Θ −
+ (5.25)
Hence, the specific combination of – that gives exact minimum of at
a given temperature can be determined by solving equations (5.23) and (5.25). The
result is summarized two tie lines ( T– and – ) in Figure 5.19. The figure can
be used to determine the best combination of – that minimize at a given
Tλ
SiΘ CΘ
Tλ
SiΘ CΘ SiΘ CΘ
Tλ Tλ
SiΘ CΘ
Tλ
SiΘ
Tλ SiΘ
SiΘ CΘ Tλ
SiΘ SiΘ CΘ
SiΘ CΘ Tλ
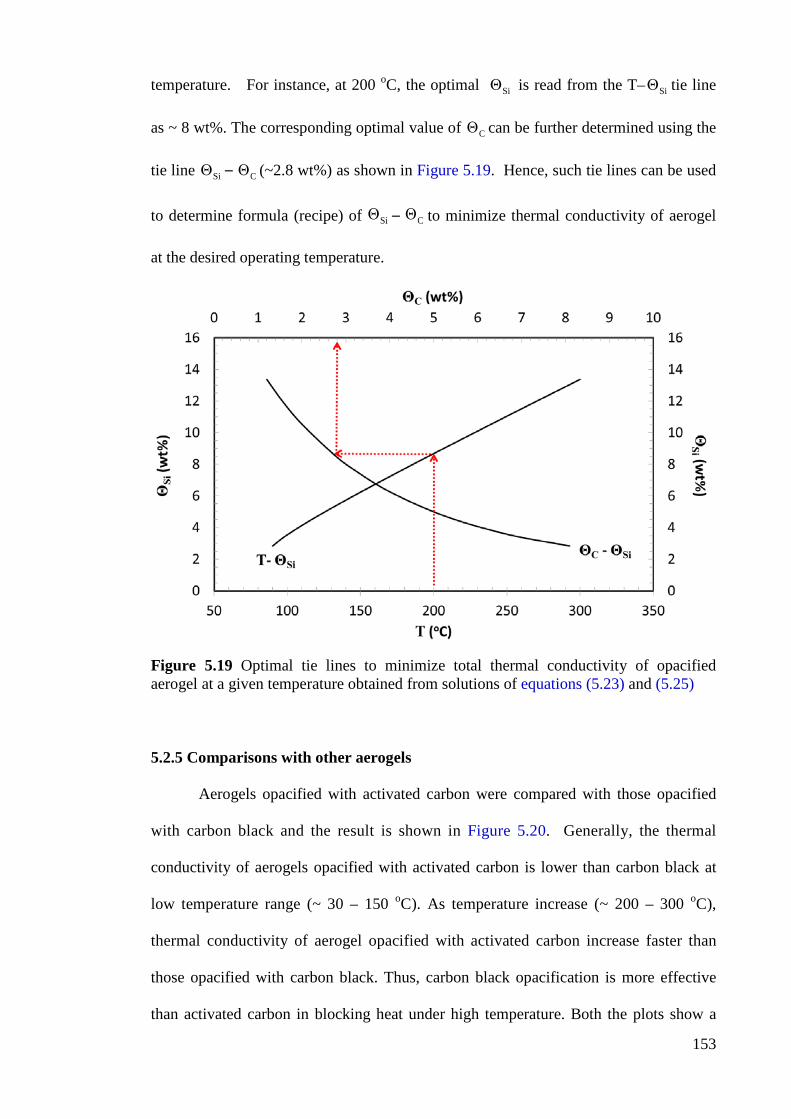
153
temperature. For instance, at 200 oC, the optimal is read from the T– tie line
as ~ 8 wt%. The corresponding optimal value of can be further determined using the
tie line – (~2.8 wt%) as shown in Figure 5.19. Hence, such tie lines can be used
to determine formula (recipe) of – to minimize thermal conductivity of aerogel
at the desired operating temperature.
Figure 5.19 Optimal tie lines to minimize total thermal conductivity of opacified aerogel at a given temperature obtained from solutions of equations (5.23) and (5.25)
5.2.5 Comparisons with other aerogels
Aerogels opacified with activated carbon were compared with those opacified
with carbon black and the result is shown in Figure 5.20. Generally, the thermal
conductivity of aerogels opacified with activated carbon is lower than carbon black at
low temperature range (~ 30 – 150 oC). As temperature increase (~ 200 – 300 oC),
thermal conductivity of aerogel opacified with activated carbon increase faster than
those opacified with carbon black. Thus, carbon black opacification is more effective
than activated carbon in blocking heat under high temperature. Both the plots show a
SiΘ SiΘ
CΘ
SiΘ CΘ
SiΘ CΘ
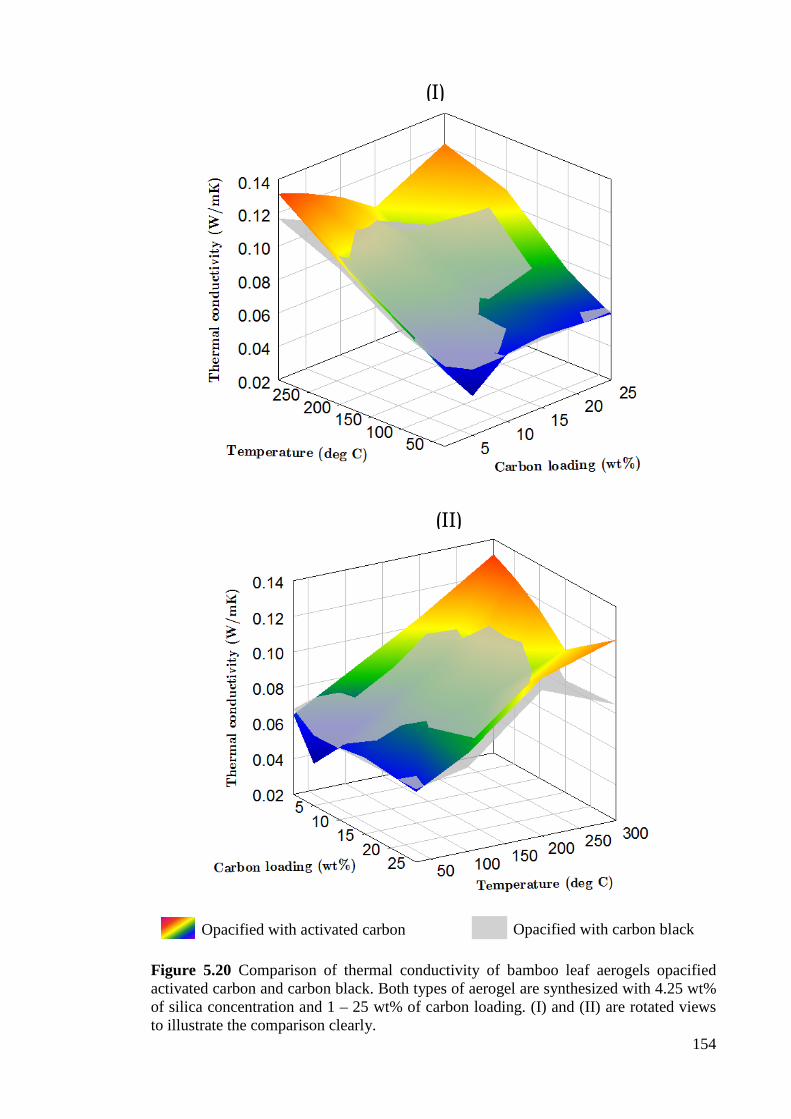
154
Figure 5.20 Comparison of thermal conductivity of bamboo leaf aerogels opacified activated carbon and carbon black. Both types of aerogel are synthesized with 4.25 wt% of silica concentration and 1 – 25 wt% of carbon loading. (I) and (II) are rotated views to illustrate the comparison clearly.
(I)
(II)
Opacified with activated carbon
Opacified with carbon black
155
kink at each level of temperature. This again verified that an optimal carbon loading
exists to minimize the thermal conductivity. The kink at 30 oC occurs at approximately
5 wt% of carbon and shifted to approximately 15 wt% at 300 oC. This optimal carbon
loading shifted because more carbon is needed to absorb the larger amount of radiation
at high temperature.
These results verified that the use of porous activated carbon had reduced the
solid conductivity of opacified aerogel. The thermal conductivity of carbon black
opacification is larger than activated carbon (at ~30 – 150 oC) because of its high
density that contributes directly to the increase in solid conductivity of aerogel. At
higher temperature range (~ 200 – 300 oC), however, the advantage of low density is
override by high radiative conductivity as indicated by the T 3 dependence in equation
(2.5). This is reasonable since activated carbon had shown higher infrared transmission
than carbon black (Figure 5.8). Based on Wien’s displacement law, as temperature
increase to the range of 200 -300 oC, the wavenumber corresponding to the maximum
intensity of radiation is shifted to 1630 – 1980 cm-1. As the infrared transmission of
activated carbon is higher than carbon in this range (Figure 5.8), the aerogel opacified
with carbon black is more effective in masking the radiation thus giving lower total
conductivity. The higher infrared transmittance of activated carbon may cause by its
porous nature where radiation may passes through the porous structure without
absorbed much by the activated carbon.
The bamboo leaf aerogel was also compared with TEOS aerogel. Figure 5.21
shows both the plots exhibit the similar trends in response to temperature and carbon
loading. It is obvious that the thermal conductivity of bamboo leaf aerogels is lower
than TEOS aerogels, which is in average 16.13% lower than TEOS aerogels. Such
differences again verified that thermal conductivity of aerogel can be different even they
were synthesized with same silica concentration and opacified with same amount of
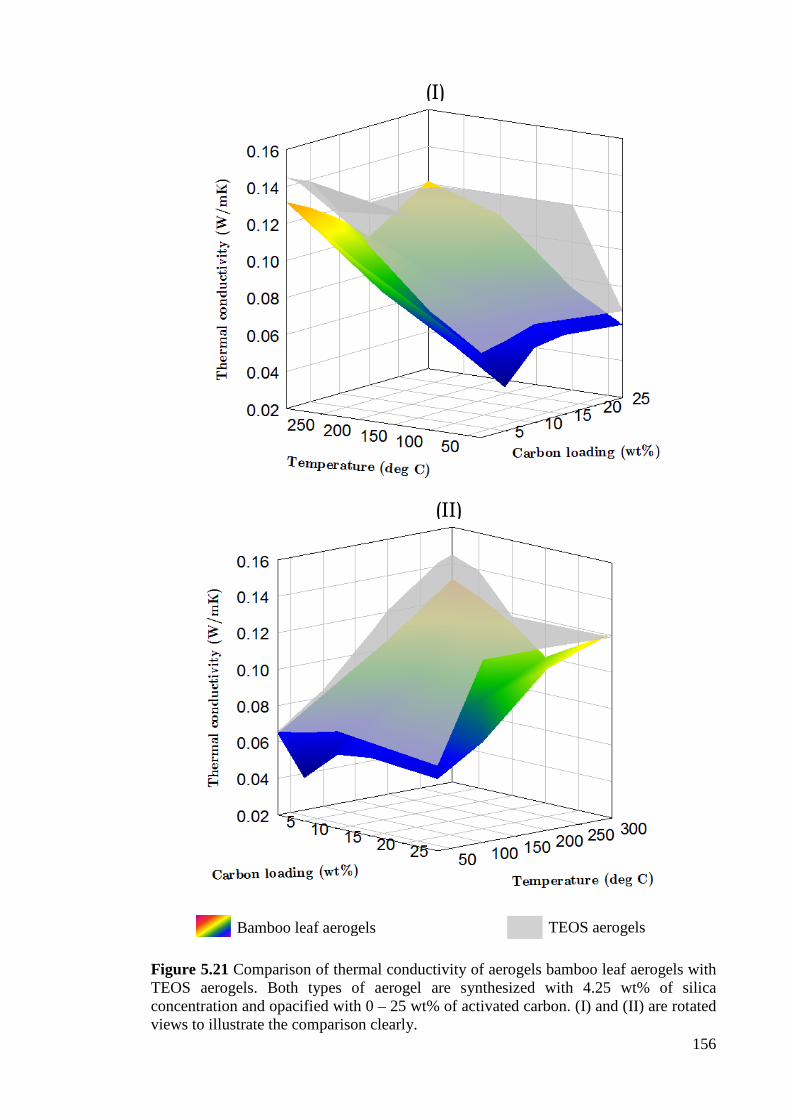
156
Figure 5.21 Comparison of thermal conductivity of aerogels bamboo leaf aerogels with TEOS aerogels. Both types of aerogel are synthesized with 4.25 wt% of silica concentration and opacified with 0 – 25 wt% of activated carbon. (I) and (II) are rotated views to illustrate the comparison clearly.
(I)
(II)
Bamboo leaf aerogels
TEOS aerogels
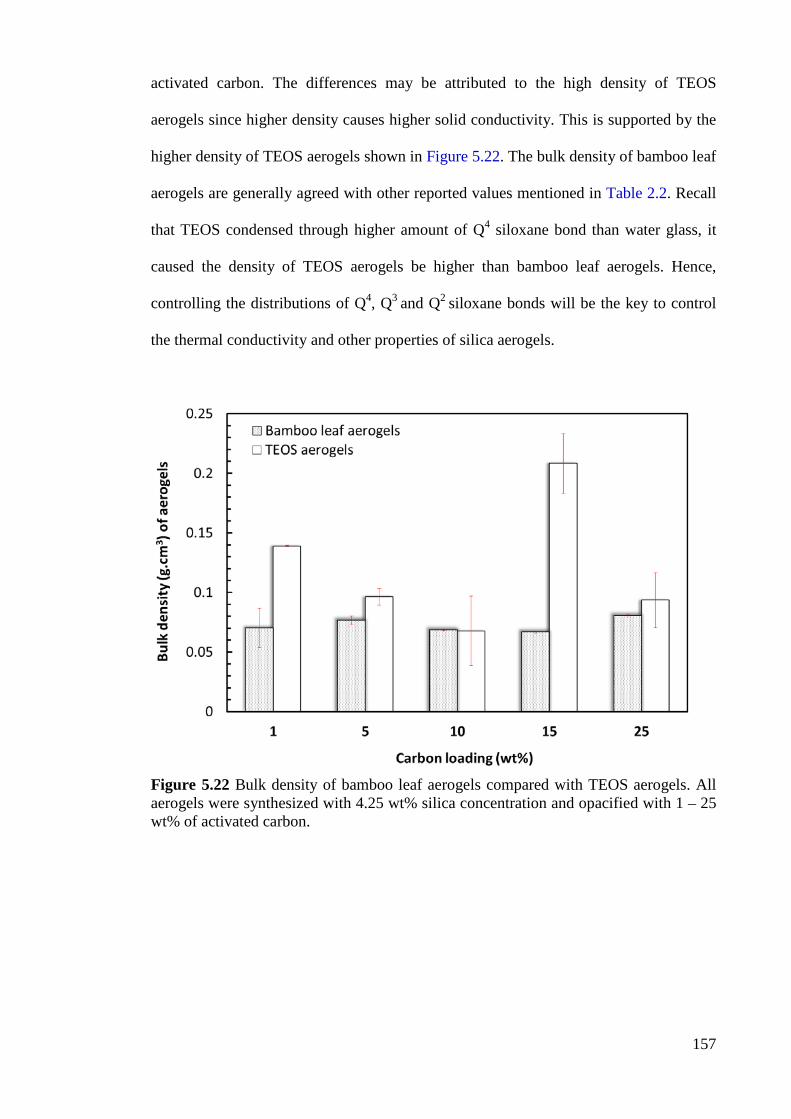
157
activated carbon. The differences may be attributed to the high density of TEOS
aerogels since higher density causes higher solid conductivity. This is supported by the
higher density of TEOS aerogels shown in Figure 5.22. The bulk density of bamboo leaf
aerogels are generally agreed with other reported values mentioned in Table 2.2. Recall
that TEOS condensed through higher amount of Q4 siloxane bond than water glass, it
caused the density of TEOS aerogels be higher than bamboo leaf aerogels. Hence,
controlling the distributions of Q4, Q3 and Q2 siloxane bonds will be the key to control
the thermal conductivity and other properties of silica aerogels.
Figure 5.22 Bulk density of bamboo leaf aerogels compared with TEOS aerogels. All aerogels were synthesized with 4.25 wt% silica concentration and opacified with 1 – 25 wt% of activated carbon.
158
5.2.6 Summary
Activated carbon had been successfully synthesized from bamboo leaf and used
to opacified bamboo leaf aerogel. The results show that carbon loading and silica
concentration have great influence on the thermal conductivity of opacified aerogel. The
combined effects of these parameters are both related implicitly to the density of
aerogel. The dependence of minimum thermal conductivity to aerogel density was
derived and illustrated in this chapter. Statistical regression developed was used to
derive tie lines that minimize thermal conductivity of aerogel with proper combination
of carbon loading and silica concentration. Comparison with TEOS aerogels proven that
thermal conductivity of bamboo leaf aerogels is generally lower than TEOS aerogels. In
term of opacifiers, activated carbon is more effective than carbon black in opacifying
aerogel under low temperature (~30 – 150 oC). However, the thermal conductivity of
activated carbon aerogels is higher than carbon black aerogels in the temperature ranged
from ~200 – 300 oC.
159
CHAPTER 6
CONCLUSIONS AND RECOMMENDATIONS
6.1 Conclusions
Bio-silica was successfully extracted from bamboo leaves and cogon grass to
study their suitability to replace alkoxides as precursor in the synthesis of silica aerogel.
Based on the study, cogon grass contains relatively low concentration of silica (2.9 ±
0.1 wt%). Nevertheless, this grass is still a potential source of silica due to the natural
abundance of the grass. Bamboo leaves is found to contains 20.3 ± 2.8 wt% of
amorphous silica, i.e., about double of rice husks which had been long recognized as
biomass with very high silica content. The characterizations performed also confirm that
the overall quality of amorphous silica obtained from bamboo leaves and cogon grass is
rivals those extracted from others sources. However, the purity of silica obtained is
highly dependent on how well the minerals in biomass can be removed. The result of
acid leaching shows that effective removal of minerals can be achieved via long
leaching periods and high acid concentration.
The bio-silica was used to prepare water glass as precursor in the synthesis of
silica aerogel. Water glass with a silica concentration of 1 mol L-1 (3.5 wt%, 1.12 g cm-3)
and a modulus R of 0.85 was successfully prepared from bamboo leaf. It is found that
processing parameters including dissolution temperature, dissolution time and agitation
speed play essential role in maximizing the silica yield in water glass. It was also
discovered that the silica yield depends on the ratio of R C ; to achieve a high silica
yield, this ratio must be in the range of 10 15R C< < . The statistical correlation
obtained from the result was used to optimize the condition in the process to maximize
silica yield in water glass.
The properties of aerogel synthesized by bamboo leaf water glass are
comparable to the aerogel synthesized with TEOS. It is discovered that bamboo leaf
160
aerogel synthesized in acidic condition exhibits more attractive properties. However, the
bamboo aerogel was later prepared under neutral pH because the aerogel synthesized
has very similar with those gelled in acidic condition but only require very short
gelation period (less than 2.5 minutes).
The difference of properties caused by different gelation mechanisms is
suspected to be related to the number of siloxane bond ( Qn ) condensed during gelation.
With larger number of siloxane bonds formed between silicon atoms, particles in
aerogel aggregated in a more compact manner thus more attractive properties. It is also
discovered that many correlations obtained from aerogel with high silica concentration
do not agree with the measured properties of aerogel with low silica concentration. The
thermal conductivity is also found to be correlated with fractal dimension of aerogel.
This indirectly indicates that thermal conductivity is related to fractality, in which
highly fractal structure can reduce thermal conductivity of aerogels.
Activated carbon used to opacifiy aerogel was also synthesized from bamboo
leaves. The processing conditions in carbonizing and activating the carbon were
optimized to reduce the carbon burnt off. The results indicate that the thermal
conductivity of aerogel is reduced after being opacified with activated carbon. The
thermal conductivity of the aerogel opacified with activated carbon is close to that of the
aerogel opacified with carbon black. Thus, bamboo leaves can be a single source of both
silica and carbon to synthesize opacified aerogel. Comparison with TEOS aerogels
proven that thermal conductivity of bamboo leaf aerogels is generally lower than TEOS
aerogels. Hence, it is proved that the replacement of alkoxides with bamboo leaves as
precursor to synthesize and opacify silica aerogel is feasible. The result also shows that
the opacified aerogels are stable up to 495 °C. Hence, bamboo leaves can be a potential
inexpensive source of material to produce opacified aerogel that is suitable to be used as
a thermal insulating material at high temperatures (200-500 °C).
161
Various models have been developed to optimize the processing conditions to
achieve minimum thermal conductivity. Based on the models, various condition tie-
lines were developed to estimate the total thermal conductivity. Such tie-lines may be
useful in deciding the optimal combinations of carbon loading and silica concentration
to synthesize opacificied aerogel with minimum thermal conductivity at a given
temperature.
It is suspected that the characteristics of the carbon dispersed in the aerogel
precursors (TEOS alkoxides or water glass) prior to gelation may alter the gelation
mechanism and affect the particle growth. As a result, the synthesized aerogels possess
different microstructures and physical properties. Further investigation should be
performed to study how the nature of the carbon added will affect the microstructure of
the aerogel.
162
6.2 Novelty and contributions
The novelty of this work lies on the fact that silica aerogel can be synthesized
and opacified by using bamboo leaf as a source of both the silica and activated carbon.
The results of this work may contribute in the following ways:
(I) Offers a cheap alternative source to synthesize aerogel
Bamboo leaf is confirmed containing high silica content that able to
replace toxic alkoxide precursors to synthesize aerogel. The production cost of
silica aerogel may be reduced as bamboo leaf has no commercial value presently.
(II) Aerogels opacified with activated carbon is comparable to carbon black
Beside carbon black, activated carbon is also proven can be used to
opacify silica aerogel. The reduction of thermal conductivity by activated carbon
at high temperature may have potential applications in hot gas piping, furnace
lining and fire protection equipment. The reuse of bamboo leaf to synthesize
activated carbon reduces the waste produced in the process. Carbon in biomass
can be captured in the form of activated carbon rather than release it as carbon
dioxide/ monoxide to the environment. Less carbon emission is achieved for the
process.
(III) Development of optimal processing tie-lines for opacified aerogel
Tie-lines developed can be used to determine combinations of silica
concentration and carbon loading that can be used to minimize thermal conductivity of
aerogel at a given temperature. Thus, proper formula of silica concentration and carbon
loading can be designed based on the temperature of interests to minimize the thermal
conductivity of aerogel.
163
6.3 Recommendations for future work
All measurements of thermal conductivity were carried out under ambient
pressure in this work due to equipment constraint. As the gas conduction of evacuated
samples would be greatly reduced, it is recommended to study the thermal conductivity
of bamboo leaf aerogel under near-vacuum pressure.
Further study should be carried out to investigate the relations between fractal
structures on the thermal conductivity of aerogels. The correlation observed between
these two in this work suggests that fractal structures may be the key parameter that
affects the thermal conductivity rather than density and porosity of aerogel. This work
also revealed that fractal structure may in turn be controlled by microstructural
evolution governed by gelation mechanism. Hence, further study can be carried out on
the gelation mechanism by altering the endpoint pH and pH swing.
The silica concentration of water glass used to synthesize aerogel is limited by
the viscous slurry formed when more than 10 wt% of bio-silica is loaded to sodium
hydroxide. Hence, method to produce water glass with larger amount of bio-silica may
be attempted. This may increase the strength of aerogel produced and thus making
ambient drying of the bamboo leaf aerogel plausible in the future.
Activated carbon used to opacify aerogel in this work is selected based on the
optimum combination of carbon burnt-off and density. Since activated carbon with
smaller particle size may cover the cross section of aerogel more effectively, less
amount of activated carbon will be require in opacification. This may in turn reduce the
solid conductivity contributed by activated carbon in the aerogel. Thus, effects such as
particle size and porosity of activated carbon to the thermal conductivity can be further
investigated in the future.
164
REFERENCES
Lower and Higher Heating Values of Gas, Liquid and Solid Fuels.Biomass Energy Data Book, 2011, Available from: http://cta.ornl.gov/bedb/appendix_a/Lower_and_Higher_Heating_Values_of_Gas_Liquid_and_Solid_Fuels.pdf. [17/7/2013].
Typical calorific values of fuels, Available from: http://www.biomassenergycentre.org.uk/portal/page?_pageid=75,20041&_dad=portal&_schema=PORTAL. [17/7/2013].
Wood as a Fuel - List and values of wood fuel., Available from: http://www.woodenergy.ie/woodasafuel/listandvaluesofwoodfuelparameters-part1/. [17/7/2013].
ALAOUI, A. H., WOIGNIER, T., PHALIPPOU, J. & SCHERER, G. W. (1998) Room temperature densification of aerogel by isostatic compression. Journal of Sol-Gel Science and Technology, 13, 365-369.
ALBA, M. D., LUAN, Z. H. & KLINOWSKI, J. (1996) Titanosilicate mesoporous molecular sieve MCM-41: Synthesis and characterization. Journal of Physical Chemistry, 100, 2178-2182.
ANDERSON, A. M., CARROLL, M. K., GREEN, E. C., MELVILLE, J. T. & BONO, M. S. (2010) Hydrophobic silica aerogels prepared via rapid supercritical extraction. Journal of Sol-Gel Science and Technology, 53, 199-207.
ARAVIND, P. R. & SORARU, G. D. (2011) High surface area methyltriethoxysilane-derived aerogels by ambient pressure drying. Journal of Porous Materials, 18, 159-165.
BALAMURUGAN, M. & SARAVANAN, S. (2012) Producing nanosilica from Sorghum vulgare seed heads. Powder Technology 224, 345–350.
BANGI, U. K. H., DHERE, S. L. & RAO, A. V. (2010) Influence of various processing parameters on water-glass-based atmospheric pressure dried aerogels for liquid marble purpose. Journal of Materials Science, 45, 2944-2951.
BANGI, U. K. H., RAO, A. P., HIRASHIMA, H. & RAO, A. V. (2009) Physico-chemical properties of ambiently dried sodium silicate based aerogels catalyzed with various acids. Journal of Sol-Gel Science and Technology, 50, 87–97.
BANGI, U. K. H., RAO, A. V. & RAO, A. P. (2008a) A new route for preparation of sodium-silicate-based hydrophobic silica aerogels via ambient-pressure drying. Science and Technology of Advanced Materials, 9.
BANGI, U. K. H., RAO, A. V. & RAO, A. P. (2008b) A new route for preparation of sodium-silicate-based hydrophobic silica aerogels via ambient-pressure drying. Science and Technology of Advanced Materials, 9, 35006.
BHAGAT, S. D., KIM, Y.-H., AHN, Y.-S. & YEO, J.-G. (2006) Textural properties of ambient pressure dried water-glass based silica aerogel beads: One day synthesis. Microporous and Mesoporous Materials, 96, 237-244.
BHAGAT, S. D., KIM, Y.-H., AHN, Y.-S. & YEO, J.-G. (2007a) Rapid synthesis of water-glass based aerogels by in situ surface modification of the hydrogels. Applied Surface Science, 253, 3231–3236.
BHAGAT, S. D., KIM, Y.-H., MOON, M.-J., AHN, Y.-S. & YEO, J.-G. (2007b) A cost-effective and fast synthesis of nanoporous SiO2 aerogel powders using water-glass via ambient pressure drying route. Solid State Sciences, 9, 628-635.
BHAGAT, S. D., OH, C.-S., KIM, Y.-H., AHN, Y.-S. & YEO, J.-G. (2007c) Methyltrimethoxysilane based monolithic silica aerogels via ambient pressure drying. Microporous and Mesoporous Materials, 100, 350-355.
165
BHAGAT, S. D., PARK, K.-T., KIM, Y.-H., KIM, J.-S. & HAN, J.-H. (2008) A continuous production process for silica aerogel powders based on sodium silicate by fluidized bed drying of wet-gel slurry. Solid State Sciences, 10, 1113-1116.
BORNE, A., CHEVALIER, B., CHEVALIER, J. L., QUENARD, D., ELALOUI, E. & LAMBARD, J. (1995) Characterization of silica aerogel with the atomic-force microscope and SAXS. Journal of Non-Crystalline Solids, 188, 235-242.
BRAJNIK, D., KORPAR, S., MEDIN, G., STARIC, M. & STANOVNIK, A. (1994) Measurement of Sr-90 activity with Cherenkov radiation in a silica aerogel. Nuclear Instruments & Methods in Physics Research Section a-Accelerators Spectrometers Detectors and Associated Equipment, 353, 217-221.
BRAJNIK, D., MEDIN, G., STANOVNIK, A. & STARIC, M. (1995) Determination of high energy beta-emitters with a Ge spectrometer or Cherenkov radiation in an aerogel. Science of the Total Environment, 173, 225-230.
BRINKER, C. J. & SCHERER, G. W. (1990) Sol-Gel Science : The Physics and Chemistry of Sol-Gel Processing Boston, Academic Press.
CARLSON, G., LEWIS, D., MCKINLEY, K., RICHARDSON, J. & TILLOTSON, T. (1995) Aerogel commercialization - technology, markets and costs. Journal of Non-Crystalline Solids, 186, 372-379.
CHANDRADASS, J., KANG, S. & BAE, D. S. (2008) Synthesis of silica aerogel blanket by ambient drying method using water glass based precursor and glass wool modified by alumina sol. Journal of Non-Crystalline Solids, 354, 4115-4119.
CHAO, X., JUN, S. & BIN, Z. (2009) Ultralow density silica aerogels prepared with PEDS. Journal of Non-Crystalline Solids, 355, 492-495.
CHARRETEUR, F., JAOUEN, F. & DODELET, J.-P. (2009) Iron porphyrin-based cathode catalysts for PEM fuel cells:Influence of pyrolysis gas on activity and stability. Electrochimica Acta, 54, 6622–6630.
CHARRETEUR, F., JAOUEN, F., RUGGERI, S. & DODELET, J.-P. (2008) Fe/N/C non-precious catalysts for PEM fuel cells: Influence of the structural parameters of pristine commercial carbon blacks on their activity for oxygen reduction. Electrochimica Acta 53, 2925–2938.
CUI, S., LIU, Y., FAN, M. H., COOPER, A. T., LIN, B. L., LIU, X. Y., HAN, G. F. & SHEN, X. D. (2011) Temperature dependent microstructure of MTES modified hydrophobic silica aerogels. Materials Letters, 65, 606-609.
CUTRUFELLO, M. G., ROMBI, E., FERINO, I., LOCHE, D., CORRIAS, A. & CASULA, M. F. (2011) Ni-based xero- and aerogels as catalysts for nitroxidation processes. Journal of Sol-Gel Science and Technology, 60, 324-332.
DAI, S., JU, Y. H., GAO, H. J., LIN, J. S., PENNYCOOK, S. J. & BARNES, C. E. (2000) Preparation of silica aerogel using ionic liquids as solvents. Chemical Communications, 243-244.
DELLA, V. P., KUHN, I. & HOTZA, D. (2002) Rice husk ash as an alternate source for active silica production. Materials Letters 57, 818-821.
DENG, Z. S., WEI, J. D., WU, A. M., BAO, Y. P., WANG, J., SHEN, J., ZHOU, B. & CHEN, L. Y. (2000) Hydrophobic SiO2 aerogels prepared with polyethoxydisiloxanes. Journal of Inorganic Materials, 15, 381-384.
DIAS, A. S., PILLINGER, M. & VALENTE, A. A. (2006) Mesoporous silica-supported 12-tungstophosphoric acid catalysts for the liquid phase dehydration of D-xylose. Microporous and Mesoporous Materials, 94, 214-225.
166
DIAS, J. M., ALVIM-FERRAZ, M. C. M., ALMEIDA, M. F., RIVERA-UTRILLA, J. & SANCHEZ-POLO, M. (2007) Waste materials for activated carbon preparation and its use in aqueous-phase treatment: A review. Journal of Environmental Management, 85, 833-846.
DOMINGUEZ, M., TABOADA, E., IDRISS, H., MOLINS, E. & LLORCA, J. (2010) Fast and efficient hydrogen generation catalyzed by cobalt talc nanolayers dispersed in silica aerogel. Journal of Materials Chemistry, 20, 4875-4883.
DOMINGUEZ, M., TABOADA, E., MOLINS, E. & LLORCA, J. (2008) Co-SiO(2) aerogel-coated catalytic walls for the generation of hydrogen. Catalysis Today, 138, 193-197.
DONATTI, D. A., RUIZ, A. I. & VOLLET, D. R. (2001a) From sol to aerogel: a study of the nanostructural characteristics of TEOS derived sonogels. Journal of Non-Crystalline Solids, 292, 44-49.
DONATTI, D. A., RUIZ, A. I. & VOLLET, D. R. (2001b) From sol to aerogel: a study of the nanostructural characteristics of TEOS derived sonogels. Journal of Non-Crystalline Solids 292 44-49.
DORCHEH, A. S. & ABBASI, M. H. (2008a) Silica aerogel; synthesis, properties and characterization. Journal of Materials Processing Technology, 199, 10-26.
DORCHEH, A. S. & ABBASI, M. H. (2008b) Silica aerogel; synthesis, properties and characterization. Journal of Materials Processing Technology, 199, 10-26.
DOZIER, H., GAFFNEY, J.F., MCDONALD, S.K., JOHNSON, E.R.R.L., SHILLING, D.G. (1998) Cogongrass in the United States: History, ecology, impacts, and management. Weed Technology, 12, 737-743.
DU, X., WANG, C., LI, T. & CHEN, M. (2009) Studies on the performances of silica aerogel electrodes for the application of supercapacitor. Ionics, 15, 561-565.
DWIVEDI, V. N., SINGH, N. P., DAS, S. S. & SINGH, N. B. (2006) A new pozzolanic material for cement industry: Bamboo leaf ash. International Journal of Physical Sciences, 1, 106-111.
EHRBURGERDOLLE, F., DALLAMANO, J., ELALOUI, E. & PAJONK, G. M. (1995) Relations between the texture of silica aerogels and their preparation. Journal of Non-Crystalline Solids, 186, 9-17.
EINARSRUD, M. A. & NILSEN, E. (1998a) Strengthening of water glass and colloidal sol based silica gels by aging in TEOS. Journal of Non-Crystalline Solids, 226, 122-128.
EINARSRUD, M. A. & NILSEN, E. (1998b) Thermal and temporal aging of silica gels in monomer solutions. Journal of Sol-Gel Science and Technology, 13, 317-322.
FISHER, T., HAJALIGOL, M., WAYMACK, B. & KELLOGG, D. (2002) Pyrolysis behavior and kinetics of biomass derived materials. Journal of Analytical and Applied Pyrolysis, 62, 331-49.
FOLETTO, E. L., GRATIERI, E., OLIVEIRA, L. H. D. & JAHN, S. R. L. (2006) Conversion of rice hull ash into soluble sodium silicate. Materials Research, 9, 335-338.
FRELTOFT, T., KJEMS, J. K. & SINHA, S. K. (1986) Power-law correlations and finite-size effects in silica particle aggregates studied by small-angle neutron-scattering. Physical Review B, 33, 269-275.
FRICKE, J. (1988) Aerogels - highly tenuous solids with fascinating properties. Journal of Non-Crystalline Solids, 100, 169-173.
FRICKE, J., CAPS, R., BUTTNER, D., HEINEMANN, U. & HUMMER, E. (1987) Silica aerogel - a light-transmitting thermal superinsulator. Journal of Non-Crystalline Solids, 95-6, 1167-1174.
FRICKE, J. & EMMERLING, A. (1992a) Aerogels. Journal of the American Ceramic Society, 75, 2027-2036.
167
FRICKE, J. & EMMERLING, A. (1992b) Aerogels - preparation, properties, applications. Structure and Bonding, 77, 37-87.
FRICKE, J. & EMMERLING, A. (1998) Aerogels - Recent progress in production techniques and novel applications. Journal of Sol-Gel Science and Technology, 13, 299-303.
GAO, G. M., ZOU, H. F., GAN, S. C., LIU, Z. J., AN, B. C., XU, J. J. & LI, G. H. (2009) Preparation and properties of silica nanoparticles from oil shale ash. Powder Technology, 191, 47-51.
GAUTHIER, B. M., BAKRANIA, S. D., ANDERSON, A. M. & CARROLL, M. K. (2004) A fast supercritical extraction technique for aerogel fabrication. Journal of Non-Crystalline Solids, 350, 238-243.
GROSS, J., CORONADO, P. R. & HRUBESH, L. W. (1998) Elastic properties of silica aerogels from a new rapid supercritical extraction process. Journal of Non-Crystalline Solids, 225, 282-286.
GURAV, J. L., NADARGI, D. Y. & RAO, A. V. (2008) Effect of mixed Catalysts system on TEOS-based silica aerogels dried at ambient pressure. Applied Surface Science, 255, 3019-3027.
GURAV, J. L., RAO, A. V. & NADARGI, D. Y. (2009a) Study of thermal conductivity and effect of humidity on HMDZ modified TEOS based aerogel dried at ambient pressure. Journal of Sol-Gel Science and Technology, 50, 275-280.
GURAV, J. L., RAO, A. V., RAO, A. P., NADARGI, D. Y. & BHAGAT, S. D. (2009b) Physical properties of sodium silicate based silica aerogels prepared by single step sol-gel process dried at ambient pressure. Journal of Alloys and Compounds, 476, 397-402.
HAEREID, S., ANDERSON, J., EINARSRUD, M. A., HUA, D. W. & SMITH, D. M. (1995a) Thermal and temporal aging of TMOS-based aerogel precursors in water. Journal of Non-Crystalline Solids, 185, 221-226.
HAEREID, S., DAHLE, M., LIMA, S. & EINARSRUD, M. A. (1995b) Preparation and properties of monolithic silica xerogels from TEOS-based alcogels aged in silane solutions. Journal of Non-Crystalline Solids, 186, 96-103.
HAEREID, S., NILSEN, E. & EINARSRUD, M. A. (1996) Properties of silica gels aged in TEOS. Journal of Non-Crystalline Solids, 204, 228-234.
HAMDAN, H., MUHID, M. N. M., ENDUD, S., LISTIORINI, E. & RAMLI, Z. (1997) Si-29 MAS NMR, XRD and FESEM studies of rice husk silica for the synthesis of zeolites. Journal of Non-Crystalline Solids, 211, 126-131.
HAYASE, G., KANAMORI, K., KAZUKI, K., HANADA, T. & IOP (2011) Synthesis of New Flexible Aerogels from MTMS/DMDMS via Ambient Pressure Drying. 3rd International Congress on Ceramics.
HDACH, H., WOIGNIER, T., PHALIPPOU, J. & SCHERER, G. W. (1990) Effect of aging and pH on the modulus of aerogels. Journal of Non-Crystalline Solids, 121, 202-205.
HE, F., ZHAO, H. L., QU, X. H., ZHANG, C. J. & QIU, W. H. (2009) Modified aging process for silica aerogel. Journal of Materials Processing Technology, 209, 1621-1626.
HEGDE, N. D., HIRASHIMA, H. & RAO, A. V. (2007) Two step sol-gel processing of TEOS based hydrophobic silica aerogels using trimethylethoxysilane as a co-precursor. Journal of Porous Materials, 14, 165-171.
HEGDE, N. D. & RAO, A. V. (2007) Physical properties of methyltrimethoxysilane based elastic silica aerogels prepared by the two-stage sol-gel process. Journal of Materials Science, 42, 6965-6971.
HENNING, S. & SVENSSON, L. (1981) Production of silica aerogel. Physica Scripta, 23, 697–702.
168
HERRMANN, G., IDEN, R., MIELKE, M., TEICH, F. & ZIEGLER, B. (1995) On the way to commercial production of silica aerogel. Journal of Non-Crystalline Solids, 186, 380-387.
HOLZMUELLER, E. J. & JOSE, S. (2011) Invasion success of cogongrass, an alien C-4 perennial grass, in the southeastern United States: exploration of the ecological basis. Biological Invasions, 13, 435-442.
HOSSEINI, M. M., SHAO, Y. X. & WHALEN, J. K. (2011) Biocement production from silicon-rich plant residues: Perspectives and future potential in Canada. Biosystems Engineering, 110, 351-362.
HOU, G. H. (2003) Preparation of SiO2 aerogel by rice husk. Journal of Inorganic Materials, 18, 407-412.
HRUBESH, L. W., CORONADO, P. R. & SATCHER, J. H. (2001) Solvent removal from water with hydrophobic aerogels. Journal of Non-Crystalline Solids, 285, 328-332.
HRUBESH, L. W. & PEKALA, R. W. (1994) Thermal-properties of organic and inorganic aerogels. Journal of Materials Research, 9, 731-738.
HSIEH, Y., DU, Y. X., JIN, F. M., ZHOU, Z. Y. & ENOMOTO, H. (2009) Alkaline pre-treatment of rice hulls for hydrothermal production of acetic acid. Chemical Engineering Research and Design, 87, 13-18.
HUMMER, E., LU, X., RETTELBACH, T. & FRICKE, J. (1992) Heat-transfer in opacified aerogel powders. Journal of Non-Crystalline Solids, 145, 211-216.
HUMMER, E., RETTELBACH, T., LU, X. & FRICKE, J. (1993) Opacified silica aerogel powder insulation. Thermochimica Acta, 218, 269-276.
HÜSING, N. & SCHUBERT, U. (2000) Aerogels. Ullmann's Encyclopedia of Industrial Chemistry. Wiley-VCH Verlag GmbH & Co. KGaA.
HWANG, H. J., KIM, C. E. & CHA, Y. C. (2007) Strengthening of water glass based aerogel by TEOS. IN KIM, H., HOJO, J. & LEE, S. W. (Eds.) Eco-Materials Processing and Design VIII. Stafa-Zurich, Trans Tech Publications Ltd.
HWANG, S.-W., KIM, T.-Y. & HYUN, S.-H. (2008) Optimization of instantaneous solvent exchange/surface modification process for ambient synthesis of monolithic silica aerogels. Journal of Colloid and Interface Science, 322, 224-230.
ILER, R. K. (1979) The Chemistry of Silica : Solubility, polymerization, colloid and surface properties, and biochemistry New York, John Wiley.
IN-SUB, H., JONG-CHUL, P., SE-YOUNG, K. & KI-SEOG, H. (2008) Fabrication of the monolithic silica aerogels using sodium silicate and its network strengthening. IN PAN, W. & GONG, J. H. (Eds.) High-Performance Ceramics V, Pts 1 and 2. Stafa-Zurich, Trans Tech Publications Ltd.
IOANNIDOU, O. & ZABANIOTOU, A. (2007) Agricultural residues as precursors for activated carbon production - A review. Renewable & Sustainable Energy Reviews, 11, 1966-2005.
JANKOVIC, B. (2008) Kinetic analysis of the nonisothermal decomposition of potassium metabisulfite using the model-fitting and isoconversional (model-free) methods. Chemical Engineering Journal, 139, 128-35.
JENSEN, K. I., SCHULTZ, J. M. & KRISTIANSEN, F. H. (2004) Development of windows based on highly insulating aerogel glazings. Journal of Non-Crystalline Solids, 350, 351-357.
JONES, J. C. (1998) Indirect evidence of relatively high thermal conductivities in powdered activated carbons. Fuel, 77, 1679-1681.
KALAPATHY, U., PROCTOR, A. & SHULTZ, J. (2000) A simple method for production of pure silica from rice hull ash. Bioresource Technology, 73, 257-262.
169
KALAPATHY, U., PROCTOR, A. & SHULTZ, J. (2002) An improved method for production of silica from rice hull ash. Bioresource Technology, 85, 285-289.
KAMIYA, K., OKA, A., NASU, H. & HASHIMOTO, T. (2000) Comparative study of structure of silica gels from different sources. Journal of Sol-Gel Science and Technology, 19, 495-499.
KANAMORI, K. (2011) Organic inorganic hybrid aerogels with high mechanical properties via organotrialkoxysilane-derived sol-gel process. Journal of the Ceramic Society of Japan, 119, 16-22.
KIM, C. E., YOON, J. S. & HWANG, H. J. (2009) Synthesis of nanoporous silica aerogel by ambient pressure drying. Journal of Sol-Gel Science and Technology, 49, 47-52.
KISTLER, S. S. (1931) Coherent expanded aerogels and jellies. Nature, 127, 741. KISTLER, S. S. (1932) Coherent Expanded-Aerogels. Journal of Physical Chemistry,
36, 52. KOHLI, R. K., JOSE, S., SINGH, H. P. & BATISH, D. R. (2008) Invasive Plants and
Forest Ecosystems, Florida, CRC Press. KRISHNARAO, R. V., SUBRAHMANYAM, J. & KUMAR, T. J. (2001) Studies on
the formation of black particles in rice husk silica ash. Journal of the European Ceramic Society, 21, 99-104.
KUHN, J., GLEISSNER, T., ARDUINISCHUSTER, M. C., KORDER, S. & FRICKE, J. (1995) Integration of mineral powders into SiO2 aerogels. Journal of Non-Crystalline Solids, 186, 291-295.
KUWAGAKI, H., MEGURO, T., TATAMI, J., KOMEYA, K. & TAMURA, K. (2003) An improvement of thermal conduction of activated carbon by adding graphite. Journal of Materials Science, 38, 3279-3284.
LAZAR, G., ZELLAMA, K., VASCAN, I., STAMATE, M., LAZAR, I. & RUSU, I. (2005) Infrared absorption properties of amorphous carbon films. Journal of Optoelectronics and Advanced Materials, 7, 647-652.
LEE, D., STEVENS, P. C., ZENG, S. Q. & HUNT, A. J. (1995) Thermal characterization of carbon-opacified silica aerogels. Journal of Non-Crystalline Solids, 186, 285-290.
LEE, O. J., LEE, K. H., YIM, T. J., KIM, S. Y. & YOO, K. P. (2002) Determination of mesopore size of aerogels from thermal conductivity measurements. Journal of Non-Crystalline Solids, 298, 287-292.
LENZA, R. F. S. & VASCONCELOS, W. L. (2001) Preparation of silica by sol-gel method using formamide. Materials Research, 4, 189-194.
LI, J., HAYAKAWA, S., SHIROSAKI, Y. & OSAKA, A. (2013) Revisiting structure of silica gels from water glass: an 1H and 29Si MAS and CP-MAS NMR study. J Sol-Gel Sci Technol, 65, 135–142.
LI, T. & WANG, T. (2008) Preparation of silica aerogel from rice hull ash by drying at atmospheric pressure. Materials Chemistry and Physics, 112, 398-401.
LI, X., LI, Y., ZHANG, S. & YANG, L. (2007) Study on the SiO2 aerogels doped with TiO2 powder prepared by rice hull ash. Rare Metal Materials and Engineering, 36, 43-45.
LIN, B. L., CUI, S., LIU, X. Y., SHEN, X. D., LIU, Y. & HAN, G. F. (2011) Preparation and Characterization of HMDS Modified Hydrophobic Silica Aerogel. Current Nanoscience, 7, 1042-1045.
LIOU, T. H. & WU, S. J. (2010) Kinetics Study and Characteristics of Silica Nanoparticles Produced from Biomass-Based Material. Ind. Eng. Chem. Res. , 49, 8379-8387.
170
LIU, H., SHA, W., COOPER, A. T. & FAN, M. (2009) Preparation and characterization of a novel silica aerogel as adsorbent for toxic organic compounds. Colloids and Surfaces a-Physicochemical and Engineering Aspects, 347, 38-44.
LIU, M.-L., YANG, D.-A. & QU, Y.-F. (2008) Preparation of super hydrophobic silica aerogel and study on its fractal structure. Journal of Non-Crystalline Solids, 354, 4927-4931.
LOWE S, B. M., BOUDJELA, S, DE POORTER M (2004) 100 of the world’s worst invasive alien species a selection from the global invasive species database, Published by Invasive Species Specialist Group (ISSG) a specialist group of the Species survival Commission (SSC) of the World Conservation Union (IUCN).
LOWELL, S., SHIELDS, J. E., THOMAS, M. A. & THOMMES, M. (2004) Characterization of Porous Materials and Powders: Surface Area, Pore Size and Density, Springer.
LU, X., ARDUINI-SCHUSTER, M. C., KUHN, J., NILSSON, O., FRICKE, J. & PEKALA, R. W. (1992) 255, 971.
LU, X., CAPS, R., FRICKE, J., ALVISO, C. T. & PEKALA, R. W. (1995) Correlation between structure and thermal-conductivity of organic aerogels. Journal of Non-Crystalline Solids, 188, 226-234.
LUX, A., LUXOVA, M., ABE, J., MORITA, S. & INANAGA, S. (2003) Silicification of bamboo (Phyllostachys heterocycla Mitf.) root and leaf. Plant and Soil, 255, 85-91.
MA, X., ZHOU, B., GAO, W., QU, Y., WANG, L., WANG, Z. & ZHU, Y. (2012) A recyclable method for production of pure silica from rice hull ash. Powder Technology, 217, 497-501.
MACDONALD, G. E. (2007) Cogongrass: the plant’s biology, distribution,and impacts in the Southeastern US. IN LOEWENSTEIN NJ, M. J. (Ed.) The regional cogongrass conference: a cogongrass management guide. Auburn University.
MAHADIK, D. B., RAO, A. V., KUMAR, R., INGALE, S. V., WAGH, P. B. & GUPTA, S. C. (2012) Reduction of processing time by mechanical shaking of the ambient pressure dried TEOS based silica aerogel granules. Journal of Porous Materials, 19, 87-94.
MANSARAY, K. G. & GHALY, A. E. (1998) Thermal degradation of rice husks in nitrogen atmosphere. Bioresource Technology, 65, 13-20.
MARTIN, J. E. (1986) Scattering exponents for polydisperse surface and mass fractals. Journal of Applied Crystallography, 19, 25-27.
MEZZA, P., PHALIPPOU, J. & SEMPERE, R. (1999) Sol-gel derived porous silica films. Journal of Non-Crystalline Solids, 243, 75-79.
MOHANAN, J. L. & BROCK, S. L. (2004) A new addition to the aerogel community: unsupported US aerogels with tunable optical properties. Journal of Non-Crystalline Solids, 350, 1-8.
MOHAPATRA, S., SAKTHIVEL, R., ROY, G. S., VARMA, S., SINGH, S. K. & MISHRA, D. K. (2011) Synthesis of beta-SiC Powder from Bamboo Leaf in a DC Extended Thermal Plasma Reactor. Materials and Manufacturing Processes, 26, 1362-1368.
MOHMOD, A. L. (1999) R&D needs related to bamboo and rattan small enterprises. INBAR-Workshop of Member Countries. Beijing, China.
MONER-GIRONA, M., MARTINEZ, E., ESTEVE, J., ROIG, A., SOLANAS, R. & MOLINS, E. (2002) Micromechanical properties of carbon-silica aerogel composites. Applied Physics a-Materials Science & Processing, 74, 119-122.
MONER-GIRONA, M., ROIG, A., BENITO, M. & MOLINS, E. (2003a) Aerogel thin film synthesis by a supercritical fluid-assisted sol-gel route in a single processing unit. Journal of Materials Chemistry, 13, 2066-2068.
171
MONER-GIRONA, M., ROIG, A., MOLINS, E. & LLIBRE, J. (2003b) Sol-gel route to direct formation of silica aerogel microparticles using supercritical solvents. Journal of Sol-Gel Science and Technology, 26, 645-649.
MOTOMURA, H., FUJII, T. & SUZUKI, M. (2006) Silica deposition in abaxial epidermis before the opening of leaf blades of Pleioblastus chino (Poaceae, Bambusoideae). Annals of Botany 97, 513-519.
MOTOMURA, H., MITA, N. & SUZUKI, M. (2002) Silica accumulation in long-lived leaves of Sasa veitchii (Carriere) Rehder (Poaceae-Bambusoideae). Annals of Botany, 90, 149-152.
NADARGI, D. Y., LATTHE, S. S. & RAO, A. V. (2009) Effect of post-treatment (gel aging) on the properties of methyltrimethoxysilane based silica aerogels prepared by two-step sol-gel process. Journal of Sol-Gel Science and Technology, 49, 53-59.
NADARGI, D. Y. & RAO, A. V. (2009) Methyltriethoxysilane: New precursor for synthesizing silica aerogels. Journal of Alloys and Compounds, 467, 397-404.
NATARAJAN, E., NORDIN, A. & RAO, A. N. (1998) Overview of combustion and gasification of rice husk in fluidized bed reactors. Biomass & Bioenergy, 14, 533-546.
NAYAK, J. P. & BERA, J. (2009a) Preparation of Silica Aerogel by Ambient Pressure Drying Process using Rice Husk Ash as Raw Material. Transactions of the Indian Ceramic Society, 68, 91-94.
NAYAK, J. P. & BERA, J. (2009b) Preparation of Silica Aerogel by Ambient Pressure Drying Process using Rice Husk Ash as Raw Material. Trans. Indian Ceram. Soc. , 68, 91-94.
NAZRIATI, SETYAWAN, H. & WINARDI, S. (2011) Synthesis of Silica Aerogel from Bagasse Ash by Ambient Pressure Drying. IN ISKANDAR, F., KHAIRURRIJAL & ABDULLAH, M. (Eds.) 4th Nanoscience and Nanotechnology Symposium. Melville, Amer Inst Physics.
NOVAK, Z. & KNEZ, Z. (1997) Diffusion of methanol-liquid CO2 and methanol-supercritical CO2 in silica aerogels. Journal of Non-Crystalline Solids, 221, 163-169.
PAJONK, G. M. (1991) Aerogel catalysts. Applied Catalysis, 72, 217-266. PARK, B. D., WI, S. G., LEE, K. H., SINGH, A. P., YOON, T. H. & KIM, Y. S. (2003)
Characterization of anatomical features and silica distribution in rice husk using microscopic and micro-analytical techniques. Biomass Bioenerg., 25, 319-327.
PHALIPPOU, J., SCHERER, G. W., WOIGNIER, T., BOURRET, D. & SEMPERE, R. (1995) Ultraporous materials with low permeability. Journal of Non-Crystalline Solids, 186, 64-72.
PIERRE, A. C. & RIGACCI, A. (2011) SiO2 Aerogels. IN AEGERTER, M. A. (Ed.) Aerogels Handbook, Advances in Sol-Gel Derived Materials and Technologies. Springer Science.
PIJARN, N., JAROENWORALUCK, A., SUNSANEEYAMETHA, W. & STEVENS, R. (2010) Synthesis and characterization of nanosized-silica gels formed under controlled conditions. Powder Technology, 203, 462-468.
PLANTARD, G., GOETZ, V. & PY, X. (2010) A direct method for porous particle density characterization applied to activated carbons. Advanced Powder Technology, 21, 592-598.
POURETEDAL, H. & KAZEMI, M. (2012) Characterization of modified silica aerogel using sodium silicate precursor and its application as adsorbent of Cu2+, Cd2+, and Pb2+ ions. International Journal of Industrial Chemistry 3:20.
RANGARAJAN, B. & LIRA, C. T. (1991) The effect of aging on acid-catalyzed aerogels. Journal of Non-Crystalline Solids, 136, 111-118.
172
RAO, A. P., PAJONK, G. M. & RAO, A. V. (2005a) Effect of preparation conditions on the physical and hydrophobic properties of two step processed ambient pressure dried silica aerogels. Journal of Materials Science, 40, 3481-3489.
RAO, A. P. & RAO, A. V. (2009) Improvement in optical transmission of the ambient pressure dried hydrophobic nanostructured silica aerogels with mixed silylating agents. Journal of Non-Crystalline Solids, 355, 2260-2271.
RAO, A. P. & RAO, A. V. (2010) Modifying the surface energy and hydrophobicity of the low-density silica aerogels through the use of combinations of surface-modification agents. Journal of Materials Science, 45, 51-63.
RAO, A. P., RAO, A. V. & PAJONK, G. M. (2005b) Hydrophobic and physical properties of the two step processed ambient pressure dried silica aerogels with various exchanging solvents. Journal of Sol-Gel Science and Technology, 36, 285-292.
RAO, A. P., RAO, A. V., PAJONK, G. M. & SHEWALE, P. M. (2007a) Effect of solvent exchanging process on the preparation of the hydrophobic silica aerogels by ambient pressure drying method using sodium silicate precursor. Journal of Materials Science, 42, 8418-8425.
RAO, A. V., GANBAVLE, V. V., BANGI, U. K. H. & DHERE, S. L. (2011) Influence of preparation conditions on nanoporous structure and optical transmission of sodium silicate based ambient pressure dried aerogels employing shaking. 18, 751–759.
RAO, A. V. & HARANATH, D. (1999) Effect of methyltrimethoxysilane as a synthesis component on the hydrophobicity and some physical properties of silica aerogels. Microporous and Mesoporous Materials, 30, 267-273.
RAO, A. V., HEGDE, N. D. & HIRASHIMA, H. (2007b) Absorption and desorption of organic liquids in elastic superhydrophobic silica aerogels. Journal of Colloid and Interface Science, 305, 124-132.
RAO, A. V., KALESH, R. R., AMALNERKAR, D. P. & SETH, T. (2003a) Synthesis and characterization of hydrophobic TMES/TEOS based silica aerogels. Journal of Porous Materials, 10, 23-29.
RAO, A. V., KULKARNI, M. M., AMALNERKAR, D. P. & SETH, T. (2003b) Superhydrophobic silica aerogels based on methyltrimethoxysilane precursor. Journal of Non-Crystalline Solids, 330, 187-195.
RAO, A. V., NILSEN, E. & EINARSRUD, M. A. (2001) Effect of precursors, methylation agents and solvents on the physicochemical properties of silica aerogels prepared by atmospheric pressure drying method. Journal of Non-Crystalline Solids, 296, 165-171.
RAO, A. V., RAO, A. P. & KULKARNI, M. M. (2004) Influence of gel aging and Na2 SiO3/H2 O molar ratio on monolithicity and physical properties of water-glass-based aerogels dried at atmospheric pressure. Journal of Non-Crystalline Solids, 350, 224-229.
REICHENAUER, G. (2004) Thermal aging of silica gels in water. Journal of Non-Crystalline Solids, 350, 189-195.
REIM, M., BECK, A., KORNER, W., PETRICEVIC, R., GLORA, M., WETH, M., SCHLIERMANN, T., FRICKE, J., SCHMIDT, C. & POTTER, F. J. (2002) Highly insulating aerogel glazing for solar energy usage. Solar Energy, 72, 21-29.
REIM, M., KORNER, W., MANARA, J., KORDER, S., ARDUINI-SCHUSTER, M., EBERT, H. P. & FRICKE, J. (2005) Silica aerogel granulate material for thermal insulation and daylighting. Solar Energy, 79, 131-139.
173
RIGACCI, A., ACHARD, P., EHRBURGER-DOLLE, F. & PIRARD, R. (1998) Structural investigation in monolithic silica aerogels and thermal properties. Journal of Non-Crystalline Solids, 225, 260-265.
ROGACKI, G. & WAWRZYNIAK, P. (1995) Diffusion of ethanol-liquid CO2 in silica aerogel. Journal of Non-Crystalline Solids, 186, 73-77.
SARAWADE, P., KIM, J., HILONGA, A., QUANG, D., JEON, S. & KIM, H. (2011) Synthesis of sodium silicate-based hydrophilic silica aerogel beads with superior properties: Effect of heat-treatment Journal of Non-Crystalline Solids 357, 2156-2162.
SARAWADE, P. B., KIM, J.-K., HILONGA, A. & KIM, H. T. (2010) Production of low-density sodium silicate-based hydrophobic silica aerogel beads by a novel fast gelation process and ambient pressure drying process. Solid State Sciences, 12, 911-918.
SARAWADE, P. B., QUANG, D. V., HILONGA, A., JEON, S. J. & KIM, H. T. (2012) Synthesis and characterization of micrometer-sized silica aerogel nanoporous beads. Materials Letters, 81, 37-40.
SCHERER, G. W., GROSS, J., HRUBESH, L. W. & CORONADO, P. R. (2002) Optimization of the rapid supercritical extraction process for aerogels. Journal of Non-Crystalline Solids, 311, 259-272.
SCHERER, G. W., HAEREID, S., NILSEN, E. & EINARSRUD, M. A. (1996) Shrinkage of silica gels aged in TEOS. Journal of Non-Crystalline Solids, 202, 42-52.
SCHERER, G. W. & SMITH, D. M. (1995) Cavitation during drying of a gel. Journal of Non-Crystalline Solids, 189, 197-211.
SCHULTZ, J. M., JENSEN, K. I. & KRISTIANSEN, F. H. (2005) Super insulating aerogel glazing. Solar Energy Materials and Solar Cells, 89, 275-285.
SHEWALE, P. M., RAO, A. V. & RAO, A. P. (2008) Effect of different trimethyl silylating agents on the hydrophobic and physical properties of silica aerogels. Applied Surface Science, 254, 6902–6907.
SHI, F., LIU, J.-X., SONG, K. & WANG, Z.-Y. (2010) Cost-effective synthesis of silica aerogels from fly ash via ambient pressure drying. Journal of Non-Crystalline Solids, 356, 2241-2246.
SHILLING, N. C. C. A. D. G. (1993) Cogongrass, Imperata cylindrica (L.) Beauv.: A Good Grass Gone Bad! IN FLORIDA DEPARTMENT OF AGRICULTURE & CONSUMER SERVICES, D. O. P. I. (Ed.).
SHLYAKHTINA, A. & OH, Y.-J. (2008) Transparent SiO2 aerogels prepared by ambient pressure drying with ternary azeotropes as components of pore fluid. Journal of Non-Crystalline Solids, 354, 1633-1642.
SHUI, M., SONG, Y., REN, Y. & WANG, X. (2010) Structural analysisofamorphoussilicapreparedbywaterglass-based precursors anditsthermal,spectralcharacterization. Physica B, 405, 1316–1320.
SING, K. S. W., EVERETT, D. H., HAUL, R. A. W., MOSCOU, L., PIEROTTI, R. A., ROUQUEROL, J. & SIEMIENIEWSKA, T. (1985) Reporting physisorption data for gas solid systems with special reference to the determination of surface-area and porosity (recommendations 1984). Pure and Applied Chemistry, 57, 603-619.
SMITH, D. M., MASKARA, A. & BOES, U. (1998) Aerogel-based thermal insulation. Journal of Non-Crystalline Solids, 225, 254-259.
SMITHA, S., SHAJESH, P., ARAVIND, P. R., KUMAR, S. R., PILLAI, P. K. & WARRIER, K. G. K. (2006) Effect of aging time and concentration of aging solution on the porosity characteristics of subcritically dried silica aerogels. Microporous and Mesoporous Materials, 91, 286-292.
174
STANDEKER, S., NOVAK, Z. & KNEZ, Z. (2007) Adsorption of toxic organic compounds from water with hydrophobic silica aerogels. Journal of Colloid and Interface Science, 310, 362-368.
STANDEKER, S., NOVAK, Z. & KNEZ, Z. (2009) Removal of BTEX vapours from waste gas streams using silica aerogels of different hydrophobicity. Journal of Hazardous Materials, 165, 1114-1118.
STANGL, R., PLATZER, W. & WITTWER, V. (1995) IR emission-spectroscopy of silica aerogel. Journal of Non-Crystalline Solids, 186, 256-263.
STROM, R. A., MASMOUDI, Y., RIGACCI, A., PETERMANN, G., GULLBERG, L., CHEVALIER, B. & EINARSRUD, M. A. (2007) Strengthening and aging of wet silica gels for up-scaling of aerogel preparation. Journal of Sol-Gel Science and Technology, 41, 291-298.
SUI, R. H., RIZKALLA, A. S. & CHARPENTIER, P. A. (2004) Synthesis and formation of silica aerogel particles by a novel sol-gel route in supercritical carbon dioxide. Journal of Physical Chemistry B, 108, 11886-11892.
TAI, Y., YAMAGUCHI, W., TAJIRI, K. & KAGEYAMA, H. (2009) Structures and CO oxidation activities of size-selected Au nanoparticles in mesoporous titania-coated silica aerogels. Applied Catalysis a-General, 364, 143-149.
TAJIRI, K., IGARASHI, K. & NISHIO, T. (1995) Effects of supercritical drying media on structure and properties of silica aerogel. Journal of Non-Crystalline Solids, 186, 83-87.
TAMON, H., KITAMURA, T. & OKAZAKI, M. (1998) Preparation of silica aerogel from TEOS. Journal of Colloid and Interface Science, 197, 353-359.
TANG, Q. & WANG, T. (2005) Preparation of silica aerogel from rice hull ash by supercritical carbon dioxide drying. Journal of Supercritical Fluids, 35, 91-94.
TEIXEIRA, J. (1988) Small-angle scattering by fractal systems. Journal of Applied Crystallography, 21, 781.
TEWARI, P. H., HUNT, A. J. & LOFFTUS, K. D. (1985) Ambient-temperature supercritical drying of transparent silica aerogels. Materials Letters, 3, 363-367.
THY, P., JENKINS, B. M., GRUNDVIG, S., SHIRAKI, R. & LESHER, C. E. (2006) High temperature elemental losses and mineralogical changes in common biomass ashes. Fuel, 85, 783-795.
TSAI, W. T., LEE, M. K. & CHANG, Y. M. (2007) Fast pyrolysis of rice husk: Product yields and compositions. Bioresour. Technol., 98, 22-28.
VACHER, R., WOIGNIER, T., PELOUS, J. & COURTENS, E. (1988) Structure and self-similarity of silica aerogels. Physical Review B, 37, 6500-6503.
VAN DE HULST, H. C. (1957) Light Scattering by Small Particles, New York, Dover Publications.
VANBOMMEL, M. J. & DEHAAN, A. B. (1995) Drying of silica aerogel with supercritical carbon-dioxide. Journal of Non-Crystalline Solids, 186, 78-82.
VATSALA (2003) Bamboos in India, New Delhi, National Institute of Science Communication and Information Resources.
VILLAR-COCINA, E., MORALES, E. V., SANTOS, S. F., SAVASTANO, H. & FRIAS, M. (2011) Pozzolanic behavior of bamboo leaf ash: Characterization and determination of the kinetic parameters. Cement and Concrete Composites, 33, 68-73.
VOLLET, D. R., DONATTI, D. A., RUIZ, A. I. & GATTO, F. R. (2006) Mass fractal characteristics of wet sonogels as determined by small-angle x-ray scattering and differential scanning calorimetry. Physical Review B, 74.
WAGH, P. B., BEGAG, R., PAJONK, G. M., RAO, A. V. & HARANATH, D. (1999) Comparison of some physical properties of silica aerogel monoliths synthesized by different precursors. Materials Chemistry and Physics, 57, 214-218.
175
WANG, J., KUHN, J. & LU, X. (1995) Monolithic silica aerogel insulation doped with TiO2 powder and ceramic fibers. Journal of Non-Crystalline Solids, 186, 296-300.
WANG, J., SHEN, J., NI, X., WANG, B., WANG, X. & LI, J. (2010) Acoustic Properties of Nanoporous Silica Aerogel. Rare Metal Materials and Engineering, 39, 14-17.
WANG, L. J., ZHAO, S. Y. & YANG, M. (2009) Structural characteristics and thermal conductivity of ambient pressure dried silica aerogels with one-step solvent exchange/surface modification. Materials Chemistry and Physics, 113, 485-490.
WEI, G., LIU, Y., ZHANG, X. & DU, X. (2013) Radiative heat transfer study on silica aerogel and its composite insulation materials. Journal of Non-Crystalline Solids, 362 231–236.
WEI, G., LIU, Y., ZHANG, X., YU, F. & DU, X. (2011) Thermal conductivities study on silica aerogel and its composite insulation materials. International Journal of Heat and Mass Transfer, 54, 2355-2366.
WEI, T.-Y., LU, S.-Y. & CHANG, Y.-C. (2009a) A New Class of Opacified Monolithic Aerogels of Ultralow High-Temperature Thermal Conductivities. Journal of Physical Chemistry C, 113, 7424-7428.
WEI, T. Y., CHANG, T. F., LU, S. Y. & CHANG, Y. C. (2007) Preparation of monolithic silica aerogel of low thermal conductivity by ambient pressure drying. Journal of the American Ceramic Society, 90, 2003-2007.
WEI, T. Y., LU, S. Y. & CHANG, Y. C. (2009b) A New Class of Opacified Monolithic Aerogels of Ultralow High-Temperature Thermal Conductivities. Journal of Physical Chemistry C, 113, 7424-7428.
WITTEN, T. A., JR. & SANDER, L. M. (1981) Diffusion-Limited Aggregation, a Kinetic Critical Phenomenon. Physical Review Letters, 47, 1400-1403.
WU, G. M., WANG, J., SHEN, J., YANG, T. H., ZHANG, Q. Y., ZHOU, B., DENG, Z. S., BIN, F., ZHOU, D. P. & ZHANG, F. S. (2000) Properties of sol-gel derived scratch-resistant nano-porous silica films by a mixed atmosphere treatment. Journal of Non-Crystalline Solids, 275, 169-174.
WU, G. Y., YU, Y. X., CHENG, X. & ZHANG, Y. (2011) Preparation and surface modification mechanism of silica aerogels via ambient pressure drying. Materials Chemistry and Physics, 129, 308-314.
YALCIN, N. & SEVINC, V. (2001) Studies on silica obtained from rice husk. Ceramics International, 27, 219-224.
ZENG, S. Q., HUNT, A. & GREIF, R. (1995a) Theoretical modeling of carbon content to minimize heat-transfer in silica aerogel. Journal of Non-Crystalline Solids, 186, 271-277.
ZENG, S. Q., HUNT, A. & GREIF, R. (1995b) Transport-properties of gas in silica aerogel. Journal of Non-Crystalline Solids, 186, 264-270.
ZENG, S. Q., HUNT, A. & GREIF, R. (1995 ) Theoretical modeling of carbon content to minimize heat-transfer in silica aerogel. Journal of Non-Crystalline Solids, 186, 271-277.
ZHANG, H. X., ZHAO, X., DING, X. F., LEI, H., CHEN, X., AN, D. M., LI, Y. L. & WANG, Z. C. (2010) A study on the consecutive preparation of D-xylose and pure superfine silica from rice husk. Bioresource Technology 101, 1263-1267.
ZHAO, J. J., DUAN, Y. Y., WANG, X. D. & WANG, B. X. (2012) A 3-D numerical heat transfer model for silica aerogels based on the porous secondary nanoparticle aggregate structure. Journal of Non-Crystalline Solids, 358, 1287-1297.
176
LIST OF PUBLICATIONS
1. K.W. Kow, Rozita Yusoff, A.R. Aziz, E.C. Abdullah (2014). Thermal insulative performance of bamboo leaf aerogel opacified using activated carbon compared with carbon black. Advanced Materials Research. (941) 2482.
2. K.W. Kow, Rozita Yusoff, A.R. Aziz, E.C. Abdullah 2014, “Silica aerogel synthesized via bamboo leaves”. Paper presented at the 4th International Congress on Green Process Engineering (GPE 2014), Sevilla Spain.
3. K.W. Kow, Rozita Yusoff, A.R. Aziz, E.C. Abdullah (2014). Physicochemical properties of bamboo leaf aerogels synthesized via different modes of gelation. Applied Surface Science. (301) 161-172.
4. K.W. Kow, Rozita Yusoff, A.R. Aziz, E.C. Abdullah (2014). Characterisation of bio-silica synthesised from cogon grass (Imperata cylindrica). Powder Technology. (254) 206-13.
5. K.W. Kow, Rozita Yusoff, A.R. Aziz, E.C. Abdullah (2014). From bamboo leaf to aerogel: Preparation of water glass as a precursor. Journal of Non-Crystalline Solids. (386) 76-84.
6. K.W. Kow, Rozita Yusoff, A.R. Aziz, E.C. Abdullah 2013, “Synthesis of carbon-opacified-silica-aerogel using bamboo leaf”. Paper presented at the International Conference on the Science and Engineering of Materials 2013 (ICoSEM2013), Kuala Lumpur Malaysia.
7. K.W. Kow, Rozita Yusoff, A.R. Aziz. (2011). Amorphous silica from bamboo leaves. In: Proc. of 3rd International Congress on Green Process Engineering (GPE 2011), December 6-8, Kuala Lumpur, Malaysia. pp 262.
177
Appendix A Originality report