Embed Size (px)
Citation preview
UNIVERSITA’ DEGLI STUDI DI PADOVA
Dipartimento di Ingegneria Industriale DII
Corso di Laurea Magistrale in Ingegneria Meccanica
Titolo tesi
Fatigue behavior of no reinforced polymers
Relatore: Prof. Mauro Ricotta
Studente: Luca Benedetti ( matr. 603501 )
Anno Accademico 2016/2017

Summary
1. Introduction............................................................................................................................................... 1
2. Mechanical Properties and behaviour of Polymers .................................................................................. 3
2.1 General consideration ....................................................................................................................... 3
2.2 Viscoelasticity .................................................................................................................................... 4
1) Stress relaxation ................................................................................................................................ 4
2) Time-Temperature superposition ..................................................................................................... 4
3) Boltzmann Superposition Principle ................................................................................................... 4
3. FATIGUE......................................................................................................................................................... 7
3.1 DIFFERENCES BETWEEN COMPOSITES AND METALS.............................................................................. 7
3.2 CYCLIC STRESS FATIGUE AND THERMAL SOFTENING FAILURE OF THERMOPLASTICS ......................... 10
3.2.1 Test details and results ................................................................................................................... 10
3.2.2 Analysys of temeprature rise during fatigue.................................................................................. 11
3.2.3 Effect of strain control.................................................................................................................... 14
3.2.4 Effect of mean stress ...................................................................................................................... 15
3.2.5 Effect of the wave form.................................................................................................................. 16
3.2.6 Fracture morphology...................................................................................................................... 16
3.2.7 Conclusion ...................................................................................................................................... 17
3.3 LOAD HISTORY AND SEQUENCE EFFECTS ON CYCLIC DEFORMATION AND FATIGUE BEHAVIOUR OF ATHERMOPLASTIC POLYMER......................................................................................................................... 18
3.3.1 Experimental data and procedure................................................................................................. 18
3.3.2 Experimental results and discussion ............................................................................................. 19
3.4 LOW-CYCLE FATIGUE BEHAVIOUR OF POLYAMIDES ............................................................................. 32
3.4.1 Experimental procedure ................................................................................................................ 33
3.4.2 Effect of number of cycles ............................................................................................................. 34
3.4.3 Effect of frequency ....................................................................................................................... 36
3.4.4 Effect of strain............................................................................................................................... 37
3.4.5 Discussion ...................................................................................................................................... 39
3.4.6 Conclusion ..................................................................................................................................... 43
3.5 MULTIAXIAL FATIGUE CRITERION FOR A HIGH – DENSITY POLYETHYLENE THERMOPLASTIC ............. 45
3.5.1 Experimental.................................................................................................................................. 46
3.5.2 Results............................................................................................................................................ 50
3.5.3 Discussion ...................................................................................................................................... 59
3.5.4 Conclusion ..................................................................................................................................... 62
3.6 VARIABLE AMPLITUDE FATIGUE BEHAVIOUR OF NEAT THERMOPLASTICS ......................................... 63
3.6.1 Experimental program................................................................................................................... 64
3.6.2 Two – step and periodic overload histories ................................................................................... 66
3.6.3 Variable amplitude service load history ......................................................................................... 68
3.6.4 Conclusion ...................................................................................................................................... 71
3.7 MULTISCALE HIGH CYCLE FATIGUE MODELS FOR NEAT THERMOPLASTIC POLYMERS........................ 73
3.7.1 Introduction.................................................................................................................................... 73
3.7.2 Proposed multiscale high cycle fatigue ( HCF ) models.................................................................. 74
3.7.3 Experimental evaluation................................................................................................................. 76
3.7.4 Discussion and possible enhancements ......................................................................................... 82
3.7.5 Conclusion ...................................................................................................................................... 83
3.8 ON THE STRENGTHENING EFFECT OF INCREASING CYCLING ON FATIGUE BEHAVIOUR OF SOMEPOLYMERS AND THEIR COMPOSITES .......................................................................................................... 84
3.8.1 Introduction.................................................................................................................................... 84
3.8.2 Literature review on the beneficial effect of increased frequency on fatigue life......................... 85
3.8.3 Experimental program.................................................................................................................... 87
3.8.4 Viscoelastic behaviour and characterization.................................................................................. 88
3.8.5 Frequency effect............................................................................................................................. 90
3.8.6 Conclusion ..................................................................................................................................... 94
4. CONCLUSION ............................................................................................................................................... 95
5. REFERENCES................................................................................................................................................. 97
SPECIAL TANKS ................................................................................................................................................ 99
1
1. Introduction
A study regarding no-reinforced polymers was made, by carefully analysis of specific scientific
articles. So far, few studies regarding fatigue behaviour are made on these type of polymers,
compared to reinforced polymers, due to low utilize as structural components. It is important to
point out the large utilize of the no-reinforced polymers, just think about how many plastic
components are used every day from everyone.
The main goal of this thesis is to analyze the fatigue behaviour of no – reinforced polymers,
especially the causes which lead them to failure. By scientific articles it was possible to evaluate a
lot of tests results performed by different Universities and final considerations from authors were
very useful to complete the work.
The thesis is structured in 5 chapters:
- chapter 1, introduction;
- chapter 2, tells about mechanical properties of these type of polymers;
- chapter 3, tells about fatigue and sub-chapters report articles analyzed;
- chapter 4, conclusion;
- chapter 5, reference.

2
3
2. Mechanical Properties and behaviour of Polymers
2.1General consideration
By definition a polymer is a large molecule composed of a lot of repeated subunits. Polymers are
created via polymerization of small molecules, known as monomers. The structure of the molecule
is composed of multiple repeating units, which are the source of the relative molecular mass and
the properties of the Polymer. The modern concept of Polymer is based on macromolecular
structures covalently bonded.
The basic properties of a polymer are the identities of its constituent monomers. Other important
properties depend on its microstructure which describes the arrangement of monomers in the
single chain polymer. Specifically the microstructure influences the physical properties such as
strength, hardness, ductility etc.
Chemical properties, at the nano-scale, describe how the chains interact through various physical
forces; the macro-scale describes how the polymer interacts with other chemicals and solvents.
The physical properties are greatly dependent on the length of the polymer chain; for example if
the chain length increases, the melting temperature, impact resistance, viscosity and glass
transition temperature tends to increase. On the contrary chain mobility tends to decrease. A
common means to express the length of a chain is the degree of polymerization.
The polymer is usually described as viscoelastic material, mechanical properties are dominated by
its viscoelasticity. This can be seen observing the time-dependency of the mechanical response of
a component during loading. Hence, a polymer behaves differently if subjected to short or long
term loads.
We can consider linear viscoelasticity if the polymer is undergoing small or slow deformations and
non-linear viscoelasticity with large or rapid deformations.
At low temperature a polymer may behave like glass, this means high Young’s modulus and the
breaking can appear around 5% of the strain. At high temperature it may behave like rubber, this
means low Young’s modulus and extension of more than 100% without any permanent
deformation. In the intermediate temperature the polymer resembles neither glass nor rubber, it
shows an intermediate Young’s modulus and can dissipate a considerable amount of energy.
4
2.2 Viscoelasticity
To explain the linear viscoelasticity behaviour of polymeric materials during deformation, could be
interesting to have a look at the principal tests used to analyse this property.
1) Stress relaxation
In the stress relaxation test, a polymer sample is deformed with a fixed value of elongation and
the stress required to hold that value of deformation is recorded over time. The stress relaxiation
modulus is defined by = ( ), where is the applied strain and ( ) is the stress measured.
2) Time-Temperature superposition
The time-temperature equivalence can be used to reduce the data at various temperatures, trying
to reference to only one curve at temperature T. The main thing is to highlight that the relaxation
curve at the single temperature depends on the time scale; hence if the material is loaded for a
short time the molecules are not able to move and slide on one other, similar to elastic material
and the deformation is fully recovered. On the other hand, if the sample is kept deformed for a
long period, the molecules have enough time to slide and move on one other, fully relaxing the
initial stress, but showing a permanent deformation.
3) Boltzmann Superposition Principle
This principle is extremely important in understanding the linear viscoelasticity theory, in fact it
states that the deformation of a polymer is the sum or superposition of all strains, which are the
results of the various loads applied at different times. This means the response of the polymer to a
specific load is independent of pre-existing loads. Hence we can calculate the deformation of a
polymer which was loaded at different point-time, simply by adding strain responses.
Taking into consideration a short-term tensile test, we have to consider separately cross-linked
and uncross-linked (thermoplastic) polymers, because their deformation are significantly different.
In the cross-linked polymers the deformation is generally reversible, in the uncrossed-linked
polymers the deformation is associated with molecular chain relaxation, making the process time-
dependent and irreversible.
5
The main feature of cross-linked elastomeric materials is their ability to undergo notable reversible
deformations, because sliding is hindered among the molecules during deformation. Once the
load is released, most molecules recoil. In the uncross-linked polymers, when the elastomer
sample is deformed, the molecules provide low resistance allowing them to move more freely. At
around 400% of elongation we have the complete stretching of the polymer chains; this stretching
is followed by polymer chain breakage resulting in fracture of the sample.
Regarding thermoplastic polymer this test is the least understood and its results are often
misinterpreted. Classically this type of test is applied for elastic stress-strain response material; a
typical test was performed at various strain rates and the results have shown an increasing of the
curvatures with low elongation speed, this highlight the high relevance of the stress relaxation
during test.

6
7
3. FATIGUE
The dynamic loading of any material that leads to breakage after a certain number of cycles is
called fatigue. To better understand, we have to compare carefully the fatigue of composite
materials with metals, especially because a lot of components made in composite material are the
result of a metal substitution. Metallic fatigue has been studied for more than 150 years and it is
approached using some established concepts; low, mega and giga cycle fatigue and crack
propagation.
For the composite materials the situation is quite different, for which the giga cycles regime is
totally unknown. The S-N curves are usually between 10^3 to 10^6 cycle. To note that composites
are damaged in fatigue under shear or compression loading much more than metals; it is well
known that the fatigue resistance of composite materials is much lower in compression –
compression than in tension – tension, it is the contrary for metallic alloys.
3.1 DIFFERENCES BETWEEN COMPOSITES AND METALS
In metals the fatigue damage is strongly related to the cyclic plasticity, namely it is referred to the
dislocation mobility and slip system. Due to the environmental effect and the plane stress states,
the initiation of fatigue damage is often localized near the surface of metals. The endurance curve
of metallic alloys is almost hyperbolic in shape with a pronounced concavity as soon as the
maximum stress of the cycle exceeds the elastic limit of the material. The concavity of this curve is
attributed to the plasticity of metals.
In composite materials, an appreciable alternation of the shape of the curve can be reasonably
expected. This slow slope type of endurance is verified especially because very high cycle regime
( > 107 ) is unknown in composite materials since there is no drastic change between low and high
cycle fatigue behaviour, at the contrary of metals.
The effect of loading in the fatigue of a composite material is interesting, R ratio has not the same
effect compared to metals. Under monotonic and cyclic loading the composite shows a
compressive strength lower than the ultimate tensile strength, when the fatigue cycle is entirely in
compression, fracture can occur. This type of damage is unknown in metallic alloys, for practical
8
application it is extremely important to notice that in compression loading the ratio / can
be as low as 0.3 for certain composite.
Fatigue in bending is another aspect for composite materials; the analysis of the phenomenon is
quite complex, because several types of damage can occur in bending like tension, shear and
compression simultaneously. It is generally difficult to compare a result in bending fatigue with
one in tension or compression. The behaviour in bending of composite materials is more difficult
to determine than in metals.
Regarding stress concentration in fatigue, that it is well known that all metals are very notch
sensitive and the endurance limit falls in significant proportions. In composite polymers this
phenomenon is practically unknown, this is an advantage compared to metals.
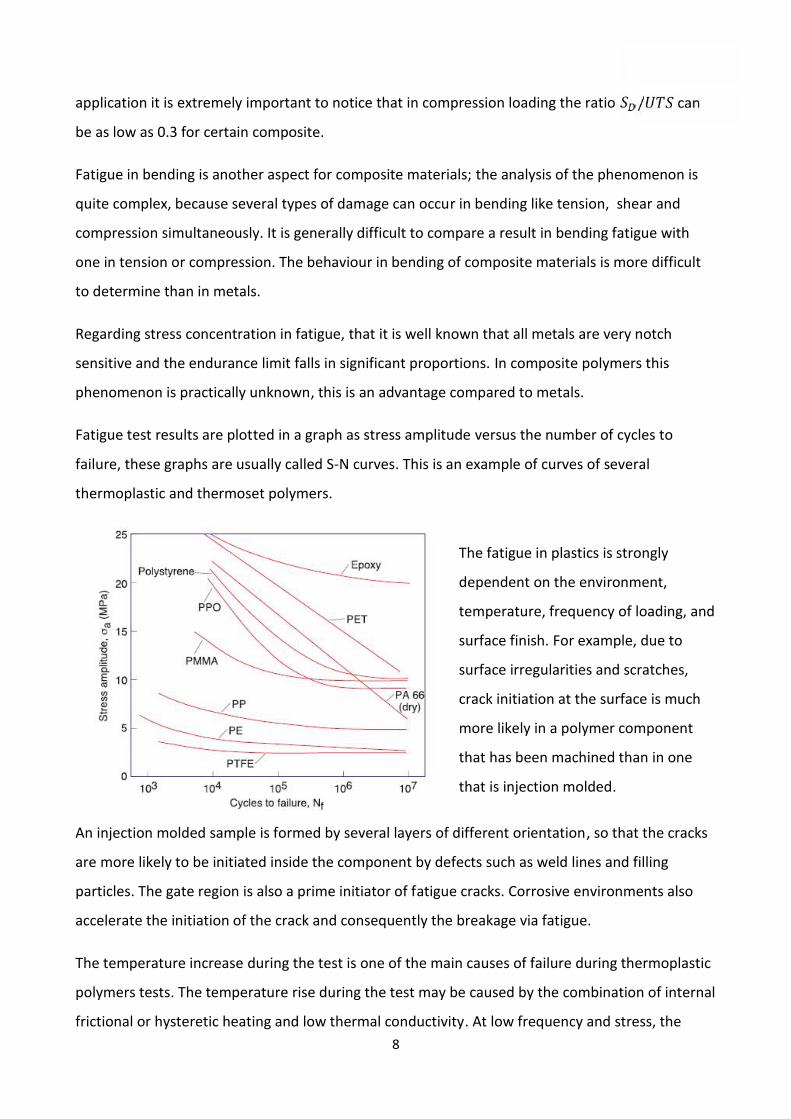
Fatigue test results are plotted in a graph as stress amplitude versus the number of cycles to
failure, these graphs are usually called S-N curves. This is an example of curves of several
thermoplastic and thermoset polymers.
The fatigue in plastics is strongly
dependent on the environment,
temperature, frequency of loading, and
surface finish. For example, due to
surface irregularities and scratches,
crack initiation at the surface is much
more likely in a polymer component
that has been machined than in one
that is injection molded.
An injection molded sample is formed by several layers of different orientation, so that the cracks
are more likely to be initiated inside the component by defects such as weld lines and filling
particles. The gate region is also a prime initiator of fatigue cracks. Corrosive environments also
accelerate the initiation of the crack and consequently the breakage via fatigue.
The temperature increase during the test is one of the main causes of failure during thermoplastic
polymers tests. The temperature rise during the test may be caused by the combination of internal
frictional or hysteretic heating and low thermal conductivity. At low frequency and stress, the
9
temperature in the polymer sample will rise and can eventually reach thermal equilibrium when
the heat generated by hysteretic heating equals the heat removed from the sample by conduction.
Increasing the frequency, a viscous heat is generated faster, causing a further temperature rise.
When thermal equilibrium has been reached, the sample eventually can reach breakage by
conventional brittle fatigue, assuming that the stress is above the endurance limit. However, if the
frequency or stress level is increased further, the temperature rises to the point that the sample
breaks before reaching thermal equilibrium. This mode of failure is usually called thermal fatigue.
10
3.2 CYCLIC STRESS FATIGUE AND THERMAL SOFTENING FAILURE OFTHERMOPLASTICS
REF: R.J. crawfird, P.P. Benham; Dept. of Mech. Engineering , the Queen’s University of Belfast.
There are few references relating to the fundamentals of fatigue of unreinforced thermoplastics;
probably because these materials are not often used for engineering components subjected to
cyclic stresses.
The main peculiarity, in the case of polymer fatigue, is undoubtedly the thermal aspect of failure.
In contrast to metals, the plastics have low thermal conductivity; for certain limits of frequency
and cyclic stress, the temperature will rise for a period, then it achieves a stable value and a
conventional form of fatigue crack can be initiated and propagated to complete failure. The
analysis conducted in this chapter indicates methods which may be used in deciding what type of
failure can be expected under selected loading conditions. In particular the effects of strain
control, load control, wave form and mean stress on fatigue behaviour are considered.
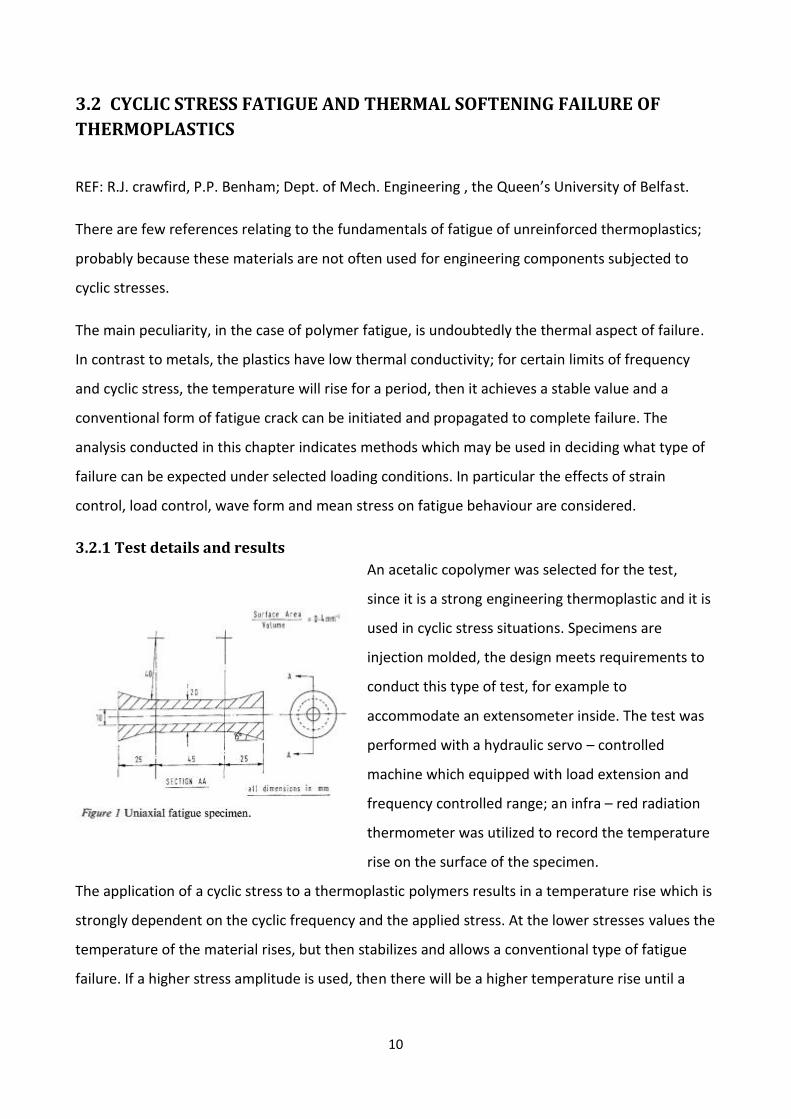
3.2.1 Test details and resultsAn acetalic copolymer was selected for the test,
since it is a strong engineering thermoplastic and it is
used in cyclic stress situations. Specimens are
injection molded, the design meets requirements to
conduct this type of test, for example to
accommodate an extensometer inside. The test was
performed with a hydraulic servo – controlled
machine which equipped with load extension and
frequency controlled range; an infra – red radiation
thermometer was utilized to record the temperature
rise on the surface of the specimen.
The application of a cyclic stress to a thermoplastic polymers results in a temperature rise which is
strongly dependent on the cyclic frequency and the applied stress. At the lower stresses values the
temperature of the material rises, but then stabilizes and allows a conventional type of fatigue
failure. If a higher stress amplitude is used, then there will be a higher temperature rise until a
11
particular stress amplitude is reached and the temperature instead of stabilizing, keeps increasing.
This results in a thermal failure in the material through a drastic drop in modulus.
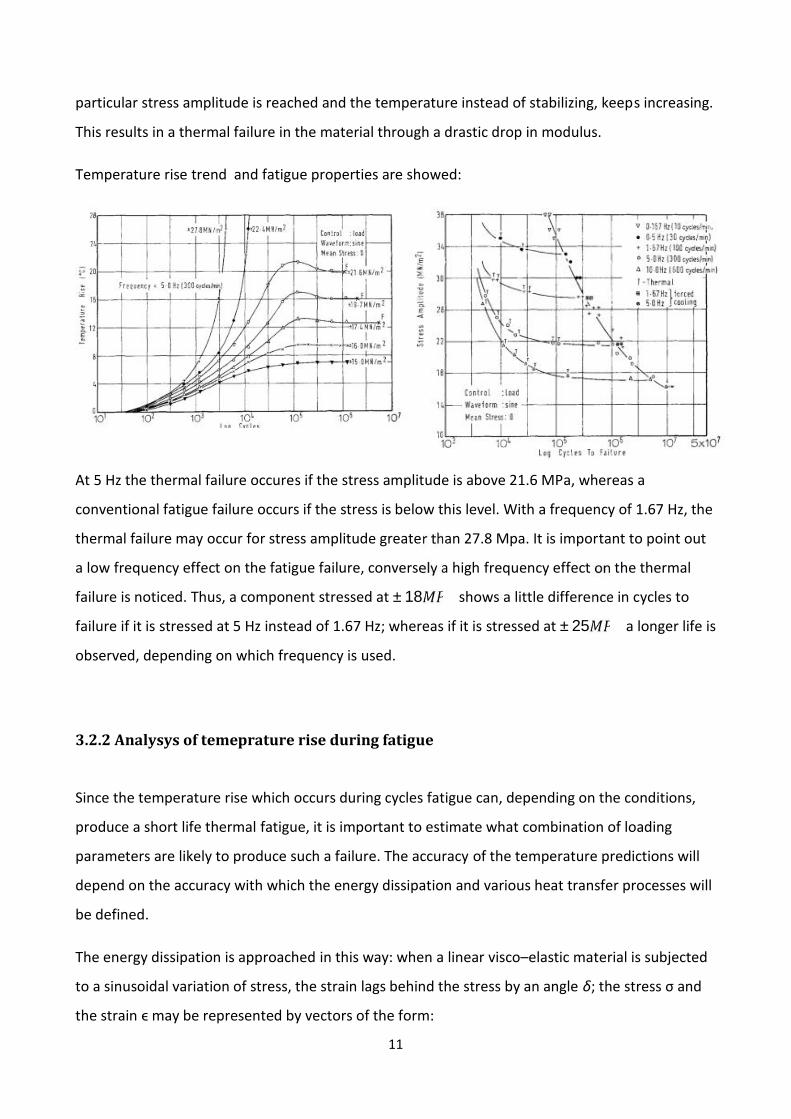
Temperature rise trend and fatigue properties are showed:
At 5 Hz the thermal failure occures if the stress amplitude is above 21.6 MPa, whereas a
conventional fatigue failure occurs if the stress is below this level. With a frequency of 1.67 Hz, the
thermal failure may occur for stress amplitude greater than 27.8 Mpa. It is important to point out
a low frequency effect on the fatigue failure, conversely a high frequency effect on the thermal
failure is noticed. Thus, a component stressed at ±18 shows a little difference in cycles to
failure if it is stressed at 5 Hz instead of 1.67 Hz; whereas if it is stressed at ±25 a longer life is
observed, depending on which frequency is used.
3.2.2 Analysys of temeprature rise during fatigue
Since the temperature rise which occurs during cycles fatigue can, depending on the conditions,
produce a short life thermal fatigue, it is important to estimate what combination of loading
parameters are likely to produce such a failure. The accuracy of the temperature predictions will
depend on the accuracy with which the energy dissipation and various heat transfer processes will
be defined.
The energy dissipation is approached in this way: when a linear visco–elastic material is subjected
to a sinusoidal variation of stress, the strain lags behind the stress by an angle δ; the stress σ and
the strain ϵ may be represented by vectors of the form:
12
∈=∈ sin = sin( + )where ω is the angular frequency, t is the time and subscript “a” refers to amplitude. The total
energy per unit volume W is given by : = ∫ = ∫ ∈ sin( + ) .
First part of this integral is the recoverable energy, but the remain part appears as heat and is
effectively lost; if the volume of material is V and the cyclic frequency is f, then the work dissipated
as heat per unit time, is given by: = ∈ .
Some of this heat is lost to the surroundings, , so the total heat per unit time is given by := − , so under normal conditions the major contributor to the heat transfer will be
free convection in which case = , where “h” is heat transfer coefficient, “A” is the surface
area and “ϴ” is the temperature difference between specimen and surroundings.
Applying to such formulations to the geometry of our specimen, we obtain the final equation:
= − + , where = / , = /∈ , ρ = density of material,
Cp = specific heat, = temperature of specimen.
Due to the low thermal conductivity of the material, the temperature within the wall of the
specimen will be greater than the temperature at the surface. This means that in the final
equation ≠ ; however as the first approximation they may be assumed to be the same. By
estimating a steady state of radial heat conduction through a hallow cylinder specimen, from the
last equation it can be shown that this is an acceptable assumption to make. The final equation
could be rewritten as = − , if R and S are assumed to be independent of temperature,
then this simple differential equation has a solution of the form : = (1 − ) , which
indicates an exponential rise of temperature to a value of = / . This is a simple
relationship which would be very useful, but unfortunately a few calculations with it show that the
temperature dependence of R and S cannot be ignore. In these tests and E were recorded
directly by means of the extensometer. Once the temperature dependence of h, sin δ and E had
been established then they were substituted in the final equation. Due to the heat transfer
coefficient was related to temperature ϴ by value of 0.25, it was not possible to get an explicit
solution of the differential equation for ϴ in terms of other parameters and then it was necessary
to use either a graphical solution or an iterative solution involving a computer.
13
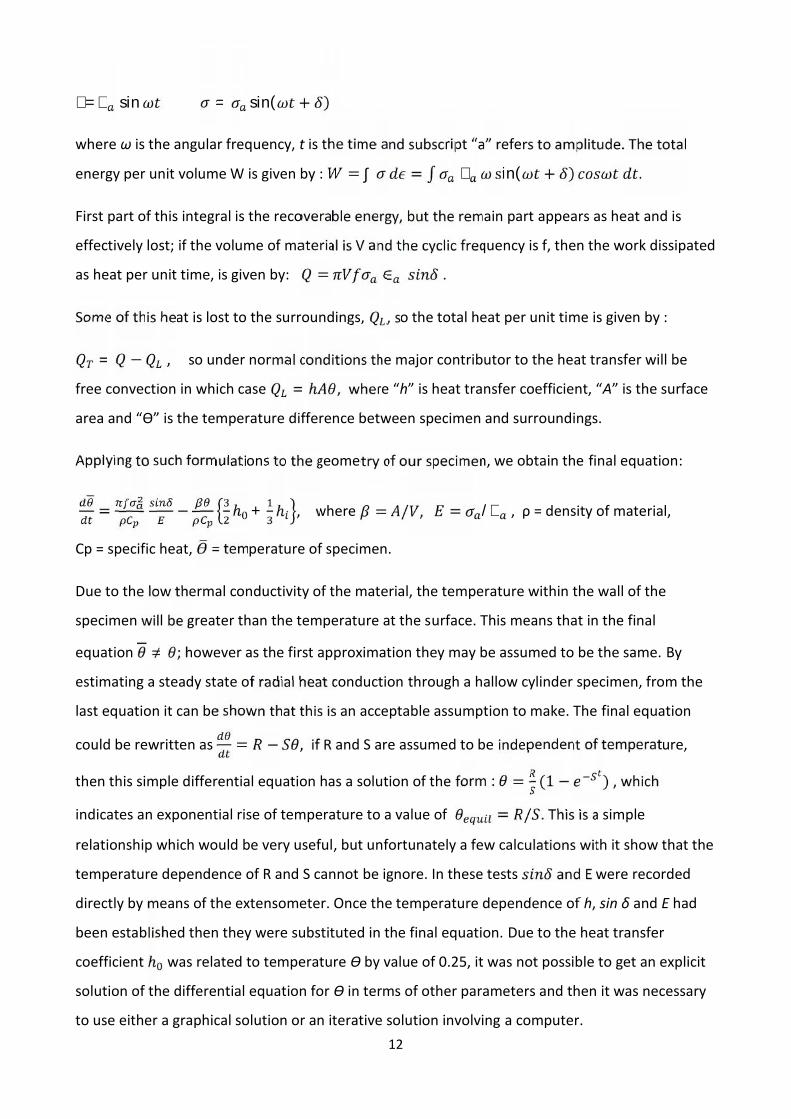
A graphical solution is plotted, once the temperature dependence of the heat transfer coefficients
had been included in the final equation.
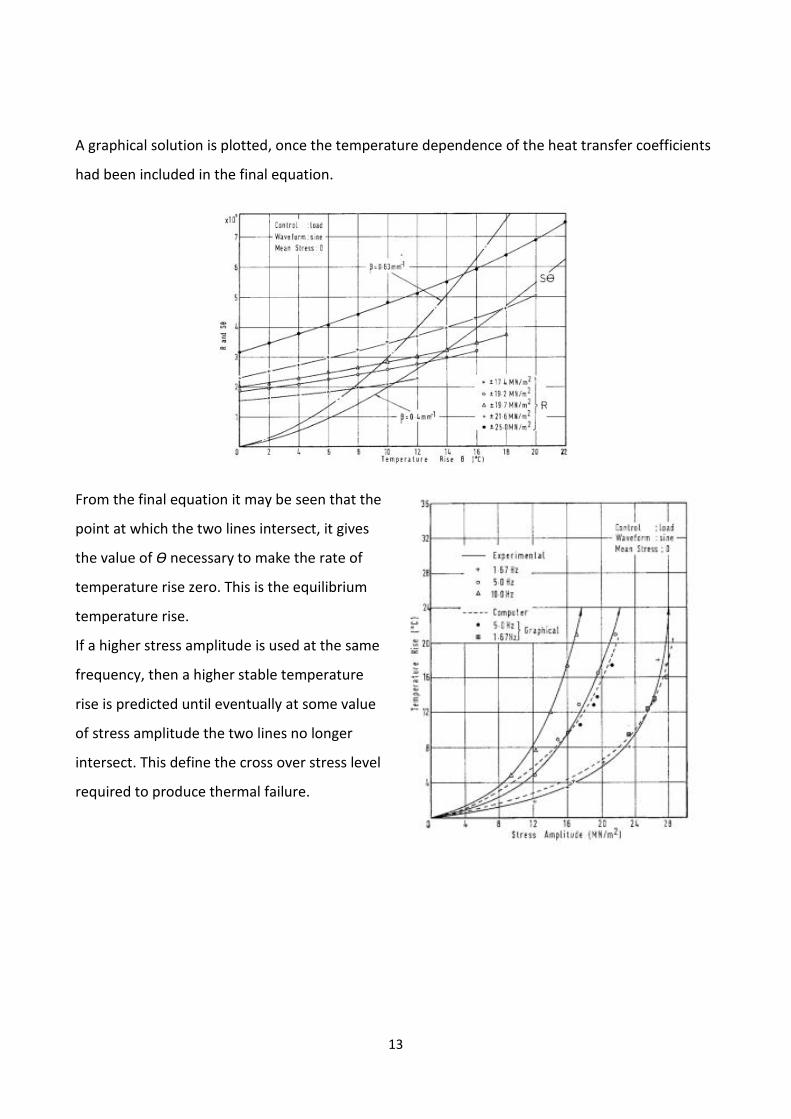
From the final equation it may be seen that the
point at which the two lines intersect, it gives
the value of ϴ necessary to make the rate of
temperature rise zero. This is the equilibrium
temperature rise.
If a higher stress amplitude is used at the same
frequency, then a higher stable temperature
rise is predicted until eventually at some value
of stress amplitude the two lines no longer
intersect. This define the cross over stress level
required to produce thermal failure.
14
3.2.3 Effect of strain control
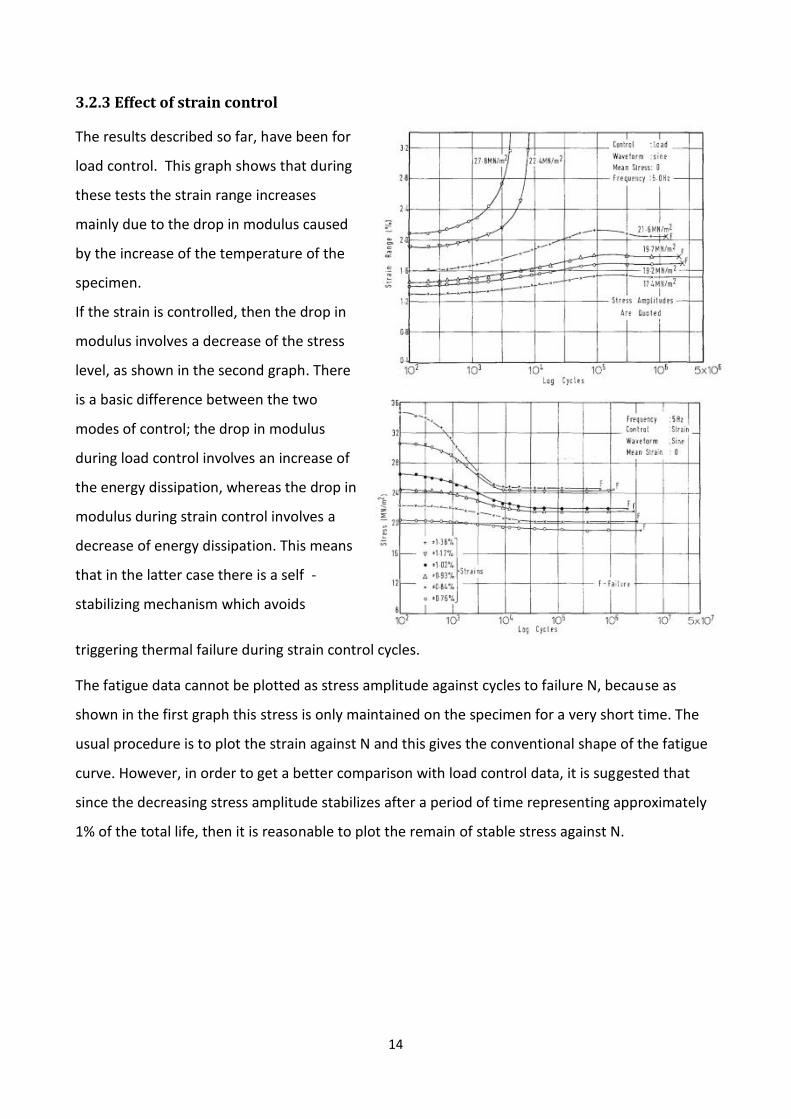
triggering thermal failure during strain control cycles.
The fatigue data cannot be plotted as stress amplitude against cycles to failure N, because as
shown in the first graph this stress is only maintained on the specimen for a very short time. The
usual procedure is to plot the strain against N and this gives the conventional shape of the fatigue
curve. However, in order to get a better comparison with load control data, it is suggested that
since the decreasing stress amplitude stabilizes after a period of time representing approximately
1% of the total life, then it is reasonable to plot the remain of stable stress against N.
The results described so far, have been for
load control. This graph shows that during
these tests the strain range increases
mainly due to the drop in modulus caused
by the increase of the temperature of the
specimen.
If the strain is controlled, then the drop in
modulus involves a decrease of the stress
level, as shown in the second graph. There
is a basic difference between the two
modes of control; the drop in modulus
during load control involves an increase of
the energy dissipation, whereas the drop in
modulus during strain control involves a
decrease of energy dissipation. This means
that in the latter case there is a self -
stabilizing mechanism which avoids
15
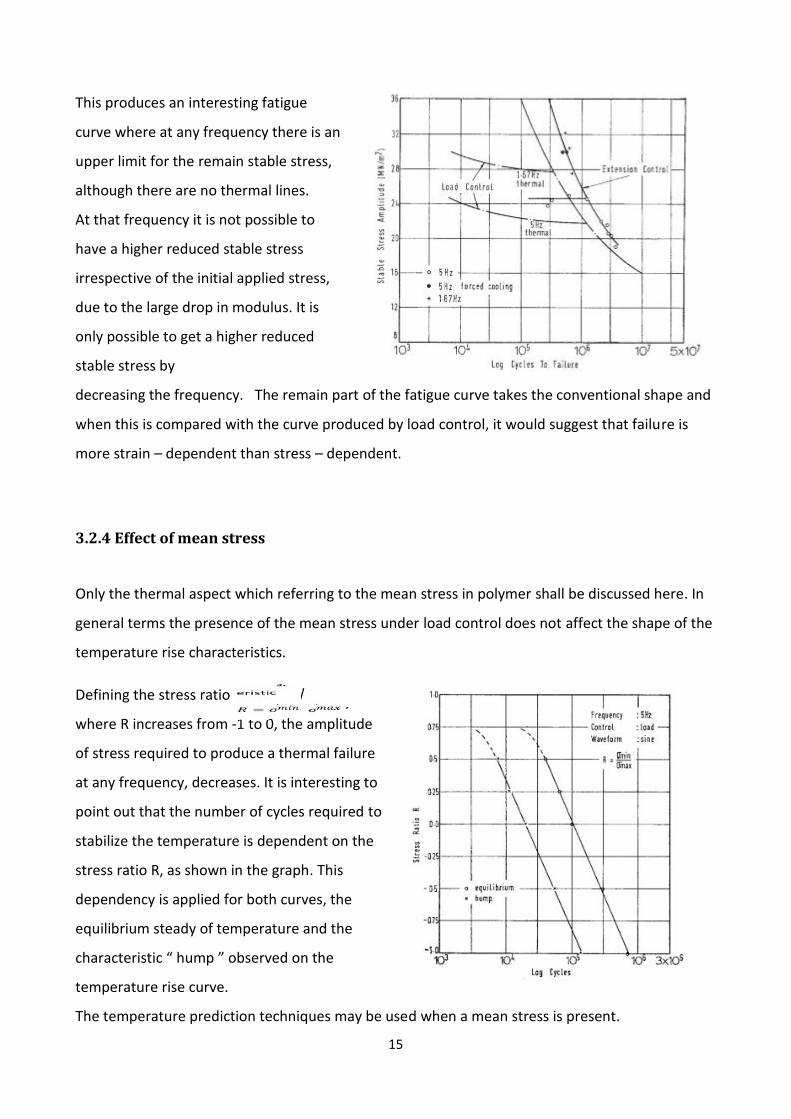
This produces an interesting fatigue
curve where at any frequency there is an
upper limit for the remain stable stress,
although there are no thermal lines.
At that frequency it is not possible to
have a higher reduced stable stress
irrespective of the initial applied stress,
due to the large drop in modulus. It is
only possible to get a higher reduced
stable stress by
decreasing the frequency. The remain part of the fatigue curve takes the conventional shape and
when this is compared with the curve produced by load control, it would suggest that failure is
more strain – dependent than stress – dependent.
3.2.4 Effect of mean stress
Only the thermal aspect which referring to the mean stress in polymer shall be discussed here. In
general terms the presence of the mean stress under load control does not affect the shape of the
temperature rise characteristics.
Defining the stress ratio = / ,
where R increases from -1 to 0, the amplitude
of stress required to produce a thermal failure
at any frequency, decreases. It is interesting to
point out that the number of cycles required to
stabilize the temperature is dependent on the
stress ratio R, as shown in the graph. This
dependency is applied for both curves, the
equilibrium steady of temperature and the
characteristic “ hump ” observed on the
temperature rise curve.
The temperature prediction techniques may be used when a mean stress is present.
16
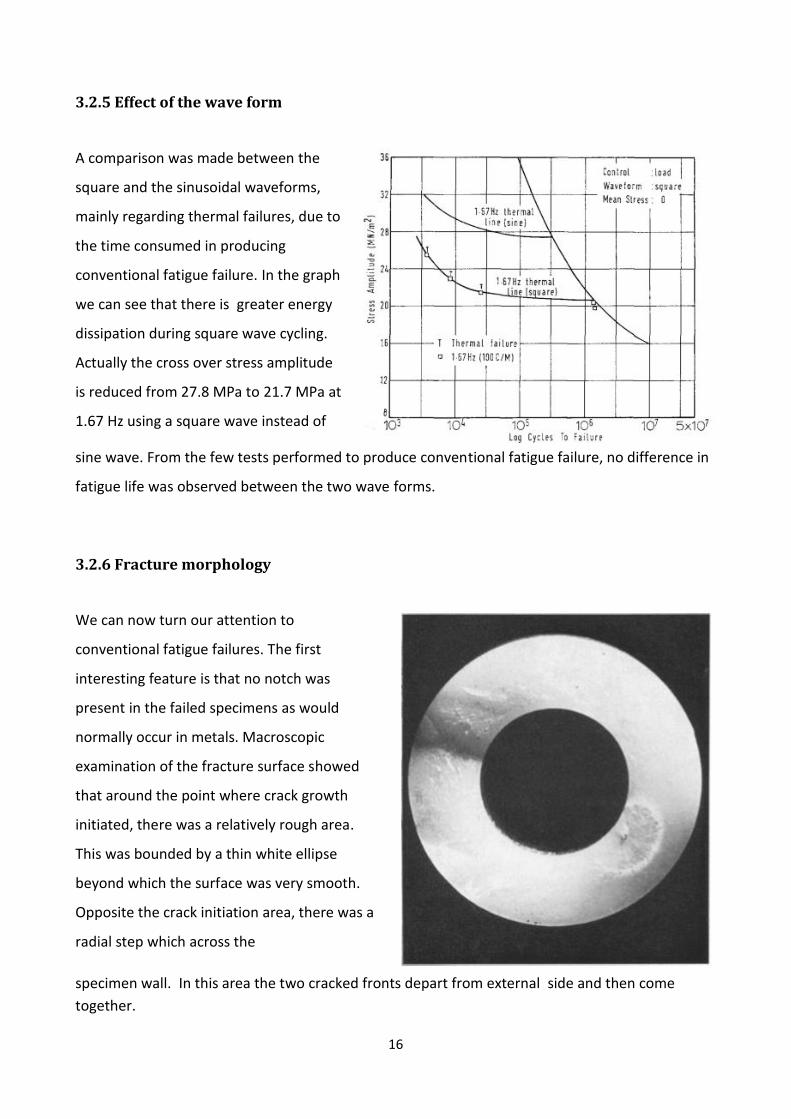
3.2.5 Effect of the wave form
A comparison was made between the
square and the sinusoidal waveforms,
mainly regarding thermal failures, due to
the time consumed in producing
conventional fatigue failure. In the graph
we can see that there is greater energy
dissipation during square wave cycling.
Actually the cross over stress amplitude
is reduced from 27.8 MPa to 21.7 MPa at
1.67 Hz using a square wave instead of
sine wave. From the few tests performed to produce conventional fatigue failure, no difference in
fatigue life was observed between the two wave forms.
3.2.6 Fracture morphology
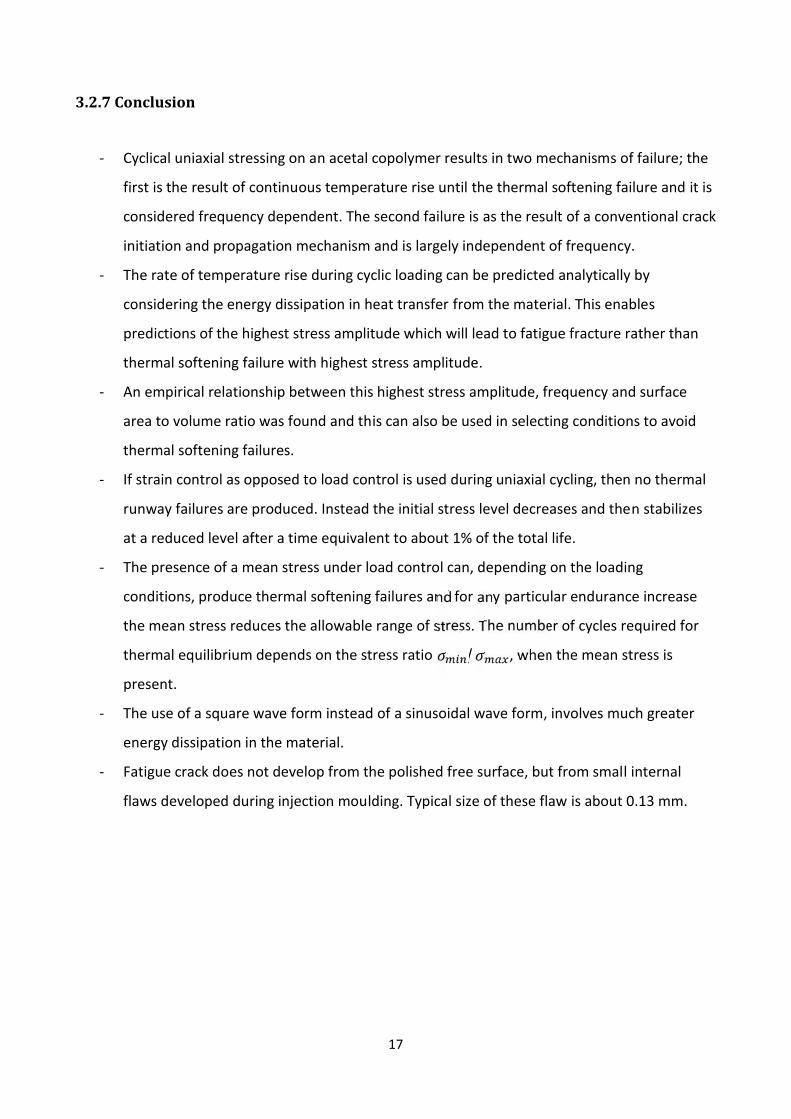
We can now turn our attention to
conventional fatigue failures. The first
interesting feature is that no notch was
present in the failed specimens as would
normally occur in metals. Macroscopic
examination of the fracture surface showed
that around the point where crack growth
initiated, there was a relatively rough area.
This was bounded by a thin white ellipse
beyond which the surface was very smooth.
Opposite the crack initiation area, there was a
radial step which across the
specimen wall. In this area the two cracked fronts depart from external side and then cometogether.
17
3.2.7 Conclusion
- Cyclical uniaxial stressing on an acetal copolymer results in two mechanisms of failure; the
first is the result of continuous temperature rise until the thermal softening failure and it is
considered frequency dependent. The second failure is as the result of a conventional crack
initiation and propagation mechanism and is largely independent of frequency.
- The rate of temperature rise during cyclic loading can be predicted analytically by
considering the energy dissipation in heat transfer from the material. This enables
predictions of the highest stress amplitude which will lead to fatigue fracture rather than
thermal softening failure with highest stress amplitude.
- An empirical relationship between this highest stress amplitude, frequency and surface
area to volume ratio was found and this can also be used in selecting conditions to avoid
thermal softening failures.
- If strain control as opposed to load control is used during uniaxial cycling, then no thermal
runway failures are produced. Instead the initial stress level decreases and then stabilizes
at a reduced level after a time equivalent to about 1% of the total life.
- The presence of a mean stress under load control can, depending on the loading
conditions, produce thermal softening failures and for any particular endurance increase
the mean stress reduces the allowable range of stress. The number of cycles required for
thermal equilibrium depends on the stress ratio / , when the mean stress is
present.
- The use of a square wave form instead of a sinusoidal wave form, involves much greater
energy dissipation in the material.
- Fatigue crack does not develop from the polished free surface, but from small internal
flaws developed during injection moulding. Typical size of these flaw is about 0.13 mm.
18
3.3 LOAD HISTORY AND SEQUENCE EFFECTS ON CYCLIC DEFORMATION
AND FATIGUE BEHAVIOUR OF A THERMOPLASTIC POLYMER
REF: R. Shrestha, J. Simsiriwong, N. Shamsaei; Center of vehicular system, Mississipi state
University ( USA ) – Dept. of Mech. Engineer Auburn University ( USA )
In this chapter, the fatigue behaviour of PEEK polymer ( polyether ether ketone ) was evaluated
under different types of strain - controlled multi – block cyclic loading. The loading conditions
examined include 1) fully - reversed R= -1 four block - loading with adjusted frequency to maintain
a nominal temperature rise on the specimen surface; 2) fully – reversed two block - loading to
study the frequency effect and 3) pulsating tension R = 0 two block - loading to investigate the
effect of pre – loading in the presence of mean strain / stress.
3.3.1 Experimental data and procedure
A series of experiments on unfilled PEEK polymer were performed, the glass transition and melt
temperatures are respectively of 143°C and 343°C. The specimens were machined from a uniform
section of 6.35 mm in diameter and 18 mm in length , using an oil-based coolant to minimize heat
build-up. The dimensions and geometry of specimens were designed in accordance with ASTM
E606-04 and they were further polished to achieve an average surface finish of 3.4 in the gage
section.
Fatigue tests were conducted in accordance with ASTM D7791-12 using a closed – loop servo –
hydraulic load frame; a 25 KN load cell, an extensometer with 15 mm length and sinusoidal wave
forms were utilized. The tests were stopped at 10^6 cycles. The temperature monitoring was an
important aspect during the test, its purpose is to ensure that specimens underwent mechanical
failure and not failure due to excessive temperature rise during cycling ( self - heating ).
PEEK specimens were subjected to strain – controlled low – high and high – low block loading at
R= -1 and 0; two set of experiments were conducted under R = -1 test conditions. The first set
showed a frequency that allowed the maintenance of a nominal temperature rise on the specimen
surface. The second set showed various frequencies to study the effect of the frequency on PEEK
specimens.
19
In R = -1 tests, 0.02 or 0.03 mm/mm was selected as the lower strain amplitude and 0.04 mm/mm
as the higher. In R = 0 tests, 0.02 and 0.03 mm/mm were taken as the lower and the higher
respectively.
3.3.2 Experimental results and discussion
3.3.2.1 Fully reversed block loading with nominal temperature rise
The results obtained from the two block - loading fatigue test under fully reversed fatigue cycles
are summarized in table 1.
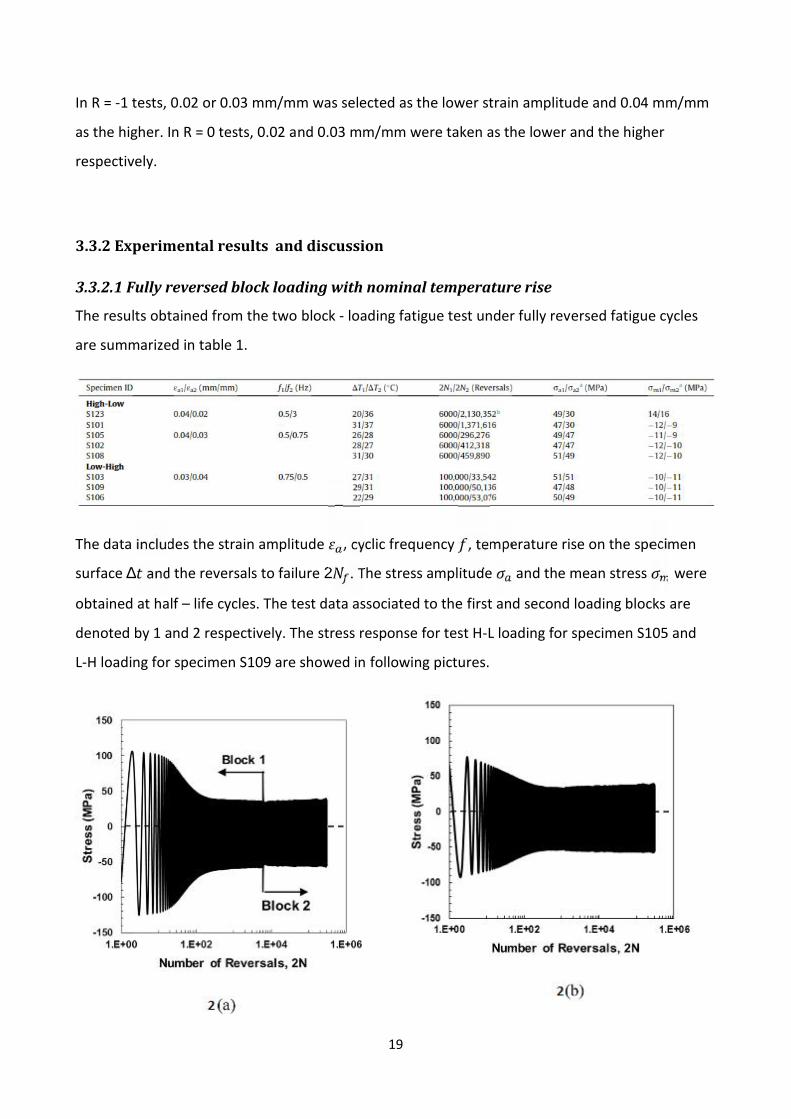
The data includes the strain amplitude , cyclic frequency , temperature rise on the specimen
surface ∆ and the reversals to failure 2 . The stress amplitude and the mean stress were
obtained at half – life cycles. The test data associated to the first and second loading blocks are
denoted by 1 and 2 respectively. The stress response for test H-L loading for specimen S105 and
L-H loading for specimen S109 are showed in following pictures.
20
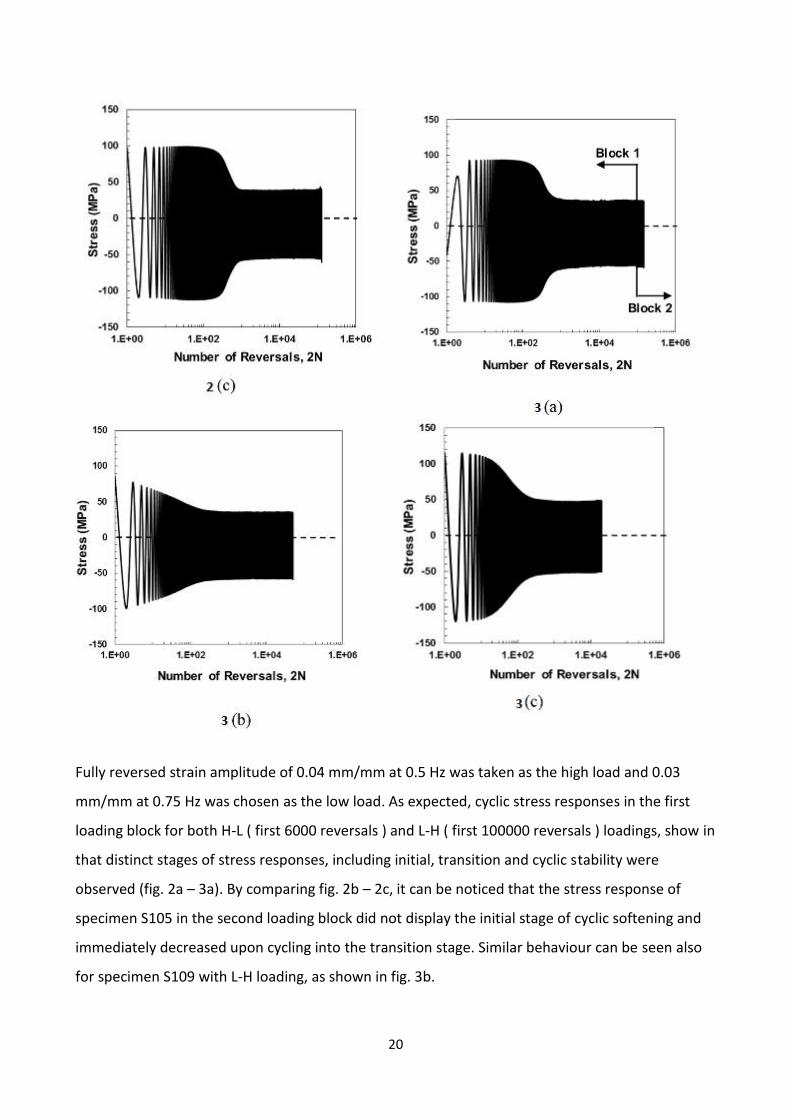
Fully reversed strain amplitude of 0.04 mm/mm at 0.5 Hz was taken as the high load and 0.03
mm/mm at 0.75 Hz was chosen as the low load. As expected, cyclic stress responses in the first
loading block for both H-L ( first 6000 reversals ) and L-H ( first 100000 reversals ) loadings, show in
that distinct stages of stress responses, including initial, transition and cyclic stability were
observed (fig. 2a – 3a). By comparing fig. 2b – 2c, it can be noticed that the stress response of
specimen S105 in the second loading block did not display the initial stage of cyclic softening and
immediately decreased upon cycling into the transition stage. Similar behaviour can be seen also
for specimen S109 with L-H loading, as shown in fig. 3b.
21
Overall, higher stress amplitudes ( 15% higher ) at the initial cycles of the specimens without pre-
loading were observed as compared to those with pre-loading. It has been reported that the
duration of the initial region of cycle softening for polymers significantly depends on the initial
state of the material microstructure as well as the applied strain/stress amplitude. During the
initial stage of cyclic softening, some molecular rearrangement may occur, which can cause the
movement and formation of mobile defects in polymeric materials. The materials will begin to
soften when the mobile defect population reaches its critical value.
Some polymers, such as nylon and acrylonitrile butadiene styrene, do not exhibit an initial stage of
cyclic softening under constant amplitude cyclic loading, which is believed to be associated with
the presence of a larger mobile defect population in the initial material state. As result, the
absence of the initial stage of cyclic softening in PEEK specimens with pre-loading may be
explained by increased mobile defects as compared to the virgin material. However, despite the
differences in the initial cyclic deformation, the stress response in PEEK specimens with pre-
loading, irrespective of loading sequence ( L-H or H-L ), was stabilized at approximately the same
loading cycle as the specimen without pre-loading. Furthermore, the pre-loading effect on the
stress amplitude at the cyclic stability region was not noticeable.
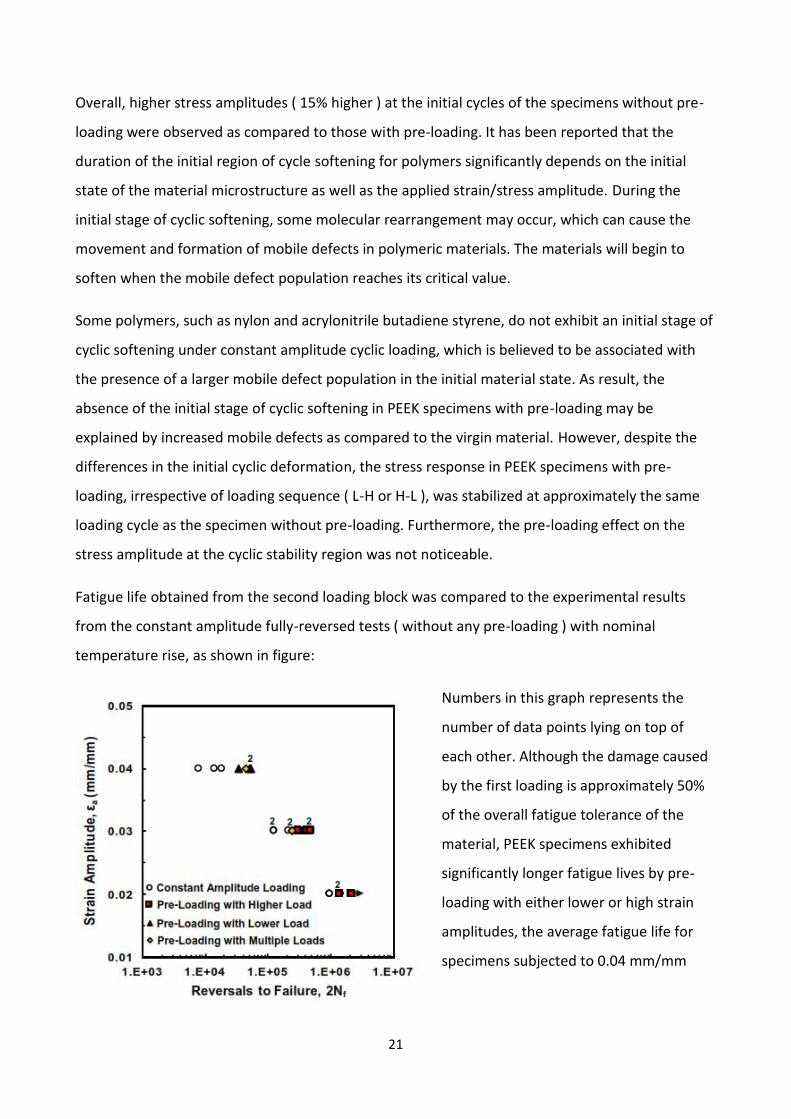
Fatigue life obtained from the second loading block was compared to the experimental results
from the constant amplitude fully-reversed tests ( without any pre-loading ) with nominal
temperature rise, as shown in figure:
Numbers in this graph represents the
number of data points lying on top of
each other. Although the damage caused
by the first loading is approximately 50%
of the overall fatigue tolerance of the
material, PEEK specimens exhibited
significantly longer fatigue lives by pre-
loading with either lower or high strain
amplitudes, the average fatigue life for
specimens subjected to 0.04 mm/mm
22
at 0.5 Hz without pre-loading was 13464 reversals, while the average fatigue life for PEEK
specimens under fully reversed 0.04 mm/mm strain amplitude ( specimens S103, S109, S106 in
table 1 ) increased to 45585 reversals after being subjected to a prior loading block of 0.03
mm/mm strain amplitude for 10^5 reversals.
Similarly, in the case of 0.03 mm/mm strain amplitude at 0.75 Hz, the average fatigue life (
specimens S105, S102, S108 ) increased from 152927 reversals without pre-loading to 389495
reversals when a loading block with strain amplitude of 0.04 mm/mm was first applied for 6000
reversals.
Although some compressive mean stresses are noticeable in two-block loading tests, PEEK
specimens under constant amplitude loading also exhibited some compressive mean stresses, but
at slightly lower values. Specimen S123 exhibited a tensile mean stress at half-life cycle, it had a
longer fatigue life ( > 2 × 10 reversals ) than specimen S101 (1.37 × 10 reversals ) with some
compressive mean stress. Therefore, the presence of compressive mean stress may not be the
main contributor to the increased fatigue resistance observed in PEEK thermoplastic when
subjected to pre-loading.
Under cyclic loading, in polymeric materials may experience some microstructural rearrangements
that consist of the realignments and entanglements of individual polymer molecules, leading to a
molecular directional hardening. Hence, a decrease in the material internal free volume may
possibly affect the fatigue behaviour of PEEK with pre-loading. Further microstructural
investigations, however, are needed to better understand the mechanism involved in the fatigue
failure of PEEK polymer with and without pre-loading.
The next set of fatigue experiments with nominal temperature rise was conducted using three
blocks ( H-L-H and L-H-L ) and four blocks ( H-L-H-L ) loading with zero mean strain ( R=-1 ). Strain
amplitude of 0.04 mm/mm at 0.5 Hz and 0.03 mm/mm at 0.75 Hz were chosen high and low
respectively.
23
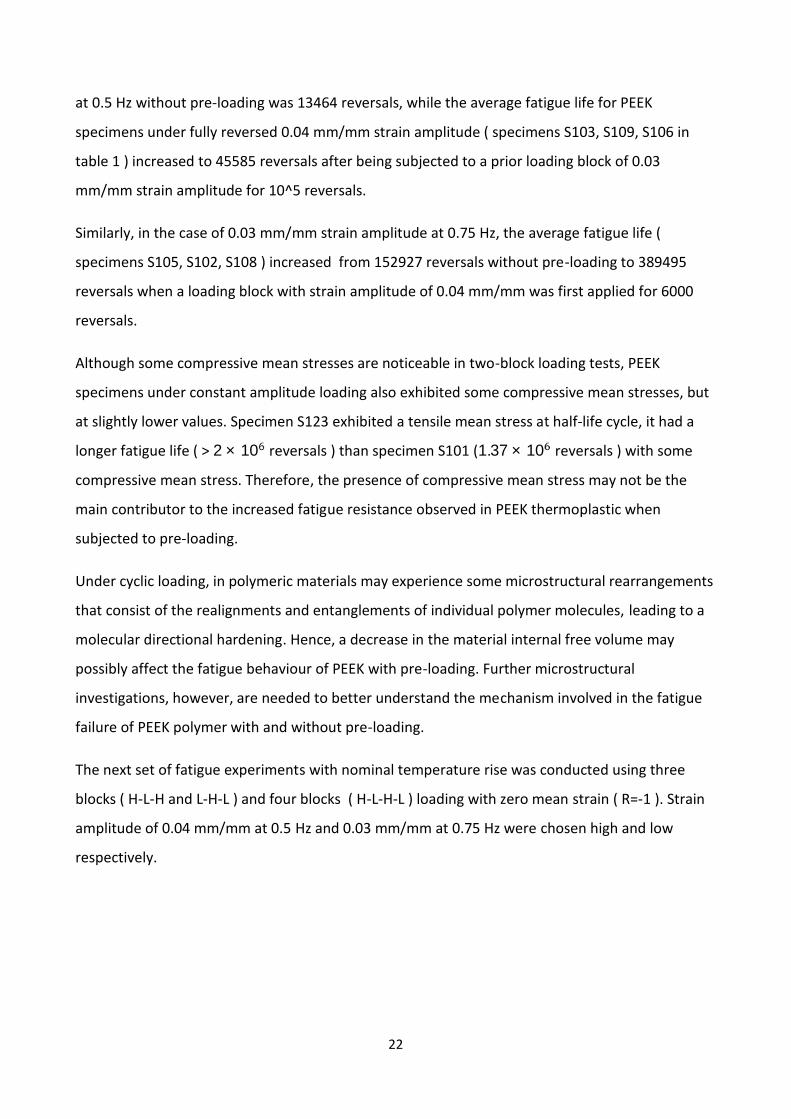
The experimental results are shown in the table 2.
24
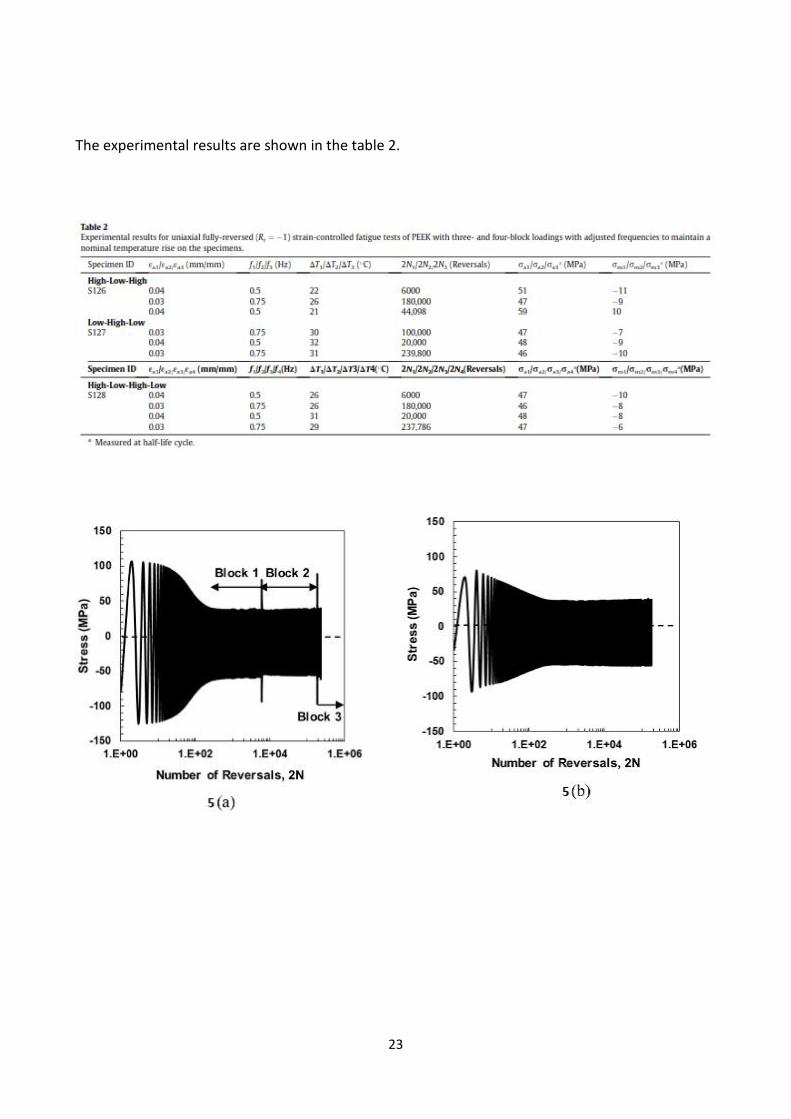
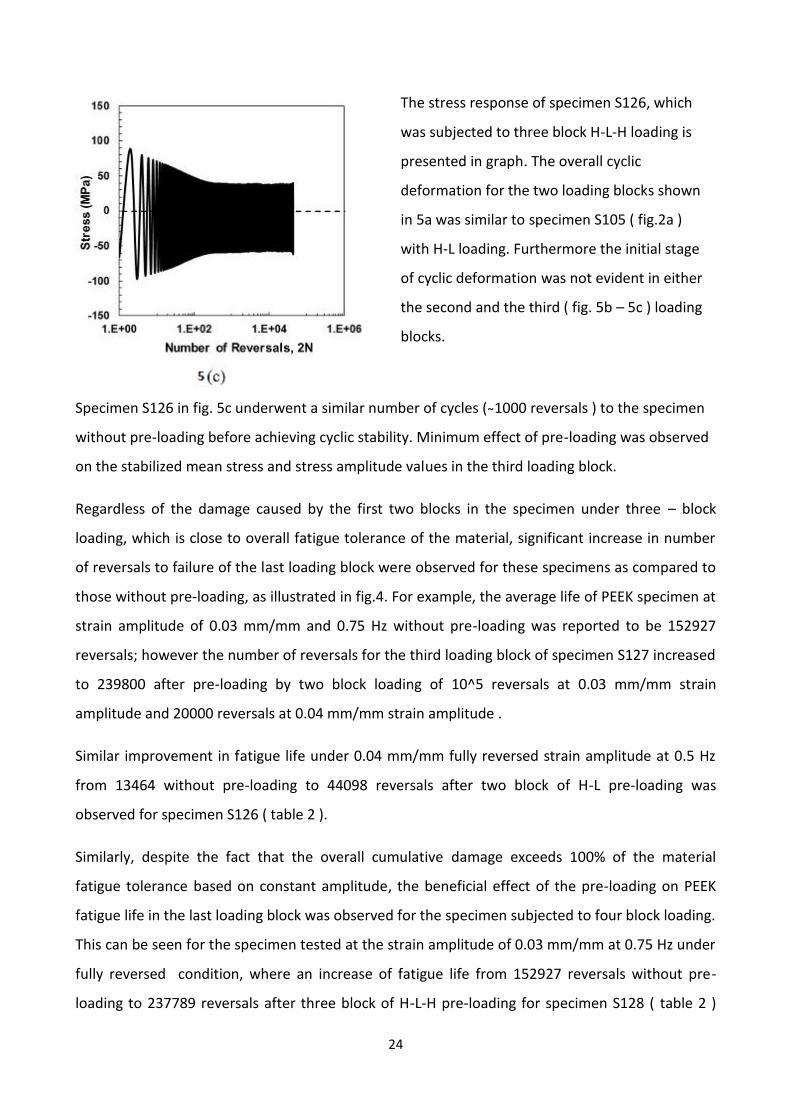
The stress response of specimen S126, which
was subjected to three block H-L-H loading is
presented in graph. The overall cyclic
deformation for the two loading blocks shown
in 5a was similar to specimen S105 ( fig.2a )
with H-L loading. Furthermore the initial stage
of cyclic deformation was not evident in either
the second and the third ( fig. 5b – 5c ) loading
blocks.
Specimen S126 in fig. 5c underwent a similar number of cycles ( 1000 reversals ) to the specimen
without pre-loading before achieving cyclic stability. Minimum effect of pre-loading was observed
on the stabilized mean stress and stress amplitude values in the third loading block.
Regardless of the damage caused by the first two blocks in the specimen under three – block
loading, which is close to overall fatigue tolerance of the material, significant increase in number
of reversals to failure of the last loading block were observed for these specimens as compared to
those without pre-loading, as illustrated in fig.4. For example, the average life of PEEK specimen at
strain amplitude of 0.03 mm/mm and 0.75 Hz without pre-loading was reported to be 152927
reversals; however the number of reversals for the third loading block of specimen S127 increased
to 239800 after pre-loading by two block loading of 10^5 reversals at 0.03 mm/mm strain
amplitude and 20000 reversals at 0.04 mm/mm strain amplitude .
Similar improvement in fatigue life under 0.04 mm/mm fully reversed strain amplitude at 0.5 Hz
from 13464 without pre-loading to 44098 reversals after two block of H-L pre-loading was
observed for specimen S126 ( table 2 ).
Similarly, despite the fact that the overall cumulative damage exceeds 100% of the material
fatigue tolerance based on constant amplitude, the beneficial effect of the pre-loading on PEEK
fatigue life in the last loading block was observed for the specimen subjected to four block loading.
This can be seen for the specimen tested at the strain amplitude of 0.03 mm/mm at 0.75 Hz under
fully reversed condition, where an increase of fatigue life from 152927 reversals without pre-
loading to 237789 reversals after three block of H-L-H pre-loading for specimen S128 ( table 2 )
25
was obtained. Again, a further investigation at lower-length scales are needed to understand the
mechanism involved in fatigue failure of polymers to explain the beneficial effect of pre-loading on
fatigue resistance of PEEK.
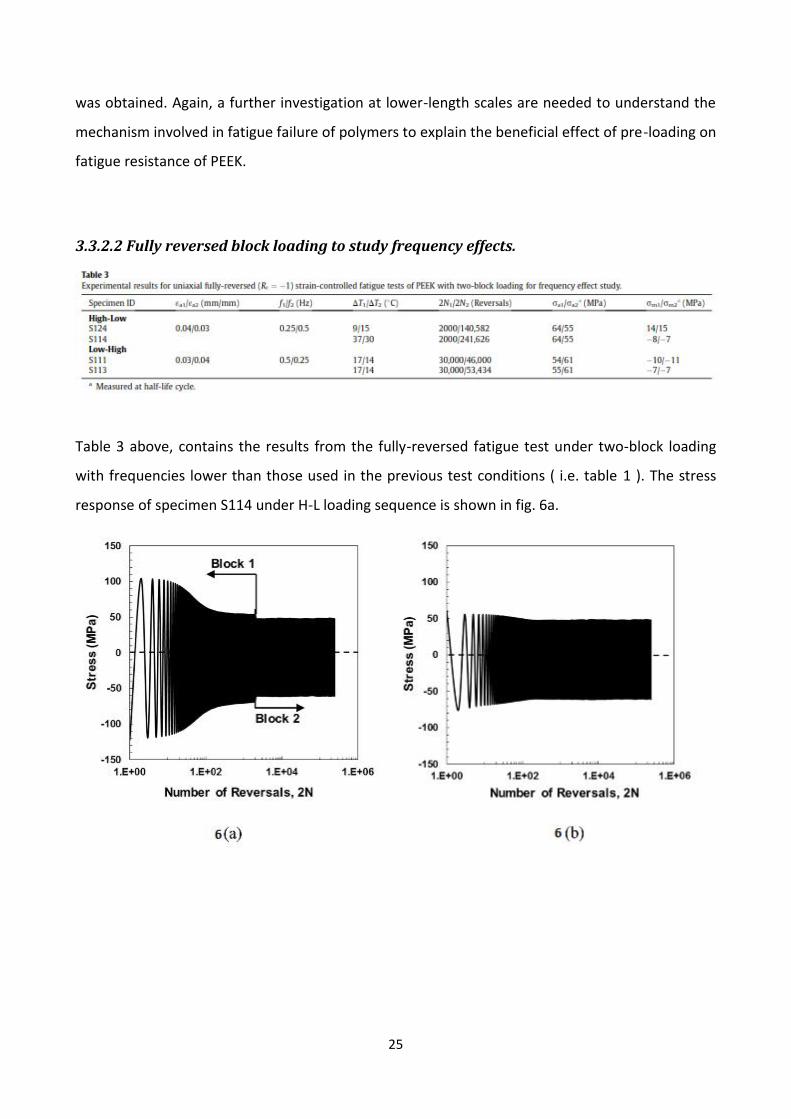
3.3.2.2 Fully reversed block loading to study frequency effects.
Table 3 above, contains the results from the fully-reversed fatigue test under two-block loading
with frequencies lower than those used in the previous test conditions ( i.e. table 1 ). The stress
response of specimen S114 under H-L loading sequence is shown in fig. 6a.
26
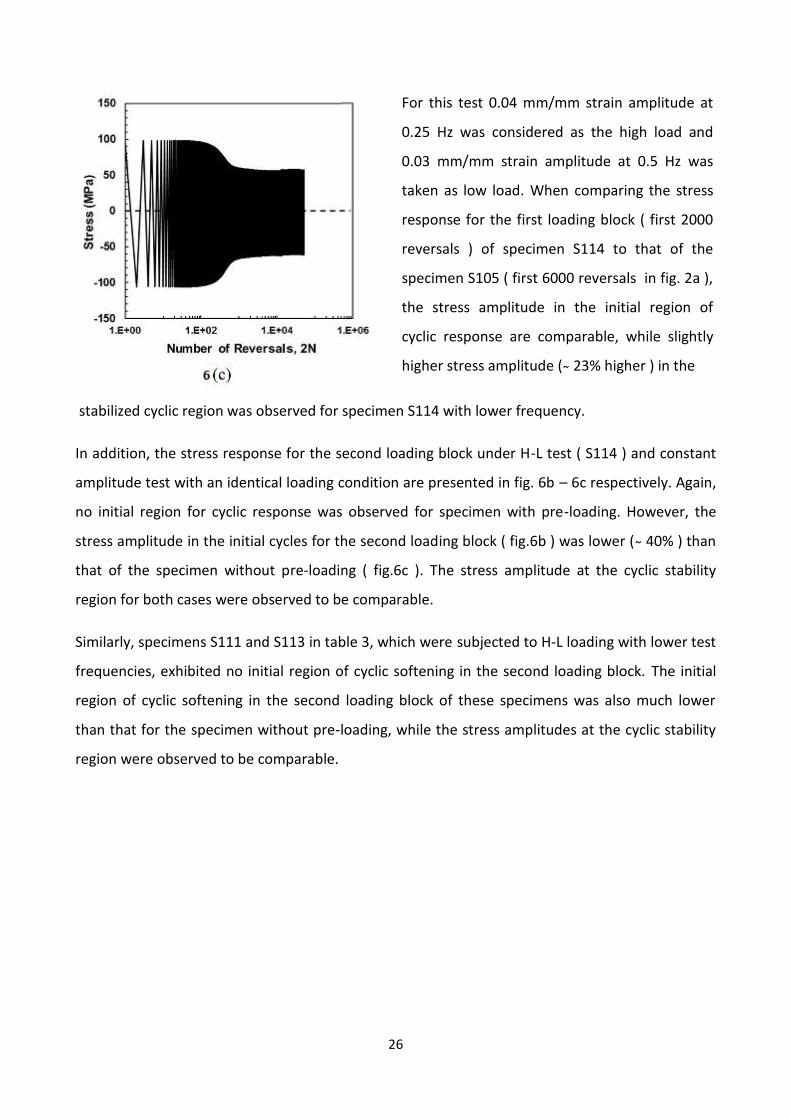
For this test 0.04 mm/mm strain amplitude at
0.25 Hz was considered as the high load and
0.03 mm/mm strain amplitude at 0.5 Hz was
taken as low load. When comparing the stress
response for the first loading block ( first 2000
reversals ) of specimen S114 to that of the
specimen S105 ( first 6000 reversals in fig. 2a ),
the stress amplitude in the initial region of
cyclic response are comparable, while slightly
higher stress amplitude ( 23% higher ) in the
stabilized cyclic region was observed for specimen S114 with lower frequency.
In addition, the stress response for the second loading block under H-L test ( S114 ) and constant
amplitude test with an identical loading condition are presented in fig. 6b – 6c respectively. Again,
no initial region for cyclic response was observed for specimen with pre-loading. However, the
stress amplitude in the initial cycles for the second loading block ( fig.6b ) was lower ( 40% ) than
that of the specimen without pre-loading ( fig.6c ). The stress amplitude at the cyclic stability
region for both cases were observed to be comparable.
Similarly, specimens S111 and S113 in table 3, which were subjected to H-L loading with lower test
frequencies, exhibited no initial region of cyclic softening in the second loading block. The initial
region of cyclic softening in the second loading block of these specimens was also much lower
than that for the specimen without pre-loading, while the stress amplitudes at the cyclic stability
region were observed to be comparable.
27
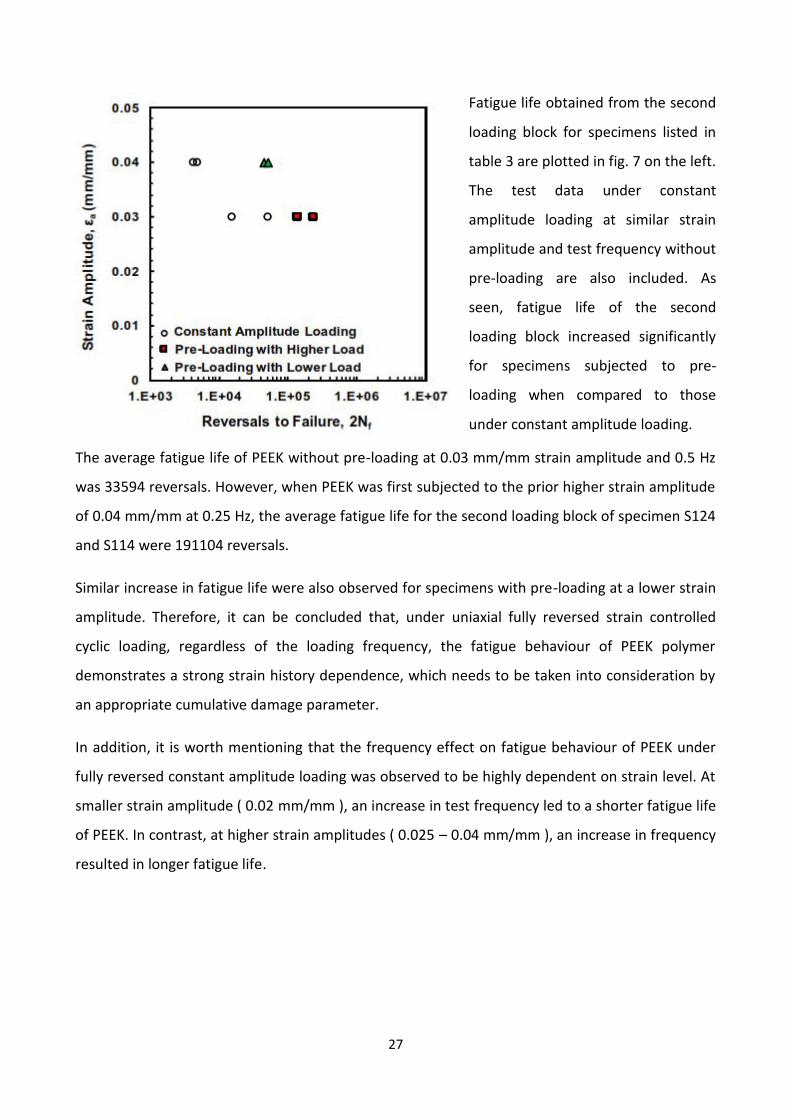
Fatigue life obtained from the second
loading block for specimens listed in
table 3 are plotted in fig. 7 on the left.
The test data under constant
amplitude loading at similar strain
amplitude and test frequency without
pre-loading are also included. As
seen, fatigue life of the second
loading block increased significantly
for specimens subjected to pre-
loading when compared to those
under constant amplitude loading.
The average fatigue life of PEEK without pre-loading at 0.03 mm/mm strain amplitude and 0.5 Hz
was 33594 reversals. However, when PEEK was first subjected to the prior higher strain amplitude
of 0.04 mm/mm at 0.25 Hz, the average fatigue life for the second loading block of specimen S124
and S114 were 191104 reversals.
Similar increase in fatigue life were also observed for specimens with pre-loading at a lower strain
amplitude. Therefore, it can be concluded that, under uniaxial fully reversed strain controlled
cyclic loading, regardless of the loading frequency, the fatigue behaviour of PEEK polymer
demonstrates a strong strain history dependence, which needs to be taken into consideration by
an appropriate cumulative damage parameter.
In addition, it is worth mentioning that the frequency effect on fatigue behaviour of PEEK under
fully reversed constant amplitude loading was observed to be highly dependent on strain level. At
smaller strain amplitude ( 0.02 mm/mm ), an increase in test frequency led to a shorter fatigue life
of PEEK. In contrast, at higher strain amplitudes ( 0.025 – 0.04 mm/mm ), an increase in frequency
resulted in longer fatigue life.
28
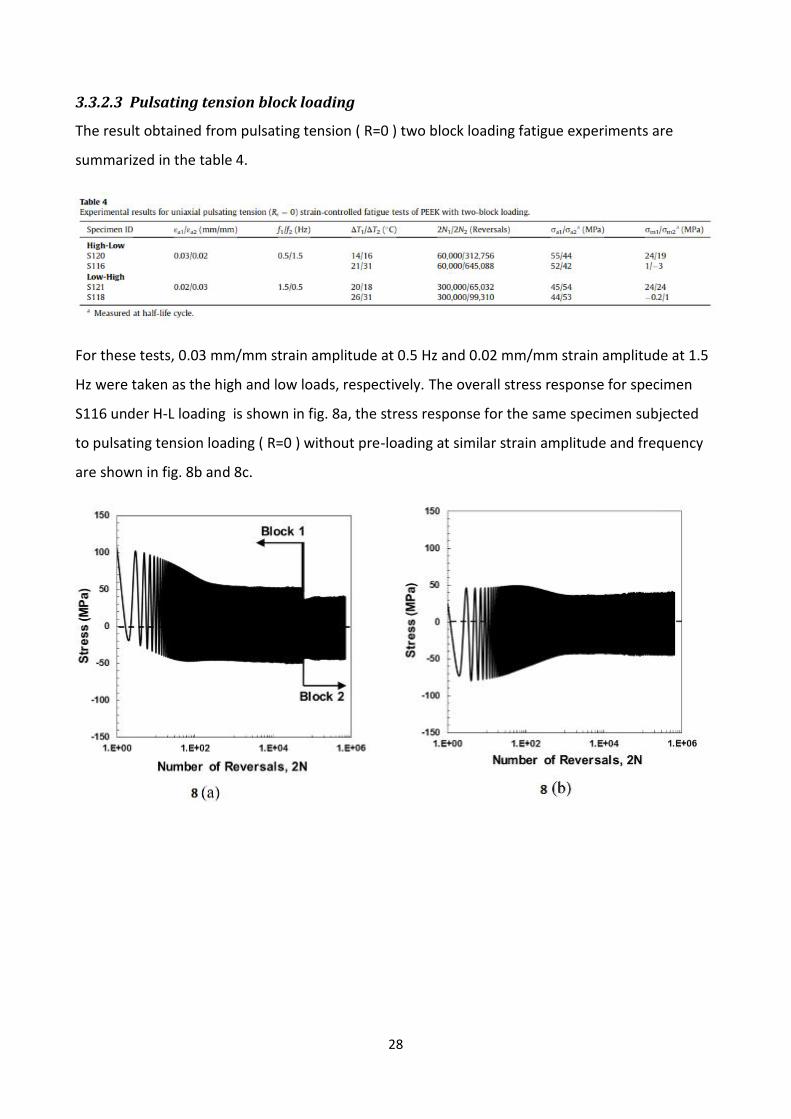
3.3.2.3 Pulsating tension block loading
The result obtained from pulsating tension ( R=0 ) two block loading fatigue experiments are
summarized in the table 4.
For these tests, 0.03 mm/mm strain amplitude at 0.5 Hz and 0.02 mm/mm strain amplitude at 1.5
Hz were taken as the high and low loads, respectively. The overall stress response for specimen
S116 under H-L loading is shown in fig. 8a, the stress response for the same specimen subjected
to pulsating tension loading ( R=0 ) without pre-loading at similar strain amplitude and frequency
are shown in fig. 8b and 8c.
29
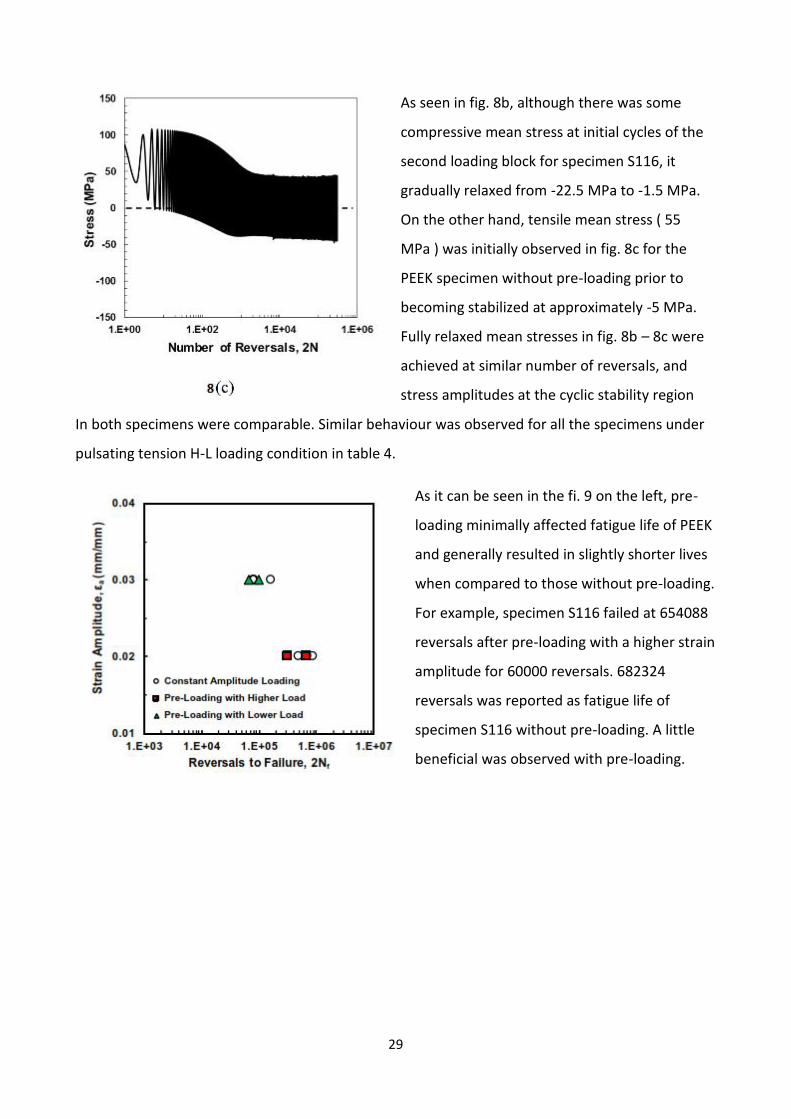
As seen in fig. 8b, although there was some
compressive mean stress at initial cycles of the
second loading block for specimen S116, it
gradually relaxed from -22.5 MPa to -1.5 MPa.
On the other hand, tensile mean stress ( 55
MPa ) was initially observed in fig. 8c for the
PEEK specimen without pre-loading prior to
becoming stabilized at approximately -5 MPa.
Fully relaxed mean stresses in fig. 8b – 8c were
achieved at similar number of reversals, and
stress amplitudes at the cyclic stability region
In both specimens were comparable. Similar behaviour was observed for all the specimens under
pulsating tension H-L loading condition in table 4.
As it can be seen in the fi. 9 on the left, pre-
loading minimally affected fatigue life of PEEK
and generally resulted in slightly shorter lives
when compared to those without pre-loading.
For example, specimen S116 failed at 654088
reversals after pre-loading with a higher strain
amplitude for 60000 reversals. 682324
reversals was reported as fatigue life of
specimen S116 without pre-loading. A little
beneficial was observed with pre-loading.
30
3.3.2.4 Conclusion
A series of uniaxial strain – controlled cyclic tests under various multi – block loading conditions
were performed to investigate the load sequence effects on fatigue behaviour of a PEEK
thermoplastic. The fatigue tests conducted in this study included multi block fully reversed loading
with various frequencies and multi block loading with mean strains. Based on the experimental
results, the following conclusions and recommendations ca be made:
1. In general, PEEK specimen with fully reversed ( R = -1 ) pre-loaded ( with higher or lower
strain amplitude ) did not exhibit the initial stage of cyclic softening. The cyclic stability of
the pre-loaded specimens was achieved at approximately the same reversals as those
without pre-loading under identical test condition. Furthermore, the stress amplitudes at
the cyclic stability region were also comparable. Such cyclic deformation behaviour was
observed for all specimens under two, three or four block loading with R = -1
2. Pre-loading for specimens under fully – reversed conditions ( R=-1 ) was found to have a
significant beneficial effect on PEEK fatigue resistance, irrespective of load sequence ( i.e.
high-low or low-high ).
3. Similar to fatigue tests without pre-loading for higher strain amplitudes ( 0.025 mm/mm ),
increasing the test frequency resulted in longer lives in both low-high and high-low loading
block tests.
4. Load history and sequence minimally affected fatigue behaviour of PEEK under pulsating
tension condition ( R=0 ). Only some slight decreases in fatigue lives of specimens under
block loading ( high-low or low-high ) were observed as compared to those under constant
amplitude loading.
The experimental results in the study revealed a distinctive fatigue behaviour of PEEK under
multi block loading. However, due to the unavailability of published studies in polymer fatigue
involving both upper-length scale non-constant amplitude loading and lower-length scale
micro/nanostructure analysis, the mechanism causing such behaviour are not fully realized.
Therefore, there is a need for further fatigue related multi-scale studies to better understand
the underlying fatigue damage mechanism of polymers. While the present work deals with the
experimental investigation to obtain the effect of load history and sequence on PEEK fatigue
behaviour, the knowledge gained based on this study can be used to develop appropriate

31
cumulative fatigue damage models that are essential for life prediction of polymeric
components under realistic service loadings.
32
3.4 LOW-CYCLE FATIGUE BEHAVIOUR OF POLYAMIDES
REF: D. Serban, L. Marsavina, N. Modler . FFEMS Fatigue & Fracture Engineering Materials &structures
Mechanics and strength of materials dept. , University of Timisoara, Timisoara, Romania.
Kunststofftechnik, Dresden University of Technology, Dresden, Germany.
The material examined is a polyamide-based semi-crystalline thermoplastic polymer. Analysis of
products manufactured from this material, before and after several hours of service, highlighted a
noticeable difference in their mechanical properties. Hence, a study is required to determine the
influence of cyclic-loading induced softening on both material and product behaviour, in order to
underpin a quality improvement through design optimization.
The purpose of these LCF tests are to determination of cyclic softening and investigation of
reversible and irreversible deformation both during and after LCF tests. The spectrum of in service
loading conditions that the material may undergo are shown by in the variation of three test
parameters: number of cycles, frequency and strain.
As studied the polyamide is subjected to loadings below the yield point during service and
considering the mechanics of the deformation, tests were performed in order to quantify the
types of deformations ( instantaneous elasticity, delayed elasticity and permanent deformations )
that occur during LCF and to determine at which point during cyclic deformation the steady-state
material behaviour is reached.
33
3.4.1 Experimental procedure
The tests were performed with a servo-hydraulic testing machine equipped with a 40 KN load cell,
specimens were ISO 527 with cross section of 4x10 mm and 80 mm of length. Two types of tests
were performed: monotonic tensile tests and cyclic tensile tests, both of which were carried out in
strain control. The deformation was recorded with a strain – gauge extensometer with 50 mm
opening. An environmental chamber was equipped and set at 23°C, in order to moderate the
effect of any temperature variation that could be caused by the heating up of the servo – hydraulic
actuator.
Monotonic tensile tests were carried out on specimens in order to determine the initial stress –
strain response, also the same tests were performed on pre – treated specimens ( previously
subjected to LCF ) both immediately after LCF tests ( in order to determine the steady – state
stress – strain response ) and after a period of recovery ( in order to determine the behaviour of
the permanently damaged specimen after viscous strains are recovered ).
Considering that the increase in viscous strain can be accelerated by a number of loading
conditions, in the case of LCF tests, three parameters were varied in order to determine their
influence on the onset of the steady state behaviour: the number of cycles, loading frequency and
strain level. In each test, two parameters remained constant, while the third had three different
values. The tests were divided into five steps of equal number of cycles, and stress – strain
response was recorded after each block.
In order to determine the stress – strain response of the steady state material, monotonic tensile
tests were performed immediately after the LCF tests and after 24 h that the material recovered
its reversible deformation.
34
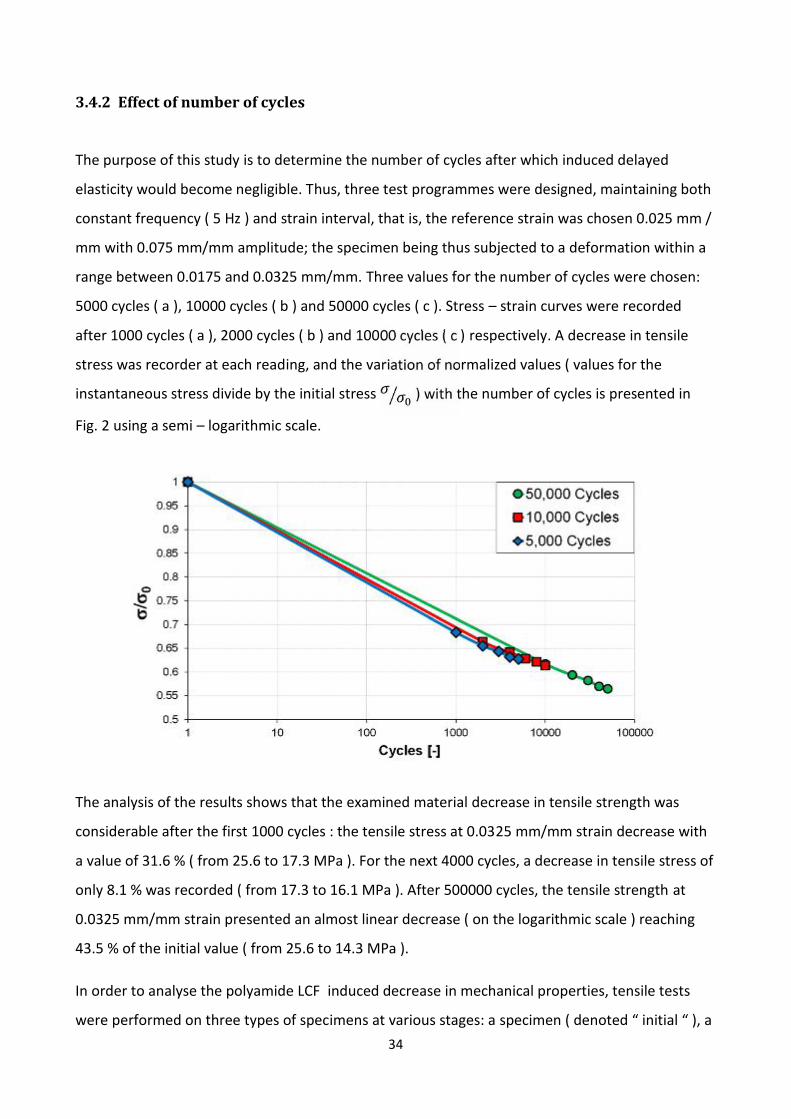
3.4.2 Effect of number of cycles
The purpose of this study is to determine the number of cycles after which induced delayed
elasticity would become negligible. Thus, three test programmes were designed, maintaining both
constant frequency ( 5 Hz ) and strain interval, that is, the reference strain was chosen 0.025 mm /
mm with 0.075 mm/mm amplitude; the specimen being thus subjected to a deformation within a
range between 0.0175 and 0.0325 mm/mm. Three values for the number of cycles were chosen:
5000 cycles ( a ), 10000 cycles ( b ) and 50000 cycles ( c ). Stress – strain curves were recorded
after 1000 cycles ( a ), 2000 cycles ( b ) and 10000 cycles ( c ) respectively. A decrease in tensile
stress was recorder at each reading, and the variation of normalized values ( values for the
instantaneous stress divide by the initial stress ) with the number of cycles is presented in
Fig. 2 using a semi – logarithmic scale.
The analysis of the results shows that the examined material decrease in tensile strength was
considerable after the first 1000 cycles : the tensile stress at 0.0325 mm/mm strain decrease with
a value of 31.6 % ( from 25.6 to 17.3 MPa ). For the next 4000 cycles, a decrease in tensile stress of
only 8.1 % was recorded ( from 17.3 to 16.1 MPa ). After 500000 cycles, the tensile strength at
0.0325 mm/mm strain presented an almost linear decrease ( on the logarithmic scale ) reaching
43.5 % of the initial value ( from 25.6 to 14.3 MPa ).
In order to analyse the polyamide LCF induced decrease in mechanical properties, tensile tests
were performed on three types of specimens at various stages: a specimen ( denoted “ initial “ ), a
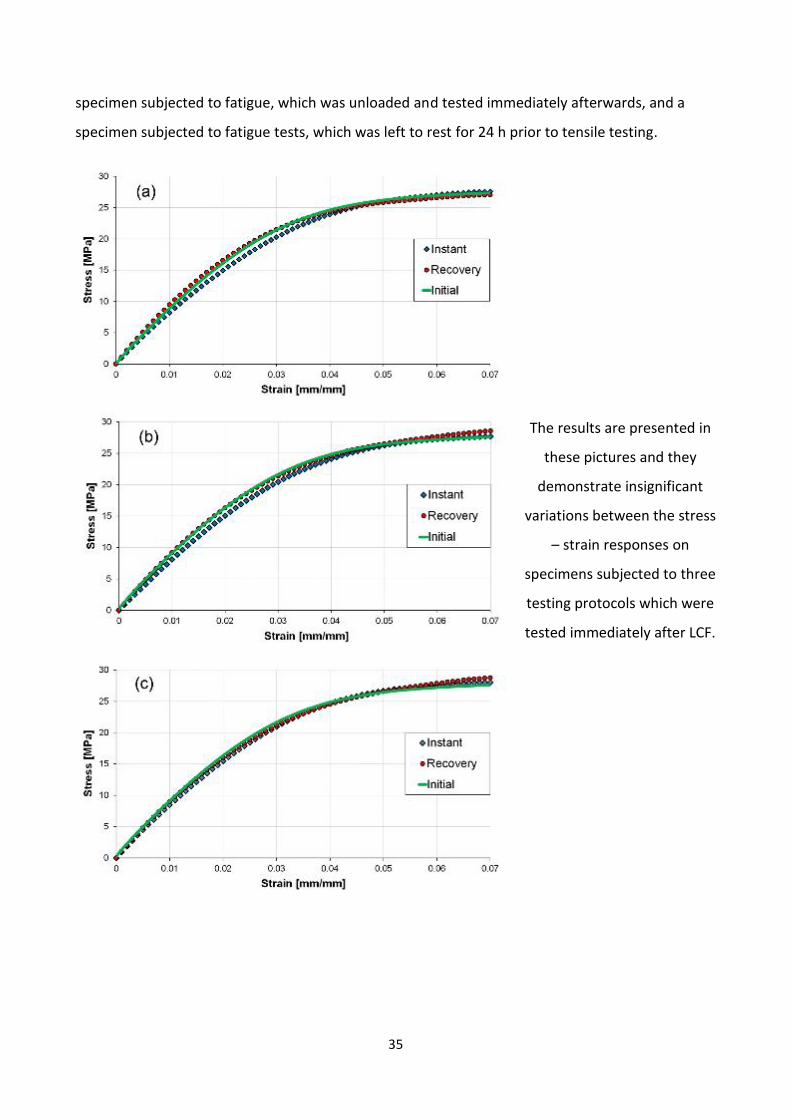
35
specimen subjected to fatigue, which was unloaded and tested immediately afterwards, and a
specimen subjected to fatigue tests, which was left to rest for 24 h prior to tensile testing.
The results are presented in
these pictures and they
demonstrate insignificant
variations between the stress
– strain responses on
specimens subjected to three
testing protocols which were
tested immediately after LCF.
36
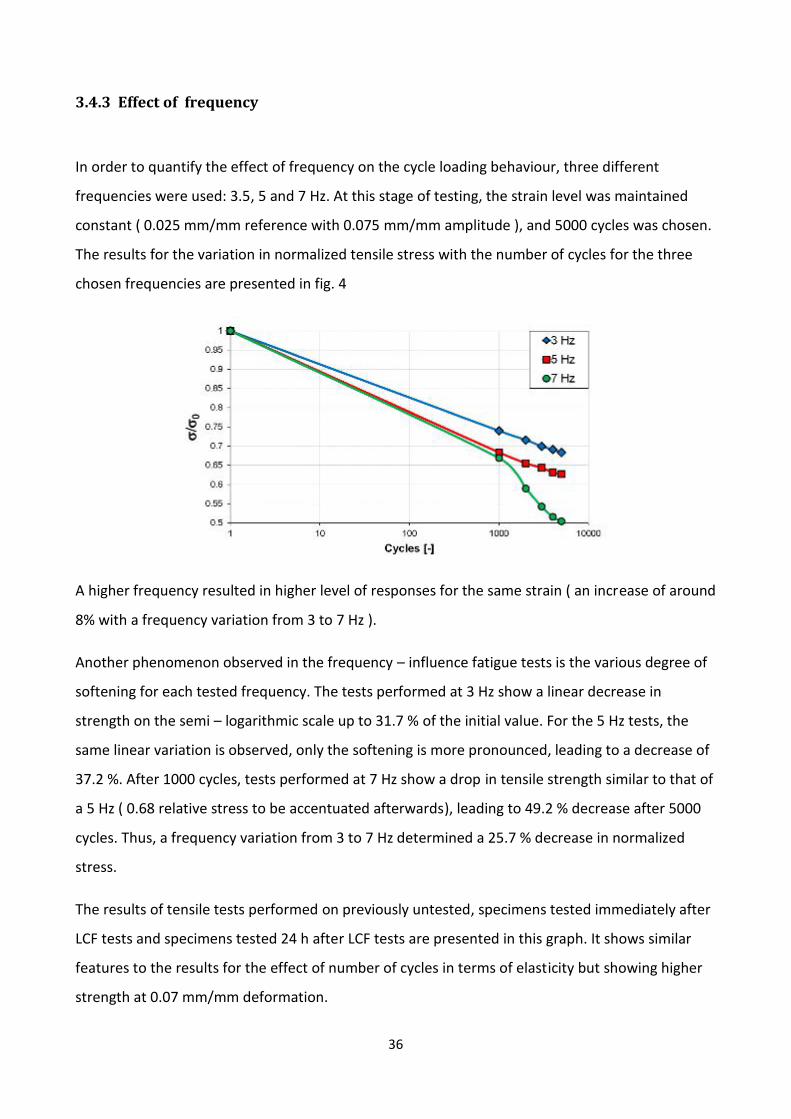
3.4.3 Effect of frequency
In order to quantify the effect of frequency on the cycle loading behaviour, three different
frequencies were used: 3.5, 5 and 7 Hz. At this stage of testing, the strain level was maintained
constant ( 0.025 mm/mm reference with 0.075 mm/mm amplitude ), and 5000 cycles was chosen.
The results for the variation in normalized tensile stress with the number of cycles for the three
chosen frequencies are presented in fig. 4
A higher frequency resulted in higher level of responses for the same strain ( an increase of around
8% with a frequency variation from 3 to 7 Hz ).
Another phenomenon observed in the frequency – influence fatigue tests is the various degree of
softening for each tested frequency. The tests performed at 3 Hz show a linear decrease in
strength on the semi – logarithmic scale up to 31.7 % of the initial value. For the 5 Hz tests, the
same linear variation is observed, only the softening is more pronounced, leading to a decrease of
37.2 %. After 1000 cycles, tests performed at 7 Hz show a drop in tensile strength similar to that of
a 5 Hz ( 0.68 relative stress to be accentuated afterwards), leading to 49.2 % decrease after 5000
cycles. Thus, a frequency variation from 3 to 7 Hz determined a 25.7 % decrease in normalized
stress.
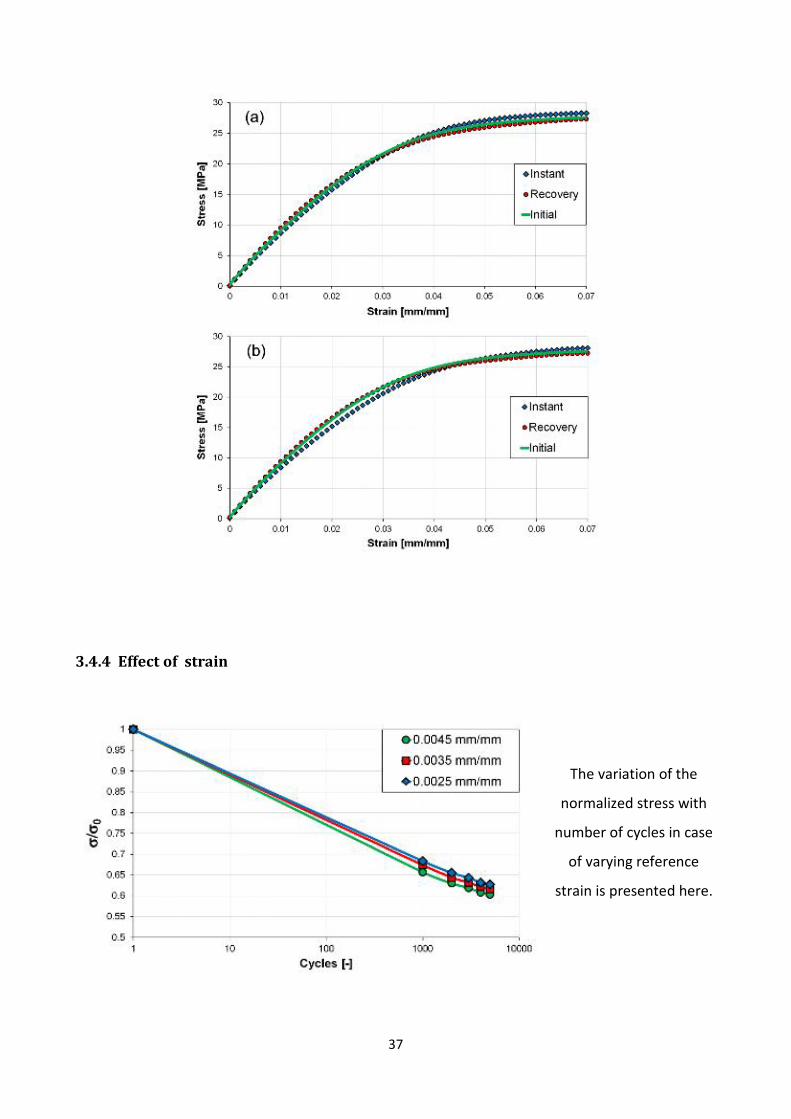
The results of tensile tests performed on previously untested, specimens tested immediately after
LCF tests and specimens tested 24 h after LCF tests are presented in this graph. It shows similar
features to the results for the effect of number of cycles in terms of elasticity but showing higher
strength at 0.07 mm/mm deformation.
37
3.4.4 Effect of strain
The variation of the
normalized stress with
number of cycles in case
of varying reference
strain is presented here.
38
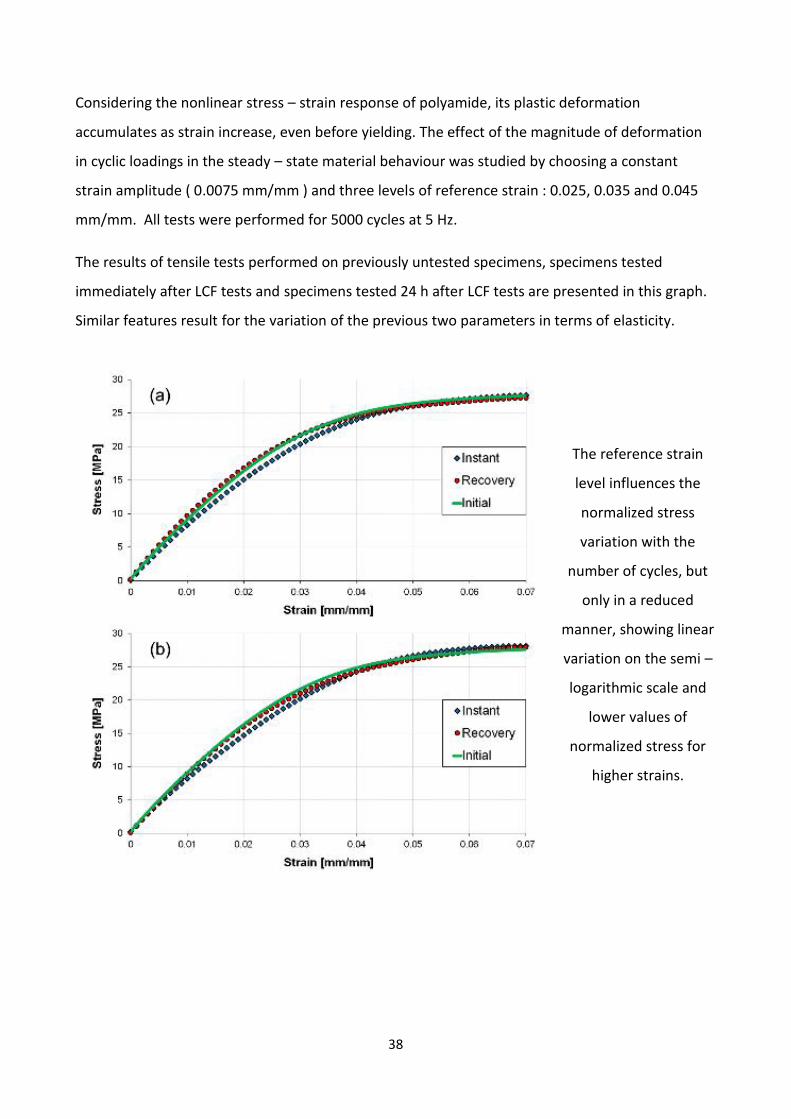
Considering the nonlinear stress – strain response of polyamide, its plastic deformation
accumulates as strain increase, even before yielding. The effect of the magnitude of deformation
in cyclic loadings in the steady – state material behaviour was studied by choosing a constant
strain amplitude ( 0.0075 mm/mm ) and three levels of reference strain : 0.025, 0.035 and 0.045
mm/mm. All tests were performed for 5000 cycles at 5 Hz.
The results of tensile tests performed on previously untested specimens, specimens tested
immediately after LCF tests and specimens tested 24 h after LCF tests are presented in this graph.
Similar features result for the variation of the previous two parameters in terms of elasticity.
The reference strain
level influences the
normalized stress
variation with the
number of cycles, but
only in a reduced
manner, showing linear
variation on the semi –
logarithmic scale and
lower values of
normalized stress for
higher strains.
39
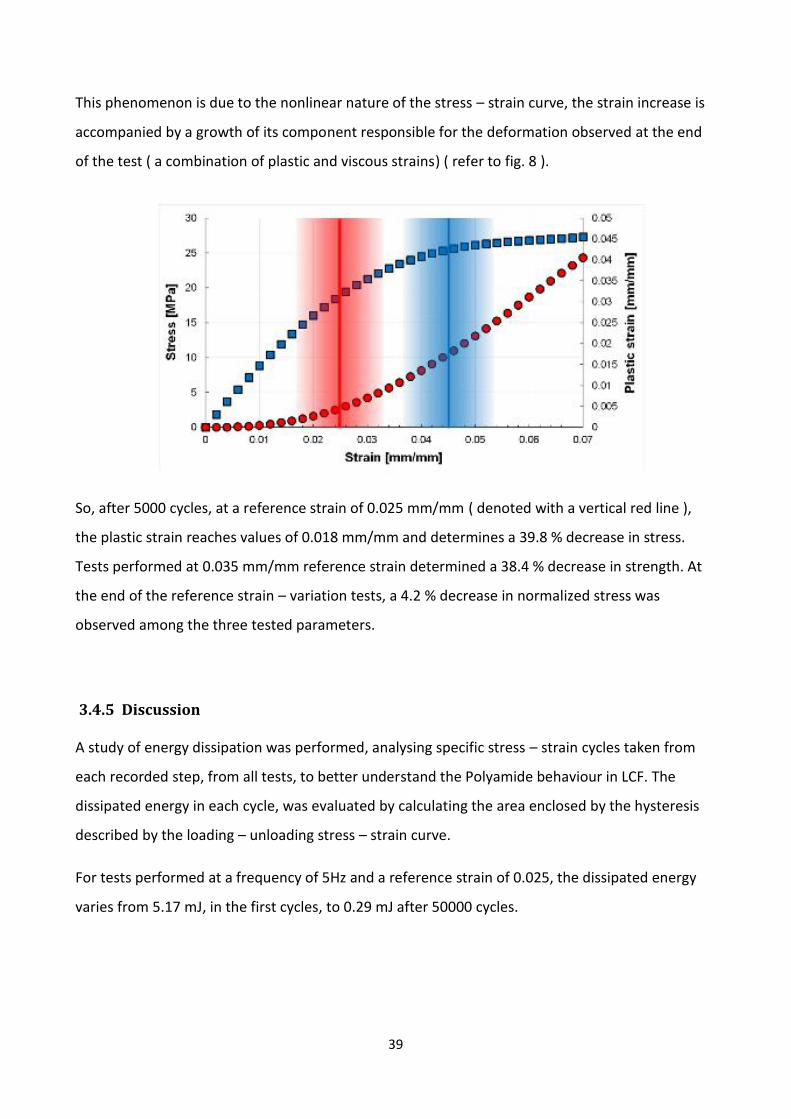
This phenomenon is due to the nonlinear nature of the stress – strain curve, the strain increase is
accompanied by a growth of its component responsible for the deformation observed at the end
of the test ( a combination of plastic and viscous strains) ( refer to fig. 8 ).
So, after 5000 cycles, at a reference strain of 0.025 mm/mm ( denoted with a vertical red line ),
the plastic strain reaches values of 0.018 mm/mm and determines a 39.8 % decrease in stress.
Tests performed at 0.035 mm/mm reference strain determined a 38.4 % decrease in strength. At
the end of the reference strain – variation tests, a 4.2 % decrease in normalized stress was
observed among the three tested parameters.
3.4.5 Discussion
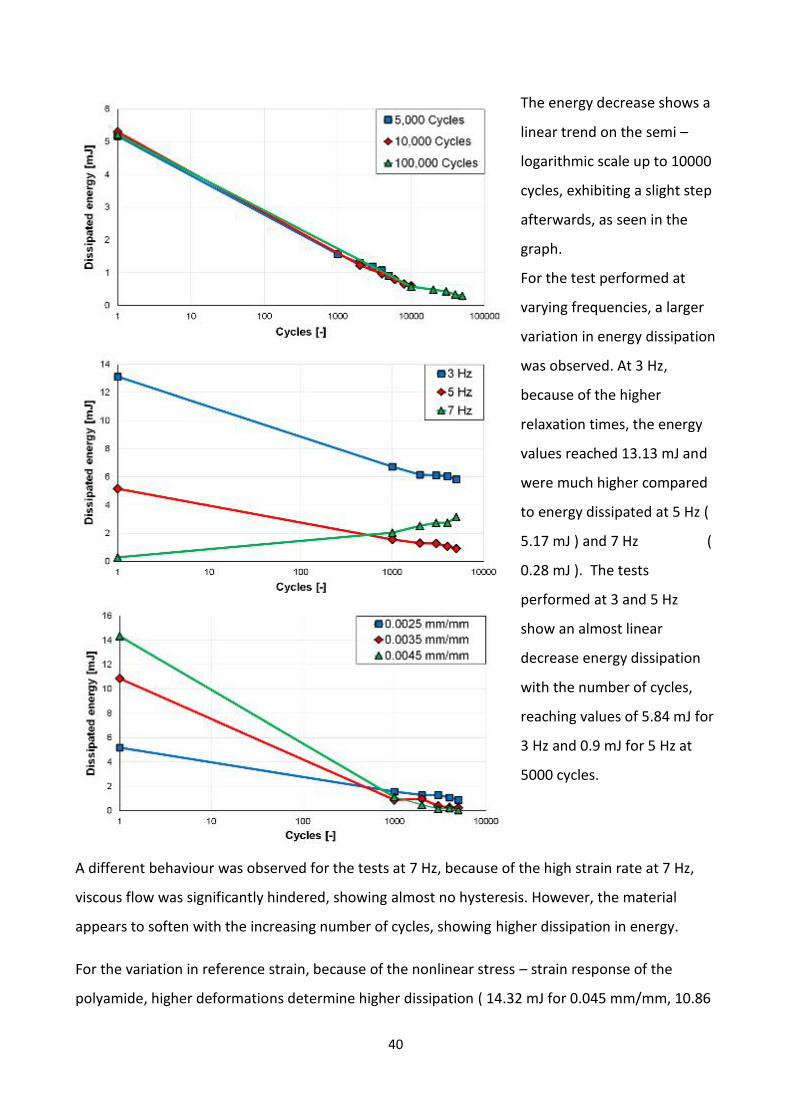
A study of energy dissipation was performed, analysing specific stress – strain cycles taken from
each recorded step, from all tests, to better understand the Polyamide behaviour in LCF. The
dissipated energy in each cycle, was evaluated by calculating the area enclosed by the hysteresis
described by the loading – unloading stress – strain curve.
For tests performed at a frequency of 5Hz and a reference strain of 0.025, the dissipated energy
varies from 5.17 mJ, in the first cycles, to 0.29 mJ after 50000 cycles.
40
The energy decrease shows a
linear trend on the semi –
logarithmic scale up to 10000
cycles, exhibiting a slight step
afterwards, as seen in the
graph.
For the test performed at
varying frequencies, a larger
variation in energy dissipation
was observed. At 3 Hz,
because of the higher
relaxation times, the energy
values reached 13.13 mJ and
were much higher compared
to energy dissipated at 5 Hz (
5.17 mJ ) and 7 Hz (
0.28 mJ ). The tests
performed at 3 and 5 Hz
show an almost linear
decrease energy dissipation
with the number of cycles,
reaching values of 5.84 mJ for
3 Hz and 0.9 mJ for 5 Hz at
5000 cycles.
A different behaviour was observed for the tests at 7 Hz, because of the high strain rate at 7 Hz,
viscous flow was significantly hindered, showing almost no hysteresis. However, the material
appears to soften with the increasing number of cycles, showing higher dissipation in energy.
For the variation in reference strain, because of the nonlinear stress – strain response of the
polyamide, higher deformations determine higher dissipation ( 14.32 mJ for 0.045 mm/mm, 10.86
41
mJ for 0.035 mm/mm and 5.17 mJ for 0.025 mm/mm ). Despite the large difference in recorded
values, after 1000 cycles the values for all tests reached similar values ( between 0.88 and 1.56 mJ
), the same trend is maintained until 5000 cycles have been reached, only in reversed order of
magnitude ( 0.04 mJ for 0.045 mm/mm, 0.23 mJ for 0.034 mm/mm and 0.9 mJ for 0.025 mm/mm
). Tests at 0.045 mm/mm showed almost no energy dissipation after 5000 cycles, a phenomenon
that can be associated with the accumulation of permanent deformation because of strain closer
to the yield point.
Regardless of the variation of the test parameters within the experimental program, the
polyamide has a similar behaviour in tension: in comparison with the stress – strain curve of the
previously untested specimen, the stress – strain curve of the specimen tested immediately after
the LCF test shows slightly lower stress values between 0.01 and 0.04 mm/mm deformation but
determines almost identical yield stresses and strains ( 27 MPa at around 0.07 mm/mm at
crosshead travel speed of 20 mm/min). The tensile stress – strain curve of the specimens
subjected to a 24 h recovery demonstrates insignificant differences when compared to the curves
of previously untested specimens.
Analysing the acquired data from the tensile tests that followed immediately LCF tests, it was
observed that when unloading to 0 N, a residual deformation was recorded, ranging from 0.013 to
0.02 mm/mm, depending on the test parameters.
Considering that tensile response of a fatigue specimen is almost identical to that of a previously
untested specimen, it can be concluded that softening determined by fatigue at deformations
below the yield point is responsible for inducing a temporary residual deformation without
affecting material properties in a noticeable manner ( delayed elasticity opposed to permanent
deformations ).
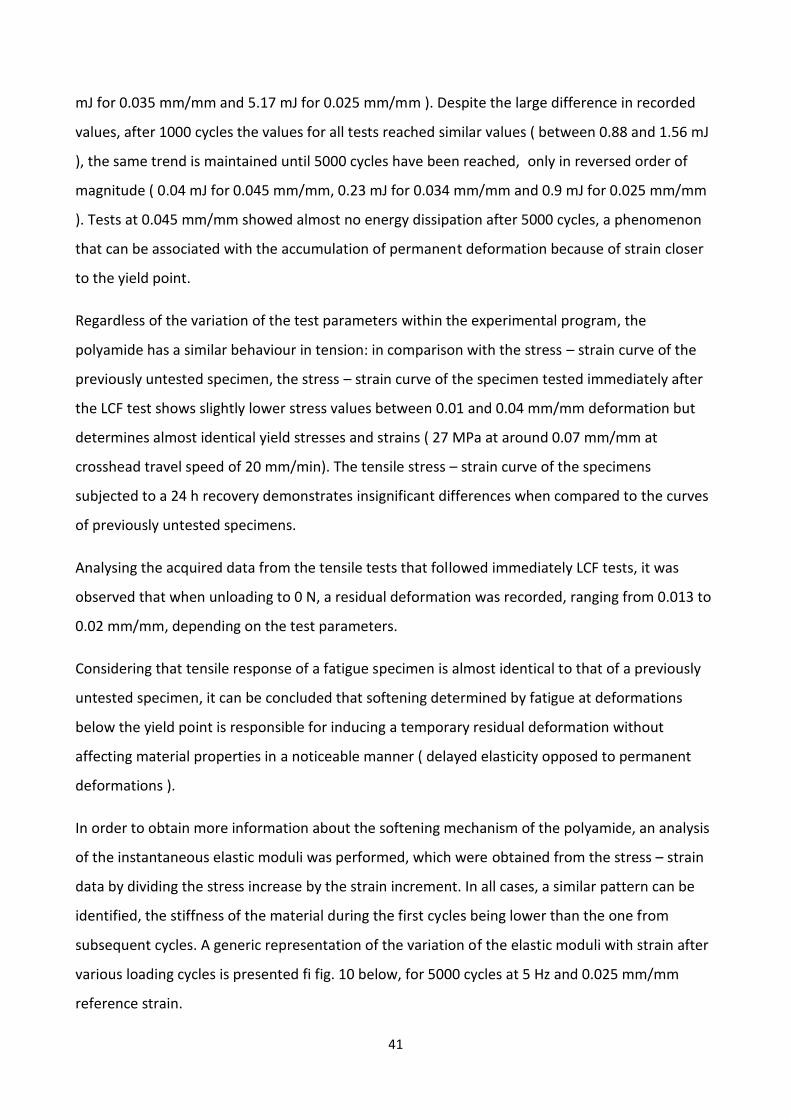
In order to obtain more information about the softening mechanism of the polyamide, an analysis
of the instantaneous elastic moduli was performed, which were obtained from the stress – strain
data by dividing the stress increase by the strain increment. In all cases, a similar pattern can be
identified, the stiffness of the material during the first cycles being lower than the one from
subsequent cycles. A generic representation of the variation of the elastic moduli with strain after
various loading cycles is presented fi fig. 10 below, for 5000 cycles at 5 Hz and 0.025 mm/mm
reference strain.
42
To explain this phenomenon, we need to further analyse the correlation between the stiffness and
strength of the material for the same extensometer opening ( LCF tests being performed in strain
control ).
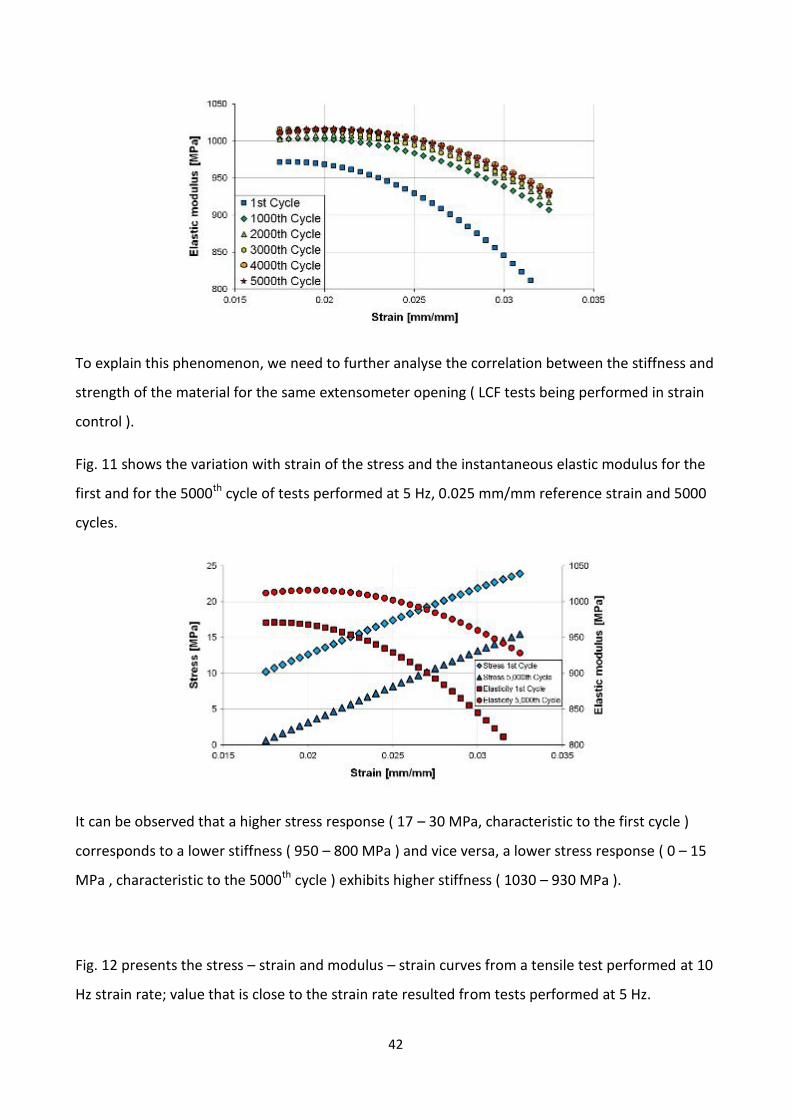
Fig. 11 shows the variation with strain of the stress and the instantaneous elastic modulus for the
first and for the 5000th cycle of tests performed at 5 Hz, 0.025 mm/mm reference strain and 5000
cycles.
It can be observed that a higher stress response ( 17 – 30 MPa, characteristic to the first cycle )
corresponds to a lower stiffness ( 950 – 800 MPa ) and vice versa, a lower stress response ( 0 – 15
MPa , characteristic to the 5000th cycle ) exhibits higher stiffness ( 1030 – 930 MPa ).
Fig. 12 presents the stress – strain and modulus – strain curves from a tensile test performed at 10
Hz strain rate; value that is close to the strain rate resulted from tests performed at 5 Hz.
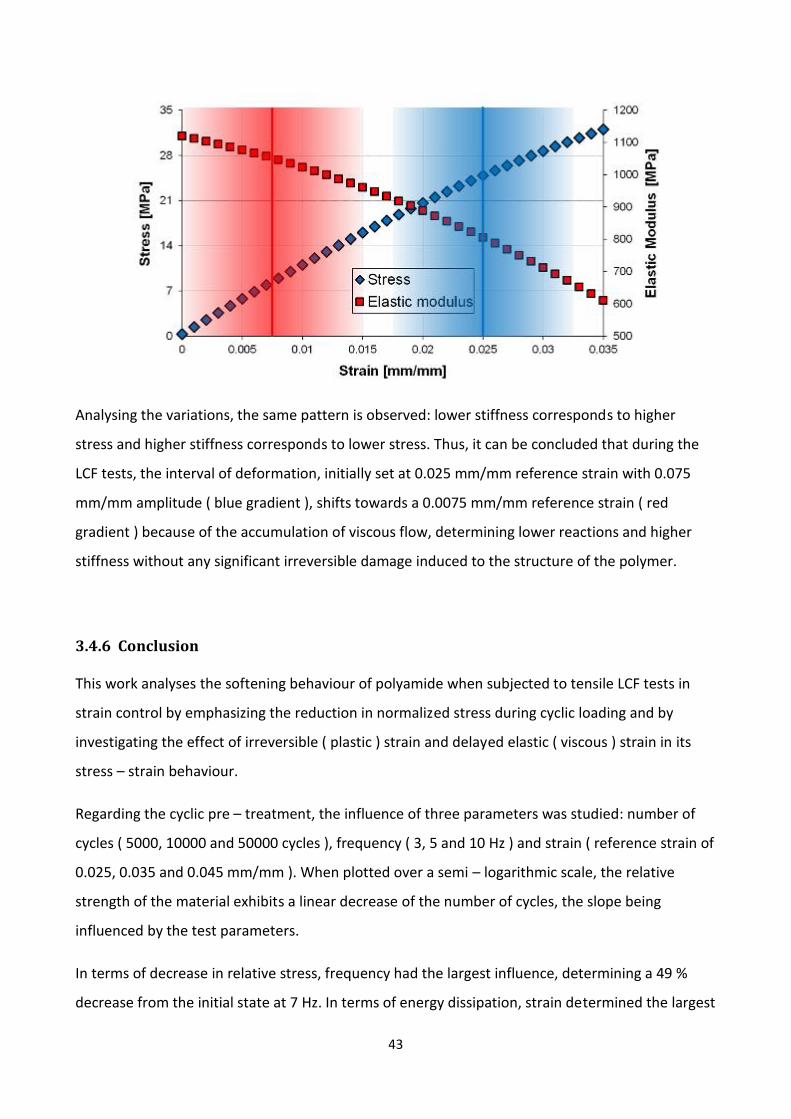
43
Analysing the variations, the same pattern is observed: lower stiffness corresponds to higher
stress and higher stiffness corresponds to lower stress. Thus, it can be concluded that during the
LCF tests, the interval of deformation, initially set at 0.025 mm/mm reference strain with 0.075
mm/mm amplitude ( blue gradient ), shifts towards a 0.0075 mm/mm reference strain ( red
gradient ) because of the accumulation of viscous flow, determining lower reactions and higher
stiffness without any significant irreversible damage induced to the structure of the polymer.
3.4.6 Conclusion
This work analyses the softening behaviour of polyamide when subjected to tensile LCF tests in
strain control by emphasizing the reduction in normalized stress during cyclic loading and by
investigating the effect of irreversible ( plastic ) strain and delayed elastic ( viscous ) strain in its
stress – strain behaviour.
Regarding the cyclic pre – treatment, the influence of three parameters was studied: number of
cycles ( 5000, 10000 and 50000 cycles ), frequency ( 3, 5 and 10 Hz ) and strain ( reference strain of
0.025, 0.035 and 0.045 mm/mm ). When plotted over a semi – logarithmic scale, the relative
strength of the material exhibits a linear decrease of the number of cycles, the slope being
influenced by the test parameters.
In terms of decrease in relative stress, frequency had the largest influence, determining a 49 %
decrease from the initial state at 7 Hz. In terms of energy dissipation, strain determined the largest
44
value, 14 mJ corresponding to a reference strain of 0.0045 during the first cycles of deformation.
The tests performed at 3 and 7 Hz showed higher values of dissipated energy through each cycle (
around 8 and 3 mJ, respectively ) compared to the rest of the tests ( under 2 mJ for each other
parameter variation ).
Analysis of the stiffness and strength of the polyamide throughout the tests showed that LCF
loadings before the yield point of the material are shown no significant permanent damage to the
structure ( for the parameter variation described in this study ), the apparent softening of the
material being caused by the accumulation of viscous deformation with each cycle.
45
3.5 MULTIAXIAL FATIGUE CRITERION FOR A HIGH – DENSITYPOLYETHYLENE THERMOPLASTIC
REF: A. Berrehili, S. Castagnet, Y. Nadot. FFEMS Fatigue & Fracture Engineering Materials &structures
UMR CNRS – ENSMA University of Poitiers, France
The use of polymers for structural applications has aroused great interest in the assessment of
their mechanical behaviour over a wide range of solicitations, among which fatigue loading. The
majority of studies have been centred on the characterization of fatigue crack propagation in
association with the influence of some microstructure parameters such as the crystallinity ratio,
the molecular mass, the entanglement density or the molecule concentration.
The influence of some loading parameters on the crack propagation has been also considered:
frequency, overload and temperature, especially close to the transition temperature of the
material.
Fatigue tests have been mainly conducted in a uniaxial framework, under stress or strain
controlled, sinusoidal tension or tension – compression waveforms. The loading R – ratio was
shown to influence the crack propagation resistance; the compression – compression loadings
have been also reported to be detrimental to the fatigue crack resistance. Only a few study have
been performed in a biaxial or flexural loading mode.
So far, there are only a few studies on the multiaxial endurance fatigue behaviour of semi –
crystalline thermoplastics.
The two main goals of this work are to highlight the end – of – life definition in samples failing by
instability, and to propose a multiaxial endurance fatigue criterion for an un – cracked semi –
crystalline polymer. The endurance fatigue behaviour of a widely – used high – density
polyethylene ( HDPE ) is addressed under tensile, compressive and torsion loadings at different R –
ratio and constant frequency.
46
3.5.1 Experimental
3.5.1.1 Material
Experiment were performed in HDPE provided by Ineos in the form of 50 mm external diameter
and 3.2 mm thick extruded pipes. Standard Differential Scanning Calorimetry ( DSC ) experiments
showed a crystallinity ratio of 55 % , a glass transition temperature at – 120°C and melting
temperature at 130°C.
The shape was selected to perform all multiaxial tests on identical samples and thus to avoid
microstructure differences enhanced by the process in case of variable geometry. A preferential
macromolecular orientation is usually enhanced by extrusion process. Consequences on
mechanical anisotropy were not quantified here but related to unpublished studies would suggest
that this anisotropy effect is weak in considered process conditions.
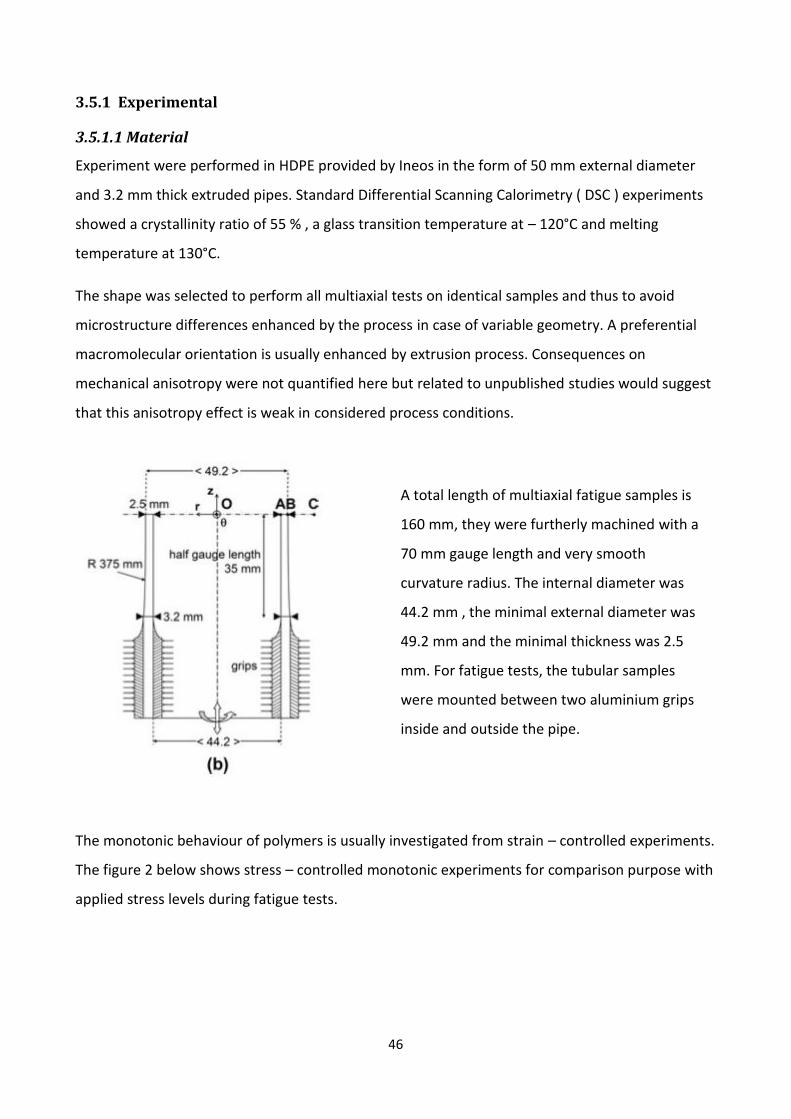
A total length of multiaxial fatigue samples is
160 mm, they were furtherly machined with a
70 mm gauge length and very smooth
curvature radius. The internal diameter was
44.2 mm , the minimal external diameter was
49.2 mm and the minimal thickness was 2.5
mm. For fatigue tests, the tubular samples
were mounted between two aluminium grips
inside and outside the pipe.
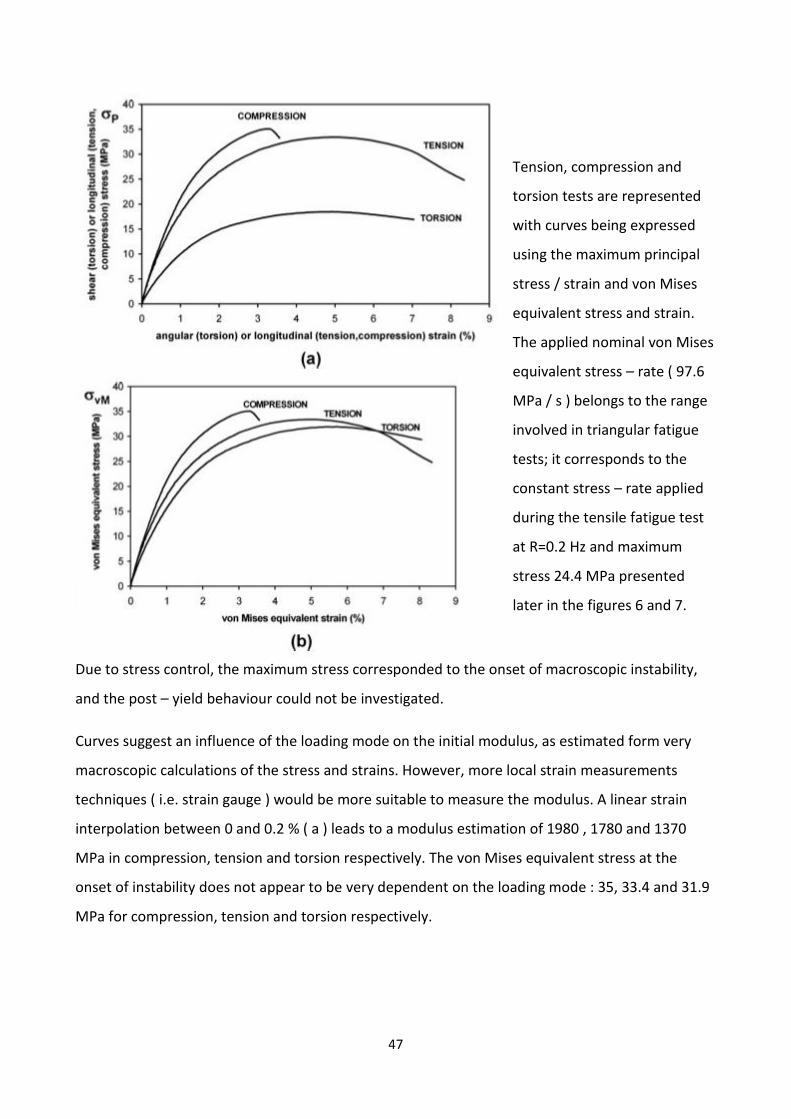
The monotonic behaviour of polymers is usually investigated from strain – controlled experiments.
The figure 2 below shows stress – controlled monotonic experiments for comparison purpose with
applied stress levels during fatigue tests.
47
Tension, compression and
torsion tests are represented
with curves being expressed
using the maximum principal
stress / strain and von Mises
equivalent stress and strain.
The applied nominal von Mises
equivalent stress – rate ( 97.6
MPa / s ) belongs to the range
involved in triangular fatigue
tests; it corresponds to the
constant stress – rate applied
during the tensile fatigue test
at R=0.2 Hz and maximum
stress 24.4 MPa presented
later in the figures 6 and 7.
Due to stress control, the maximum stress corresponded to the onset of macroscopic instability,
and the post – yield behaviour could not be investigated.
Curves suggest an influence of the loading mode on the initial modulus, as estimated form very
macroscopic calculations of the stress and strains. However, more local strain measurements
techniques ( i.e. strain gauge ) would be more suitable to measure the modulus. A linear strain
interpolation between 0 and 0.2 % ( a ) leads to a modulus estimation of 1980 , 1780 and 1370
MPa in compression, tension and torsion respectively. The von Mises equivalent stress at the
onset of instability does not appear to be very dependent on the loading mode : 35, 33.4 and 31.9
MPa for compression, tension and torsion respectively.
48
3.5.1.2 Multiaxial fatigue tests
All multiaxial fatigue tests were performed at room temperature on a servo – hydraulic biaxial
testing machine. Force controlled tests were conducted in tension, compression and torsion, using
a triangular wave function. This wave form has been chosen to keep a constant stress – rate all
along for the test; the frequency was set at 2 Hz for most tests and 1 Hz for a few additional ones
to reduce the possibility of self – heating and thermal failure.
Fatigue tests were performed by placing the grips and sample within a controlled chamber, where
the same cooled air flux circulates inside and around the pipe. The goals of this device were to
ensure reproducible air temperature, to reduce the temperature gradients between the inner and
outer surfaces of the pipe and to minimize self – heating by increasing the heat exchanges
between the pipe wall and the air. The sample was allowed to equilibrate at the air flux
temperature before being tested, so that both inner and outer surface are at the same
temperature. The initial ambient temperature was 18.8 °C.
The tension / compression and torsion stresses ( and = , respectively ) and strains (
and , respectively ) were calculated in the minimal section of the pipe, in a thin – walled
pipe assumption framework i.e. at the median radius of the pipe wall. Since the diameter
reduction could not be accessed during the test, only the longitudinal nominal stress in the
minimal diameter section was considered and calculated from Eq.1. In the same way, applied
stress – rates were nominal one. In polar coordinates, , , , ( z being the axial
component and ϴ the twist angle ) were calculated by the following equations:
1) =2) = = 2 (( ) ( ) )3) = 1 + ∆4) = = ∆ ∙(∆ )where , and are the exterior, interior and median radius of the pipe in the
minimum diameter cross – section respectively. Index o refers to the initial state.
49
For evaluation of multiaxial loading, von Mises stress ( vM index ) and maximum Principal
stress ( P index ) are discussed. In case of tension loading = = ; in case of torsion
loading = √3 and = .
During 4 cycles every 20 cycles, experimental data were stored at a frequency 20 times higher
than the test frequency, in order to track the evolution of strains and modulus along the
fatigue test. After conversion into a von Mises equivalent stress for comparison with the
monotonic loading tests ( fig.2 ), the maximum fatigue stress , applied within the fatigue
domain, ranged from 60 to 67 % of the maximum von Mises stress recorded in monotonic
compression, between 64 and 70 % in tension and between 67 and 74% in torsion. The stress
amplitude was defined as a difference between the maximum and the mean stresses. The
stress ratio R ( defined as the minimum stress divided by the maximum stress over the fatigue
cycle ) was 0 or -1. In the following, fatigue tests performed at R=0 or R=-∞ will be called
“pulsating“ tests in tension and compression, respectively, and those carried out at R=-1 are
actually a tension / compression loading mode. In the following, the index a, max and mean will
always refer to the amplitude, maximum and mean value of the considered variable,
respectively.
50
3.5.2 Results
3.5.2.1 Definition of an end – of – life criterion
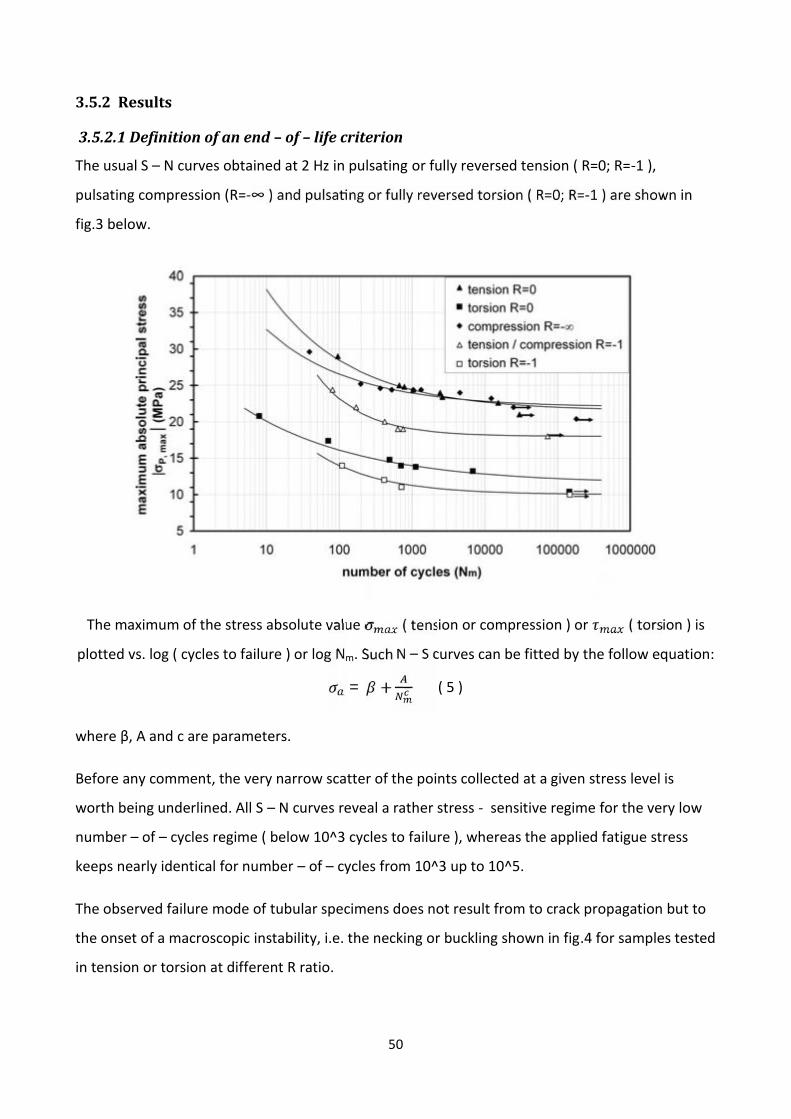
The usual S – N curves obtained at 2 Hz in pulsating or fully reversed tension ( R=0; R=-1 ),
pulsating compression (R=- -1 ) are shown in
fig.3 below.
The maximum of the stress absolute value ( tension or compression ) or ( torsion ) is
plotted vs. log ( cycles to failure ) or log Nm. Such N – S curves can be fitted by the follow equation:= + ( 5 )
where β, A and c are parameters.
Before any comment, the very narrow scatter of the points collected at a given stress level is
worth being underlined. All S – N curves reveal a rather stress - sensitive regime for the very low
number – of – cycles regime ( below 10^3 cycles to failure ), whereas the applied fatigue stress
keeps nearly identical for number – of – cycles from 10^3 up to 10^5.
The observed failure mode of tubular specimens does not result from to crack propagation but to
the onset of a macroscopic instability, i.e. the necking or buckling shown in fig.4 for samples tested
in tension or torsion at different R ratio.
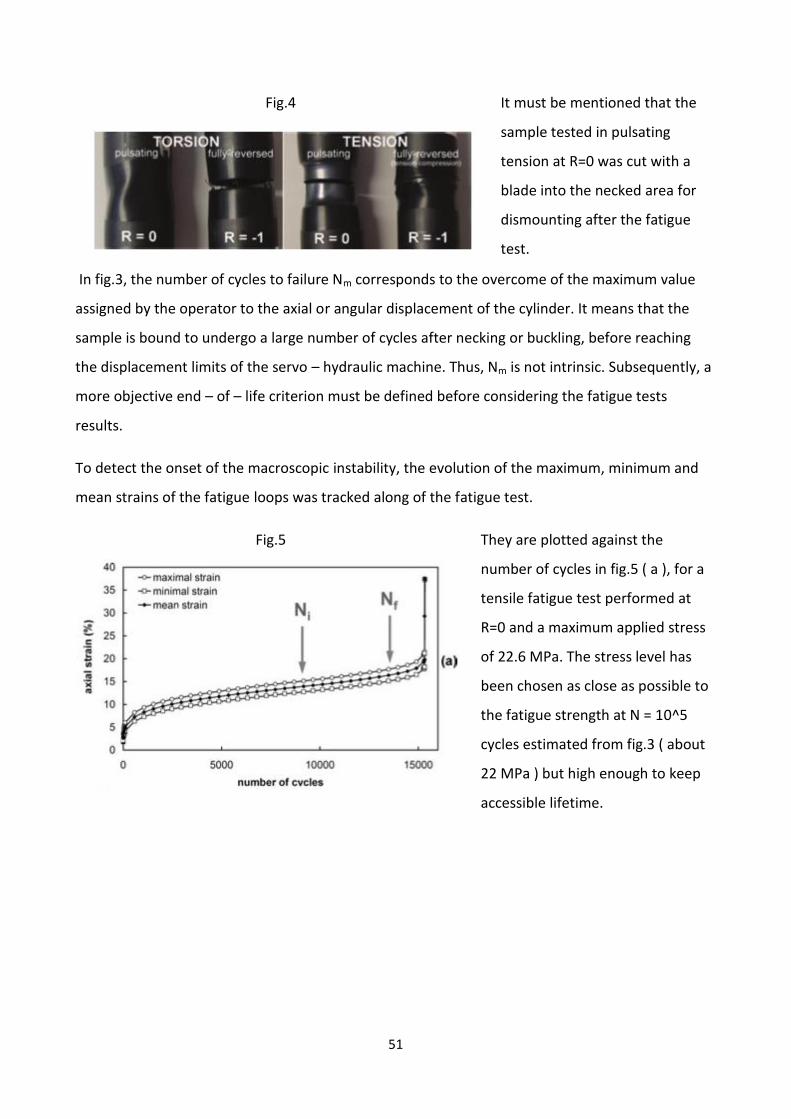
51
Fig.4 It must be mentioned that the
sample tested in pulsating
tension at R=0 was cut with a
blade into the necked area for
dismounting after the fatigue
test.
In fig.3, the number of cycles to failure Nm corresponds to the overcome of the maximum value
assigned by the operator to the axial or angular displacement of the cylinder. It means that the
sample is bound to undergo a large number of cycles after necking or buckling, before reaching
the displacement limits of the servo – hydraulic machine. Thus, Nm is not intrinsic. Subsequently, a
more objective end – of – life criterion must be defined before considering the fatigue tests
results.
To detect the onset of the macroscopic instability, the evolution of the maximum, minimum and
mean strains of the fatigue loops was tracked along of the fatigue test.
Fig.5 They are plotted against the
number of cycles in fig.5 ( a ), for a
tensile fatigue test performed at
R=0 and a maximum applied stress
of 22.6 MPa. The stress level has
been chosen as close as possible to
the fatigue strength at N = 10^5
cycles estimated from fig.3 ( about
22 MPa ) but high enough to keep
accessible lifetime.
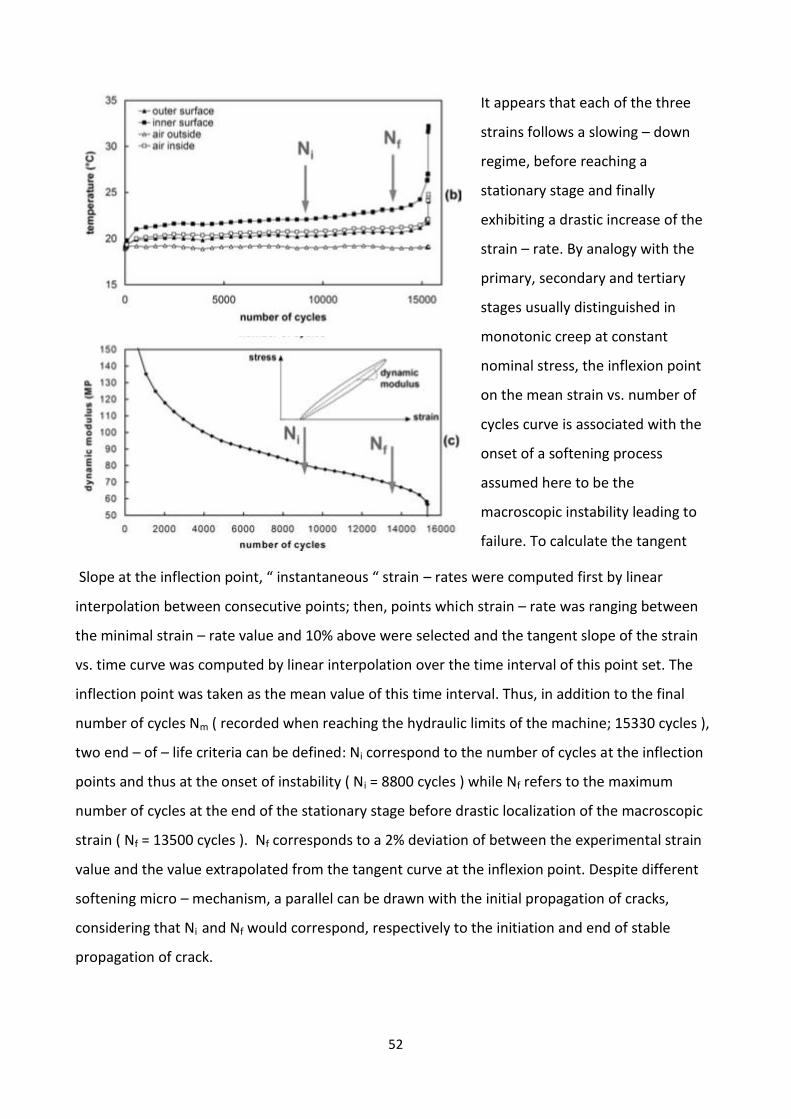
52
It appears that each of the three
strains follows a slowing – down
regime, before reaching a
stationary stage and finally
exhibiting a drastic increase of the
strain – rate. By analogy with the
primary, secondary and tertiary
stages usually distinguished in
monotonic creep at constant
nominal stress, the inflexion point
on the mean strain vs. number of
cycles curve is associated with the
onset of a softening process
assumed here to be the
macroscopic instability leading to
failure. To calculate the tangent
Slope at the inflection point, “ instantaneous “ strain – rates were computed first by linear
interpolation between consecutive points; then, points which strain – rate was ranging between
the minimal strain – rate value and 10% above were selected and the tangent slope of the strain
vs. time curve was computed by linear interpolation over the time interval of this point set. The
inflection point was taken as the mean value of this time interval. Thus, in addition to the final
number of cycles Nm ( recorded when reaching the hydraulic limits of the machine; 15330 cycles ),
two end – of – life criteria can be defined: Ni correspond to the number of cycles at the inflection
points and thus at the onset of instability ( Ni = 8800 cycles ) while Nf refers to the maximum
number of cycles at the end of the stationary stage before drastic localization of the macroscopic
strain ( Nf = 13500 cycles ). Nf corresponds to a 2% deviation of between the experimental strain
value and the value extrapolated from the tangent curve at the inflexion point. Despite different
softening micro – mechanism, a parallel can be drawn with the initial propagation of cracks,
considering that Ni and Nf would correspond, respectively to the initiation and end of stable
propagation of crack.
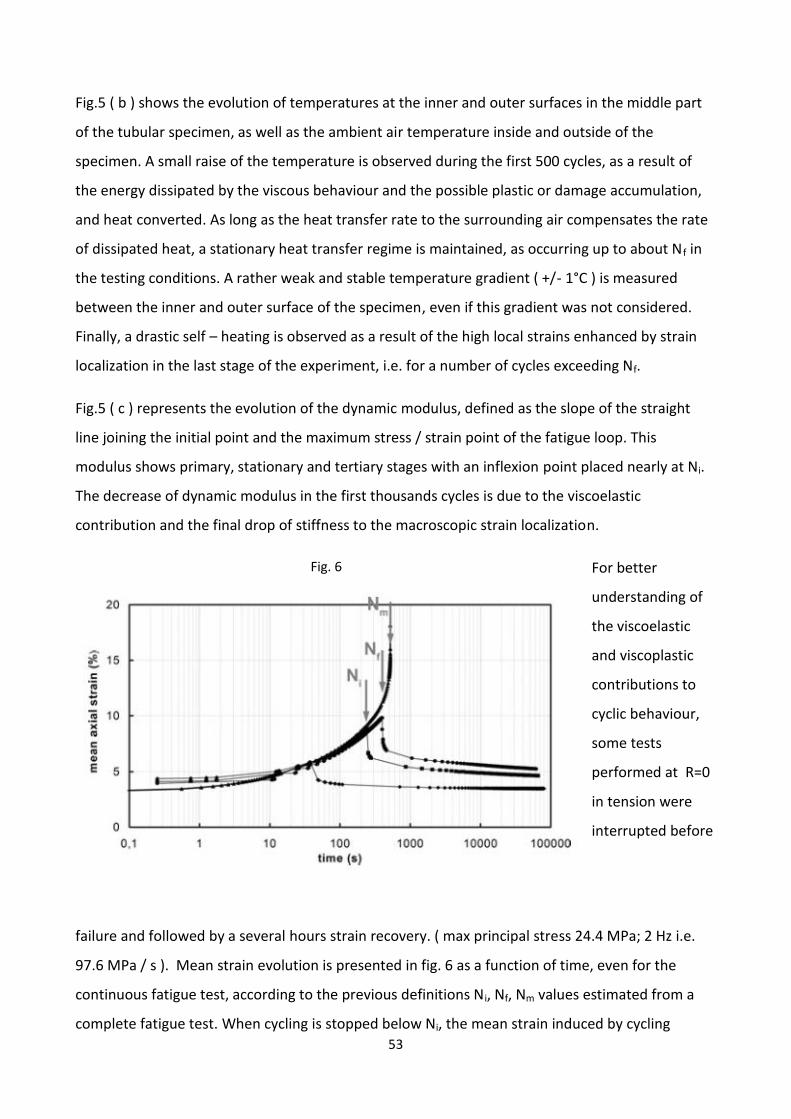
53
Fig.5 ( b ) shows the evolution of temperatures at the inner and outer surfaces in the middle part
of the tubular specimen, as well as the ambient air temperature inside and outside of the
specimen. A small raise of the temperature is observed during the first 500 cycles, as a result of
the energy dissipated by the viscous behaviour and the possible plastic or damage accumulation,
and heat converted. As long as the heat transfer rate to the surrounding air compensates the rate
of dissipated heat, a stationary heat transfer regime is maintained, as occurring up to about N f in
the testing conditions. A rather weak and stable temperature gradient ( +/- 1°C ) is measured
between the inner and outer surface of the specimen, even if this gradient was not considered.
Finally, a drastic self – heating is observed as a result of the high local strains enhanced by strain
localization in the last stage of the experiment, i.e. for a number of cycles exceeding Nf.
Fig.5 ( c ) represents the evolution of the dynamic modulus, defined as the slope of the straight
line joining the initial point and the maximum stress / strain point of the fatigue loop. This
modulus shows primary, stationary and tertiary stages with an inflexion point placed nearly at Ni.
The decrease of dynamic modulus in the first thousands cycles is due to the viscoelastic
contribution and the final drop of stiffness to the macroscopic strain localization.
Fig. 6 For better
understanding of
the viscoelastic
and viscoplastic
contributions to
cyclic behaviour,
some tests
performed at R=0
in tension were
interrupted before
failure and followed by a several hours strain recovery. ( max principal stress 24.4 MPa; 2 Hz i.e.
97.6 MPa / s ). Mean strain evolution is presented in fig. 6 as a function of time, even for the
continuous fatigue test, according to the previous definitions Ni, Nf, Nm values estimated from a
complete fatigue test. When cycling is stopped below Ni, the mean strain induced by cycling
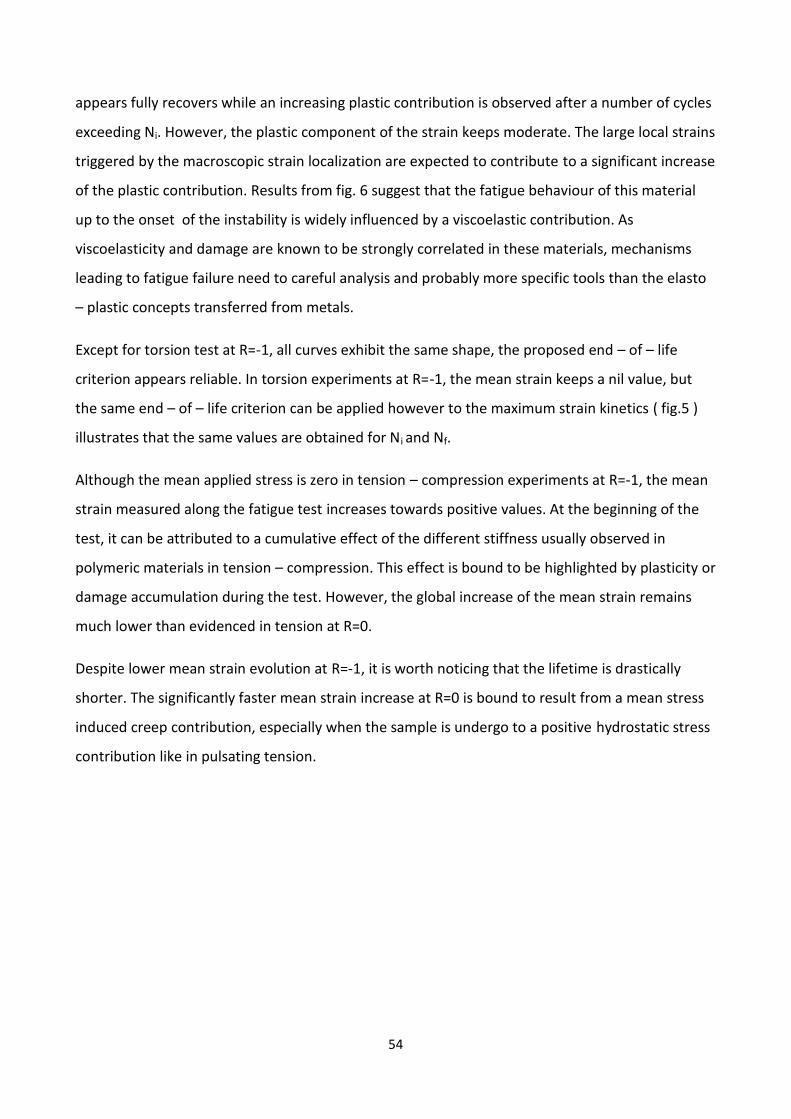
54
appears fully recovers while an increasing plastic contribution is observed after a number of cycles
exceeding Ni. However, the plastic component of the strain keeps moderate. The large local strains
triggered by the macroscopic strain localization are expected to contribute to a significant increase
of the plastic contribution. Results from fig. 6 suggest that the fatigue behaviour of this material
up to the onset of the instability is widely influenced by a viscoelastic contribution. As
viscoelasticity and damage are known to be strongly correlated in these materials, mechanisms
leading to fatigue failure need to careful analysis and probably more specific tools than the elasto
– plastic concepts transferred from metals.
Except for torsion test at R=-1, all curves exhibit the same shape, the proposed end – of – life
criterion appears reliable. In torsion experiments at R=-1, the mean strain keeps a nil value, but
the same end – of – life criterion can be applied however to the maximum strain kinetics ( fig.5 )
illustrates that the same values are obtained for Ni and Nf.
Although the mean applied stress is zero in tension – compression experiments at R=-1, the mean
strain measured along the fatigue test increases towards positive values. At the beginning of the
test, it can be attributed to a cumulative effect of the different stiffness usually observed in
polymeric materials in tension – compression. This effect is bound to be highlighted by plasticity or
damage accumulation during the test. However, the global increase of the mean strain remains
much lower than evidenced in tension at R=0.
Despite lower mean strain evolution at R=-1, it is worth noticing that the lifetime is drastically
shorter. The significantly faster mean strain increase at R=0 is bound to result from a mean stress
induced creep contribution, especially when the sample is undergo to a positive hydrostatic stress
contribution like in pulsating tension.
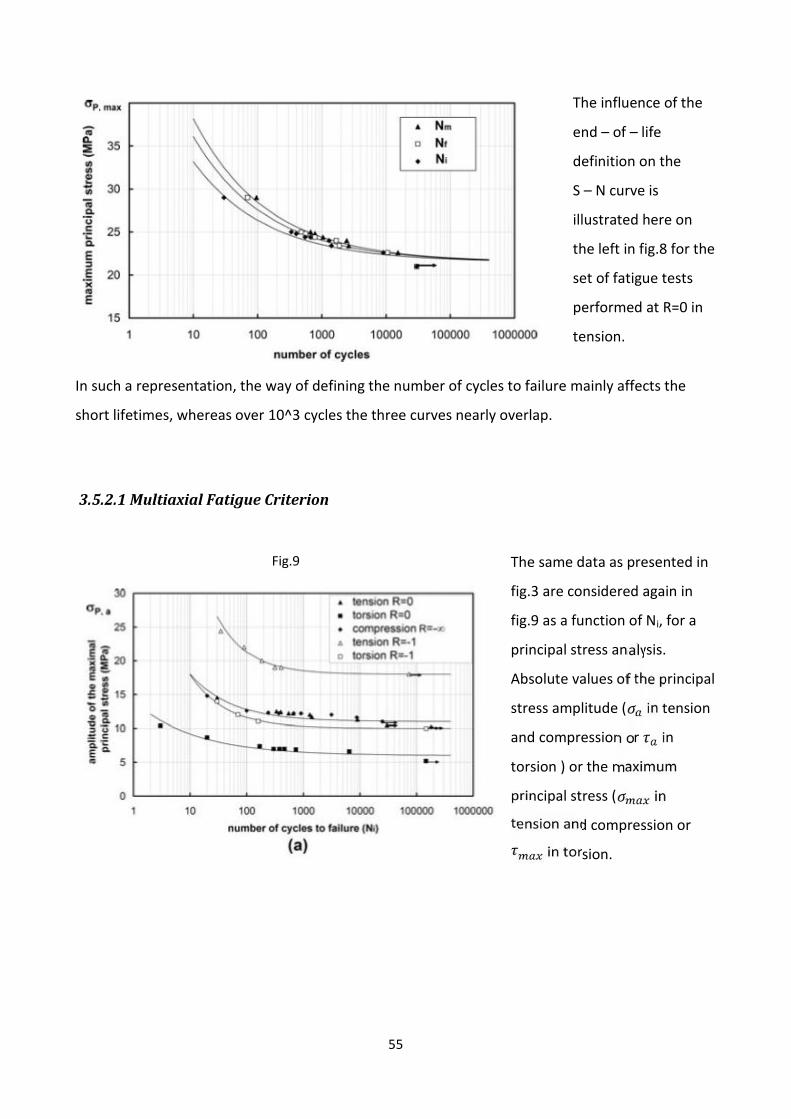
55
The influence of the
end – of – life
definition on the
S – N curve is
illustrated here on
the left in fig.8 for the
set of fatigue tests
performed at R=0 in
tension.
In such a representation, the way of defining the number of cycles to failure mainly affects the
short lifetimes, whereas over 10^3 cycles the three curves nearly overlap.
3.5.2.1 Multiaxial Fatigue Criterion
Fig.9 The same data as presented in
fig.3 are considered again in
fig.9 as a function of Ni, for a
principal stress analysis.
Absolute values of the principal
stress amplitude ( in tension
and compression or in
torsion ) or the maximum
principal stress ( in
tension and compression or
in torsion.
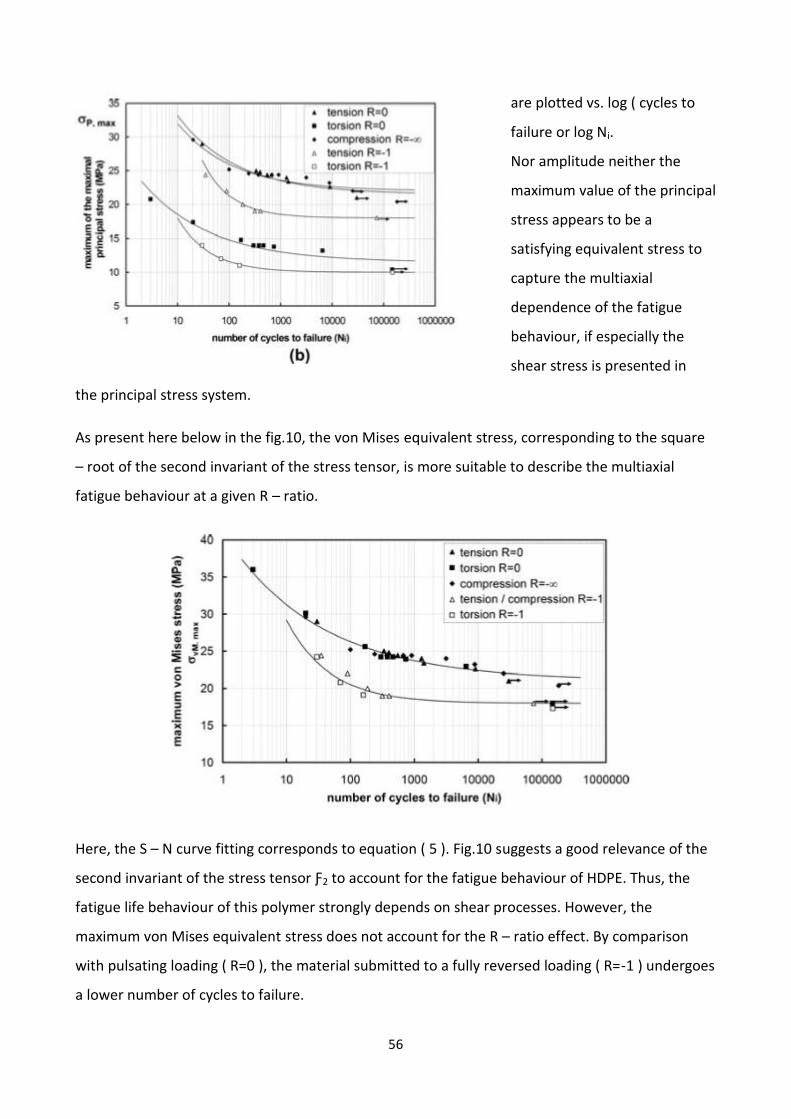
56
are plotted vs. log ( cycles to
failure or log Ni.
Nor amplitude neither the
maximum value of the principal
stress appears to be a
satisfying equivalent stress to
capture the multiaxial
dependence of the fatigue
behaviour, if especially the
shear stress is presented in
the principal stress system.
As present here below in the fig.10, the von Mises equivalent stress, corresponding to the square
– root of the second invariant of the stress tensor, is more suitable to describe the multiaxial
fatigue behaviour at a given R – ratio.
Here, the S – N curve fitting corresponds to equation ( 5 ). Fig.10 suggests a good relevance of the
second invariant of the stress tensor Ƒ2 to account for the fatigue behaviour of HDPE. Thus, the
fatigue life behaviour of this polymer strongly depends on shear processes. However, the
maximum von Mises equivalent stress does not account for the R – ratio effect. By comparison
with pulsating loading ( R=0 ), the material submitted to a fully reversed loading ( R=-1 ) undergoes
a lower number of cycles to failure.
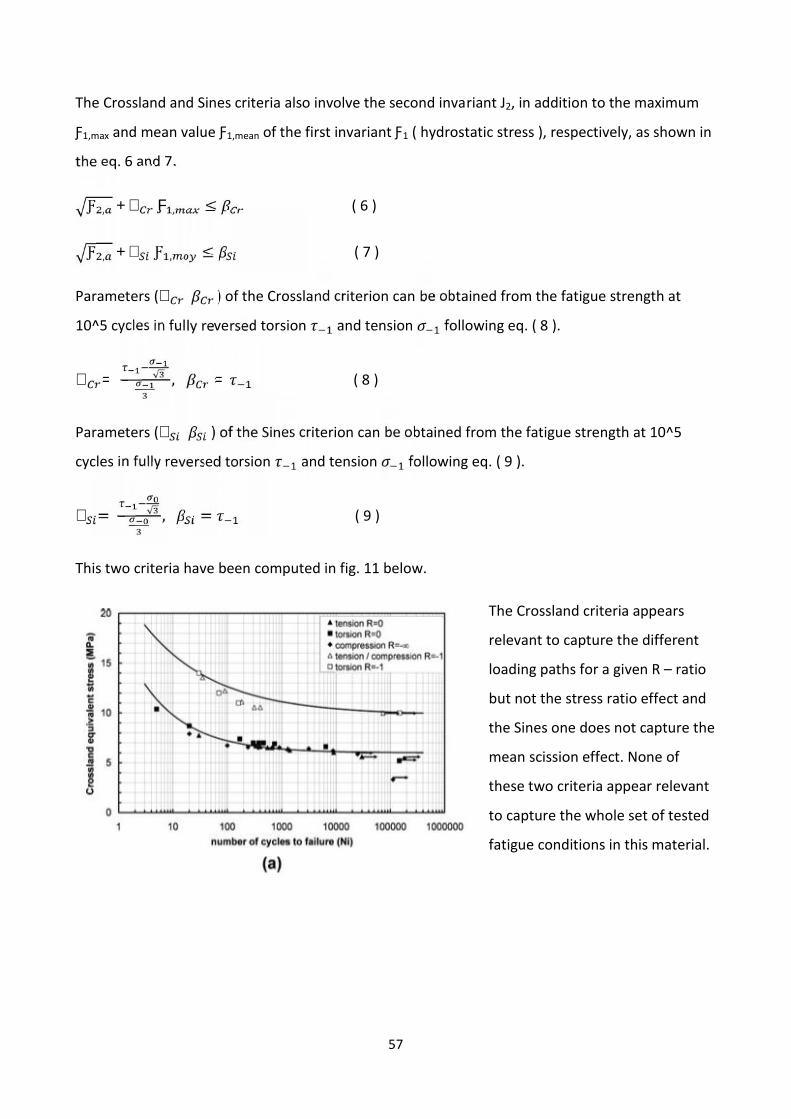
57
The Crossland and Sines criteria also involve the second invariant J2, in addition to the maximum
Ƒ1,max and mean value Ƒ1,mean of the first invariant Ƒ1 ( hydrostatic stress ), respectively, as shown in
the eq. 6 and 7.Ƒ , +∝ Ƒ , ≤ ( 6 )
Ƒ , +∝ Ƒ , ≤ ( 7 )
Parameters (∝ ) of the Crossland criterion can be obtained from the fatigue strength at
10^5 cycles in fully reversed torsion and tension following eq. ( 8 ).
∝ = √ , = ( 8 )
Parameters (∝ ) of the Sines criterion can be obtained from the fatigue strength at 10^5
cycles in fully reversed torsion and tension following eq. ( 9 ).
∝ = √ , = ( 9 )
This two criteria have been computed in fig. 11 below.
The Crossland criteria appears
relevant to capture the different
loading paths for a given R – ratio
but not the stress ratio effect and
the Sines one does not capture the
mean scission effect. None of
these two criteria appear relevant
to capture the whole set of tested
fatigue conditions in this material.
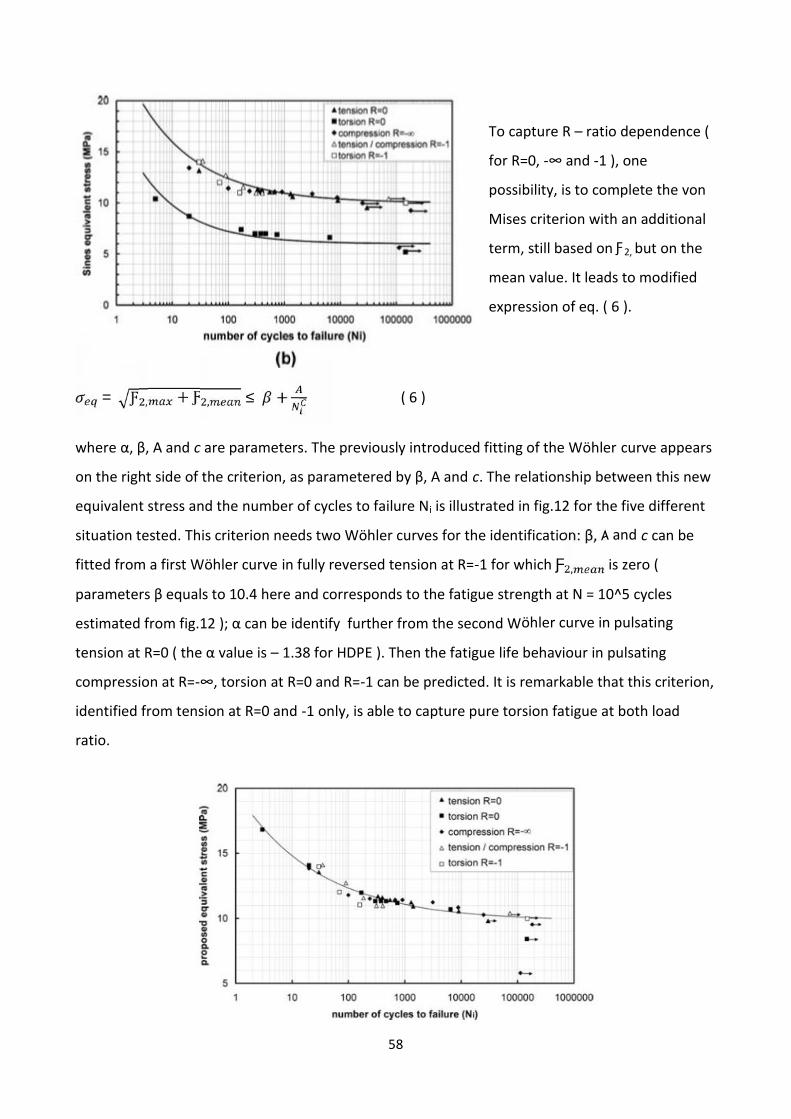
58
To capture R – ratio dependence (
for R=0, -∞ and -1 ), one
possibility, is to complete the von
Mises criterion with an additional
term, still based on Ƒ2, but on the
mean value. It leads to modified
expression of eq. ( 6 ).
= Ƒ , + Ƒ , ≤ + ( 6 )
where α, β, A and c are parameters. The previously introduced fitting of the Wöhler curve appears
on the right side of the criterion, as parametered by β, A and c. The relationship between this new
equivalent stress and the number of cycles to failure Ni is illustrated in fig.12 for the five different
situation tested. This criterion needs two Wöhler curves for the identification: β, A and c can be
fitted from a first Wöhler curve in fully reversed tension at R=-1 for which Ƒ , is zero (
parameters β equals to 10.4 here and corresponds to the fatigue strength at N = 10^5 cycles
estimated from fig.12 ); α can be identify further from the second Wöhler curve in pulsating
tension at R=0 ( the α value is – 1.38 for HDPE ). Then the fatigue life behaviour in pulsating
compression at R=-∞, torsion at R=0 and R=-1 can be predicted. It is remarkable that this criterion,
identified from tension at R=0 and -1 only, is able to capture pure torsion fatigue at both load
ratio.
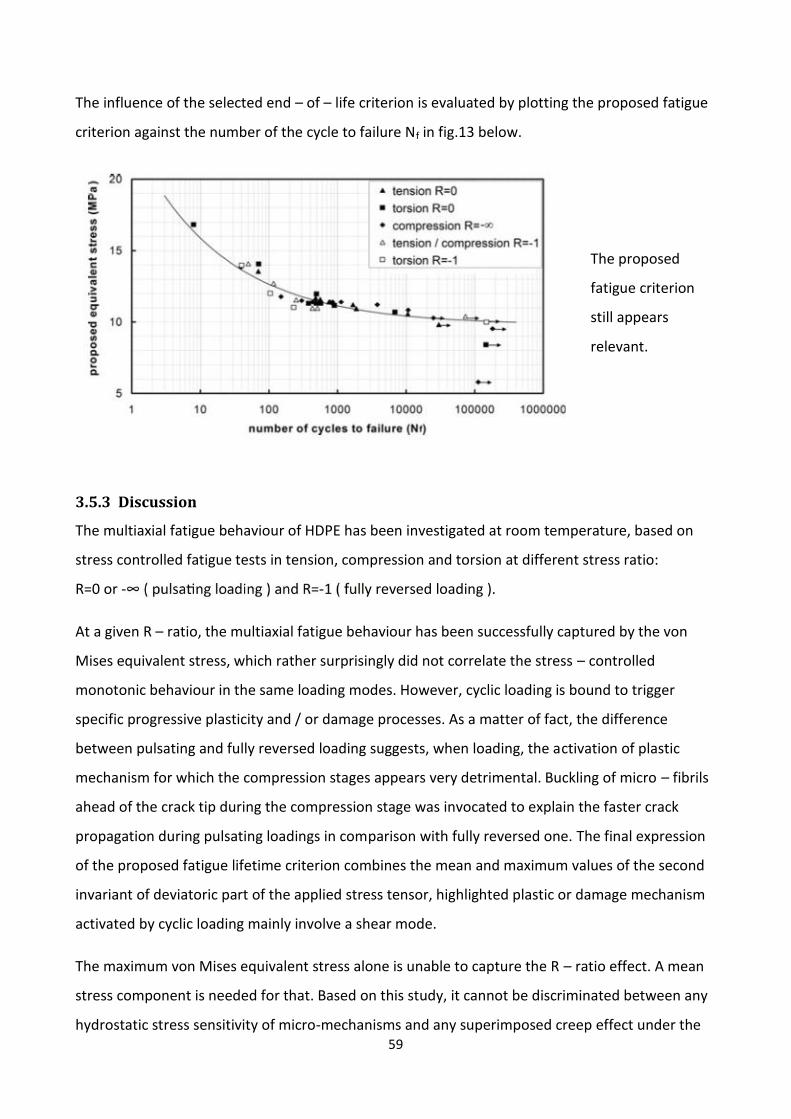
59
The influence of the selected end – of – life criterion is evaluated by plotting the proposed fatigue
criterion against the number of the cycle to failure Nf in fig.13 below.
The proposed
fatigue criterion
still appears
relevant.
3.5.3 Discussion
The multiaxial fatigue behaviour of HDPE has been investigated at room temperature, based on
stress controlled fatigue tests in tension, compression and torsion at different stress ratio:
R=0 or - -1 ( fully reversed loading ).
At a given R – ratio, the multiaxial fatigue behaviour has been successfully captured by the von
Mises equivalent stress, which rather surprisingly did not correlate the stress – controlled
monotonic behaviour in the same loading modes. However, cyclic loading is bound to trigger
specific progressive plasticity and / or damage processes. As a matter of fact, the difference
between pulsating and fully reversed loading suggests, when loading, the activation of plastic
mechanism for which the compression stages appears very detrimental. Buckling of micro – fibrils
ahead of the crack tip during the compression stage was invocated to explain the faster crack
propagation during pulsating loadings in comparison with fully reversed one. The final expression
of the proposed fatigue lifetime criterion combines the mean and maximum values of the second
invariant of deviatoric part of the applied stress tensor, highlighted plastic or damage mechanism
activated by cyclic loading mainly involve a shear mode.
The maximum von Mises equivalent stress alone is unable to capture the R – ratio effect. A mean
stress component is needed for that. Based on this study, it cannot be discriminated between any
hydrostatic stress sensitivity of micro-mechanisms and any superimposed creep effect under the
60
applied mean strain. This criterion is proposed to empirically describe the mean stress effect by
introducing one term based on the mean value of the von Mises equivalent stress, and one
additional parameter α. A simple linear dependence on Ƒ , is proposed, but it should be
validated from more experiments at various load ratios. From this approach, no interpretation can
be brought about this “ material “ parameter α. More detailed investigations about the micro-
mechanisms should be performed in different materials to highlight the relationship between α
and the creep component.
However, the present approach, proposed for the fatigue endurance lifetime range ( 10^3 – 10^5
cycles ) is not expected to be relevant for very high applied maximum stress or lifetimes below
10^3 cycles, due to the probable activation of pressure dependent dependent micro – mechanism
like cavitation under more severe loading. In the same way, only two R – ratios were tested here.
Any extension of the criterion towards higher R values is expected to involve the hydrostatic term
of the applied stress. To deeper evaluate the application domain proposed criterion, tests
performed with other fatigue waveforms, like the sinusoidal one, should be also performed and
analysed.
The present fatigue criterion was built from a specific definition of number of cycles to failure
( Ni ), corresponding to the onset of softening observed in the mean strain kinetics. However,
other end – of – life criteria could be defined.
It mostly affects the low cycles to failure regime in the Wöhler curves and does not appear
determinant for an endurance lifetime analysis : the proposed fatigue criterion keeps its relevancy
when choosing Nf as the end – of – life criterion. Nevertheless, as the end – of – life occurs by
macroscopic strain localization, tests on pipe length should be performed to evaluate the
influence on the determination of Ni and Nf and thus support the generality of the proposed
criterion. Nevertheless, as the end of life occurs, by macroscopic strain localization tests on other
pipe length should be performed to evaluate the influence on the determination of N i and Nf and
thus support the generality of the proposed criterion.
The present macroscopic analysis was also performed from averages stresses and strains
calculated from the global force and displacements. Gradients were not taken into account:
digital correlation software could be used although measuring strain fields would not be so easy in
such tubular shaped specimens, due to out – of – plane displacements. Nevertheless, this material
61
does not seem very sensitive to gradients localization. A few fatigue tests performed in pre –
cracked specimens ( with several hole diameters : 1, 2 and 3 mm diameter ) showed that the
material was not very notch – sensitive: indeed, samples field for similar fatigue life and in the
same instability mode as un – cracked specimens, whatever the hole location and direction. This
property cam be explained by the macromolecular architecture, optimized to delay slow crack
initiation and growth during creep at very long time scale.
It is worth being underlined that the proposed criterion is stress – based and that only stress –
controlled fatigue tests were considered so that the stress level in the cross section of these
specimens is nearly constant during the fatigue test. Even if the material exhibits a changing
behaviour during fatigue loading, as long as the sample undergoes force – controlled loading
enhancing relatively homogenous stress field, the present criterion could be used. However,
applying this criterion to other types of tests such as notch specimens, out of phase or
displacement tests should be checked carefully, because a relevant constitutive low is required to
model a realistic stress field. Like usually made in rubbers, a key issue is expected to deal with “
accommodate “ regime.
62
3.5.4 Conclusion
Force controlled multiaxial fatigue tests ( tension, torsion and compression ) have been performed
in thin – walled tubular specimens of HDPE, with a constant frequency, a triangular waveform and
different R – ratio ( 0, - ∞ and -1 ). Self – heating has been minimized and results have been
interpreted in a isothermal framework. Two major conclusions can be drawn.
1) Considering the failure mode, triggered by macroscopic strain localization, an end – of – life
criterion has been defined first. It is based on the onset of softening detected on the time
evolution of the fatigue loop mean strain. Up to this point, a great amount of the cyclic
strain has been demonstrated to be viscoelastic and thus recoverable after cycling
interruption.
2) Based on this end – of – life criterion, S – N curves could be drawn up. A fatigue criterion,
expressed from the maximum and mean values of the second invariant of the stress
tensor, has been proposed to explain the endurance lifetime. By adopting other end – of –
life criteria, the low cycles regime appears to be mostly affected. The proposed criterion
keeps relevancy. This stress – based criterion is validated for the restrictive framework of
force – controlled fatigue tests, over similar mean stress conditions between tension and
torsion. The application to other types of loadings is not discussed here. More general
loading conditions should be considered before generalization.
Work is in progress to evaluate the suitability of the proposed criterion to widened loading
situations ( higher mean stresses, frequency, waveform ) as well as to other thermoplastics.
Thermomechanical coupling exhibited during cyclic fatigue loading is also under consideration.
63
3.6 VARIABLE AMPLITUDE FATIGUE BEHAVIOUR OF NEATTHERMOPLASTICS
REF: Mohammadreza E, Ali F. Mechanical, Industrial and Manufactoring Engineering Dept. , the
University of Toledo USA.
Article from Internationale Journal Fatigue
Many applications of thermoplastic materials are exposed to cyclic loading. As result, fatigue is a
common mode to failure which must be taken into consideration in the design of components
made of these materials. The service load history tipically consists of variable amplitude loading.
Experimental evaluation of the behaviour of the component under these load histories considering
structural shaping ( stress concentrations ) is costly and time consuming, therefore an accurate life
prediction method is required. This method typically includes a cycle counting method, a damage
quantification parameter, a cumulative damage rule, along with constant amplitude material
fatigue data.
Multi – step loading, constant amplitude loading with periodic overloads, and variable amplitude
service loading histories are common types of loadings used for investigation of variable
ampltitude fatigue behaviour. Multi – step loading is usually utilized to investigate load sequence
effects on fatigue behaviour. Service load histories typically contain periodic overloads, therefore,
understanding the response of the material to overloads is an important consideration.
Variable amplitude fatigue behaviour of polymeric materials has been studied much less than
metallic materials. Due to the complex interaction and growth of different damage mechanisms, in
addition to the influence of the temperature, frequency and humidity on the fatigue behaviour of
polymer composites, their cumulative fatigue damage analysis is tipically more complex than
metallic materials.
Due to limited reported experimental results and modeling techniques ragarding variable
amplitude fatigue behaviour of thermoplastics, there is a need for a comprehensive study
considering different effects including material, loading condition, mean stress, frequency and
stress concentration. In this study, variable amplitude fatigue behaviour of neat thermoplastic
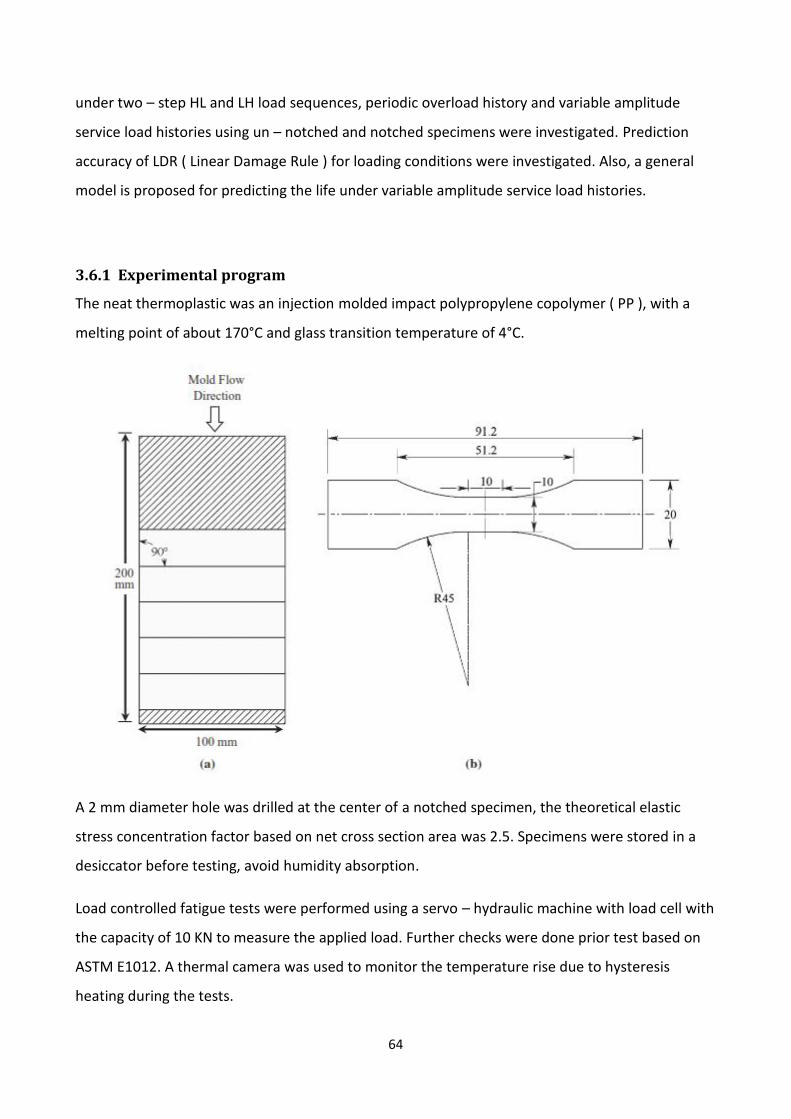
64
under two – step HL and LH load sequences, periodic overload history and variable amplitude
service load histories using un – notched and notched specimens were investigated. Prediction
accuracy of LDR ( Linear Damage Rule ) for loading conditions were investigated. Also, a general
model is proposed for predicting the life under variable amplitude service load histories.
3.6.1 Experimental program
The neat thermoplastic was an injection molded impact polypropylene copolymer ( PP ), with a
melting point of about 170°C and glass transition temperature of 4°C.
A 2 mm diameter hole was drilled at the center of a notched specimen, the theoretical elastic
stress concentration factor based on net cross section area was 2.5. Specimens were stored in a
desiccator before testing, avoid humidity absorption.
Load controlled fatigue tests were performed using a servo – hydraulic machine with load cell with
the capacity of 10 KN to measure the applied load. Further checks were done prior test based on
ASTM E1012. A thermal camera was used to monitor the temperature rise due to hysteresis
heating during the tests.
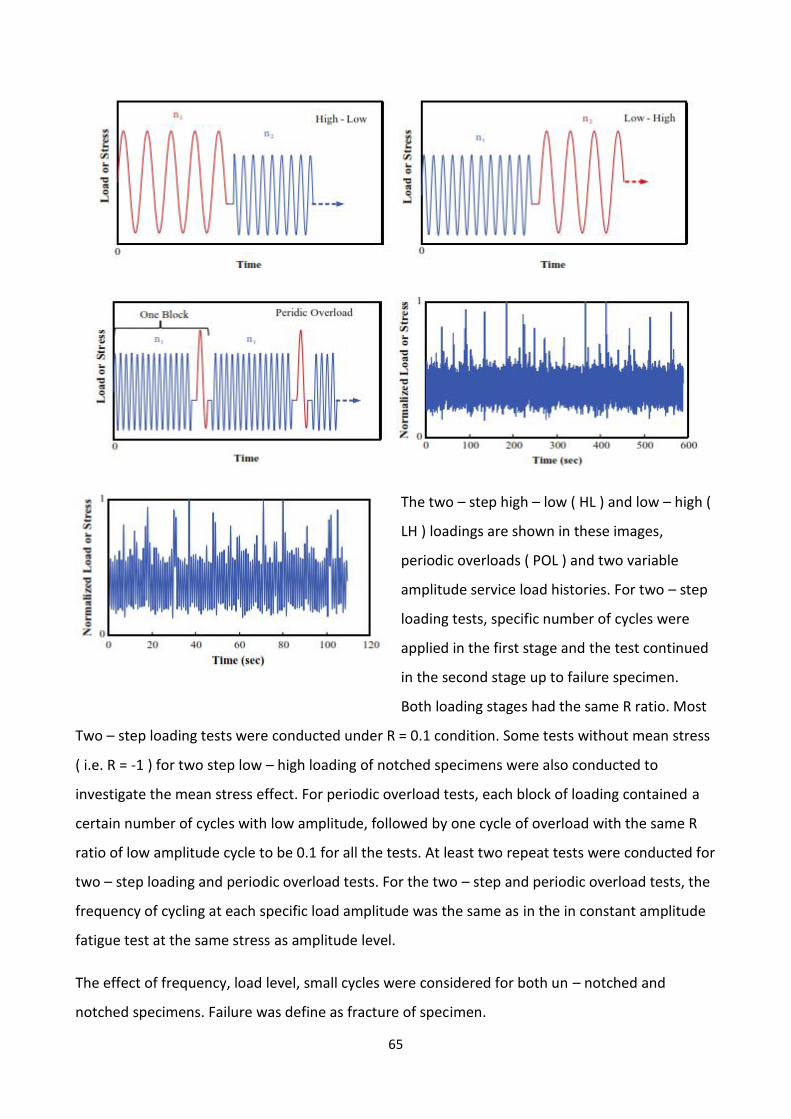
65
The two – step high – low ( HL ) and low – high (
LH ) loadings are shown in these images,
periodic overloads ( POL ) and two variable
amplitude service load histories. For two – step
loading tests, specific number of cycles were
applied in the first stage and the test continued
in the second stage up to failure specimen.
Both loading stages had the same R ratio. Most
Two – step loading tests were conducted under R = 0.1 condition. Some tests without mean stress
( i.e. R = -1 ) for two step low – high loading of notched specimens were also conducted to
investigate the mean stress effect. For periodic overload tests, each block of loading contained a
certain number of cycles with low amplitude, followed by one cycle of overload with the same R
ratio of low amplitude cycle to be 0.1 for all the tests. At least two repeat tests were conducted for
two – step loading and periodic overload tests. For the two – step and periodic overload tests, the
frequency of cycling at each specific load amplitude was the same as in the in constant amplitude
fatigue test at the same stress as amplitude level.
The effect of frequency, load level, small cycles were considered for both un – notched and
notched specimens. Failure was define as fracture of specimen.
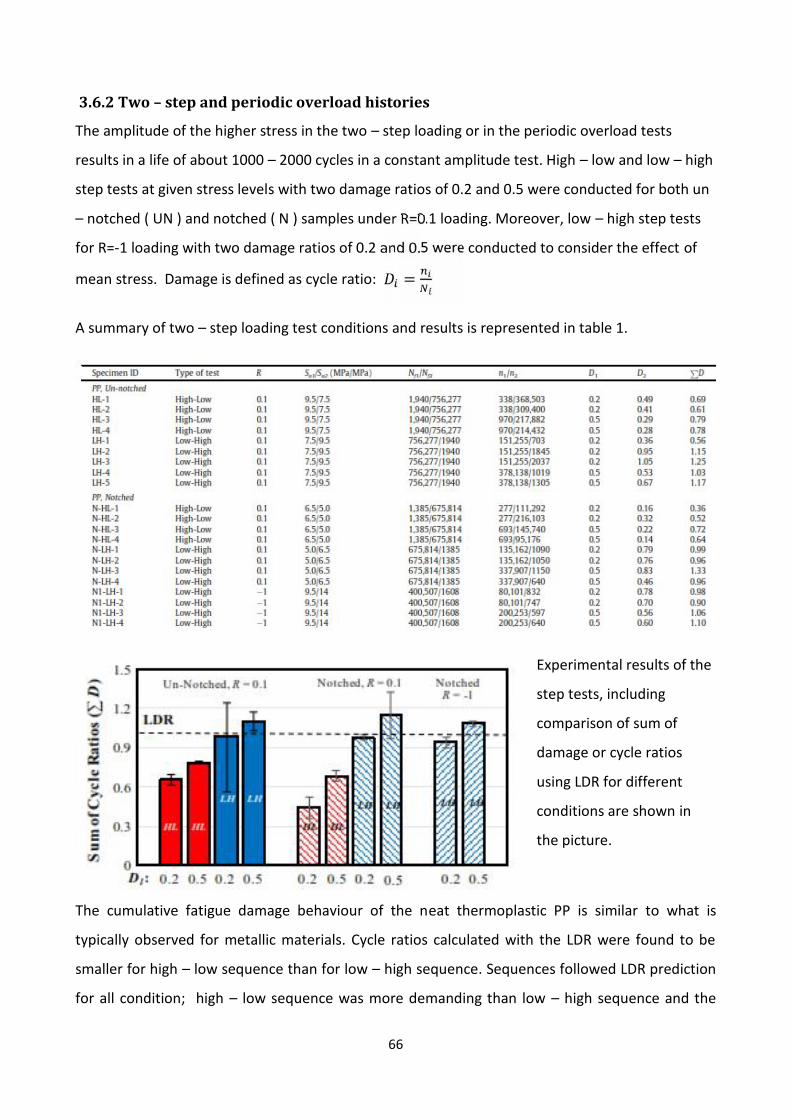
66
3.6.2 Two – step and periodic overload histories
The amplitude of the higher stress in the two – step loading or in the periodic overload tests
results in a life of about 1000 – 2000 cycles in a constant amplitude test. High – low and low – high
step tests at given stress levels with two damage ratios of 0.2 and 0.5 were conducted for both un
– notched ( UN ) and notched ( N ) samples under R=0.1 loading. Moreover, low – high step tests
for R=-1 loading with two damage ratios of 0.2 and 0.5 were conducted to consider the effect of
mean stress. Damage is defined as cycle ratio: =A summary of two – step loading test conditions and results is represented in table 1.
Experimental results of the
step tests, including
comparison of sum of
damage or cycle ratios
using LDR for different
conditions are shown in
the picture.
The cumulative fatigue damage behaviour of the neat thermoplastic PP is similar to what is
typically observed for metallic materials. Cycle ratios calculated with the LDR were found to be
smaller for high – low sequence than for low – high sequence. Sequences followed LDR prediction
for all condition; high – low sequence was more demanding than low – high sequence and the
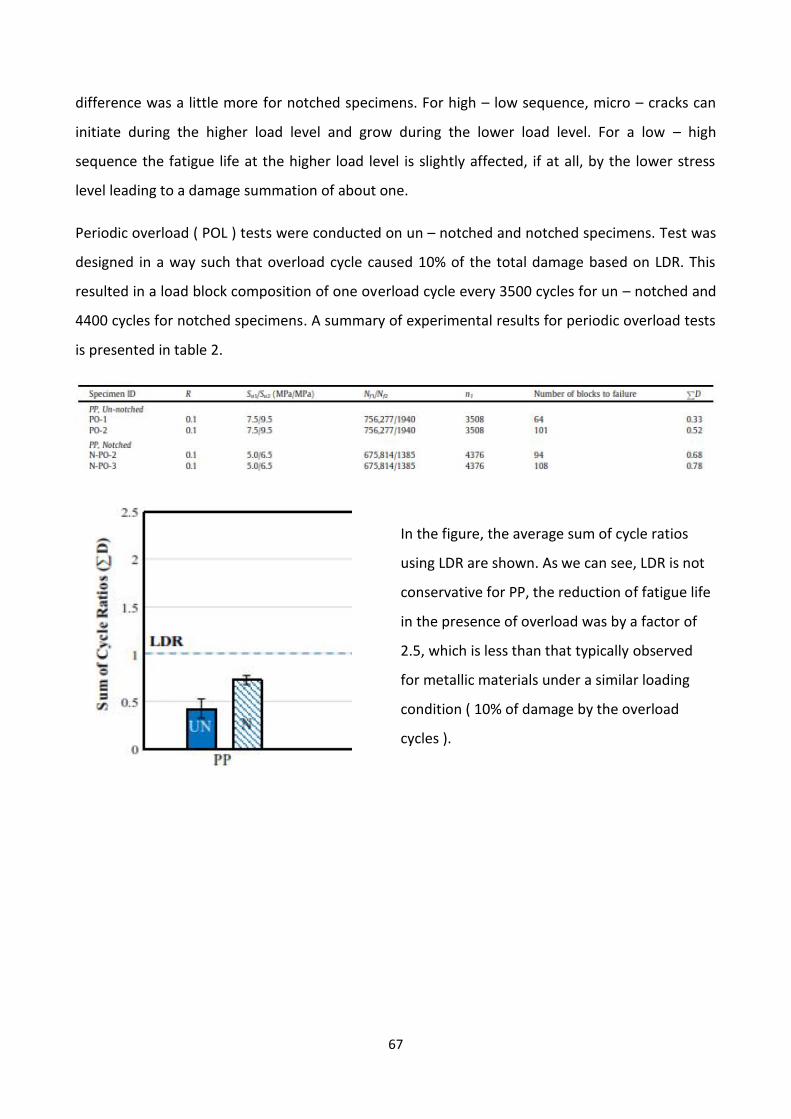
67
difference was a little more for notched specimens. For high – low sequence, micro – cracks can
initiate during the higher load level and grow during the lower load level. For a low – high
sequence the fatigue life at the higher load level is slightly affected, if at all, by the lower stress
level leading to a damage summation of about one.
Periodic overload ( POL ) tests were conducted on un – notched and notched specimens. Test was
designed in a way such that overload cycle caused 10% of the total damage based on LDR. This
resulted in a load block composition of one overload cycle every 3500 cycles for un – notched and
4400 cycles for notched specimens. A summary of experimental results for periodic overload tests
is presented in table 2.
In the figure, the average sum of cycle ratios
using LDR are shown. As we can see, LDR is not
conservative for PP, the reduction of fatigue life
in the presence of overload was by a factor of
2.5, which is less than that typically observed
for metallic materials under a similar loading
condition ( 10% of damage by the overload
cycles ).
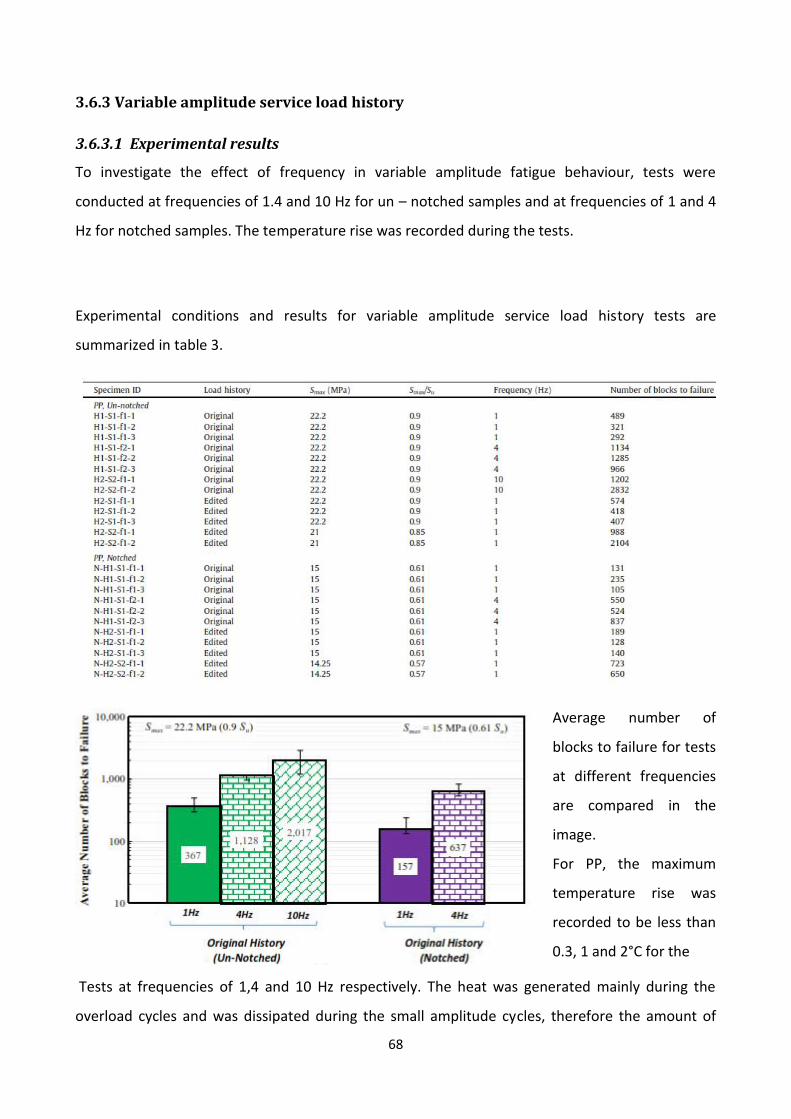
68
3.6.3 Variable amplitude service load history
3.6.3.1 Experimental results
To investigate the effect of frequency in variable amplitude fatigue behaviour, tests were
conducted at frequencies of 1.4 and 10 Hz for un – notched samples and at frequencies of 1 and 4
Hz for notched samples. The temperature rise was recorded during the tests.
Experimental conditions and results for variable amplitude service load history tests are
summarized in table 3.
Average number of
blocks to failure for tests
at different frequencies
are compared in the
image.
For PP, the maximum
temperature rise was
recorded to be less than
0.3, 1 and 2°C for the
Tests at frequencies of 1,4 and 10 Hz respectively. The heat was generated mainly during the
overload cycles and was dissipated during the small amplitude cycles, therefore the amount of
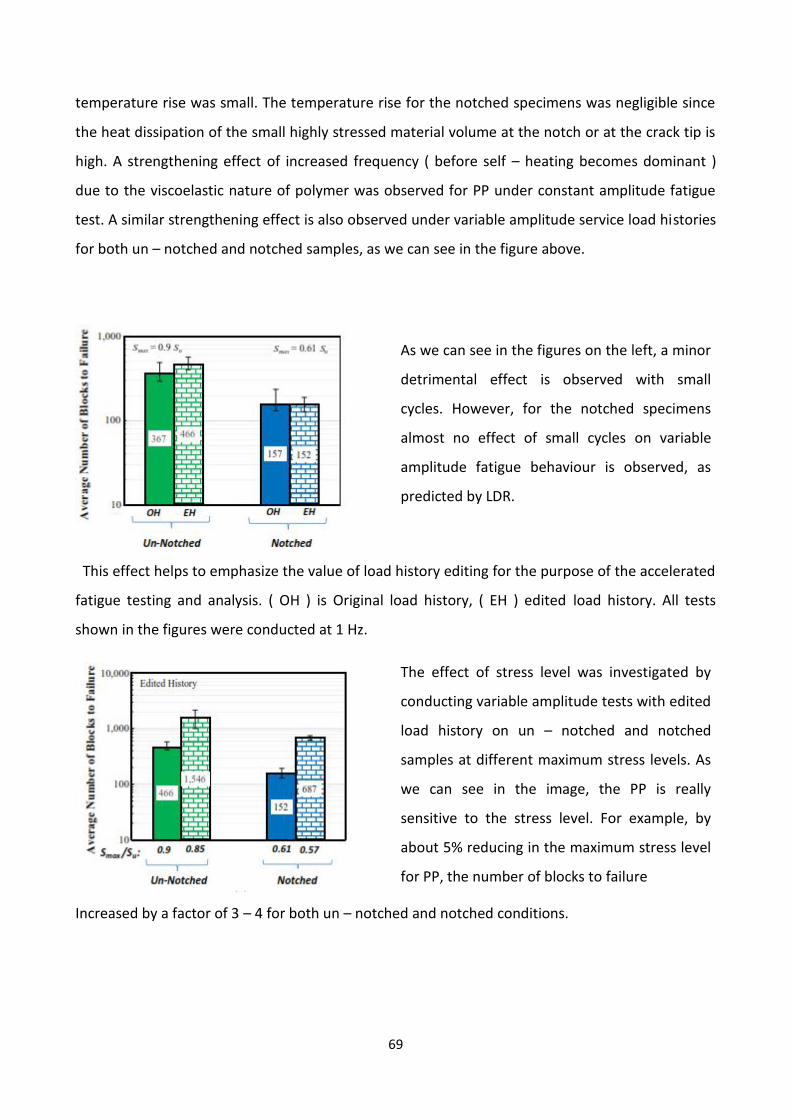
69
temperature rise was small. The temperature rise for the notched specimens was negligible since
the heat dissipation of the small highly stressed material volume at the notch or at the crack tip is
high. A strengthening effect of increased frequency ( before self – heating becomes dominant )
due to the viscoelastic nature of polymer was observed for PP under constant amplitude fatigue
test. A similar strengthening effect is also observed under variable amplitude service load histories
for both un – notched and notched samples, as we can see in the figure above.
As we can see in the figures on the left, a minor
detrimental effect is observed with small
cycles. However, for the notched specimens
almost no effect of small cycles on variable
amplitude fatigue behaviour is observed, as
predicted by LDR.
This effect helps to emphasize the value of load history editing for the purpose of the accelerated
fatigue testing and analysis. ( OH ) is Original load history, ( EH ) edited load history. All tests
shown in the figures were conducted at 1 Hz.
The effect of stress level was investigated by
conducting variable amplitude tests with edited
load history on un – notched and notched
samples at different maximum stress levels. As
we can see in the image, the PP is really
sensitive to the stress level. For example, by
about 5% reducing in the maximum stress level
for PP, the number of blocks to failure
Increased by a factor of 3 – 4 for both un – notched and notched conditions.
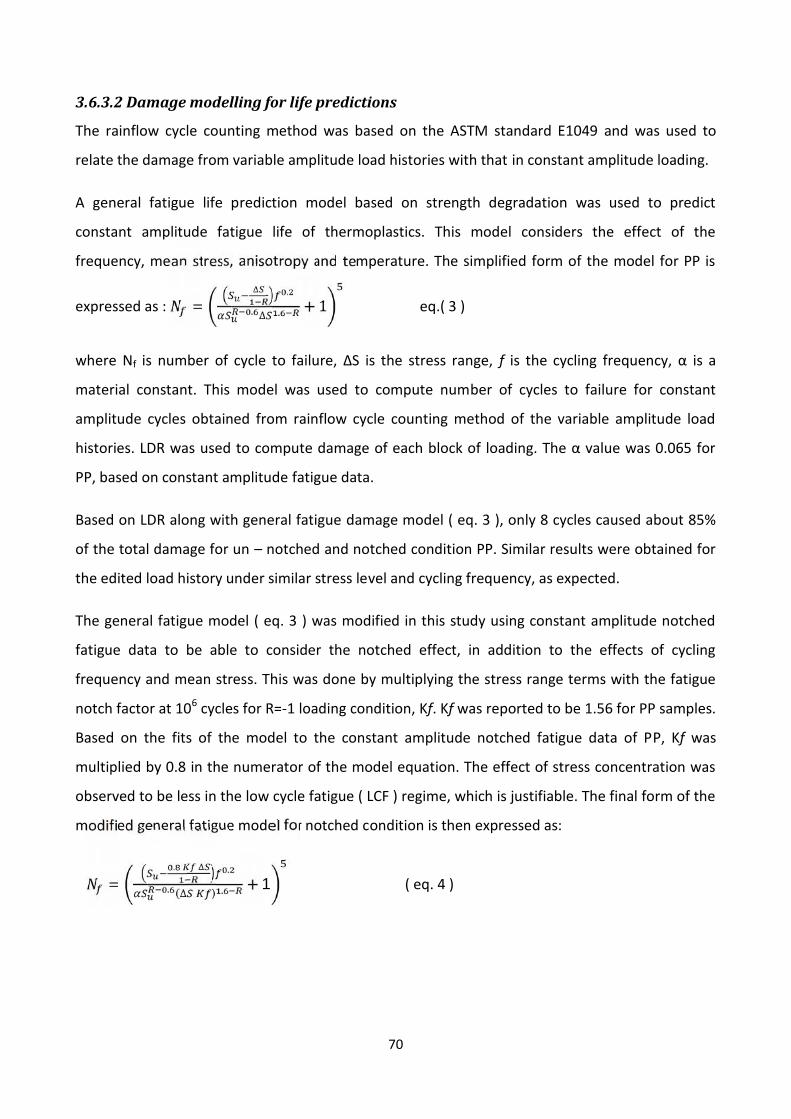
70
3.6.3.2 Damage modelling for life predictions
The rainflow cycle counting method was based on the ASTM standard E1049 and was used to
relate the damage from variable amplitude load histories with that in constant amplitude loading.
A general fatigue life prediction model based on strength degradation was used to predict
constant amplitude fatigue life of thermoplastics. This model considers the effect of the
frequency, mean stress, anisotropy and temperature. The simplified form of the model for PP is
expressed as : = ∆ .. ∆ . + 1 eq.( 3 )
where Nf is number of cycle to failure, ΔS is the stress range, f is the cycling frequency, α is a
material constant. This model was used to compute number of cycles to failure for constant
amplitude cycles obtained from rainflow cycle counting method of the variable amplitude load
histories. LDR was used to compute damage of each block of loading. The α value was 0.065 for
PP, based on constant amplitude fatigue data.
Based on LDR along with general fatigue damage model ( eq. 3 ), only 8 cycles caused about 85%
of the total damage for un – notched and notched condition PP. Similar results were obtained for
the edited load history under similar stress level and cycling frequency, as expected.
The general fatigue model ( eq. 3 ) was modified in this study using constant amplitude notched
fatigue data to be able to consider the notched effect, in addition to the effects of cycling
frequency and mean stress. This was done by multiplying the stress range terms with the fatigue
notch factor at 106 cycles for R=-1 loading condition, Kf. Kf was reported to be 1.56 for PP samples.
Based on the fits of the model to the constant amplitude notched fatigue data of PP, Kf was
multiplied by 0.8 in the numerator of the model equation. The effect of stress concentration was
observed to be less in the low cycle fatigue ( LCF ) regime, which is justifiable. The final form of the
modified general fatigue model for notched condition is then expressed as:
= . ∆ .. (∆ ) . + 1 ( eq. 4 )
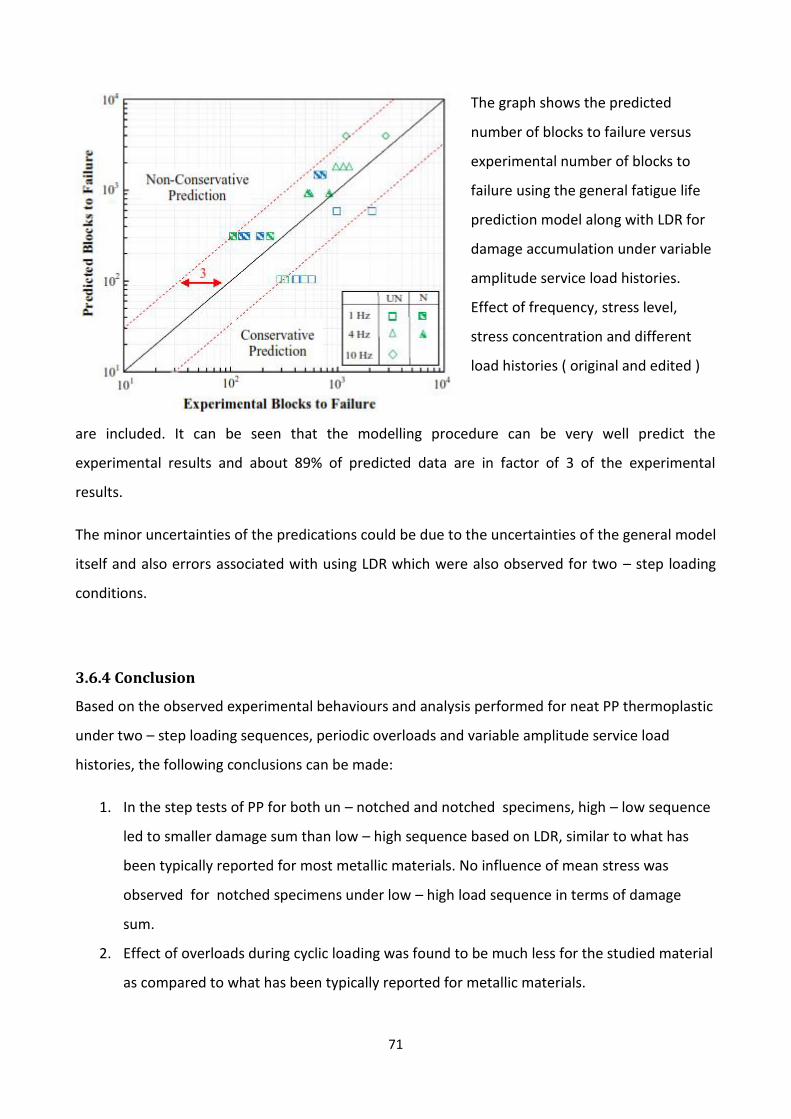
71
The graph shows the predicted
number of blocks to failure versus
experimental number of blocks to
failure using the general fatigue life
prediction model along with LDR for
damage accumulation under variable
amplitude service load histories.
Effect of frequency, stress level,
stress concentration and different
load histories ( original and edited )
are included. It can be seen that the modelling procedure can be very well predict the
experimental results and about 89% of predicted data are in factor of 3 of the experimental
results.
The minor uncertainties of the predications could be due to the uncertainties of the general model
itself and also errors associated with using LDR which were also observed for two – step loading
conditions.
3.6.4 Conclusion
Based on the observed experimental behaviours and analysis performed for neat PP thermoplastic
under two – step loading sequences, periodic overloads and variable amplitude service load
histories, the following conclusions can be made:
1. In the step tests of PP for both un – notched and notched specimens, high – low sequence
led to smaller damage sum than low – high sequence based on LDR, similar to what has
been typically reported for most metallic materials. No influence of mean stress was
observed for notched specimens under low – high load sequence in terms of damage
sum.
2. Effect of overloads during cyclic loading was found to be much less for the studied material
as compared to what has been typically reported for metallic materials.
72
3. The strengthening effect of increased frequency was observed for both materials for the
original service load history tests of both un – notched and notched conditions. Minor
damage effect of small cycles but significant stress effect level were observed in variable
amplitude service load history test.
4. A general fatigue life prediction model was suggested for fatigue life prediction along with
rainflow cycle counting method and LDR. The general model took into account the effects
of frequency, mean stress and stress concentration. 89% of predicted lives were within a
factor of 3 of experimental lives.
5. In general, using LDR life predictions under variable amplitude loadings, including two –
step loading, periodic overloads and representative service load histories of neat PP
thermoplastic was reasonable. Almost all of the life predictions using the LDR were within
a factor of 3 of experimental results.
73
3.7 MULTISCALE HIGH CYCLE FATIGUE MODELS FOR NEAT THERMOPLASTICPOLYMERS
REF: A. Krairi, I. Dogri, G. Robert; University of Louvain Belgium, Solvay Engineering Plastics Saint
Fons France
Article from Internationale Journal of Fatigue
3.7.1 Introduction
Neat thermoplastic homogeneous polymer ( TPs ) is a material that have been employed for
several decade in automotive, sporting goods and electronic applications, as an alternative for
metals. The reduction of the weight with a control cost were most important challenges for a lot
of Industries. Thermal – mechanical fatigue was the result of the failure of the extreme operating
conditions; effects of fatigue loadings are generally evaluated by costly and time – consuming
experiments.
In order to predict fatigue life several scenarios and experimental interpretations utilized to
motivate modelling approach. In defining the TPs fatigue failure, two different stage are needed:
the first is the progressive degradation of material ( mechanical properties ) until crack initiation,
the second stage consider the crack propagation up to the final fracture. Crack initiated at pre-
existing defects or inhomogeneity within the material or low density formed at nanometric scale.
According to Sauer, Chen and Lesser, the crack initiation stage takes the most of lifetime for
several polymers, like PC, PP and PPMA, which shown that the initiation stage covers the entire
fatigue life ( < 99% ).
In summary, failure is a result of two processes: the initiation and the propagation of the crack.
Crack propagation is usually modelled using fracture mechanics ( FM ). They assume pre – existing
defects, however they generally ignore the initiation stage of failure. The well – known model of
Paris and Erdogan is used, which gives the rate of crack propagation per cycle as function of the so
– called “ stress intensity factor variation “. However, the initiation stage is the most important for
many TPs, thus it should be taken into account in the modelling.
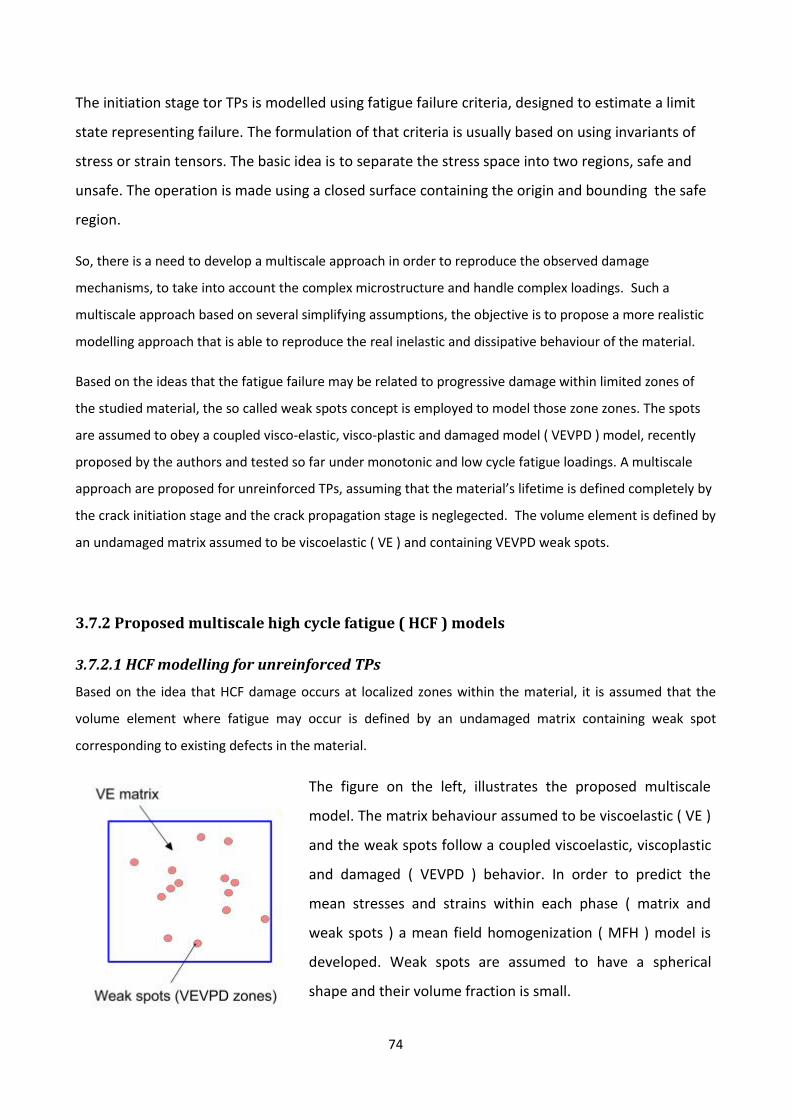
74
The initiation stage tor TPs is modelled using fatigue failure criteria, designed to estimate a limit
state representing failure. The formulation of that criteria is usually based on using invariants of
stress or strain tensors. The basic idea is to separate the stress space into two regions, safe and
unsafe. The operation is made using a closed surface containing the origin and bounding the safe
region.
So, there is a need to develop a multiscale approach in order to reproduce the observed damage
mechanisms, to take into account the complex microstructure and handle complex loadings. Such a
multiscale approach based on several simplifying assumptions, the objective is to propose a more realistic
modelling approach that is able to reproduce the real inelastic and dissipative behaviour of the material.
Based on the ideas that the fatigue failure may be related to progressive damage within limited zones of
the studied material, the so called weak spots concept is employed to model those zone zones. The spots
are assumed to obey a coupled visco-elastic, visco-plastic and damaged model ( VEVPD ) model, recently
proposed by the authors and tested so far under monotonic and low cycle fatigue loadings. A multiscale
approach are proposed for unreinforced TPs, assuming that the material’s lifetime is defined completely by
the crack initiation stage and the crack propagation stage is neglegected. The volume element is defined by
an undamaged matrix assumed to be viscoelastic ( VE ) and containing VEVPD weak spots.
3.7.2 Proposed multiscale high cycle fatigue ( HCF ) models
3.7.2.1 HCF modelling for unreinforced TPsBased on the idea that HCF damage occurs at localized zones within the material, it is assumed that the
volume element where fatigue may occur is defined by an undamaged matrix containing weak spot
corresponding to existing defects in the material.
The figure on the left, illustrates the proposed multiscale
model. The matrix behaviour assumed to be viscoelastic ( VE )
and the weak spots follow a coupled viscoelastic, viscoplastic
and damaged ( VEVPD ) behavior. In order to predict the
mean stresses and strains within each phase ( matrix and
weak spots ) a mean field homogenization ( MFH ) model is
developed. Weak spots are assumed to have a spherical
shape and their volume fraction is small.
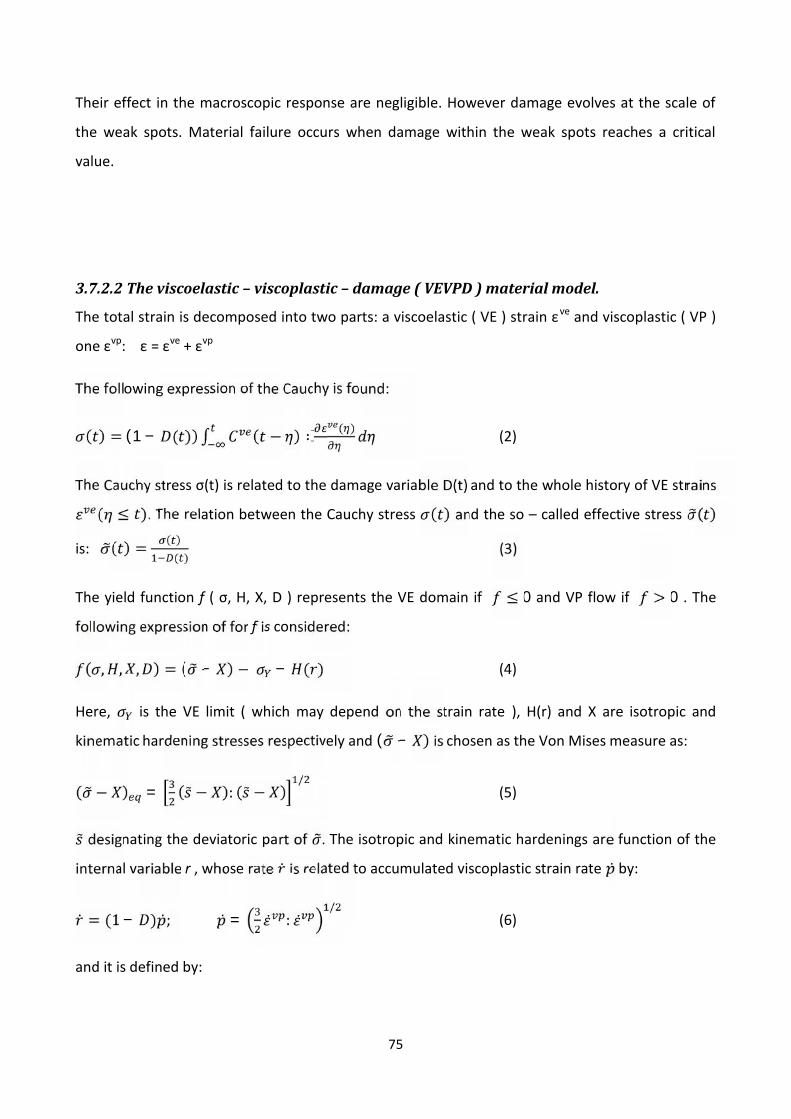
75
Their effect in the macroscopic response are negligible. However damage evolves at the scale of
the weak spots. Material failure occurs when damage within the weak spots reaches a critical
value.
3.7.2.2 The viscoelastic – viscoplastic – damage ( VEVPD ) material model.
The total strain is decomposed into two parts: a viscoelastic ( VE ) strain εve and viscoplastic ( VP )
one εvp: ε = εve + εvp
The following expression of the Cauchy is found:
( ) = (1 − ( )) ∫ ( − ) ∶ ( ) (2)
The Cauchy stress σ(t) is related to the damage variable D(t) and to the whole history of VE strains( ≤ ). The relation between the Cauchy stress ( ) and the so – called effective stress ( )is: ( ) = ( )( ) (3)
The yield function f ( σ, H, X, D ) represents the VE domain if ≤ 0 and VP flow if > 0 . The
following expression of for f is considered:( , , , ) = ( − ) − − ( ) (4)
Here, is the VE limit ( which may depend on the strain rate ), H(r) and X are isotropic and
kinematic hardening stresses respectively and ( − ) is chosen as the Von Mises measure as:
( − ) = ( − ): ( − ) /(5)
designating the deviatoric part of . The isotropic and kinematic hardenings are function of the
internal variable r , whose rate is related to accumulated viscoplastic strain rate by:
= (1 − ) ; = : /(6)
and it is defined by:
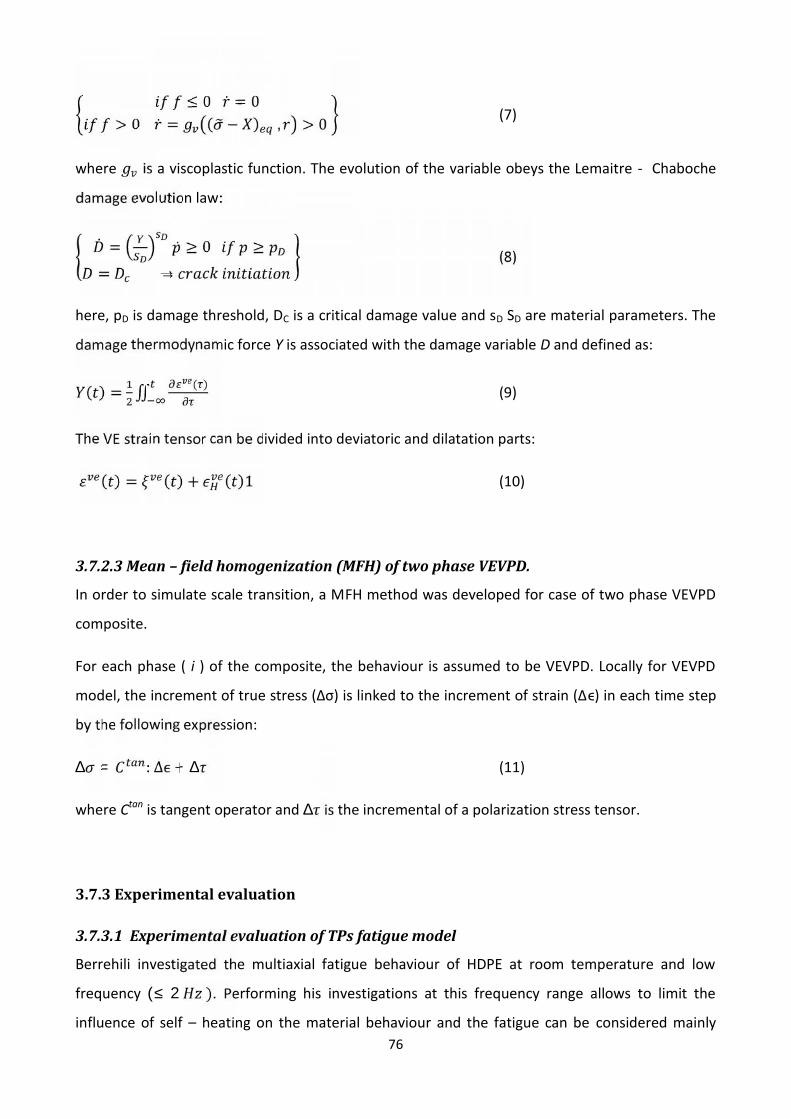
76
≤ 0 = 0> 0 = ( − ) , > 0 (7)
where is a viscoplastic function. The evolution of the variable obeys the Lemaitre - Chaboche
damage evolution law:
= ≥ 0 ≥= → (8)
here, pD is damage threshold, DC is a critical damage value and sD SD are material parameters. The
damage thermodynamic force Y is associated with the damage variable D and defined as:
( ) = ∬ ( ) (9)
The VE strain tensor can be divided into deviatoric and dilatation parts:( ) = ( ) + ( )1 (10)
3.7.2.3 Mean – field homogenization (MFH) of two phase VEVPD.
In order to simulate scale transition, a MFH method was developed for case of two phase VEVPD
composite.
For each phase ( i ) of the composite, the behaviour is assumed to be VEVPD. Locally for VEVPD
model, the increment of true stress (Δσ) is linked to the increment of strain (Δϵ) in each time step
by the following expression:∆ = : ∆ + ∆ (11)
where Ctan is tangent operator and ∆ is the incremental of a polarization stress tensor.
3.7.3 Experimental evaluation
3.7.3.1 Experimental evaluation of TPs fatigue model
Berrehili investigated the multiaxial fatigue behaviour of HDPE at room temperature and low
frequency (≤ 2 ). Performing his investigations at this frequency range allows to limit the
influence of self – heating on the material behaviour and the fatigue can be considered mainly
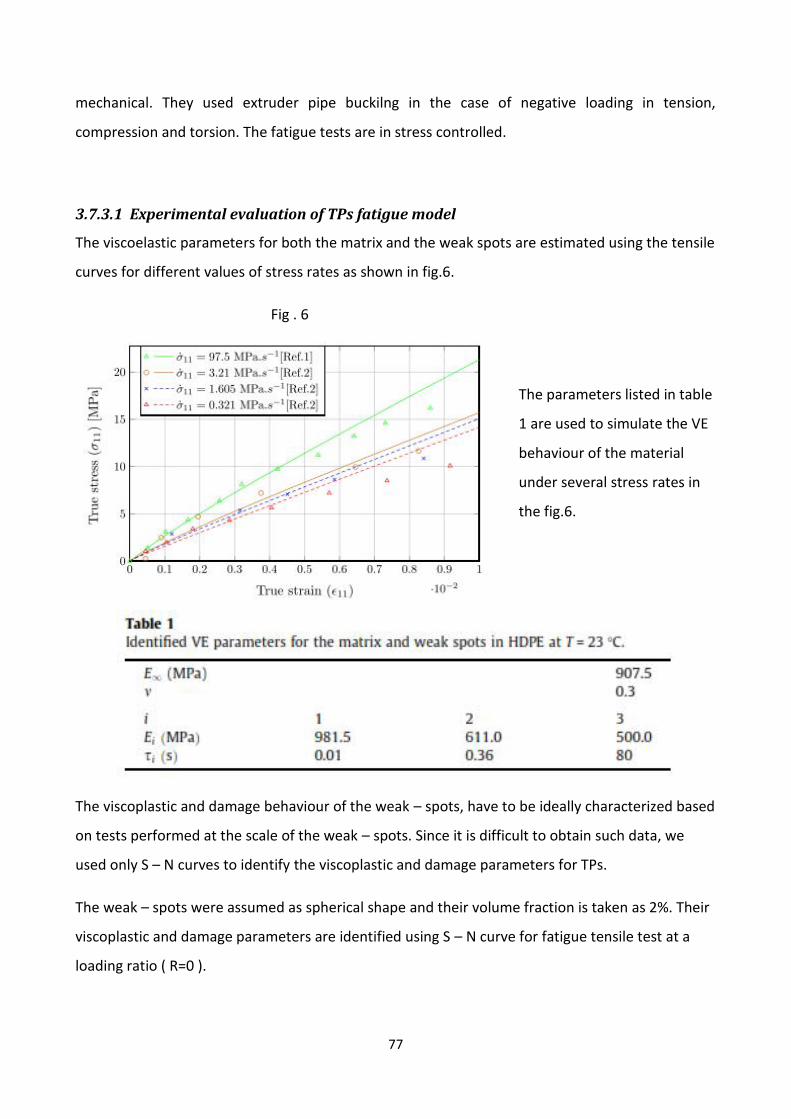
77
mechanical. They used extruder pipe buckilng in the case of negative loading in tension,
compression and torsion. The fatigue tests are in stress controlled.
3.7.3.1 Experimental evaluation of TPs fatigue model
The viscoelastic parameters for both the matrix and the weak spots are estimated using the tensile
curves for different values of stress rates as shown in fig.6.
Fig . 6
The parameters listed in table
1 are used to simulate the VE
behaviour of the material
under several stress rates in
the fig.6.
The viscoplastic and damage behaviour of the weak – spots, have to be ideally characterized based
on tests performed at the scale of the weak – spots. Since it is difficult to obtain such data, we
used only S – N curves to identify the viscoplastic and damage parameters for TPs.
The weak – spots were assumed as spherical shape and their volume fraction is taken as 2%. Their
viscoplastic and damage parameters are identified using S – N curve for fatigue tensile test at a
loading ratio ( R=0 ).
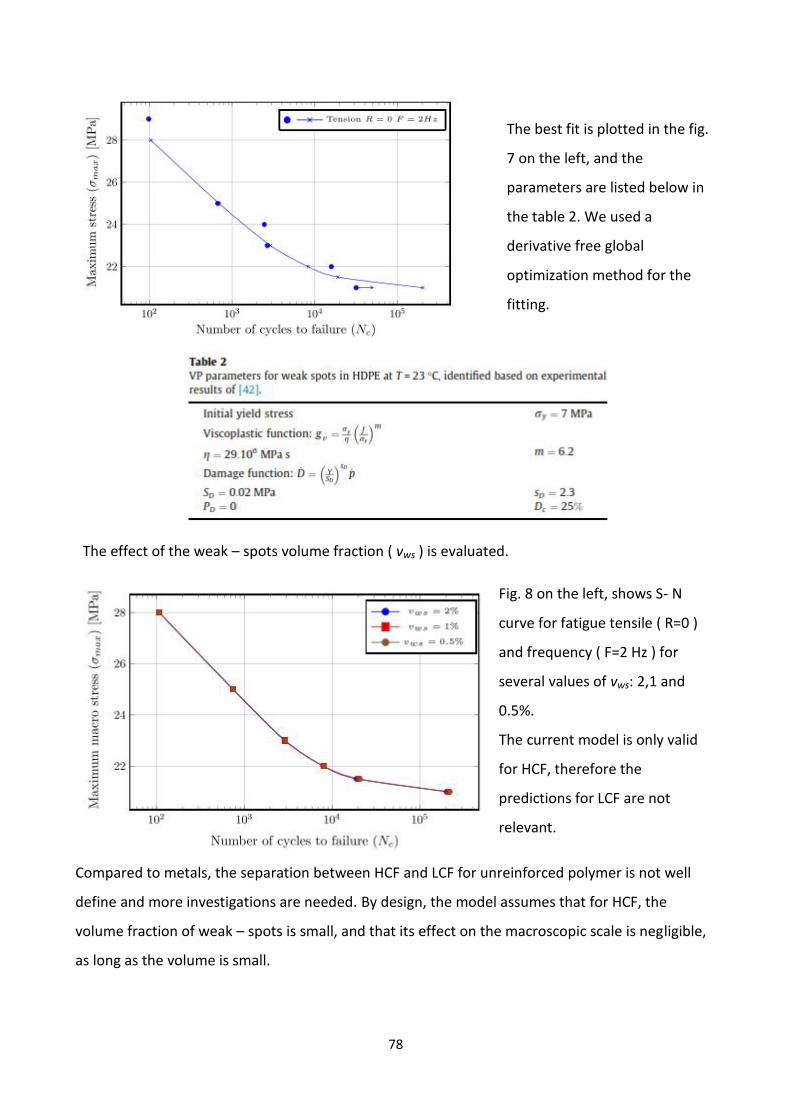
78
The best fit is plotted in the fig.
7 on the left, and the
parameters are listed below in
the table 2. We used a
derivative free global
optimization method for the
fitting.
The effect of the weak – spots volume fraction ( vws ) is evaluated.
Fig. 8 on the left, shows S- N
curve for fatigue tensile ( R=0 )
and frequency ( F=2 Hz ) for
several values of vws: 2,1 and
0.5%.
The current model is only valid
for HCF, therefore the
predictions for LCF are not
relevant.
Compared to metals, the separation between HCF and LCF for unreinforced polymer is not well
define and more investigations are needed. By design, the model assumes that for HCF, the
volume fraction of weak – spots is small, and that its effect on the macroscopic scale is negligible,
as long as the volume is small.
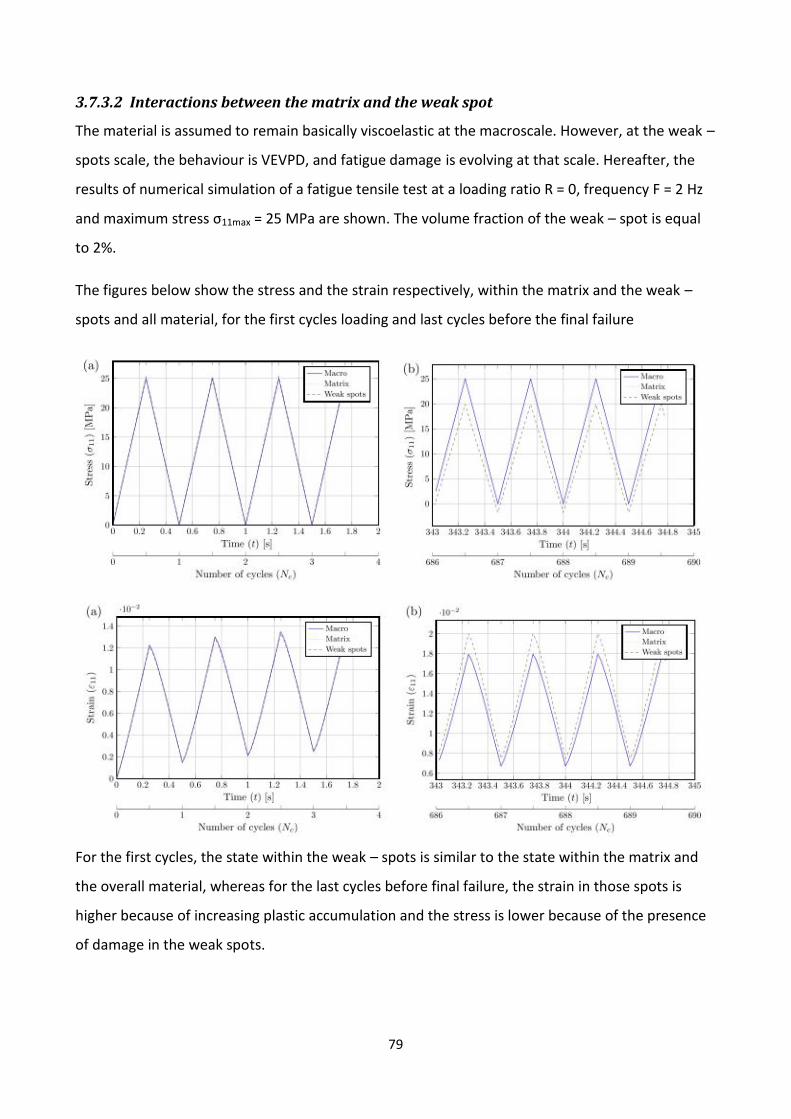
79
3.7.3.2 Interactions between the matrix and the weak spot
The material is assumed to remain basically viscoelastic at the macroscale. However, at the weak –
spots scale, the behaviour is VEVPD, and fatigue damage is evolving at that scale. Hereafter, the
results of numerical simulation of a fatigue tensile test at a loading ratio R = 0, frequency F = 2 Hz
and maximum stress σ11max = 25 MPa are shown. The volume fraction of the weak – spot is equal
to 2%.
The figures below show the stress and the strain respectively, within the matrix and the weak –
spots and all material, for the first cycles loading and last cycles before the final failure
For the first cycles, the state within the weak – spots is similar to the state within the matrix and
the overall material, whereas for the last cycles before final failure, the strain in those spots is
higher because of increasing plastic accumulation and the stress is lower because of the presence
of damage in the weak spots.
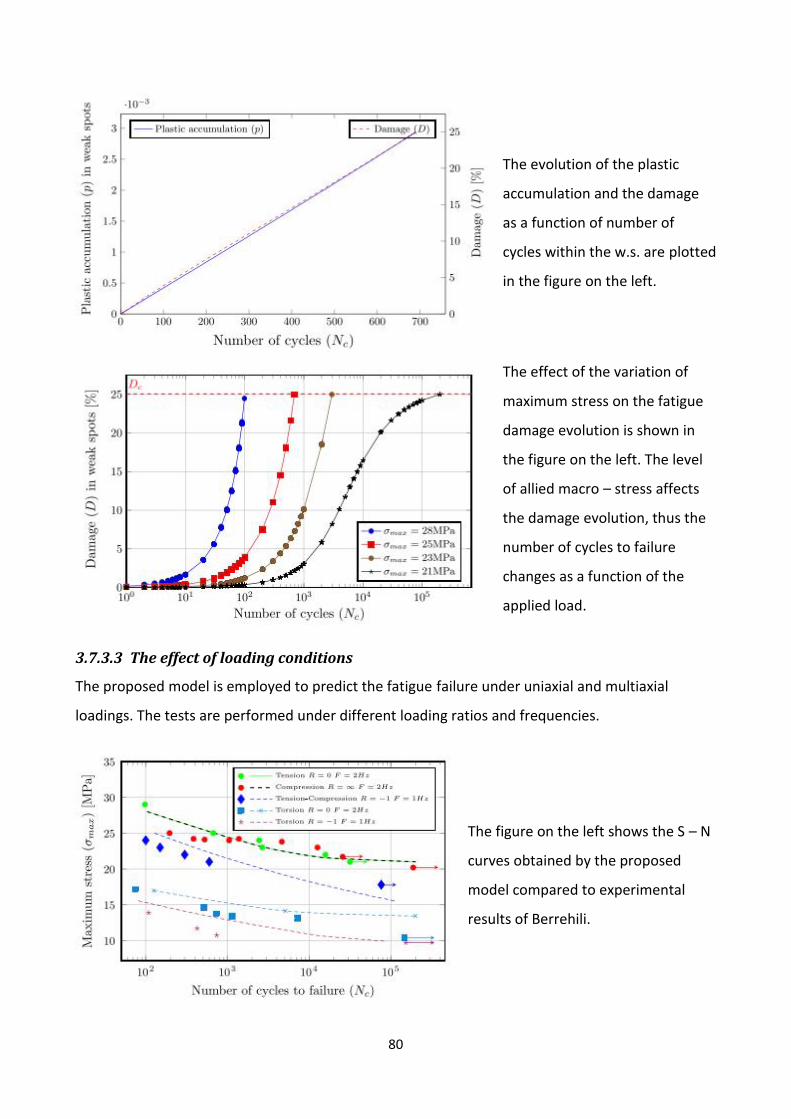
80
The evolution of the plastic
accumulation and the damage
as a function of number of
cycles within the w.s. are plotted
in the figure on the left.
The effect of the variation of
maximum stress on the fatigue
damage evolution is shown in
the figure on the left. The level
of allied macro – stress affects
the damage evolution, thus the
number of cycles to failure
changes as a function of the
applied load.
3.7.3.3 The effect of loading conditions
The proposed model is employed to predict the fatigue failure under uniaxial and multiaxial
loadings. The tests are performed under different loading ratios and frequencies.
The figure on the left shows the S – N
curves obtained by the proposed
model compared to experimental
results of Berrehili.
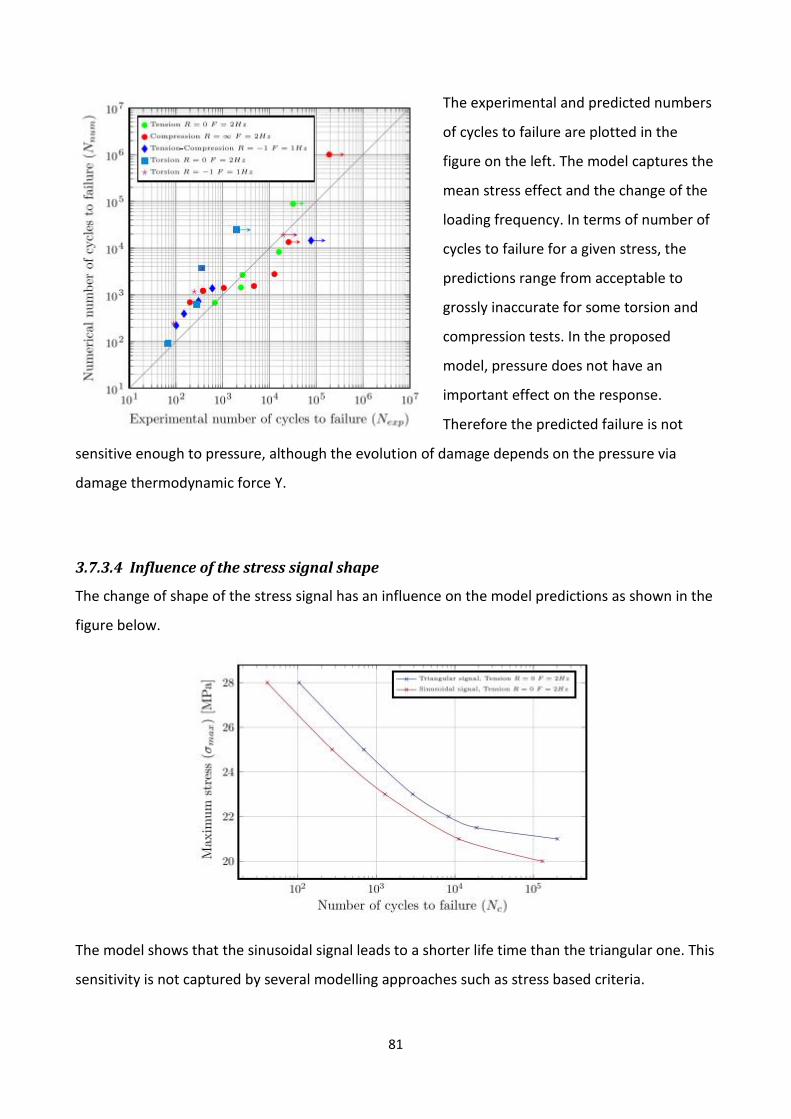
81
The experimental and predicted numbers
of cycles to failure are plotted in the
figure on the left. The model captures the
mean stress effect and the change of the
loading frequency. In terms of number of
cycles to failure for a given stress, the
predictions range from acceptable to
grossly inaccurate for some torsion and
compression tests. In the proposed
model, pressure does not have an
important effect on the response.
Therefore the predicted failure is not
sensitive enough to pressure, although the evolution of damage depends on the pressure via
damage thermodynamic force Y.
3.7.3.4 Influence of the stress signal shape
The change of shape of the stress signal has an influence on the model predictions as shown in the
figure below.
The model shows that the sinusoidal signal leads to a shorter life time than the triangular one. This
sensitivity is not captured by several modelling approaches such as stress based criteria.
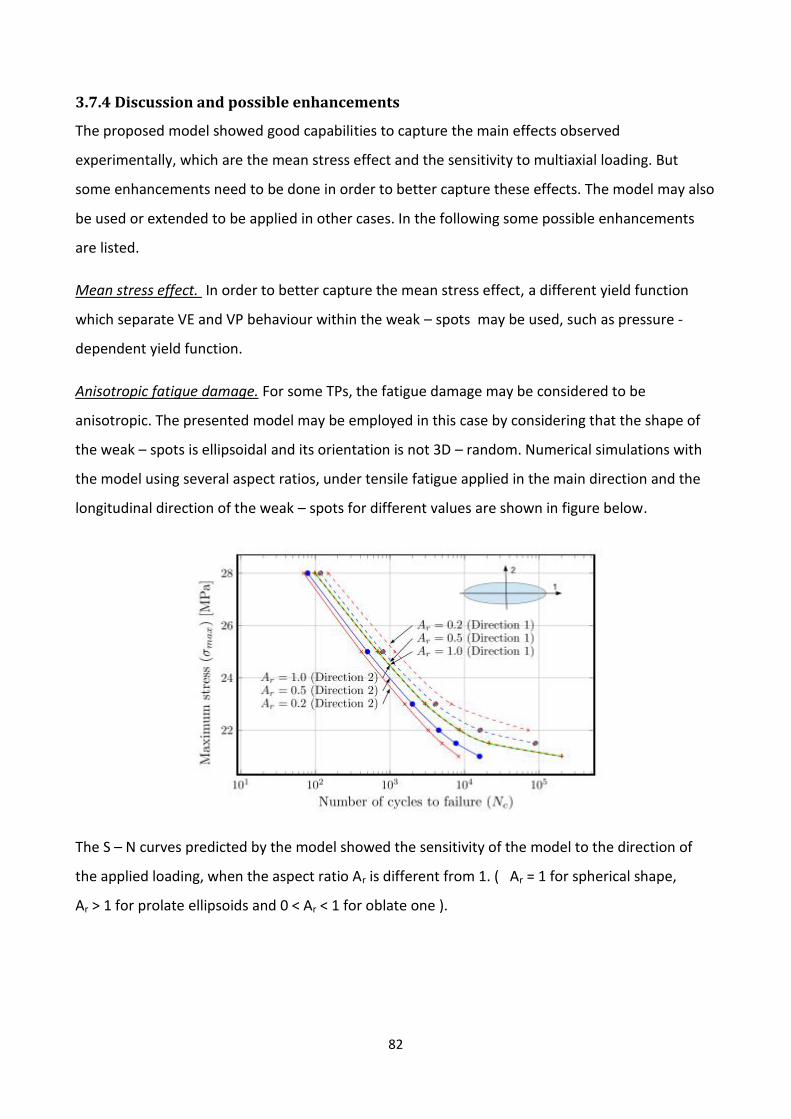
82
3.7.4 Discussion and possible enhancements
The proposed model showed good capabilities to capture the main effects observed
experimentally, which are the mean stress effect and the sensitivity to multiaxial loading. But
some enhancements need to be done in order to better capture these effects. The model may also
be used or extended to be applied in other cases. In the following some possible enhancements
are listed.
Mean stress effect. In order to better capture the mean stress effect, a different yield function
which separate VE and VP behaviour within the weak – spots may be used, such as pressure -
dependent yield function.
Anisotropic fatigue damage. For some TPs, the fatigue damage may be considered to be
anisotropic. The presented model may be employed in this case by considering that the shape of
the weak – spots is ellipsoidal and its orientation is not 3D – random. Numerical simulations with
the model using several aspect ratios, under tensile fatigue applied in the main direction and the
longitudinal direction of the weak – spots for different values are shown in figure below.
The S – N curves predicted by the model showed the sensitivity of the model to the direction of
the applied loading, when the aspect ratio Ar is different from 1. ( Ar = 1 for spherical shape,
Ar > 1 for prolate ellipsoids and 0 < Ar < 1 for oblate one ).
83
3.7.5 Conclusion
Throughout this chapter, two new proposed models which may be classified as crack initiation
based approach were discussed and their originally highlighted. They are based on weak – spots
with VE, VP and damage behaviour and MFH techniques for scale transition.
The proposed model for neat TPs fatigue, was validated experimentally against the results of
fatigue tests carried out on HDPE. Our proposal showed a good capability to capture the main
effects observed experimentally such as the effects of multiaxial loading and sensitivity to the
loading ratio. Possible enhancements were discussed in order to enlarge the field of application of
the proposed model. In addition, it was shown that possible anisotropy of the material fatigue
failure may be taken into account by changing the aspect ratio and the orientation of the weak –
spots.
84
3.8 ON THE STRENGTHENING EFFECT OF INCREASING CYCLING ONFATIGUE BEHAVIOUR OF SOME POLYMERS AND THEIR COMPOSITES
Mohammadreza Eftekhari, Ali Fatemi.
Mechanical, Industrial and Manufactoring Engineering Dept. , the University of Toledo USA.
Article from Internationale Journal of Fatigue
3.8.1 Introduction
Generally, there is a stronger dependence of mechanical properties on time or frequency in
polymers, compared to metals, resulting from the viscoelastic nature of these materials. The strain
rate sensitivity, the time – dependent failure and their creep have been studied carefully, but the
effect of frequency on fatigue behaviour of polymers has been studied far less, in spite of its
important consequence in many applications.
Depending on the mode of loading, stress level, material characteristics and the in – service
temperature, the frequency affects the cyclic behaviour of polymeric materials to various degrees.
Self – heating is the major effect of cycling frequency on fatigue behaviour of polymers, resulting
from viscous energy dissipation and frictional heating. Friction mechanisms between the polymer
chains cause dissipation of a part of the total mechanical strain energy. Part of this dissipated
energy is converted into heat. Due to thermal conductivity of polymers, the cumulated heat from
continuously applied cycles cause thermal damage, in addition to fatigue damage, which can
reduce life dramatically. Different studies in the literature have evaluated self – heating effects on
fatigue behaviour of thermoplastics, including microstructural overview, modelling temperature
rise and estimating cyclic life. At a critical frequency corresponds a unstable temperature rise; this
has been obtained from experimental results and relationship have been suggested to estimate
the critical frequency for a given stress level. Energy – based models based on hysteresis energy
loss and steady state heat conduction have been utilized to calculate temperature rise and
correlate experimental fatigue life data.
Another effect of frequency on fatigue behaviour of some polymers, other than the self – heating,
is known as the beneficial or strengthening effect of frequency. A few studies have considered the
beneficial effect of frequency on the fatigue behaviour in terms of crack initiation aspect by using
85
un – notched specimens. Viscoelastic behaviour was characterized from the results of the
temperature and frequency sweep dynamic mechanical analysis tests. Load – controlled fatigue
tests were conducted at different frequencies at constant stress amplitude levels at different
temperature and stress ratios. Scanning electron microscopy was performed on specimen fracture
surface to study the frequency effect at the microstructural level. Two different fatigue life
estimation models that account for the effect of frequency were applied to the experimental data.
To be able to apply the models to general cases, additional fatigue tests were conducted at
different stress levels at each temperatures and stress ratio.
3.8.2 Literature review on the beneficial effect of increased frequency on fatigue life
It has been observed that, under certain conditions ( type and level of loading, material and
temperature ), fatigue life increases and crack growth rate decreases with increasing frequency.
Shrestha investigated fatigue behaviour of PEEK using fully reversed strain – controlled fatigue
tests at strain amplitudes ranging from 0.02 to 0.04 mm/mm at several frequencies. The beneficial
effect on fatigue life was observed at higher strain amplitude, whereas at a lower strain amplitude
of 0.02 mm/mm a minimal effect was observed. For example, at strain amplitude of 0.03
increasing frequency from 0.5 to 1 Hz caused increase in reversals to failure by a factor of seven,
although temperature rise on the surface of specimen increased from 37 to 66°C.
In several studies, the beneficial effect of increasing frequency have been observed on fatigue
crack propagation ( FCP ) behaviour of polymers. It should be noted that the self – heating for
notched or cracked specimens used for FCP investigations becomes less dominant than for un –
notched specimens due to higher heat dissipation of the highly stressed material volume at the
notch or at the crack tip.
Hertzberg studied the beneficial effect of frequency on the FCP rate of different polymers in the
frequency range of 0.1 – 100 Hz. It was observed that for PMMA, PS and PVC, the fatigue crack
propagation ( FCP ) rate decreased and fatigue resistance significantly improved with increasing
frequency. On the other hand PC, PFS and Nylon 6-6 exhibited a slight worsening of FCP with
increasing frequency. It was concluded that the frequency sensitivity is greatest in those polymers
that shows a high propensity for crazing. Also the beneficial effect of higher frequency was related
to competition between strain rate and creep effect, crack tip blunting because of hysteresis
86
heating, and the role of beta transition in which bending and stretching of primary polymer bonds
lead to increased toughness. A higher frequency and a higher strain rate causes an increase in
modulus and strength. Localized heating due to increased frequency at the crack tip can blunt the
crack tip getting a lower effective intensity factor, thus , decreases FCP rate.
Radon and Culver evaluated effect of frequency on FCP behaviour of PMMA and PC in the
frequency range of 0.1 – 100 Hz and temperature range of -60 to 21 °C. FCP rate of PMMA
decreased continuously with increasing frequency, and the reduction was more at higher
temperatures. The frequency effect was negligible for PC compared to PMMA. It was suggested
that the beneficial effect of frequency was the reduction of loss modulus with increasing test
frequency.
The beneficial effect of frequency on FCP behaviour of PMMA and PE was also reported by
Dumpleton and Bucknall. Crack grown behaviour and failure were also related to the duration of
loading rather than a cycle dependent to load cycling.
Pegoretti and Ricco investigated the effect of frequency on FCP in PP. A dramatic decrease in the
crack growth rate per cycle at any crack length was observed as a result of increasing frequency.
By separating total crack growth rate to fatigue and creep crack growth rates, it was concluded
that for low frequencies ( 0.1 and 1 Hz ) the crack propagation was governed by viscoelastic creep.
However, for high frequency ( 10 Hz ) creep and fatigue crack growth rates became comparable,
making about same contribution to overall crack growth rate.
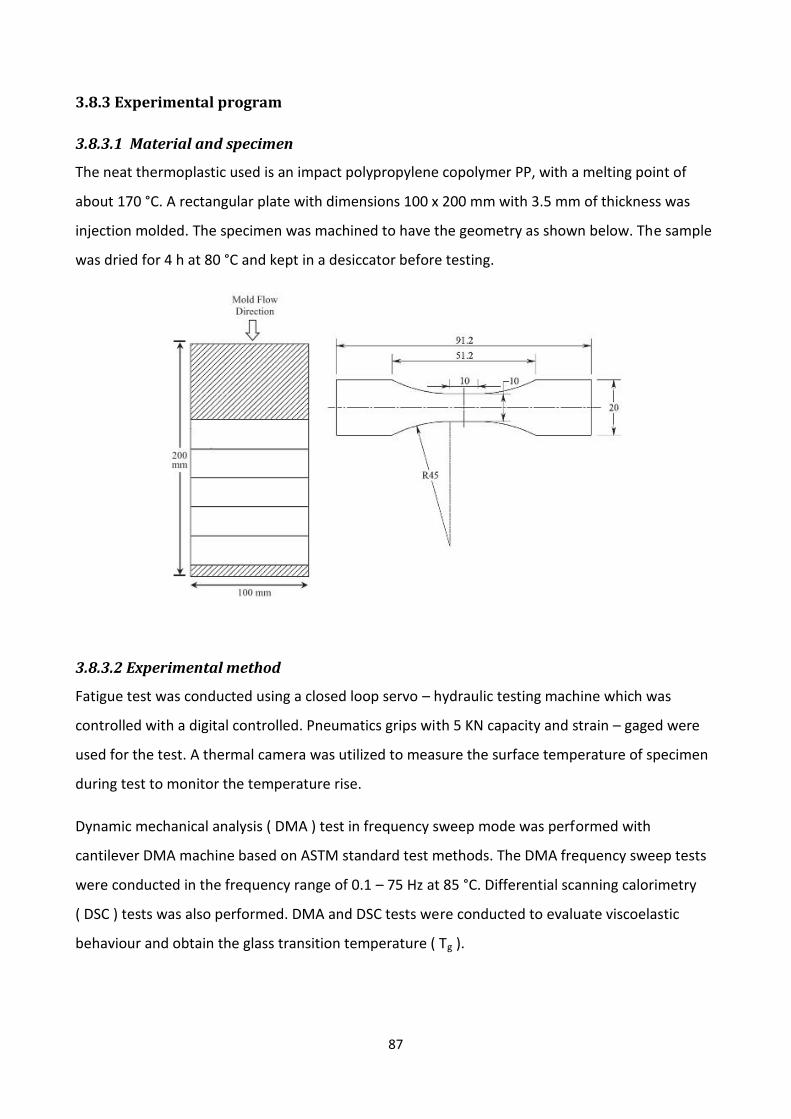
87
3.8.3 Experimental program
3.8.3.1 Material and specimen
The neat thermoplastic used is an impact polypropylene copolymer PP, with a melting point of
about 170 °C. A rectangular plate with dimensions 100 x 200 mm with 3.5 mm of thickness was
injection molded. The specimen was machined to have the geometry as shown below. The sample
was dried for 4 h at 80 °C and kept in a desiccator before testing.
3.8.3.2 Experimental method
Fatigue test was conducted using a closed loop servo – hydraulic testing machine which was
controlled with a digital controlled. Pneumatics grips with 5 KN capacity and strain – gaged were
used for the test. A thermal camera was utilized to measure the surface temperature of specimen
during test to monitor the temperature rise.
Dynamic mechanical analysis ( DMA ) test in frequency sweep mode was performed with
cantilever DMA machine based on ASTM standard test methods. The DMA frequency sweep tests
were conducted in the frequency range of 0.1 – 75 Hz at 85 °C. Differential scanning calorimetry
( DSC ) tests was also performed. DMA and DSC tests were conducted to evaluate viscoelastic
behaviour and obtain the glass transition temperature ( Tg ).
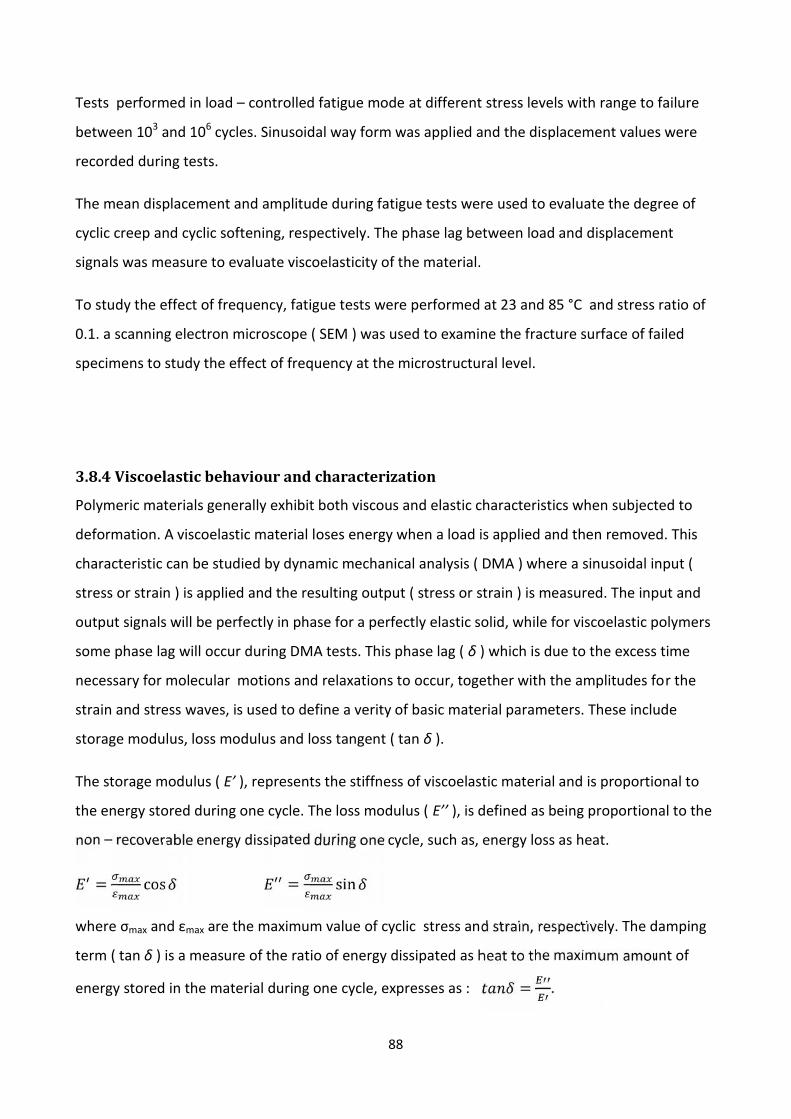
88
Tests performed in load – controlled fatigue mode at different stress levels with range to failure
between 103 and 106 cycles. Sinusoidal way form was applied and the displacement values were
recorded during tests.
The mean displacement and amplitude during fatigue tests were used to evaluate the degree of
cyclic creep and cyclic softening, respectively. The phase lag between load and displacement
signals was measure to evaluate viscoelasticity of the material.
To study the effect of frequency, fatigue tests were performed at 23 and 85 °C and stress ratio of
0.1. a scanning electron microscope ( SEM ) was used to examine the fracture surface of failed
specimens to study the effect of frequency at the microstructural level.
3.8.4 Viscoelastic behaviour and characterization
Polymeric materials generally exhibit both viscous and elastic characteristics when subjected to
deformation. A viscoelastic material loses energy when a load is applied and then removed. This
characteristic can be studied by dynamic mechanical analysis ( DMA ) where a sinusoidal input (
stress or strain ) is applied and the resulting output ( stress or strain ) is measured. The input and
output signals will be perfectly in phase for a perfectly elastic solid, while for viscoelastic polymers
some phase lag will occur during DMA tests. This phase lag ( δ ) which is due to the excess time
necessary for molecular motions and relaxations to occur, together with the amplitudes for the
strain and stress waves, is used to define a verity of basic material parameters. These include
storage modulus, loss modulus and loss tangent ( tan δ ).
The storage modulus ( E’ ), represents the stiffness of viscoelastic material and is proportional to
the energy stored during one cycle. The loss modulus ( E’’ ), is defined as being proportional to the
non – recoverable energy dissipated during one cycle, such as, energy loss as heat.
= cos = sinwhere σmax and εmax are the maximum value of cyclic stress and strain, respectively. The damping
term ( tan δ ) is a measure of the ratio of energy dissipated as heat to the maximum amount of
energy stored in the material during one cycle, expresses as : = .
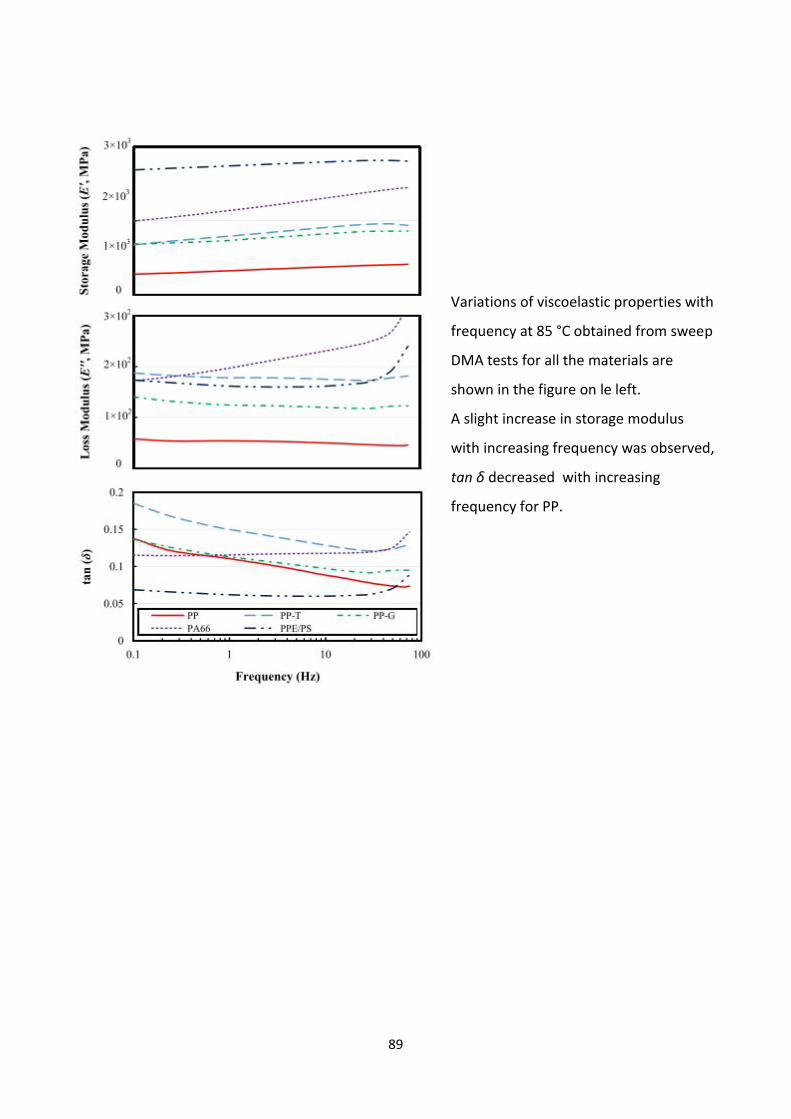
89
Variations of viscoelastic properties with
frequency at 85 °C obtained from sweep
DMA tests for all the materials are
shown in the figure on le left.
A slight increase in storage modulus
with increasing frequency was observed,
tan δ decreased with increasing
frequency for PP.
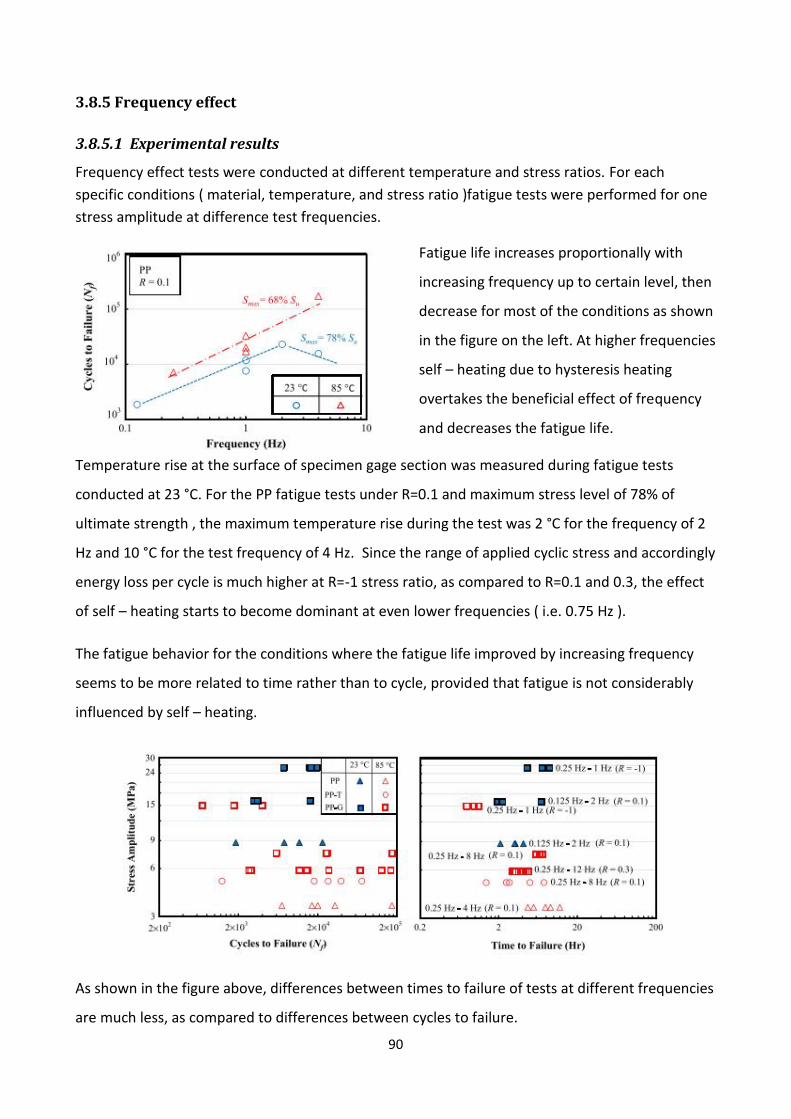
90
3.8.5 Frequency effect
3.8.5.1 Experimental results
Frequency effect tests were conducted at different temperature and stress ratios. For eachspecific conditions ( material, temperature, and stress ratio )fatigue tests were performed for onestress amplitude at difference test frequencies.
Fatigue life increases proportionally with
increasing frequency up to certain level, then
decrease for most of the conditions as shown
in the figure on the left. At higher frequencies
self – heating due to hysteresis heating
overtakes the beneficial effect of frequency
and decreases the fatigue life.
Temperature rise at the surface of specimen gage section was measured during fatigue tests
conducted at 23 °C. For the PP fatigue tests under R=0.1 and maximum stress level of 78% of
ultimate strength , the maximum temperature rise during the test was 2 °C for the frequency of 2
Hz and 10 °C for the test frequency of 4 Hz. Since the range of applied cyclic stress and accordingly
energy loss per cycle is much higher at R=-1 stress ratio, as compared to R=0.1 and 0.3, the effect
of self – heating starts to become dominant at even lower frequencies ( i.e. 0.75 Hz ).
The fatigue behavior for the conditions where the fatigue life improved by increasing frequency
seems to be more related to time rather than to cycle, provided that fatigue is not considerably
influenced by self – heating.
As shown in the figure above, differences between times to failure of tests at different frequencies
are much less, as compared to differences between cycles to failure.
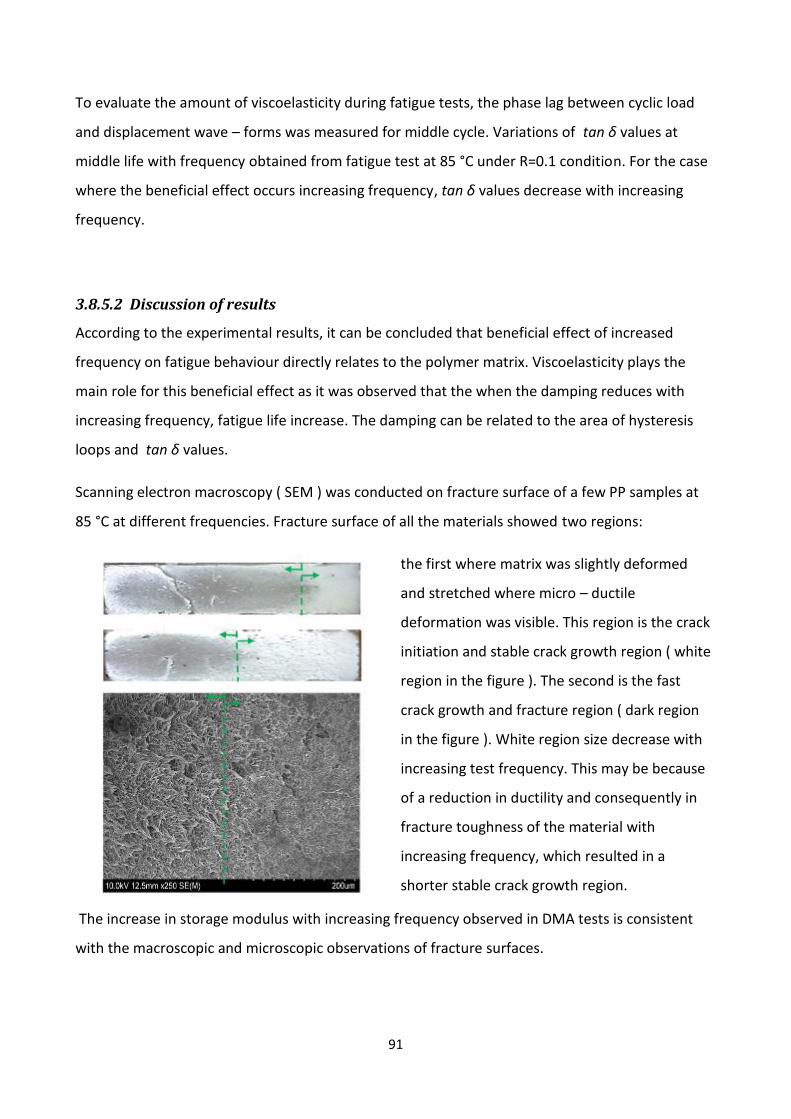
91
To evaluate the amount of viscoelasticity during fatigue tests, the phase lag between cyclic load
and displacement wave – forms was measured for middle cycle. Variations of tan δ values at
middle life with frequency obtained from fatigue test at 85 °C under R=0.1 condition. For the case
where the beneficial effect occurs increasing frequency, tan δ values decrease with increasing
frequency.
3.8.5.2 Discussion of results
According to the experimental results, it can be concluded that beneficial effect of increased
frequency on fatigue behaviour directly relates to the polymer matrix. Viscoelasticity plays the
main role for this beneficial effect as it was observed that the when the damping reduces with
increasing frequency, fatigue life increase. The damping can be related to the area of hysteresis
loops and tan δ values.
Scanning electron macroscopy ( SEM ) was conducted on fracture surface of a few PP samples at
85 °C at different frequencies. Fracture surface of all the materials showed two regions:
the first where matrix was slightly deformed
and stretched where micro – ductile
deformation was visible. This region is the crack
initiation and stable crack growth region ( white
region in the figure ). The second is the fast
crack growth and fracture region ( dark region
in the figure ). White region size decrease with
increasing test frequency. This may be because
of a reduction in ductility and consequently in
fracture toughness of the material with
increasing frequency, which resulted in a
shorter stable crack growth region.
The increase in storage modulus with increasing frequency observed in DMA tests is consistent
with the macroscopic and microscopic observations of fracture surfaces.
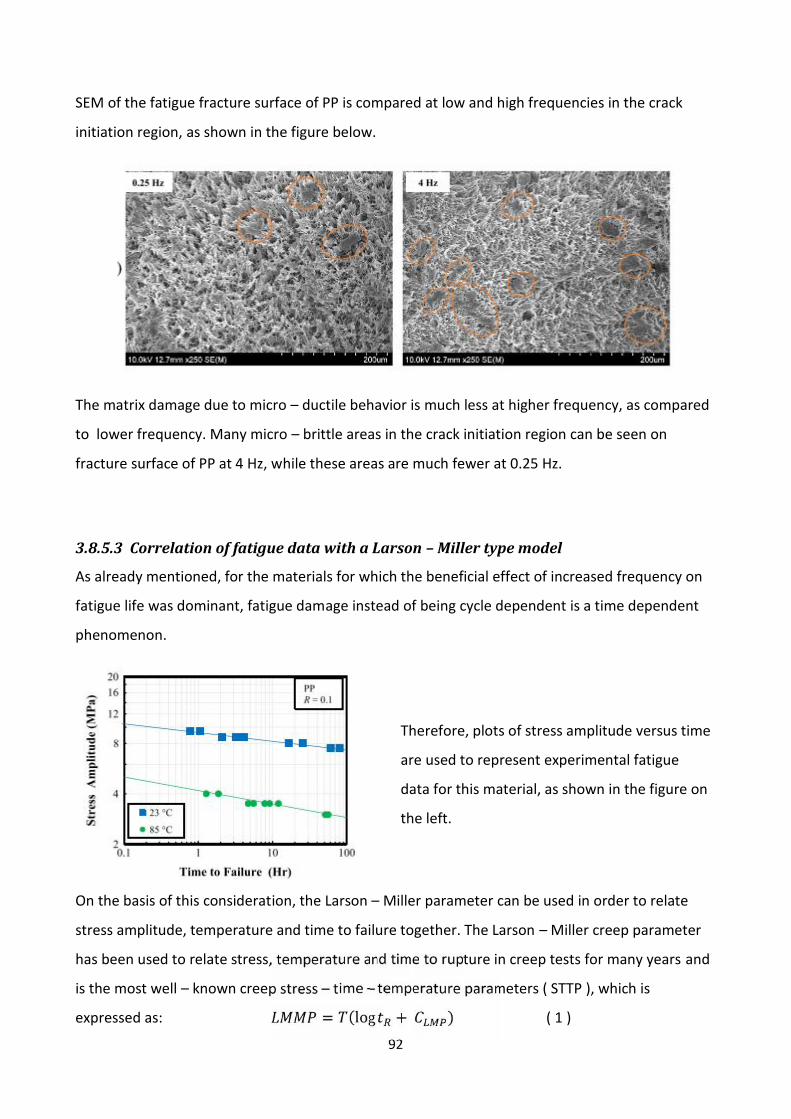
92
SEM of the fatigue fracture surface of PP is compared at low and high frequencies in the crack
initiation region, as shown in the figure below.
The matrix damage due to micro – ductile behavior is much less at higher frequency, as compared
to lower frequency. Many micro – brittle areas in the crack initiation region can be seen on
fracture surface of PP at 4 Hz, while these areas are much fewer at 0.25 Hz.
3.8.5.3 Correlation of fatigue data with a Larson – Miller type model
As already mentioned, for the materials for which the beneficial effect of increased frequency on
fatigue life was dominant, fatigue damage instead of being cycle dependent is a time dependent
phenomenon.
Therefore, plots of stress amplitude versus time
are used to represent experimental fatigue
data for this material, as shown in the figure on
the left.
On the basis of this consideration, the Larson – Miller parameter can be used in order to relate
stress amplitude, temperature and time to failure together. The Larson – Miller creep parameter
has been used to relate stress, temperature and time to rupture in creep tests for many years and
is the most well – known creep stress – time – temperature parameters ( STTP ), which is
expressed as: = (log + ) ( 1 )
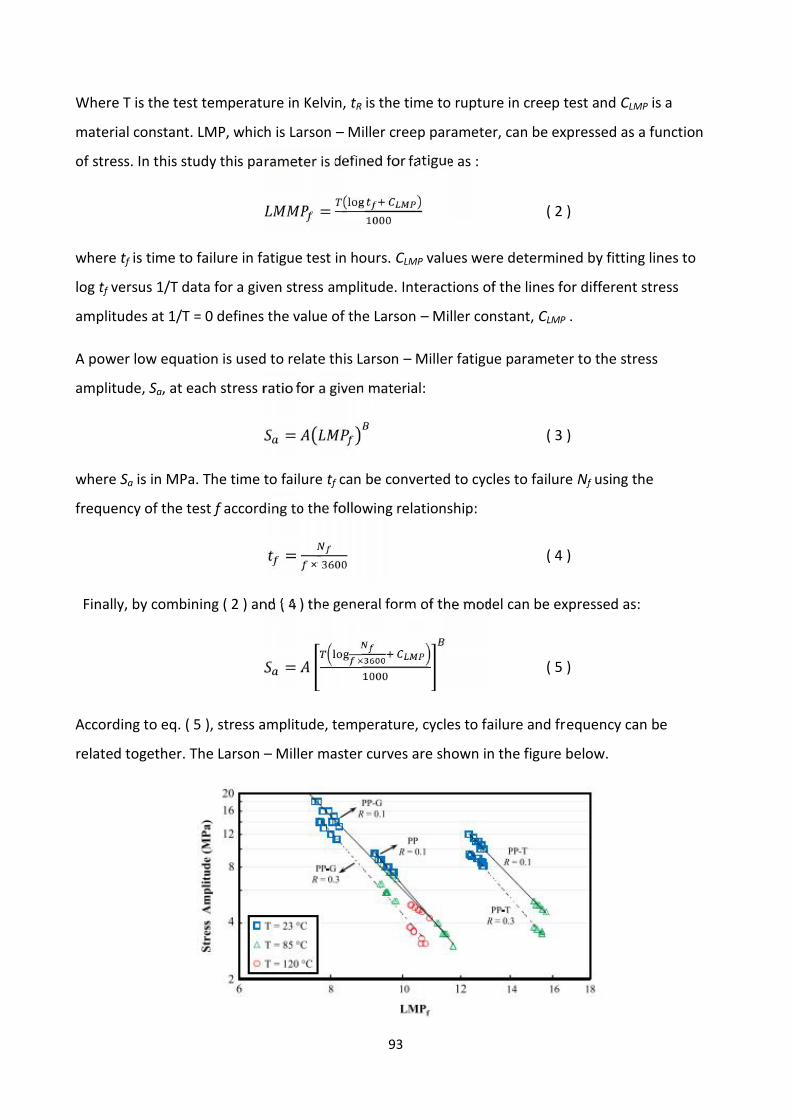
93
Where T is the test temperature in Kelvin, tR is the time to rupture in creep test and CLMP is a
material constant. LMP, which is Larson – Miller creep parameter, can be expressed as a function
of stress. In this study this parameter is defined for fatigue as :
= ( 2 )
where tf is time to failure in fatigue test in hours. CLMP values were determined by fitting lines to
log tf versus 1/T data for a given stress amplitude. Interactions of the lines for different stress
amplitudes at 1/T = 0 defines the value of the Larson – Miller constant, CLMP .
A power low equation is used to relate this Larson – Miller fatigue parameter to the stress
amplitude, Sa, at each stress ratio for a given material:
= ( 3 )
where Sa is in MPa. The time to failure tf can be converted to cycles to failure Nf using the
frequency of the test f according to the following relationship:
= × ( 4 )
Finally, by combining ( 2 ) and ( 4 ) the general form of the model can be expressed as:
= × ( 5 )
According to eq. ( 5 ), stress amplitude, temperature, cycles to failure and frequency can be
related together. The Larson – Miller master curves are shown in the figure below.
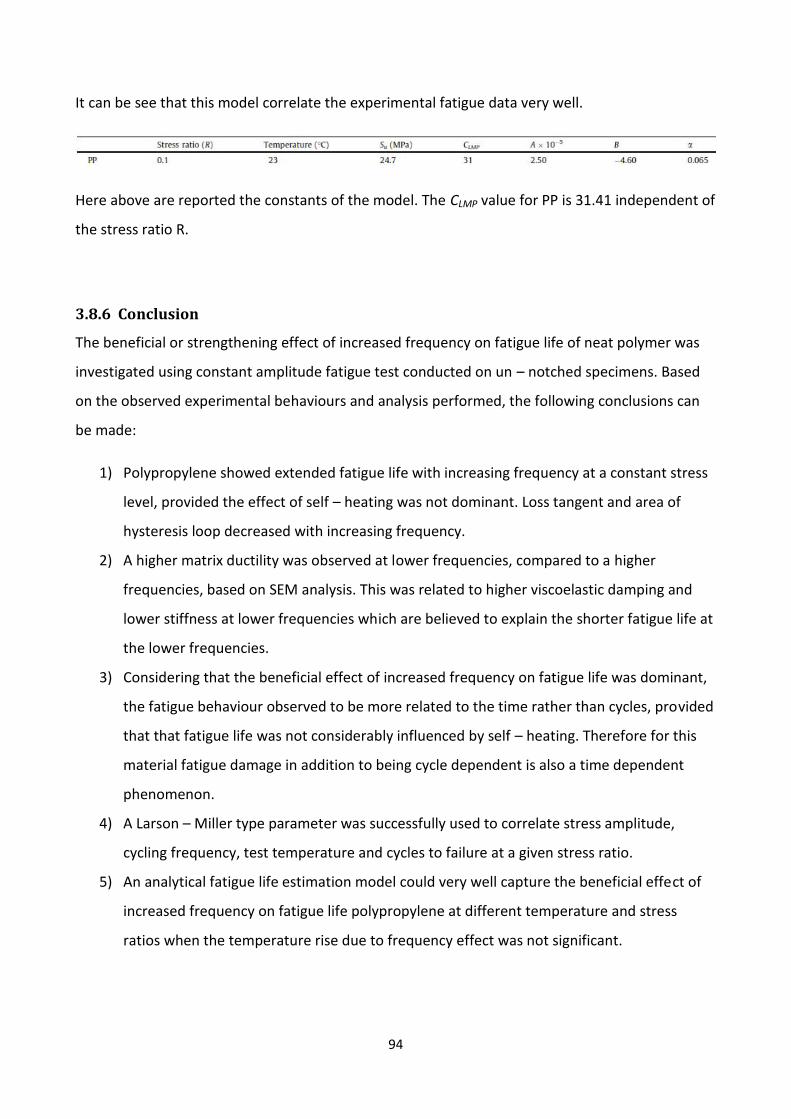
94
It can be see that this model correlate the experimental fatigue data very well.
Here above are reported the constants of the model. The CLMP value for PP is 31.41 independent of
the stress ratio R.
3.8.6 Conclusion
The beneficial or strengthening effect of increased frequency on fatigue life of neat polymer was
investigated using constant amplitude fatigue test conducted on un – notched specimens. Based
on the observed experimental behaviours and analysis performed, the following conclusions can
be made:
1) Polypropylene showed extended fatigue life with increasing frequency at a constant stress
level, provided the effect of self – heating was not dominant. Loss tangent and area of
hysteresis loop decreased with increasing frequency.
2) A higher matrix ductility was observed at lower frequencies, compared to a higher
frequencies, based on SEM analysis. This was related to higher viscoelastic damping and
lower stiffness at lower frequencies which are believed to explain the shorter fatigue life at
the lower frequencies.
3) Considering that the beneficial effect of increased frequency on fatigue life was dominant,
the fatigue behaviour observed to be more related to the time rather than cycles, provided
that that fatigue life was not considerably influenced by self – heating. Therefore for this
material fatigue damage in addition to being cycle dependent is also a time dependent
phenomenon.
4) A Larson – Miller type parameter was successfully used to correlate stress amplitude,
cycling frequency, test temperature and cycles to failure at a given stress ratio.
5) An analytical fatigue life estimation model could very well capture the beneficial effect of
increased frequency on fatigue life polypropylene at different temperature and stress
ratios when the temperature rise due to frequency effect was not significant.
95
4. CONCLUSION
Final considerations were made after analysing scientific articles utilized to write the thesis and
they are listed below:
- Observing causes of failure in these type of materials, the most important seems to be the
temperature rise. The phenomenon called thermal failure is the consequence of this
temperature rise. Boundary conditions trigger the thermal failure during the cycle life.
- Articles reported different tests with different type of no reinforced polymers and loading
conditions. The results of the frequency effect, different stress value, strain control,
different load histories are shown and compared to formulations utilized to predict the
failure. Very helpful consideration regarding differences between tested and predicted
results were made.
- Some authors stated that further tests should be made to get the results obtained
stronger. Few studies of the fatigue behaviour of no reinforce polymers were made so far,
due to little use of these in structural applications compared to reinforced polymers.
- It is very important to point out the large use of these materials in a lot of common
applications. The main thing is to avoid unexpected failure. The large number of
components utilized involves high costs in replacing them in case of failure.

96
97
5. REFERENCES
- R.J. crawfird, P.P. Benham; Dept. of Mech. Engineering , the Queen’s University of Belfast
- R. Shrestha, J. Simsiriwong, N. Shamsaei; Center of vehicular system, Mississipi state
University ( USA ) – Dept. of Mech. Engineer Auburn University ( USA ).
- D. Serban, L. Marsavina, N. Modler . FFEMS Fatigue & Fracture Engineering Materials &structures
- Mechanics and strength of materials dept. , University of Timisoara, Timisoara, Romania
Kunststofftechnik, Dresden University of Technology, Dresden, Germany
- A. Berrehili, S. Castagnet, Y. Nadot. FFEMS Fatigue & Fracture Engineering Materials &structures UMR CNRS – ENSMA University of Poitiers, France
- Mohammadreza E, Ali F. Mechanical, Industrial and Manufactoring Engineering Dept. , the
University of Toledo USA.
- A. Krairi, I. Dogri, G. Robert; University of Louvain Belgium, Solvay Engineering Plastics
Saint Fons France
- Mohammadreza Eftekhari, Ali Fatemi, Mechanical, Industrial and Manufactoring
Engineering Dept. , the University of Toledo USA.

98

99
SPECIAL TANKS
I want to dedicate this thesis to my family, my wife Giulia, my daughter Arianna, my parents
Teresa and Michele, my brother Diego and my in - laws. I always received a big support in these
years during this long and hard student path.
Special thanks for the support that I received during preparation of this work is dedicated to
Professor Mauro Ricotta, who was at disposal during the entire period of the thesis.
Further thanks is for Eng. Pier Luigi De Pol who inspired me at the very beginning of my student
career.


![universita' degli studi di padova - [email protected] - Universit](https://img.pdfslide.us/doc/110x75/620619ec8c2f7b1730049ab8/universita-degli-studi-di-padova-emailprotected-universit.jpg)