Embed Size (px)
Citation preview

I
UNIVERSITÀ DEGLI STUDI DI MILANO
Agriculture, Environment and Bioenergy
(code: R10)
Department of Agricultural and Environmental Sciences Production,
Landscape, Agroenergy (DISAA)
XXX cycle
FRUIT FLESH IN PEACH:
characterization of the 'slow softening' texture
Disciplinary sectors: AGR/03, AGR/07
Angelo Ciacciulli
R10941
Supervisor: Prof. Daniele Bassi
Co-supervisor: Prof. Laura Rossini
PhD School Coordinator: Prof. Daniele Bassi
2016-2017

II
Table of Contents
1 GENERAL ABSTRACT 1
2 INTRODUCTION 3
2.1 THE TEXTURE: A SENSORY PROPERTY 3
2.2 THE TEXTURE GOLD STANDARD ANALYSIS 4
2.3 OBJECTIVE ANALYSES 5
2.4 THE TEXTURE IN FRUIT 6
2.5 PEACH: TAXONOMY AND BOTANICAL OVERVIEW 6
3 IDENTIFICATION OF A MELTING TYPE VARIANT AMONG PEACH (P.
PERSICA L. BATSCH) FRUIT TEXTURES BY A DIGITAL PENETROMETER 14
3.1 ABSTRACT 14
3.2 INTRODUCTION 15
3.3 MATERIALS AND METHODS 16
3.4 RESULTS 20
3.5 DISCUSSION AND CONCLUSIONS 24
3.6 SUPPLEMENTAL MATERIALS AND TABLES 27
4 GENETIC ANALYSIS OF THE SLOW SOFTENING TRAIT IN PEACH 33
4.1 ABSTRACT 33
4.2 INTRODUCTION 33
4.3 MATERIALS AND METHODS 35
4.4 RESULTS 39
4.5 DISCUSSION 51
4.6 CONCLUSIONS 52
5 GENERAL CONCLUSIONS 62
6 REFERENCES 63

III


1
1 General abstract 1
The aim of this research was to deepen the knowledge about the slow softening texture in peach. 2
The texture is a synthesis of several parameters detected by senses, derived from the food 3
structure. The paramount sense in the texture perception is the tactile one, principally perceived 4
by hand and mouth. The tactile perception is a combination of four classes of mechanoreceptors, 5
each one specialized to perceive mechanic deformation with different speed. This combined 6
perception influences the consumer evaluation of food quality, giving the texture importance 7
among food characteristics. The texture could also affect the taste perception through mechanical 8
actions on food structure. The mechanical property linked to the texture is associated with the 9
cellular organization and the cell wall strength. The main cell wall component affecting texture in 10
fresh fruit is pectin, a polymer of galacturonic acid. The disassembly of pectin involves several 11
enzymatic and non-enzymatic activities acting directly in pectin cleavage or indirectly disrupting 12
non-covalent interactions. The gold standard of texture analyses is the sensorial one, however 13
several issues make sensorial analyses inapplicable to breeding programs to select plant with 14
improved fruit texture. Several efforts were made to achieve instrumental analyses capable of 15
substitute humans in texture analyses. To mimic the tactile sense, a discipline studying the material 16
response to an applied force, the rheology, is applied. The easiest instrumental measure of rheology 17
parameters is the penetrometer test, diffused to measure the firmness, but exploitable to collect the 18
Young’s modulus and the slope of yield stress represented respectively elasticity and fracturability. 19
In peach, so far at least four textures were described, melting (M), stony hard (SH), non-20
melting (NM) and slow softening (SS). Prior to this work, no reliable objective nor fast tool were 21
available to phenotype and select the SS trait in peach germplasm. The only reliable approach was 22
a sensorial assessment done by a texture-trained panel, requiring repeated and time-consuming 23
assessment. An objective, instrumental method, was set up by processing the data of a digital 24
penetrometer test. The penetrometer itself, as reported in paragraph 2, does not support the ability 25
to discriminate among the different texture types, as already reported in other works. In addition, 26
this method appears to be affected by the fruit ripening season, since the early-ripening accessions 27
tend to show faster loss of firmness, while the late-ripening exhibit a slower firmness loss. 28
Using the data collected in our experiment, the texture dynamic (TD) model was developed from 29
the observation of differences in the rheogram shape due to the elasticity and fracturability 30
parameters. The TD model, that excludes the firmness effect on the fracturability and elasticity 31
parameters, was thus developed, after testing it on 20 accessions in three years, allowing for 32
2
reliable discrimination between SS and M phenotype. Differences in the TD were also found when 33
comparing M vs SH and M vs NM textures. In particular, when comparing M and SS, TD value 34
is explained for the 96% from the texture. 35
The developed method was then applied (together with sensorial evaluation) to genetically dissect 36
the SS trait. Association and QTL mapping approaches were combined by analyzing a germplasm 37
panel and a biparental progeny, and a single locus at the end of chromosome 8 was identified. 38
RNA-seq analysis of 2 SS and 2 M accessions suggested some common features with the SH type 39
described in literature. In both texture types a lower auxin response was found when compared to 40
the M type. This agrees with the already known activity of auxin in the modulation of cell wall 41
rearrangement and expansion. Therefore, slower softening could be associated to slower cell wall 42
rearrangement. In future, comparison of auxin content in slow softening and melting type peaches 43
might provide further insight into the validity of this hypothesis. In detail, by RNA-seq comparing 44
M and SS a total of 64 differentially expressed genes were found in the genomic region harboring 45
the SS locus. Out of these 64 genes, 16 are uncharacterized, while among the characterized ones, 46
4 are putatively involved in auxin response based on peach genome annotation. Analysis of 47
polymorphisms in these 4 DEGs based on resequencing data of the ‘Max10’ and ‘Rebus 028’ 48
parents of biparental population did not uncover any variants in agreement with the observed 49
segregation. Analyzing 2kb gene models flanking regions, 16 genes were associated with 50
polymorphisms outside the coding sequence: the possible regulatory effects of such variants 51
require further evaluation by expression analyses. 52
In summary, the major results are the setup of a reliable tool to score objectively the SS texture 53
and the detection of a major locus and his dominant mendelian inheritance. However, NGS and 54
RNA-seq approaches are presented as a speculative data only, because they are not supported by 55
hormones content in fruit, and the large locus detected did not allow indication of a putative 56
variant. 57
These results will: a) give impetus in exploring SS genetic and physiology; b) support the design 58
of future crosses and experiments; c) increase marker density in the locus; d) point out the possible 59
central role of auxin (to validate the hypothesis of a similarity between SS and SH physiology); e) 60
allow texture assessment of improved cultivars; and f) allow phenotyping of segregating progenies 61
to develop molecular markers associated with the SS trait. 62
63
64

3
2 INTRODUCTION 65
66
2.1 The texture: a sensory property 67
A pioneer in food texture science and founding editor of the Journal of Texture Studies, 68
Alina Szczesniak states [1] that “texture is the sensory and functional manifestation of the 69
structural, mechanical and surface properties of foods detected through the senses of vision, 70
hearing, touch and kinesthetics”. She then postulated the following axioms: 71
a. “texture is a sensory property” which can only be perceived and described by humans and any 72
instrumental measurements must be related to sensory responses. 73
b. “texture is a multi-parameter attribute.” 74
c. “texture derives from the structure of the food.” 75
d. “texture is detected by several senses.” 76
Tactile texture can be divided into oral–tactile texture, mouth feel characteristics, phase changes 77
in the oral cavity, and the tactile texture perceived when manipulating an object by hand (often 78
used for fabric or paper and called “hand”) or with utensils [2]. However, the tactile sense is 79
perceived in humans at least from four different mechanoreceptors specialized on different 80
deformation frequencies, the fast-adapting type I, the slowly-adapting type I, the fast-adapting type 81
II and the slowly-adapting type II, involved in the perception of deformation with 5-50 Hz 82
frequency, deformation with frequency lower than 5Hz, vibration of 40-400 Hz and the sensation 83
of static force, respectively [3]. 84
Texture is one of the most appreciated characteristics of food [4], enhancing or reducing flavor 85
perception [5]. Experiments showed that foods are less recognizable after changes in texture, so 86
the combination of taste and texture is considered a fingerprint of food in particular flavorless food 87
like cucumber which are unrecognizable when blended [2]. 88
Several experiments conducted in simplified models as artificial matrices [5,6], showed distinct 89
phenomena modulating the perception of savors [7] by physical immobilization, increasing the 90
contact area or the ability to change the releasing rate of aromas [5], juice and tasting molecules, 91
affecting the biting time [8] and the receptor binding of the tasty molecules [9]. 92
Regarding the relationship between texture and food structure, the basic structure of food is a 93
carbon skeleton: commonly in fruit and vegetables a major component is represented by plant cell 94
walls consisting of carbohydrates arranged in long and branched structures, called 95
polysaccharides, interacting with other organic molecules and ions. Plant cell walls link together 96
adjacent cells creating tissues and organs [4,10]. Considering edible fruits, non-lignified 97

4
parenchymatous cells are joined together by the middle lamella, composed mainly by pectin. 98
Pectin is a polymer of galacturonic acid, branched with sundry substituents as sugars, probably the 99
most complex macromolecule in nature [10]. Pectin plays a major role in texture perception [11] 100
and its degradation is associated to changes in texture [12]. The pectin degradation pathway 101
involves several enzymatic activities [13]. Polygalacturonase enzymes hydrolyze the poly 102
galacturonic acid (pectin), cleaving the alpha-1,4 glycosidic bonds between galacturonic acid 103
residues: exo-polygalacturonases cut molecules from the end, releasing galacturonic acid 104
monomers, while endo-polygalacturonases cut the molecule randomly producing pectin 105
fragments, i.e. oligogalacturonides. Pectin methylesterase catalyzes the demethoxylation of pectin, 106
changing water affinity. Polygalacturonic transeliminase catalyzes an eliminative cleavage of (1-107
>4)-alpha-D-galacturonan to give oligosaccharides with 4-deoxy-alpha-D-galact-4-enuronosyl 108
groups at their non-reducing ends [14]. As recently demonstrated in tomato using genetic 109
engineering approach, a bottleneck in pectin disassembly could be represented by the ability of the 110
enzymes to move across extra-cellular matrix. The relaxation of extra-cellular matrix increasing 111
the accessibility to the pectin matrix, a big part in relaxation is done by expansins disrupting non 112
covalent interactions [15–18]. 113
2.2 The gold standard for texture analysis 114
Since texture is defined as a sensory property that can be perceived and described only by 115
humans, physical parameters detected and quantified by so-called texture testing instruments must 116
be interpreted in terms of sensory perception [1,19]. For these reasons, sensorial analysis is the 117
gold standard for texture studies. Sensory evaluation comprises a set of techniques for accurate 118
measurement of human responses to foods and minimizes the potential bias effects of brand 119
identity and other information influencing consumer perception [2]. 120
Advanced protocols to describe different textures in food have been already published [6,20]. The 121
use of humans as sensors involves several human abilities [1], tactile, acoustic and chemical 122
perception, capacity to elaborate sensations from previous experience, communication capacity 123
[19], known vocabulary (lexicon) and native language (compared to Americans, Japanese could 124
use five times more words to describe the same textural property of foods) [2]. Each human ability 125
involved in sensorial analysis may be a bottleneck for an objective and reproducible analysis 126
[21].Other limits of sensory analysis could be to find standard foods, well trained panelists, 127
homogeneity of the panelist age, culture and ethnicity [20,22]. Usually this time-consuming 128
approach is inapplicable to breeding programs where a relatively large number of samples need to 129
be assessed each day [23]. 130

5
2.3 Objective analyses 131
Different scientific approaches have been applied to develop objective analyses to better 132
understand texture, including: rheology [24–26], tribology [27] and acoustic-vibrational 133
approaches [28,29], that are based on disciplines studying mechanical properties of matter; 134
chemistry to study matter chemical composition [18]; optical approaches based on microscopy to 135
visualize structural differences among samples with different textures [30]; and spectrophotometry 136
to study optical properties of the material [31,32]. 137
2.3.1 Mechanical properties 138
Different mechanical approaches intending to imitate the human tactile sense have been proposed 139
to characterize food texture. 140
2.3.1.1 Rheology 141
Food rheology is the study of the manner in which food materials respond to an applied stress or 142
strain [26]. Instrumental methods have been classified into three main categories: empirical, 143
imitative and fundamental [28]. Among the empirical ones, the most used is the Penetrometer Test 144
[22,24]. 145
2.3.1.1.1 Penetrometer test 146
Penetrometer test is the easiest test to record a stress-strain curve [24]. The stress-strain curve of a 147
material (where the stress is the compressive loading and the strain is the amount of deformation), 148
is the relationship between the stress and strain recorded during the penetrometer test. The 149
graphical representation of stress-strain curves is the rheogram, that is specific for each material 150
and related with its mechanical properties [33]. Penetrometer test is usually performed at constant 151
speed where the force is recorded [21]. Several plungers have been tested and adopted [34]: in the 152
horticultural field the most used has a cylindrical shape with a flat head [22]. The test involves the 153
compression force, applied by the central part of the plunger, and the shear force exercised by the 154
edge of the plunger [35]. 155
The most used mechanical parameter is the upper yield point (pag.18 Figure 2) that represents the 156
firmness [2], one of the main maturity indices of fruits [36]. Other parameters that can be obtained 157
are the Young’s modulus that represents the elasticity, and the Slope of Yield Stress after the upper 158
yield point, that represents the fracturability [37]. 159
160

6
161
2.4 The texture in fruit 162
Texture is one of the main fruit quality attribute, influencing consumers degree of liking 163
and marketability. All these aspects are well-described in several recent reviews [28,34,38]. 164
In the horticulture field, the term “texture” has acquired a specific meaning, departing to 165
some extent from its meaning in the food engineering field [34]. In contrast to the extemporary 166
description of food texture used by food engineers, horticulturists define different texture types 167
referring to the evolution of fruit structure-related characteristics during ripening or storage. This 168
implies that fruit texture is somehow described as a dynamic concept linked to firmness evolution 169
[38]. 170
2.4.1 Fruit texture, improvement of consistency and shelf-life 171
The availability of fruits with satisfactory quality for fresh market requires the adoption of 172
different solutions [39–41]. Most important examples are represented by the extension of the 173
harvest season using cultivars with different ripening dates, combined with cultivation at different 174
latitude and/or altitude; by the improving of storage technologies to preserve and control fruit 175
texture (controlled temperature, atmosphere and light conditions); improving the maintenance of 176
fruit consistency ( reported in the sensory analysis vocabulary ISO 5492:2008, as "mechanical 177
attribute detected by stimulation of the tactile or visual receptors" ) during storage, for example by 178
tapping into a wide genetic diversity pool and combining texture type variants. Interesting, most 179
of these variants were often discarded in the past, when the consumer trends and distribution chains 180
were different [39,42]. 181
2.5 Peach: Taxonomy and Botanical Overview 182
The domesticated peach (Prunus persica [L.] Batsch; synonym: Amygdalus persica) is a member 183
of the Rosaceae family in the subgenus Amygdalus within the section Euamygdalus .P.persica is 184
a self-compatible entomophilous species, with a small diploid genome (220Mb, 2n=16) almost 185
twice the size of the Arabidopsis one [43]. The genus Prunus is a monophyletic group, which 186
consists of ten subgenera and more than 200 species having certain morphological traits in 187
common. They are deciduous shrubs and trees with simple leaves and glands at the base of a blade 188
or at the top of the petiole. The inflorescence shows large variation among the groups but as 189
common trait it has a calyx with a bell-shaped tube, inserted at the throat of flower [44]. 190
7
Linné (1758) first named the species (Amygdaluspersica) with the specific epithet persica based 191
on the opinion that the fruit was native to Persia (present day Iran) due to its widespread cultivation 192
in this putative country of origin. 193
Written records and archaeological evidences discovered [45] between the 19th and the 20th century 194
showed that the origin of peach domestication was the region of Northwest China between the 195
Tarim Basin and the north slopes of the Kunlun Shan mountains, at least as far back as 3000 BC. 196
More recent archaeological studies [46] (based on discovery of peach stones preserved in 197
waterlogged context in the Zhejiang province) propose that the lower Yangzi River valley, in the 198
East of China, was the region of early peach selection from the wild P. persica ancestor, in a 199
process that began at least 7500 years ago and took over three millennia. This could help to explain 200
the presence of peach in Japan around 2500 BC [45]. According to these data, the westward 201
movement of peach could have brought it into Persia around the second century BC, by crossing 202
the entire China in 3000 years. 203
Prunus is from the Latin for plums. Peaches were acquired by the Romans, probably along the 204
Silk Road in the beginning of the Christian era, which had given rise to the European supposition 205
that the fruit had originated in Persia. The fruit tree was introduced in Italy during the 1st century 206
AD; soon it reached France, which became a second center of diversification of this species after 207
China. 208
209

8
2.5.1 Macroeconomic Relevance 210
Globalization, decrease in transportation costs, rising incomes and technological 211
improvements, in addition to development and evolution of commercial trades, have led to an 212
enhancement of the global exchange of vegetables and fruits. 213
Peach has a prominent role in the global fruit farming production and is the most important in the 214
genus Prunus [47]. 215
216
Figure 1 Production and export quantity (in millions of tons) of top five peach producer in the world (FAOSTAT 2013) 217
The global production of peaches is estimated around 21,6 million tons, which corresponds to 218
3,21% of the entire global fruit production, with a growth rate that has increased by approximately 219
3.93% every year since 2000 [48]. Worldwide, Italy is the third producer of peaches after China 220
and Spain, producing 1.4 million tons of fresh fruit every year ( Figure 1). Italy is also one of the 221
major exporters (with Spain as leader), with almost a 300k tons exported in 2013 corresponding 222
to an economic value of more than 363 million dollars [49]. 223
2.5.2 Morphology 224
2.5.2.1 Growth Habit 225
Peach is a deciduous medium-high tree with a smooth and straight trunk and a dark grey 226
bark. It can reach 4-8 m, depending on internode length [42]. The growth habit is characterized by 227
the angle of insertion of the branches and the length of the internodes, which define the appearance 228
of the tree canopy. 229
Buds are present at the base of leaves. Each node shows commonly two lateral flower buds and 230
one vegetative bud in the middle [42]. One-year-old shoots have flower buds on their axis and one 231
vegetative bud at the apex [42]. Fruit weight is positively correlated to the vigor of the shoot and 232
0
2
4
6
8
10
12
14
China Spain Italy Greece United States ofAmerica
Mill
ion
To
nn
es
Export Quantity Production
9
also depends on the season. For this reason, the production of fresh fruit needs a vigorous shoot, 233
up to 100 cm in length. The production of canning fruit, instead, benefits from a weak shoot, 10-234
25 cm long [42] because the small fruit are more suitable for canning. Side shoots arising from a 235
bud formed in the same year are called a “feather” [50]. 236
2.5.2.2 Leaf 237
In peach, leaves are formed right after anthesis and present two temporary stipules at the 238
base of the petiole [42]. The adaxial surface of the leaves is darker than the abaxial one, and the 239
color of the veins is associated with the color of the flesh of the fruit: pale yellow in the yellow 240
flesh fruit and pale green in the white flesh fruit. The margin can be smooth or crenate. There are 241
usually a variable number of secreting glands near the bottom of the leaf margins. Their shape can 242
be globose or reniform. They are absent in plants that are homozygous recessive for this trait [42]. 243
2.5.2.3 Flower 244
Peach has hermaphroditic and perigynous flowers. The gamosepalous calix falls after the 245
initial swelling of the fruitlet. Petals, normally five, are separated and two kinds of corolla are 246
known: showy, with large rose-shaped petals, or non-showy, with bell-shaped smaller petals. This 247
second shape is the dominant trait [51]. Petal color varies from white to dark red, but the most 248
common is a shade of pink. The gynoecium is superior. The receptacle contains as many as 20 or 249
30 stamens and it carries reddish anthers, unless they are sterile: in this case, they look pale yellow; 250
this is a monogenic recessive trait [42]. 251
2.5.2.4 Phenological Stages 252
The time of flowering depends on the chilling units (see below) necessary to overcome 253
endo-dormancy, and later, on the amount of “growing degree-hours” (GDH) required to reach a 254
full blossom. The chilling requirement is the minimum period of cold below a certain threshold 255
temperature that a flower needs to complete its morphological development. It is expressed in 256
chilling units (CU), a measure of the exposure of plants to chilling temperature (latter depends on 257
the adopted model) [52].The heat requirement is analogous to the chilling requirement: the flower 258
needs an amount of heat to achieve organ development after endo-dormancy is fulfilled. Heat is 259
the main driver of bloom timing [53][54].In winter, at the end of the dormancy period, 260
microsporogenesis takes place: two 2-nucleated pollen grains, contained into the pollen sac, are 261
generated from the microsporocytes [55]. A light brown color covers the swelling bud during 262
meiotic division of the megasporocyte that leads to a tetrad of megaspores. Three of them 263
ordinarily disintegrate, and the fourth one develops into an embryo sac. Following subsequent 264

10
nuclear divisions, the embryo sac contains eight nuclei, one of which becomes the female gamete; 265
this usually happens a few days before full anthesis [53]. 266
The ovary contains two ovules, but only one will be fertilized; the development of the ovary is 267
conventionally divided into four phenological stages: cellular division (SI), pit hardening (SII), 268
cell elongation and enlargement (SIII) and, finally, fruit ripening (SIV) [56]. 269
The fruit development period may range from 55-60 to more than 220 days and is under polygenic 270
control. A major locus for maturity date was located on chromosome 4 and associated to a variant 271
in a NAC transcription factor gene [57]. 272
2.5.2.5 Fruit 273
The peach drupe can have a globose, elongated or flat shape [58]. The weight can vary 274
from 50g, up to 700g, depending on cultivars and agronomical management. The epicarp is thin 275
and can be adherent to the flesh depending also on mesocarp texture. The skin can be pubescent 276
or glabrous in the case of “nectarines”, a mutation that occurred in China and has been imported 277
in Europe in the XIV century [59–61]. 278
Fruits are classified as climacteric or non-climacteric by the ability to increase respiration rate and 279
ethylene production at the onset of ripening. The ethylene is a hormone synthesized in the plant 280
from the amino acid methionine, by three enzymatic steps involving in order three enzymes: The 281
S-adenosyl-L-methionine (SAM); 1-aminocyclopropane-1-carboxylic (ACC) acid synthase 282
(ACS); and ACC oxidase (ACO). Several ACS and ACO genes are present in plant genomes [62]. 283
The expression of these genes could be regulated by two different systems one autoinhibitory (in 284
presence of exogenous ethylene the endogenous one decrease) and one autocatalytic (presence of 285
exogenous ethylene induces endogenous ethylene production). The first (System 1) is induced in 286
the normal plant development and in response to stress (such as cold), the second (System 2) plays 287
a role in organ senescence and fruit ripening [62]. Peaches are described as climacteric fruit that 288
ripe with a biphasic behavior, a first phase of slow flesh softening followed by a rapid decrease of 289
firmness. The shift to a rapid loss of firmness is marked by a climacteric peak, with high ethylene 290
production regulated by System 2 [63]. Notably, peach germplasm is characterized by the presence 291
of non-climacteric accessions, such as the stony hard cultivars [64], unable to produce ethylene 292
but reaching a sufficient degree of palatability. 293
294

11
2.5.2.6 Endocarp and Seed 295
The endocarp is lignified (in certain cultivars lignification can be so limited that the fruit 296
is completely edible [42]) and shows a more or less furrowed surface. The suture presents a ridge 297
and a pointed tip at the apex. The endocarp splitting trait (which is not a desirable trait) is believed 298
to occur when a rapid mesocarp expansion leads to the splitting at the carpel suture or the shattering 299
of the rigid endocarp. It is also associated to those agronomical practices that lead to a faster 300
expansion of the mesocarp. In almonds (P. dulcis) the trait is associated to the presence of a site 301
of a secondary ovule abortion [65]. Flesh and stone may adhere to each other or be separated. This 302
trait seems to be controlled by a single locus, where the freestone allele is dominant over the 303
clingstone allele [51]. Mesocarp and endocarp shapes are strictly related: in round shaped fruit, the 304
stone is globose, while in flat fruits the stone is round-oblate or elliptic in elliptic fruits. The seed 305
within the fruit is typically single (exceptionally, double) and may contain cyanogenic glycosides, 306
that confer a bitter taste [42]. 307
2.5.2.7 Fruit texture 308
Several texture variants have been described in peach flesh: 309
Melting (M) peaches are the most spread texture type in fresh market. They are characterized by 310
a fast evolution from firm and crispy flesh to creamy and buttery on the tree and mealy during 311
extended storage. Within this texture type, a quantitative variation exists for the rate of flesh 312
melting. Several approaches were tested to measure differences in peach flesh texture: the rate of 313
firmness loss, measured by penetrometer test, during ripening or storage, is the most commonly 314
used to assess the quantitative variation in the M type [66]. 315
Stony hard (SH) peaches have a crispy and consistent flesh characterized by the lack in ethylene 316
and auxin production: they are able to melt and produce ethylene in cold storage or after ethylene 317
or auxin exposure [67]. This trait originated in the far Est and was introduced in Italy from the 318
Korean peach ‘Yumyeong’ used in an important Italian breeding program [68]. For the SH type, 319
the production of ethylene can be assessed by head space gas chromatography of peach fruits. A 320
recent molecular study of this texture type allowed the development of a genetic marker based on 321
a microsatellite variant in the intron of PpYUC11, a gene involved in the auxin biosynthesis [69]. 322
The non-melting (NM) type is characterized by a consistent flesh unable to melt, but able to 323
produce ethylene [70]. This texture is associated to the lack of endopolygalacturonase activity 324
[63], that gives resistance to mealiness during storage. This type is frequently used for canning 325
[42]. For the NM type, knowledge of the molecular genetic basis of the trait produced reliable 326
DNA markers allowing early prediction of the flesh texture already at the seedling stage [70]. 327

12
Non-softening (NSF) texture is described as a crispy non-melting variant: this trait is controlled 328
by a specific allele (called “f2”) of the same endoPG gene already described in non-melting texture 329
[70]. 330
Slow-ripening (SR) is described as a peach with a hard and pour quality flesh: it is a mutant unable 331
to ripe properly, since fruit development arrests at the S3 stage [71]. First described in ‘Fantasia’ 332
progeny, this texture type is insensitive to ethylene exposure [71]. 333
Slow softening(SS) peaches are phenotypic variants of melting-type, characterized by a slower 334
softening rate compared to the melting ones. Interesting, this type of texture was initially classified 335
as stony hard types, although SS peaches were subsequently recognized as a distinct texture type 336
for their ability to produce ethylene and melt [72]. The origin of this character is unknown, but 337
was first described in the ‘Big Top’ variety, a nectarine licensed by Zaiger Genetics around 1980 338
[73]. 339
2.5.3 Breeding 340
In breeding programs, breeders must be able to efficiently and inexpensively evaluate 341
thousands of plants in a short time. In the case of fruit trees, phenotyping is made more complex 342
by the high variability of fruits on the plant, so that a high number of replicated 343
measurements/observations is required to obtain reliable data. 344
The inherent complexity of texture evaluation, the time and money required for advanced 345
chemical/physical analysis to analyze cell wall structure, the inapplicability of panel tests for high 346
numbers of genotypes, are stimulating the development of fast and low-cost techniques to 347
phenotype different texture types. Combination of different mechanical properties with the 348
appropriate interpretation could well represent the texture. As Harker argued, mechanical 349
parameters are not the same for tactile or bite and instrumental detection: an example is the 350
hardness (the force needed to compress the sample under a flat plate for 1cm), while the relation 351
among instrumental and sensory has a good predictability on sample with different hardness but 352
sharing the same matrix, compare samples with the same instrumental hardness, but different 353
matrix, shows weaker relation between organoleptic hardness and instrumental ones [8,28]. 354
355

13
2.5.3.1 Finding a reliable tool to phenotype the SS trait 356
The major relevance of texture types for the development of new peach cultivars requires 357
reliable and efficient methods for texture evaluation, in order to be applied in breeding programs. 358
Over the years our group’s efforts were dedicated to find a reliable tool to score the SS texture 359
type. Various approaches were tested including Time Resolved Spectroscopy (TRS), echography, 360
computerized tomography (CT), expressible juice, penetrometer test by digital penetrometer [74], 361
Fourier Transformed Near Infrared Spectroscopy in reflectance (FT-NIR), pectin analysis [72] and 362
relaxation test by texturometer. 363
Herein it is reported the development and testing of an empirical method to score the SS texture 364
type, incorporating an innovative interpretation approach and exploiting the relationship among 365
rheological parameters as a predictor of fruit texture. This novel approach has been applied 366
together with sensorial phenotyping in a genotyped progeny and germplasm collection to identify 367
the genetic basis of the trait and genotypic markers associated to SS phenotype. A single locus was 368
detected, suggesting a simple inheritance of SS texture. The gene models annotated within the 369
target locus have been investigated through RNAseq approach by comparing 2 SS and 2 M 370
accessions. Candidate variants were also investigated by whole-genome re-sequencing (WGRS) 371
of cross parents. 372
The developing of a novel phenotyping approach for SS texture has been submitted to the Journal 373
of Texture Studies with the title: Identification of a melting type variant among peach (P. 374
Persica L. Batsch) fruit textures by a digital penetrometer. The manuscript is currently under 375
review. 376
The genetic dissection of SS texture will be submitted to Tree Genetics & Genomes. 377
My contribution to the both studies was manifold, besides writing two papers. Both are ready to 378
be submitted to referred journals. 379
In the first one, I contribute to the developing of the phenotyping approach, through the collection 380
and analysis of the mechanical parameters from rheograms, and model development. 381
In the second paper, other than collecting and analyzing phenotypic data, I performed QTLs, RNA-382
seq and WGRS data analysis. 383
384

14
3 Identification of a melting type variant among peach 385
(P. Persica L. Batsch) fruit textures by a digital 386
penetrometer 387
3.1 Abstract 388
The increase of peach (P. persica L. Batsch) fruit shelf-life is one of the most important objectives 389
of breeding activities, since peach is a highly perishable fruit which undergoes rapid softening 390
during ripening. The loss of fruit firmness is accompanied by a modification of textural properties. 391
At least four distinct textures were described in peach: melting (M), non-melting (NM), stony hard 392
(SH) and slow-melting (better defined as ‘slow-softening’, SS). Flesh textures are usually 393
discriminated using different approaches, specific for each type. Objective of this work was the 394
development of a reliable method to assess flesh texture variants in peach fruit, with special 395
attention to the SS type which is currently scored by sensorial evaluation. A puncture-based test 396
using a digital penetrometer was performed on 20 accessions belonging to the four textural groups, 397
obtaining a series of rheological measures related to mechanical flesh properties and including 398
Young’s Modulus, Upper Yield Point and Slope of Yield Stress. Among the components of elasto-399
plastic behavior of the fruits, the texture dynamic index (TD) was shown to be a reliable parameter 400
to distinguish the group of M flesh texture from SS, NM and SH. The TD index can be applied to 401
discriminate SS and M fruits, although variability within the different texture groups suggests the 402
existence of genotypes with intermediate phenotypes and minor quantitative trait variation. 403
The availability of an objective method to clearly distinguish M and SS phenotypes paves the road 404
to phenotype segregating progenies in order to find molecular markers associated to the SS trait. 405
3.1.1.1 Practical applications 406
The TD index could be considered to determine different textures in fleshy fruits in pre- and post-407
harvest, to support evaluation of quality for the intended use. 408
409
Key words: texture, firmness, slow softening, phenotyping, fruit quality, peach 410
411
15
3.2 Introduction 412
Fruit maturation is a coordinated and genetically programmed process, leading to the 413
development of an edible fruit with desirable quality attributes [13]. In most fleshy fruits, softening 414
is a ripening-related phenomenon. The softening process involves metabolic and physiological 415
changes, which lead to the disassembly of the polysaccharide matrix composing the primary cell 416
wall and middle lamella, and loss of turgor pressure [18]. Such changes impact shelf-life, so 417
selection of slow softening cultivars is a major objective of current breeding activities, stimulating 418
the search for textural characteristics able to increase fruit storability. 419
Peach [Prunus persica L. (Batsch)] is the most important cultivated species of the Prunus genus. 420
Significant breeding efforts during the last decades have allowed the improvement of important 421
fruit quality traits [42]. Currently, the increase of shelf-life is a primary breeding goal, since peach 422
is a highly perishable fruit which undergoes a rapid softening during ripening [75]. In this context, 423
the development of a quick and reliable method for assessing the range of textures present in peach 424
is of utmost importance (see below). The rate of softening varies depending on genotype, 425
environmental conditions and cultural practices [70]. Peach softening is also accompanied by a 426
modification of fruit textural properties. Texture can only be perceived and described by humans 427
and any instrumental measurements should be related to sensory responses because it is 'the 428
sensory and functional manifestation of the structural, mechanical and surface properties of foods 429
detected through the senses of vision, hearing, touch and kinesthetic' [2]. So far at least four distinct 430
types of flesh texture have been identified in peach: ‘melting’ (M), ‘non-melting’ (NM), ‘stony 431
hard’ (SH) and 'slow-melting' [42]. Most peach accessions are characterized by a melting flesh. 432
NM peaches arise from a missense mutation in an endo-PG gene [34,76], coding for an endo-433
polygalacturonase enzyme, resulting in a slower decrease of firmness and the maintenance of a 434
rubbery texture [77]. NM trait is typical of canning peaches. SH peaches also tend to remain firm, 435
since they are unable to produce ethylene during ripening, although they can melt under 436
appropriate storage conditions [78,79]. A reduced expression of the auxin biosynthesis gene 437
PpYUCCA11-like has been recently suggested as the genetic base of the recessive SH trait [80]. A 438
novel phenotype of qualitative origin has been recently characterized, the slow-melting (SM) 439
texture, typical of 'Big Top'-like cultivars [81]. SM peach tend to soften slower compared to the 440
melting ones, although the biochemical and physiological patterns are still largely unknown. In 441
agreement with Contador et al. [82], we suggest renaming the SM texture in slow-softening (SS), 442
since the term ‘slow-melting’ can be easily mistaken with the quantitative variability found within 443
the melting type [72,83]. The different texture phenotypes are often discriminated using various 444
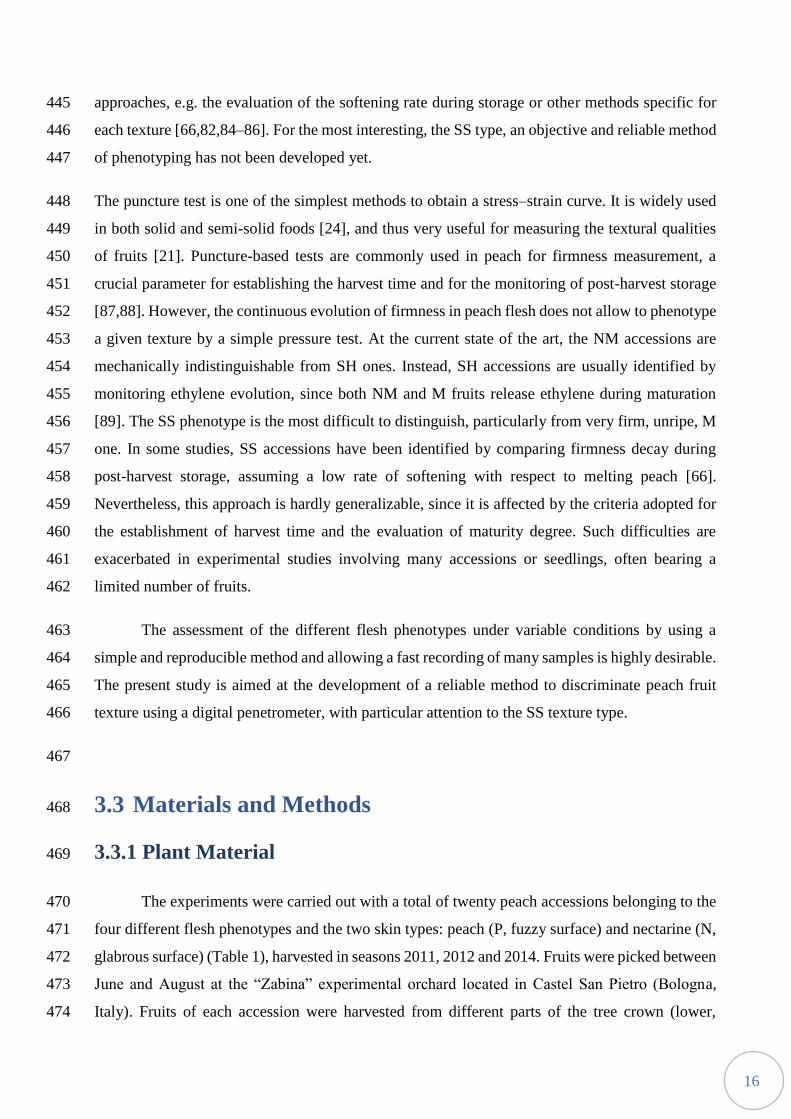
16
approaches, e.g. the evaluation of the softening rate during storage or other methods specific for 445
each texture [66,82,84–86]. For the most interesting, the SS type, an objective and reliable method 446
of phenotyping has not been developed yet. 447
The puncture test is one of the simplest methods to obtain a stress–strain curve. It is widely used 448
in both solid and semi-solid foods [24], and thus very useful for measuring the textural qualities 449
of fruits [21]. Puncture-based tests are commonly used in peach for firmness measurement, a 450
crucial parameter for establishing the harvest time and for the monitoring of post-harvest storage 451
[87,88]. However, the continuous evolution of firmness in peach flesh does not allow to phenotype 452
a given texture by a simple pressure test. At the current state of the art, the NM accessions are 453
mechanically indistinguishable from SH ones. Instead, SH accessions are usually identified by 454
monitoring ethylene evolution, since both NM and M fruits release ethylene during maturation 455
[89]. The SS phenotype is the most difficult to distinguish, particularly from very firm, unripe, M 456
one. In some studies, SS accessions have been identified by comparing firmness decay during 457
post-harvest storage, assuming a low rate of softening with respect to melting peach [66]. 458
Nevertheless, this approach is hardly generalizable, since it is affected by the criteria adopted for 459
the establishment of harvest time and the evaluation of maturity degree. Such difficulties are 460
exacerbated in experimental studies involving many accessions or seedlings, often bearing a 461
limited number of fruits. 462
The assessment of the different flesh phenotypes under variable conditions by using a 463
simple and reproducible method and allowing a fast recording of many samples is highly desirable. 464
The present study is aimed at the development of a reliable method to discriminate peach fruit 465
texture using a digital penetrometer, with particular attention to the SS texture type. 466
467
3.3 Materials and Methods 468
3.3.1 Plant Material 469
The experiments were carried out with a total of twenty peach accessions belonging to the 470
four different flesh phenotypes and the two skin types: peach (P, fuzzy surface) and nectarine (N, 471
glabrous surface) (Table 1), harvested in seasons 2011, 2012 and 2014. Fruits were picked between 472
June and August at the “Zabina” experimental orchard located in Castel San Pietro (Bologna, 473
Italy). Fruits of each accession were harvested from different parts of the tree crown (lower, 474

17
medium and upper) to collect a full range of ripening degree. One hundred sixty-five fruits were 475
harvested for each accession. Peaches were grouped into three maturity classes based on the IAD 476
parameter (see below) and divided into lots of 15 fruits for daily analysis, so that each lot included 477
the full IAD range. Each lot was composed by five fruits classified as less mature, five as medium 478
mature and five as mature. Out of the one hundred sixty-five fruits for each accession, seventy-479
five were held at 20° C and ninety were put into 4° C storage for two weeks. After cold storage, 480
fruits were held at 20° C for daily analysis. Every day one lot of fruit was taken out of storage and 481
measured for IAD, fruit weight and firmness. Shelf life evaluation was conducted after harvest and 482
two weeks of cold storage. 483
3.3.2 Measure of the maturity stage by IAD 484
∆Ameter instrument (Synteleia S.R.L., Italy) is a portable spectrometer that measures the index 485
absorbance difference (IAD) between two wavelengths near the chlorophyll-A absorption peak 486
[36]. IAD was measured on the two sides of each fruit at harvest and daily during the analysis. The 487
lower value of IAD was taken as the expression of the physiological age the fruit, since the lower 488
the parameter, the more advanced is the ripening evolution. The fruit classes are specific for each 489
accession. For each accession, fruits were sorted using IAD in three different classes, each 490
representing about a third of the total number of fruits. 491
3.3.3 Penetrometer test 492
The penetrometer test was performed on the day of analysis. A 1.5 cm round portion of the skin 493
was removed from the middle of each fruit cheek by a slicer. The penetrometer test was done using 494
a constant rate digital penetrometer (Andilog Centor AC TEXT08) fitted with an 8mm diameter 495
flat plunger for 1 cm puncture, motorized by a basic test stand (BATDRIVE) set at 5 mm/s speed. 496
The rheogram data were acquired by the RSIC bundle software (Andilog Technology). 497

18
3.3.4 Rheogram processing 498
499
Figure 2 An example of rheogram (stress-strain curve) obtained using a digital penetrometer from sampled fruits of ‘Big Top’ 500 (slow-softening, brown solid line) and ‘Ambra’ (melting, red solid line); the Young’s modulus and the Slope of yield stress curve 501 are indicated by dashed and dotted lines, respectively. The Young’s modulus and the Slope of yield stress are calculated respectively 502 on the 20 data points before and after the Upper yield point. 503
504
Young’s modulus (YM), the upper yield point (the UYP) and the slope of yield stress (SYS) [9] were 505
calculated from the rheogram of each sample (Figure 2). The upper yield point, and the Young's 506
modulus are the maximum firmness and the elastic properties of the fruit, respectively. In a 507
mechanical sense, the ripening process of fruit flesh can be described in terms of its elasto-plastic 508
properties: elastic for the small deformations and plastic for the large ones. Modulus of elasticity 509
(E), and modulus of fracturability (F) were evaluated by using the following formulas, 510
respectively: E = ∆YM / ∆UYP and F = ∆SYS / ∆UYP. 511
512
19
3.3.5 Statistical data analysis 513
To investigate the components of the elasto-plastic behavior in peach fruit, a regression approach 514
was applied to rheological data. A linear regression for each accession was calculated using the 515
lmList function of the R package nlme, according to the formula: UYP = E*YM + F*SYS + k, where 516
E is the elasticity modulus, F the fracturability modulus and k the intercept. The E:F ratio was 517
then defined as texture dynamic (TD) and calculated for each accession for each year and storage 518
condition. ANOVA analysis was performed on TD data using as the aov function in R stats 519
package. The data of each accession were analyzed by year and storage regime as blocks. Physical 520
analyses were tested for distribution by Shapiro-Wilk test. Based on distribution, each parameter 521
was analysed with a congruous test. Young’s modulus was checked by Siegel-Tukey analysis for 522
equal variability based on ranks. The upper yield point was analyzed by ANOVA for the variance 523
analysis and the slope of yield stress was analyzed by Welch Two Sample t-test. An LSD (α<0.05, 524
p adjusted by Bonferroni) was done on TD, E and F using the texture phenotypes as blocks. 525
526
20
527
3.4 Results 528
A common problem when evaluating and comparing softening behavior, is to properly 529
account for the variability in fruit physiological age, both within and among accessions. The 530
maturity degree at harvest exerts a major effect on the dynamic of firmness loss during storage. 531
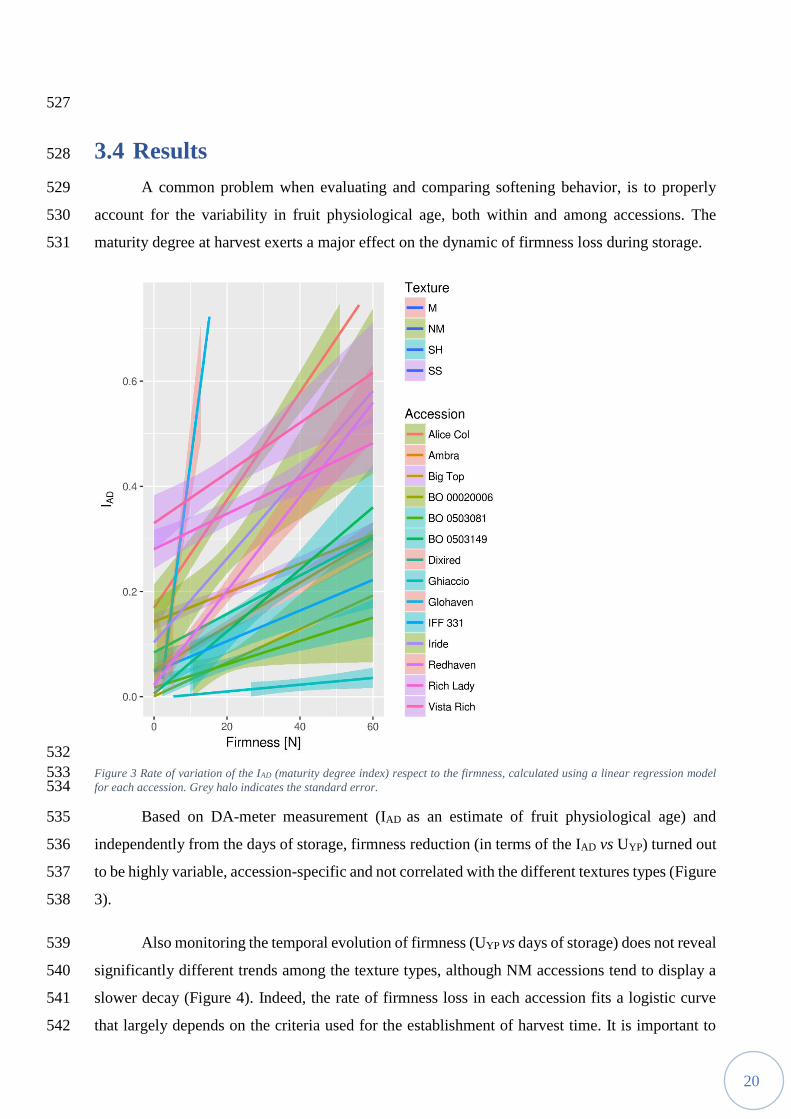
532
Figure 3 Rate of variation of the IAD (maturity degree index) respect to the firmness, calculated using a linear regression model 533 for each accession. Grey halo indicates the standard error. 534
Based on DA-meter measurement (IAD as an estimate of fruit physiological age) and 535
independently from the days of storage, firmness reduction (in terms of the IAD vs UYP) turned out 536
to be highly variable, accession-specific and not correlated with the different textures types (Figure 537
3). 538
Also monitoring the temporal evolution of firmness (UYP vs days of storage) does not reveal 539
significantly different trends among the texture types, although NM accessions tend to display a 540
slower decay (Figure 4). Indeed, the rate of firmness loss in each accession fits a logistic curve 541
that largely depends on the criteria used for the establishment of harvest time. It is important to 542

21
remark that for this analysis, fruits were a priori sorted based on IAD value into three maturity 543
classes in order to remove confounding effects due to the heterogeneity in their physiological age. 544
545
Figure 4. Rate of firmness loss during storage at 20° C for five days for four accessions representative of each texture group: ‘Alice 546
Col’ (NM), ‘Big Top’ (SS), ‘Ghiaccio’ (SH) and ‘Redhaven’ (M). The regression model is smoothed using the Loess method, with 547
a 0.8 span. The standard error is indicated by grey halo. The box plot represents the median and quartiles and for each day of 548
analysis. 549
Therefore, none of the two above described approaches yielded a reliable classification of 550
the different texture types within the considered panel of accessions. As described in Materials 551
and Methods section, other rheological parameters can be used in addition to the UYP to describe 552
the changes of peach texture during ripening: the Young’s modulus (YM), evaluating the elastic 553
behavior, and the fracturability (F), dependent from the slope of yield stress and describing the 554
plastic behavior [2] . 555
The Young’s Modulus showed a bimodal distribution in M and SS accessions, being 556
unimodal for the SH and NM ones (data not shown). The YM was strongly related with the UYP, 557
and the slope of this regression (E) was specific for each accession, representing the rate of 558
variation in the elastic properties of the fruit (Supplemental Table 1). Nevertheless, the E parameter 559

22
was unable to significantly differentiate among the different textures, although a tendency to 560
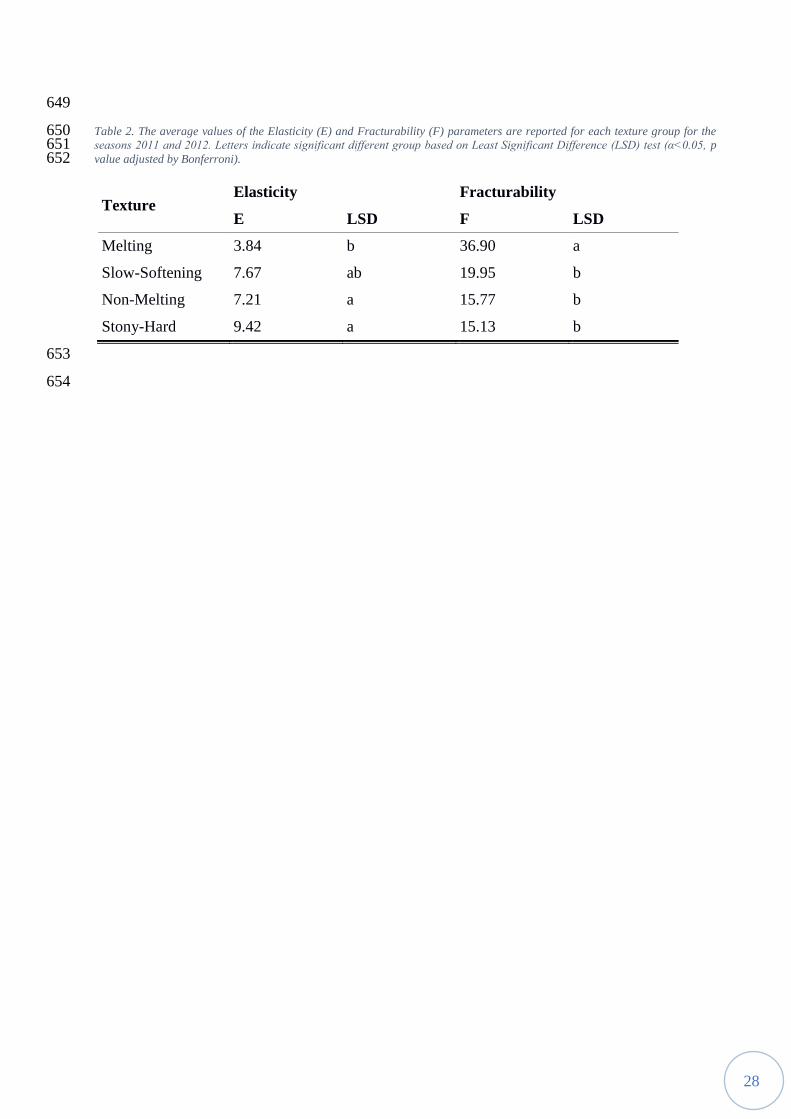
display low elasticity values was observed in M accessions (Table2). 561
562
Figure 5. Relationship between Fracturability and Elasticity parameters in fruits collected during 2011-2012 seasons. The shape 563 of the points indicates the texture group (M, melting; SS, slow-softening; SH, stony hard, and NM, non-melting). Colors indicates 564 each cultivar. Horizontal and vertical error bars represent the standard error of the Fracturability (F) and the Elasticity(E) of the 565 regression model: UYP = E*YM + F*SYS + k (see text for further details). 566
567
The Slope of Yield Stress (SYS) showed a studentized distribution, with a marked difference 568
in the shape among the textures, while the statistical test showed significant differences for all 569
pairs of combinations. The fracturability (F), calculated by the regression of the SYS on the UYS, 570
was specific for each accession (Supplemental Table 1) and able to distinguish SS from M 571
(showing high F value), but not from NM and SH (Table 2). As shown in Figure 5, E and F 572
parameters tend to be inversely related i.e. the fracturability tend to decrease with the increase of 573
elasticity and vice versa. Melting fruits show a higher fracturability and, thus, lower elasticity 574
compared to the other texture types, particularly with respect to NM and SH fruits, in which the 575
two parameters remain basically constant. In contrast to F, the E parameter was affected by storage 576
conditions, particularly in SH accessions. However, the ability of F parameter to discriminate 577

23
between M and SS textures was not confirmed on 2014 season (Supplemental Table 2). For such 578
reasons, novel indices were calculated: Texture Dynamic (TD) and K-intercept. The TD index is 579
based on the ratio between the elasticity and the fracturability modulus (E:F ratio). The TD index, 580
can be interpreted as the trend of variation in fruit consistency in function of the firmness, resulting 581
significantly correlated to the texture, independently from the accession (including skin hairiness 582
phenotype), year or storage regime. The texture explains 88% of the TD mean square error (MSE), 583
whereas the M and SS phenotypes explained up to 96% of TD MSE. SH and NM add 8% of 584
unexplained variance. The M phenotype can easily be separated from SS for TD value lower than 585
0.25 (Figure 6 and Supplemental Table 1). The discrimination ability of TD index was also 586
validated on 2014 data, obtaining consistent results (Supplemental Figure 2 and Supplemental 587
Table 2). Nevertheless, TD cannot distinguish NM from both SS and SH, since the index showed 588
similar values for these three texture groups (Figure 6). The K-intercept is the intercept of the 589
model and resulted well-correlated with the TD-index (data not shown). 590

24
591
Figure 6Texture Dynamic (TD) values in each texture group as predicted by the model. Letters indicate the least significant 592 differences (LSD) among textures for α<0.05 (p value adjusted by Bonferroni). The error bars represent the standard errors. 593
594
3.5 Discussion and Conclusions 595
Analyzing a diversified set of accessions, the difficulties of discriminating among different 596
texture types by monitoring maximum firmness (UYP) decay during storage became evident, in 597
particular when comparing M and SS types. Comparison of the softening trend among accessions 598
requires an accurate estimation of fruit physiological age. However, the main index used for 599
assessing maturity degree (IAD) was correlated to the firmness only in a genotype-dependent 600

25
manner, and therefore, not useful to standardize a diversified panel of accessions. This is in 601
agreement with several other studies [66,90,91]. 602
In addition to firmness, other mechanical properties of the fruit can be determined from 603
rheological data, such as elasticity and fracturability. In the analyzed accessions, the E and F 604
parameters were strongly interconnected and varied depending on the texture type. Fruit elasticity, 605
calculated from the Young's Modulus, showed a unimodal behavior in NM and SH, and bimodal 606
in M and SS. This is coherent with the typical biphasic pattern of firmness loss, because of the 607
activation of the melting pathway [78]. Nevertheless, the E parameter was variable both within 608
and among accessions, resulting in a reduced ability to distinguish the different textures. Such 609
variability may be affected by the water status of flesh tissues and, thus, by changes in cell turgor 610
pressure [92]. In contrast, the fracturability (F) appeared more specific and particularly able to 611
discriminate M from the other textures: this is in agreement with the notion that the disassembly 612
of cell wall structure (mainly responsible for fruit plasticity) plays a major role in the softening 613
process in the melting type [93]. However, the F parameter was also affected by some variability, 614
that in certain cases masks a reliable discrimination. The resolution of the F parameter can be 615
increased by using the elasticity value to adjust for fruit water status, leading to a combination of 616
both components in a unified index, TD, which is more stable and unaffected by season or storage 617
regime. Indeed, this index measures inherent mechanical properties of the fruits, not dependent on 618
the firmness. The texture phenotype can affect the rheological properties of the flesh but not the 619
firmness, in agreement with some works in peach and other species [63,94]. While firmness 620
represents just the ripening stage, TD allows to predict the evolution of the elasticity and 621
fracturability during the softening process, thus identifying a specific phenotype. This index can 622
be calculated through a one-step analysis, and only requires the sampling of fruits with an average 623
firmness ≥15 N. 624
In this work, accessions have been considered as biological replicates of the four groups of 625
textures. The rationale of this approach arose both from the need for a reliable method to 626
discriminate predefined texture types (in particular SS) and from the opportunity to test a target 627
modeling on well-outlined phenotypes (in the case of NM and SH, accompanied by the knowledge 628
of genetic determinants). It is important to highlight that the analyzed rheological parameters (E, 629
F and TD), irrespective of the greater or lesser predictive ability, all tend to distinguish the melting 630
type from the other textures, and to group together NM, SH and SS, which tend to have similar 631
mechanical properties of the flesh, as also previously hypothesized [81]. Moreover, the variability 632
in TD values observed in each texture group suggests the existence of intermediate phenotypes 633

26
that may depend on the genetic background. The presence of a quantitative variability for flesh 634
texture trait has been also observed in other studies [66,72,82]. Further studies are needed to 635
confirm whether TD can be used as an effective approach to score the continuous phenotypic 636
variability present in peach germplasm, in turn a crucial step for association and linkage mapping 637
studies. However, we have to stress that the main goal of our work was achieved by setting up an 638
objective method to clearly distinguish melting from slow softening phenotypes that so far was 639
possible only by sensorial evaluation. This finding will pave the road to phenotype segregating 640
progenies in order to find molecular markers associated to the slow softening trait. 641
642

27
3.6 Supplemental Materials and Tables 643
Table 1 Accession panel used in this study. Texture, skin hairiness (peach vs nectarine) and sampling season are reported. 644
Accession Texture Skin hairiness Season
Alice Col Non-Melting Nectarine 2011-2012
Ambra Melting Nectarine 2012-2014
Amiga Slow-Softening Nectarine 2014
Big Top Slow-Softening Nectarine 2011-2012-2014
BO00020006 Non-Melting Peach 2011
BO04020009 Melting Peach 2014
BO0503149 Non-Melting Peach 2011
BO0530081 Stony-Hard Peach 2011
Dixired Melting Peach 2011
Ghiaccio1 Stony-Hard Peach 2011-2014
Glohaven Melting Peach 2011
Grenat Slow-Softening Peach 2014
Honey Blaze Slow-Softening Nectarine 2014
Honey Kist Slow-Softening Nectarine 2014
IFF331 Stony-Hard Peach 2011
IFF813 Non-Melting Nectarine 2014
Iride Non-Melting Peach 2012
Pulchra Slow-Softening Peach 2014
Redhaven Melting Peach 2011-2012
Rich Lady Slow-Softening Peach 2011-2012-2014
Vistarich Slow-Softening Peach 2011-2014
645
646
647
648
28
649
Table 2. The average values of the Elasticity (E) and Fracturability (F) parameters are reported for each texture group for the 650 seasons 2011 and 2012. Letters indicate significant different group based on Least Significant Difference (LSD) test (α<0.05, p 651 value adjusted by Bonferroni). 652
Texture Elasticity Fracturability
E LSD F LSD
Melting 3.84 b 36.90 a
Slow-Softening 7.67 ab 19.95 b
Non-Melting 7.21 a 15.77 b
Stony-Hard 9.42 a 15.13 b
653
654

29
655
Supplemental Figure 1. Principal Component Analysis (PCA) performed on rheological data 656
obtained from the analyzed panel of accessions. The first two components (PC1 and 2) explain 62 657
and 20% of the variance proportion, respectively, and 82% of the cumulative variation. 658
Eigenvalues and eigenvectors relative to the texture, TD index, Young’s modulus, Upper yield 659
point and Slope of yield stress are highlighted in red. 660

30
661
Supplemental Figure 2. TD index values for each texture group as determined on season 2014. 662
Letters indicate the least significant differences (LSD) among melting and slow softening textures 663
(α<0.05, p adjusted by Bonferroni). 664
665

31
Supplemental Table 1. Rheological parameters recorded in two seasons (2011-2012) for 14 peach 666
accessions. Fruits were stored at 4° and 20° C. All coefficients are expressed as average values. 667
For the components K (intercept), E (elasticity), F (fracturability) the standard errors are also 668
reported. 669
670
671
Accession Year Storage (°C) Intercept Elasticity Fracturability K a b
TD Estimate Std.Error Estimate Std.Error Estimate Std.Error
Alice Col 2011 20 -10.88 7.28 14.47 -10.88 1.37 7.28 0.65 14.47 3.30 0.50
Alice Col 2011 4 -11.62 7.09 15.99 -11.62 1.06 7.09 0.61 15.99 2.59 0.44
Alice Col 2012 20 -18.93 8.39 28.56 -18.93 0.93 8.39 0.516 28.56 2.30 0.29
Alice Col 2012 4 -14.72 9.21 18.49 -14.72 0.57 9.21 0.55 18.49 1.61 0.49
Ambra 2012 20 -21.85 3.97 39.77 -21.85 1.51 3.97 0.363 39.77 3.29 0.10
Ambra 2012 4 -20.95 3.11 38.96 -20.95 1.11 3.11 0.298 38.96 2.43 0.08
BigTop 2011 20 -15.97 7.32 24.67 -15.97 1.62 7.32 0.493 24.67 3.63 0.29
BigTop 2011 4 -12.64 7.24 18.37 -12.64 1.86 7.24 0.534 18.37 4.09 0.39
BigTop 2012 20 -15.29 4.69 25.97 -15.29 1.34 4.69 0.497 25.97 3.13 0.18
BigTop 2012 4 -9.96 6.58 13.43 -9.96 1.46 6.58 0.529 13.43 3.39 0.49
BO 00020006 2011 20 -8.84 6.99 10.02 -8.84 1.63 6.99 1.066 10.02 4.00 0.69
BO 00020006 2011 4 -9.06 5.58 12.56 -9.06 0.90 5.58 0.589 12.56 2.26 0.44
BO 05030149 2011 20 -8.60 5.33 12.72 -8.60 2.47 5.33 1.18 12.72 5.86 0.41
BO 05030149 2011 4 -10.98 10.96 8.44 -10.98 1.42 10.96 1.163 8.44 3.93 1.29
BO 0530081 2011 20 -12.16 7.57 15.34 -12.16 1.50 7.57 0.865 15.34 3.87 0.49
BO 0530081 2011 4 -17.21 6.24 26.89 -17.21 1.95 6.24 1.133 26.89 5.11 0.23
Dixired 2011 20 -27.92 3.59 52.41 -27.92 6.53 3.59 0.999 52.41 13.85 0.06
Ghiaccio 2011 20 -14.19 11.26 14.71 -14.19 1.94 11.26 0.61 14.71 4.40 0.76
Ghiaccio 2011 4 -13.00 13.81 8.158 -13.00 0.59 13.81 0.425 8.158 1.26 1.69
Glohaven 2011 20 -16.89 0.94 33.35 -16.89 6.78 0.94 0.758 33.35 14.07 0.02
Glohaven 2011 4 -17.61 1.45 34.28 -17.61 3.91 1.45 0.485 34.28 8.06 0.04
IFF331 2011 20 -16.40 14.71 11.32 -16.40 0.88 14.71 1.243 11.32 2.34 1.30
IFF331 2011 4 -15.13 5.47 23.73 -15.13 0.40 5.47 0.429 23.73 1.20 0.23
Iride 2012 20 -12.20 6.05 18.79 -12.20 2.22 6.05 0.418 18.79 4.64 0.32
Iride 2012 4 -7.18 7.06 7.27 -7.18 1.37 7.06 0.776 7.27 3.47 0.97

32
Supplemental Table 2. Rheological parameters recorded in 2014 season for 10 peach accessions. 672
Fruits were stored at 4° C. All coefficients are expressed as average values. For the components K 673
(intercept), E (elasticity), F (fracturability) the standard errors are also reported. The TD index 674
shows lower values for the melting peach accessions ‘Ambra’ and ‘BO 04020009’. 675
676
677
Accession Year Storage
(° C) UYP (N)
YM SYS K E F
TD Estimate Std.Err Estimate Std.Err Estimate Std.Err
Ambra 2014 4 31.79 0.10 0.21 0.36 0.12 1.51 0.52 14.53 0.66 0.10
Big Top 2014 4 48.11 0.23 0.10 2.08 0.40 6.54 1.55 13.24 3.92 0.49
BO 04020009 2014 4 42.48 0.17 0.28 0.07 0.43 1.70 1.17 14.21 1.48 0.12
Ghiaccio 1 2014 4 49.16 0.19 0.10 3.44 0.39 4.38 1.98 8.11 2.50 0.54
Grenat 2014 4 29.36 0.11 0.04 1.19 0.22 9.01 1.84 19.14 4.57 0.47
Honey Blaze 2014 4 32.00 0.11 0.07 2.09 0.57 11.59 4.87 1.53 5.93 7.58
Honey Kist 2014 4 25.42 0.10 0.06 0.58 0.17 12.71 2.03 11.31 2.62 1.12
IFF813 2014 4 40.27 0.14 0.14 1.60 0.17 11.59 1.90 6.92 1.67 1.67
Pulchra 2014 4 31.02 0.29 0.22 0.33 0.37 3.46 1.45 8.38 2.64 0.41
Vista Rich 2014 4 49.19 0.23 0.07 2.27 0.38 7.57 1.55 15.64 5.41 0.48

33
4 Genetic analysis of the slow softening trait in peach 678
679
4.1 Abstract 680
Texture is one of the main quality attributes of peach fruit. A germplasm panel and a segregating 681
progeny were genotyped with the Illumina 9k peach SNP array and phenotyped for fruit texture 682
(Slow-softening vs Melting) using a sensorial evaluation and by measuring mechanical properties, 683
respectively. Combining association and linkage mapping a locus for the Slow-softening trait was 684
located in the distal part of chromosome 8 (spanning an interval of about 2.3 Mb and 1.6Mb, 685
respectively using GWA and QTL-mapping). The most significantly associated SNPs in Genome 686
Wide-Association and QTL-mapping are spaced about 257kb apart on the reference peach genome 687
sequence, suggesting that the same locus might be segregating both in progeny and association 688
panel. Among 804 gene models fall in the locus, 517 were expressed in the fruit flesh. A 689
preliminary investigation of putative candidate genes was performed by inspecting annotated 690
transcripts within the identified interval, by comparing fruit gene expression data between two 691
slow-softening and two melting accessions and whole-genome re-sequencing data of parents in 692
search of sequence variants possibly associated with the trait: 7 variants were identified in coding 693
regions of differentially expressed genes, Prupe.8G257900 (coding for tetratricopeptide repeat 694
(TPR)-containing protein), Prupe.8G224000 (coding for Protein of unknown function, DUF647) 695
and Prupe.8G206600 (coding for UDP-Glycosyltransferase superfamily protein) (1, 2 and 4 696
variants, respectively), while 33 were identified in regulatory regions of 16 differentially expressed 697
genes. This is the first description of slow-softening locus, his inheritance resulting consistent with 698
previous works fasting objective method and molecular biology. It is expected that applying 699
texture dynamic model on a similar or an even wider peach progeny or collection will support 700
precise QTL mapping or genome wide association studies. This would allow to identify genes 701
involved in peach texture control. 702
4.2 Introduction 703
The limited shelf-life of peach fruit has stimulated an increasing interest for the characterization 704
of the natural phenotypic variability associated to texture and softening behavior [42]. The vast 705
majority of peach cultivars are characterized by a melting flesh (M) texture type, manifested 706
through an initial slow decrease of firmness followed by a rapid softening (melting phase), 707
concomitant to the climacteric respiration and ethylene burst [95]. The loss of turgor pressure and 708
cell-to-cell adhesion in pericarp tissues have been proposed as the main physiological mechanisms 709

34
regulating the melting process in peach [63]. At genetic level, the M trait is regulated by a major 710
locus located on linkage group 4 [76], and harboring a cluster of genes belonging to the 711
endopolygalacturonase family (endo-PG), under the control of ethylene signaling pathways [96]. 712
Copy number variation at the M locus involving the presence/absence of two endo-PG genes 713
(endoPGM and endoPGF), has been recently proposed as the genetic bases of the monogenic 714
recessive non-melting flesh (NM) trait [97]. NM peaches are characterized by the maintenance of 715
a rubbery texture, characteristic which makes them suitable for canning [70]. The stony-hard (SH) 716
texture is a monogenic recessive trait first reported by Yoshida (1976) [83]. The flesh of SH 717
peaches remains firm and consistent at full ripening, evolving null or very low ethylene amount 718
during ripening [79,84]. The inability to produce ethylene is determined by a low expression of 719
the main fruit-related ethylene biosynthesis gene, the 1-aminocyclopropane-1-carboxylic acid 720
synthase isoform PpACS1 [98], in turn caused by the lack of auxin increase at the onset of ripening 721
[67]. The ppa008176m gene, coding for an auxin biosynthesis protein similar to the Arabidopsis 722
YUCCA11 (AtYUC11) has been recently proposed as a candidate gene for the recessive SH trait 723
[80]. 724
Apart from these texture variants, the genetic basis of the quantitative behavior associated to the 725
melting flesh phenotype is poorly understood, mainly hampered by environmental effects and 726
intra-genotype variability [72]. Understanding variation within the melting group is especially 727
important because of its relevance for the fresh market [87]. An interesting melting-variant, the 728
slow-softening type, has been recognized in 'Big Top'-like cultivars [73,81]. The Slow-softening 729
trait is manifested through a delay of the melting phase, resulting in a prolonged shelf-life and a 730
crispy texture compared to the melting flesh. The genetic and physiological mechanisms regulating 731
this phenotype still remain largely unknown [42]. A dominant Mendelian inheritance has been 732
suggested for the SS trait, observing the segregation pattern in several bi-parental progenies 733
derived from the ‘Big Top’ parent [73]. However, the inherent complexity of SS trait does not 734
allow to exclude a co-dominant or even quantitative inheritance. 735
Aim of this work is the genetic dissection of the slow-softening trait and the identification of 736
molecular markers to be used for marker assisted selection and putative candidate genes and/or 737
pathways involved. 738
739

35
4.3 Materials and methods 740
4.3.1 Plant materials 741
A panel of 119 accessions and 70 F1 progenies from cross ‘Max10’ x ‘Rebus 028’ (MxR028) were 742
analyzed in this study. Plants were grown under integrated pest management in the “Centro 743
Ricerche Produzioni Vegetali” (CRPV) experimental orchard, located at Imola. Eleven fruits per 744
plant were assessed by DA-meter [36] and visual inspection in order to select representative fruits 745
at commercial ripening stage. Of the 119 accessions 41 are nectarines, (21 acid and 20 sub-acid), 746
while 78 accessions are peaches (63 acids and 15 sub-acid). MxR028 F1 seedlings are all 747
nectarines, but segregate 1:1 for the D locus controlling the acid/sub-acid trait (32 sub-acid, 38 748
acid). Rebus 028 is a SS early ripening nectarine belonging from a cross between SS ‘Big Top’ 749
and M ‘May Fire’ cultivars. Max10 is a M late ripening nectarine the pedigree is unknown. 750
4.3.2 Genotyping 751
The panel of 119 accessions and 70 individuals from F1 cross-population MxR028 were genotyped 752
by using the IPSC peach 9K SNP array [99], using previously described SNP selection criteria 753
[51]. SNP positions within the array were recalibrated based on the Peach Genome assembly V2.0 754
[100]. For the germplasm panel, genotyping data were further filtered for marker missing rate < 755
10% and minor allele frequency (MAF) > 5%, finally retaining a total of 6104 SNPs for GWA 756
analysis. 757
4.3.3 Phenotyping 758
Accessions and MxR028 seedlings were screened for fruit texture through sensorial analysis 759
classifying them as melting (M) or slow-softening (SS). Organoleptic data were collected for at 760
least 5 years through the scoring of tactile and mouthfeel attributes during SIV ripening stage and 761
post-harvest (room temperature). For mechanical analysis, fruits of MxR seedlings were selected 762
based on maturity degree (established through IAD index measurement) and firmness value (above 763
15 N threshold) and analyzed through a digital penetrometer (Andilog Centor) after peel removal 764
as detailed in paragraph 3 (page 17). Rheograms data were analyzed as described in paragraph 3 765
(page 18). Fruit acidity, fresh weight, SSC, skin overcolor and maturity date were also measured 766
and evaluated. Statistical analyses were performed in R using nmle and stat packages. 767
4.3.4 Genome Wide Association Study 768
The panel used for GWA analysis was established by including a total of 119 accessions, of which 769
34 with SS phenotype and the remaining with MF. Population structure was inferred by using 770
36
ADMIXTURE v1.22 [101,102] by using a value of K = 3, chosen based on a 10-fold cross-771
validation procedure with 10 different fixed initial seeds. For association analysis, Mixed Linear 772
Model (MLM) was performed in GAPIT R package [103]. Random effects were included in the 773
mixed models as kinship matrix computed using Identical-By-State (IBS) algorithm, as 774
implemented in EMMAX package [104]. For fixed effects, a Q-matrix using a value of K = 3 was 775
used as covariate for association analysis. The Fixed and random model Circulating Probability 776
Unification (FarmCPU) method was used to further confirm association signals [105]. The 777
performance of all tested GWA algorithms was evaluated by comparing the observed vs expected 778
p-values under null hypothesis, through quantile-quantile (QQ)-plot inspection and considering 779
statistical power against False-Discovery Rate (FDR). A conservative threshold for assessing SNP 780
significance was calculated based on Bonferroni correction for a type I error rate of 0.05. Intra-781
chromosomal LD patterns were measured and visualized using HAPLOVIEW v4.2 [106]. 782
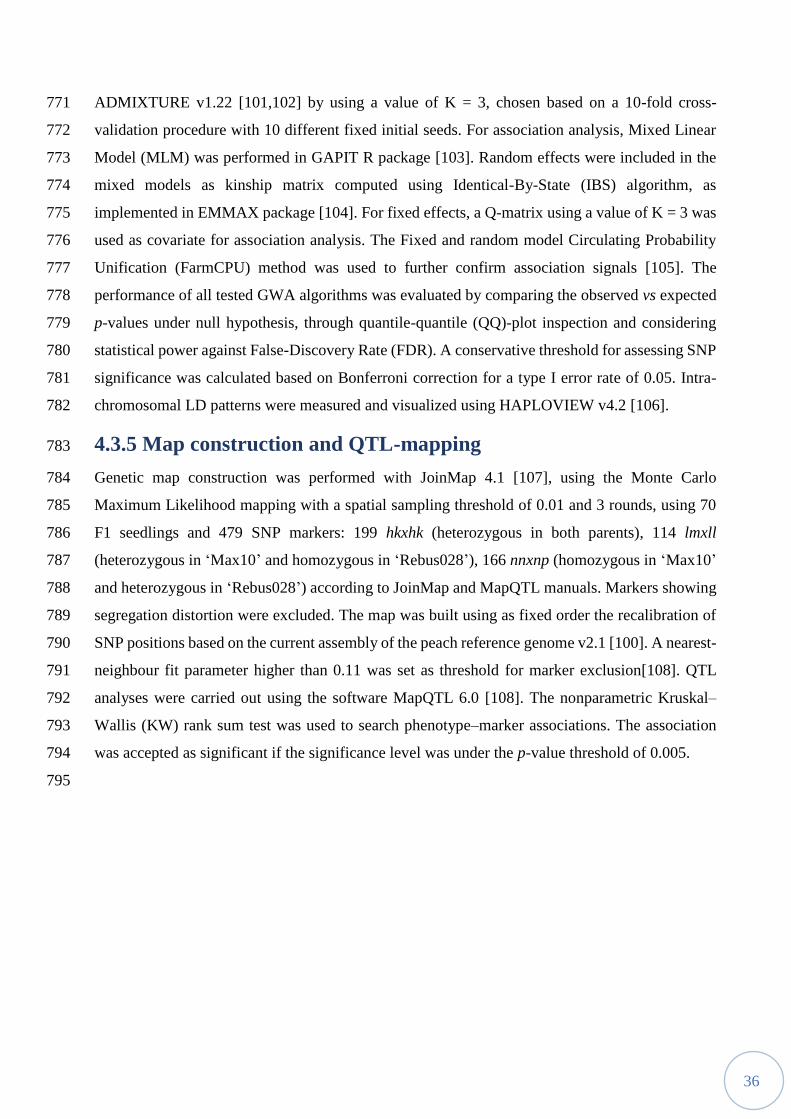
4.3.5 Map construction and QTL-mapping 783
Genetic map construction was performed with JoinMap 4.1 [107], using the Monte Carlo 784
Maximum Likelihood mapping with a spatial sampling threshold of 0.01 and 3 rounds, using 70 785
F1 seedlings and 479 SNP markers: 199 hkxhk (heterozygous in both parents), 114 lmxll 786
(heterozygous in ‘Max10’ and homozygous in ‘Rebus028’), 166 nnxnp (homozygous in ‘Max10’ 787
and heterozygous in ‘Rebus028’) according to JoinMap and MapQTL manuals. Markers showing 788
segregation distortion were excluded. The map was built using as fixed order the recalibration of 789
SNP positions based on the current assembly of the peach reference genome v2.1 [100]. A nearest-790
neighbour fit parameter higher than 0.11 was set as threshold for marker exclusion[108]. QTL 791
analyses were carried out using the software MapQTL 6.0 [108]. The nonparametric Kruskal–792
Wallis (KW) rank sum test was used to search phenotype–marker associations. The association 793
was accepted as significant if the significance level was under the p-value threshold of 0.005. 794
795

37
4.3.6 RNA sequencing and data processing 796
Fruits from two SS cultivars, ‘Big Top’ (BT) and ‘Rich Lady’ (RL), and two melting cultivars, 797
‘Bolero’ (BL) and ‘Red Haven’ (RH) were collected. Trees were grown under integrated pest 798
management growing systems at the “Centro Ricerche Produzioni Vegetali” (CRPV) (Imola, Italy) 799
experimental orchard. Representative fruits of each accessions were harvested along the SIII and 800
SIV stage of ripening. Maturity degree was assessed through the measuring of IAD index using 801
DA-meter instrument (Sintéleia, Bologna, Italy). For each accession 9 fruits (3 fruits from 3 trees) 802
were collected, immediately peeled, sliced in wedges, quickly frozen and ground using liquid 803
nitrogen. Total RNA was obtained following the protocol of Dal Cin et al. [109]. Total RNA 804
concentration was evaluated examining aliquots of samples in a Nanodrop spectrophotometer 805
(Thermo Scientific) while the quality was assessed by gel electrophoresis on a 1% agarose gel in 806
TAE buffer and stained with ethidium bromide. Samples were sequenced using Illumina RNA-807
Seq technology (HiSeq 2000) at IGA Technology Services (Udine, Italy) in 6-plex with a 50 bp 808
single end module. Quality of raw data was checked using the FastQC tool for high throughput 809
sequence data [110] . About 98% of the cleaned reads were aligned against the ‘Lovell’ peach 810
genome version 2.0 using bowtie2 and TopHat2 [111,112]. About 90% of the reads were uniquely 811
mapped and counted by HTSeq [113]. For subsequent analyses, only features with more than one 812
read per million in at least three samples were retained, for a total of 15 672 genes expressed across 813
the different texture types. Expression of each gene was normalized in RPKM (reads per kilobase 814
of exon model per million mapped reads), calculated based on the length of the gene and reads 815
mapped [114]. To compare the M accessions to SS accessions a gene by gene non-parametric 816
analysis was done by nparcomp package. Heatmap data visualization was obtained with the 817
heatmap.2::R software package [115]. 818
819

38
4.3.7 Next-generation sequencing whole-genome resequencing 820
Whole-genome sequence (WGS) libraries of ‘Max10’ and ‘Rebus 028’ parents were prepared by 821
the Genomics Platform of Parco Tecnologico Padano (Lodi, Italy) with the Illumina Truseq DNA 822
Nano sample prep kit (Illumina, San Diego) following manufacturer's protocol and sequenced on 823
the Hiseq2000 with paired-end sequencing module using the Truseq SBS kit v3. FASTQ files were 824
obtained with the Illumina CASAVA Pipeline. After cleaning and filtering, reads were trimmed 825
with Trimmomatic v0.32 and mapped using default parameters onto the peach reference genome 826
v2.0 using BWA-MEM algorithm, implemented in BWA v.0.6.1 tool [116]. After alignment, mean 827
coverage was estimated by using Samtools mpileup tool, obtaining a value of 31.6x and 28.9x 828
respectively for ‘Max10’ and ‘Rebus 028’. For variant identification, after duplicate removal and 829
reads indexing with PICARD, a joint-calling approach was performed using Haplotype Caller 830
algorithm in GATK, following Best Practice guidelines. Sequences for predicted peach gene 831
models were retrieved from the Phytozome database [117]. Functional annotation of the variants 832
was performed using SNPEffect v2.0 [118]. 833
834

39
4.4 Results 835
4.4.1 Phenotyping for fruit texture 836
The slow-softening trait is a phenotypic variant of melting flesh texture characterized by a delay 837
of softening processes. At the start of this work, an objective method to identify this trait was not 838
yet available, while firmness measurement through maximum force tests were shown not to 839
correlate to texture properties (see paragraph 3 for more details and references on this topic). The 840
identification of SS trait was (and still is) largely based on sensorial analysis by trained experts, 841
through tactile evaluation and 842
mouthfeel sensations, and in 843
comparison, with reference 844
phenotypes (i.e ‘Big Top’-like 845
varieties). The accession panel and 846
MxR028 progeny were phenotyped 847
for at least 5 years using sensorial 848
analysis throughout SIV stage of 849
fruit development and in post-850
harvest. In addition to the ‘Big Top’ 851
variety, the panel includes well-852
known series of SS accessions, 853
including ‘Honey’ and ‘Romagna’ 854
for nectarines, and ‘Rich’ and 855
‘Royal’ series for peach and some breeding selections derived from them (Table 3). The MxR028 856
progenies was obtained from the cross of two SS nectarine parents, ‘Max10’ and ‘Rebus 028’ 857
(‘Big Top’ x ‘Mayfire’). Seedlings of this progeny (Table 4) were phenotyped through the 858
approach proposed in the previous chapter. This method is based on the use of synthetic indices 859
(Texture Dynamics, TD and K-intercept, K) derived from the measurement of the mechanical 860
properties (Elasticity and Fracturability) of pulp tissues through penetration-based tests. 861
862
Figure 7 The bimodal distribution of the index K.intercept in the MxR028, on the left the M seedlings and on the right the SS seedlings.

40
863
Figure 8 The bimodal distribution of the index K.intercept in the MxR028, under the green halo on the left the M seedlings and 864 under the red halo on the right the SS seedlings; the horizontal bars represent respectively in green the 50% of the data, in red the 865 95% and in blue the 99%. 866
867
As a result of the application of 868
this method on MxR028 seedlings, 869
the K-intercept value showed a 870
bimodal distribution, varying 871
between a minimum of -0.08 and a 872
maximum of 3.20, with 2th and 3rd 873
quartiles included within the intervals 874
0.1-1.1 and 2.2-2.6, respectively 875
Figure 7). The K-index is able to 876
cluster seedlings into two groups of 877
similar sample size, supporting the 878
hypothesis of a mendelian trait 879
(Figure 8). The TD index showed 880
instead a continuous and not normal 881
distribution (SW-test p < 0.05), with 882
a maximum peak ranged between 0.1-0.65, typical of a quantitative behavior (Figure 9). No 883
significant (p<0.05) correlation was found between the K and TD indices and the other tested 884
parameters, such as IAD, acidity, SSC, fruit overcolor, maturity date and fresh weight (Figure 10). 885
Figure 9 The not normal distribution of the TD index in the MxR028; horizontal bars represent respectively in green the 50% of the data in red the 95% and in blue the 99%.

41
Supporting the phenotypical data, the already described pleiotropic effect of the maturity date on 886
the SSC were found[119]. 887
888 Figure 10 Pearson correlation among the TD equation parameters (TD and Intercept) and other fruit attributes. The numbers 889
represent the Pearson correlation coefficient, * mark significant values ('***': p < 0.001 -- '**': p < 0.01 -- '*': p < 0.05 -- 890 '.'': p < 0.1). 891
892

42
4.4.2 Genome-wide association and LD analysis 893
The 119 accessions used for GWA analysis included: 35 slow softening accessions (2 acid 894
nectarines, 10 acid peaches, 19 sub-acid nectarines, 4 sub-acid peaches); 84 melting accessions 895
(19 acid nectarines, 53 acid peaches, 1 sub-acid nectarine and 11 sub acid peaches) (Figure 11, 896
Table 5). Prior to GWA analysis, the genetic structure of the panel was inferred by ADMIXTURE 897
software. 898
899
Figure 11 The counting of the pubescence and acidity mendelian traits between the M and SS accessions used for GWA analysis. 900
901

43
A value of K = 3 minimized cross-validation error, explaining most of the ancestry within the 902
panel. The clusters of Oriental, Occidental and breeding-derived (the most represented) Figure 13, 903
accessions agreed with the already suggested pattern of peach domestication. As a proof-of-904
concept of the statistical power of the GWA approach, the panel was used to map the monogenic 905

44
trait acid/sub-acid (D/d locus). For this analysis, phenotypes were coded as a binary trait, assigning 906
0 - 1 to acid and sub-acid accessions, respectively (Figure 11). 907
908
Figure 12Manhattan plot of the GWAS analysis for the low acidity trait (MLM algorithm in the GAPIT software, corrected 909 using the kinship matrix). In the different color the chromosome reported on the x axis. On the y the log10 of the probability 910 (p). Green line is the threshold calculated using Bonferroni. 911
912
Using FarmCPU algorithm adjusted for population structure, a strong significant signal (p-value 913
1.95e-12 was detected on the proximal regions of chromosome 5 (SNP_IGA_544657, at 635,222 914
bp), in agreement with previous studies [51,120]. 915

45
916
Figure 13 The kinship matrix representing the genetic structure of the panel of accessions. In small on the top left the color key 917 and the color frequency. 918
919
The same approach (FarmCPU algorithm adjusted for population structure) was used for detecting 920
genome-wide associations for the SS trait. A highly significant signal was detected on 921

46
chromosome 8, corresponding to the marker SNP_IGA_881722, with a p-value of 4.0e-7), above 922
to the Bonferroni threshold (Figure 13). 923
924
Figure 14 Manhattan plot of the GWAS analysis for the Slow Softening trait, made using the FarmCPU software. In the 925 different colors, the chromosome reported on the x axis. On the y the log10 of the probability (p). Green line is the threshold 926 calculated using Bonferroni. 927
928
A less significant signal p-value of 6.8e-05 was also detected on chromosome 7, at 929
SNP_IGA_707848. As deduced by QQ-plot inspection, the p-values distribution suggests a 930
reduced background inflation and low number of false positive associations (Figure 14). 931
932
Figure 15 QQ-plot for the SNPs association to the SS trait 933

47
SNP_IGA_881722 is located at 19,889,620 bp in a distal region of chromosome 8 and with a MAF 934
(minor allele frequency) of 0.21. Linkage disequilibrium (LD) analysis of the regions surrounding 935
the SNP_IGA_881722 estimated an extended LD block, which encompasses a region of about 2.3 936
Mb in physical size, roughly comprised between SNP_IGA_881120 (19,710,170 bp) and 937
SNP_IGA_885740 (21,948,219 bp). 938
4.4.3 QTL-mapping of SS trait 939
In order to verify the significance of the locus 940
detected by GWA, a QTL-mapping approach 941
was performed in an F1 MxR028 progeny, 942
using mechanical properties. A genetic map of 943
the MxR028 progeny was built from IPSC 9k 944
SNP array data. A total of 479 markers were 945
arranged in 12 linkage groups which were 946
anchored to the 8 chromosomes of the peach 947
genome sequence: chromosomes 1, 2 and 6 948
were subdivided in 3, 2 and 2 linkage groups, 949
respectively (Figure 19). A total distance of 950
172.6Mb (165.4Mb without counting the gap 951
>20cM) of the peach genome is covered by the 952
map with a mean physical/genetic distance 953
ratio of 216Kb/cM, (maximum ratio of 459 954
Kb/cM in MxR_1b and a minimum of 71 955
Kb/cM MxR_2b). As a first validation of the 956
obtained genetic map for genetic dissection of 957
fruit quality traits, a QTL analysis for fruit 958
acidity was performed: a major QTL was 959
identified in agreement with the already known 960
D locus on chromosome 5 (Figure 19). Mechanical properties obtained from rheological analyses 961
were then used for QTL analysis. All the parameters coming from TD equation including the 962
logistic K-intercept parameters showed a single and significant (p<0.005) association on 963
chromosome 8 with K* of Kruskal-Wallis non-parametric test>19 (significance < 0.0001), and a 964
maximum association of the logistic K-intercept of 47.9 K* (Figure 16). 965
The mapped interval spans a region of about 1.63Mb on chromosome 8, roughly comprised 966
between SNP_IGA_878205 (18.675.130 bp) and SNP_IGA_882809 (20.308.888 bp), being 967
Figure 16 The genetic map of the chromosome 8 showing in color the K score of the Kruskal-Wallis analysis made using MapQTL software and colored by the Harry Plotter software [41]
48
SNP_IGA_882427 the most associated (20.146.776 bp). The interval is composed by hkxhk 968
marker type (heterozygous in both parents), which do not allow the tracing of SS allele in the 969
donor parent Rebus028, although individuals bearing kk markers were all characterized by M 970
texture. Although the SS texture has been reported as dominant over M, QTL analysis do not allow 971
to exclude the hypothesis of a recessive inheritance i.e. Rebus028 parent is homozygous recessive 972
and Max10 heterozygous for the SS allele. Using an interval mapping (IM) approach to map the 973
logistic K-intercept, the identified interval spans 1.64Mb, comprised between SNP_IGA_877294 974
(18.438.875 bp and LOD 5.61) and SNP_IGA_883291 (20.478.408 bp and LOD of 14.91), and a 975
maximum peak corresponding to SNP_IGA_882225 (20.084.243 and LOD of 100). 976
977
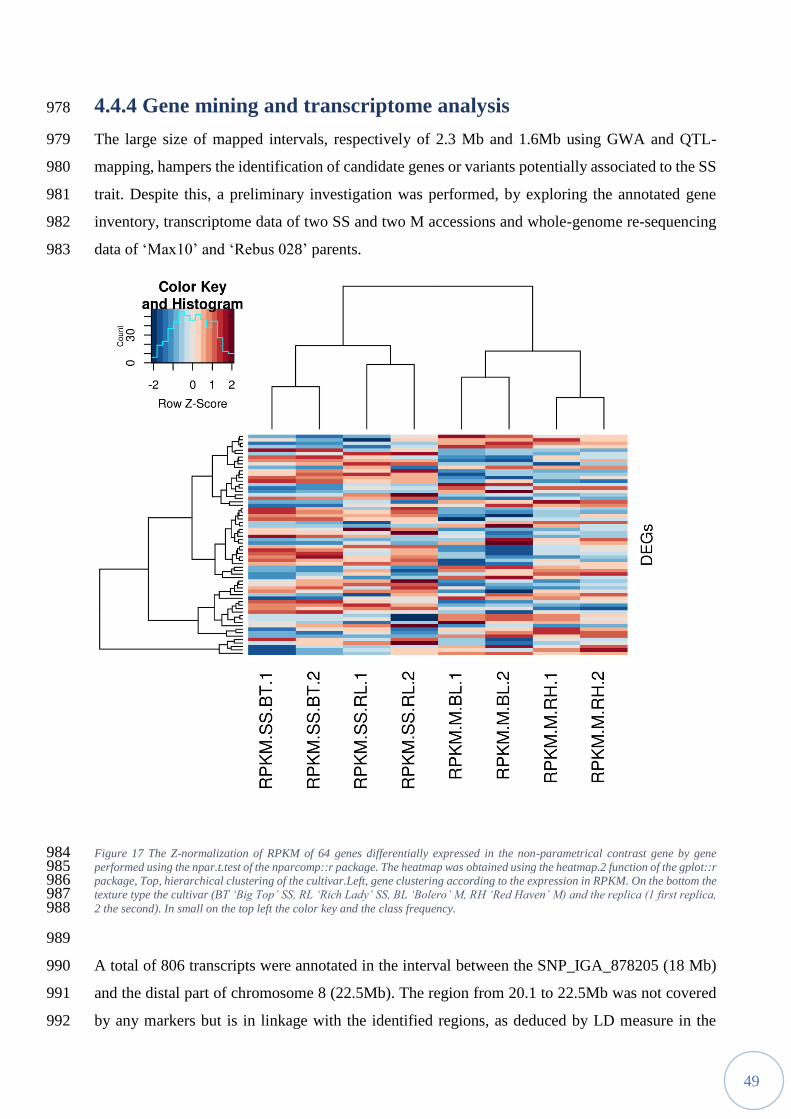
49
4.4.4 Gene mining and transcriptome analysis 978
The large size of mapped intervals, respectively of 2.3 Mb and 1.6Mb using GWA and QTL-979
mapping, hampers the identification of candidate genes or variants potentially associated to the SS 980
trait. Despite this, a preliminary investigation was performed, by exploring the annotated gene 981
inventory, transcriptome data of two SS and two M accessions and whole-genome re-sequencing 982
data of ‘Max10’ and ‘Rebus 028’ parents. 983
Figure 17 The Z-normalization of RPKM of 64 genes differentially expressed in the non-parametrical contrast gene by gene 984 performed using the npar.t.test of the nparcomp::r package. The heatmap was obtained using the heatmap.2 function of the gplot::r 985 package, Top, hierarchical clustering of the cultivar.Left, gene clustering according to the expression in RPKM. On the bottom the 986 texture type the cultivar (BT ‘Big Top’ SS, RL ‘Rich Lady’ SS, BL ‘Bolero’ M, RH ‘Red Haven’ M) and the replica (1 first replica, 987 2 the second). In small on the top left the color key and the class frequency. 988
989
A total of 806 transcripts were annotated in the interval between the SNP_IGA_878205 (18 Mb) 990
and the distal part of chromosome 8 (22.5Mb). The region from 20.1 to 22.5Mb was not covered 991
by any markers but is in linkage with the identified regions, as deduced by LD measure in the 992

50
accession panel (data not shown). Based on the assumption that the gene(s) controlling the SS trait 993
is expressed in ripening fruit tissues, analysis of transcriptome data allowed to reduce the number 994
of candidates to 517 genes. In order to evaluate the potential association between differential 995
expression of any of these genes and the SS trait, their expression pattern was compared by a non-996
parametric contrast, identifying a total of 64 genes with a significant differential expression 997
between SS and M fruits at SIV ripening stage (Figure 17). Based on peach reference transcripts 998
annotation v2.1a, these transcripts were mainly involved in auxin response, fatty acid biosynthesis, 999
cell-wall metabolism, regulation of transcription and RNA metabolism, while 16 were 1000
uncharacterized or unknown. 1001
1002
Figure 18 The count of the SNPs (length 0) and INDELs (length between 1-21) in the SS locus in according these in agree with the 1003 observed pattern of segregation. 1004
1005
Differentially expressed genes (DEGs) were further investigated by the analysis of re-sequencing 1006
data of ‘Max10’ and ‘Rebus028’. Within the identified interval, a total of 10680 variants were 1007

51
found in ‘Max10’ and ‘Rebus 028’: of these,853 were in agreement with the observed pattern of 1008
trait segregation. Most of them (656) are SNPs, while 197 are INDELs ranging from 1 to 22 bp 1009
(Figure 17). Furthermore, 7 variants were identified in coding regions of DEGs, Prupe.8G257900 1010
(coding for tetratricopeptide repeat (TPR)-containing protein), Prupe.8G224000 (coding for 1011
Protein of unknown function, DUF647) and Prupe.8G206600 (coding for UDP-1012
Glycosyltransferase superfamily protein) (1, 2 and 4 variants, respectively), while 33 were 1013
identified in regulatory regions of 16 DEGs (Table 5). 1014
4.5 Discussion 1015
Maintenance of an elevated consistency is necessary for the storage and the handling of 1016
ripe fruits [39]. Due to the commercial success of ‘Big Top’ nectarine[73], the SS texture has been 1017
increasingly studied in the last 20 years[81,82,121–123]. The penetrometer itself, as reported in 1018
paragraph 3, does not support the ability to discriminate among the different texture types, as 1019
already reported in other works [63,66,122]. In addition, this method appears affected by the fruit 1020
ripening season, since the early-ripening accessions tend to show a faster loss of firmness, while 1021
the late-ripening a more slower firmness loss. Using the firmness loss method, Serra et al. [121] 1022
found major QTLs overlapping with the major QTLs for maturity date. 1023
Nevertheless, the lack of an easy and cheap tool to phenotype this melting texture variant hampered 1024
its full exploitation in breeding activities [73]. The most widely used method to score the SS trait 1025
is based on sensorial evaluation, based on mouthfeel and tactile sensation assessed by expert 1026
breeders. However, this approach is limited by its low throughput, requiring several years of 1027
observation for a reliable assessment. Clearly, sensorial evaluation suffers from a certain degree 1028
of subjectivity, which makes observation not generalizable to all experimental conditions. In the 1029
previous chapter, novel indices have been developed, the TD and K-intercept, which allows a more 1030
objective evaluation of fruit textural properties. These methods rely on the measurement of the 1031
mechanical properties of the flesh, which are able to distinguish between SS and M textures. In 1032
the present work, a panel of accessions and a biparental population were phenotyped by sensorial 1033
evaluation and instrumental measures of mechanical parameters, and used in association and 1034
linkage mapping experiment. A major locus was identified in the distal part of chromosome 8, 1035
between 18.4Mb and 20.5 Mb. The distance between the most associated signals in GWAS and 1036
QTL-mapping is 257.156 bp, suggesting the same locus segregates in both populations. 1037
Association and linkage mapping results support the hypothesis of a Mendelian inheritance of the 1038
trait, although this hypothesis should be further verified in other genetic backgrounds. Our results 1039
are consistent with a dominant effect of the allele conferring the SS trait, as early reported[73]. In 1040
52
the MxR028 progeny, most associated SNPs in the identified interval are heterozygous in both 1041
parents, thus not useful for an application in marker assisted selection. The mapped interval spans 1042
a region of about 2 Mb, too large to confidently identify causal variants. In order to increase genetic 1043
resolution of the target locus and restrict the list of candidate genes, a higher number of segregating 1044
progenies should be analyzed, taking advantage of the high degree of molecular polymorphism of 1045
the identified genomic region. Despite the low resolution of the current chromosomal position, the 1046
locus was further explored by using RNA-seq and whole-genome re-sequencing data as a 1047
preliminary step to evaluate possible associations with candidate genes. A total of 64 DEG 1048
transcripts were identified by the comparison of fruit flesh at SIV ripening stage transcriptome of 1049
two SS and two M cultivars: genes related to auxin metabolism and response were detected. As 1050
recently found in peach, auxin homeostasis is crucial for fruit ripening, stimulating ethylene 1051
biosynthesis[69]. Moreover, an auxin biosynthesis gene, YUC11-like, has been recently proposed 1052
as a candidate gene for the stony hard texture trait in peach. Thus, auxin metabolism and/or 1053
response may a play a role in SS trait as well [80]. 1054
4.6 Conclusions 1055
In this work a novel approach based on processed mechanical parameters (see paragraph 1056
3), the texture dynamics index (TD), was applied to phenotype fruit texture types in a segregating 1057
progeny (MxR028). The K-intercept of TD model was able to distinguish melting and slow-1058
softening individuals, allowing the identification of a major locus on the distal part of chromosome 1059
8. QTL-mapping was coupled with GWA analysis in a wide peach collection characterized by 1060
sensorial evaluation of fruit texture. Most associated SNPs detected by association mapping 1061
confirmed the presence of a single locus in the same region of chromosome 8, albeit with a broader 1062
genetic interval compared to QTL analysis. Nevertheless, the size of the associated interval is still 1063
too extended for a preliminary screening of candidate gene variants. 1064
This study is the first reporting a major locus associated to the SS trait in peach, supporting 1065
early observations of a simple inheritance of the trait. Furthermore, results demonstrated the 1066
suitability of the TD index for a quick and reliable phenotyping of peach texture in segregating 1067
progenies, even of relative small size. Considering the complexity of sensorial assessment, this 1068
aspect is of fundamental importance for fine-mapping experiments, which will require a wider 1069
progeny or wide germplasm collections. A more precise mapping would allow the identification 1070
of the gene(s) involved in peach texture and the development of efficient markers for assisted 1071
selection of new cultivars with optimum textural performance, a crucial aspects for increasing 1072
peach fruit competitiveness in the fresh market. 1073
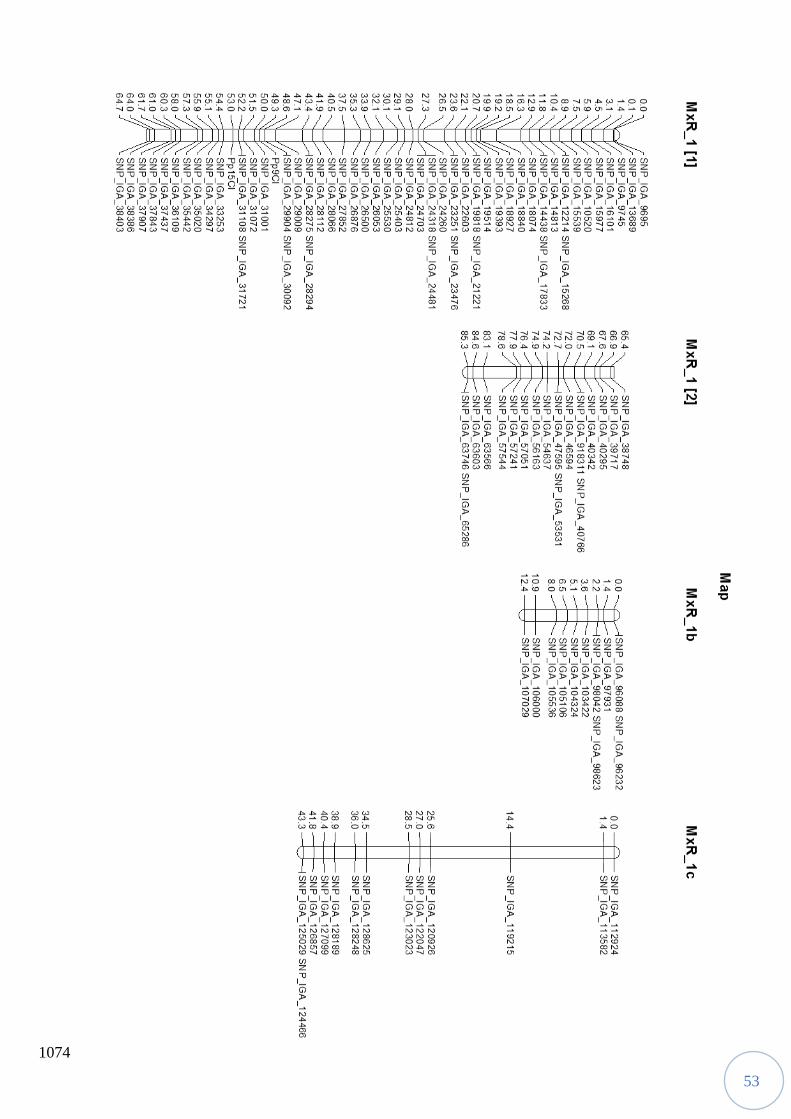
53
1074

54
1075

55
1076
Map
SN
P_IG
A_368650
0.0
SN
P_IG
A_368926
1.4
SN
P_IG
A_378159
2.9
SN
P_IG
A_382215
9.0
SN
P_IG
A_383427
10.4
SN
P_IG
A_384244
13.4
SN
P_IG
A_387021
SN
P_IG
A_385004
14.8
SN
P_IG
A_387198
16.3
SN
P_IG
A_387415
SN
P_IG
A_387459
17.7
SN
P_IG
A_388960
SN
P_IG
A_389048
20.0
SN
P_IG
A_395152
22.6
SN
P_IG
A_394960
SN
P_IG
A_393684
25.3
SN
P_IG
A_392147
26.8
Pp17C
l29.9
SN
P_IG
A_398075
33.1
SN
P_IG
A_398997
34.6
SN
P_IG
A_402724
37.7
SN
P_IG
A_402793
SN
P_IG
A_402828
40.9
SN
P_IG
A_407370
45.6
SN
P_IG
A_408059
47.2
SN
P_IG
A_408505
SN
P_IG
A_408884
47.9
SN
P_IG
A_408981
48.6
SN
P_IG
A_410134
54.7
SN
P_IG
A_410265
SN
P_IG
A_410336
55.4
SN
P_IG
A_410478
56.1
SN
P_IG
A_410794
57.6
SN
P_IG
A_411166
SN
P_IG
A_412338
58.3
SN
P_IG
A_414387
59.3
SN
P_IG
A_437516
64.7
MxR
_4 [1
]
SN
P_IG
A_440116
65.8
snp_4_19087691
68.9
SN
P_IG
A_445689
70.4
SN
P_IG
A_445812
SN
P_IG
A_445821
71.1
SN
P_IG
A_445826
71.8
SN
P_IG
A_445835
73.5
SN
P_IG
A_445871
76.2
SN
P_IG
A_447130
79.2
SN
P_IG
A_449118
SN
P_IG
A_450003
79.9
SN
P_IG
A_453202
80.6
SN
P_IG
A_453669
82.1
SN
P_IG
A_455216
83.5
SN
P_IG
A_465802
85.0
SN
P_IG
A_466377
86.4
SN
P_IG
A_473555
SN
P_IG
A_474444
88.6
SN
P_IG
A_476569
89.3
SN
P_IG
A_499780
91.5
SN
P_IG
A_499790
SN
P_IG
A_500525
92.2
SN
P_IG
A_500532
93.0
SN
P_IG
A_500917
SN
P_IG
A_501464
94.4
SN
P_IG
A_501471
95.2
SN
P_IG
A_501810
95.9
SN
P_IG
A_502744
97.3
SN
P_IG
A_504998
98.8
SN
P_IG
A_513226
SN
P_IG
A_513232
101.1
SN
P_IG
A_513553
101.8
SN
P_IG
A_514224
105.0
SN
P_IG
A_514243
108.3
SN
P_IG
A_514263
112.8
SN
P_IG
A_515075
113.5
SN
P_IG
A_515140
114.2
SN
P_IG
A_516589
115.7
SN
P_IG
A_516818
116.4
SN
P_IG
A_518080
118.8
SN
P_IG
A_518093
SN
P_IG
A_519594
119.5
SN
P_IG
A_525001
121.7
SN
P_IG
A_525520
124.7
SN
P_IG
A_525863
SN
P_IG
A_525984
126.9
SN
P_IG
A_526424
127.6
SN
P_IG
A_529568
129.8
MxR
_4 [2
]
SN
P_IG
A_543179
0.0
SN
P_IG
A_543247
1.4
SN
P_IG
A_547022
7.5
SN
P_IG
A_550504
15.2
SN
P_IG
A_551853
16.7
SN
P_IG
A_552836
18.1
SN
P_IG
A_556288
19.6
SN
P_IG
A_557489
22.5
SN
P_IG
A_557558
25.5
SN
P_IG
A_571548
31.5
SN
P_IG
A_572582
34.5
SN
P_IG
A_585182
SN
P_IG
A_585560
45.6
SN
P_IG
A_585810
SN
P_IG
A_586523
46.3
SN
P_IG
A_585890
47.3
SN
P_IG
A_586935
49.1
SN
P_IG
A_586043
50.4
SN
P_IG
A_586225
51.4
SN
P_IG
A_587238
51.8
SN
P_IG
A_587450
SN
P_IG
A_587455
SN
P_IG
A_587832
54.5
SN
P_IG
A_587708
55.9
SN
P_IG
A_588670
58.8
SN
P_IG
A_589219
60.3
SN
P_IG
A_593320
60.5
SN
P_IG
A_593874
62.0
SN
P_IG
A_594216
63.4
SN
P_IG
A_591896
64.8
SN
P_IG
A_594413
64.9
MxR
_5 [1
]
SN
P_IG
A_596063
75.9
SN
P_IG
A_596332
78.9
MxR
_5 [2
]

56
1077
Ma
p
SN
P_IG
A_655794
0.0
SN
P_IG
A_667164
6.1
SN
P_IG
A_667563
7.5
SN
P_IG
A_669050
15.2
SN
P_IG
A_669734
19.7
SN
P_IG
A_670727
25.8
SN
P_IG
A_671806
27.2
SN
P_IG
A_672404
28.7
SN
P_IG
A_672475
33.2
SN
P_IG
A_675077
36.1
SN
P_IG
A_676161
snp_6_21067422
39.0
SN
P_IG
A_678060
SN
P_IG
A_680032
40.5
SN
P_IG
A_680112
41.2
SN
P_IG
A_680615
45.2
SN
P_IG
A_681950
SN
P_IG
A_682254
SN
P_IG
A_682343
49.1
SN
P_IG
A_686112
SN
P_IG
A_686138
50.6
SN
P_IG
A_688103
SN
P_IG
A_688827
53.6
SN
P_IG
A_689067
54.3
SN
P_IG
A_689771
SN
P_IG
A_689957
SN
P_IG
A_690792
55.8
SN
P_IG
A_691838
58.0
SN
P_IG
A_691866
59.1
SN
P_IG
A_693032
SN
P_IG
A_693075
60.1
SN
P_IG
A_693205
61.2
SN
P_IG
A_693130
SN
P_IG
A_693326
SN
P_IG
A_693379
62.3
SN
P_IG
A_693435
63.0
SN
P_IG
A_693492
64.5
MxR
_6 [1
]
SN
P_IG
A_693592
67.4
SN
P_IG
A_695629
71.0
SN
P_IG
A_695974
SN
P_IG
A_696241
71.9
SN
P_IG
A_699844
74.8
SN
P_IG
A_700552
SN
P_IG
A_700814
76.3
MxR
_6 [2
]
SN
P_IG
A_611891
0.0
SN
P_IG
A_609984
2.9
SN
P_IG
A_605290
5.9
snp_6_5294415
8.8
SN
P_IG
A_640430
21.8 M
xR
_6b
SN
P_IG
A_725918
SN
P_IG
A_725139
SN
P_IG
A_724309
SN
P_IG
A_723701
0.0
SN
P_IG
A_722956
0.8
SN
P_IG
A_719222
4.2
SN
P_IG
A_718919
7.5
SN
P_IG
A_716322
8.2
SN
P_IG
A_714864
SN
P_IG
A_713301
8.6
SN
P_IG
A_710792
9.0
SN
P_IG
A_703355
10.4
SN
P_IG
A_737790
12.7
SN
P_IG
A_740785
13.4
SN
P_IG
A_740881
14.1
SN
P_IG
A_740948
16.5
SN
P_IG
A_742238
19.9
SN
P_IG
A_743057
21.6
SN
P_IG
A_745712
SN
P_IG
A_745880
26.2
SN
P_IG
A_746147
SN
P_IG
A_746204
SN
P_IG
A_748637
26.9
SN
P_IG
A_750721
28.1
SN
P_IG
A_754512
29.4
SN
P_IG
A_758767
30.6
SN
P_IG
A_769471
38.7
SN
P_IG
A_769572
39.9
SN
P_IG
A_769675
42.4
SN
P_IG
A_770978
46.2
SN
P_IG
A_771684
50.1
SN
P_IG
A_776826
52.6
SN
P_IG
A_776994
55.1
SN
P_IG
A_778002
58.9
SN
P_IG
A_778535
60.2
SN
P_IG
A_780816
61.4
SN
P_IG
A_781317
62.7
SN
P_IG
A_783342
63.7
SN
P_IG
A_781685
63.9
MxR
_7 [1
]

57
1078
Figure 19 Genetic map of MxR028 population, 12 linkage groups (anchored to the 8 chromosomes) represented with integrated 1079 map, plotted using JoinMap 4.1. 1080
1081
Map
SN
P_IG
A_782867
66.4
SN
P_IG
A_783950
67.2
SN
P_IG
A_783262
SN
P_IG
A_783973
68.9
SN
P_IG
A_784030
69.7
SN
P_IG
A_784616
70.4
SN
P_IG
A_785868
SN
P_IG
A_786682
71.8
SN
P_IG
A_787134
SN
P_IG
A_789414
snp_7_20169559
74.0
SN
P_IG
A_789700
SN
P_IG
A_789941
74.8
SN
P_IG
A_790469
76.2
SN
P_IG
A_790600
76.6
SN
P_IG
A_790678
SN
P_IG
A_790944
76.9
SN
P_IG
A_790967
78.4
SN
P_IG
A_791108
SN
P_IG
A_791504
SN
P_IG
A_791580
79.9
SN
P_IG
A_791780
87.6
SN
P_IG
A_792240
100.6
MxR
_7 [2
]
SN
P_IG
A_806564
0.0
SN
P_IG
A_817915
SN
P_IG
A_819591
1.4
SN
P_IG
A_824066
SN
P_IG
A_824074
5.9
SN
P_IG
A_824728
10.4
SN
P_IG
A_841696
16.5
SN
P_IG
A_838376
SN
P_IG
A_836857
17.9
SN
P_IG
A_835294
19.4
SN
P_IG
A_834505
20.8
SN
P_IG
A_853020
22.3
SN
P_IG
A_853113
23.7
SN
P_IG
A_853728
26.7
SN
P_IG
A_855356
31.1
SN
P_IG
A_856141
32.6
SN
P_IG
A_867794
33.0
SN
P_IG
A_867978
34.5
SN
P_IG
A_868339
35.9
SN
P_IG
A_868544
38.9
SN
P_IG
A_868870
40.3
SN
P_IG
A_857951
42.0
SN
P_IG
A_869487
43.3
SN
P_IG
A_858039
43.5
SN
P_IG
A_859441
44.9
SN
P_IG
A_870084
46.2
SN
P_IG
A_862006
46.3
SN
P_IG
A_862321
47.8
SN
P_IG
A_870110
SN
P_IG
A_862801
49.2
SN
P_IG
A_864110
52.2
SN
P_IG
A_870191
55.2
SN
P_IG
A_866829
SN
P_IG
A_870320
56.7
SN
P_IG
A_867575
58.1
SN
P_IG
A_870509
61.2
SN
P_IG
A_871262
62.6
SN
P_IG
A_871382
63.3
SN
P_IG
A_871423
64.8
MxR
_8 [1
]
SN
P_IG
A_871566
67.0
SN
P_IG
A_872101
68.5
SN
P_IG
A_872411
69.2
SN
P_IG
A_877294
78.8
SN
P_IG
A_877370
80.2
SN
P_IG
A_876618
80.3
SN
P_IG
A_878205
81.7
SN
P_IG
A_878210
82.4
SN
P_IG
A_878831
83.1
SN
P_IG
A_878981
SN
P_IG
A_879061
83.9
SN
P_IG
A_879131
84.6
SN
P_IG
A_879224
SN
P_IG
A_879291
86.1
snp_scaffo
ld_8_18584
87.0
SN
P_IG
A_882225
91.7
SN
P_IG
A_882427
93.6
SN
P_IG
A_882454
95.0
SN
P_IG
A_882680
97.2
SN
P_IG
A_882752
SN
P_IG
A_882809
SN
P_IG
A_883191
98.0
MxR
_8 [2
]

58
1082
Figure 20 QTL mapping of acidity, recovering the Locus D. In red the LOD value, the dashed line represents the threshold obtained 1083 by permutation test (3.1 LOD). 1084
1085

59
Table 3 phenotypes collected in MxR28 seedlings 1086
1087
individualnames_ K.Intercept TD Elasticity FracturabilityLogistic_K MD I_DA Weight Blush RSR TDy2 Acidity Type
MxR28-003 2,12 0,38 1,82 4,85 2 252 0,8 147 75 12,8 0,22 1
MxR28-004 3,11 0,64 1,84 2,86 2 NA 0,3 126 85 14,2 0,22 0
MxR28-006 0,38 0,51 2,59 5,1 1 223 0,3 121 76 11,2 0,24 1
MxR28-007 1,49 0,38 2,15 5,73 1 218 0,2 115 45 8,6 NA 0
MxR28-014 1,13 0,27 1,81 6,81 1 216 0,3 110 73 11 0,25 1
MxR28-016 2,52 0,22 1,84 8,24 2 218 0,3 128 90 8,8 NA 0
MxR28-018 2,58 0,22 1,82 8,38 2 220 0,3 134 75 11 NA 1
MxR28-023 0,38 1,49 2,99 2 1 232 0,3 119 91 13 NA 0
MxR28-034 2,45 0,21 1,44 6,93 2 250 0,5 154 79 14 0,22 0
MxR28-042 2,55 1,02 2,48 2,42 2 241 0,6 131 65 12,2 0,23 0
MxR28-045 0,87 0,55 2,45 4,49 1 NA NA NA NA NA NA NA
MxR28-049 3,21 0,17 1,69 9,66 2 210 NA NA NA NA NA NA
MxR28-051 0,9 0,86 2,36 2,75 1 NA 0,8 129 98 13,7 0,25 1
MxR28-052 0,18 1,77 3,65 2,06 1 NA 0,5 126 79 12,4 0,23 1
MxR28-055 2,61 0,5 1,5 3,01 2 243 0,7 129 63 11 0,21 0
MxR28-057 0,31 0,49 2,86 5,89 1 NA 0,8 166 74 13,4 0,22 1
MxR28-061 0,84 0,67 2,5 3,73 1 243 0,7 116 65 13 NA 1
MxR28-064 0,24 0,46 3,73 8,15 1 238 0,6 124 93 11,4 0,24 0
MxR28-066 2,88 0,19 1,76 9,01 2 210 NA NA NA NA NA NA
MxR28-069 2,81 0,2 1,77 8,87 2 NA NA NA NA NA NA NA
MxR28-077 0,21 1,3 3,37 2,6 1 234 0,5 113 69 11,7 0,27 0
MxR28-080 0,38 1,49 2,99 2 1 234 0,4 96 95 13,4 NA 0
MxR28-081 0,64 -4,62 2,91 -0,63 1 238 0,4 109 60 10,6 0,23 1
MxR28-089 0,28 2,03 3,17 1,56 1 NA 0,7 132 64 12,2 NA 0
MxR28-097 2,38 0,24 1,87 7,94 2 241 0,6 132 64 12,6 NA 0
MxR28-103 1,92 0,29 2 6,85 2 216 0,3 150 81 9 NA 0
MxR28-106 0,41 1,37 2,94 2,14 1 220 0,2 154 78 8,8 NA 0
MxR28-107 0,41 1,37 2,94 2,14 1 218 0,3 149 88 10,2 NA 1
MxR28-108 3,21 0,3 1,32 4,46 2 NA 0,3 137 61 12 0,22 1
MxR28-109 0,44 1,27 2,89 2,27 1 NA NA NA NA NA NA NA
MxR28-117 0,11 5,01 3,72 0,74 1 NA 0,3 128 75 12 NA 1
MxR28-118 0,28 0,08 1,67 20,6 1 210 NA NA NA NA 0,42 NA
MxR28-120 0,97 0,58 2,42 4,17 1 210 0,3 123 61 11,4 NA 0
MxR28-123 0,28 1 2,72 2,72 1 245 0,6 96 63 11,1 0,27 0
MxR28-126 1,96 0,4 1,63 4,05 2 234 0,7 138 81 12,8 0,2 1
MxR28-128 1 0,56 2,39 4,27 1 238 0,4 126 79 13,6 NA 1
MxR28-132 2,28 2,57 2,61 1,02 2 241 0,8 153 48 14 0,21 1
MxR28-133 0,87 0,65 2,48 3,84 1 NA 0,3 119 80 10,4 NA 0
MxR28-136 0,28 2,03 3,17 1,56 1 210 NA NA NA NA NA NA
MxR28-138 0,41 1,37 2,94 2,14 1 NA 0,6 148 71 12,4 NA 1
MxR28-139 1,03 0,54 2,38 4,38 1 NA 0,5 159 64 12 NA 0
MxR28-141 0,64 0,46 2,17 4,73 1 210 0,2 NA NA NA 0,28 NA
MxR28-147 2,71 0,21 1,79 8,66 2 216 0,2 136 66 8,6 NA 0
MxR28-148 1,99 0,23 1,71 7,3 2 234 0,8 94 89 13,8 0,22 1
MxR28-149 2,35 0,24 1,88 7,87 2 NA NA NA NA NA NA NA
MxR28-152 -0,09 0,09 2,3 25,27 1 250 0,5 159 72 13 0,26 0
MxR28-159 2,02 0,28 1,97 7,1 2 216 0,2 79 79 9 NA 0
MxR28-160 2,94 0,32 1,22 3,8 2 234 0,4 130 80 13,5 0,23 1
MxR28-163 2,65 0,21 1,81 8,52 2 220 0,2 104 85 10,4 NA 1
MxR28-164 2,22 0,25 1,91 7,57 2 NA NA NA NA NA NA NA
MxR28-165 1,46 0,38 2,17 5,64 1 NA 0,4 NA NA NA NA NA
MxR28-171 0,28 2,03 3,17 1,56 1 210 NA NA NA NA NA NA
MxR28-173 1,43 -1,29 2,32 -1,81 1 216 NA NA NA NA 0,37 NA
MxR28-176 1,99 0,28 1,98 7,02 2 216 NA NA NA NA NA NA
MxR28-178 2,48 0,23 1,85 8,17 2 NA 0,7 123 86 12,9 NA 0
MxR28-179 1,66 0,6 2,35 3,95 2 NA 0,7 128 87 15 0,2 1
MxR28-191 0,05 12,16 4,26 0,35 1 216 0,3 99 67 9 NA 0
MxR28-192 2,32 0,24 1,89 7,8 2 216 0,3 105 71 8 NA 0
MxR28-204 0,77 0,79 2,4 3,03 1 218 NA NA NA NA 0,24 NA
MxR28-206 2,48 0,23 1,85 8,17 2 245 0,6 165 71 11,9 NA 0
MxR28-208 0,77 0,44 2,36 5,35 1 218 NA NA NA NA 0,29 NA
MxR28-210 1,66 0,17 1,63 9,75 2 247 0,8 190 75 12,6 0,23 1
MxR28-213 1,13 0,97 3,53 3,65 1 232 0,5 119 87 12,6 0,23 0
MxR28-218 2,28 0,27 1,62 5,96 2 245 0,8 119 50 10,4 0,21 1
MxR28-221 3,11 0,18 1,71 9,47 2 216 0,3 132 75 9 NA 0
MxR28-227 0,87 3,95 3,65 0,92 1 234 0,6 120 90 12,4 0,25 1
MxR28-228 0,51 1,11 2,81 2,54 1 NA 0,2 158 84 9,6 NA 0
MxR28-229 0,61 0,93 2,7 2,91 1 216 0,3 127 62 10 NA 1
MxR28-231 1 0,28 2,13 7,64 1 243 0,5 100 73 11,5 0,21 0
MxR28-242 0,54 1,04 2,77 2,66 1 218 0,2 NA NA NA NA NA

60
Table 4DEGs in SS locus between the M and SS accessions. 1088
1089
1090
Gene Position foldchange CDS variants Variants Flanking (2k) Annotation
Prupe.8G192500.v2.1 18643902-18646172 2,71 0 0 Auxin-responsive family protein
Prupe.8G192700.v2.1 18651621-18652697 1,58 0 0 auxin-responsive family protein
Prupe.8G196600.v2.1 18815103-18816216 -1,49 0 8
Prupe.8G196900.v2.1 18829145-18831138 2,82 0 8 cytochrome P450, family 82, subfamily G, polypeptide 1
Prupe.8G200200.v2.1 18962947-18967387 -1,28 0 0 GPI transamidase component PIG-S-related
Prupe.8G202800.v2.1 19101309-19102983 -1,82 0 1 Ribosomal protein L13 family protein
Prupe.8G202900.v2.1 19103722-19105639 -1,49 0 0 cytochrome B5 isoform B
Prupe.8G203200.v2.1 19114472-19117029 -1,35 0 0 BSD domain-containing protein
Prupe.8G203400.v2.1 19124862-19128400 -3,7 0 0 proteolysis 1
Prupe.8G204600.v2.1 19182750-19185601 -1,22 0 0 homolog of bacterial PANC
Prupe.8G205200.v2.1 19212279-19212973 4,29 0 0
Prupe.8G206400.v2.1 19321695-19324805 1,24 0 0 peroxisomal 3-ketoacyl-CoA thiolase 3
Prupe.8G210900.v2.1 19510008-19512968 -1,39 0 3 Glutaredoxin family protein
Prupe.8G211800.v2.1 19567128-19577259 3,67 0 0 global transcription factor group B1
Prupe.8G215400.v2.1 19776926-19780643 2,03 0 0 indole-3-acetic acid inducible 11
Prupe.8G216200.v2.1 19816130-19818295 -1,59 0 0 plasmodesmata-located protein 2
Prupe.8G216400.v2.1 19826510-19828518 1,79 0 0 Glutathione S-transferase family protein
Prupe.8G219000.v2.1 19953927-19959169 1,21 0 0 no pollen germination related 2
Prupe.8G220500.v2.1 20027790-20030920 -1,23 0 0 vacuolar protein sorting-associated protein 2.3
Prupe.8G220800.v2.1 20041459-20047260 -1,75 0 0 Ypt/Rab-GAP domain of gyp1p superfamily protein
Prupe.8G221000.v2.1 20062678-20065027 -1,37 0 0
Prupe.8G222400.v2.1 20145270-20150752 1,2 0 1 ARM repeat superfamily protein
Prupe.8G222700.v2.1 20160344-20164335 -1,33 0 0 Peptidase S24/S26A/S26B/S26C family protein
Prupe.8G223500.v2.1 20189766-20190797 1,92 0 0
Prupe.8G223600.v2.1 20191345-20195989 -1,2 0 1 translocase inner membrane subunit 44-2
Prupe.8G224100.v2.1 20213330-20216347 -1,22 0 2
Prupe.8G225000.v2.1 20254913-20257736 1,39 0 1
Prupe.8G229700.v2.1 20527683-20532213 -1,61 0 0 IND1(iron-sulfur protein required for NADH dehydrogenase)-like
Prupe.8G230700.v2.1 20573325-20576549 1,26 0 0 WRKY DNA-binding protein 21
Prupe.8G232400.v2.1 20653624-20655672 1,59 0 0 AUX/IAA transcriptional regulator family protein
Prupe.8G232500.v2.1 20655080-20657037 -1,67 0 0 Primosome PriB/single-strand DNA-binding
Prupe.8G233400.v2.1 20711762-20715713 2,47 0 0
Prupe.8G233500.v2.1 20724576-20727588 1,68 0 0 Ggamma-subunit 1
Prupe.8G236700.v2.1 20916860-20917895 -1,32 0 0
Prupe.8G237300.v2.1 20955842-20957155 1,59 0 0 Protein of unknown function (DUF581)
Prupe.8G238200.v2.1 20984438-20987946 -1,43 0 1 Transducin/WD40 repeat-like superfamily protein
Prupe.8G238300.v2.1 20991186-20993923 -1,39 0 1 Protein of unknown function (DUF581)
Prupe.8G238900.v2.1 21011896-21014402 -1,35 0 1 Ribosomal protein S13/S18 family
Prupe.8G239300.v2.1 21041987-21043487 1,92 0 1 Plant protein of unknown function (DUF868)
Prupe.8G240900.v2.1 21114323-21118055 -1,37 0 0 RAN GTPase activating protein 1
Prupe.8G241400.v2.1 21137506-21139618 1,86 0 1 Protein of unknown function (DUF3049)
Prupe.8G242600.v2.1 21199953-21203790 -1,54 0 0 TRICHOME BIREFRINGENCE-LIKE 11
Prupe.8G245000.v2.1 21310320-21318203 1,22 0 1 REF4-related 1
Prupe.8G247100.v2.1 21399627-21404706 -1,89 0 0 oxidoreductase, 2OG-Fe(II) oxygenase family protein
Prupe.8G247600.v2.1 21415077-21417619 -1,41 0 0 ribosomal RNA processing 4
Prupe.8G248600.v2.1 21474403-21479245 -1,41 0 0 Major facilitator superfamily protein
Prupe.8G253000.v2.1 21670736-21673787 1,21 0 0 tubby like protein 3
Prupe.8G254700.v2.1 21759740-21761601 -1,69 0 1
Prupe.8G257400.v2.1 21914479-21916328 1,29 0 1 Seven transmembrane MLO family protein
Prupe.8G259800.v2.1 21998521-22007097 1,66 0 0 multidrug resistance-associated protein 4
Prupe.8G261000.v2.1 22055341-22057371 1,28 0 0
Prupe.8G261100.v2.1 22057662-22058465 -1,3 0 0 complex 1 family protein / LVR family protein
Prupe.8G263800.v2.1 22155178-22158557 3,19 0 0 AtL5
Prupe.8G265300.v2.1 22219511-22224016 -1,45 0 0 fumarase 1
Prupe.8G266200.v2.1 22269906-22276951 -1,2 0 0 SET domain-containing protein
Prupe.8G267300.v2.1 22313937-22317753 -1,54 0 0
Prupe.8G267400.v2.1 22319209-22322641 1,11 0 0 NAD+ transporter 1
Prupe.8G267800.v2.1 22334771-22338301 1,38 0 0 nodulin MtN21 /EamA-like transporter family protein
Prupe.8G270100.v2.1 22426303-22428517 -1,28 0 0 ADP-ribosylation factor family protein
Prupe.8G270200.v2.1 22429206-22433386 -1,33 0 0 DNAJ heat shock family protein
Prupe.8G270600.v2.1 22454004-22457476 1,7 0 0 Heat shock protein DnaJ with tetratricopeptide repeat
Prupe.8G257900.v2.1 21932617-21936030 -1,28 1 0 tetratricopeptide repeat (TPR)-containing protein
Prupe.8G224000.v2.1 20209396-20213267 -1,23 2 0 Protein of unknown function, DUF647
Prupe.8G206600.v2.1 19334972-19340609 1,14 4 0 UDP-Glycosyltransferase superfamily protein

61
Table 5 germplasm phenotypes for texture (melting/slow softening), skin pubescence (Locus G), and flesh acidity (Locus D) 1091
1092

62
5 General conclusions 1093
The aim of this research was to deepen the knowledge about the slow softening texture in 1094
peach. 1095
Two major goals achieved are the setup of the texture dynamics models (TD) as a reliable 1096
tool to score difference in texture and the detection of SS major locus and his dominant mendelian 1097
inheritance. 1098
Results from RNA-seq and NGS approaches as speculative data, because: a) not supported 1099
by measure of fruit hormones content; b) the so wide locus found did not allow to indicate a 1100
putative variant. 1101
TD model could be applied to deep the knowledge about texture in peach, with the possibility to 1102
find new textures or to dissect the already known textures to find modulatory genes. 1103
Findings the locus and the mendelian inheritance of the SS trait will help to design future 1104
experiments and would allow a more precise mapping and identification of the gene(s) involved 1105
in peach texture. Additionally, the new tool (TD) will help the development of efficient markers 1106
for assisted selection in breeding for optimum textural performance, a crucial aspect for increasing 1107
peach fruit competitiveness in the fresh market. 1108
1109
63
6 References 1110
1. Szczesniak AS. Texture is a sensory property. Food Qual Prefer. 2002;13: 215–225. 1111
doi:10.1016/S0950-3293(01)00039-8 1112
2. Lawless HT, Heimann H. Sensory Evaluation of Food 2nd Ed. Science. 2010. 1113
doi:10.1007/978-1-4419-6488-5 1114
3. Johansson RS, Flanagan JR. Coding and use of tactile signals from the fingertips in object 1115
manipulation tasks. Nat Rev Neurosci. 2009;10: 345–359. doi:10.1038/nrn2621 1116
4. Waldron KW, Smith AC, Parr AJ, Ng A, Parker ML. New approaches to understanding and 1117
controlling cell separation in relation to fruit and vegetable texture. Trends Food Sci 1118
Technol. 1997;8: 213–221. doi:10.1016/S0924-2244(97)01052-2 1119
5. Boland AB, Delahunty CM, Van Ruth SM. Influence of the texture of gelatin gels and pectin 1120
gels on strawberry flavour release and perception. Food Chem. 2006;96: 452–460. 1121
doi:10.1016/j.foodchem.2005.02.027 1122
6. Rosenthal AJ. Texture Profile Analysis - How Important Are the Parameters? J Texture 1123
Stud. 2010;41: 672–684. doi:10.1111/j.1745-4603.2010.00248.x 1124
7. Tournier C, Sulmont-Rosse C, Guichard E. Flavour perception: aroma, taste and texture 1125
interactions. Food. 2007;1: 246–257. Available: 1126
http://www.globalsciencebooks.info/Journals/images/GSB_EditorBoards.pdf 1127
8. Foster KD, Woda a, Peyron M a. Effect of texture of plastic and elastic model foods on the 1128
parameters of mastication. J Neurophysiol. 2006;95: 3469–79. doi:10.1152/jn.01003.2005 1129
9. Rao MA. Rheology of Fluid, Semisolid, and Solid Foods [Internet]. Boston, MA: Springer 1130
US; 2014. doi:10.1007/978-1-4614-9230-6 1131
10. Voragen AGJ, Coenen GJ, Verhoef RP, Schols HA. Pectin, a versatile polysaccharide 1132
present in plant cell walls. Struct Chem. 2009;20: 263–275. doi:10.1007/s11224-009-9442-1133
z 1134
11. Kim Y, Yoo YH, Kim KO, Park JB, Yoo SH. Textural properties of gelling system of low-1135
methoxy pectins produced by demethoxylating reaction of pectin methyl esterase. J Food 1136
Sci. 2008;73: 367–372. doi:10.1111/j.1750-3841.2008.00771.x 1137
12. Paniagua C, Posé S, Morris VJ, Kirby AR, Quesada M a, Mercado J a. Fruit softening and 1138
pectin disassembly: an overview of nanostructural pectin modifications assessed by atomic 1139
force microscopy. Ann Bot. 2014;114: 1375–83. doi:10.1093/aob/mcu149 1140
13. Prasanna V, Prabha TN, Tharanathan RN. Fruit Ripening Phenomena–An Overview. Crit 1141
Rev Food Sci Nutr. 2007;47: 1–19. doi:10.1080/10408390600976841 1142
14. Kanehisa M, Furumichi M, Tanabe M, Sato Y, Morishima K. KEGG: New perspectives on 1143

64
genomes, pathways, diseases and drugs. Nucleic Acids Res. 2017;45: D353–D361. 1144
doi:10.1093/nar/gkw1092 1145
15. Hayama H, Ito A, Moriguchi T, Kashimura Y. Identification of a new expansin gene closely 1146
associated with peach fruit softening. Postharvest Biol Technol. 2003;29: 1–10. 1147
doi:10.1016/S0925-5214(02)00216-8 1148
16. Brummell DA, Harpster MH. Cell wall metabolism in fruit softening and quality and its 1149
manipulation in transgenic plants. Plant Mol Biol. 2001;47: 311–340. 1150
doi:10.1023/A:1010656104304 1151
17. Hayama H, Shimada T, Fujii H, Ito A, Kashimura Y. Ethylene-regulation of fruit softening 1152
and softening-related genes in peach. J Exp Bot. 2006;57: 4071–4077. 1153
doi:10.1093/jxb/erl178 1154
18. Brownleader MD, Jackson P, Mobasheri A, Pantelides a T, Sumar S, Trevan M, et al. 1155
Molecular aspects of cell wall modifications during fruit ripening. Crit Rev Food Sci Nutr. 1156
1999;39: 149–164. doi:10.1080/10408399908500494 1157
19. Wilkinson C, Dijksterhuis GB, Minekus M. From food structure to texture. 2001;11: 442–1158
450. 1159
20. Varela P, Ares G. Sensory profiling, the blurred line between sensory and consumer science. 1160
A review of novel methods for product characterization. Food Res Int. Elsevier Ltd; 1161
2012;48: 893–908. doi:10.1016/j.foodres.2012.06.037 1162
21. Essex E. Objective measurements for texture in foods. J Texture Stud. 1969;1: 19–37. 1163
Available: http://onlinelibrary.wiley.com/doi/10.1111/j.1745-1164
4603.1969.tb00953.x/abstract 1165
22. Harker FR, Redgwell RJ, Hallett IC, Murray SH, Carter G. Texture of Fresh Fruit. 1166
Horticultural Reviews. Oxford, UK: John Wiley & Sons, Inc.; 2010. pp. 121–224. 1167
doi:10.1002/9780470650646.ch2 1168
23. Otegbayo B, Aina J, Abbey L, Sakyi-Dawson E, Bokanga M, Asiedu R. Texture Profile 1169
Analysis Applied To Pounded Yam. J Texture Stud. 2007;38: 355–372. doi:10.1111/j.1745-1170
4603.2007.00101.x 1171
24. Tabilo-Munizaga G, Barbosa-Cánovas G V. Rheology for the food industry. J Food Eng. 1172
2005;67: 147–156. doi:10.1016/j.jfoodeng.2004.05.062 1173
25. Rao MA. Rheology of Fluid, Semisolid, and Solid Foods. 2014; doi:10.1007/978-1-4614-1174
9230-6 1175
26. Barbosa-Cánovas G V., Kokini JL, Ma L, Ibarz A. The Rheology of Semiliquid Foods. Adv 1176
Food Nutr Res. 1996;39: 1–69. doi:10.1016/S1043-4526(08)60073-X 1177

65
27. Prakash S, Tan DDY, Chen J. Applications of tribology in studying food oral processing 1178
and texture perception. Food Res Int. Elsevier Ltd; 2013;54: 1627–1635. 1179
doi:10.1016/j.foodres.2013.10.010 1180
28. Kilcast D. Texture in Food. Texture in Food: Solid Foods v. 2. 2004. 1181
doi:10.1533/9781855737082.1.3 1182
29. Costa F, Cappellin L, Longhi S, Guerra W, Magnago P, Porro D, et al. Assessment of apple 1183
(Malus×domestica Borkh.) fruit texture by a combined acoustic-mechanical profiling 1184
strategy. Postharvest Biol Technol. Elsevier B.V.; 2011;61: 21–28. 1185
doi:10.1016/j.postharvbio.2011.02.006 1186
30. Varela P, Salvador A, Fiszman S. Changes in apple tissue with storage time: Rheological, 1187
textural and microstructural analyses. J Food Eng. 2007;78: 622–629. 1188
doi:10.1016/j.jfoodeng.2005.10.034 1189
31. Kj??lstad L, Isaksson T, Rosenfeld HJ. Prediction of sensory quality by near infrared 1190
reflectance analysis of frozen and freeze dried green peas (Pisum sativum). J Sci Food 1191
Agric. 1990;51: 247–260. doi:10.1002/jsfa.2740510212 1192
32. Martens M, Martens H. NEAR-INFRARED REFLECTANCE DETERMINATION OF 1193
SENSORY QUALITY OF PEAS. Appl Spectrosc. 1986;40: 303–310. 1194
doi:10.1366/0003702864509114 1195
33. Roylance D. Stress-Strain Curves. Test. 2001; 1–14. doi:10.1361/aac 1196
34. Harker FR, Redgwell RJ, Hallett IC, Murray SH, Carter G. Texture of Fresh Fruit. In: Janick 1197
J, editor. Horticultural Reviews. Oxford, UK: John Wiley & Sons, Inc.; 2010. pp. 121–224. 1198
doi:10.1002/9780470650646.ch2 1199
35. Bourne MCC. Food texture and viscosity: concepts and measurements. 2002. 1200
36. Ziosi V, Noferini M, Fiori G, Tadiello a., Trainotti L, Casadoro G, et al. A new index based 1201
on vis spectroscopy to characterize the progression of ripening in peach fruit. Postharvest 1202
Biol Technol. 2008;49: 319–329. doi:10.1016/j.postharvbio.2008.01.017 1203
37. Finney EE, Abbott JA. METHODS FOR TESTING THE DYNAMIC MECHANICAL. 1204
1978;2: 55–74. 1205
38. Contador L, Díaz M, Hernández E, Shinya P, Infante R. The relationship between 1206
instrumental tests and sensory determinations of peach and nectarine texture. Eur J Hortic 1207
Sci. 2016;81: 189–196. doi:10.17660/eJHS.2016/81.4.1 1208
39. Byrne DH. Trends in stone fruit cultivar development. Horttechnology. 2005;15: 494–500. 1209
40. Thompson AK. Fruit and Vegetable Storage: Hypobaric, Hyberbaric and Controlled 1210
Atmosphere. 2016. 1211

66
41. Thompson AK. Fruit and Vegetables [Internet]. Chichester, UK: John Wiley & Sons, Ltd; 1212
2014. doi:10.1002/9781118653975 1213
42. Layne D, Bassi D. The peach: botany, production and uses [Internet]. Layne D, Bassi D, 1214
editors. The peach: botany, production and uses. Wallingford: CABI; 2008. 1215
doi:10.1079/9781845933869.0000 1216
43. Baird WV, Estager AS, Wells JK. Estimating Nuclear DNA Content in Peach and Related 1217
Diploid Species Using Laser Flow Cytometry and DNA Hybridization. J Am Soc Hortic 1218
Sci. 1994;119: 1312–1316. 1219
44. Shi S, Li J, Sun J, Yu J, Zhou S. Phylogeny and Classification of Prunus sensu lato 1220
(Rosaceae). J Integr Plant Biol. 2013;55: 1069–1079. doi:10.1111/jipb.12095 1221
45. Alphonse De Candolle. Origine des plantes cultivées. Germer-Baillière. 1886; 1689–1699. 1222
46. Zheng Y, Crawford GW, Chen X. Archaeological evidence for peach (Prunus persica) 1223
cultivation and domestication in China. PLoS One. 2014;9. 1224
doi:10.1371/journal.pone.0106595 1225
47. Dirlewanger E, Cosson P, Boudehri K, Renaud C, Capdeville G, Tauzin Y, et al. 1226
Development of a second-generation genetic linkage map for peach [Prunus persica (L.) 1227
Batsch] and characterization of morphological traits affecting flower and fruit. Tree Genet 1228
Genomes. 2006;3: 1–13. doi:10.1007/s11295-006-0053-1 1229
48. FAOSTAT. FAOSTAT. Food and Agricultural Organization of the United Nations. 2014. 1230
49. FAOSTAT. FAOSTAT Database on Agriculture. In: FAO - Food and Agriculture 1231
Organization of the United Nations. 2015. 1232
50. Giovannini D, Liverani A, Sartori A, Cipriani G. Botanical and Pomological Aspects of 1233
Stone Fruits Physiology, Agronomy and Orchard Management. Agric Food Biotechnol 1234
Olea Eur Stone Fruit. 2015; 161–242. doi:10.2174/97816080599351150101 1235
51. Micheletti D, Dettori MT, Micali S, Aramini V, Pacheco I, Da Silva Linge C, et al. Whole-1236
genome analysis of diversity and SNP-major gene association in peach germplasm. PLoS 1237
One. 2015;10: 1–19. doi:10.1371/journal.pone.0136803 1238
52. Anderson J V. Advances in Plant Dormancy. Sunflower and Plant Biology Research. 2015. 1239
doi:10.1017/CBO9781107415324.004 1240
53. Reinoso H, Luna V, Pharis RP, Bottini R. Dormancy in peach (Prunus persica) flower buds. 1241
V. Anatomy of bud development in relation to phenological stage Article. Can J Bot. 1242
2002;80: 656–663. doi:10.1139/b02-052 1243
54. Citadin I, Raseira MCB, Herter FG, Baptista Da Silva J. Heat requirement for blooming and 1244
leafing in peach. HortScience. 2001;36: 305–307. doi:10.1590/S0100-29452003000100034 1245

67
55. Szalay L, Timon B, Szabo Z, Papp J. Microsporogenesis of peach (Prunus persica L. 1246
Batsch) varieties. Int J Hortic Sci. 2002;8: 7–10. 1247
56. Mounzer OH, Conejero W, Nicolás E, Abrisqueta I, García-Orellana Y V., Tapia LM, et al. 1248
Growth pattern and phenological stages of early-maturing peach trees under a 1249
Mediterranean climate. HortScience. 2008;43: 1813–1818. 1250
57. Pirona R, Eduardo I, Pacheco I, Da Silva Linge C, Miculan M, Verde I, et al. Fine mapping 1251
and identification of a candidate gene for a major locus controlling maturity date in peach. 1252
BMC Plant Biol. BMC Plant Biology; 2013;13: 166. doi:10.1186/1471-2229-13-166 1253
58. López-Girona E, Zhang Y, Eduardo I, Mora JRH, Alexiou KG, Arús P, et al. A deletion 1254
affecting an LRR-RLK gene co-segregates with the fruit flat shape trait in peach. Sci Rep. 1255
2017;7: 6714. doi:10.1038/s41598-017-07022-0 1256
59. Li X, Meng X, Jia H, Yu M, Ma R, Wang L, et al. Peach genetic resources: diversity, 1257
population structure and linkage disequilibrium. BMC Genet. 2013;14: 84. 1258
doi:10.1186/1471-2156-14-84 1259
60. Yoon J, Liu D, Song W, Liu W, Zhang A, Li S. Genetic diversity and ecogeographical 1260
phylogenetic relationships among peach and nectarine cultivars based on simple sequence 1261
repeat (SSR) markers. J Amer Soc Hort Sci. 2006;131: 513–521. Available: 1262
http://journal.ashspublications.org/content/131/4/513.abstract?related-1263
urls=yes&legid=jashs;131/4/513 1264
61. Vendramin E, Pea G, Dondini L, Pacheco I, Dettori MT, Gazza L, et al. A unique mutation 1265
in a MYB gene cosegregates with the nectarine phenotype in peach. PLoS One. 2014;9. 1266
doi:10.1371/journal.pone.0090574 1267
62. Pech JC, Purgatto E, Bouzayen M, Latché A. Ethylene and Fruit Ripening. Plant Horm 1268
Ethyl. 2012;44: 275–304. doi:10.1002/9781118223086.ch11 1269
63. Ghiani a., Onelli E, Aina R, Cocucci M, Citterio S. A comparative study of melting and 1270
non-melting flesh peach cultivars reveals that during fruit ripening endo-polygalacturonase 1271
(endo-PG) is mainly involved in pericarp textural changes, not in firmness reduction. J Exp 1272
Bot. 2011;62: 4043–4054. doi:10.1093/jxb/err109 1273
64. Haji T. Inheritance of flesh texture in peach and effects of ethylene treatment on softening 1274
of the stony hard peach. Japan Agric Res Q. 2014;48: 57–61. doi:10.6090/jarq.48.57 1275
65. Gradziel TM, Martinez-Gomez P. Shell seal breakdown in almonds is associated with the 1276
site of secondary ovule abortion. J Amer Soc Hort Sci. 2002;127: 69–74. 1277
66. Reig G, Alegre S, Cantín CM, Gatius F, Puy J, Iglesias I. Tree ripening and postharvest 1278
firmness loss of eleven commercial nectarine cultivars under Mediterranean conditions. Sci 1279

68
Hortic (Amsterdam). Elsevier B.V.; 2017;219: 335–343. doi:10.1016/j.scienta.2017.03.001 1280
67. Tatsuki M, Nakajima N, Fujii H, Shimada T, Nakano M, Hayashi KI, et al. Increased levels 1281
of IAA are required for system 2 ethylene synthesis causing fruit softening in peach (Prunus 1282
persica L. Batsch). J Exp Bot. 2013;64: 1049–1059. doi:10.1093/jxb/ers381 1283
68. Nicotra A, Conte L, Moser L, Fantechi P. New types of high quality peaches: Flat peaches 1284
(P. Persica var. Platicarpa) and ghiaccio peach series with long on tree fruit life. Acta 1285
Horticulturae. 2002. pp. 131–135. 1286
69. Fang W, Cai Z, Li G, Wang Z. PpYUC11 , a strong candidate gene for the stony hard 1287
phenotype in peach ( Prunus persica L . Batsch ), participates in IAA biosynthesis during 1288
fruit ripening Lei Pan , Wenfang Zeng , Liang Niu , Zhenhua Lu , Hui Liu , Guochao Cui , 1289
Yunqin Zhu , Jinfang Ch. 1290
70. Sandefur P, Clark JR, Peace C. Peach Texture. Horticultural Reviews. 2013. pp. 241–302. 1291
doi:10.1002/9781118707418.ch06 1292
71. Brecht JK, Kader AA, Ramming DW, Brecht, Jeffrey K. and Kader AA. Description and 1293
postharvest physiology of some slow-ripening nectarine genotypes. Journal of the American 1294
Society for Horticultural Science. 1984. pp. 596–600. 1295
72. Mignani I, Ortugno C, Bassi D. Biochemical parameters for the evaluation of different 1296
peach flesh types. Acta Horticulturae. International Society for Horticultural Science 1297
(ISHS), Leuven, Belgium; 2006. pp. 441–448. doi:10.17660/ActaHortic.2006.713.65 1298
73. Vaio C Di, Damiano C, Fideghelli C, Vaio C Di, Damiano C. VI CONVEGNO N 1299
AZIONALE SULLA P ESCHICOLTURA M ERIDIONALE SULLA P ESCHICOLTURA 1300
M ERIDIONALE A cura di : 2008. 1301
74. Attanasio (Department of Agricultural and Environmental Sciences Production, Landscape 1302
A (DISAA). Graduate School in Molecular Sciences and Plant , Food and Enviromental 1303
Biotechnology Department of Agricultural and Environmental Sciences Production , 1304
Landscape , Agroenergy ( DISAA ) Plant Biology and Production XXV cycle Assessment 1305
of flesh texture in. 2012. 1306
75. Lurie S, Crisosto CH. Chilling injury in peach and nectarine. Postharvest Biol Technol. 1307
2005;37: 195–208. doi:10.1016/j.postharvbio.2005.04.012 1308
76. Peace CP, Crisosto CH, Gradziel TM. Endopolygalacturonase: A candidate gene for 1309
Freestone and Melting Flesh in peach. Mol Breed. 2005;16: 21–31. doi:10.1007/s11032-1310
005-0828-3 1311
77. Pressey R, Avants JK. Difference in polygalacturonase composition of clingstone and 1312
freestone peaches. J Food Sci. Blackwell Publishing Ltd; 1978;43: 1415–1417. 1313

69
doi:10.1111/j.1365-2621.1978.tb02507.x 1314
78. Begheldo M, Manganaris GA, Bonghi C, Tonutti P. Different postharvest conditions 1315
modulate ripening and ethylene biosynthetic and signal transduction pathways in Stony 1316
Hard peaches. Postharvest Biol Technol. 2008;48: 84–91. 1317
doi:10.1016/j.postharvbio.2007.09.023 1318
79. Hayama H, Tatsuki M, Ito A, Kashimura Y. Ethylene and fruit softening in the stony hard 1319
mutation in peach. Postharvest Biol Technol. 2006;41: 16–21. 1320
doi:10.1016/j.postharvbio.2006.03.006 1321
80. Pan L, Zeng W, Niu L, Lu Z, Liu H, Cui G, et al. PpYUC11, a strong candidate gene for 1322
the stony hard phenotype in peach (Prunus persica L. Batsch), participates in IAA 1323
biosynthesis during fruit ripening. J Exp Bot. 2015;66: 7031–7044. doi:10.1093/jxb/erv400 1324
81. Ghiani A, Negrini N, Morgutti S, Baldin F, Nocito FF, Spinardi A, et al. Melting of “Big 1325
Top” nectarine fruit: Some physiological, biochemical, and molecular aspects. J Am Soc 1326
Hortic Sci. 2011;136: 61–68. Available: http://www.scopus.com/inward/record.url?eid=2-1327
s2.0-78651519484&partnerID=tZOtx3y1 1328
82. Contador L, Díaz M, Millanao M, Hernández E, Shinya P, Sáenz C, et al. A proposal for 1329
determining the flesh softening of peach and nectarine in postharvest through simplified 1330
targeted modeling. Sci Hortic (Amsterdam). Elsevier B.V.; 2016;209: 47–52. 1331
doi:10.1016/j.scienta.2016.06.015 1332
83. Yoshida M. Genetical studies on the fruit quality of peach varieties, 3: Texture and keeping 1333
quality. Bull Fruit Tree Res Station Ser A Hiratsuka. 1976; Available: 1334
http://agris.fao.org/agris-search/search.do?recordID=JP19760099806#.WV-1335
YBeKCPK4.mendeley 1336
84. Haji T, Yaegaki H, Yamaguchi M. Inheritance and expression of fruit texture melting, non-1337
melting and stony hard in peach. Sci Hortic (Amsterdam). 2005;105: 241–248. 1338
doi:10.1016/j.scienta.2005.01.017 1339
85. Rizzolo A, Vanoli M, Eccher Zerbini P, Jacob S, Torricelli A, Spinelli L, et al. Prediction 1340
ability of firmness decay models of nectarines based on the biological shift factor measured 1341
by time-resolved reflectance spectroscopy. Postharvest Biol Technol. 2009;54: 131–140. 1342
doi:10.1016/j.postharvbio.2009.05.010 1343
86. Giné-Bordonaba J, Cantín CM, Echeverría G, Ubach D, Larrigaudiére C. The effect of 1344
chilling injury-inducing storage conditions on quality and consumer acceptance of different 1345
Prunus persica cultivars. Postharvest Biol Technol. Elsevier B.V.; 2016;115: 38–47. 1346
doi:10.1016/j.postharvbio.2015.12.006 1347

70
87. Infante R. Harvest maturity indicators in the stone fruit industry. Stewart Postharvest Rev. 1348
2012; doi:10.2212/spr.2012.1.4 1349
88. Zhang L, Chen F, Yang H, Sun X, Liu H, Gong X, et al. Changes in firmness, pectin content 1350
and nanostructure of two crisp peach cultivars after storage. LWT - Food Sci Technol. 1351
Elsevier Ltd; 2010;43: 26–32. doi:10.1016/j.lwt.2009.06.015 1352
89. Goffreda JC. Stony hard gene of peach alters ethylene Biosynthesis. Respiration, and other 1353
ripening-related characteristics. HortScience. 1992: 27:610 (Abstr.). 1354
90. Iglesias I, Echeverría G. Differential effect of cultivar and harvest date on nectarine colour, 1355
quality and consumer acceptance. Sci Hortic (Amsterdam). 2009;120: 41–50. 1356
doi:10.1016/j.scienta.2008.09.011 1357
91. Bonora E, Noferini M, Costa G, Vidoni S. Modeling fruit ripening for improving peach 1358
homogeneity in planta. Sci Hortic (Amsterdam). Elsevier B.V.; 2013;159: 166–171. 1359
doi:10.1016/j.scienta.2013.05.011 1360
92. Matthews MA, Thomas TR, Shackel KA. Fruit ripening in Vitis vinifera L.: Possible 1361
relation of veraison to turgor and berry softening. Aust J Grape Wine Res. 2009;15: 278–1362
283. doi:10.1111/j.1755-0238.2009.00060.x 1363
93. King GA, Henderson KG, Lill RE. Ultrastructural changes in the nectarine cell wall 1364
accompanying ripening and storage in a chilling-resistant and chilling-sensitive cultivar. 1365
New Zeal J Crop Hortic Sci. 1989;17: 337–344. doi:10.1080/01140671.1989.10428054 1366
94. Giovannoni JJ, DellaPenna D, Bennett a B, Fischer RL. Expression of a chimeric 1367
polygalacturonase gene in transgenic rin (ripening inhibitor) tomato fruit results in 1368
polyuronide degradation but not fruit softening. Plant Cell. 1989;1: 53–63. 1369
doi:10.1105/tpc.1.1.53 1370
95. Lester D, Sherman WB, Atwell BJ. Endopolygalacturonase and the Melting Flesh ( M ) 1371
Locus in Peach. J Amer Soc Hort Sci. 1996;121: 231–235. 1372
96. Callahan AM, Scorza R, Bassett C, Nickerson M, Abeles FB. Deletions in an 1373
endopolygalacturonase gene cluster correlate with non-melting flesh texture in peach. Funct 1374
Plant Biol. 2004;31: 159–168. doi:10.1071/FP03131 1375
97. Gu C, Wang L, Wang W, Zhou H, Ma B, Zheng H, et al. Copy number variation of a gene 1376
cluster encoding endopolygalacturonase mediates flesh texture and stone adhesion in peach. 1377
J Exp Bot. 2016;67: 1993–2005. doi:10.1093/jxb/erw021 1378
98. Tatsuki M, Haji T, Yamaguchi M. The involvement of 1-aminocyclopropane-1-carboxylic 1379
acid synthase isogene, Pp-ACS1, in peach fruit softening. J Exp Bot. 2006;57: 1281–1289. 1380
doi:10.1093/jxb/erj097 1381

71
99. Verde I, Bassil N, Scalabrin S, Gilmore B, Lawley CT, Gasic K, et al. Development and 1382
evaluation of a 9K SNP array for peach by internationally coordinated SNP detection and 1383
validation in breeding germplasm. PLoS One. 2012;7: e35668. 1384
doi:10.1371/journal.pone.0035668 1385
100. Verde I, Jenkins J, Dondini L, Micali S, Pagliarani G, Vendramin E, et al. The Peach v2.0 1386
release: high-resolution linkage mapping and deep resequencing improve chromosome-1387
scale assembly and contiguity. BMC Genomics. 2017;18. doi:10.1186/s12864-017-3606-9 1388
101. Alexander DH, Lange K. Enhancements to the ADMIXTURE algorithm for individual 1389
ancestry estimation. BMC Bioinformatics. 2011;12: 246. doi:10.1186/1471-2105-12-246 1390
102. Alexander DH, Novembre J, Lange K. Fast model-based estimation of ancestry in unrelated 1391
individuals. Genome Res. 2009;19: 1655–1664. doi:10.1101/gr.094052.109 1392
103. Lipka AE, Tian F, Wang Q, Peiffer J, Li M, Bradbury PJ, et al. GAPIT: Genome association 1393
and prediction integrated tool. Bioinformatics. 2012;28: 2397–2399. 1394
doi:10.1093/bioinformatics/bts444 1395
104. Kang HM, Sul JH, Service SK, Zaitlen NA, Kong SY, Freimer NB, et al. Variance 1396
component model to account for sample structure in genome-wide association studies. Nat 1397
Genet. 2010;42: 348–354. doi:10.1038/ng.548 1398
105. Liu X, Huang M, Fan B, Buckler ES, Zhang Z. FarmCPU manual. PLOS Genet. 2016;12: 1399
e1005767. doi:10.1371/journal.pgen.1005767 1400
106. Barrett JC, Fry B, Maller J, Daly MJ. Haploview: Analysis and visualization of LD and 1401
haplotype maps. Bioinformatics. 2005;21: 263–265. doi:10.1093/bioinformatics/bth457 1402
107. Van Ooijen JW. JoinMap ® 4, Software for the calculation of genetic linkage maps in 1403
experimental populations. 2006;Kyazma B.V: Wageningen, Netherlands. 1404
108. Van Ooijen JW. MapQTL 6, Software for the mapping of quantitative trait loci in 1405
experimental populations of dipoid species. Kyazma BV, Wageningen, Netherlands. 2009; 1406
109. Dal Cin V, Danesin M, Rizzini FM, Ramina A. RNA extraction from plant tissues: the use 1407
of calcium to precipitate contaminating pectic sugars. Mol Biotechnol. 2005;31: 113–9. 1408
doi:10.1385/MB:31:2:113 1409
110. Andrews S. FastQC: A quality control tool for high throughput sequence data. In: 1410
Http://Www.Bioinformatics.Babraham.Ac.Uk/Projects/Fastqc/. 2010 p. 1411
http://www.bioinformatics.babraham.ac.uk/projects/. doi:citeulike-article-id:11583827 1412
111. Kim D, Pertea G, Trapnell C, Pimentel H, Kelley R, Salzberg SL. TopHat2: accurate 1413
alignment of transcriptomes in the presence of insertions, deletions and gene fusions. 1414
Genome Biol. 2013;14: R36. doi:10.1186/gb-2013-14-4-r36 1415

72
112. Langmead B, Salzberg SL. Fast gapped-read alignment with Bowtie 2. Nat Methods. 1416
2012;9: 357–9. doi:10.1038/nmeth.1923 1417
113. Anders S, Pyl PT, Huber W. HTSeq-A Python framework to work with high-throughput 1418
sequencing data. Bioinformatics. 2015;31: 166–169. doi:10.1093/bioinformatics/btu638 1419
114. Mortazavi A, Williams BA, McCue K, Schaeffer L, Wold B. Mapping and quantifying 1420
mammalian transcriptomes by RNA-Seq. Nat Methods. 2008;5: 621–628. 1421
doi:10.1038/nmeth.1226 1422
115. Warnes G. gplots: Various R programming tools for plotting data. R package version 1423
2.11.0.1. 2013. doi:citeulike-article-id:5194889 1424
116. Li H, Durbin R. Fast and accurate short read alignment with Burrows – Wheeler transform. 1425
Bioinformatics. 2009;25: 1754–1760. doi:10.1093/bioinformatics/btp324 1426
117. Goodstein DM, Shu S, Howson R, Neupane R, Hayes RD, Fazo J, et al. Phytozome: A 1427
comparative platform for green plant genomics. Nucleic Acids Res. 2012;40. 1428
doi:10.1093/nar/gkr944 1429
118. Reumers J, Maurer-Stroh S, Schymkowitz J, Rousseau F. SNPeffect v2.0: A new step in 1430
investigating the molecular phenotypic effects of human non-synonymous SNPs. 1431
Bioinformatics. 2006;22: 2183–2185. doi:10.1093/bioinformatics/btl348 1432
119. Eduardo I, Pacheco I, Chietera G, Bassi D, Pozzi C, Vecchietti A, et al. QTL analysis of 1433
fruit quality traits in two peach intraspecific populations and importance of maturity date 1434
pleiotropic effect. Tree Genet Genomes. 2010;7: 323–335. doi:10.1007/s11295-010-0334-1435
6 1436
120. Boudehri K, Bendahmane A, Cardinet G, Troadec C, Moing A, Dirlewanger E. Phenotypic 1437
and fine genetic characterization of the D locus controlling fruit acidity in peach. BMC 1438
Plant Biol. 2009;9: 59. doi:10.1186/1471-2229-9-59 1439
121. Serra O, Giné-Bordonaba J, Eduardo I, Bonany J, Echeverria G, Larrigaudière C, et al. 1440
Genetic analysis of the slow-melting flesh character in peach. Tree Genet Genomes. Tree 1441
Genetics & Genomes; 2017;13. doi:10.1007/s11295-017-1160-x 1442
122. Lurie S, Friedman H, Weksler A, Dagar A, Eccher Zerbini P. Maturity assessment at harvest 1443
and prediction of softening in an early and late season melting peach. Postharvest Biol 1444
Technol. Elsevier B.V.; 2013;76: 10–16. doi:10.1016/j.postharvbio.2012.08.007 1445
123. Li X wei, Jiang J, Zhang L ping, Yu Y, Ye Z wen, Wang X min, et al. Identification of 1446
volatile and softening-related genes using digital gene expression profiles in melting peach. 1447
Tree Genet Genomes. 2015;11. doi:10.1007/s11295-015-0891-9 1448
1449

73
1450