Embed Size (px)
Citation preview

Universidade de Lisboa
Faculdade de Ciências
Departamento de Biologia Vegetal
Monitoring the activity of the Notch pathway in neural progenitor cells
Ana Marisa Mendes Gonçalves Vinhais Guedes
Mestrado em Biologia Molecular e Genética
Setembro 2011
Universidade de Lisboa

Faculdade de Ciências
Departamento de Biologia Vegetal
Monitoring the activity of the Notch pathway in neural progenitor cells
Ana Marisa Mendes Gonçalves Vinhais Guedes
Mestrado em Biologia Molecular e Genética
Setembro 2011
Dissertação orientada por:
Doutor Domingos Henrique
(Instituto de Medicina Molecular, Faculdade de Medicina da Universidade de Lisboa)
Doutor Rui Gomes
(Faculdade de Ciências da Universidade de Lisboa)
ix
ABSTRACT
Neural progenitor (NP) cells proliferate in the ventricular zone (VZ) of the neural tube and
migrate towards the mantle layer (ML) upon neural differentiation. In order to produce the correct
type and number of neurons at the right time, a precise control of the proliferation of neural
progenitor (NP) cells and their differentiation is required. The Notch signaling pathway, through
lateral inhibition, is involved in this balance, restraining NP differentiation. However, not much is
known about Notch activity in single NPs, mainly regarding possible variations on Notch activity
in each NP, and how this putative dynamic activity contributes to the maintenance of these cells
in the undifferentiated state. In order to answer these questions, I used several ES cell lines
expressing different reporters of Notch activity driven by the promoter of the Hes5 gene. These
ES cells can be directed to neural differentiation in adherent monolayer cultures, resulting in the
production of neuroepithelial rosettes that mimic their in vivo counterpart, the neural tube. Here, I
show that an already described Hes5::GFP reporter ES cell line is not suitable to be used as a
reporter of Notch activity since the half-life of the reporter protein is much longer than that of the
HES5 protein, not allowing the detection of the termination of Notch activity. I also test other ES
cell lines, Hes5::VNP, that express an unstable reporter protein, which might allow a more
precise and accurate monitoring of Notch activity dynamics. Using this cell lines, I could observe
that not all cells in neuroepithelial rosettes express the reporter protein, and that the levels of
Notch activity are variable between NPs. Further engineering of these cell lines needs to be
performed in order to be able to construct a double reporter cell line carrying a reporter of Notch
activity together with a reporter of neuronal differentiation to allow visualization of differentiated
neurons.
Key-words: Notch signaling, HES5 reporter protein, neuroepithelial rosette, Neural
progenitors, Interkinetic nuclear migration.

x
RESUMO
O tubo neural, estrutura embrionária que no adulto origina o sistema nervoso central,
encontra-se organizado em duas zonas: a zona ventricular, onde residem os progenitores
neurais, e a zona do manto, para onde migram estas células quando começam a diferenciar em
neurónios. Os núcleos dos progenitores neurais movimentam-se entre as regiões apical e basal
da zona ventricular num mecanismo designado de movimento intercinético nuclear. Este
movimento encontra-se relacionado com as fases do ciclo celular, sendo que a mitose ocorre
quando o núcleo dos progenitores neurais se encontra na região apical e a fase S quando este
se encontra na região basal. Durante a neurogénese é necessária a existência de um controlo
preciso entre a manutenção de células num estado indiferenciado e a diferenciação destes
progenitores em células neurais. Sabe-se que a via de sinalização Notch está implicada neste
balanço através do processo de inibição lateral, restringindo a diferenciação das células
progenitoras. Inicialmente todas as células expressam níveis semelhantes de ligandos Notch e
genes pró-neurais. Contudo, devido a variações estocásticas, uma das células começa a
expressar níveis mais elevados de ligandos Notch e consequentemente é mais eficiente na
activação de Notch nas células vizinhas. Nas células em que Notch é activado há expressão de
genes Hes que reprimem a expressão de genes pró-neurais e levam à consequente
manutenção dessas células como progenitores neurais. Por sua vez, nas células que não
activaram Notch ocorre a expressão de genes pró-neurais com consequente diferenciação dos
progenitores neurais.
Após a migração dos neurónios nascentes para a zona do manto, estas células deixam de
sinalizar para as células adjacentes. Desta forma a actividade de Notch diminui nos
progenitores neurais vizinhos e o processo de inibição lateral poderá ser reiniciado. Assim, os
níveis de Notch em progenitores neurais não deverão ser constantes e a sinalização Notch será
dinâmica. A actividade dinâmica da via de sinalização Notch foi monitorizada na mesoderme
pré-somítica e em culturas de progenitores neurais isolados utilizando uma proteína reporter
instável sob o controlo do promotor de um gene alvo de Notch: Hes1. A utilização deste repórter
permitiu observar variações na expressão de Hes1. Contudo, foi observado que a expressão de
Hes1 não é apenas dependente da actividade da via Notch, respondendo a outras vias de
sinalização como a via Jak/Stat, o que impossibilita a monitorização apenas da actividade da
via de sinalização Notch.
Uma outra observação concordante com a actividade dinâmica de Notch é a expressão de
componentes da via Notch em gradientes entre as regiões apical e basal da zona ventricular,

xi
sugerindo que nos progenitores neurais a activação de Notch é específica de determinadas
fases do ciclo celular. Em retina de peixe zebra foi observado que o receptor Notch activado é
expresso em níveis elevados na região apical, onde os progenitores se encontram nas fases
G2/M/G1 do ciclo celular. Contudo, em cérebro de ratinho o receptor Notch activado foi
detectado em células em fase S do ciclo celular e não em mitose. No tubo neural de galinha o
mRNA de Notch foi detectado na região apical da zona ventricular, onde ocorre a mitose. Estes
resultados contraditórios podem indicar regulações diferentes da actividade Notch em diferentes
organismos e tecidos. Desta forma, uma análise mais profunda é necessária para determinar se
a activação de Notch ocorre especificamente em determinadas fases do ciclo celular. Por outro
lado é necessária a análise de progenitores neurais ao nível de células individuais recorrendo a
um repórter que responda apenas a Notch. Apenas desta forma será possível determinar se
Notch pode ser activado mais do que uma vez no tempo de vida de cada progenitor neural e se
a sua actividade é necessária para manter estes progenitores neurais num estado
indiferenciado.
Neste trabalho utilizaram-se várias linhas celulares de células estaminais embrionárias
(Hes5::GFP and Hes5::VNP) que expressam diferentes proteínas repórter sob o controlo do
promotor do gene Hes5, que se pensa ser o principal alvo da via Notch no sistema nervoso
central. Estas células estaminais embrionárias podem ser diferenciadas em tecido neural,
através de um protocolo de cultura de células aderentes em monocamada, formando estruturas
características designadas rosetas neuroepiteliais, onde a expressão de Hes5 foi já
documentada.
A linha celular Hes5::GFP já tinha sido descrita e foi testada relativamente às suas
capacidades de auto-renovação e pluripotência tendo-se observado que não diferia da linha
celular controlo. Adicionalmente, a sua capacidade de diferenciação neural e a expressão da
proteína repórter foram testadas tendo-se confirmado a capacidade de originar rosetas
neuroepiteliais em que a expressão da proteína repórter estava presente. O tempo de semi-vida
da proteína repórter foi determinado de forma a avaliar se esta linha celular iria permitir a
monitorização e determinação do início e terminação da actividade da via Notch. Observou-se
que 12 horas após o bloqueio da tradução as células ainda exprimem cerca de 75% do valor
inicial de proteína repórter GFP. Dado que o tempo de semi-vida da proteína HES5 é de
aproximadamente 1 hora foi possível concluir que esta linha repórter não pode ser usada para
monitorizar a actividade Notch uma vez que permanece nas células durante muito tempo após
a sua terminação.

xii
Foram geradas no Laboratório linhas celulares que expressam uma proteína repórter instável
sob controlo do promotor do gene Hes5 de forma a possibilitar a detecção do começo e
terminação da actividade Notch. Estas linhas foram validadas em termos de capacidade de
auto-renovação e pluripotência tendo-se observado que as suas características não diferiam
daquelas da linha celular controlo. Adicionalmente, foi confirmada a capacidade de formação de
rosetas neuroepiteliais e expressão da proteína repórter. Das linhas geradas a linha Hd foi
escolhida para continuar as experiências tendo-se observado que a intensidade de expressão
do repórter não é igual em todas as células das rosetas originadas por estas células. Este
resultado sugere que a intensidade da actividade Notch varia entre os progenitores neurais.
Este facto pode ser explicado pelo facto de a expressão de Notch ser constante em cada célula
mas variar entre diferentes células, ou pelo facto de esta expressão ter variações na mesma
célula. De realçar ainda que estes resultados sugerem possíveis flutuações na actividade da via
Notch, enfatizando a importância da monitorização de Notch ao nível de um único progenitor
neural.
A linha celular Hd, possui a sequência do gene de resistência à Neomicina localizada entre a
região codificante da proteína VNP e a região 3‟UTR do gene Hes5, onde se localiza o sinal de
poli-adenilação necessário para a produção de um transcrito com todos os sinais de regulação
pós-transcricional necessários. Desta forma procedeu-se à remoção do gene de resistência à
Neomicina de forma a assegurar a correcta expressão da proteína repórter. Contudo, nas linhas
celulares obtidas após este procedimento não se observou expressão da proteína reporter.
Após vários testes à sequência promotora e à expressão do repórter ao nível de mRNA e
proteína concluiu-se que a falta de expressão do repórter deveria dever-se a problemas a nível
da transcrição. De forma a ultrapassar estes constrangimentos novas linhas celulares deverão
ser desenhadas e geradas de forma a que o cDNA da proteína reporter possua o seu próprio
sinal de poliadenilação antes de se proceder à remoção da cassete de selecção. Desta forma a
expressão da proteína repórter poderia ser analisada imediatamente aquando da geração das
linhas sem serem necessários procedimentos adicionais de remoção da cassette de selecção,
que acarretam a possibilidade de introdução de instabilidade genómica e danos no DNA.
Após a construção de linhas Hes5::VNP capazes de monitorizar de forma fiel a actividade da
via Notch será possível monitorizar esta actividade em progenitores neurais ao nível de células
individuais. Assim será possível determinar se Notch pode ser activado várias vezes ao longo
do tempo de vida destas células e especificamente em determinadas fases do ciclo celular e se
essa activação está correlacionada com a manutenção das células num estado indiferenciado.
Adicionalmente, estas linhas celulares podem ser usadas para a formação de uma dupla linha

xiii
repórter que expressa repórteres da actividade Notch e também de diferenciação. Desta forma
será possível avaliar não só as variações na actividade da via Notch mas também diferenciação
neuronal, correlacionando a actividade Notch com o destino celular dos progenitores neurais.
Palavras-chave: Via de sinalização Notch, Proteína repórter HES5, Roseta neuroepitelial,
Progenitores neurais, Movimento Intercinético nuclear.

xiv
TABLE OF CONTENTS
ABSTRACT _________________________________________________________________________ ix
RESUMO ___________________________________________________________________________ x
TABLE OF CONTENTS ______________________________________________________________ xiv
LIST OF FIGURES __________________________________________________________________ xvi
LIST OF TABLES ___________________________________________________________________ xix
LIST OF ABBREVIATIONS ___________________________________________________________ xx
1. INTRODUCTION _________________________________________________________________ 1
1.1 The Neural tube and the Neuroepithelium _______________________________________ 1
1.2 Notch pathway in vertebrate neurogenesis ______________________________________ 3
1.3 Embryonic Stem cells ________________________________________________________ 6
2. MATERIALS AND METHODS _____________________________________________________ 10
2.1 Materials /Reagents _________________________________________________________ 10
2.2 Methods __________________________________________________________________ 10
2.2.1.1 Expansion of ES cells __________________________________________________ 10
2.2.1.2 ES cell differentiation ___________________________________________________ 10
2.2.1.2.2.1 PDL-Laminin Coating _____________________________________________ 11
2.2.2.1 BAC electroporation into ES cells _________________________________________ 11
2.2.2.2 Selection cassette removal from ES cells ___________________________________ 11
2.2.3 Protein expression analysis __________________________________________________ 12
2.2.3.2 Fluorescence Activated Cell Sorting (FACS) ________________________________ 12
2.2.3.2 Immunocytochemistry __________________________________________________ 12
2.2.3.3 Determination of protein half-life __________________________________________ 12
2.2.4 RNA expression analysis ____________________________________________________ 13
2.2.4.1 Isolation of total RNA from cultured ES cells _________________________________ 13
2.2.4.2 cDNA synthesis _______________________________________________________ 13
2.2.5 DNA analysis _____________________________________________________________ 13
2.2.5.1 Isolation of genomic DNA for screening PCRs _______________________________ 13
2.2.5.2 Mycoplasma detection __________________________________________________ 13
2.2.5.2.1 Control DNA extraction _______________________________________________ 13
2.2.5.2.2 PCR for Mycoplasma detection ________________________________________ 14
2.2.5.3 Purification and precipitation of plasmid DNA for electroporation _________________ 14

xv
2.2.6 DNA/RNA quantification ___________________________________________________ - 2 -
2.2.7 Agarose gel electrophoresis ________________________________________________ - 2 -
2.2.8 Screening PCRs _________________________________________________________ - 2 -
2.2.9 Bioinformatics ___________________________________________________________ - 2 -
3. RESULTS _____________________________________________________________________ 15
3.1 HT reporter ES cell line ______________________________________________________ 15
3.1.1 Self-renewal capacity ______________________________________________________ 15
3.1.2 Pluripotency capacity ________________________________________________________ 16
The pluripotency capacity of HT cells was assessed regarding the ability to generate embryoid
bodies (EBs) and, specially, the ability to undergo neural differentiation. _____________________ 16
3.1.2.1 Embryoid bodies formation ______________________________________________ 16
3.1.2.2 Neural differentiation in adherent monolayer cultures __________________________ 16
3.1.3 GFP half-life ______________________________________________________________ 17
3.2 Ha, Hc, Hd, He reporter ES cell lines ___________________________________________ 18
3.2.1 Self-renewal capacity ______________________________________________________ 19
3.2.2 Pluripotency capacity _______________________________________________________ 19
3.2.2.1 EB formation _________________________________________________________ 19
3.2.2.2 Neural differentiation in adherent monolayer cultures __________________________ 19
3.2.3 Removal of Neomycin resistance cassette ______________________________________ 20
3.2.3.1 ES cell electroporation __________________________________________________ 20
3.2.3.2 Validation of Neomycin resistance cassette removal __________________________ 21
3.2.3.2.1 Growth in Neomycin _________________________________________________ 21
3.2.3.2.2 PCR validation _____________________________________________________ 21
3.2.3.3 Cell line choice________________________________________________________ 22
3.3 HdB5 and HdB8 ES cell lines _________________________________________________ 22
3.3.1 Self-renewal capacity ______________________________________________________ 22
3.3.2 Pluripotency capacity: neural differentiation in adherent monolayer cultures ____________ 23
3.3.3 Analysis of expression of VNP mRNA in HdB5 and HdB8 cell lines _________________ 24
4. DISCUSSION __________________________________________________________________ 26
5. BIBLIOGRAPHY ________________________________________________________________ 30
6 SUPLEMENTAL INFORMATION __________________________________________________ - 2 -
6.1 LIF test __________________________________________________________________ - 3 -

xvi
LIST OF FIGURES
Figure 1: The neural tube and interkinetic nuclear migration. The neural tube is divided into two major
regions: the VZ, where NPs reside, displaying the characteristic INM, and the ML, to where cells migrate
when they differentiate. The nucleus of a NP migrates within the cytoplasm (INM) according to the phases
of the cell cycle being at the basal region of the VZ during S-phase and at the apical region of the VZ
during mitosis. Adapted from Kosodo et al, 2011. _________________________________________________ 1
Figure 2: Types of cell division of NP cells. The scheme summarizes the types of cell division that NPs
can undergo. (A) Symmetric cell division originating two neural progenitors (PP). (B) Symmetric cell
division originating two neurons (NN). (C) Asymmetric cell divisions originating one neural progenitor and
one neuron (PN).______________________________________________________________________________ 2
Figure 4: Schematic representation of the successive competence states acquired along the monolayer
neural differentiation protocol. During neural differentiation ES cells pass through successive states of
competence. ES cells initially acquire characteristics of Primitive Ectoderm (Pr.Ectoderm). Then, a
transient population of NPs (tNPs) emerges and gives rise to a NPs population that is able to originate
neurons (nNPs). This population of NPs will then originate the final set of NPs organized in rosette-like
structures having proper Notch activity, INM and production of differentiated neurons. Adapted from
Abranches et al 2009. _________________________________________________________________________ 7
Figure 5: Structure of Hes5::VNP reporter cassette and Screening PCRs scheme. The Hes5 BAC was
modified replacing the coding region of Hes5 by the reporter cassette. The reporter cassette comprises a
cDNA encoding the reporter protein Venus-NLS-PEST (VNP) and a Neomycin resistance cassette flanked
by loxP sites. To validate the removal of Neomycin cassette several PCRs were performed, which are
illustrated in the figure by the arrows. ___________________________________________________________ 15
Figure 6: Self-renewal capacity of 46C, HT, Ha, Hc, Hd and He ES cell lines. (A-F) Bright field images of
ES cells, organized in clusters. (G) The viability of the cell lines is not statistically different from that of the
control cell line (46C). (H) FI values are within the normal range of variation of ES cells and are similar to
those of 46C. These values represent the average of n passages from several replicates. (Scale-bar=100
µm) _________________________________________________________________________________________ 15
Figure 7: Intensity of GFP expression in HT cells after translation blockage. (A) Fluorescence intensities
measured in time-lapse movies of neuroepithelial rosettes: the values were calculated for each cell by the
ratio between the fluorescence intensity of each time point and the fluorescence intensity of the initial time
point. After 12hrs of blockage of translation, the expression of GFP reporter is still ~75% of the initial
value. (B) Fluorescence intensities measured in cells labeled with anti-GFP antibody: the values were
calculated by the ratio between the fluorescence intensity of one cell at a certain time-point and the
average of fluorescence intensities of all cells measured at the initial time-point. After 6hrs of translation

xvii
inhibition the fluorescent ratio is similar to the initial value. The line represents the average between
several replicates and for each time-point each dot represents one cell. ____________________________ 19
Figure 8: Quality assessment of pTurboCre and pCAGGsPuromycin plasmids. The observed bands
correspond to the visualization, in an agarose gel, of the plasmids. (A) pTurboCre plasmid. (B)
pCAGGsPuromycin. Both plasmids were in proper conditions to be electroporated. _________________ - 3 -
Figure 9: Screening PCRs. The clones HdA2, HdA11, HdB1, HdB5, HdB8 and HdB11 fully respected the
PCR selection criteria for Neomycin selection cassette removal: (i) amplification of a DNA fragment with
the correct size of the reporter cassette PCR; (ii) no amplification of Neomycin resistance gene DNA; (iii)
amplification of Venus DNA. ___________________________________________________________________ 22
Figure 10: PCRs to test for the integration of pTurboCre or pCAGGsPuromycin plasmids into HdB5 and
HdB8 cell lines. The PCRs confirmed that neither plasmid integrated into the genome of either clone. For
both PCRs positive controls consisting of plasmids containing the fragments to be amplified were used. In
addition, for the PCR to detect the Puromycin resistance gene the 46C cells were used as a positive
control since they contain a Puromycin resistance gene inserted into the genome. __________________ - 3 -
Figure 11: Self-renewal capacity of HdB5 and HdB8 ES cell lines. (A-C) All analyzed cell lines show
typical morphology of ES cells, organized in clusters. (D) The viability of both cell lines is similar to that of
the control cell line 46C. (E) Values of FI are within the normal range of variation of ES cells. These values
represent the average of n passages from several replicates. (Scale-bar=100μm) ___________________ 23
Figure 13: Hes5 promoter integrity. The integrity of the Hes5 promoter in the HdB5 and HdB8 cell lines
was confirmed by PCR, where a fragment with the expected size and coincident with that of the parental
cell line was obtained. 46C cell line was used as a negative control, where no band could be detected. 25
Figure S1: EB formation in 46C, HT, Hd and He ES cell lines. (A-D) Bright field images of EBs from the
different cell lines studied, showing normal and typical morphology. (Scale-bar=100µm) _____________ - 3 -
Figure S2: Monolayer neural differentiation of HT and Hes5::VNP ES cell lines. (A) Bright field image of
ES cultures along the monolayer neural differentiation protocol. All cell lines showed typical morphology at
each time-point being able to form neuroepithelial rosettes. (B,C) Values of viability and FI were similar to
the ones of 46C cell line, both in High density and Monolayer cultures. (D) Analysis of the reporter
proteins by FACS revealed that GFP is being expressed in approximately 60% of HT cells, while VNP is
expressed only in Hd and He cell lines in approximately 5% of the cells. (Scale-bar=100µm) __________ 17
Figure S3: Immunocytochemistry of neuroepithelial rosettes preformed at day 8. Cells were labeled by
immunocytochemistry using antibodies against N-cadherin (red), marking the apical junctions of the
rosettes, and by GFP (green) marking the respective reporter protein: (A) 46C cells expressing GFP
driven by the Sox1 promoter, (B) HT cells expressing GFP under the control of the Hes5 promoter (C)

xviii
Hes5::VNP cells expressing VNP under the control of the Hes5 promoter. Nuclei are stained with DAPI.
(Scale-bar=50µm) ____________________________________________________________________________ 18
Figure S4: Monolayer neural differentiation of HdB5 and HdB8 ES cell lines. (A) Morphology of ES
cultures along the monolayer neural differentiation protocol. All cell lines had typical morphology at each
time-point and all were able to form neuroepithelial rosettes. (B,C) Values of viability and FI are not
statistically different from those of the control cell line Hd both in High density and Monolayer cultures. (D)
Analysis of the expression of the reporter proteins by FACS revealed that VNP is not expressed in any of
the HdB5 or HdB8 ES cell lines. These values represent the average of n passages from several
replicates. (Scale-bar=100µm) _________________________________________________________________ 23
Figure S5: Immunocytochemistry of neuroepithelial rosettes (day 8) of HdB5 and HdB8 cell lines. Cells
were labeled using antibodies against N-cadherin (red), marking the apical junctions of the rosettes and
GFP (green), marking VNP reporter protein. Nuclei are stained with DAPI. (Scale-bar=50µm) _________ 24
Figure S6: Lif test. (A-J) Cells were analyzed in terms of morphology, (K) viability, (M-N) FI and (L)
Nanog::VNP expression, concluding that the new batch was as effective as the previous one. _______ - 4 -

xix
LIST OF TABLES
Table 1: ES cell growth in Neomycin supplemented media. (+) and (-) represent the ability of cells to grow
or not in Neomycin supplemented media, respectively. _____________________________________ - 3 -
Table S1: ES cell lines used in the experiments described in this thesis. ES cells used are listed with the
description and source. ______________________________________________________________ - 4 -
Table S2: List of relevant reagents used in the experiments described in this thesis. The reagents are
listed with information relative to suppliers, catalogue numbers and stock solutions. ______________ - 5 -
Table S3: List of relevant solutions used in the experiments described in this thesis. The composition of
most important solutions is listed. The working stock characteristics of the solutions are listed in Table3.- 5
-
Table S4: Oligonucleotide primers that were used in the experiments described in this thesis. The primers
are listed with the respective sequences, annealing temperature, size of the amplified product and other
observations (primers were provided by Sigma Genosys or Frilabo). __________________________ - 6 -
Table S5: Antibodies used in the experiments described in this thesis. Antibody dilution, animal in which it
was raised and origin are listed. _______________________________________________________ - 6 -

xx
LIST OF ABBREVIATIONS
3‟UTR 3‟ Untranslated Region
BAC Bacterial Artificial Chromosome
bFGF basic Fibroblast Growth Factor
DAPI 4',6-diamidino-2-phenylindole
DMSO Dimethyl sulfoxide
DNA Deoxyribonucleic acid
EB Embryoid Body
ES cells Embryonic Stem cells
FACS Fluorescence Activated Cell Sorting
FI Fold Increase
GAPDH Glyceraldehyde 3-phosphate dehydrogenase
GFP Green Fluorescent Protein
GMEM Glasgow Minimum Essential Medium
hrs Hours
HT Hes5::GFP cell line [1]
INM Interkinetic Nuclear Migration
LIF Leukemia inhibitory factor
min Minutes
ML Mantle Layer
NICD Notch Intracellular Domain
NN Cell division originating two Neurons
NP Neural Progenitor

x
O/N Over-Night
PBS Phosphate Buffered Saline
PCR Polymerase Chain Reaction
PDL Poly-D-lysine
PFA Paraformaldehyde
PN Cell division originating one Neural Progenitor and one Neuron
PP Cell division originating two Neural Progenitors
RNA Ribonucleic acid
rpm rotations per minute
RT Room Temperature
VNP Venus-NLS-PEST
VZ Ventricular Zone

CHAPTER 1
Introduction

Introduction
1
1. INTRODUCTION
1.1 The Neural tube and the Neuroepithelium
In vertebrates, the process of neurulation gives rise to the neural tube, a structure that
develops into the adult central nervous system (brain and spinal cord). Production of neurons
occurs in the neural tube by means of an asynchronous and mitotically active neuroepithelial
population [2]. These neural progenitor (NP) cells are located in the ventricular zone (VZ),
migrating away to the mantle layer (ML) upon neuronal differentiation (Figure 1).
Figure 1: The neural tube and interkinetic nuclear migration. The neural tube is divided into two major regions: the
VZ, where NPs reside, displaying the characteristic INM, and the ML, to where cells migrate when they differentiate. The nucleus of a NP migrates within the cytoplasm (INM) according to the phases of the cell cycle being at the basal region of the VZ during S-phase and at the apical region of the VZ during mitosis. Adapted from Kosodo et al, 2011.
The VZ is pseudostratified, with NPs being attached to both the outer basal and inner apical
surfaces. The nucleus of a NP migrates within the cytoplasm in a characteristic movement
between the apical and basal regions of the VZ (Figure 1), called interkinetic nuclear migration
(INM), that was first described by Sauer in 1935 (reviewed in [3], [4]).
A key feature of INM is that nuclear migration is correlated with the phases of the cell cycle of
NPs, with mitosis occurring when the nucleus is located at the apical region of the VZ, and S-
phase when it is at the basal region (Figure 1) (reviewed in [4], [5]). However, the mechanisms
involved in the coordination between INM and the cell cycle are not clear. It has been reported
that inhibition of INM by inhibiting actin or microtubule polymerization does not influence cell
cycle progression. In contrast, INM stops when the cell cycle is blocked [2], (reviewed in [3]).
These results suggest that the regulators of the cell cycle also regulate the molecular machinery
involved in nuclear migration but the contrary does not seem to occur with nuclear migration not
being necessary for cell cycle progression. Recently, a molecular mechanism connecting cell
cycle to INM was described [6]. In this study, the microtubule-associated protein Tbx2 was

Introduction
2
reported to be translocated to the apical process of NPs during G2 phase, ensuring the proper
movement of nuclei to the apical region during the appropriate cell cycle phase (S-G2-M
transition).
Regarding INM functions, it has been suggested that it might act to increase the density of
proliferating NPs while maintaining their apical and basal attachments during mitosis and
consequently junction-associated signaling molecules. Another possible function for INM is a
role in the determination of cell fate diversification of NPs (reviewed in [3]). Cell fate
determinants, such as Notch or Delta1 are expressed specifically in the apical or basal regions
of the VZ [7] and consequently INM may generate heterogeneity between NPs, according to the
differential nuclear positions (reviewed in [3]).
NPs in the VZ can undergo different types of cell division: proliferative symmetric cell
divisions (PP division), expanding the pool of NPs, and asymmetric or symmetric neurogenic cell
divisions (PN and NN divisions, respectively), which generate neurons (reviewed in [9], [10])
(Figure 2).
Figure 2: Types of cell division of NP cells. The scheme summarizes the types of cell division that NPs can undergo. (A) Symmetric cell division originating two neural progenitors (PP). (B) Symmetric cell division originating two neurons (NN). (C) Asymmetric cell divisions originating one neural progenitor and one neuron (PN).
It has been observed a correlation between the type of cell division and the angle of the
mitotic cleavage plane relative to the lumen of the VZ. NN cell divisions were reported to be
generated by vertical cleavage planes, while PP and PN divisions can occur in all orientations,
suggesting that cleavage plane orientation would only be important in cells with potential to
generate neurons [10]. Regarding PN cell divisions, it has been observed that asymmetric
inheritance of the apical membrane is indicative of asymmetric daughter cell fates [8], [11]. It
was therefore suggested that the correlation between the angle of mitotic cleavage plane and
the type of cell division involves the distribution of the apical elements of the dividing cell
between the two daughter cells: vertical cleavage planes would bisect the apical elements
(distributing them equally to the daughter cells) while horizontal cleavage planes would bypass
them (resulting in an unequal distribution of the apical elements) (reviewed in [9]). Contradictory
data has been published regarding the cell fate of the cell that inherits the apical membrane:

Introduction
3
some results suggest that the daughter cell that inherits it is going to be maintained as a
progenitor cell [8], while others suggest that the cell that inherits the apical membrane is going to
differentiate into a post-mitotic neuron [11]. In addition, it has also been reported that the length
of the G1 phase of the cell cycle might play an important role in the type of cell division that NPs
undergo [6], (reviewed in [12], [13]). NPs that undergo PN cell divisions have a longer G1 phase
than the ones that undergo PP cell divisions suggesting that the lengthening of G1 in
neuroepithelial cells is correlated with the neurogenic potential [10]. Further analysis of the cell
cycle and the type of cells generated will be essential to better elucidate their relation and clarify
previous contradictory reports.
1.2 Notch pathway in vertebrate neurogenesis
During neurogenesis, a balance between the proliferation of NPs and their differentiation into
neurons needs to be maintained, in order to produce the correct number and types of neurons at
the right time. It is known that the Notch pathway, a highly conserved mechanism among
metazoans, is implicated in this process, controlling cell fates through cell interactions (reviewed
in [14-16]). The Notch receptor gene was first characterized in Drosophila melanogaster and
encodes a cell surface type I transmembrane protein with an extracellular ligand-binding domain
and a cytoplasmic domain that acts in signal transduction. The extracellular domain comprises
epidermal growth factor (EGF)–like tandem repeats, thought to be involved in ligand binding,
and a cystein-rich conserved region that appears to negatively regulate receptor activation
(reviewed in [17]). In the cytoplasmic domain there are 6 tandem ankyrin repeats (that are
sufficient for Notch activity), a glutamine-rich domain, and a PEST sequence that is involved in
Notch protein turnover (reviewed in [14], [17]). The Notch receptor is subjected to post-
translational modifications in the trans-Golgi network by proteases of the Furin-family, and is
then translocated to the plasma membrane where it works as an heterodimer that comprises an
ectodomain and a membrane tethered intracellular domain (reviewed in [18]). The Notch ligands
are also type I transmembrane proteins of the DSL family (invertebrate ligands Delta, Serrate
and LAG-2). Similar to the Notch receptors, members of the DSL family of Notch ligands have
multiple (EGF)–like tandem repeats in the extracellular domain, but unlike the receptor they have
characteristic degenerate N-terminal EGF repeats. The Notch ligands do not share the same
functions between themselves, as they seem to regulate different developmental decisions
(reviewed in [17]).
Upon ligand-receptor interaction, the Notch receptor undergoes a series of proteolytic
cleavages mediated by a ɣ-secretase complex, resulting in the release of the Notch intracellular
domain (NICD) to the cytoplasm. NICD is then translocated to the nucleus, where it binds CSL

Introduction
4
(a DNA-binding protein) and recruits Mastermind, forming a ternary complex. In the absence of
NICD, CSL binds to specific regulatory regions, acting as a repressor. Upon Notch activation,
the complex suffers conformational changes replacing the co-repressors by transcriptional co-
activators (such as Mastermind), which activate the expression of Notch target genes (reviewed
in [15], [18], [19]). The main Notch targets are the HES genes that encode basic helix-loop-helix
(bHLH) transcriptional repressors. The HES proteins repress the expression of proneural bHLH
genes (like Mash1 or Neurogenin2) that are responsible for the induction of the neural
differentiation program (reviewed in [15], [20]) (Figure 3).
Figure 3: A scheme representing the Notch signaling pathway. The proneural genes (like Mash1 and Ngn2)
induce the expression of Notch ligands (like Delta1), activating Notch in the neighboring cells. In these cells, the receptor-ligand interactions trigger a series of proteolytic cleavages that result in the release of NICD. NICD is then translocated into the nucleus where it forms a complex with RBPj (CSL). NICD/RBPj complex functions as a transcriptional activator of Notch target genes (like the Hes genes). The Hes genes, in turn, inhibit their own expression and the expression of proneural genes. As a result, cells where Notch is not activated express proneural genes and differentiate into neurons while in cells that have activated Notch, proneural gene expression is repressed and therefore these cells are maintained as progenitors. Adapted from Kageyama 2008.
The Notch pathway ensures the generation of cells with different fates in a population of cells
that have similar developmental potential by the mechanism of lateral inhibition (reviewed in [18],
[19], [21]). By this mechanism, one cell is chosen from a group of equivalent cells to acquire one
determined cell fate and by competing with its neighbors inhibits them from acquiring the same
fate (reviewed in [16], [19]). Initially, in the vertebrate neural tube, all cells are equivalent,
expressing similar levels of both Notch ligands and proneural genes (Figure 3). At a certain
point and due to stochastic variations, one cell starts to express higher levels of Notch ligands
(signal sending cell) and consequently becomes more effective at activating Notch in
neighboring cells. The signal receiving cells activate the expression of Notch target genes (like
the Hes genes) that are going to repress the expression of proneural genes and Notch ligands.
Consequently, signal receiving cells have lower levels of proneural gene expression and are

Introduction
5
maintained as progenitor cells. In contrast, signal sending cells up-regulate the expression of
proneural genes, differentiating into post-mitotic neurons (reviewed in [15], [20-22]).
In differentiating neurons ligand expression is transient, being down-regulated upon cell
migration from the VZ to the ML. As a consequence, the levels of Notch activity in the
neighboring cells are reduced, the lateral inhibition process is reset and NPs are able to respond
to new signals and to decide again if they enter differentiation or are maintained as NPs. This
suggests that Notch activity levels in NPs are not constant and that Notch signaling might be
dynamic. The dynamic nature of Notch signaling has already been observed in different systems
by the detection of fluctuations or oscillations in Notch target genes. It was observed that the
bHLH component of Notch pathway, Hes1, is cyclically expressed in the presomitic mesoderm
[23]. Hes1 expression fluctuations were also observed in isolated NP cultures [24]. However, it is
known that other signaling pathways, like the Jak/Stat pathway, are implicated in Hes1
fluctuations [24], (reviewed in [20], [25]), and therefore Hes1 expression is not a specific readout
of Notch activity.
In agreement with the dynamic activity of Notch signaling, Notch components were reported
to be expressed in apical-basal gradients in the VZ of the neural tube, suggesting that NPs are
able to activate Notch only in specific phases of the cell cycle. In the developing zebrafish retina,
the activated form of the Notch receptor is expressed at higher levels in the apical region of the
neuroepithelium, where NPs are at G2/M/G1 phases of the cell cycle, while Delta1 mRNA is
expressed at higher levels at the basal region [26]. It was suggested that the INM regulates the
duration and level of exposure of NPs to Notch signaling in the apical region of the VZ: in retinas
of zebrafish mutants for the microtubule motor associated protein Dynactin-1, NPs nuclei move
more quickly and deeply to the basal region of the VZ and more slowly to the apical region,
resulting in less exposure to Notch signaling and a consequent premature exit of NPs from the
cell cycle, leading to massive neuronal differentiation [26]. In the VZ of the developing chick
neural tube similar patterns of expression of Notch components were also observed, with Notch1
mRNA being expressed specifically in the apical region [7]. In the developing chicken brain it
was observed that Notch mRNA expression is reduced in S-phase [7], [27]. These results
suggest that Notch activity occurs distinctively in a specific region of the neuroepithelium where
cells undergo mitosis. However, in the developing mouse brain, the activated form of the Notch
receptor is not detected in the apical region of the VZ. Instead, it is detected in S-phase cells,
suggesting that Notch is not activated in mitosis [28]. These contradictory results might indicate
different regulations of Notch activity in different tissues and organisms.
Introduction
6
Further analysis of Notch activity in NPs is thus necessary to determine whether activation
occurs in specific cell cycle phases. Also, analysis of single NPs using a bona fine readout that
responds only to Notch signaling is essential to assess if the Notch pathway can be activated
more than once in the NPs life-time and if Notch activation is necessary to maintain these NPs in
an undifferentiated state.
1.3 Embryonic Stem cells
Embryonic Stem (ES) cells are derived from the inner cell mass of embryos in the blastocyst
stage (reviewed in [29]) and are characterized by their self-renewal capacity (being able to
proliferate indefinitely under the appropriate conditions) and their pluripotency capacity (giving
rise to all cell types from the three germ layers - ectoderm, endoderm and mesoderm) (reviewed
[30]). Initially, the maintenance of mouse ES cells in culture was dependent on a proper medium,
containing the necessary metabolites, nutrients and serum and also on the presence of feeder
cells. Currently, it is known that feeder cells can be replaced by a specific cytokine, leukaemia
inhibitory factor (LIF) and serum by BMP4 (reviewed in [31], [32]). Upon withdrawal of LIF, cells
lose their undifferentiated characteristics and rapidly differentiate (reviewed in [32]). Due to their
unique properties, ES cells have been used as a powerful tool for the development of cell-based
therapies, generation of cellular disease models, test of new drugs and also to unravel the
molecular mechanisms and pathways involved in the differentiation fate of a pluripotent cell
(reviewed in [30], [34]).
ES cells can be driven into neural differentiation by the formation of multicellular aggregates,
embryoid bodies (EBs), or by adherent monolayer cultures [35-37]. However, neural
differentiation of ES cells mediated by EBs formation is very inefficient, occurring only in a small
fraction of cells [36]. A more efficient method to drive neural differentiation of ES cells relies
upon adherent monolayer cultures and was firstly described in 2003 by Ying and co-workers
[36]. In this protocol, ES cells are cultured in feeder-free conditions in the presence of a serum-
free medium that does not contain LIF or BMPs, which are known to inhibit neural differentiation.
Therefore, cells leave the undifferentiated state, passing through successive stages from an
identity of ES cells to NPs and organize in rosette-like structures [35] (Figure 4). These rosettes
have been shown to mimic the in vivo neural tube as they show: (i) proper apico-basal polarity,
with apical markers localizing at the centre of the rosette and differentiating neurons migrating to
the outer surface of the rosette; (ii) proper cell cycle stage localization, with mitosis occurring at
the apical surface (centre) of the rosette and S-phase at the periphery, reproducing the
characteristic INM observed in the VZ of the vertebrate neural tube; (iii) active Notch signaling in

Introduction
7
NPs but not in differentiated cells; and (iv) proper timing of production of neurons and glia.
Additionally, as rosettes are two-dimensional structures, they are much easier to analyze and to
image than their embryonic counterpart, being a useful tool to study Notch activity in single cells.
Figure 4: Schematic representation of the successive competence states acquired along the monolayer neural differentiation protocol. During neural differentiation ES cells pass through successive states of competence.
ES cells initially acquire characteristics of Primitive Ectoderm (Pr.Ectoderm). Then, a transient population of NPs (tNPs) emerges and gives rise to a NPs population that is able to originate neurons (nNPs). This population of NPs will then originate the final set of NPs organized in rosette-like structures having proper Notch activity, INM and production of differentiated neurons. Adapted from Abranches et al 2009.
ES cells can be modified to generate ES cell lines expressing reporter proteins (like GFP)
under the control of specific promoters, allowing to monitor gene expression in live ES cells [1],
(reviewed in [37]). To generate reporter ES cell lines there are several aspects to consider: (i)
the promoter used to drive the expression of the reporter protein; (ii) the type of reporter protein
that is going to be used; and (iii) the strategy to engineer the desired cell line.
Reporters of Notch signaling have been described to use either synthetic promoters (repeats
of CSL binding-boxes) [39] or promoters of Notch target genes (like Hes1 or Hes5) [1], [23], [24],
[40] to drive the expression of the reporter proteins. Expression of reporter proteins driven by
synthetic promoters does not reflect all Notch activity [39]. Therefore, the use of Notch target
genes seems to be a better choice. Among the Notch target genes, it has been shown that Hes1
expression is not affected by the inactivation of the Notch pathway in the developing embryo [41]
and does not respond specifically to Notch signaling [24]. In contrast, Hes5 expression is
dramatically reduced in Notch mutants [41], suggesting that Hes5 is a specific Notch target gene
in the developing nervous system. Therefore, Hes5 promoter would be the most appropriate to
use as readout of Notch activity.
The characteristics of the reporter protein to be used in the generation of this reporter cell line
are very important. One of the most relevant features of the reporter protein is its half-life.
Ideally, the reporter protein should have the same half-life as that of the protein coded by the
gene that is going to be monitored, so that the onset and termination of expression can be
observed. This is particularly important for proteins with short half-lives, such as the HES5

Introduction
8
protein that has a half-life shorter than 1hr [42]. In this case an unstable reporter protein should
be used to visualize its expression. The reporter should be unstable both at the protein and
mRNA levels so that it allows the precise monitoring of Notch activity.
Transgenic ES cells can be generated by different methods: (i) site-specific targeting of the
cDNA encoding a reporter protein into the locus of the gene of interest or (ii) random integration
into the genome of the potential regulatory regions of the gene of interest linked to a cDNA
encoding a reporter protein. The first method has the advantage of normally resulting in a
correct expression of the reporter. However, the process is very inefficient and results in a cell
line with only one functional allele of the targeted gene. In the second method, in which a
potential regulatory region linked to a cDNA encoding a reporter protein is randomly integrated
into the genome, the expression of the reporter is frequently influenced by the chromosome
integration site. Furthermore, this strategy normally requires that the promoter and other
regulatory regions of the gene of interest are known.
One method that allows overcoming these limitations is the use of Bacterial Artificial
Chromosome (BAC) vectors expressing the reporter protein. A BAC is a DNA construct based
on the conjugation plasmid (F plasmid) of E. coli that can be electroporated into ES cells. These
vectors carry long genomic regions, containing entire genes as well as distant flanking cis-
regulatory regions that are necessary for proper gene regulation and expression (reviewed in
[43]). BACs can be modified to express a reporter protein with all the regulatory sequences of
the gene of interest, allowing the monitor of gene expression. This is very important because
reporters of Notch activity driven by a 0.76-Kbp promoter of Hes5 showed not to fully mimic the
expression of the endogenous Hes5 gene [44]. The large size of these BAC vectors also
diminishes the effects of the integration site on reporter expression [43]. Besides these
advantages, as BAC vectors integrate randomly into the genome they do not disrupt the
endogenous copies of the gene of interest.
The generation of a reporter using a BAC vector comprises several successive steps: (i)
choice of a BAC vector that comprises the coding region of the gene of interest and the largest
possible flanking regions; (ii) generation of the reporter cassette (in a plasmid) containing the
cDNA encoding the reporter protein, appropriate selectable markers and homology regions that
are needed for a step of homologous recombination in E.coli; (iii) BAC recombineering
(homologous recombination) performed in bacteria, replacing the coding region of the gene of
interest in the BAC by the reporter cassette DNA, present in the plasmid; (iv) purification of the
modified BAC; and (v) its electroporation into ES cells and the creation of a stable cell line
(reviewed in [45], [46]). This strategy has already been used to generate reporter systems of
Introduction
9
Notch signaling [1], [40]. Specifically, Tomishima and co-workers engineered an ES cell line
(Hes5::GFP, from here on referred as HT cell line) expressing a stable reporter protein (GFP)
under the control of the Hes5 promoter [1].
A reporter of Notch activity has also previously been generated in the Laboratory using the
promoter of the Hes5 gene and BAC recombineering strategy (Hes5::VNP cell line). In contrast
with the reporter protein employed in the HT cell line, the reporter protein of the Hes5::VNP cell
line is unstable, comprising Venus (a yellow fluorescent reporter protein), NLS (a nuclear
localization signal that targets the reporter protein to the nucleus) and PEST (a peptide
sequence that reduces the half-life of the protein to which it is fused). This reporter protein is
based on an already described Venus-PEST unstable reporter [47] that allows monitoring of
2hrs periodic waves of Lfng reporter expression. Also, Hes5::VNP cells express an unstable
reporter mRNA due to the presence of post-transcriptional regulatory signals in the 3‟UTR, which
decreases the time of reporter activity.
Thesis Outline
The objective of this thesis is to monitor Notch activity in live neural progenitors, in order to
investigate the role of Notch signaling during vertebrate neural development. The specific aims
were:
- Determine if Notch is activated more than once in a life of a NP;
- Determine if Notch activation occurs preferentially in a specific phase of the cell cycle;
- Define the timing of commitment to neurogenesis;
- Assess if Notch activity is correlated with the cell fate of NPs.
In order to do so, a previously described ES cell line expressing a fluorescent reporter protein
under the control of the Hes5 promoter (HT) [1] was analyzed to assess its suitability to perform
these experiments. Specifically, the stability of the reporter protein (GFP) was investigated by
determination of its half-life. In addition, the novel ES cell lines generated in the Laboratory were
also investigated for their suitability as reporters of Notch activity. These cell lines, (Hes5::VNP),
express an unstable reporter protein upon Notch activation, which might allow the precise
monitoring of Notch activation and termination in NPs, in real-time and with single cell resolution.

CHAPTER 2
Materials and Methods

Materials and Methods
10
2. MATERIALS AND METHODS
2.1 Materials /Reagents
2.1.1 Embryonic stem cell lines
The mouse ES cell lines used in this project are listed in Table S2 (Chapter 6).
2.2.2 Reagents
The reagents, solutions/media, primers and antibodies used in this study are listed in Table
S3, Table S4, Table S5 and Table S6, respectively (Chapter 6).
2.2 Methods
2.2.1 ES cell culture
All steps involved in the manipulation of ES cells were performed in a sterile laminar flow
hood class II, type A/B3.
2.2.1.1 Expansion of ES cells
ES cells were thawed in pre-heated Glasgow Modified Eagles Medium 1x (GMEM) and
plated on 0.1% (v/v) gelatin-coated dishes in supplemented GMEM (with 2ng/ml LIF). Medium
was changed 6hrs later to eliminate DMSO residues. ES cells were grown at 37ºC in a 5% (v/v)
CO2 incubator on gelatin-coated dishes in supplemented GMEM. The morphology and health of
the cells were assessed daily by direct visualization on a bright field microscope and cells were
passaged every other day, at a constant plating density of 3x10⁴ cells/cm2. For each passage,
cells were washed twice with PBS and dissociated with 0,025% trypsin for 2-3min at 37ºC. Cells
were immediately resuspended in GMEM (in order to neutralize trypsin), centrifuged at 1200 rpm
for 4min and again resuspended in GMEM. Cells were counted using trypan blue dye exclusion
method and the required amount of cells was then plated on gelatin-coated dishes in
supplemented GMEM. To prepare ES cell stocks, 3x10⁶ cells were frozen in GMEM 1x with 10%
Dimethyl sulphoxide (DMSO) and stored in liquid N2. Every time cells were frozen, a sample was
collected to test for Mycoplasma contamination (see section 2.2.5.2).
2.2.1.2 ES cell differentiation
2.2.1.2.1 Embryoid Bodies formation
To generate EBs, ES cells were plated at 2x10⁴ cells/cm2 in GMEM 1x on bacterial grade
dishes. EB formation was checked on day 1 and the morphology was assessed every day, until
day 8, to confirm the normal differentiation pattern of the cultures.
2.2.1.2.2 Neural differentiation in adherent monolayer cultures

Materials and Methods
11
The protocol described in Abranches et al. was used (Figure 4) [35]. Briefly, 24hrs before the
beginning of the monolayer differentiation protocol (day -1), cells were plated at high density
(1x10⁵ cells/cm2) on gelatin-coated dishes in serum-free medium (ESGRO Complete Clonal
Grade medium) supplemented with 2ng/ml of LIF. After 24hrs (day 0), cells were observed on a
bright field microscope to assess morphology and confluence of the cultures. Cells were then
dissociated, counted and plated on fresh gelatin-coated dishes in RHB-A medium at a cell
density of 3x10⁴ cells/cm2. Medium was changed at day 2 and cells were replated at day 4. For
the replating, cells were dissociated, counted and plated at a cell density of 2x10⁴ cells/cm2 on
PDL-Laminin coated tissue culture plastics or coverslips in RHB-A supplemented with 5ng/mL of
murine bFGF and medium was changed at day 6. According to the analysis to be made, at the
end of the neural differentiation protocol (day 8) different cell treatments were performed (see
sections 2.2.3.2, 2.2.4.1, 2.2.3.3).
2.2.1.2.2.1 PDL-Laminin Coating
The tissue culture dishes or coverslips were covered with PDL solution (10µg/mL in PBS) and
were left for 1h at room temperature (RT). The dishes were then washed twice with PBS,
covered with Laminin solution (2,5 µg/mL in PBS) and left overnight (O/N) at 37ºC and 5% CO2.
Laminin was removed immediately before plating the cells.
2.2.2 ES cell line generation
2.2.2.1 BAC electroporation into ES cells
In this work were used ES cell lines that had been previously generated in the Laboratory.
These cell lines were engineered, by the insertion of a BAC vector, to express a reporter protein
driven by the promoter of the Hes5 gene. The BAC was chosen from the CHORI database
(REF. RP24-345H15), comprising the Hes5 coding region and the largest possible flanking
regions. The BAC was manipulated through recombinogenic engineering (reviewed in [46]),
replacing the coding region of the Hes5 gene by the reporter cassette DNA. This reporter
cassette contains the cDNA of the reporter protein followed by a Neomycin resistance cassette
flanked by loxP sites. The reporter protein (VNP) has unstable kinetics, comprising Venus, a
yellow fluorescent reporter protein with bright signal and fast maturation, NLS, a nuclear
localization signal that targets the reporter protein to the nucleus and PEST, a peptide sequence
that reduces the half-life of the proteins to which it is fused. The modified BAC vector was
electroporated into E14tg2a ES cells, integrating randomly and in a stable manner in the
genome. After electroporation, clonal ES cell lines were generated.
2.2.2.2 Selection cassette removal from ES cells

Materials and Methods
12
Cells were dissociated (section 2.2.1.1) and 5x10⁶ cells were resuspended in ice cold PBS.
Cells were electroporated with 0.5µg of pCAGGsPuromycin and 50µg of pTurboCre, at 400V,
250µF. After the electroporation procedure, cells were left for 10min at RT and plated in GMEM
on gelatin-coated dishes. Medium was changed 6hrs later to supplemented GMEM. Selection
started in the next day, by adding 2µg/µL of Puromycin to the medium, and lasted for two days.
After that, medium was changed every day for 9 days. Subsequently, 24 individual colonies of
cells were manually picked and grown clonally. Genomic DNA from each clone was extracted
(section 2.2.5.1) to perform screening PCRs. As a control for the electroporation, 2.5x10⁶ cells
were treated as described previously being electroporated with no DNA.
2.2.3 Protein expression analysis
2.2.3.1 Fluorescence Activated Cell Sorting (FACS)
To monitor the expression of GFP/VNP reporters, FACS analysis was performed on a FACS
Calibur cytometer (Becton Dickinson). Cells were dissociated and 5x10⁵ cells were resuspended
in FACS buffer. Live cells were gated based on forward and side scatter and by propidium iodide
dye exclusion. In each data acquisition 10000 gated events were recorded and the data
obtained was subsequently analyzed using the FlowJo software.
2.2.3.2 Immunocytochemistry
Cells in coverslips were washed twice for 5min in PBS and fixed for 15min at 4ºC with 4%
(w/v) paraformaldehyde (PFA) in PBS. Cells were washed twice for 5 min in PBS and residual
PFA was washed with 0.1M Glycine in PBS for 10min at RT. Cells were permeabilized by
incubation with 0.1% Triton in PBS for 10min at RT and blocked with blocking solution for 30 min
at RT. Primary antibodies (see Table S5, Chapter 6) were diluted in blocking solution and
incubated O/N at 4ºC. Cells were then washed three times with TBST for 5min. Appropriate
secondary antibodies (see Table S5, Chapter 6) were diluted in blocking solution and incubated
for 30min at RT. Cells were washed three times for 5min with TBST and counterstained with
4',6-diamidino-2- phenylindole (DAPI) for 5min. After washing three times in PBS for 5min, cells
in coverslips were mounted with Mowiol mounting medium.
2.2.3.3 Determination of protein half-life
At day 7 or day 8 of the neural differentiation protocol, cells in coverslips were treated with
100 µg/mL of cycloheximide, an inhibitor of translation. Cells were then harvested after 30min,
1h, 3h and 6h and immunocytochemistry was performed to detect expression of the GFP
reporter (section 2.2.3.2). Alternatively, day 4 NPs were plated in MatTek dishes and rosettes
were allowed to form. Cells were treated with cycloheximide at days 7 or 8 of the neural

Materials and Methods
13
differentiation protocol and time-lapse movies were performed during 6 or 12hrs. Cells were
imaged on an inverted fluorescence Zeiss Axiovert 200M microscope in a chamber kept at 38 ºC
with a humidified 5% CO2/95% air mix. Images were captured using a 40x/0.75 NA objective
lens (Zeiss EC Plan-Neofluar) with an Hg-arc lamp and acquired with Metamorph software.
Multiple points in the dish were chosen and cells were imaged with 30min or 1hr intervals. Data
was analyzed using ImageJ software by measuring the average intensity of a maximum intensity
projection of three Z planes of selected cells in the different time-points. The background was
subtracted for each cell at each time-point.
2.2.4 RNA expression analysis
2.2.4.1 Isolation of total RNA from cultured ES cells
To extract total RNA from the cells, 106 cells were collected and washed twice in PBS. The
RNA was then extracted using the High Pure RNA Isolation Kit (Roche), according to the
manufacturer‟s instructions, and quantified (section 6.1.1).
2.2.4.2 cDNA synthesis
To synthesize cDNA from the total RNA extracted it was used the Superscript II Reverse
Transcriptase system, with random primers, according to the manufacturer‟s instructions. The
cDNA obtained was used to perform standard PCR (section 6.1.3).
2.2.5 DNA analysis
2.2.5.1 Isolation of genomic DNA for screening PCRs
For the extraction of genomic DNA for ES cell cultures, 106 cells were washed twice with ice-
cold PBS and immediately lysed with 1mL of SNET containing 400µg/mL of proteinase K. Cells
were incubated O/N at 55ºC and then an equal volume of phenol:chlorophorm:isoamyl alcohol
was added. The mixture was incubated for 30min at RT. The aqueous phase was collected after
centrifugation at 2000rpm for 5min at RT. The DNA was precipitated by adding an equal volume
of isopropanol with 1:10 sodium acetate and centrifuging at 13000g for 15min at 4ºC. Pellets
were washed with 70% ethanol and resuspended in TE O/N at 4ºC. DNA was quantified (section
2.2.6.1).
2.2.5.2 Mycoplasma detection
2.2.5.2.1 Control DNA extraction
For high quality small-scale preparation of mycoplasma positive control plasmid DNA, 3mL of
an O/N bacterial culture of transformed competent cells, in the appropriate selective LB medium,
was processed using the Wizard Plus SV Minipreps DNA Purification System (Promega),
according to the manufacturer‟s instructions.

Materials and Methods
14
2.2.5.2.2 PCR for Mycoplasma detection
To check for the absence of mycoplasma contamination in ES cell cultures, samples were
routinely collected using the following procedure. 106 cells were centrifuged at 2000rpm for
5min, resuspended in wash buffer and centrifuged again in the same conditions. The pellet was
then resuspended in a 1:1 mix of solution A and solution B and incubated for 1h at 60ºC. The
suspension was denatured, to inactivate proteinase K, by incubation at 90ºC for 10min.
The PCR for mycoplasma detection was performed using rTaq Polymerase, amplifying a
conserved region in the 16S RNA gene. The amplification was performed with an initial step of
denaturation at 95ºC for 5min, followed by 30 cycles of denaturation at 95ºC for 30sec,
annealing at 58ºC for 1.5min and extension at 72ºC for 1.5min, and a final step of extension at
72ºC for 10min. The reactions were prepared for a final volume of 25µL: 3µL of sample, 1x
buffer, 0.2mM dCTP, 0.2mM dGTP, 0.2mM dATP, 0.2mM dTTP, 25pmol of each primer and
2.5U of rTaq Polymerase. The PCR products were analyzed in agarose gel (section 6.1.2) The
quality of the DNA preparation was confirmed by performing a PCR to detect GAPDH, a
housekeeping gene that functions as an internal control. Also, a plasmid that carries an insertion
that corresponds to the amplified fragment was used as a positive control (plasmid DNA was
obtained as described in section 2.2.5.2.1).
2.2.5.3 Purification and precipitation of plasmid DNA for electroporation
To obtain high quality large-scale preparations of the plasmids to be electroporated into ES
cells, 50 mL of bacterial culture of transformed competent cells, in the appropriate selective LB
medium, were processed using the High Speed Plasmid Midi Kit (Quiagen) according to the
manufacturer‟s instructions. Precipitation of the plasmid was done by adding 1/10 of the solution
volume of 3M sodium acetate and 9/10 of isopropanol followed by centrifugation for 30 min at
13000 rpm. The pellet was washed with 70% ethanol in sterile water and resuspended in PBS in
a sterile laminar flow. DNA was quantified (section 6.1.1) and DNA integrity was confirmed by
agarose gel electrophoresis (section 6.1.2).

CHAPTER 3
Results

Results
15
3. RESULTS
To identify a cell line that allows monitoring of Notch activity and its dynamics, different
mouse ES cell lines expressing two different reporter proteins driven by the Hes5 promoter were
tested: (i) HT cell line (Hes5::GFP), described by Tomishima and co-workers [1], that expresses
a stable reporter protein; and (ii) Ha, Hc, Hd and derivatives (HdB5 and HdB8) and He cell lines
(together named Hes5::VNP), that were generated in the Laboratory (section 2.2.2.1) and
express the unstable reporter protein VNP (Figure 5). The 46C cell line, which is a Sox1:GFP
knock-in [36], was used as a control for the experiments.
Figure 5: Structure of Hes5::VNP reporter cassette and Screening PCRs scheme. The Hes5 BAC was modified
replacing the coding region of Hes5 by the reporter cassette. The reporter cassette comprises a cDNA encoding the reporter protein Venus-NLS-PEST (VNP) and a Neomycin resistance cassette flanked by loxP sites. To validate the removal of Neomycin cassette several PCRs were performed, which are illustrated in the figure by the arrows.
3.1 HT reporter ES cell line
The HT cell line was already described by Tomishima and co-workers [1] and was further
validated in terms of its stemness potential: self-renewal and pluripotency capacity. The half-life
of the reporter protein was determined to assess its suitability as reporter of Notch activity.
3.1.1 Self-renewal capacity
The self-renewal capacity of HT cells was analyzed regarding the morphology, viability and
fold increase (FI) of cell cultures. The morphology was assessed by direct observation of the
cells in an inverted bright field microscope. It was observed that HT cells grew in typical ES
morphology with cells being organized in clusters with almost no differentiation (Figure 6A-F).
Figure 6: Self-renewal capacity of 46C, HT, Ha, Hc, Hd and He ES cell lines. (A-F) Bright field images of ES cells, organized in clusters. (G) The viability of the cell lines is not statistically different from that of the control cell line (46C). (H) FI values are within the normal range of variation of ES cells and are similar to those of 46C. These values represent the average of n passages from several replicates. (Scale-bar=100 µm)

Results
16
Cells were passaged several times and the values of viability and FI were calculated as the
average of several passages in many replicates. For each replica the viability was assessed,
using the dye exclusion method by trypan blue and calculated by the ratio between the number
of viable cells (that excluded the dye) and the total number of counted cells. The FI was
determined by the ratio between the number of cells counted at the end of the passage and the
initial number of plated cells. Viabilities and FI were observed to be similar to those of the control
cell line (46C), confirming the self-renewal capacity of HT cells (Figure 6G,H).
3.1.2 Pluripotency capacity
The pluripotency capacity of HT cells was assessed regarding the ability to generate
embryoid bodies (EBs) and, specially, the ability to undergo neural differentiation.
3.1.2.1 Embryoid bodies formation
To confirm the pluripotency capacity of the HT cells, the differentiation method through EBs
was performed. HT cells generated EBs in a normal differentiation pattern (Figure S1).
3.1.2.2 Neural differentiation in adherent monolayer cultures
To further test the differentiation potential of HT cells into NPs, the neural differentiation
protocol in adherent monolayer was performed [35]. Cell morphology was monitored daily on a
bright field microscope and the formation of neuroepithelial rosettes was observed at day 8 of
the protocol (Figure 7A). The values of viability and FI were analyzed at several time-points of
the protocol (section 2.2.1.2.2). Both in high density and monolayer cultures, it was observed
that HT cells had similar values of FI and viability to those of 46C cell line (Figure 7B,C).
The efficiency of the protocol was assessed by FACS analysis using as a control the 46C cell
line that expresses GFP under the control of the Sox1 promoter. Sox1 expression is activated in
proliferating neuroectodermal cells, allowing to monitor the neural commitment efficiency [35],
(reviewed in [36], [47]). At day 4, 80% GFP positive cells were observed, a value that was
maintained at day 8 (Figure 7D), confirming the efficiency of the protocol.
In HT cell line, FACS analysis performed at days 0, 4 and 8 of the protocol showed an
increase in the expression of GFP along the protocol, with the reporter protein being expressed
in approximately 60% of NPs at day 8 of the protocol. This increase was expected, since Notch
starts to be active around day 3 [35] and is active in NPs at day 8 of the protocol. However, the
levels of GFP expression are higher than the reported values that point out to 30% of the cells
expressing Hes5 at a certain time-point in E3 chick neural tube [49]. Also, the percentage of
GFP-expressing cells is variable between replicates and dependent on the efficiency of neural
commitment, in clear contrast with 46C cell line in which this variability is not so evident. These

Results
17
results were confirmed by immunocytochemistry performed at day 8, labeling the GFP reporter
protein of 46C and HT cell lines. Cells were co-labeled with N-cadherin, marking apical
adherents junctions, to allow the identification of the centre of each rosette (Figure 8A,B).
Figure 7: Monolayer neural differentiation of HT and Hes5::VNP ES cell lines. (A) Bright field image of ES
cultures along the monolayer neural differentiation protocol. All cell lines showed typical morphology at each time-point being able to form neuroepithelial rosettes. (B,C) Values of viability and FI were similar to the ones of 46C cell line, both in High density and Monolayer cultures. (D) Analysis of the reporter proteins by FACS revealed that GFP is
being expressed in approximately 60% of HT cells, while VNP is expressed only in Hd and He cell lines in approximately 5% of the cells. (Scale-bar=100µm)
3.1.3 GFP half-life
The suitability of the HT cell line as a good reporter of Notch activity was assessed by
measuring the half-life of the reporter protein in neuroepithelial rosettes (section 2.2.3.3) using
time-lapse movies and immunocytochemistry to visualize GFP.
Three time-lapse movies were preformed from which 72 cells were analyzed. It was observed
that 12hrs after the blockage of translation the expression of GFP in HT cells, as measured by
the fluorescence intensity, is still 75% of the initial value (Figure 9A). These results were
confirmed by immunocytochemistry measuring the fluorescence intensity of 230 cells at several
time points. It was observed that 6hrs after inhibition of translation blockage the levels of GFP

Results
18
expression are very similar to those of the initial time-point (Figure 9B). These results show that
the HT cell line cannot be used to monitor Notch activity since the reporter protein perdures in
the cell for much longer than the HES5 protein [42], impairing the observation of possible
variations in levels of Notch activity. Therefore, a novel cell line that expresses a reporter protein
with a half-life closer to that of the HES5 needs to be generated in order to be able to monitor
the onset and termination of Notch activity.
Figure 8: Immunocytochemistry of neuroepithelial rosettes preformed at day 8. Cells were labeled by
immunocytochemistry using antibodies against N-cadherin (red), marking the apical junctions of the rosettes, and by GFP (green) marking the respective reporter protein: (A) 46C cells expressing GFP driven by the Sox1 promoter, (B) HT cells expressing GFP under the control of the Hes5 promoter (C) Hes5::VNP cells expressing VNP under the control of the Hes5 promoter. Nuclei are stained with DAPI. (Scale-bar=50µm)
3.2 Ha, Hc, Hd, He reporter ES cell lines

Results
19
Four Hes5::VNP ES cell lines (Ha, Hc, Hd and He) were generated in the Laboratory by the
electroporation of a modified BAC vector, expressing an unstable yellow fluorescent reporter
protein that localizes to the nucleus (VNP) under the control of the Hes5 promoter. Similarly to
the analyses performed for the HT cell line (section 3.1), these novel cell lines were validated in
terms of their stemness potential.
Figure 9: Intensity of GFP expression in HT cells after translation blockage. (A) Fluorescence intensities
measured in time-lapse movies of neuroepithelial rosettes: the values were calculated for each cell by the ratio between the fluorescence intensity of each time point and the fluorescence intensity of the initial time point. After 12hrs of blockage of translation, the expression of GFP reporter is still ~75% of the initial value. (B) Fluorescence
intensities measured in cells labeled with anti-GFP antibody: the values were calculated by the ratio between the fluorescence intensity of one cell at a certain time-point and the average of fluorescence intensities of all cells measured at the initial time-point. After 6hrs of translation inhibition the fluorescent ratio is similar to the initial value. The line represents the average between several replicates and for each time-point each dot represents one cell.
3.2.1 Self-renewal capacity
The morphology of the cells was assessed by their direct observation in an inverted bright
field microscope. It was observed that all cell lines had a cluster-like ES morphology with almost
no differentiation (Figure 6C-F). Furthermore, they all show values of FI and viability that were
similar to the ones of 46C, confirming their self-renewal capacity (Figure 6G,H).
3.2.2 Pluripotency capacity
3.2.2.1 EB formation
To confirm the pluripotency capacity of the cell lines, the differentiation method through EBs
was performed. Hd and He generated EBs in a normal differentiation pattern (Figure S1C,D).
3.2.2.2 Neural differentiation in adherent monolayer cultures
As done with the HT cell line, the neural differentiation capacity of the four ES cell lines
expressing the Hes5::VNP reporter was assessed. Cell morphology was observed daily on a
bright field microscope and the formation of neuroepithelial rosettes was observed at day 8 of
the protocol, confirming that the four cell lines were able to undergo neural commitment (Figure
7A). The values of viability and FI were analyzed at several time-points of the protocol (days -1,
0, 4 and 8). Both in the high density and monolayer cultures, it was observed that the four ES
cell lines had similar values of FI and viability to those of the 46C cell line (Figure 7B,C). The
Results
20
efficiency of the neural commitment was again confirmed by FACS analysis performed at day 8,
using the 46C cell line as a control, which showed 80% of GFP-expressing cells (Figure 7D).
FACS analysis at days 0, 4 and 8 showed that only two of the four clones (Hd and He) had a
slight increase in VNP expression along the protocol. Hd is the cell line expressing higher levels
of VNP at day 8 of the protocol, ~5% (Figure 7D), a value that is lower than the expected
compared with previously published data in E3 chick, where approximately 30% of cells have
been shown to express Hes5 [49]. This might be due to the presence of the Neomycin
resistance cassette before the polyadenylation signal, which could be causing the transcription
of an incomplete reporter mRNA lacking a poly(A) tail sequence and that is potentially very
unstable. The observed VNP expression levels for these novel cell lines are also lower than
those observed for the HT cell line, as expected, since GFP expressed in HT cells is a stable
reporter protein and consequently is not degraded as fast as the VNP reporter protein. VNP
expression was confirmed by immunocytochemistry performed at day 8 (Figure 8C) using the
same markers as in HT validation (GFP and N-cad) (section 3.1.2.2). It was also observed that
the reporter is not expressed in all Hd and He cells, as expected, since Notch signaling is not
active in all NPs at the same time (reviewed in [15]). Additionally, it was observed that the
expression levels of the reporter protein are different between cells. This could mean that there
are different levels of Notch activity between cells, but constant in each cell, or that Notch activity
varies in individual cells and the differences observed result from the harvesting of cells in
different phases of that variation. Overall these results suggest that the Hes5::VNP reporter cell
lines might be adequate to monitor Notch activity, but the presence of Neomycin resistance
cassette might be impairing VNP expression.
3.2.3 Removal of Neomycin resistance cassette
To allow the proper expression of the reporter protein, the Neomycin resistance cassette was
removed. As this cassette is flanked by loxP sites, the Cre-loxP system was be used. Being Hd
the Hes5::VNP cell line with the highest levels of expression of the reporter protein, it was
chosen to proceed with the experiments.
3.2.3.1 ES cell electroporation
For the removal of the Neomycin selection cassette, Hd cells were electroporated with
pTurbo-Cre, which encodes a Cre recombinase expressed under a strong promoter and that is
targeted to the nucleus (increasing its efficiency), and pCAGGsPuromycin, which encodes a
Puromycin resistance protein to allow for the selection of electroporated cells. The plasmids to
be electroporated were isolated (section 2.2.5.3), quantified and the quality of the plasmids was

Results
21
confirmed by the presence of a single band in an agarose gel (Figure S2) (an additional band
indicates nicked plasmids, which cannot be used because they are more probable of integrating
into the genome of the cells, causing subsequent deleterious effects). After electroporation,
selection was performed with Puromycin for 2 days. Almost all cells detached from the plates but
some small clusters remained attached and kept growing, in clear contrast with the negative
control (cells electroporated without plasmid), where all cells detached (data not shown). When
clusters started to be visible by eye (9 days after electroporation), 24 clusters were carefully
picked (clones HdA1-A12 and HdB1-B12) and expanded. From the 11 clones that survived to
the expansion, genomic DNA was extracted and used for PCR analysis (clones HdA2, HdA3,
HdA8, HdA10, HdA11, HdB1, HdB4, HdB5, HdB7, HdB8, HdB11).
3.2.3.2 Validation of Neomycin resistance cassette removal
The removal of the Neomycin cassette was confirmed by the inability of cells to grow in
Neomycin supplemented media and by PCR analysis. The self-renewal capacity of the clones
was also analyzed to determine if any deleterious genomic effects occurred.
3.2.3.2.1 Growth in Neomycin
To identify the ES cell clones where the Neomycin cassette was excised, cells were grown in
GMEM supplemented with 4µg/mL of Neomycin, for 4 days. From the 11 expanded clones, 7 of
them were not able to grow upon Neomycin addition and, therefore, were good candidates to
have excised the cassette (HdA2, HdA11, HdB1, HdB5, HdB7, HdB8, HdB11) (Table S1).
3.2.3.2.2 PCR validation
Several PCR reactions were performed in order to confirm the excision of the Neomycin
cassette (see annealing regions of the primers in Figure 5). Specifically, a PCR to detect the
Neomycin resistance gene and a PCR to detect the reporter cassette were used to confirm the
results obtained by growth in Neomycin. The PCR to detect the reporter cassette amplifies a
DNA fragment of 767 bp when the selection cassette is excised, but when the selection cassette
is present the sequence between the annealing region of the primers is too long for PCR
amplification. For all the clones, PCRs gave results that are coincident with the data from growth
in Neomycin: clones where the selection cassette was removed have amplification of a DNA
fragment correspondent to the PCR to detect the reporter cassette and no amplification of a
DNA fragment correspondent to the Neomycin resistance gene (Figure 10). The results confirm
that clones HdA2, HdA11, HdB1, HdB5, HdB7, HdB8, HdB11 excised the selection cassette. In
addition, a PCR to detect Venus DNA was performed to ensure that it was not excised together
with the Neomycin resistance cassette, due a recombination error. Only in the case of HdB7

Results
22
clone the PCR did not amplify Venus DNA (Figure 10), and this clone was therefore discarded
from future analyses. The quality of the DNA was assessed by PCR to detect GAPDH.
Figure 10: Screening PCRs. The clones HdA2, HdA11, HdB1, HdB5, HdB8 and HdB11 fully respected the PCR
selection criteria for Neomycin selection cassette removal: (i) amplification of a DNA fragment with the correct size of the reporter cassette PCR; (ii) no amplification of Neomycin resistance gene DNA; (iii) amplification of Venus DNA.
3.2.3.3 Cell line choice
The clones HdA2, HdA11, HdB1, HdB5, HdB8 and HdB11 respected all the criteria of
Neomycin resistance cassette removal validation. No significant differences were observed
between the clones, regarding the self-renewal capacity (morphology, viability and FI), except for
HdA11 and HdB1 that had many differentiated cells (data not shown) and consequently were not
chosen to proceed with the experiments. Initial data suggested that the cell lines with higher
values of viability and FI were HdB5 and HdB8. These were then chosen to be used in the
following experiments and for further validation in terms of self-renewal capacity and reporter
protein expression, to assess their suitability as reporters of Notch activity. Also, PCRs were
performed to assess the integration of the electroporated plasmids (pTurboCre and
pCAGGsPuromycin) into the genome of the cells, which could cause deleterious effects. The
absence of the plasmids was confirmed for both ES cell lines, since no DNA bands could be
detected (Figure S3). The quality of the DNA was confirmed by a PCR to detect GAPDH.
3.3 HdB5 and HdB8 ES cell lines
HdB5 and HdB8, the cell lines generated by the removal of Neomycin cassette, were
validated regarding their stemness capacity as described previously (sections 3.1.1 and 3.1.2).
3.3.1 Self-renewal capacity
No significant differences were observed in terms of morphology, viability and FI between
HdB5 and HdB8 ES cell lines and the parental cell line (Hd) (Figure 11A-C).

Results
23
Figure 11: Self-renewal capacity of HdB5 and HdB8 ES cell lines. (A-C) All analyzed cell lines show typical morphology of ES cells, organized in clusters. (D) The viability of both cell lines is similar to that of the control cell line 46C. (E) Values of FI are within the normal range of variation of ES cells. These values represent the average of n
passages from several replicates. (Scale-bar=100μm)
3.3.2 Pluripotency capacity: neural differentiation in adherent monolayer cultures
The neural differentiation capacity of both ES cell lines was assessed by the ability of the
cells to undergo neural commitment, which was confirmed by the observation of neuroepithelial
rosettes at day 8 of the protocol (Figure 12A). Additionally, analyses of morphology, viability and
FI of the cells were performed. No differences were observed in morphology relative to the
control cell line. The values of viability and FI were analyzed at several time-points of the
protocol (section 2.2.1.2.2) showing similar values to those of the parental cell line both in high
density and monolayer cultures (Figure 12B,C).
Figure 12: Monolayer neural differentiation of HdB5 and HdB8 ES cell lines. (A) Morphology of ES cultures
along the monolayer neural differentiation protocol. All cell lines had typical morphology at each time-point and all were able to form neuroepithelial rosettes. (B,C) Values of viability and FI are not statistically different from those of the control cell line Hd both in High density and Monolayer cultures. (D) Analysis of the expression of the reporter
proteins by FACS revealed that VNP is not expressed in any of the HdB5 or HdB8 ES cell lines. These values represent the average of n passages from several replicates. (Scale-bar=100µm)
To determine if the HdB5 and HdB8 cell lines show reporter expression in NPs, FACS
analysis was performed along the differentiation protocol and immunocytochemistry at day 8. By
either method, the analysis of the results showed that none of the clones were expressing the
reporter protein (Figure 12D, Figure 13), in clear contrast with the parental cell line (Hd), which
showed ~5% of the cells expressing the VNP reporter protein. This could be due to the low copy
number of the reporter DNA due to multiple copy excision during the removal of Neomycin
resistance cassette, coupled to the fast degradation of the reporter mRNA and protein, which
might impair the visualization of VNP expression. In addition, damages in the promoter
sequence or other signals necessary for transcription or translation might have occurred.

Results
24
Figure 13: Immunocytochemistry of neuroepithelial rosettes (day 8) of HdB5 and HdB8 cell lines. Cells were
labeled using antibodies against N-cadherin (red), marking the apical junctions of the rosettes and GFP (green), marking VNP reporter protein. Nuclei are stained with DAPI. (Scale-bar=50µm)
3.3.3 Analysis of expression of VNP mRNA in HdB5 and HdB8 cell lines
To assess if the lack of reporter expression in HdB5 and HdB8 was due to problems in
translation or in transcription, the expression of the mRNA encoding the reporter protein was
analyzed by RT-PCR for each cell line at days 0, 4 and 8 of the neural differentiation protocol
(section 2.2.4). The quality of the cDNA produced was confirmed by a PCR to detect GAPDH
and 46C cells were used as controls for the expression of endogenous Hes5 and reporter
protein. In 46C cells it was observed that expression of the Hes5 increases along the protocol,
as occurs also with the expression of reporter mRNA driven by the Sox1 promoter, as expected
[35], [36]. This increase in Hes5 mRNA expression was also observed for Hd, HdB5 and HdB8
cell lines confirming that cells are expressing the gene and that the lack of reporter expression is
not due to deleterious effects on the signals necessary for Hes5 expression.
In HT cells a precise relation between the levels of expression of endogenous Hes5 and the
ones of the reporter mRNA was observed, with both increasing with the same magnitude along
the protocol. In contrast, in HdB5 and HdB8 cells and in the parental cell line Hd, the increase in
endogenous Hes5 expression from day 4 to day 8 is not followed by the same increase in the
expression of the reporter mRNA. This shows that in Hd, HdB5 and HdB8 cells, reporter
expression is not a good readout of endogenous Hes5 expression, suggesting that these cell
lines might not be suitable to report Notch activity. Altogether these results also show that the
lack of reporter expression is caused by impaired mRNA expression. When compared with the
levels of expression of GFP mRNA in HT cells, the levels of expression of VNP mRNA in Hd,
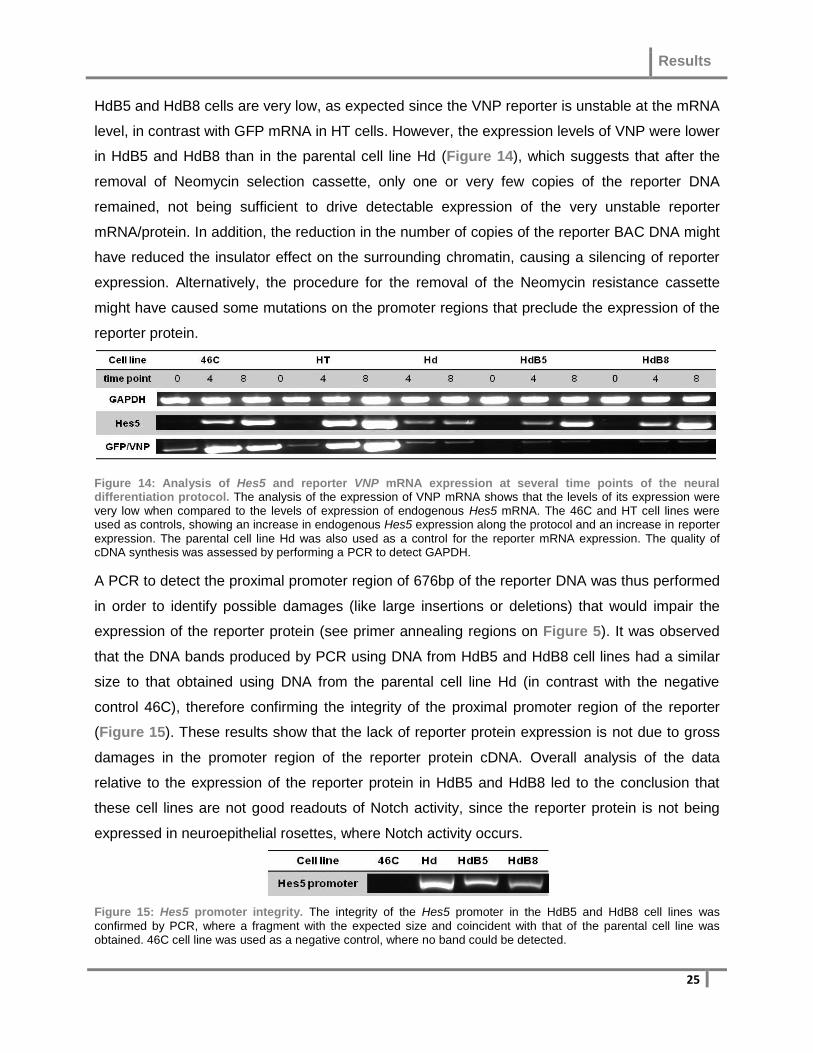
Results
25
HdB5 and HdB8 cells are very low, as expected since the VNP reporter is unstable at the mRNA
level, in contrast with GFP mRNA in HT cells. However, the expression levels of VNP were lower
in HdB5 and HdB8 than in the parental cell line Hd (Figure 14), which suggests that after the
removal of Neomycin selection cassette, only one or very few copies of the reporter DNA
remained, not being sufficient to drive detectable expression of the very unstable reporter
mRNA/protein. In addition, the reduction in the number of copies of the reporter BAC DNA might
have reduced the insulator effect on the surrounding chromatin, causing a silencing of reporter
expression. Alternatively, the procedure for the removal of the Neomycin resistance cassette
might have caused some mutations on the promoter regions that preclude the expression of the
reporter protein.
Figure 14: Analysis of Hes5 and reporter VNP mRNA expression at several time points of the neural differentiation protocol. The analysis of the expression of VNP mRNA shows that the levels of its expression were very low when compared to the levels of expression of endogenous Hes5 mRNA. The 46C and HT cell lines were used as controls, showing an increase in endogenous Hes5 expression along the protocol and an increase in reporter
expression. The parental cell line Hd was also used as a control for the reporter mRNA expression. The quality of cDNA synthesis was assessed by performing a PCR to detect GAPDH.
A PCR to detect the proximal promoter region of 676bp of the reporter DNA was thus performed
in order to identify possible damages (like large insertions or deletions) that would impair the
expression of the reporter protein (see primer annealing regions on Figure 5). It was observed
that the DNA bands produced by PCR using DNA from HdB5 and HdB8 cell lines had a similar
size to that obtained using DNA from the parental cell line Hd (in contrast with the negative
control 46C), therefore confirming the integrity of the proximal promoter region of the reporter
(Figure 15). These results show that the lack of reporter protein expression is not due to gross
damages in the promoter region of the reporter protein cDNA. Overall analysis of the data
relative to the expression of the reporter protein in HdB5 and HdB8 led to the conclusion that
these cell lines are not good readouts of Notch activity, since the reporter protein is not being
expressed in neuroepithelial rosettes, where Notch activity occurs.
Figure 15: Hes5 promoter integrity. The integrity of the Hes5 promoter in the HdB5 and HdB8 cell lines was
confirmed by PCR, where a fragment with the expected size and coincident with that of the parental cell line was obtained. 46C cell line was used as a negative control, where no band could be detected.

CHAPTER 4
Discussion

Discussion
26
4. DISCUSSION
In this work I have analyzed an already described Hes5::GFP reporter ES cell line (HT cell
line), to test its suitability as a reporter to monitor Notch activity with high accuracy at the single
cell level. I found that the HT cells express a reporter protein that perdures in the cell long after
Notch activity is extinguished. Therefore, I have started the development of a novel cell line
expressing a reporter protein with a short half-life that would allow the monitoring of Notch
signaling dynamics.
In the construction of a reporter cell line, one of the most important characteristics of the
reporter protein is its half-life, especially when the endogenous protein whose expression is
going to be monitored has short half-life, as is the case of HES5. In order to be able to detect the
onset and termination of Notch activity the reporter protein must have a half-live close to that of
HES5, which has been shown to be shorter that 1hr [42]. However, it should be noted that the
experiments to determine the half-life of HES5 were not performed in neural progenitors and
therefore the value for this type of cell might differ. I validated HT cells in terms of self-renewal
capacity and analyzed their capacity to undergo neural differentiation, confirming the ability of
HT cells to form neuroepithelial rosettes expressing the reporter protein. I also tested the half-life
of the GFP reporter protein in HT cells to assess its suitability as a Notch activity reporter with
fast response kinetics, confirming that it perdures in the cell for a long time after the stop of
translation. Actually, 12 hrs after the blockage of translation, HT cells still express 75% of the
initial values of GFP, in agreement with previous published data that report a half-life of
approximately 26hrs for GFP. Therefore, I showed that HT cells should not be used as reporters
to monitor Notch activity dynamics since GFP perdures in the cell after the termination of Notch
activity. Additionally, I have observed that the expression levels of GFP in HT cell line at day 8
are very variable between replicates and highly dependent on the efficiency of neural
commitment and on the culture state, in contrast with the 46C cell line that has a more robust
expression of GFP and is less dependent on the state of the culture. Altogether these results
show that HT cells cannot be used to monitor dynamics of Notch activity.
Due to the inadequacy of the HT cell line, I proceeded to the establishment of a novel cell
line, with an unstable VNP reporter protein, whose expression would faithfully mimic the
expression of the endogenous Hes5 gene. A similar reporter protein, unstable Venus-PEST, has
already been used allowing the visualization of oscillations with 2hrs period in the expression of
Lfng promoter [47]. This suggests that VNP is suitable to detect variations of HES5 expression if
it has a similar period [42]. Several ES cell lines expressing the VNP reporter were generated

Discussion
27
and validated, confirming no significant differences to the parental cell line in terms of self-
renewal and pluripotency capacities. Specifically, the neural differentiation capacity of these
cells was confirmed, as well as the expression of the reporter protein.
From the initial generated ES cell lines, Hd was validated and shown to express the reporter
protein in neuroepithelial rosettes. However, Hd cells cannot be used as an adequate reporter of
Notch activity since the reporter cassette comprises a Neomycin resistance gene that might be
interfering with reporter expression because it is located between the coding region of VNP and
the polyadenylation signal present at the 3‟UTR region. Therefore, in this cell line the reporter
mRNA might be produced with the poly(A) signal from Neomycin gene or with no poly(A) signal.
This might result in the production of a mRNA without the proper regulation signals or of a highly
unstable mRNA impairing the detection of reporter expression. The cell lines in which the
Neomycin resistance gene was removed showed self-renewal and pluripotency capacities
similar to the control cell line. However, the cell lines selected to continue the experiments, HdB5
and HdB8, were proven not to be suitable to reporter Notch activity since they do not express
the reporter protein VNP, as observed by FACS analysis and confirmed by
immunocytochemistry.
To investigate whether the cause of lack of reporter protein expression was reduced
transcriptional activity, the reporter expression was analyzed at the mRNA level. Analysis of the
mRNA reporter expression in HdB5 and HdB8 showed that it was lower than in the parental cell
line and not increasing along the differentiation protocol. These results were in clear contrast
with the levels of expression of the endogenous Hes5 gene in the same cell lines that showed
an increase from days 0 to 8. These results show that the reporter expression is not mimicking
that of the endogenous Hes5 and suggest that the lack of reporter protein expression is due to
problems at the level of reporter transcription and not to some deleterious effects affecting
signals necessary for Hes5 expression. One possible explanation for the lack of reporter protein
expression might reside on damages (insertions or deletions) in the reporter promoter region.
This hypothesis was tested by the amplification of a DNA fragment from either cell line,
comprising the proximal promoter region of the reporter bigger than the 400 bp that were
described to be sufficient for transcriptional activation after Notch activity [50]. It was observed
that in either case a fragment with the expected size and similar to that of the parental cell line
(Hd) could be amplified, suggesting that no major deletion or insertion was made in the promoter
region that could impair reporter protein expression. For a detailed analysis of the promoter
region, sequencing would have to be performed. Also, these results exclude the hypothesis of
Discussion
28
damages in the promoter region but do not exclude the existence of damages in the sequence
of other regulatory transcriptional signals.
Alternatively, upon the generation of Hes5::VNP cell lines, the modified BAC might have
inserted in multiple copies in tandem, allowing the expression of the reporter. However, upon the
excision of the selection cassette, some copies of the BAC might have also been excised by the
recombination between loxP sites of different BAC copies, remaining only one copy of the
construct after recombination. This one copy might have been silenced due to the inhibiting
effects of the neighboring chromatin. Also it has been reported that repression at single-copy
levels might occur because tandem repeats might amplify the effects of inhibitory or activating
sequences present in the repeated sequence [51]. Additionally, the production of a highly
unstable reporter mRNA, due to the presence of the Hes5 3‟UTR, that is degraded faster than
the folding of the reporter protein might account for the inability to detect reporter expression.
This would explain the expression of the reporter protein in Hd cells and the lack of expression
in the cell lines where the selection cassette was removed.
Despite the already described restrictions in the observation of reporter expression in Hd cells
due to the presence of the Neomycin resistance cassette, it was observed by
immunocytochemistry that in a neuroepithelial rosette not all cells express the reporter protein at
the same levels, which suggests that the intensity of Notch activity varies between cells. This
might be the result of cells having different levels of Notch activity between themselves but
constant in each cell; also, this could mean that Notch activity is not constant, varying in each
cell and that the observed differences are due to the harvesting of cells in different phases of
that variation. These results suggest that there might be fluctuations of Notch activity,
emphasizing the importance of monitoring Notch activity in single NPs.
In order to overcome the limitations of the previous strategy to generate Hes5::VNP reporter
cell lines and to engineer a cell line that would allow monitoring of Notch activity some other
strategies have to be used. First, as there were generated four initial Hes5::VNP cell lines from
which two were expressing the reporter protein (Hd and He), He cell line should be tested to
assess its suitability as a Notch activity reporter and the Neomycin cassette should be removed.
To generate new cell lines, it will be necessary to generate more initial clones, which would have
different integration sites, increasing the probability of finding a cell line suitable for monitoring
Notch activity. Also, upon the engineering planning of the cell lines, the construct should be
designed so that the Neomycin resistance cassette will not need to be removed to allow the
proper expression of the reporter and the visualization of the reporter protein expression. In this
new strategy, the reporter DNA must have its own polyadenylation signal before the Neomycin

Discussion
29
resistance cassette sequence to confer proper expression of the reporter protein, allowing its
assessment before the removal of the Neomycin selection cassette. This would diminish the
time and handling procedures for the cell line validation process and also the probabilities of
genomic instability and damage inherent to ES cell culture.
After the generation of novel ES cell lines expressing the VNP reporter protein under the
control of the Hes5 promoter, it will be possible to monitor Notch activity and follow single NP
cells. This will allow determining if Notch can have multiple activations in a life-time of a NP, if its
activation occurs specifically in one phase of the cell cycle and if it is correlated with the fate of
that NP being necessary to maintain cells in an undifferentiated state. Additionally, other BAC
constructs can be electroporated into the Hes5::VNP cell line generated in order to create
double reporter cell lines. This is the case of a BAC carrying a reporter of Delta1 expression that
has already been generated in the Laboratory. The construction of a double reporter cell line in
which Hes5 and Delta1 expression can be followed in real time and at the single cell level would
allow following differentiated cells to determine the timing of commitment to neural
differentiation.

CHAPTER 5
Bibliography

Bibliography
30
5. BIBLIOGRAPHY
[1] M. J. Tomishima, A.-K. Hadjantonakis, S. Gong, and L. Studer, “Production of green fluorescent protein transgenic embryonic stem cells using the GENSAT bacterial artificial chromosome library.,” Stem cells (Dayton, Ohio), vol. 25, no. 1, pp. 39-45, Jan. 2007.
[2] M. Ueno, K.-ichi Katayama, H. Yamauchi, H. Nakayama, and K. Doi, “Cell cycle progression is required for nuclear migration of neural progenitor cells.,” Brain research, vol. 1088, no. 1, pp. 57-67, May. 2006.
[3] L. M. Baye and B. a Link, “Nuclear migration during retinal development.,” Brain research, vol. 1192, pp. 29-36, Feb. 2008.
[4] M. Hollyday, “Neurogenesis in the vertebrate neural tube.,” International journal of developmental neuroscience : the official journal of the International Society for Developmental Neuroscience, vol. 19, no. 2, pp. 161-73, Apr. 2001.
[5] S. Fujita, “The discovery of the matrix cell, the identification of the multipotent neural stem cell and the development of the central nervous system.,” Cell structure and function, vol. 28, no. 4, pp. 205-28, Aug. 2003.
[6] Y. Kosodo et al., “Regulation of interkinetic nuclear migration by cell cycle-coupled active and passive mechanisms in the developing brain.,” The EMBO journal, no. 2010, pp. 1-15, Mar. 2011.
[7] a Murciano, J. Zamora, J. Lopezsanchez, and J. Frade, “Interkinetic Nuclear Movement May Provide Spatial Clues to the Regulation of Neurogenesis,” Molecular and Cellular Neuroscience, vol. 21, no. 2, pp. 285-300, Oct. 2002.
[8] Y. Kosodo, K. Röper, W. Haubensak, A.-M. Marzesco, D. Corbeil, and W. B. Huttner, “Asymmetric distribution of the apical plasma membrane during neurogenic divisions of mammalian neuroepithelial cells.,” The EMBO journal, vol. 23, no. 11, pp. 2314-24, Jun. 2004.
[9] J. a Knoblich, “Mechanisms of asymmetric stem cell division.,” Cell, vol. 132, no. 4, pp. 583-97, Mar. 2008.
[10] A. C. Wilcock, J. R. Swedlow, and K. G. Storey, “Mitotic spindle orientation distinguishes stem cell and terminal modes of neuron production in the early spinal cord.,” Development (Cambridge, England), vol. 134, no. 10, pp. 1943-54, May. 2007.
[11] P. Alexandre, A. M. Reugels, D. Barker, E. Blanc, and J. D. W. Clarke, “Neurons derive from the more apical daughter in asymmetric divisions in the zebrafish neural tube,” Online, 2010.
[12] P. Salomoni and F. Calegari, “Cell cycle control of mammalian neural stem cells: putting a speed limit on G1.,” Trends in cell biology, vol. 20, no. 5, pp. 233-243, Feb. 2010.
[13] M. Götz and W. B. Huttner, “The cell biology of neurogenesis.,” Nature reviews. Molecular cell biology, vol. 6, no. 10, pp. 777-88, Oct. 2005.
[14] S. Artavanis-Tsakonas, “Notch Signaling: Cell Fate Control and Signal Integration in Development,” Science, vol. 284, no. 5415, pp. 770-776, Apr. 1999.

Bibliography
31
[15] A. Louvi and S. Artavanis-Tsakonas, “Notch signalling in vertebrate neural development.,” Nature reviews. Neuroscience, vol. 7, no. 2, pp. 93-102, Mar. 2006.
[16] J. D. Axelrod, “Delivering the lateral inhibition punchline: it‟s all about the timing.,” Science signaling, vol. 3, no. 145, p. pe38, Jan. 2010.
[17] G. Weinmaster, “The ins and outs of notch signaling.,” Molecular and cellular neurosciences, vol. 9, no. 2, pp. 91-102, Jan. 1997.
[18] F. Schweisguth, “Regulation of Notch Signaling Activity,” Current Biology, vol. 14, no. 3, p. R129-R138, Feb. 2004.
[19] R. Fior and D. Henrique, “„Notch-Off‟: a perspective on the termination of Notch signalling.,” The International journal of developmental biology, vol. 53, no. 8-10, pp. 1379-84, Jan. 2009.
[20] R. Kageyama, Y. Niwa, and H. Shimojo, “Rhythmic gene expression in somite formation and neural development.,” Molecules and cells, vol. 27, no. 5, pp. 497-502, May. 2009.
[21] R. Kageyama, T. Ohtsuka, H. Shimojo, and I. Imayoshi, “Dynamic Notch signaling in neural progenitor cells and a revised view of lateral inhibition.,” Nature neuroscience, vol. 11, no. 11, pp. 1247-51, Nov. 2008.
[22] J. Lewis, A. Hanisch, and M. Holder, “Notch signaling, the segmentation clock, and the patterning of vertebrate somites.,” Journal of biology, vol. 8, no. 4, p. 44, Jan. 2009.
[23] Y. Masamizu et al., “Real-time imaging of the somite segmentation clock: revelation of unstable oscillators in the individual presomitic mesoderm cells.,” Proceedings of the National Academy of Sciences of the United States of America, vol. 103, no. 5, pp. 1313-8, Jan. 2006.
[24] H. Shimojo, T. Ohtsuka, and R. Kageyama, “Oscillations in notch signaling regulate maintenance of neural progenitors.,” Neuron, vol. 58, no. 1, pp. 52-64, Apr. 2008.
[25] R. Kageyama, Y. Niwa, and H. Shimojo, Ultradian Oscillations in Notch Signaling Regulate Dynamic Biological Events, vol. 92, no. 10. Elsevier Inc., 2010, pp. 311-331.
[26] F. Del Bene, A. M. Wehman, B. a Link, and H. Baier, “Regulation of neurogenesis by interkinetic nuclear migration through an apical-basal notch gradient.,” Cell, vol. 134, no. 6, pp. 1055-65, Sep. 2008.
[27] E. Cisneros, M. J. Latasa, M. García-Flores, and J. M. Frade, “Instability of Notch1 and Delta1 mRNAs and reduced Notch activity in vertebrate neuroepithelial cells undergoing S-phase.,” Molecular and cellular neurosciences, vol. 37, no. 4, pp. 820-31, Apr. 2008.
[28] A. Tokunaga, J. Kohyama, T. Yoshida, K. Nakao, K. Sawamoto, and H. Okano, “Mapping spatio-temporal activation of Notch signaling during neurogenesis and gliogenesis in the developing mouse brain.,” Journal of neurochemistry, vol. 90, no. 1, pp. 142-54, Jul. 2004.
[29] T. Takahashi, R. S. Nowakowski, and V. S. Caviness, “Cell cycle parameters and patterns of nuclear movement in the neocortical proliferative zone of the fetal mouse.,” The Journal of neuroscience : the official journal of the Society for Neuroscience, vol. 13, no. 2, pp. 820-33, Feb. 1993.
Bibliography
32
[30] J. F. Battey, “Stem cells: current challenges and future promise.,” Developmental dynamics : an official publication of the American Association of Anatomists, vol. 236, no. 12, pp. 3193-8, Dec. 2007.
[31] J. Nichols and A. Smith, “The origin and identity of embryonic stem cells.,” Development (Cambridge, England), vol. 138, no. 1, pp. 3-8, Jan. 2011.
[32] M. Buehr and A. Smith, “Genesis of embryonic stem cells.,” Philosophical transactions of the Royal Society of London. Series B, Biological sciences, vol. 358, no. 1436, pp. 1397-402; discussion 1402, Aug. 2003.
[33] a G. Smith, “Embryo-derived stem cells: of mice and men.,” Annual review of cell and developmental biology, vol. 17, pp. 435-62, Jan. 2001.
[34] E. a Mayhall, N. Paffett-Lugassy, and L. I. Zon, “The clinical potential of stem cells.,” Current opinion in cell biology, vol. 16, no. 6, pp. 713-20, Dec. 2004.
[35] E. Abranches et al., “Neural differentiation of embryonic stem cells in vitro: a road map to neurogenesis in the embryo.,” PloS one, vol. 4, no. 7, p. e6286, Jan. 2009.
[36] Q.-L. Ying, M. Stavridis, D. Griffiths, M. Li, and A. Smith, “Conversion of embryonic stem cells into neuroectodermal precursors in adherent monoculture.,” Nature biotechnology, vol. 21, no. 2, pp. 183-6, Feb. 2003.
[37] M. P. Stavridis and a G. Smith, “Neural differentiation of mouse embryonic stem cells.,” Biochemical Society transactions, vol. 31, no. 1, pp. 45-9, Feb. 2003.
[38] L. Hook, C. O. Brien, and T. Allsopp, “ES cell technology : An introduction to genetic manipulation , differentiation and therapeutic cloning B,” Advanced Drug Delivery Reviews, vol. 57, pp. 1904 - 1917, 2005.
[39] C. Souilhol, S. Cormier, M. Monet, S. Vandormael-pournin, C. Babinet, and M. Cohen-tannoudji, “HAL Archives Ouvertes ‒ France Author Manuscript Nas transgenic mouse line allows visualization of Notch pathway activity in vivo HAL-AO Author Manuscript,” 2006.
[40] D. G. Placantonakis et al., “BAC transgenesis in human embryonic stem cells as a novel tool to define the human neural lineage.,” Stem cells (Dayton, Ohio), vol. 27, no. 3, pp. 521-32, Mar. 2009.
[41] J. L. de la Pompa et al., “Conservation of the Notch signalling pathway in mammalian neurogenesis.,” Development (Cambridge, England), vol. 124, no. 6, pp. 1139-48, Mar. 1997.
[42] L. V. Sharova, A. a Sharov, T. Nedorezov, Y. Piao, N. Shaik, and M. S. H. Ko, “Database for mRNA half-life of 19 977 genes obtained by DNA microarray analysis of pluripotent and differentiating mouse embryonic stem cells.,” DNA research : an international journal for rapid publication of reports on genes and genomes, vol. 16, no. 1, pp. 45-58, Feb. 2009.
[43] H.-Q. Xian, K. Werth, and D. I. Gottlieb, “Promoter analysis in ES cell-derived neural cells.,” Biochemical and biophysical research communications, vol. 327, no. 1, pp. 155-62, Feb. 2005.
[44] T. Ohtsuka, I. Imayoshi, H. Shimojo, E. Nishi, R. Kageyama, and S. K. McConnell, “Visualization of embryonic neural stem cells using Hes promoters in transgenic mice.,” Molecular and cellular neurosciences, vol. 31, no. 1, pp. 109-22, Jan. 2006.

Bibliography
33
[45] K. Narayanan and Q. Chen, “Recombineering,” vol. 2011, 2011.
[46] N. G. Copeland, N. a Jenkins, and D. L. Court, “Recombineering: a powerful new tool for mouse functional genomics.,” Nature reviews. Genetics, vol. 2, no. 10, pp. 769-79, Oct. 2001.
[47] A. Aulehla et al., “A beta-catenin gradient links the clock and wavefront systems in mouse embryo segmentation.,” Nature cell biology, vol. 10, no. 2, pp. 186-93, Feb. 2008.
[48] L. H. Pevny, S. Sockanathan, M. Placzek, and R. Lovell-Badge, “A role for SOX1 in neural determination.,” Development (Cambridge, England), vol. 125, no. 10, pp. 1967-78, May. 1998.
[49] R. Fior, J. R. Swedlow, and K. G. Storey, BMC Biology. 2011.
[50] C.-tong Ong et al., “Target Selectivity of Vertebrate Notch Proteins COLLABORATION BETWEEN DISCRETE DOMAINS AND CSL-BINDING SITE ARCHITECTURE DETERMINES ACTIVATION PROBABILITY * □,” Journal of Biological Chemistry, vol. 281, no. 8, pp. 5106 -5119, 2006.
[51] P. Sabbattini, A. Georgiou, C. Sinclair, and N. Dillon, “Analysis of Mice with Single and Multiple Copies of Transgenes Reveals a Novel Arrangement for the 5-V preB1 Locus Control Region,” Society, vol. 19, no. 1, pp. 671-679, 1999.

CHAPTER 6
Supplementary Information

Supplementary Information
- 2 -
6. SUPPLEMENTARY INFORMATION
6.1 Supplementary Methods
6.1.1 DNA/RNA quantification
The concentration of each DNA/RNA preparation was determined by spectrophotometry
using the NanoDrop spectrophotometer (Thermo Scientific). The sample concentration in ng/ul
was calculated based on absorbance at 260 nm. The purity of the nucleic acid preparation was
estimated by the ratio between the readings obtained at 260nm and 280nm (pure preparations
of DNA show ratio values of 1.8 and pure RNA preparations have values closer to 2).
6.1.2 Agarose gel electrophoresis
To separate and estimate the size of DNA fragments, agarose gel electrophoresis was
performed. Gels were prepared by heating until complete dissolution of agarose in 1x TAE
buffer. The final agarose concentration depended on the size of DNA to be resolved and ranged
from 1% to 1.5%. Samples were mixed with loading buffer in a 5:1 proportion and DNA was
visualized under an ultraviolet light at 260nm or 365nm, by the addition of gel red. The size of
the fragments was estimated by comparison with linear DNA strands of known molecular weight
(1kb Plus DNA Ladder – Invitrogen).
6.1.3 Screening PCRs
Primers were designed to amplify specific target sequences (Table S4, Chapter 8). The
reactions were prepared for a final volume of 25µL: 5µL of extracted genomic DNA (section
2.2.5.1) or 5ul of cDNA (section 2.2.4.2), 1x buffer, 0.2mM dCTP, 0.2mM dGTP, 0.2mM dATP,
0.2mM dTTP, 25pmol of each primer and 2.5U of DreamTaq Polymerase. The amplification was
performed with an initial denaturation step at 94ºC for 5min, followed by 30 to 35 cycles of
denaturation at 94ºC for 30sec, annealing at the specific temperature required for the primer set
(Table S4) for 1min, extension at 72ºC for 1min, followed by 10min at 72ºC and 5min at 4ºC.
6.1.4 Bioinformatics
DNA, mRNA and Protein sequences were obtained from the NCBI
(http://www.ncbi.nlm.nih.gov/) and Ensemble (http://www.ensembl.org/index.html) databases.
Primer sequences were designed and analyzed using: Netprimer
(http://www.premierbiosoft.com/netprimer/index.html) and Primer3
(http://frodo.wi.mit.edu/primer3/).

Supplementary Information
- 3 -
6.2 Supplementary Results
Figure S1: EB formation in 46C, HT, Hd and He ES cell lines. (A-D) Bright field images of EBs from the different
cell lines studied, showing normal and typical morphology. (Scale-bar=100µm)
Figure S2: Quality assessment of pTurboCre and pCAGGsPuromycin plasmids. The observed bands correspond to the visualization, in an agarose gel, of the plasmids. (A) pTurboCre plasmid. (B) pCAGGsPuromycin.
Both plasmids were in proper conditions to be electroporated.
Figure S3: PCRs to test for the integration of pTurboCre or pCAGGsPuromycin plasmids into HdB5 and HdB8 cell lines. The PCRs confirmed that neither plasmid integrated into the genome of either clone. For both PCRs
positive controls consisting of plasmids containing the fragments to be amplified were used. In addition, for the PCR to detect the Puromycin resistance gene the 46C cells were used as a positive control since they contain a Puromycin resistance gene inserted into the genome.
Table S1: ES cell growth in Neomycin supplemented media. (+) and (-) represent the ability of cells to grow or not
in Neomycin supplemented media, respectively.
ES clone HdA2 HdA3 HdA8 HdA10 HdA11 HdB1 HdB4 HdB5 HdB7 HdB8 HdB11
Growth - + + + - - + - - - -
6.2.1 LIF test
To test the activity of new batches of LIF, the stemness potential of ES cells was tested in
different conditions. For these studies a modified cell line was used, which expresses an
unstable VNP reporter protein under the control of the Nanog promoter (a readout of the
stemness state in ES cells) (Abranches et al, submitted). These cells can be analyzed by FACS
to determine the percentage of cells expressing the Nanog::VNP reporter, which is typically
around 50% when cells are grown in GMEM supplemented with LIF (data not published). Cells
were plated at different cell densities and with different concentrations of LIF. Relatively to the
cell density, cells were plated at: (i) normal density (3E+04 cells/cm2) to see if LIF is being able
to maintain cells in an undifferentiated state in “normal” passages; and (ii) clonal density (1E+03

Supplementary Information
- 4 -
cells/cm2) to address if LIF is still able to do its function when cells are grown at a lower density
and more dependent on the media. At normal density cells were analyzed during three
passages in terms of morphology, viability, FI and Nanog::VNP expression. At clonal density the
same characteristics were analyzed six days later. Relatively to LIF concentrations, three
different concentrations were tested: the usual concentration 1/500, that corresponds to 2
ng/mL, and the dilutions 1/250 and 1/1000. As controls, cells were plated without LIF [(-) ctrl],
and with 1/500 dilution of the LIF from the previous lot [(+) ctrl]. Analysis of the data showed
that, both at clonal and normal density, the three different LIF concentrations tested are able to
sustain ES cell stemness state, in clear contrast to the negative control condition, where cells
were totally differentiated. Namely, cell morphology, cell viabilities, FI and %Nanog::VNP
positive cells were similar (Figure S6).
Figure S 4: Lif test. (A-J) Cells were analyzed in terms of morphology, (K) viability, (M-N) FI and (L) Nanog::VNP
expression, concluding that the new batch was as effective as the previous one.
Table S2: ES cell lines used in the experiments described in this thesis. ES cells used are listed with the
description and source.
Cell line Description Source
46C Mouse ES cell line derived from the E14Tg2a ES cell line, expressing the reporter protein GFP under the control of the Sox1 promoter
Meng Li (MRC Clinical Sciences Centre, Faculty of Medicine, Imperial College, London, UK) and Austin Smith (Wellcome Trust Centre for Stem Cell Research,

Supplementary Information
- 5 -
Table S3: List of relevant reagents used in the experiments described in this thesis. The reagents are listed
with information relative to suppliers, catalogue numbers and stock solutions.
Table S4: List of relevant solutions used in the experiments described in this thesis. The composition of most
important solutions is listed. The working stock characteristics of the solutions are listed in Table3.
University of Cambridge, Cambridge UK)
HT Mouse ES cell line derived from the E14Tg2a ES cell line, engineered by the insertion of a BAC vector, expressing the reporter protein GFP under the control of the Hes5 promoter
Mark Tomishima (Sloan-Kettering Institute, Rockefeller University, New York, USA).
Ha, Hc, Hd, He
Mouse ES cell lines derived from the E14Tg2a ES cell line, engineered by the insertion of a BAC vector, expressing the unstable reporter protein VNP under the control of the Hes5 promoter
Cell lines engineered in the Laboratory
HdB5, HdB8
Mouse ES cell lines derived from the Hd ES cell line, expressing the unstable reporter protein VNP under the control of the Hes5 promoter
Cell lines engineered in the Laboratory
Nd Mouse ES cell line derived from the E14Tg2a ES cell line, expressing the reporter protein VNP under the control of the Nanog promoter
Cell lines engineered in the Laboratory
Reagent Supplier Cat. Number Stock Working Stock
2-mercaptoethanol Sigma M-7522 RT 0.1 M in H20, 4ºC
DAPI Sigma 1 mg/ml in PBS, -20ºC
1.5 μg/ml in PBS, 4ºC
DMSO Sigma D-2650 RT
Dream Taq Fermentas -20ºC -20ºC ESGRO COMPLETE PLUS Millipore Inc. SF001-100P -20ºC 4ºC Fast Red Roche 1149644900 -20ºC FBS ES-qualified Invitrogen 10439-024 -20ºC Heat-inactivate, -20ºC Gel red Biotium 41603-01 10000X, RT 500X
Gelatin 2%
Sigma
G-1393 4ºC 0.1% in PBS, 4ºC
Glutamine GIBCO 25030-123 200mM 100x, -20ºC Glycine Sigma G-7403 RT GMEM GIBCO 21710-025 1x, 4ºC Laminin Sigma L-2020 -20ºC -20ºC Mowiol Calbiochem murine bFGF Prepotech 100-18B -20ºC 4ºC Non-essential Aminoacids GIBCO 11140-035 100x, 4ºC PDL Sigma P-7280 -20ºC -20ºC
Pen-Strep
GIBCO 15140-122 100x, -20ºC
Propidium Iodide Invitrogen P-3566 1mg/mL, 4ºC 1ng/mL, 4ºC
RHB-A StemCell Science
Inc SCS-SF-NB-
01 -20ºC 4ºC
rTaq Polymerase GE Healthcare 27-0798-05 -20ºC -20ºC SeaKem LE Agarose Lonza Sodium Pyruvate GIBCO 11360-039 100mM 100x, -20ºC SuperScript II Reverse Transcriptase
Invitrogen 18064-014 -20ºC -20ºC
Trypsin GIBCO 25090-028 2.5% (v/v),
-20ºC 0,25% or 0.025% in
PBS,-20ºC/4ºC Cyclohexamide Sigma C-4859 4ºC 100mg/mL, 4ºC
Solutions Components

Supplementary Information
- 6 -
Table S5: Oligonucleotide primers that were used in the experiments described in this thesis. The primers are
listed with the respective sequences, annealing temperature, size of the amplified product and other observations (primers were provided by Sigma Genosys or Frilabo).
Table S6: Antibodies used in the experiments described in this thesis. Antibody dilution, animal in which it was
raised and origin are listed.
1x TAE Buffer 40mM Tris; 1mM EDTA; 0.35% glacial acetic acid Blocking solution 10% (w/v) FBS; TBST FACS Buffer 4% (v/v) FBS; PBS Gelatin 0.1% 2% gelatin; PBS GMEM 1x 80% (v/v) GMEM; 1% (v/v) Glutamine; 1% (v/v) Pen-Strep; 1% (v/v) Sodium
Pyruvate; 1% (v/v) non-essential Aminoacids; 10% (v/v) FBS; 0,001% (v/v) of 2-mercaptoethanol
Loading buffer 60% (v/v) Glycerol ; 10mM EDTA; 0.2% OrangeG Mowiol mounting medium 0.1% Mowiol; 33% glycerol; 0.1M Tris, pH 8.5; SNET 20mM Tris-HCl pH 8; 5mM EDTA pH 8; 0.4M NaCl; 1% (w/v) SDS Solution A 10mM Tris-HCl pH 8.3 ; KCl 100mM ; MgCl2 2.5mM Solution B 10mM Tris-HCl pH 8.3; MgCl2 2.5mM; 1% (v/v) Tween20; 1% (v/v)
TritonX100; 120µg/mL proteinase K TBST for FISH 150mM NaCl; 0.1%Tween-20; 10mM KCl; 50mM Tris pH 7.5 TBST for Immunocytochemistry 20mM Tris-HCl pH 8; 150mM NaCl; 0.05% Tween-20 TE 10mM Tris; 1mM EDTA pH=8; Trypsin 0.025% 0.25% Trypsin; PBS Trypsin 0.25% 2,5% (v/v) Trypsin; 0.01% (v/v) chicken serum; 0.02% (v/v) 0.5M EDTA; PBS Wash buffer 10mM Tris-HCl pH 8.3 ; KCl 50mM ; MgCl2 1.5mM
Marker Sense primer 5’ to 3’
Anti-sense primer 5’ to 3’
Annealing T. (ºC)
Product size (bp)
Obs
Cre GCATAACCAGTGAAACAGCATTGCTG
GGACATGTTCAGGGATCGCCAGGCG
61 270
GAPDH ATTCAACGGCACAGTCAAGG
TGGATGCAGGGATGATGTTC
60 580
Hes5 promoter TCCTCTGGAAGTCGCTGTCT
AGATCAGCTTCAGGGTCAGC
60 676
5% formamide
Mycoplasma TGCACCATCTGTCACTCTGTTAACCTC
ACTCCTACGGGAGGCAGCAGTA
58 717
Neomycin TGAATGAACTGCAGGACGAG
AATATCACGGGTAGCCAACG
56 515
Puromycin GTCACCGAGCTGCAAGAACT
GCTCGTAGAAGGGGAGGTTG
56 382
Screenning TGGTCCTGCTGGAGTTCGT
TTAAGGATCATCGTGGAGACC
65 767
Venus ATGGTGAGCAAGGGCGAGG
CTTGTACAGCTCGTCCATGCCG
55 720
Antibody anti- Dilution Animal Origin
GFP 1:500 Mouse Abcam #ab1218
GFP 1:400 Rabbit Abcam #ab290
N-cadherin 1:200 Mouse BD Transduction Lab. #610920
Sox2 1:200 Rabbit Chemicon #ab5603
Tuj1 1:500 Mouse Covance # MMS-435P