Embed Size (px)
Citation preview

1
Universidad Autónoma de San Luis Potosí
Detection Conditioning and
Processing of Acoustic Wave Signals
in Human Tissue for Wearable
Computer Applications. Héctor Raúl Moncada González, M. E. E. José Luis Tecpanecatl Xihuitl, Ph. D.
Carlos Adrián Gutiérrez Díaz de León, Ph. D.
Introduction The miniaturization of ultra-low power microcontroller, sensors and actuators have
enabled a new era of computing. Devices embedded into everyday objects that can adapt to a
person needs, time or context of use. These devices known as wearable devices have been
attracting several companies such as Apple, Samsung and Google. Indeed, the wearable devices
market is growing and some analysts estimate that by 2018 it will reach anywhere from $30Bn
to $50Bn in revenues [1]. Thus, the development of wearable related technologies is in demand
nowadays. Hence, novel human interface and device-to-device networking technologies are
crucial for the development of the upcoming wearable devices and applications.
Incidentally, wearable devices take advantage of one or several sensors. Some of these
sensors are cameras, accelerometers, and gyroscopes. Alternatively, acoustic transducers offer
advantages like no need for voltage supply to sense or act, small size and low price. However,
application of acoustic transducers for wearable devices has not been explored thoroughly
specially in the gesture recognition field in which the purpose is to identify gestures (hand and
fingers movements) to relate them with commands to control a system.
In this regard, beyond their use in medical imaging and diagnostics, acoustic waves have
been recently proposed for different applications related to wearable computers and human-
machine interaction. The applications include user input detection, user’s feedback and body-
centric communications.
Proposal
The proposal consist in a gesture recognition system. The prototype is a wristband with six
piezoelectric sensors connected to an audio amplifier. This amplifier is connected to a computer
in which all signals are recorded, henceforth each signal is called intrabody acoustic wave signal
(IAWS).

2
Figure 1 shows the sensors position, from sensor three to sensor five, on wrist in the hand
palm side. Figure 2 shows sensors position, sensors one, two, and six, on wrist in back palm
side. A database with 18 participants was created, each participant made 30 repetitions of 22
different gestures. The users are uniformly distributed in age and gender.
Figure 1. Sensors in wrist for palm side Figure 2. Sensors in wrist for back palm side.
Previous report
In previous report, preprocessing stage, feature extraction process and results from
gestures classification were described. Figure 3 shows a block diagram containing these stages.
Figure 3. Complete process block diagram.
Because of the results from classifiers (50% of accuracy) with previous features, conclusions
were:
- Utilize features related with audio processing.
- Use information from five sensors instead of use information from three sensors.
- Reduce the set of gestures.
All recommendations were followed.

3
Progress
Feature extraction process.
In pattern recognition field, a feature is a characteristic that can uniquely identify a pattern,
such as power energy of a signal. Feature extraction process corresponds to the stage in which
informative and no redundant features are selected facilitating the subsequent machine
learning. Patterns are formed with a series of features, the good selection of these features is
critical to obtain acceptable results in classification stage.
There are several papers that introduce an analysis on classification of acoustic signals. Subramanian use several features to classify audio signal, while Chmulik and Jarina [3] took a bio-inspired generic sound recognition. Both works used Spectral Flux, and Spectral Centroid as a classification feature. Subramanian [2]suggested to analyze the signal using time windows of N samples. That suggestion is follow in the present work using 34ms windows.
Spectral Flux is the tone quality in a musical note. It measures how fast is changing the power
spectrum in audio signal. In order to calculate the Spectral Flux, the signal is divided in 30 windows with 34 ms long, then, power spectral is obtained from all windows, the current window is compared with the previous window using the Euclidian distance [5]. Expression for Spectral Flux [2] is:
𝑆𝐹(𝑟) = ∑(|𝑓𝑓𝑡(𝑦(𝑟))| − |𝑓𝑓𝑡(𝑦(𝑟 − 1))|)
𝑁
𝑛=1
2
( 1
where r is current window , y(r) is the IAWS in the actual window, y(r-1) is the IAWS from previous window, N is the number of samples in each window, fft transforms from time domain to frequency domain.
Spectral centroid [2] determines the center of the spectrum of a signal and is commonly associated with the brightness of a sound. This measure is obtained by evaluating the “center of gravity” using the Fourier transform’s frequency and magnitude information.
𝑆𝐶(𝑟) =∑ 𝑓𝑟[𝑛] ∗ |𝑌𝑓𝑟[𝑛]|𝑁
𝑛=1
∑ |𝑌𝑓𝑟[𝑛]|𝑁𝑛=1
( 2
where r is the actual window , N is the window length, fr[n] is the frequency value at sample n,
Yfr(n) corresponds to the FFT coefficient value in sample n.

4
In similar way Jalil [4]et al. proposes Short Time Energy, as a method for separate voiced
and unvoiced segments of speech signals. Short Time Energy is the energy of short speech
segment calculated by windows. Energy signal in time domain [4][7] is defined as:
𝐸(𝑟) = ∑ |𝑦𝑟(𝑛)|2
𝑁
𝑛=1
( 3
where yr is the actual window from signal under study, and N is the number of samples in
window n is the current sample.
The features selected for this application include the spectral flux, short time energy and
spectral centroid. The signals where analyze by windows of 34ms. The maximum value of each
feature is recorded into a feature vector. Additionally, the sum of each feature over the 30
windows is used as a component of the vector feature as shown in Figure 4. The maximum is
used to weight the maximum contribution of each window, while the sum is used to consider
all the variations.
Figure 4. Pattern from one sensor, formed with six features.
Classification experiments in this work includes patterns formed with five sensors (30
features) and patterns formed with three sensors (18 features). A total of 2700 patterns
distributed in five classes are used, 50% for training and 50% for test.
Reducing number of classes.
Original set of gestures in database contains 22 classes. This 22 classes are grouped in four
categories: “Flick”, “Taps”, “Various” and “Drags”. The objective is use these gestures as
commands to control smartphones, tv, computers, light lamps, or any object related with a
smart house. Adding the idea that 22 gestures are excessive, the most representative gestures
were selected.
Previous results suggest that gestures in same categories have similar features, except in
“Various” category, in conclusion: “Various” category must be separate in different classes. A
5
new set of six gestures are proposed. Gestures selected from “Various” category are: snap, clap,
flex, click, open, and close. After several classification experiments the conclusion obtained was
that open and close gestures have similar behavior with the features proposed. Hence gestures
open and close were eliminated. Additional experiments show that gesture “index tap” obtains
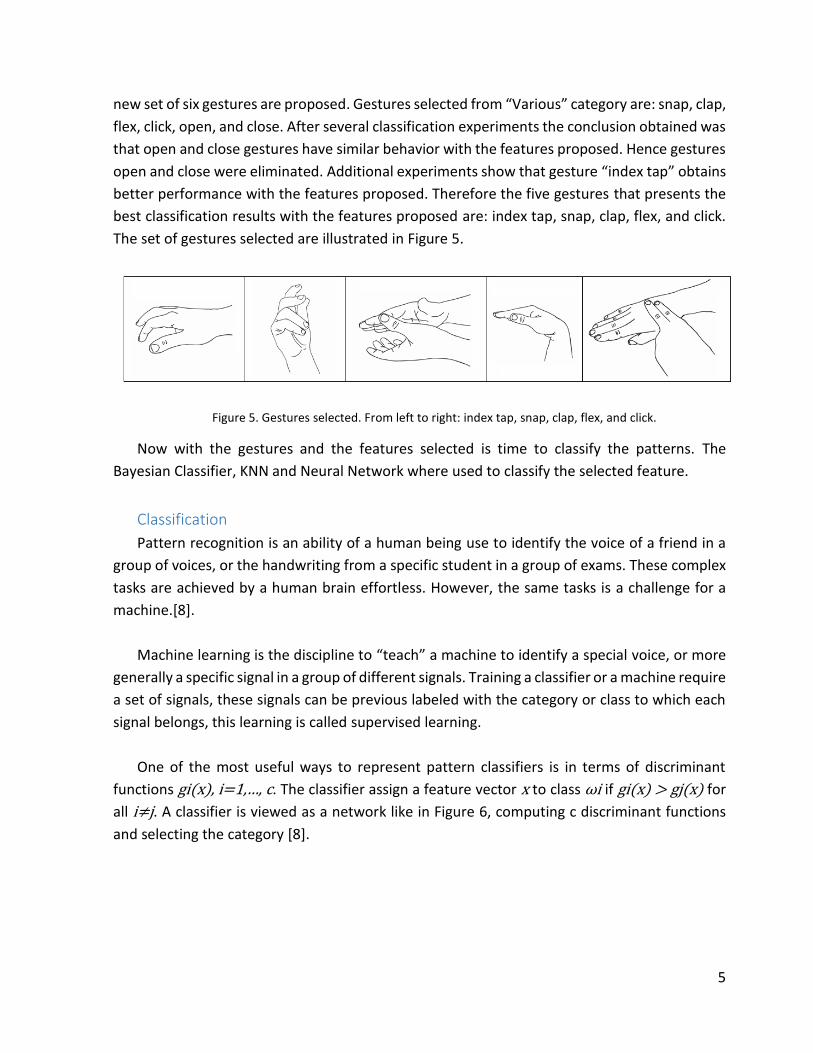
better performance with the features proposed. Therefore the five gestures that presents the
best classification results with the features proposed are: index tap, snap, clap, flex, and click.
The set of gestures selected are illustrated in Figure 5.
Figure 5. Gestures selected. From left to right: index tap, snap, clap, flex, and click.
Now with the gestures and the features selected is time to classify the patterns. The
Bayesian Classifier, KNN and Neural Network where used to classify the selected feature.
Classification
Pattern recognition is an ability of a human being use to identify the voice of a friend in a
group of voices, or the handwriting from a specific student in a group of exams. These complex
tasks are achieved by a human brain effortless. However, the same tasks is a challenge for a
machine.[8].
Machine learning is the discipline to “teach” a machine to identify a special voice, or more
generally a specific signal in a group of different signals. Training a classifier or a machine require
a set of signals, these signals can be previous labeled with the category or class to which each
signal belongs, this learning is called supervised learning.
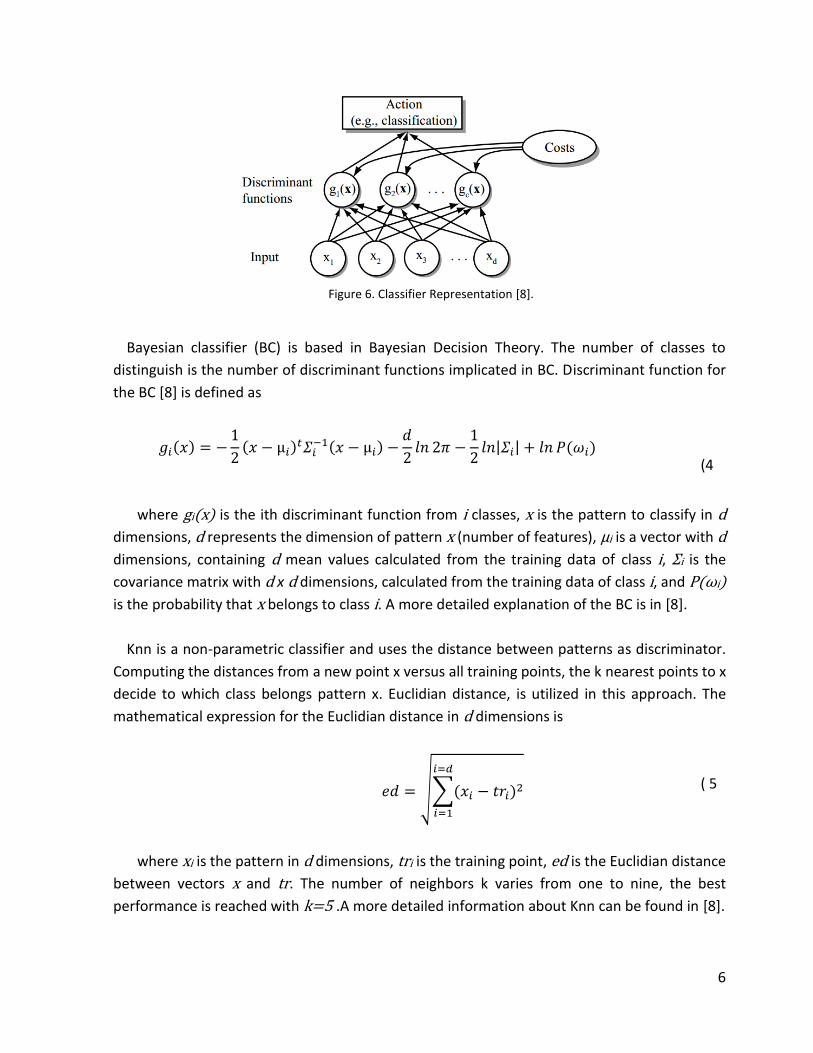
One of the most useful ways to represent pattern classifiers is in terms of discriminant
functions gi(x), i=1,…, c. The classifier assign a feature vector x to class ωi if gi(x) > gj(x) for
all i≠j. A classifier is viewed as a network like in Figure 6, computing c discriminant functions
and selecting the category [8].
6
Figure 6. Classifier Representation [8].
Bayesian classifier (BC) is based in Bayesian Decision Theory. The number of classes to
distinguish is the number of discriminant functions implicated in BC. Discriminant function for
the BC [8] is defined as
𝑔𝑖(𝑥) = −1
2(𝑥 − µ𝑖)
𝑡𝛴𝑖−1(𝑥 − µ𝑖) −
𝑑
2𝑙𝑛 2𝜋 −
1
2𝑙𝑛|𝛴𝑖| + 𝑙𝑛 𝑃(𝜔𝑖)
(4
where gi(x) is the ith discriminant function from i classes, x is the pattern to classify in d
dimensions, d represents the dimension of pattern x (number of features), µi is a vector with d
dimensions, containing d mean values calculated from the training data of class i, Σi is the
covariance matrix with d x d dimensions, calculated from the training data of class i, and P(ωi)
is the probability that x belongs to class i. A more detailed explanation of the BC is in [8].
Knn is a non-parametric classifier and uses the distance between patterns as discriminator.
Computing the distances from a new point x versus all training points, the k nearest points to x
decide to which class belongs pattern x. Euclidian distance, is utilized in this approach. The
mathematical expression for the Euclidian distance in d dimensions is
𝑒𝑑 = √∑(𝑥𝑖 − 𝑡𝑟𝑖)2
𝑖=𝑑
𝑖=1
( 5
where xi is the pattern in d dimensions, tri is the training point, ed is the Euclidian distance
between vectors x and tr. The number of neighbors k varies from one to nine, the best
performance is reached with k=5 .A more detailed information about Knn can be found in [8].
7
Artificial neural networks are generally presented as systems of interconnected “neurons”
which exchange messages between each other. The connections have numeric weights that can
be tuned based on experience, making neural nets adaptive to inputs and capable of learning.
Artificial Neural Networks (NN) is a non-parametric technique and its learning is supervised.
Using nprtool (Neural Pattern Recognition Tool) from Matlab toolbox an NN was implemented.
The number of used Neurons is 100, first layer contains 30 neurons, last layer contains 5
neurons, rest of the neurons are in internal layers. Architecture used is backpropagation. In [8]
exists a detailed section about NN.
Results
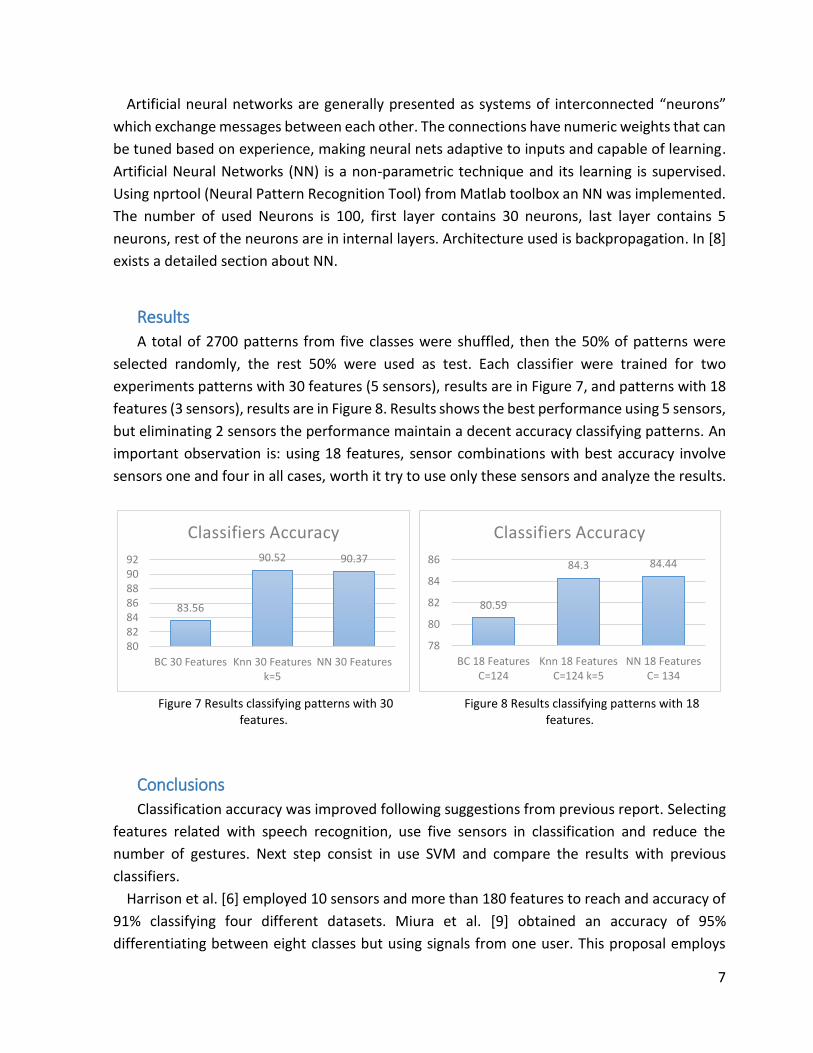
A total of 2700 patterns from five classes were shuffled, then the 50% of patterns were
selected randomly, the rest 50% were used as test. Each classifier were trained for two
experiments patterns with 30 features (5 sensors), results are in Figure 7, and patterns with 18
features (3 sensors), results are in Figure 8. Results shows the best performance using 5 sensors,
but eliminating 2 sensors the performance maintain a decent accuracy classifying patterns. An
important observation is: using 18 features, sensor combinations with best accuracy involve
sensors one and four in all cases, worth it try to use only these sensors and analyze the results.
Figure 7 Results classifying patterns with 30
features. Figure 8 Results classifying patterns with 18
features.
Conclusions
Classification accuracy was improved following suggestions from previous report. Selecting
features related with speech recognition, use five sensors in classification and reduce the
number of gestures. Next step consist in use SVM and compare the results with previous
classifiers.
Harrison et al. [6] employed 10 sensors and more than 180 features to reach and accuracy of
91% classifying four different datasets. Miura et al. [9] obtained an accuracy of 95%
differentiating between eight classes but using signals from one user. This proposal employs
83.56
90.52 90.37
80828486889092
BC 30 Features Knn 30 Featuresk=5
NN 30 Features
Classifiers Accuracy
80.59
84.3 84.44
78
80
82
84
86
BC 18 FeaturesC=124
Knn 18 FeaturesC=124 k=5
NN 18 FeaturesC= 134
Classifiers Accuracy

8
five sensors and 30 features, reaching an accuracy of 90.52% separating signals from five
different classes. Additionally, data from 18 users is used, supporting the hypothesis that
classification is independent from the user.
Calendar activities
Activity 2016
Jan Feb Mar Apr May June July Aug Sept Oct Nov Dec
Literature Review
Statistical analysis of the
different patterns for
gesture recognition.
Course. “Oral expression”
Study of SVM for pattern
classification towards
gesture recognition
Course “Optimization”
Course Seminar III
Study of the
implementation platform
Writing a Conference
paper
Start preparing a journal
paper

9
References
[1] Shane Walker. Associate Director, Medical Devices & Healthcare IT. IHS Electronics & Media. “Wearable Technology – Market Assessment.” An HIS Whitepaper. September 2013.
[2] Subramanian, H. (2004, November). Audio signal classification. Credit Seminar Report on M. Tech (pp. 1-16).
[3] Chmulik, M., & Jarina, R. (2012, April). Bio-inspired optimization of acoustic features
for generic sound recognition. 19th International Conference on Systems, Signals
and Image Processing (IWSSIP), 2012 (pp. 629-632). IEEE.
[4] Jalil, M., Butt, F. A., & Malik, A. (2013, May). Short-time energy, magnitude, zero
crossing rate and autocorrelation measurement for discriminating voiced and
unvoiced segments of speech signals. International Conference on Technological
Advances in Electrical, Electronics and Computer Engineering (TAEECE), 2013 (pp.
208-212). IEEE.
[5] Giannoulis, D., Massberg, M., & Reiss, J. D. (2013). Parameter automation in a
dynamic range compressor. Journal of the Audio Engineering Society, 61(10), 716 -
726.
[6] Harrison, C., Tan, D., & Morris, D. (2011). Skinput: appropriating the skin as an
interactive canvas. Communications of the ACM, 54(8), 111-118.
[7] Mitra, S. K., & Kuo, Y. (2006). Digital signal processing: a computer-based approach
(Vol. 2). New York: McGraw-Hill.
[8] Duda, R. O., Hart, P. E., & Stork, D. G. (2012). Pattern classification. John Wiley & Sons.
[9] Miura, K., Jiang, S., Hada, Y., & Okabayashi, K. (2015, July). Recognition of hand action using body-conducted sounds. 54th Annual Conference of the Society of Instrument and Control Engineers of Japan (SICE), 2015 (pp. 246-251). IEEE.

![[PPT]Modified Booth Multiplier - Universidad Autónoma de …galia.fc.uaslp.mx/~rmariela/digital/ModifiedBooth.ppt · Web viewTitle Modified Booth Multiplier Author Dr. José Martin](https://img.pdfslide.us/doc/110x75/5b327a3d7f8b9aae458bff5a/pptmodified-booth-multiplier-universidad-autonoma-de-galiafcuaslpmxrmarieladigital.jpg)