Embed Size (px)
Citation preview
Univariate and Multivariate Univariate and Multivariate Characterization of Equity Characterization of Equity
VolatilityVolatilitySalvatore MiccichèSalvatore Miccichè
with
Fabrizio Lillo, Rosario N. MantegnaFabrizio Lillo, Rosario N. Mantegna
http://lagash.dft.unipa.ithttp://lagash.dft.unipa.it
Observatory of Complex Observatory of Complex SystemsSystems
INFM - Istituto Nazionale INFM - Istituto Nazionale per laper la Fisica Fisica delladella Materia - Unità di Materia - Unità di PalermoPalermo
Univariate and Multivariate Characterization of Equity VolatilityUnivariate and Multivariate Characterization of Equity Volatility
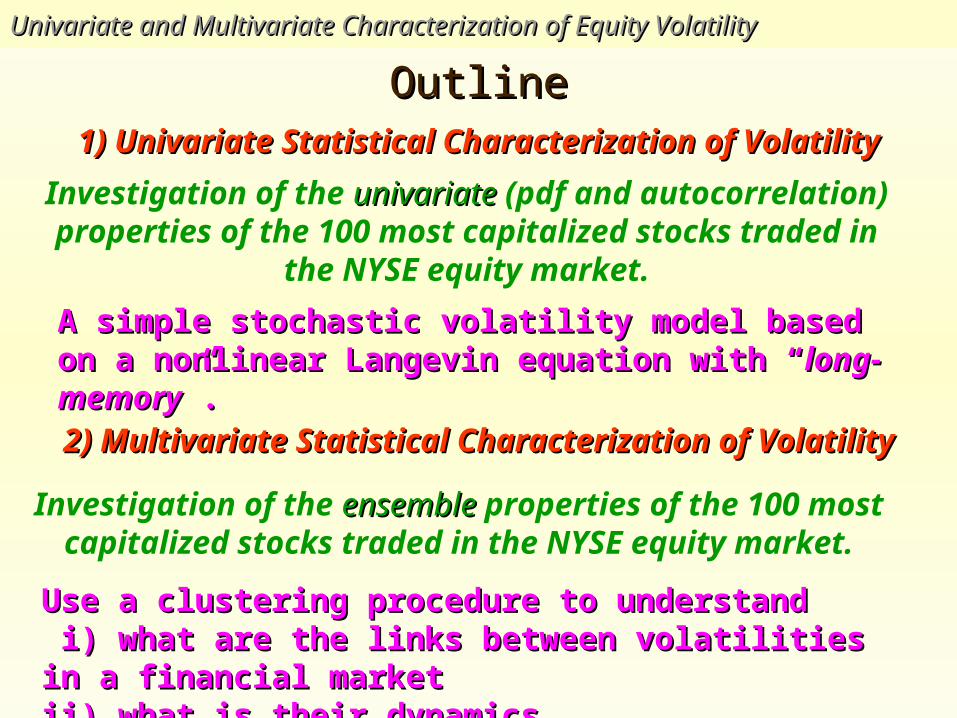
1) Univariate Statistical Characterization of 1) Univariate Statistical Characterization of VolatilityVolatility
Investigation of the ensembleensemble properties of the 100 most capitalized stocks traded in the NYSE equity market.
Use a clustering procedure to understand Use a clustering procedure to understand i) what are the links between volatilities in a financial marketi) what are the links between volatilities in a financial marketii) what is their dynamicsii) what is their dynamics
OutlineOutline
2) Multivariate Statistical Characterization of 2) Multivariate Statistical Characterization of VolatilityVolatility
Investigation of the univariateunivariate (pdf and autocorrelation) properties of the 100 most capitalized stocks traded in the NYSE
equity market.
A simple stochastic volatility model based on a nonlinear A simple stochastic volatility model based on a nonlinear Langevin equation with “Langevin equation with “long-memorylong-memory”.”.
Univariate and Multivariate Characterization of Equity VolatilityUnivariate and Multivariate Characterization of Equity Volatility
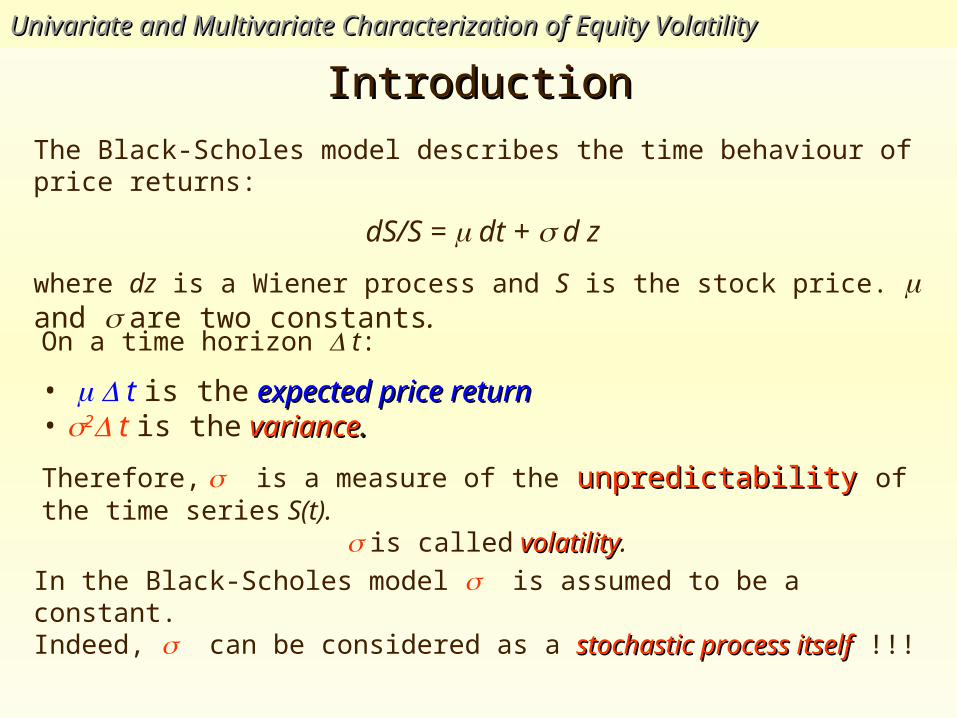
The Black-Scholes model describes the time behaviour of price returns:
dS/S = dt + d z
where dz is a Wiener process and S is the stock price. and are two constants.
On a time horizon t:
• t is the expected price returnexpected price return • 2 t is the variancevariance. .
Therefore, is a measure of the unpredictabilityunpredictability of the time series S(t). is called volatilityvolatility.
In the Black-Scholes model is assumed to be a constant. Indeed, can be considered as a stochastic process itselfstochastic process itself !!!
IntroductionIntroduction
Univariate and Multivariate Characterization of Equity VolatilityUnivariate and Multivariate Characterization of Equity Volatility
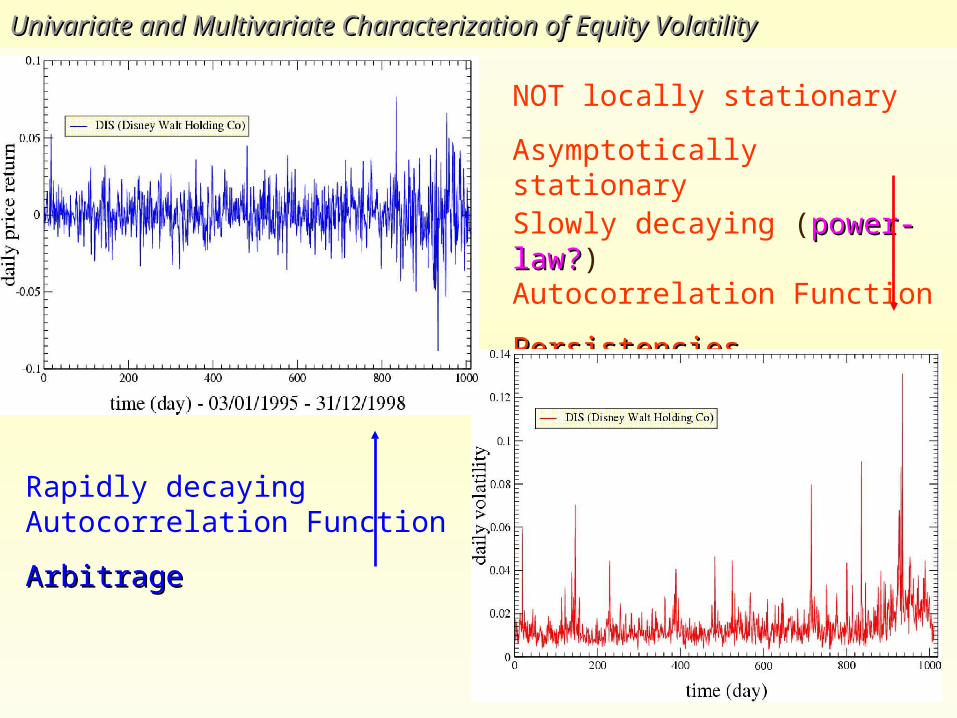
NOT locally stationary
Asymptotically stationary
Slowly decaying (power-law?power-law?) Autocorrelation Function
PersistenciesPersistencies
Rapidly decaying Autocorrelation Function
ArbitrageArbitrage
Univariate and Multivariate Characterization of Equity VolatilityUnivariate and Multivariate Characterization of Equity Volatility
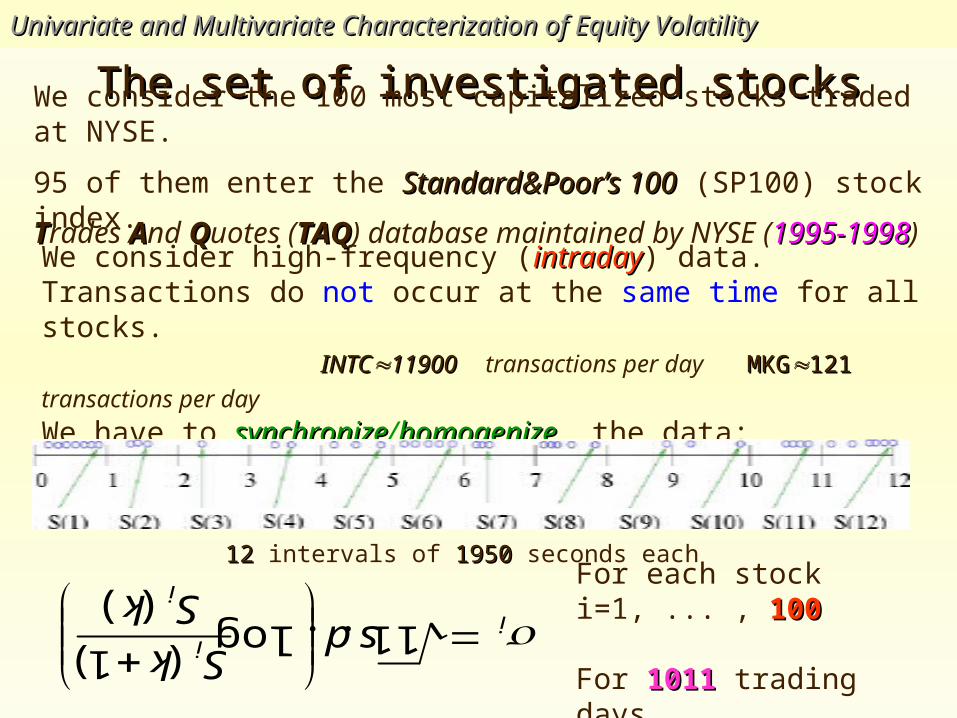
The set of investigated stocksThe set of investigated stocksWe consider the 100 most capitalized stocks traded at NYSE.
95 of them enter the Standard&Poor’s 100Standard&Poor’s 100 (SP100) stock index.
We consider high-frequency (intradayintraday) data. Transactions do not occur at the same time for all stocks. INTCINTC1190011900 transactions per day MKGMKG121 121 transactions per day We have to synchronizesynchronize/homogenizehomogenize the data:
) (
)1 (log . . 11
k S
k Sds
i
ii For each stock i=1, ... , 100100
For 10111011 trading days
1212 intervals of 19501950 seconds each
TTrades AAnd QQuotes (TAQTAQ) database maintained by NYSE (1995-19981995-1998)
UnivariateUnivariate
Univariate and Multivariate Characterization of Equity VolatilityUnivariate and Multivariate Characterization of Equity Volatility
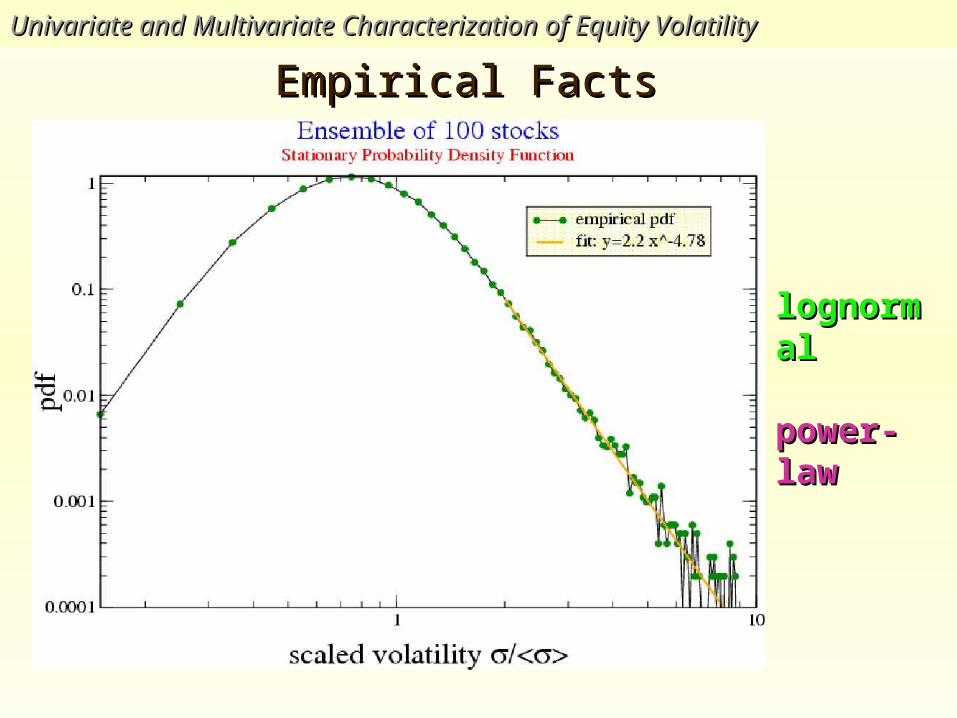
Empirical FactsEmpirical Facts Univariate and Multivariate Characterization of Equity VolatilityUnivariate and Multivariate Characterization of Equity Volatility
lognormallognormal
power-lawpower-law
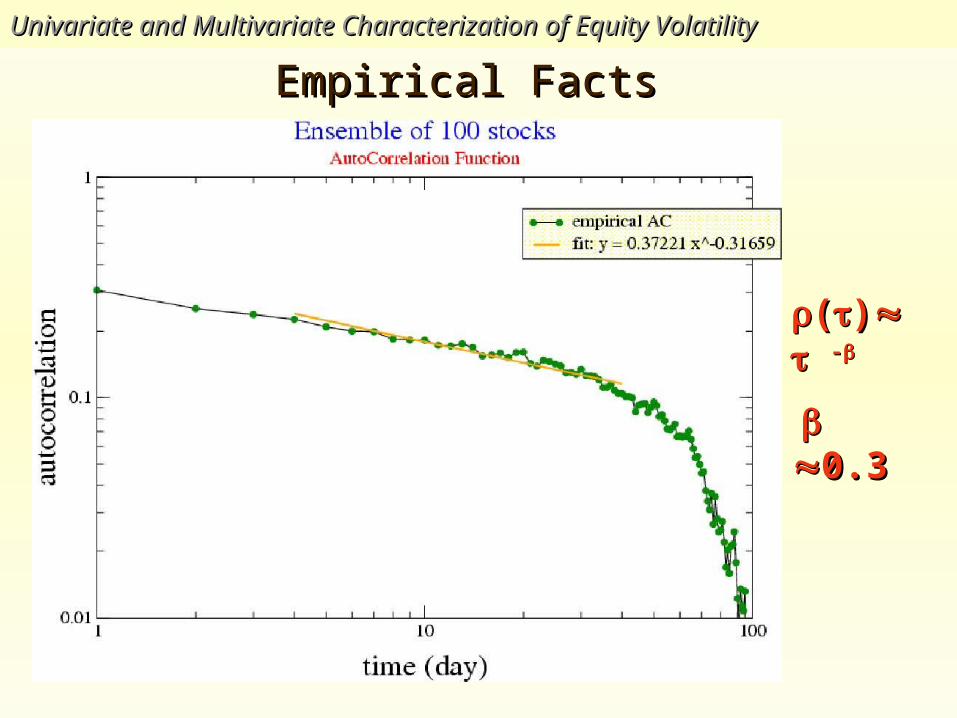
Empirical Facts Empirical Facts Univariate and Multivariate Characterization of Equity VolatilityUnivariate and Multivariate Characterization of Equity Volatility
(()) --
0.30.3
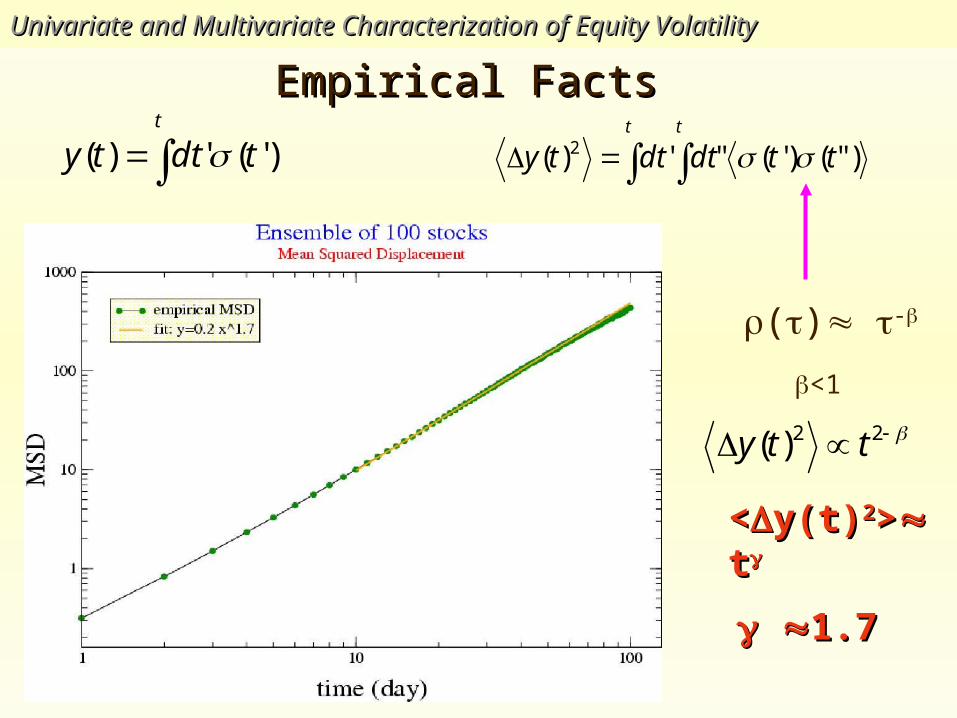
Empirical Facts Empirical Facts Univariate and Multivariate Characterization of Equity VolatilityUnivariate and Multivariate Characterization of Equity Volatility
<<y(t)y(t)22>> t t
1.71.7
() -
<1
t
tdtty )'(')( t t
ttdtdtty )"()'("')( 2
22)( tty
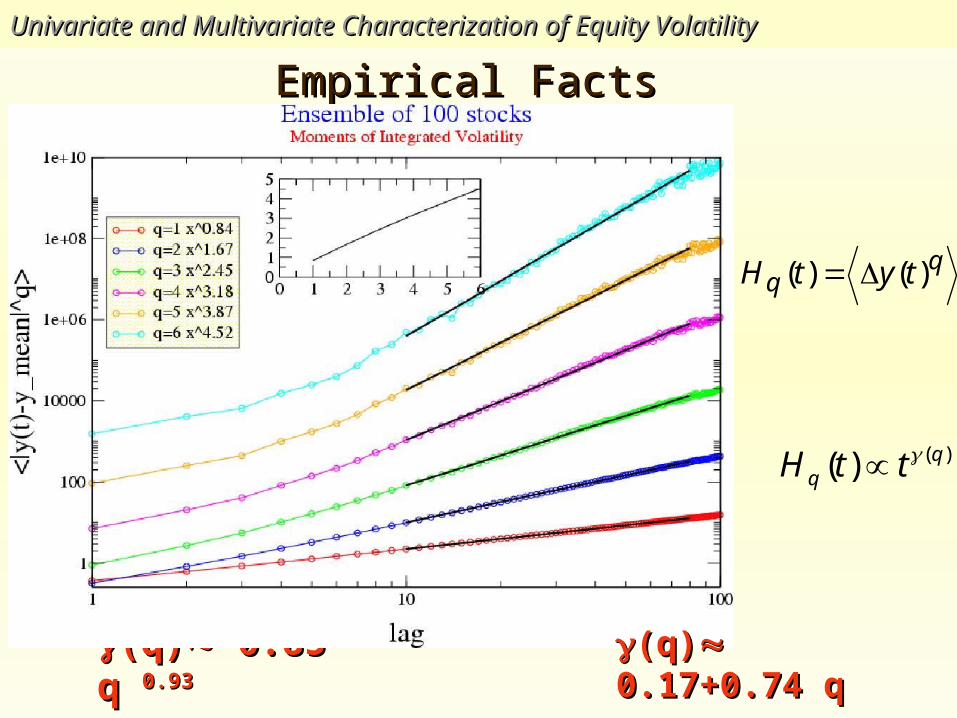
Empirical Facts Empirical Facts Univariate and Multivariate Characterization of Equity VolatilityUnivariate and Multivariate Characterization of Equity Volatility
(q)(q) 0.85 q 0.85 q 0.930.93
qq tytH )()(
)()( qq ttH
(q)(q) 0.17+0.74 0.17+0.74 qq
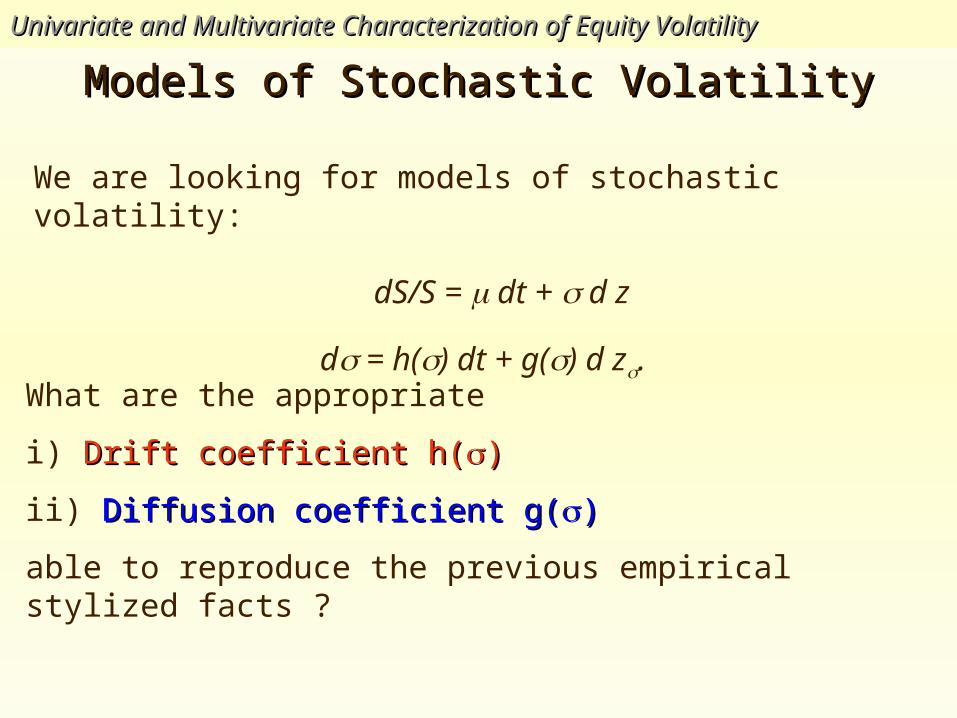
Models of Stochastic VolatilityModels of Stochastic VolatilityUnivariate and Multivariate Characterization of Equity VolatilityUnivariate and Multivariate Characterization of Equity Volatility
What are the appropriate
i) Drift coefficient h(Drift coefficient h())
ii) Diffusion coefficient g(Diffusion coefficient g())
able to reproduce the previous empirical stylized facts ?
We are looking for models of stochastic volatility:
dS/S = dt + d z
d = h() dt + g() d z.
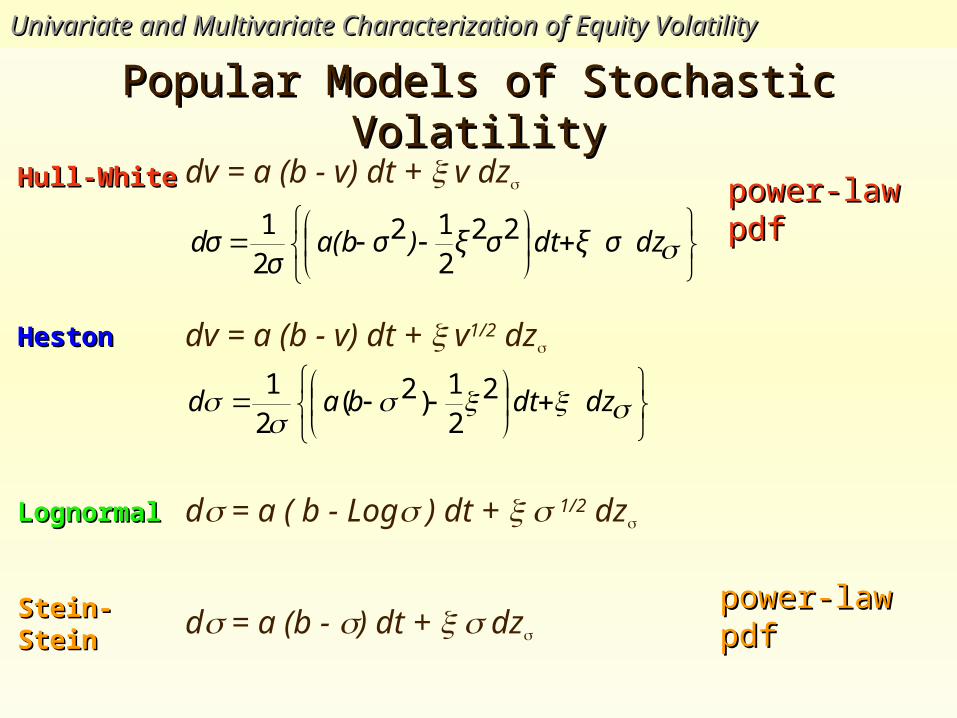
Popular Models of Stochastic VolatilityPopular Models of Stochastic VolatilityUnivariate and Multivariate Characterization of Equity VolatilityUnivariate and Multivariate Characterization of Equity Volatility
Hull-WhiteHull-White dv = a (b - v) dt + v dz
HestonHeston
LognormalLognormal
Stein-Stein-SteinStein
dv = a (b - v) dt + v1/2 dz
d = a ( b - Log ) dt + 1/2 dz
d = a (b - ) dt + dz
dzσξdtσξ)σa(b
σdσ 22
212
21
dzdtbad 2
21
)2(21
power-law power-law pdfpdf
power-law power-law pdfpdf
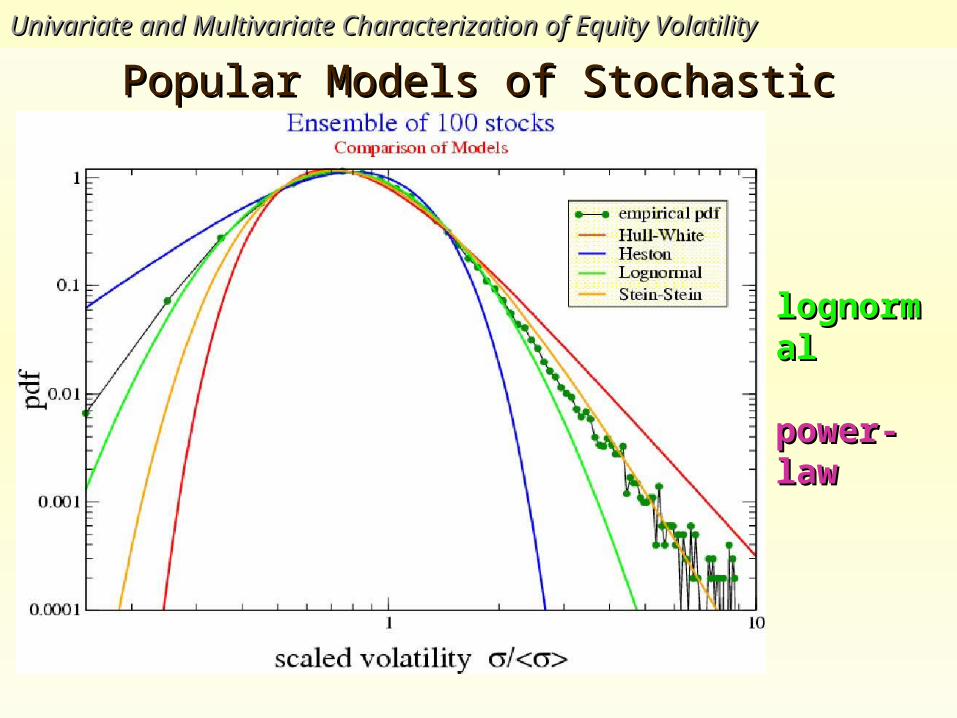
Popular Models of Stochastic VolatilityPopular Models of Stochastic VolatilityUnivariate and Multivariate Characterization of Equity VolatilityUnivariate and Multivariate Characterization of Equity Volatility
lognormallognormal
power-lawpower-law
Univariate and Multivariate Characterization of Equity VolatilityUnivariate and Multivariate Characterization of Equity Volatility
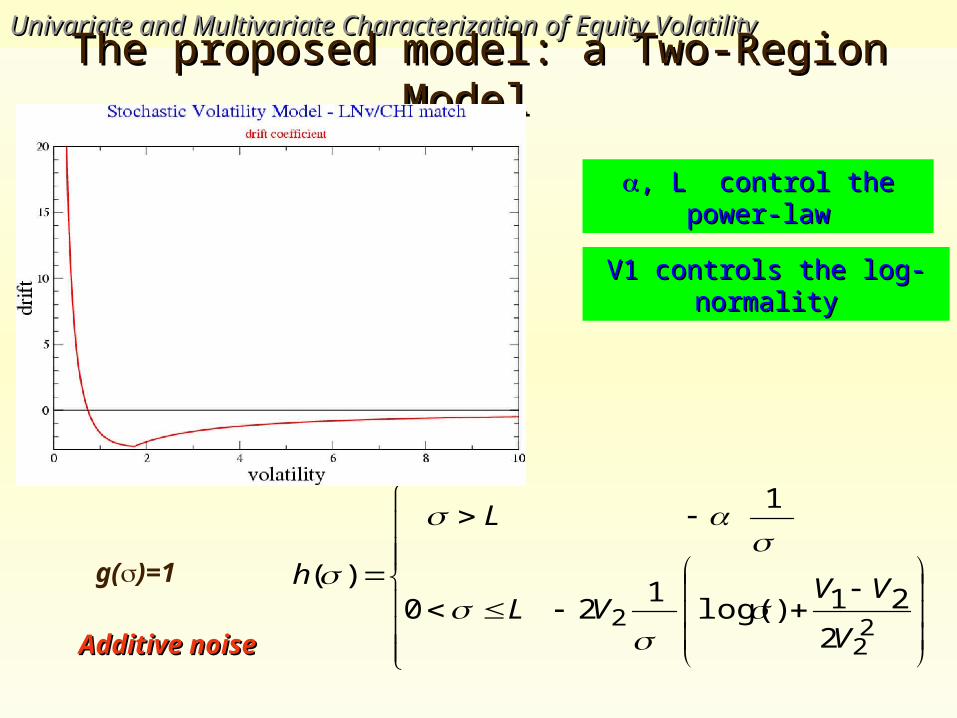
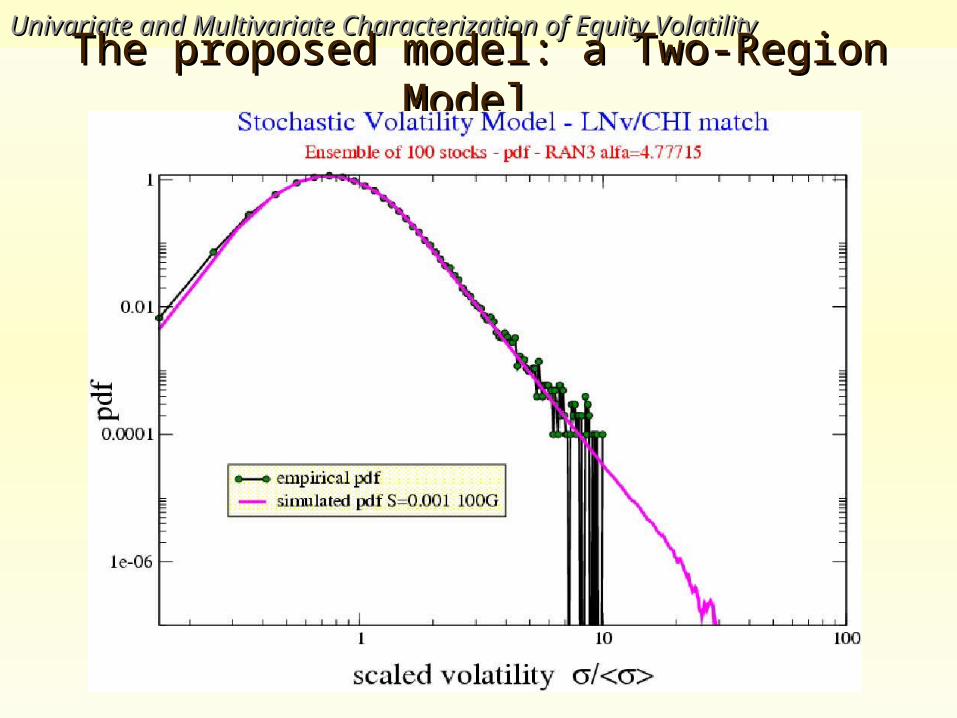
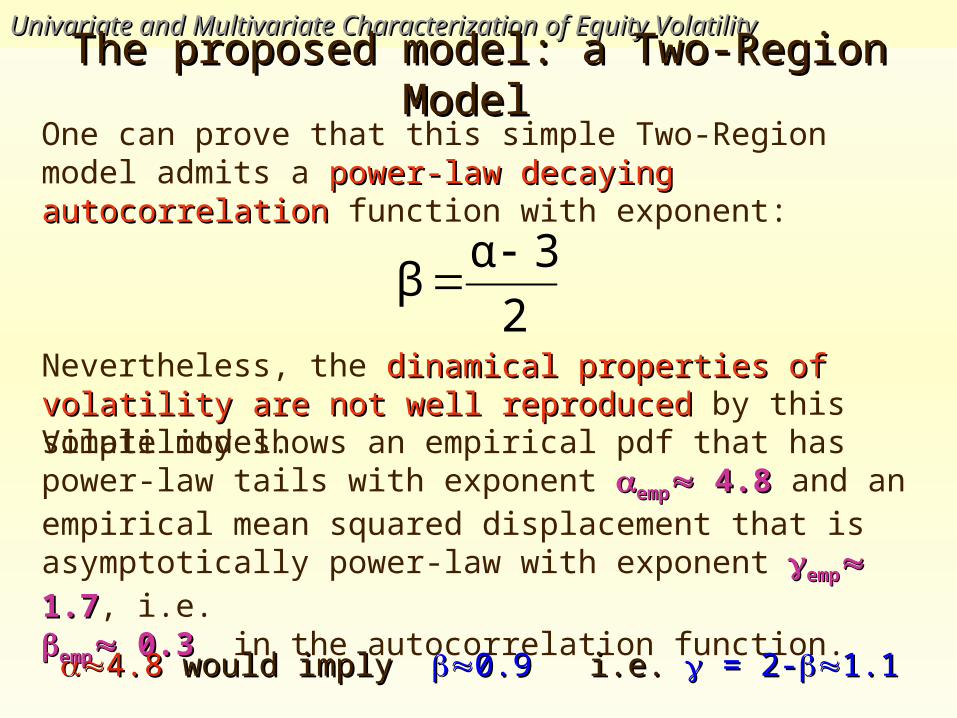
The proposed model: a Two-Region Model The proposed model: a Two-Region Model
22
22
21)log(1
20
1
)(
V
VVVL
L
h
g()=1
Additive noiseAdditive noise
, L control the power-, L control the power-lawlaw
V1 controls the log-V1 controls the log-normalitynormality
Univariate and Multivariate Characterization of Equity VolatilityUnivariate and Multivariate Characterization of Equity Volatility
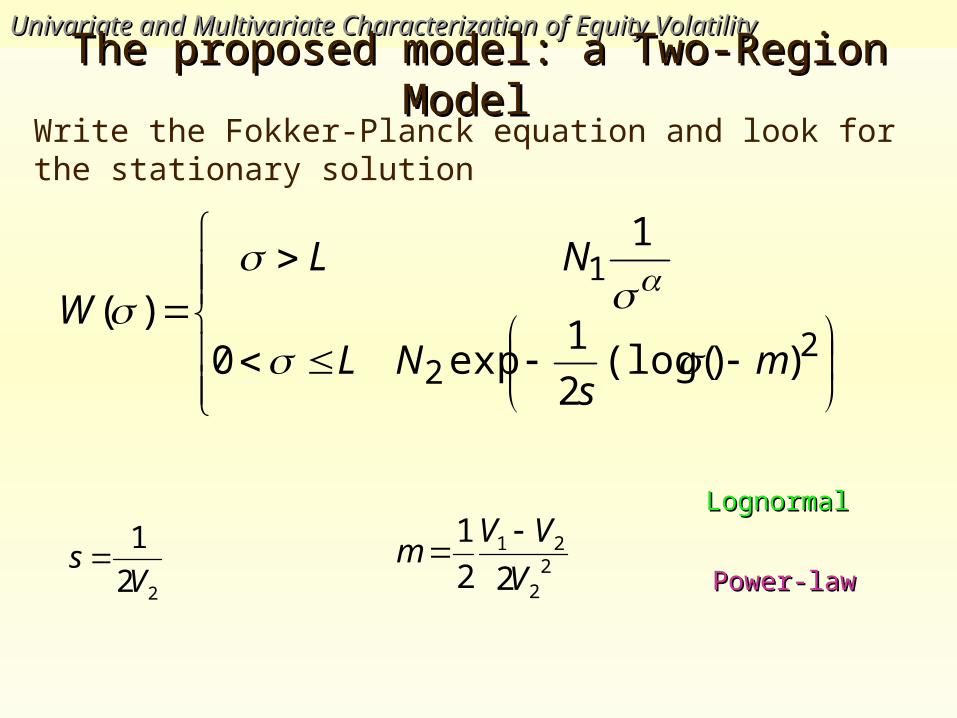
The proposed model: a Two-Region Model The proposed model: a Two-Region Model
22
1
))(log(2
1exp0
1
)(m
sNL
NLW
22
21
22
1
V
VVm
22
1
Vs
LognormalLognormal
Power-lawPower-law
Write the Fokker-Planck equation and look for the stationary solution
Univariate and Multivariate Characterization of Equity VolatilityUnivariate and Multivariate Characterization of Equity Volatility
The proposed model: a Two-Region Model The proposed model: a Two-Region Model
Univariate and Multivariate Characterization of Equity VolatilityUnivariate and Multivariate Characterization of Equity Volatility
Nevertheless, the dinamical properties of volatility are not well dinamical properties of volatility are not well reproducedreproduced by this simple model.
The proposed model: a Two-Region Model The proposed model: a Two-Region Model
Volatility shows an empirical pdf that has power-law tails with exponent empemp 4.8 4.8 and an empirical mean squared displacement that is asymptotically power-law with exponent empemp 1.7 1.7, i.e.
empemp 0.3 0.3 in the autocorrelation function.
One can prove that this simple Two-Region model admits a power-power-law decaying autocorrelationlaw decaying autocorrelation function with exponent:
2
3αβ
4.8 4.8 would imply would imply 0.9 0.9 i.e.i.e. = 2- = 2-1.11.1
Univariate and Multivariate Characterization of Equity VolatilityUnivariate and Multivariate Characterization of Equity Volatility
ConclusionsConclusions
ReferencesReferences•S. Miccichè, G. Bonanno, F. Lillo, R. N. MantegnaS. Miccichè, G. Bonanno, F. Lillo, R. N. Mantegna , Physica A, , Physica A, 314314, , 756-761756-761, (2002), (2002)•F. Lillo, S. Miccichè, R. N. MantegnaF. Lillo, S. Miccichè, R. N. Mantegna, cond-mat/0203442, cond-mat/0203442•S. Miccichè, G. Bonanno, F. Lillo, R. N. MantegnaS. Miccichè, G. Bonanno, F. Lillo, R. N. Mantegna , , Proceedings of: "The Second Nikkey Proceedings of: "The Second Nikkey Econophysics Research Workshop and Symposium", 12-14 November 2002, Tokio, Japan Econophysics Research Workshop and Symposium", 12-14 November 2002, Tokio, Japan Springer Verlag, Tokio, edited by H. Takayasu Springer Verlag, Tokio, edited by H. Takayasu
This simple model reproduces the empirical pdf quite well
However, the empirical Autocorrelation function is not well reproduced..
We are working of making the and exponents independent from each other. This could be done by considering a diffusion coefficient
g(g()) ((multiplicative noise)).
MultivariateMultivariate
Univariate and Multivariate Characterization of Equity VolatilityUnivariate and Multivariate Characterization of Equity Volatility
Univariate and Multivariate Characterization of Equity VolatilityUnivariate and Multivariate Characterization of Equity Volatility
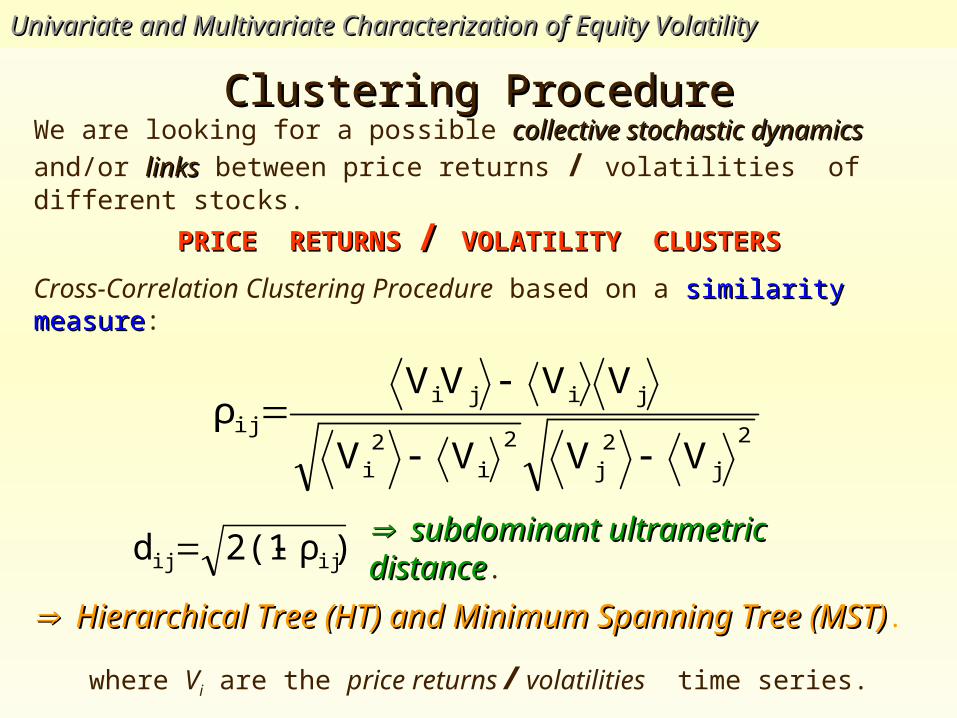
Clustering ProcedureClustering ProcedureWe are looking for a possible collective stochastic dynamicscollective stochastic dynamics and/or linkslinks between
price returns / volatilities of different stocks.
PRICE RETURNS PRICE RETURNS / / VOLATILITY CLUSTERSVOLATILITY CLUSTERS
Cross-Correlation Clustering Procedure based on a similarity measuresimilarity measure:
)ρ2(1d ijij
2
j2
j
2
i2
i
jiji
ij
VVVV
VVVVρ
where Vi are the price returns / volatilities time series.
subdominant ultrametric distancesubdominant ultrametric distance.
Hierarchical Tree (HT) and Minimum Spanning Tree (MST)Hierarchical Tree (HT) and Minimum Spanning Tree (MST).
Univariate and Multivariate Characterization of Equity VolatilityUnivariate and Multivariate Characterization of Equity Volatility
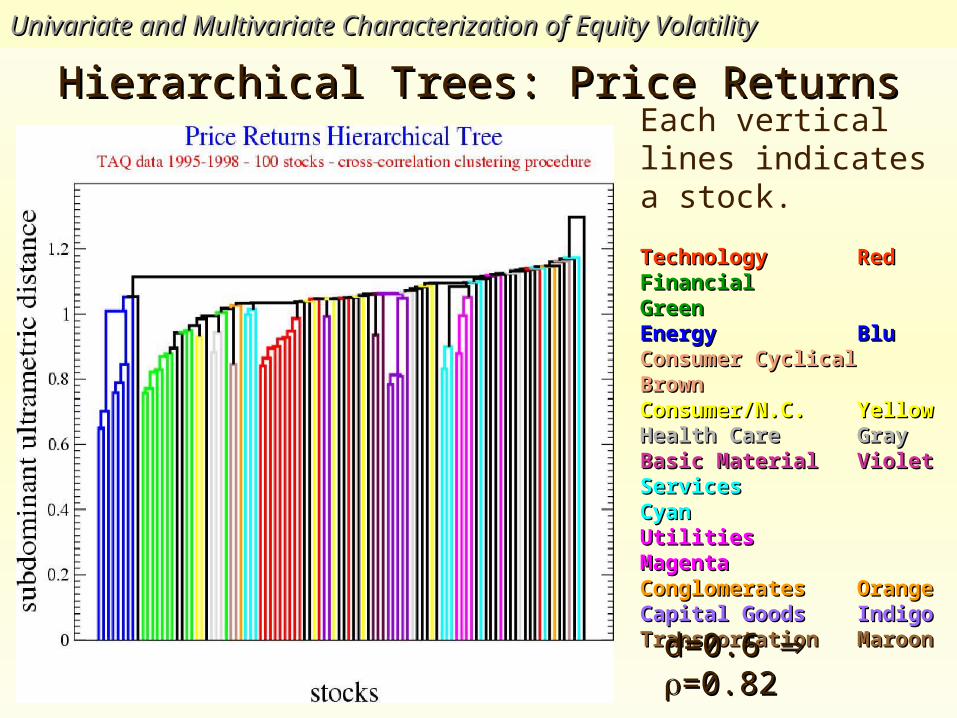
Hierarchical Trees: Price ReturnsHierarchical Trees: Price ReturnsEach vertical lines indicates a stock.
TechnologyTechnology Red RedFinancialFinancial GreenGreenEnergyEnergy Blu BluConsumer CyclicalConsumer Cyclical BrownBrownConsumer/N.C.Consumer/N.C. Yellow YellowHealth CareHealth Care Gray GrayBasic MaterialBasic Material Violet VioletServicesServices CyanCyanUtilitiesUtilities MagentaMagentaConglomeratesConglomerates Orange OrangeCapital GoodsCapital Goods Indigo IndigoTransportationTransportation Maroon Maroon
d=0.6 d=0.6 =0.82=0.82
Univariate and Multivariate Characterization of Equity VolatilityUnivariate and Multivariate Characterization of Equity Volatility
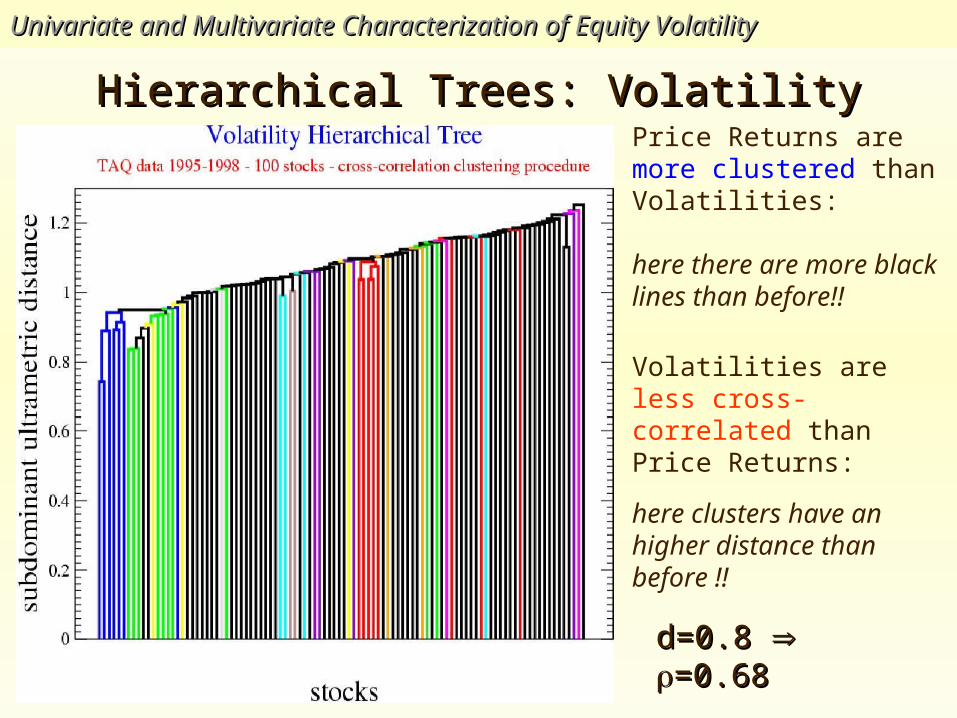
Hierarchical Trees: VolatilityHierarchical Trees: Volatility
Volatilities are less cross-correlated than Price Returns:
here clusters have an higher distance than before !!
Price Returns are more clustered than Volatilities:
here there are more black lines than before!!
d=0.8 d=0.8 =0.68=0.68
Univariate and Multivariate Characterization of Equity VolatilityUnivariate and Multivariate Characterization of Equity Volatility
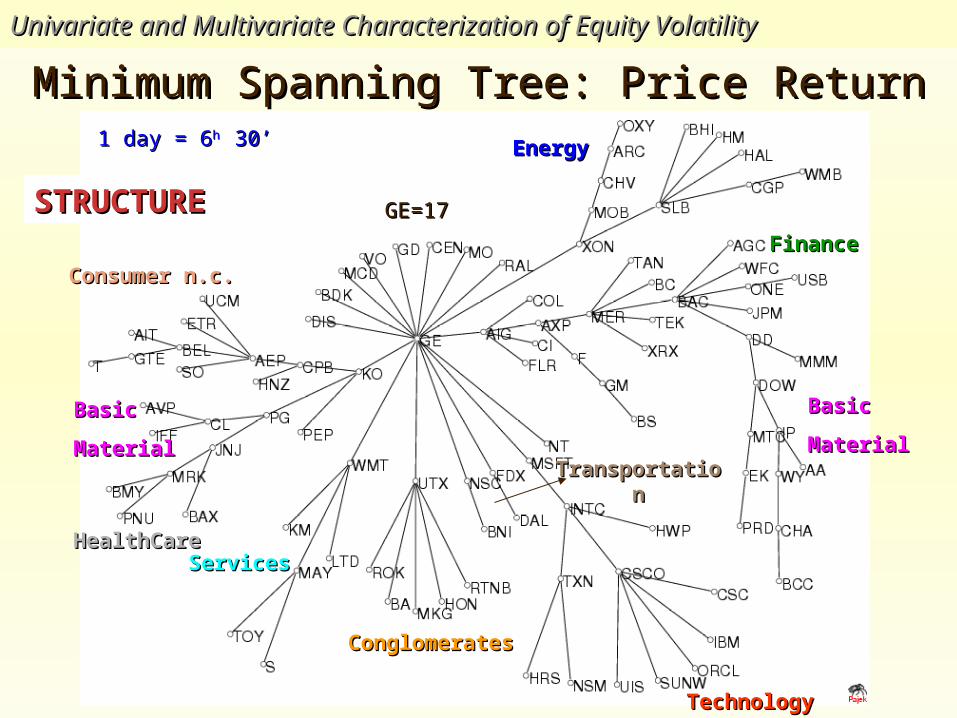
Minimum Spanning Tree: Price ReturnMinimum Spanning Tree: Price ReturnEnergyEnergy
TechnologyTechnology
FinanceFinance
ConglomerateConglomeratess
Consumer n.c.Consumer n.c.
ServicesServices
BasicBasic
MaterialMaterialTransportatioTransportatio
nn
BasicBasic
MaterialMaterial
HealthCareHealthCare
1 day = 61 day = 6h h 30’ 30’
STRUCTURSTRUCTUREE GE=17GE=17
Univariate and Multivariate Characterization of Equity VolatilityUnivariate and Multivariate Characterization of Equity Volatility
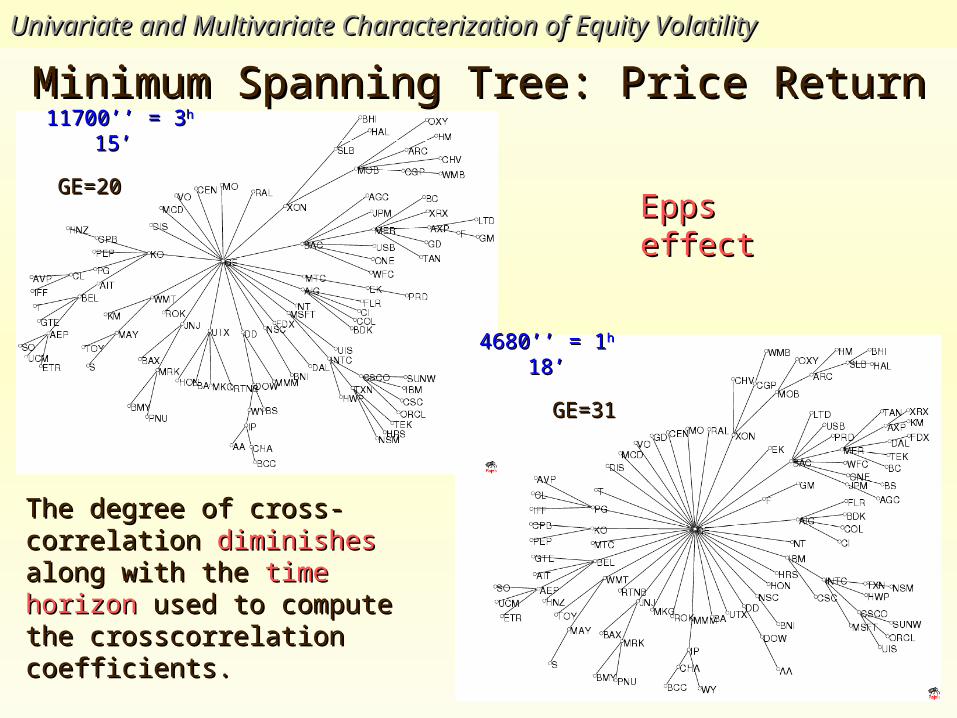
Minimum Spanning Tree: Price ReturnMinimum Spanning Tree: Price Return11700’’ = 311700’’ = 3h h 15’ 15’
4680’’ = 14680’’ = 1hh 18’ 18’
Epps effectEpps effect
The degree of cross-correlation The degree of cross-correlation diminishesdiminishes along with the along with the time time horizonhorizon used to compute the used to compute the crosscorrelation coefficients.crosscorrelation coefficients.
GE=20GE=20
GE=31GE=31
Univariate and Multivariate Characterization of Equity VolatilityUnivariate and Multivariate Characterization of Equity Volatility
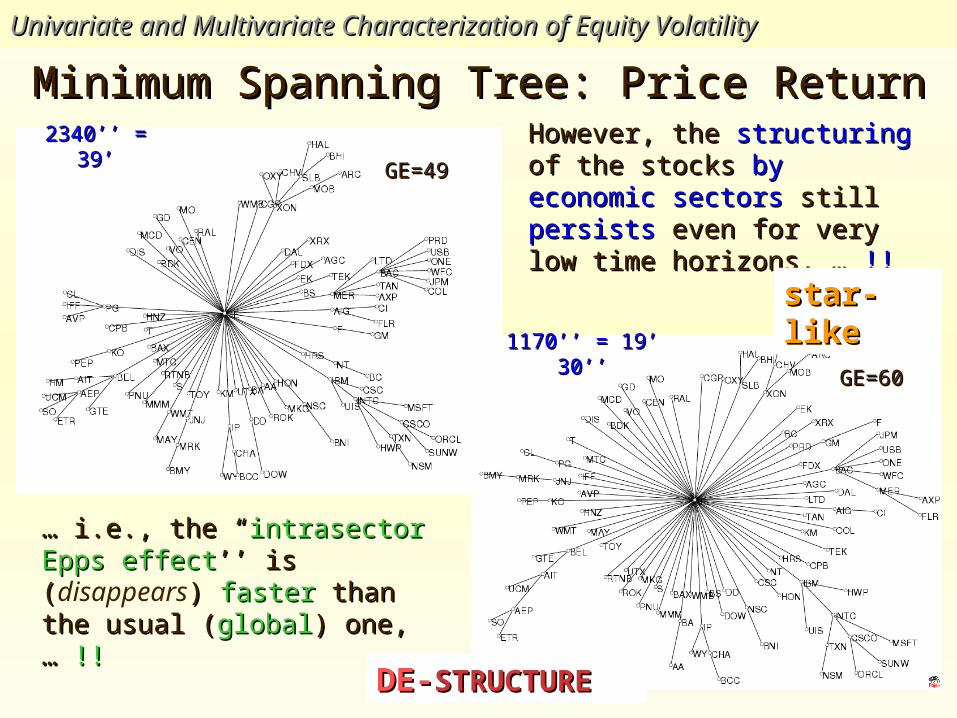
Minimum Spanning Tree: Price ReturnMinimum Spanning Tree: Price Return2340’’ = 39’2340’’ = 39’
1170’’ = 19’ 1170’’ = 19’ 30’’30’’
However, the However, the structuringstructuring of the of the stocks stocks by economic sectorsby economic sectors still still persistspersists even for very low time even for very low time horizons, … horizons, … !!!!
… … i.e., the “i.e., the “intrasector Epps intrasector Epps effecteffect’’ is (’’ is (disappears) ) fasterfaster than than the usual (the usual (globalglobal) one, … ) one, … !!!!
DE-DE-STRUCTURESTRUCTURE
GE=49GE=49
GE=60GE=60
star-star-likelike
Univariate and Multivariate Characterization of Equity VolatilityUnivariate and Multivariate Characterization of Equity Volatility
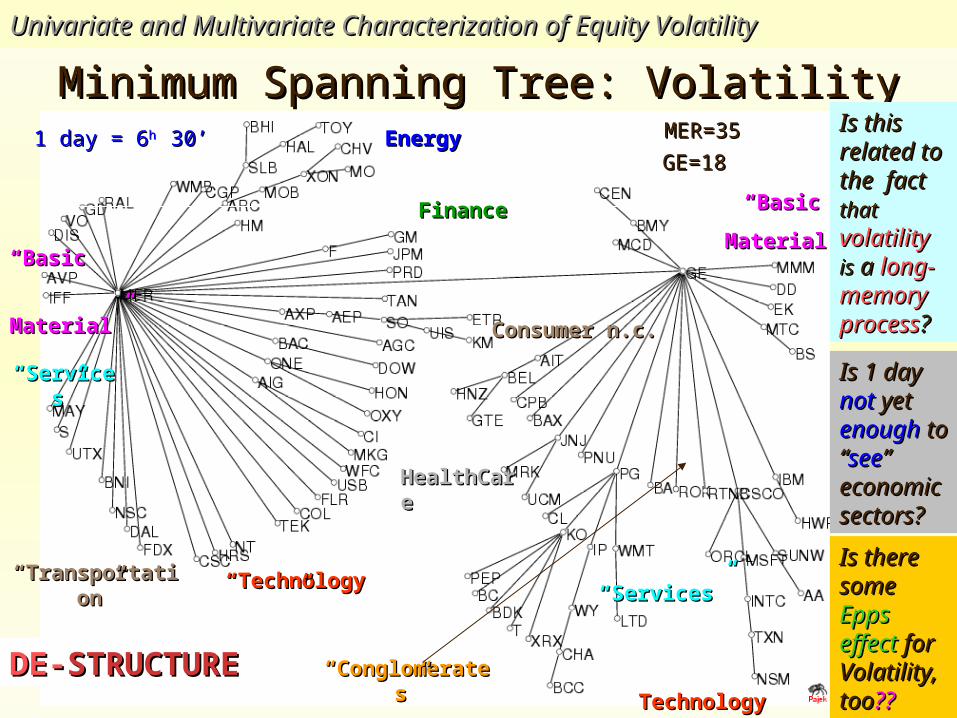
Minimum Spanning Tree: VolatilityMinimum Spanning Tree: VolatilityEnergyEnergy
FinanceFinance
““ConglomeratConglomerates”es”
““ServiceServices”s”
Consumer n.c.Consumer n.c.
““Services”Services”
TechnologyTechnology
““TechnologTechnology”y”
““TransportatiTransportation”on”
HealthCaHealthCarere
““BasicBasic
Material”Material”
““BasicBasic
Material”Material”
DE-DE-STRUCTURESTRUCTURE
Is this Is this related related to the to the fact fact thatthat volatilityvolatility isis a a long-long-memory memory processprocess??Is 1 day Is 1 day notnot yet yet enoughenough to “to “seesee” ” economieconomic c sectors?sectors?Is there Is there somesome Epps Epps effecteffect for for VolatilityVolatility, too, too????
1 day = 61 day = 6h h 30’ 30’ GE=18GE=18
MER=35MER=35
Univariate and Multivariate Characterization of Equity VolatilityUnivariate and Multivariate Characterization of Equity Volatility
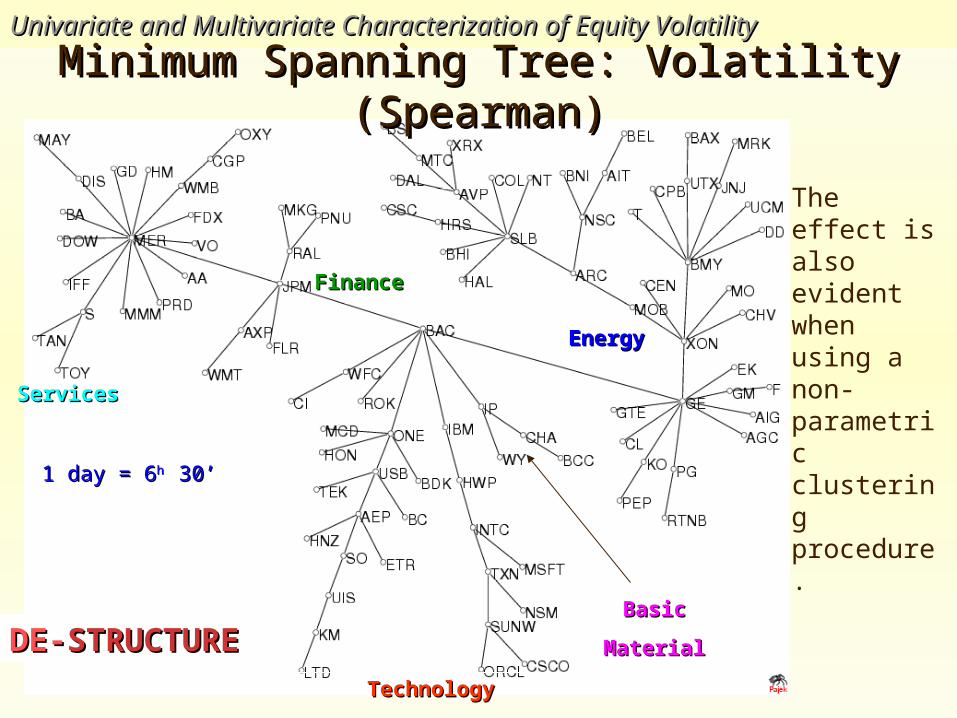
Minimum Spanning Tree: Volatility Minimum Spanning Tree: Volatility (Spearman)(Spearman)
DE-DE-STRUCTURESTRUCTURE
The effect is also evident when using a non-parametric clustering procedure.
BasicBasic
MaterialMaterial
TechnologyTechnology
EnergyEnergy
ServicesServices
FinanceFinance
1 day = 61 day = 6h h 30’ 30’
ConclusionsConclusions
ReferencesReferences•R. Rammal, G. Toulose, M.A. VirasoroR. Rammal, G. Toulose, M.A. Virasoro , Rev. Mod. Phys., , Rev. Mod. Phys., 5858, , 765, (1986)765, (1986)•R. N. MantegnaR. N. Mantegna, Eur. Phys. J. B, , Eur. Phys. J. B, 1111, 193 (1999), 193 (1999)•R. N. Mantegna, H. E. Stanley, R. N. Mantegna, H. E. Stanley, An introduction to Econophysics, CUP, Cambridge (2000)An introduction to Econophysics, CUP, Cambridge (2000)•G. Bonanno, F. Lillo, R. N. MantegnaG. Bonanno, F. Lillo, R. N. Mantegna, Quantitative Finance, , Quantitative Finance, 11, 96 (2001), 96 (2001)•S. Miccichè, G. Bonanno, F. Lillo, R. N. MantegnaS. Miccichè, G. Bonanno, F. Lillo, R. N. Mantegna , Physica A, , Physica A, 324324, 66-73, (2003), 66-73, (2003)•G. Bonanno, G. Caldarelli, F. Lillo, S. Miccichè, N. Vanderwalle, R. N. MantegnaG. Bonanno, G. Caldarelli, F. Lillo, S. Miccichè, N. Vanderwalle, R. N. Mantegna , in preparation, in preparation
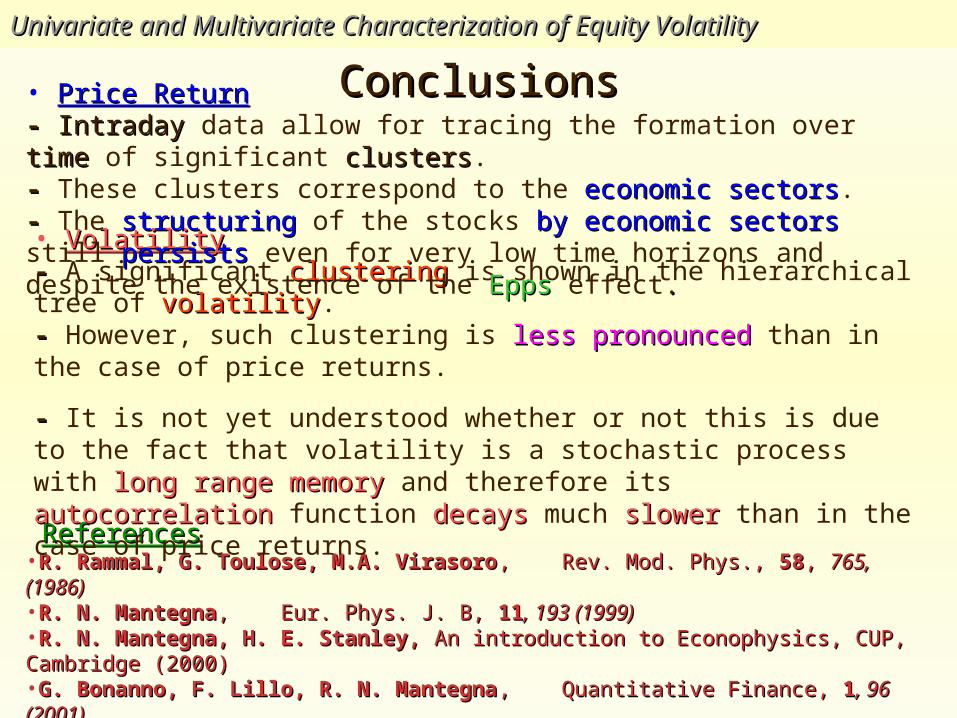
• VolatilityVolatility-- A significant clusteringclustering is shown in the hierarchical tree of volatilityvolatility.-- However, such clustering is less pronouncedless pronounced than in the case of price returns.
-- It is not yet understood whether or not this is due to the fact that volatility is a stochastic process with long range memorylong range memory and therefore its autocorrelationautocorrelation function decaysdecays much slowerslower than in the case of price returns.
Univariate and Multivariate Characterization of Equity VolatilityUnivariate and Multivariate Characterization of Equity Volatility
• Price ReturnPrice Return -- IntradayIntraday data allow for tracing the formation over timetime of significant clustersclusters. -- These clusters correspond to the economic sectorseconomic sectors. -- The structuringstructuring of the stocks by economic sectorsby economic sectors still persistspersists even for very low time horizons and despite the existence of the EppsEpps effect. .


![N. Mantegna arXiv:1107.3942v1 [q-fin.TR] 20 Jul 2011 of](https://img.pdfslide.us/doc/110x75/625414675af99c695a7ba41d/n-mantegna-arxiv11073942v1-q-fintr-20-jul-2011-of-.jpg)