Embed Size (px)
Citation preview
Univariate TestsBivariate Tests
Univariate and Bivariate Tests
BUS 230: Business and Economics Research andCommunication
BUS 230: Business Research and Communication Univariate and Bivariate Tests
Univariate TestsBivariate Tests
GoalsHypotheses Tests
Goals 1/ 20
Specific goals:
Be able to distinguish different types of data and prescribeappropriate statistical methods.Conduct a number of hypothesis tests using methodsappropriate for questions involving only one or two variables.
Learning objectives:
LO2: Interpret data using statistical analysis.LO2.3: Formulate conclusions and recommendations basedupon statistical results.
BUS 230: Business Research and Communication Univariate and Bivariate Tests
Univariate TestsBivariate Tests
GoalsHypotheses Tests
Statistical Hypotheses 2/ 20
A hypothesis is a claim or statement about a property of apopulation.
Example: The population mean for systolic blood pressure is120.
A hypothesis test (or test of significance) is a standardprocedure for testing a claim about a property of a population.
Recall the example about birth weights with mothers who usedrugs.
Hypothesis: Using drugs during pregnancy leads to an averagebirth weight of 7 pounds (the same as with mothers who donot use drugs).
BUS 230: Business Research and Communication Univariate and Bivariate Tests
Univariate TestsBivariate Tests
GoalsHypotheses Tests
Null and Alternative Hypotheses 3/ 20
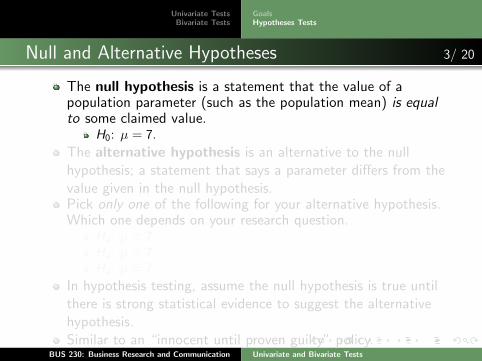
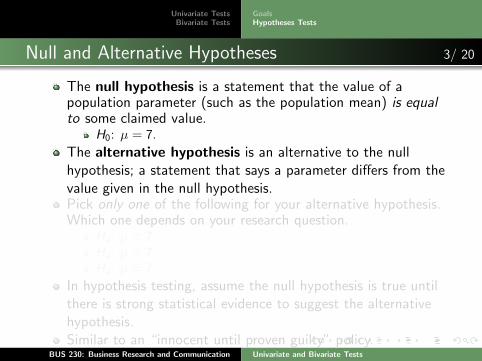
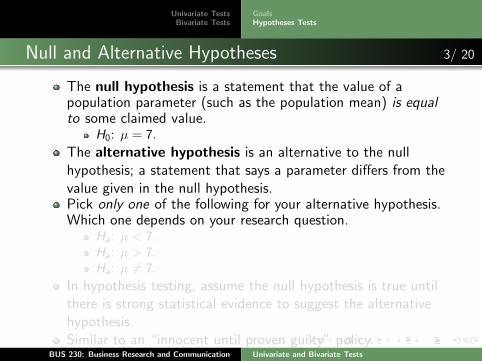
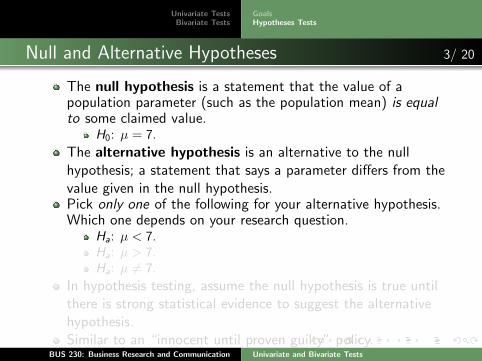
The null hypothesis is a statement that the value of apopulation parameter (such as the population mean) is equalto some claimed value.
H0: µ = 7.
The alternative hypothesis is an alternative to the nullhypothesis; a statement that says a parameter differs from thevalue given in the null hypothesis.Pick only one of the following for your alternative hypothesis.Which one depends on your research question.
Ha: µ < 7.Ha: µ > 7.Ha: µ 6= 7.
In hypothesis testing, assume the null hypothesis is true untilthere is strong statistical evidence to suggest the alternativehypothesis.Similar to an “innocent until proven guilty” policy.
BUS 230: Business Research and Communication Univariate and Bivariate Tests
Univariate TestsBivariate Tests
GoalsHypotheses Tests
Null and Alternative Hypotheses 3/ 20
The null hypothesis is a statement that the value of apopulation parameter (such as the population mean) is equalto some claimed value.
H0: µ = 7.
The alternative hypothesis is an alternative to the nullhypothesis; a statement that says a parameter differs from thevalue given in the null hypothesis.Pick only one of the following for your alternative hypothesis.Which one depends on your research question.
Ha: µ < 7.Ha: µ > 7.Ha: µ 6= 7.
In hypothesis testing, assume the null hypothesis is true untilthere is strong statistical evidence to suggest the alternativehypothesis.Similar to an “innocent until proven guilty” policy.
BUS 230: Business Research and Communication Univariate and Bivariate Tests
Univariate TestsBivariate Tests
GoalsHypotheses Tests
Hypothesis tests 4/ 20
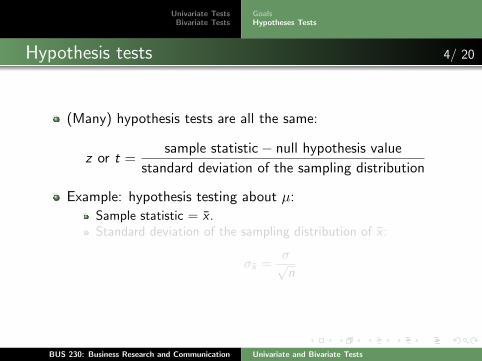
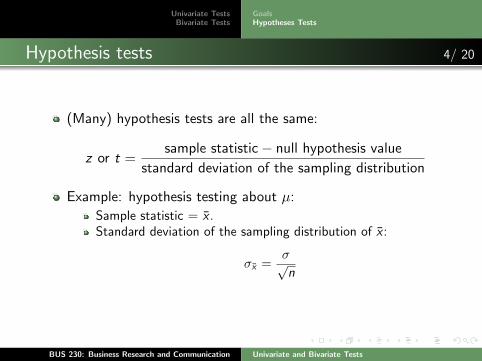
(Many) hypothesis tests are all the same:
z or t =sample statistic− null hypothesis value
standard deviation of the sampling distribution
Example: hypothesis testing about µ:
Sample statistic = x̄ .Standard deviation of the sampling distribution of x̄ :
σx̄ =σ√n
BUS 230: Business Research and Communication Univariate and Bivariate Tests
Univariate TestsBivariate Tests
GoalsHypotheses Tests
Hypothesis tests 4/ 20
(Many) hypothesis tests are all the same:
z or t =sample statistic− null hypothesis value
standard deviation of the sampling distribution
Example: hypothesis testing about µ:
Sample statistic = x̄ .Standard deviation of the sampling distribution of x̄ :
σx̄ =σ√n
BUS 230: Business Research and Communication Univariate and Bivariate Tests
Univariate TestsBivariate Tests
GoalsHypotheses Tests
P-values 5/ 20
The P-value of the test statistic, is the area of the samplingdistribution from the sample result in the direction of thealternative hypothesis.Interpretation: If the null hypothesis is correct, than thep-value is the probability of obtaining a sample that yieldedyour statistic, or a statistic that provides even strongerevidence of the null hypothesis.The p-value is therefore a measure of statistical significance.
If p-values are very small, there is strong statistical evidence infavor of the alternative hypothesis.If p-values are large, there is insignificant statistical evidence.When large, you fail to reject the null hypothesis.
Best practice is writing research: report the p-value. Differentreaders may have different opinions about how small a p-valueshould be before saying your results are statistically significant.
BUS 230: Business Research and Communication Univariate and Bivariate Tests
Univariate TestsBivariate Tests
Types of Data/TestsHypothesis Testing about MeanHypothesis Testing about ProportionNonparametric Testing about Median
Types of Data 6/ 20
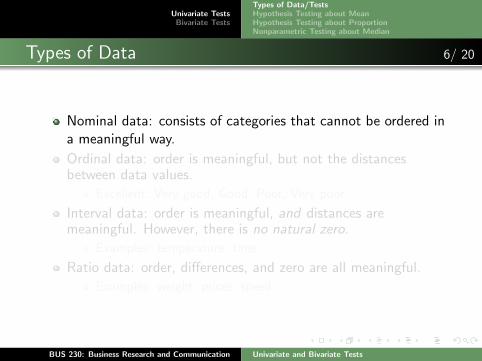
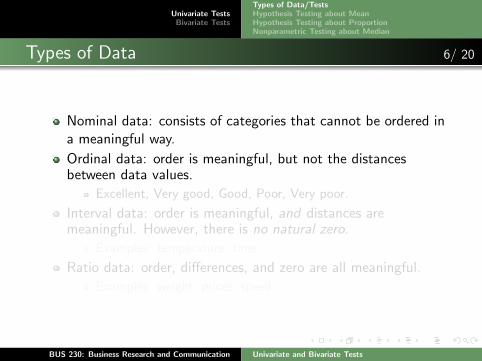
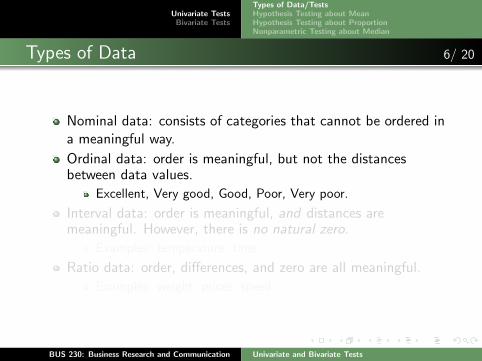
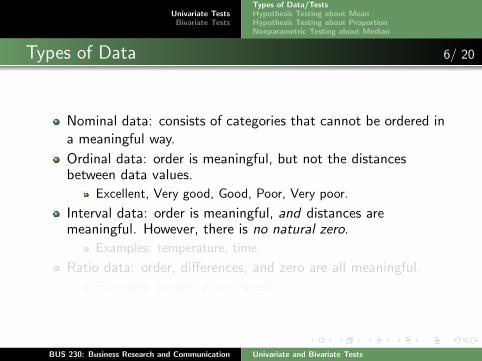
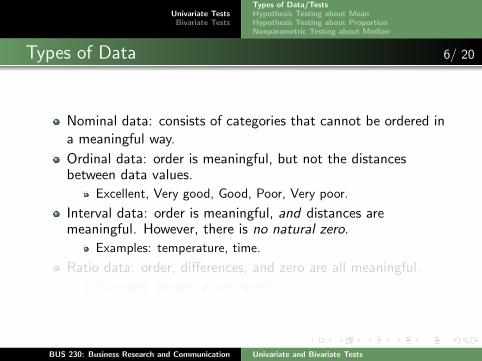
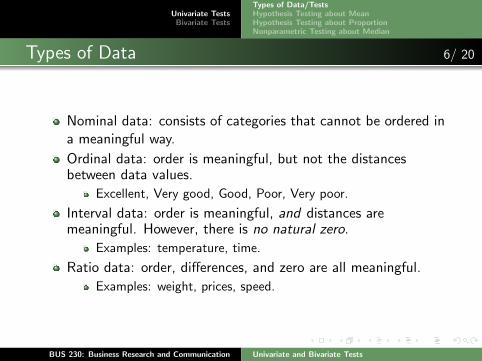
Nominal data: consists of categories that cannot be ordered ina meaningful way.
Ordinal data: order is meaningful, but not the distancesbetween data values.
Excellent, Very good, Good, Poor, Very poor.
Interval data: order is meaningful, and distances aremeaningful. However, there is no natural zero.
Examples: temperature, time.
Ratio data: order, differences, and zero are all meaningful.
Examples: weight, prices, speed.
BUS 230: Business Research and Communication Univariate and Bivariate Tests
Univariate TestsBivariate Tests
Types of Data/TestsHypothesis Testing about MeanHypothesis Testing about ProportionNonparametric Testing about Median
Types of Data 6/ 20
Nominal data: consists of categories that cannot be ordered ina meaningful way.
Ordinal data: order is meaningful, but not the distancesbetween data values.
Excellent, Very good, Good, Poor, Very poor.
Interval data: order is meaningful, and distances aremeaningful. However, there is no natural zero.
Examples: temperature, time.
Ratio data: order, differences, and zero are all meaningful.
Examples: weight, prices, speed.
BUS 230: Business Research and Communication Univariate and Bivariate Tests
Univariate TestsBivariate Tests
Types of Data/TestsHypothesis Testing about MeanHypothesis Testing about ProportionNonparametric Testing about Median
Types of Tests 7/ 20
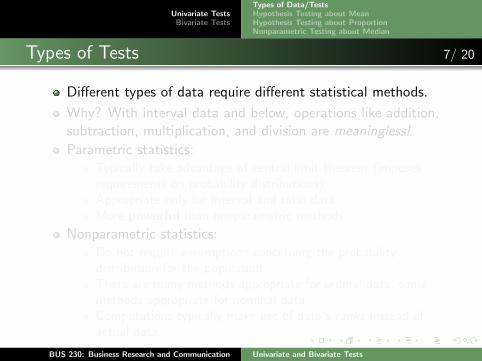
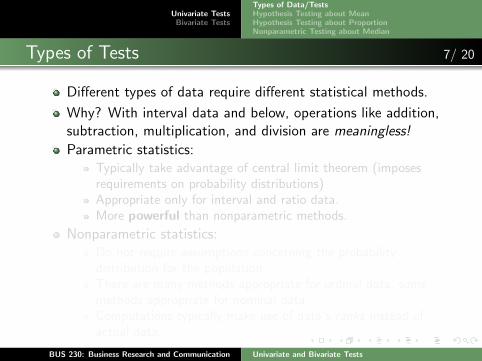
Different types of data require different statistical methods.
Why? With interval data and below, operations like addition,subtraction, multiplication, and division are meaningless!
Parametric statistics:Typically take advantage of central limit theorem (imposesrequirements on probability distributions)Appropriate only for interval and ratio data.More powerful than nonparametric methods.
Nonparametric statistics:Do not require assumptions concerning the probabilitydistribution for the population.There are many methods appropriate for ordinal data, somemethods appropriate for nominal data.Computations typically make use of data’s ranks instead ofactual data.
BUS 230: Business Research and Communication Univariate and Bivariate Tests

Univariate TestsBivariate Tests
Types of Data/TestsHypothesis Testing about MeanHypothesis Testing about ProportionNonparametric Testing about Median
Types of Tests 7/ 20
Different types of data require different statistical methods.
Why? With interval data and below, operations like addition,subtraction, multiplication, and division are meaningless!
Parametric statistics:Typically take advantage of central limit theorem (imposesrequirements on probability distributions)Appropriate only for interval and ratio data.More powerful than nonparametric methods.
Nonparametric statistics:Do not require assumptions concerning the probabilitydistribution for the population.There are many methods appropriate for ordinal data, somemethods appropriate for nominal data.Computations typically make use of data’s ranks instead ofactual data.
BUS 230: Business Research and Communication Univariate and Bivariate Tests
Univariate TestsBivariate Tests
Types of Data/TestsHypothesis Testing about MeanHypothesis Testing about ProportionNonparametric Testing about Median
Single Mean T-Test 8/ 20
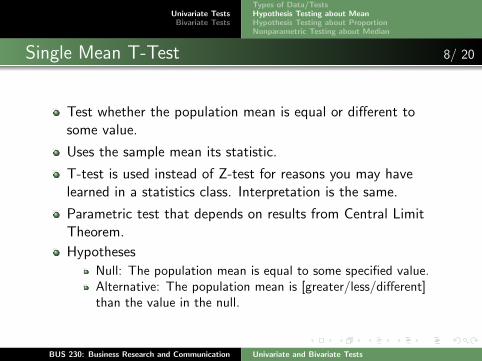
Test whether the population mean is equal or different tosome value.
Uses the sample mean its statistic.
T-test is used instead of Z-test for reasons you may havelearned in a statistics class. Interpretation is the same.
Parametric test that depends on results from Central LimitTheorem.
Hypotheses
Null: The population mean is equal to some specified value.Alternative: The population mean is [greater/less/different]than the value in the null.
BUS 230: Business Research and Communication Univariate and Bivariate Tests
Univariate TestsBivariate Tests
Types of Data/TestsHypothesis Testing about MeanHypothesis Testing about ProportionNonparametric Testing about Median
Single Mean T-Test 8/ 20
Test whether the population mean is equal or different tosome value.
Uses the sample mean its statistic.
T-test is used instead of Z-test for reasons you may havelearned in a statistics class. Interpretation is the same.
Parametric test that depends on results from Central LimitTheorem.
Hypotheses
Null: The population mean is equal to some specified value.Alternative: The population mean is [greater/less/different]than the value in the null.
BUS 230: Business Research and Communication Univariate and Bivariate Tests
Univariate TestsBivariate Tests
Types of Data/TestsHypothesis Testing about MeanHypothesis Testing about ProportionNonparametric Testing about Median
Example Questions 9/ 20
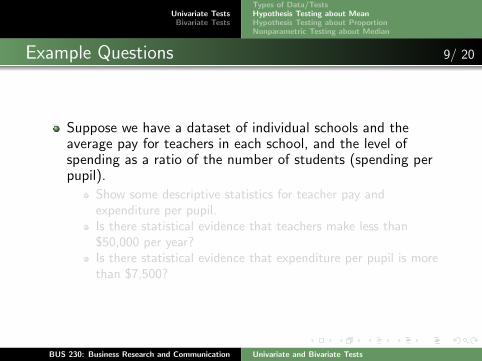
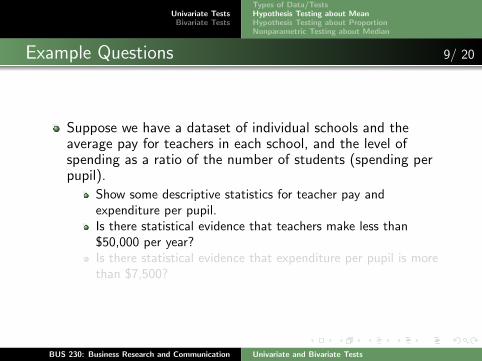
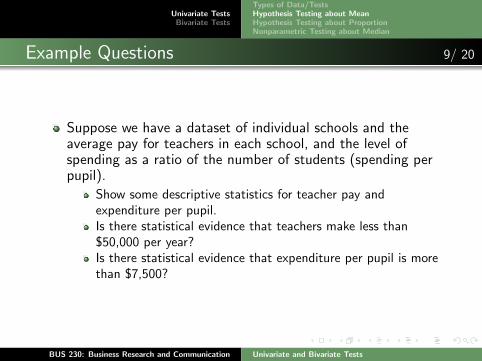
Suppose we have a dataset of individual schools and theaverage pay for teachers in each school, and the level ofspending as a ratio of the number of students (spending perpupil).
Show some descriptive statistics for teacher pay andexpenditure per pupil.Is there statistical evidence that teachers make less than$50,000 per year?Is there statistical evidence that expenditure per pupil is morethan $7,500?
BUS 230: Business Research and Communication Univariate and Bivariate Tests

Univariate TestsBivariate Tests
Types of Data/TestsHypothesis Testing about MeanHypothesis Testing about ProportionNonparametric Testing about Median
Example Questions 9/ 20
Suppose we have a dataset of individual schools and theaverage pay for teachers in each school, and the level ofspending as a ratio of the number of students (spending perpupil).
Show some descriptive statistics for teacher pay andexpenditure per pupil.Is there statistical evidence that teachers make less than$50,000 per year?Is there statistical evidence that expenditure per pupil is morethan $7,500?
BUS 230: Business Research and Communication Univariate and Bivariate Tests

Univariate TestsBivariate Tests
Types of Data/TestsHypothesis Testing about MeanHypothesis Testing about ProportionNonparametric Testing about Median
Example: Public School Spending 10/ 20
Dataset: average pay for public school teachers and averagepublic school spending per pupil for each state and theDistrict of Columbia in 1985.
Download dataset eduspending.sav.
Conduct the following exercises:
Show some descriptive statistics for teacher pay andexpenditure per pupil.Is there statistical evidence that teachers make less than$25,000 per year?Is there statistical evidence that expenditure per pupil is morethan $3,500?
BUS 230: Business Research and Communication Univariate and Bivariate Tests

Univariate TestsBivariate Tests
Types of Data/TestsHypothesis Testing about MeanHypothesis Testing about ProportionNonparametric Testing about Median
Single Proportion T-Test 11/ 20
Proportion: Percentage of times some characteristic occurs.
Example: percentage of consumers of soda who prefer Pepsiover Coke.
Sample proportion =Number of items that has characteristic
sample size
Example questions:
Are more than 50% of potential voters most likely to vote forBarack Obama in the next presidential election?Suppose typical brand-loyalty turn-over in the mobile phoneindustry is 10%. Is there statistical evidence that AT&T hasbrand-loyalty turnover more than 10%?
BUS 230: Business Research and Communication Univariate and Bivariate Tests

Univariate TestsBivariate Tests
Types of Data/TestsHypothesis Testing about MeanHypothesis Testing about ProportionNonparametric Testing about Median
Example: Economic Outlook 12/ 20
Data from Montana residents in 1992 concerning theiroutlook for the economy.All data is ordinal or nominal:
AGE = 1 under 35, 2 35-54, 3 55 and overSEX = 0 male, 1 femaleINC = yearly income: 1 under $20K, 2 20-35$K, 3 over $35KPOL = 1 Democrat, 2 Independent, 3 RepublicanAREA = 1 Western, 2 Northeastern, 3 Southeastern MontanaFIN = Financial status 1 worse, 2 same, 3 better than a yearagoSTAT = 0, State economic outlook better, 1 not better than ayear ago
Do the majority of Montana residents feel their financialstatus is the same or better than one year ago?Do the majority of Montana residents have a more positiveeconomic outlook than one year ago?
BUS 230: Business Research and Communication Univariate and Bivariate Tests
Univariate TestsBivariate Tests
Types of Data/TestsHypothesis Testing about MeanHypothesis Testing about ProportionNonparametric Testing about Median
Single Median Nonparametric Test 13/ 20
Why?
Ordinal data: cannot compute sample means (they aremeaningless), only median is meaningful.Small sample size and you are not sure the population is notnormal.
Sign test: can use tests for proportions for testing the median.
For a null hypothesized population median...Count how many observations are above the median.Test whether that proportion is greater, less than, or not equalto 0.5.For small sample sizes, use binomial distribution instead ofnormal distribution.
BUS 230: Business Research and Communication Univariate and Bivariate Tests
Univariate TestsBivariate Tests
Types of Data/TestsHypothesis Testing about MeanHypothesis Testing about ProportionNonparametric Testing about Median
Example Questions 14/ 20
Instructor evaluations have an ordinal scale: Excellent, VeryGood, Good, Poor, Very Poor.
Is there statistical evidence that the median rating for aprofessor is below ’Very Good’?
Suppose you have a frequency determination question on yoursurvey. Is this an ordinal scale? Is the median an appropriatemeasure of center?
BUS 230: Business Research and Communication Univariate and Bivariate Tests
Univariate TestsBivariate Tests
Types of Data/TestsHypothesis Testing about MeanHypothesis Testing about ProportionNonparametric Testing about Median
Example: Attitudes Grade School Kids 15/ 20
Dataset: 438 students in grades 4 through 6 were sampledfrom three school districts in Michigan. Students ranked from1 (most important) to 5 (least important) how importantgrades, sports, being good looking, and having lots of moneywere to each of them.
Open dataset gradeschools.sav. Choose second worksheet,titled Data.
Answer some of these questions:
Is the median importance for grades is greater than 3?Is the median importance for money less than 3?
BUS 230: Business Research and Communication Univariate and Bivariate Tests

Univariate TestsBivariate Tests
Difference in Populations (Independent Samples)Paired Samples
Difference in Means (Independent Samples) 16/ 20
Suppose you want to know whether the mean from onepopulation is larger than the mean for another.
Independent samples means you have different individuals inyour two sample groups.
Examples:
Compare sales volume for stores that advertise versus thosethat do not.Compare production volume for employees that havecompleted some type of training versus those who have not.
Statistic: Difference in the sample means (x̄1 − x̄2).
Hypotheses:
Null hypothesis: the difference between the two means is zero.Alternative hypothesis: the difference is [above/below/notequal] to zero.
BUS 230: Business Research and Communication Univariate and Bivariate Tests
Univariate TestsBivariate Tests
Difference in Populations (Independent Samples)Paired Samples
Example 17/ 20
Dataset: average pay for public school teachers and averagepublic school spending per pupil for each state and theDistrict of Columbia in 1985.
Test the following hypotheses:
Does spending per pupil differ in the North (region 1) and theSouth (region 2)?Does teacher salary differ in the North and the West (region3)?
Do you see any weaknesses in our statistical analysis?
BUS 230: Business Research and Communication Univariate and Bivariate Tests
Univariate TestsBivariate Tests
Difference in Populations (Independent Samples)Paired Samples
Nonparametric Tests for Differences in Medians 18/ 20
Mann-Whitney U test: nonparametric test to determinedifference in medians.
Can you suggest some examples?
Assumptions:
Samples are independent of one another.The underlying distributions have the same shape (i.e. onlythe location of the distribution is different).It has been argued that violating the second assumption doesnot severely change the sampling distribution of theMann-Whitney U test.
Null hypothesis: medians for the two populations are thesame.
Alternative hypotheses: medians for the two populations aredifferent.
BUS 230: Business Research and Communication Univariate and Bivariate Tests
Univariate TestsBivariate Tests
Difference in Populations (Independent Samples)Paired Samples
Dependent Samples - Paired Samples 19/ 20
Use a paired sampled test if instead the two samples havethe same individuals before and after some treatment.
Examples:The Biggest Loser: Compare the weight of people on the showbefore the season begins and one year after the showconcludes.Training session: Are workers more productive 6 months afterthey attended some training session versus before the trainingsession.
Really simple: for each individual subtract the beforetreatment measure from the after treatment measure (orvice-versa).
Treat your new series as a single series.
Conduct one-sample tests.
BUS 230: Business Research and Communication Univariate and Bivariate Tests
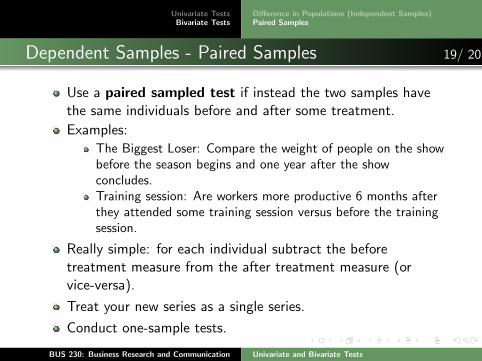

Univariate TestsBivariate Tests
Conclusions 20/ 20
Ideas to keep in mind:
What is a sampling distribution? What does it imply aboutp-values and statistical significance?When it is appropriate to use parametric versus non-parametricmethods.Most univariate and bivariate questions have a parametric andnon-parametric approach.
Next class: closed-book, closed note quiz (so study!); and anin-class exercise practicing this stuff in SPSS.
Next: Statistics to understand the relationship between twovariables.
BUS 230: Business Research and Communication Univariate and Bivariate Tests
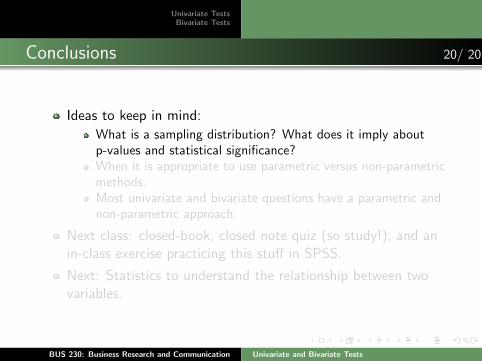
Univariate TestsBivariate Tests
Conclusions 20/ 20
Ideas to keep in mind:
What is a sampling distribution? What does it imply aboutp-values and statistical significance?When it is appropriate to use parametric versus non-parametricmethods.Most univariate and bivariate questions have a parametric andnon-parametric approach.
Next class: closed-book, closed note quiz (so study!); and anin-class exercise practicing this stuff in SPSS.
Next: Statistics to understand the relationship between twovariables.
BUS 230: Business Research and Communication Univariate and Bivariate Tests
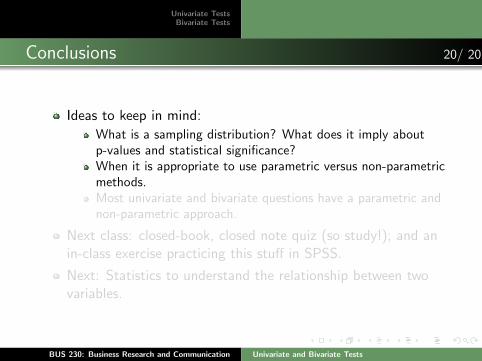
Univariate TestsBivariate Tests
Conclusions 20/ 20
Ideas to keep in mind:
What is a sampling distribution? What does it imply aboutp-values and statistical significance?When it is appropriate to use parametric versus non-parametricmethods.Most univariate and bivariate questions have a parametric andnon-parametric approach.
Next class: closed-book, closed note quiz (so study!); and anin-class exercise practicing this stuff in SPSS.
Next: Statistics to understand the relationship between twovariables.
BUS 230: Business Research and Communication Univariate and Bivariate Tests
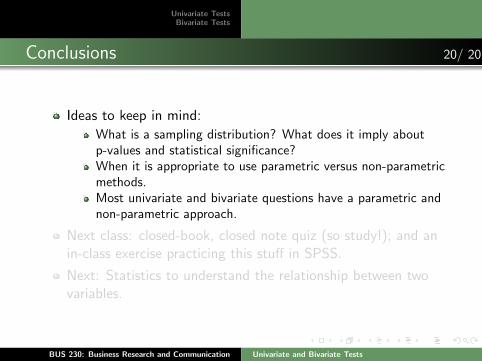
Univariate TestsBivariate Tests
Conclusions 20/ 20
Ideas to keep in mind:
What is a sampling distribution? What does it imply aboutp-values and statistical significance?When it is appropriate to use parametric versus non-parametricmethods.Most univariate and bivariate questions have a parametric andnon-parametric approach.
Next class: closed-book, closed note quiz (so study!); and anin-class exercise practicing this stuff in SPSS.
Next: Statistics to understand the relationship between twovariables.
BUS 230: Business Research and Communication Univariate and Bivariate Tests