Embed Size (px)
Citation preview
American Journal of Medical Genetics 23:775-792 (1986)
Univariate and Bivariate Analyses of Cholesterol and Triglyceride Levels in Pedigrees
Michael Boehnke, Patricia P. Moll, Kenneth Lange, William H. Weidman, and Bruce A. Kottke
Departments of Biostatistics (M.B.), Epidemiology (P. P. M.), and Human Genetics (P.P. M), University of Michigan, Ann Arbor; Department of Biomathematics, University of California, Los Angeles (K. L.); Mayo Clinic and Mayo Foundation, Rochester, Minnesota (W. H. W., B.A. K.)
A multivariate normal model for pedigree analysis is applied to fasting total serum cholesterol and total serum triglyceride tneasurements on 77 I individuals in 95 pedigrees from Rochester, M N . Univariate and bivariate analyses are carried out to determine to what extent the aggregation and coaggregation in families of these two traits may be attributed to shared genetic and environmental factors. Pedigrees were ascertained through a sample of schoolchildren enriched for those with serum cholesterol levels in the highest and lowest deciles of their age- and sex- specific distributions. Ascertainment is corrected for by conditioning the likeli- hood on the trait values of the probands.
Univariate results confirm the findings of previous studies indicating that familial aggregation of serum cholcsterol and triglyceride levels is due both to shared genes and to shared environmental factors. Results of the bivariate analyses suggest that the coaggregation of cholesterol and triglyceride levels in these families is strongly influenced by both shared genes (pleiotropy) and shared environmental factors. These findings are consistent with our understanding of lipid metabolism and of specific environmental factors known to influence both traits.
Key words: seruni cholesterol, serum triglyceride, variance components, bivariate analysis, pedi- grees, maximum likelihood
Received for publication January 15, 1985; revision received May 23, 1985.
Address reprint requests to Michael Boehnke, PhD. Department of Biostatistics, School of Public Health. University of Michigan, Ann Arbor, MI 48109.
0 1986 Alan R. Liss, Inc.
776 Boehnke et a1
INTRODUCTION
The degree to which shared genes and shared environmental factors intluence the familial aggregation of fasting serum cholesterol and fasting serum triglyceride levels has received a great deal of attention in recent years because of the importance of these variables as measures of lipid metabolism and as risk factors in atheroscle- rosis [Robertson. 19811. Family studies suggest that the familial aggregation of these traits is under the control of both genes and shared environmental factors, with genes relativrlv tnore important in determining cholesterol levels, and shared environmental factors more important for triglyceride levels [Sing and Orr, 1978; Rao et al, 1979: Iselius, 1979; Rao et al, 19821.
Cholesterol and triglyceride levels are significantly correlated within individuals in the general population in adults and children [Connor et al, 19821. Here we ask to what degree can the correlation between the two traits be ascribed to the effects of common genes and common environmental factors'? That is. do some of the genes and environmental factors that influence cholesterol levels also influence triglyceride levels? Studying the coaggregation of these traits in families provides the means to address these questions.
Other investigators have approached problems of bivariate genetic analysis by discriminant analysis [Namboodiri et al, 1975; Goldin et al, 19801. factor analysis [Martin and Eaves, 1977: Morton et al, 19781, and path analysis [Moll et al, 1978; Dal Colletto et al, 1981; Hanis, 1981; Darlu et al, 1982: Hanis et al, 1983: McGue el al. 1983: McGue, 1983; Vogler, 1985; Vogler and DeFries, 1985). Here we analyze a sample of 3-generation pedigree data from Rochester, Minnesota. While in medical genetics pedigree usually refers to the diagram expressing the genetic relationships among individuals, here we use pedigree to describe a multigeneration family. We apply a multivariate normal form of the multifactorial model [Lange et al, 1976: Lange and Boehnke, 19831. While this form of the model has seen wide application to univariate data [Spence et at, 1977; Moll et al, 1979; Annest et al, 1979; Beaty and Fajans. 1982; Rotter et al, 1982: Annest et al, 1983; Moll et al, 1983: Beaty et al, 19831, this paper presents its first application to bivariate data.
The multifactorial model assumes cholesterol and triglyceride levels are deter- mined by the summed effects of many genes, each of small effect (polygenes), and a variety of environmental factors which may be shared by sets of pedigree members or be specific to each individual. Separate univariate pedigree analyses of cholesterol and triglyceride levels allow us to apportion the variability of each of the traits into components due to genes, environmental factors shared by pedigree members, and environmental factors specific to individuals. Subsequent bivariate pedigree analysis of cholesterol and triglyceride levels jointly allow us to apportion the covariability of the two traits into these various components.
MATERIALS AND METHODS Sample
As part of a Pediatric Specialized Center of Research (SCOR) project, a cross- sectional survey of adult risk factors for atherosclerosis was carried out in 3,666 school children from Rochester, Minnesota, in 1973 and 1974. After the serum cholesterol data were collected on the school children, a 3% subsample was selected
Cholesterols and Triglycerides in Pedigrees 777
on the basis of the deviations of the children from the mean for their age and sex. The sample was enriched for the upper tail of the distribution with approximately 40% randomly selected from the highest decile, 40% randomly selected from the middle 8 deciles, and 20% randomly selected from the lowest decile. Medical records were reviewed and school children with illness, those receiving medications that could secondarily affect serum lipid levels, and adoptees were excluded. The remain- ing eligible 100 white children ranging in age from 6 to 16 yr, were selected as probands. Two of these children were sibs; 1 of the 2 was randomly chosen to be excluded as a proband. Another proband had extreme hypertriglyceridemia ( 1,333 mg/dl) and was excluded. Three additional probands identified three separate pedi- grees shown by complex segregation analysis to be segregating at a major locus for hypercholesterolemia [Moll et al, 19841. When these three pedigrees were included in our analyses, a pedigree test statistic approach [Hopper and Mathews, 1982; Boehnke, 1983; Boehnke and Lange, 19841 suggested that their cholesterol data were not consistent with the multifactorial model, providing additional evidence for segre- gation at a major locus for cholesterol in those pedigrees. Since the multifactorial model does not allow for major locus effects, the pedigrees of these probands were excluded from subsequent analyses. Thus, the population of inference for this study excludes those rare individuals who exhibit high cholesterol values owing to segre- gation at a major locus for cholesterol.
The remaining 95 probands included 38 in the highest decile for total serum cholesterol for their age and sex, 20 in the lowest decile, and 37 in the middle 8 deciles. Fasting serum cholesterol and triglyceride measurements were made on the 95 probands and 676 of their biological relatives: 225 grandparents, 187 parents, and 264 full sibs. The number of pedigree members with measurements for both choles- terol and triglyceride ranged from 4 to 14, with a median of 8.
Measurements of plasma cholesterol and triglyceride levels were made after an overnight fast. Specific laboratory methods are described by Ellefson et al [1978]. Precision of the measurements was ensured by the participation of the Mayo Clinic SCOR Lipid Laboratory in the Center for Disease Control Cooperative Lipid Stand- ardization Program.
Model Pedigree data were analyzed under the multifactorial model using the multivar-
iate normal approach described by Lange et a1 [ 19761 and Lange and Boehnke [ 19831. The model assumes that the trait(s) are the result of the summed effects of many genes, each of small effect (polygenes), together with the effects of a variety of environmental factors either shared by sets of pedigree members or specific to each individual. We further assume random mating, Hardy-Weinberg and linkage equilib- rium, additivity both within and between loci (that is, no genetic dominance and no epistasis), and no genotype-environment interaction.
Following Lange et a1 [ 1976, 19831, we assume that a pair of quantitative traits (in our case, cholesterol and triglyceride levels) are measured on n members of a pedigree, giving pedigree trait vectors X = (XI ,..., XJ' and -~ Y = (Y , ,..., YJt, respectively. Here, superscript t represents vector or matrix transpose. We assume that after adjustment for the effects of concomitants (such as age and sex), the pedigree trait vector (X or in the univariate case, Z = (X ],. . . ,X,,Y ,, . . . ,YJt in the bivariate case) follows a multivariate normal distribution with mean vector zero and covariance

778 Boehnke et al
matrix described below. The covariance matrix depends on the relationships between the pedigree members and on the genetic and environmental factors included in the model. Theoretical justification for the assumption of multivariate norniality has been given by Lange [Lange, 1978; Lange and Boehnke, 19831. This assumption allows us to deal with complete pedigrees rather than only pairs of relatives as in the alternative approach of path analysis (Wright, 1921; Li, 19751.
Here, we assume that variability in cholesterol and triglyceridc levels is due to the summed effects of additive polygenes, environmental factors shared by members of the same household, of the same sibship, and of the same spouse pair. and an environmental factor specific to each individual which may also retlect measurement error. Under these assumptions, the n x n covariance matrix for cholesterol is
fix, = u,,, 2 @ + u,,,S + u~,,H + uPXxP + uexxl.
u: , ,~ is the additive genetic variance, u,,, the shared sibship environinental variance. Uhxx the shared household environmental variance, apxx the shared spouse environ- mental variance. and ucxx the individual-specific environmental variance for choles- terol. 2@, S. H, P, and I are the n X n known covariance matrices representing the theoretical correlations between the pedigree members for each of the factors consid- ered. Under this scheme, the cholesterol total variance for any pedigree member is aary. + ohXX + ahxx + all,: + a,,,. Analogous expressions hold for the covariance matrix and the within-individual total variance for triglyceride (y), with the subscript yy replacing the subscript xx.
'1 I1 1
'0 c 0 c c 0 0 0 11 I0 0 0 0 C C C C I1
P I
Fig. 1. Covariance matrices for the given pedigree corresponding to shared sibship (S). shared household ( H ) , shared spouse (P). and individual-specific (1) cnvironmcnts. Note: since thcsc malriccs arc syrnmctric, only the lower triangles are given.
Cholesterols and Triglycerides in Pedigrees 779
For the additive genetic variance, the covariance matrix is 2@, twice the kinship matrix. The kinship matrix has ijth entry equal to the kinship coefficient of individuals i and j (that is, the probability that genes drawn at random from the same locus from i and J are identical by descent [Malecot, 1969; Jacquard, 19741).
For each environmental factor, we partition the pedigree into disjoint and exhaustive blocks [Lange and Boehnke, 19831. Given a partition of the pedigree, we assume that all individuals within the same block are exposed to the same environ- ment, and that environmental contributions to the several blocks are independent and identically distributed. The corresponding covariance matrices have ijth element equal to 1 if individuals i and j are in the same block, and 0 if they are in different blocks. Figure 1 illustrates the partitioning of a representative 3-generation pedigree into blocks appropriate for the environmental factors considered in our application to cholesterol and triglyceride levels by defining the matrices S, H, P, and I. Note that the partitions corresponding to S and P both represent subpartitions of the partition corresponding to H. Since all the sibs in each pedigree in this study were living together at the time of data collection, shared sibship environmental effects could not be separated in our analyses from genetic dominance. Therefore, when we conclude below that shared sibship environmental effects are important for these traits, the possibility that the effect is at least partly due to genetic dominance cannot be ruled out. Similarly, in a cross-sectional study with no information on duration of cohabi- tation or marriage, the possible effects of shared spouse environmental factors can not be distinguished from assortative mating. More subtle environmental parameteri- zations, taking into account the cohabitation history of pedigree members, are possible [Hopper and Mathews, 1982; Hopper and Mathews, 1983; Hopper and Culross, 1983; Lange, 198.51.
In the bivariate case, we again consider variance components and corresponding covariance matrices for cholesterol and triglyceride separately. In addition, we now model the between-trait cross covariances. That is, we allow not only for the possi- bility that the cholesterol and triglyceride measurements for two pedigree members may be correlated, but also for the possibility that the cholesterol measurement of one pedigree member may be correlated with the triglyceride measurement of the other.
For bivariate data, it is convenient to describe the covariance matrix Q of the trait vector z = (X, ,..., X,,Y, ,..., Yn)t using partitioned matrices [Rao, 19731. With assumptions as before,
Qxx and Qyy are n X n matrices of the same form as the univariate covariance matrices for cholesterol and triglyceride, respectively. Qxy = Qyx are identical n x n symmetric matrices of the same linear form as Qxx and fly,, except that here the known covariance matrices are multiplied by covariance components rather than variance components. That is,
where urxy is an unknown covariance component ( r = a,s,h,p,e). The choice of fix> = fiyx corresponds to the assumption that the expected covariance between the
780 Boehnke et a1
cholesterol value Xi for individual i and the triglyceride value Y, for individual j should equal the expected covariance between Xj and Yi. Again, the within-individual covariance between the two traits isjust a,,, + a,,, + ah,, + a,,, + a,,,.
A difficulty with using cross covariances is that the natural bounds on these parameters (namely, that they be in magnitude no greater than the square root of the product of the corresponding variance components) are of a complicated non-linear form. Therefore, we have chosen to reparameterize the model in terms of cross correlations, which must by definition lie between -1 and 1. Since the method of maximum likelihood is invariant to reparameterization [Cox and Hinkley, 19741, this choice does not affect our inferences. Parameterizing in terms of cross correlations is
where prxy is the corresponding cross correlation component. Details of this reparameteri- zation are given in Appendix 1.
Under the assumptions given, the natural logarithm of the pedigree likelihood for bivariate data may be written
carried out by replacing each covariance component u,,, by prxy a,,, I12
1 1 L = - ; log I Q I - r, z' Q - l z,
L L
where 1521 is the determinant of Q. For univariate data, we replace Z and Q in the above equation with X and fix, or Y and Q,,. For a sample of independent pedigrees, the loglikelihood of the sample is the sum of the pedigree loglikelihoods. Maximizing the loglikelihood permits maximum likelihood parameter estimation and testing of hypotheses under the likelihood ratio criterion.
Loglikelihoods were maximized using a variable metric maximization routine written by Kenneth Lange and based on a paper by Powell (19781. Convergence of the maximization process was tested using a convergence criterion tirst suggested by Hopper and Mathews [1982], and generalized by us in Appendix 2. Approximate standard errors (SE) were obtained by inversion of minus the matrix of numerically- calculated second partial derivatives evaluated at the maximum likelihood parameter estimates.
Ascertainment Correction
When pedigrees are ascertained through probands, it is important to correct for the sampling procedure. To this end, Hopper and Mathews [ 19821 suggested condi- tioning on the trait values of the probands [Cannings and Thompson. 19771 for this multivariate normal form of the multifactorial model. Since ascertainment of our pedigrees was nearly single, with only one pedigree ascertained through as many as two probands, we chose to condition on the probands' trait values as means of ascertainment correction. Conditioning on the trait value of the probands requires only that we replace the (unconditional) multivariate normal loglikelihood (1) with the conditional multivariate normal loglikelihood of the non-proband trait values given the proband trait value [Hopper and Mathews, 1982; Boehnke, 1983; Appendix 11.
RESULTS
The mean total cholesterol and triglyceride levels among the 676 relatives of the 95 probands were 205.5 mg/dl (SD = 51.1 mg/dl) and 107.6 mg/dl (SD = 69.7 mg/dl), respectively. The within-individual correlation between cholesterol and tri-
Cholesterols and Triglycerides in Pedigrees 781
glyceride values was .47S in the relatives, .27S in probands, and .476 overall. Prior to fitting the multifactorial model, the cholesterol and triglyceride measurements on the relatives and probands were transformed to univariate normality by an inverse normal scores transformation [Daniel and Wood, I97 I ] . While transformation to univariate normality in no way guarantees multivariate normality for the pedigree trait vectors, it is a reasonable step in that direction. Transformation to multivariate normality is not feasible. We normalized the data prior to regression on concomitants (see below) because of the significant skewness and kurtosis in the raw data.
Normalized lipid measurements for the relatives were regressed on the best- fitting cubic polynomial of age separately for men, women, and women using oral contraceptives. Reduction in variance due to regression was 36%, 46%, and 41 % for men, women, and women using oral contraceptives, respectively for cholesterol, and 35 % , 33 % , and 5 % in the same groups for triglycerides. Normalized proband values were then adjusted using the same regression equations. The correlation between transformed values was .370 in the relatives, .300 in the probands, and .3SS overall. After normalization and regression, trait means and variances were not significantly heterogeneous between sexes or across 10-yr age strata. The within-individual trait correlation between transformed cholesterol and transformed triglyceride was not significantly heterogeneous between sexes; it was marginally heterogeneous across age strata (x’ = 14.30, df = 7, p = .OS, (Rao, 1973]), but showed no particular trend with age. Skewness and kurtosis for transformed cholesterol and triglyceride were not significant at the .05 level, whether or not the probands were included.
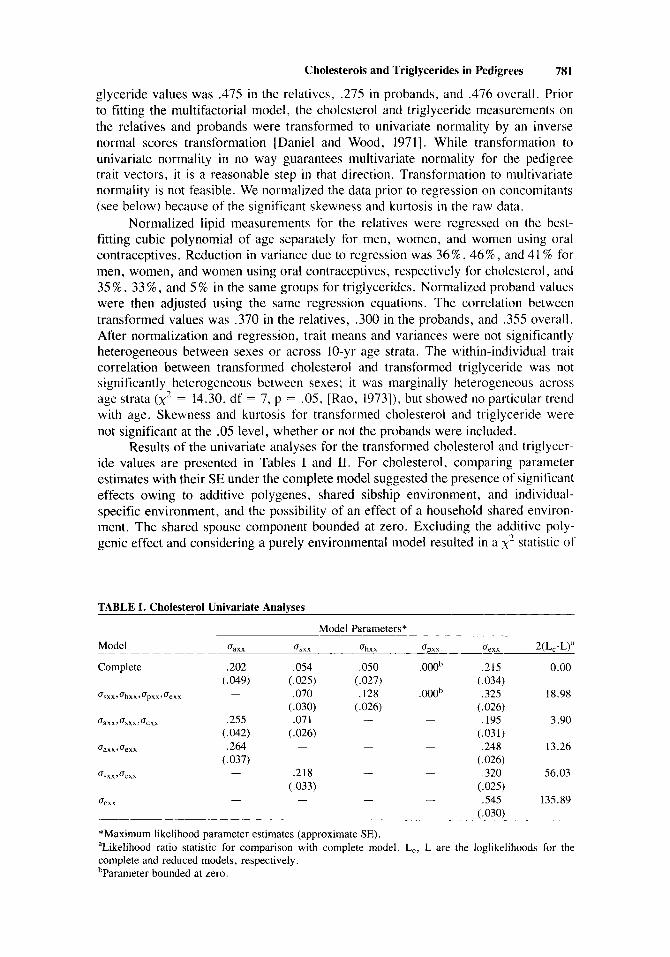
Results of the univariate analyses for the transformed cholesterol and triglycer- ide values are presented in Tables I and 11. For cholesterol, comparing parameter estimates with their SE under the complete model suggested the presence of significant effects owing to additive polygenes, shared sibship environment, and individual- specific environment, and the possibility of an effect of a household shared environ- ment. The shared spouse component bounded at zero. Excluding the additive poly- genic effect and considering a purely environmental model resulted in a x 2 statistic of
TABLE I. Cholesterol Univariate Analyses
Model Parameters* Model ‘Jaxx ‘Jsxx ‘Jhxx ‘Jpxx ‘Jexx 2(L,-L)”
Complete ,202 ,054 ,050 . oooh ,215 0.00 ( ,049) (.025) (.027) (.034)
(.030) (.026) (.026)
(.042) (.026) (.031)
(.037) (.026)
(.033) (.025)
(.030)
‘Jsxx 3 ‘Jhxx, ‘Jpxx, ‘Jeexx - ,070 ,128 . OOOb ,325 18.98
‘Jaxx 3 ‘J,xx ,‘Jexx .255 ,071 - - ,195 3.90
- - ,248 13.26
‘Jsxx,‘Jexx - ,218 - - ,320 56.03
- - - .545 135.89
.264 - ‘Jam 3‘Jexx
- ‘Jeexx
‘Maximum likelihood parameter estimates (approximate SE). “Likelihood ratio statistic for comparison with complete model. L,, L are the loglikelihoods for the complete and reduced models, respectively. ’Parameter bounded at zero.
782 Boehnke et a1
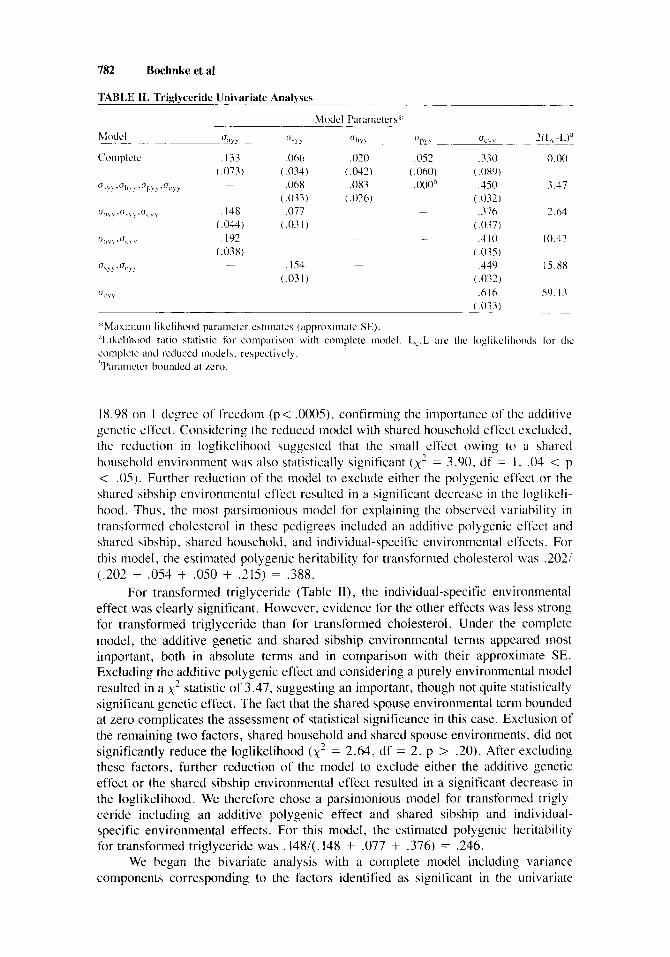
-~ TABLE 11. Triglyceride Univariate Analyses
,052 .330 0.00 (.060) ( .OXY j .ooo” ,450 3.17
( . 032) - ,376 2.64
( .037) - ,410 10.42
(.035 j ,449 15.88
i .032 j .6 I6 59. I3
( . 033)
*Max imum likelihood parameter cstiinatcs (appi-oxiiiiatc SE). “Likelihood ratio statistic for comparison with complete model. L,,L are the loglikclihoods for the complete and reduced models. respectively. hPcarametcr hounded at zero.
18.98 on 1 degree of freedom (p < .0005), confirming the importance of the additive genetic effect. Considering the reduced model with shared household effect excluded. the reduction in loglikelihood suggested that the small effect owing to a shared household environment was also statistically significant (x’ = 3.90, df = I , .04 < p < .OS). Further reduction of the model to exclude either the polygenic effect or the shared sibship environmental effect resulted in a significant decrease in the loglikeli- hood. Thus, the most parsimonious model for explaining the observed variability in transformed cholesterol in these pedigrees included an additive polygenic effect and shared sibship, shared household, and individual-specific environmental effects. For this model, the estimated polygenic heritability for transformed cholesterol was ,2021 (.202 + ,054 + ,050 + .21S) = .388.
For transformed triglyceride (Table 11), the individual-specific environmental effect was clearly significant. However, evidence for the other effects was less strong for transformed triglyceride than for transformed cholesterol. Under the complete model, the additive genetic and shared sibship environmental terms appeared most important, both in absolute terms and in comparison with their approximate SE. Excluding the additive polygenic effect and considering a purely environmental model resulted in a x 2 statistic of 3.47, suggesting an important, though not quite statistically significant genetic effect. The fact that the shared spouse environmental term bounded at zero complicates the assessment of statistical significance in this case. Exclusion of the remaining two factors, shared household and shared spouse environments, did not significantly reduce the loglikelihood (x’ = 2.64, df = 2, p > .20). After excluding these factors, further reduction of the model to exclude either the additive genetic effect or the shared sibship environmental effect resulted in a significant decrease in the loglikelihood. We therefore chose a parsimonious model for transformed trigly- ceride including an additive polygenic effect and shared sibship and individual- specific environmental effects. For this model, the estimated polygenic heritability for transformed triglyceride was .148/(. 148 + ,077 + ,376) = .246.
We began the bivariate analysis with a complete model including variance components corresponding to the factors identified as significant in the univariate
Cholesterols and Triglycerides in Pedigrees 783
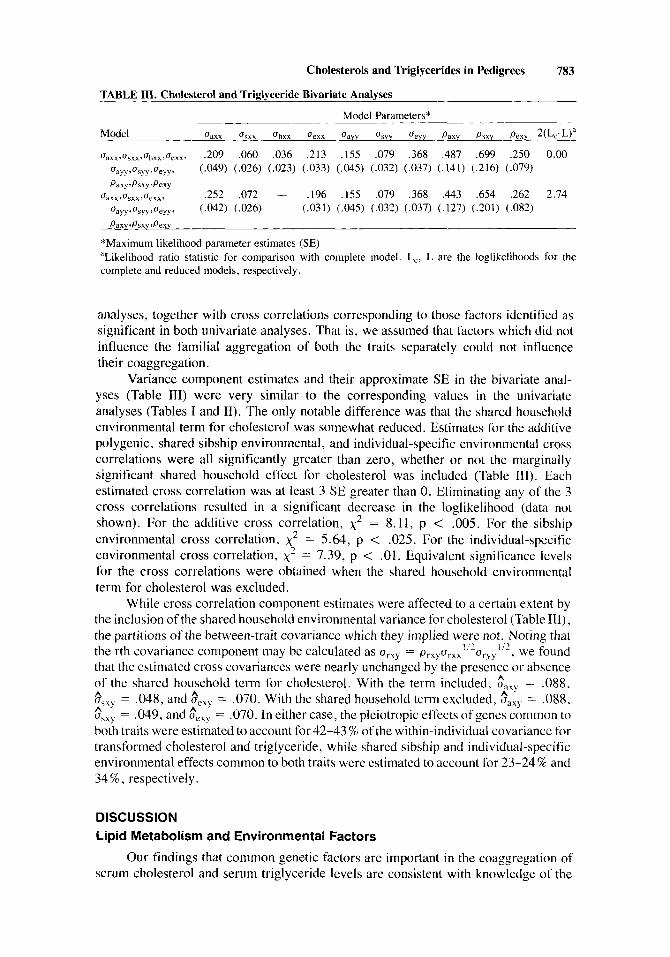
TABLE 111. Cholesterol and Triglyceride Bivariate Analyses
Model Parameters*
Model uzxx csxx uhxx ucxx Gay, c b u Ueyy Paxy PIXY Pexy 2(Lc-L)a
u~~~,~,~~,u~~~,u~.~, ,209 ,060 ,036 ,213 ,155 ,079 ,368 ,487 ,699 ,250 0.00 uayy,usyy,uecyy, (.049) (.026) (.023) (.033) (.045) (.032) (.037) (.141) (.216) (.079) Paxy rPsxy 3Pexy
oaxx, ‘Jsxx,ueexx. ,252 ,072 - ,196 .155 ,079 ,368 ,443 .654 ,262 2.74 ~ a y y ~ u s y y r u e y y r (,042) (.026) (.031) (.045) (.032) (.037) (.127) (.201) (.082) Paxv 9 P s x y JJexv
*Maximurn likelihood parameter estimates (SE) “Likelihood ratio statistic for comparison with complete model. Lc, L are the loglikelihoods for the complete and reduced models, respectively.
analyses, together with cross correlations corresponding to those factors identified as significant in both univariate analyses. That is, we assumed that factors which did not influence the familial aggregation of both the traits separately could not influence their coaggregation.
Variance component estimates and their approximate SE in the bivariate anal- yses (Table 111) were very similar to the corresponding values in the univariate analyses (Tables I and 11). The only notable difference was that the shared household environmental term for cholesterol was somewhat reduced. Estimates for the additive polygenic, shared sibship environmental, and individual-specific environmental cross correlations were all significantly greater than zero, whether or not the marginally significant shared household effect for cholesterol was included (Table 111). Each estimated cross correlation was at least 3 SE greater than 0. Eliminating any of the 3 cross correlations resulted in a significant decrease in the loglikelihood (data not shown). For the additive cross correlation, x2 = 8.11, p < .005. For the sibship environmental cross correlation, x2 = 5.64, p < .025. For the individual-specific environmental cross correlation, x2 = 7.39, p < .01. Equivalent significance levels for the cross correlations were obtained when the shared household environmental term for cholesterol was excluded.
While cross correlation component estimates were affected to a certain extent by the inclusion of the shared household environmental variance for cholesterol (Table HI), the partitions of the between-trait covariance which they implied were not. Noting that the rth covariance component may be calculated as urXy = prxyurxx’i2uryy”2, we found that the estimated cross covariances were nearly unchanged by the presence or absence of the shared household term for cholesterol. With the term included, Gaxr = .088,
= ,048, and $cxy = .070. With the shared household term excluded, saxy = .088, flSxy = ,049, and o“,,, = .070. In either case, the pleiotropic effects of genes common to both traits were estimated to account for 42-43 % of the within-individual covariance for transformed cholesterol and triglyceride, while shared sibship and individual-specific environmental effects common to both traits were estimated to account for 23-24% and 34 % , respectively.
A p Y
DISCUSSION Lipid Metabolism and Environmental Factors
Our findings that common genetic factors are important in the coaggregation of serum cholesterol and serum triglyceride levels are consistent with knowledge of the
784 Boehnke et a1
metabolism of these plasma lipids. Chylomicrons and very low density lipoprotein (VLDL) particles carry most of the triglyceride transported in plasma and moderate amounts of cholesterol. Most low density lipoprotein (LDL) particles are end products of VLDL catabolism and carry approximately 70% of plasma cholesterol in normal individuals. Direct secretion of LDL by the liver may also occur. It is not known how much cholesterol enters the circulation on chylomicrons and VLDL and how much cholesterol is attached to LDL in the plasma through the actions of the plasma enzyme lecithin cholesterol acetyltransferase (LCAT) and the cholesterol exchange protein.
Given the complexity of lipid metabolism, it is reasonable to hypothesize that many genes with small effects are involved, and that at least some of these genes affect both cholesterol and triglyceride levels. Population studies have reported associations between small differences in cholesterol levels and certain polymorphic loci, notably ABO and secretor [Sing and Orr, 19761. Individuals with blood group A or AB individuals appear to have higher rates of type I1 hyperlipidemia (elevated LDL), while individuals with blood group B or 0 have higher rates of type'IV hyperlipidemia (elevated VLDL) [Morton, 19761.
Similarly, a number of environmental factors, including cigarette smoking and dietary and exercise habits, are known to affect one or both of these serum lipid levels in the adult population. Variability in carbohydrate, alcohol, and overall caloric intake, and in body weight are known to be associated with variability in triglyceride levels [Hartung et al, 19801. Reduced intake of saturated fats and increased intake of polyunsaturated fats are associated with lower levels of both cholesterol and trigly- ceride [Ernst and Levy. 19801. It appears that exercise levels can exert a strong effect on triglyceride levels, and a lesser effect on cholesterol levels [Hartung et al, 19801. In addition, cholesterol and particularly triglyceride levels are subject to a certain amount of within-individual variability [Jacobs and Barrett-Connor. 19821. These and other environmental factors may be contributing to the individual-specific and shared environmental effects noted in the univariate and bivariate analyses.
Ascertainment
Cannings and Thompson [ 19771 demonstrated that conditioning on probands provides an appropriate ascertainment correction when ascertainment is single. Hop- per and Mathews [I9821 pointed out that this ascertainment correction could be applied to the multivariate normal form of the multifactorial model. While condition- ing on probands has been applied in segregation analysis, its application to the multifactorial model to date had been limited to simulated data [Boehnke, 1983; Boehnke and Lange, 19841. Typically, data analysis under the multifactorial model has assumed random sampling even if the data were non-randomly ascertained [Rao et al, 1979; Beaty and Fajans, 19821, Ascertainment correction in path analysis has only recently been considered [Hanis and Chakraborty, 19841.
Previously, we carried out a simulation study in which pedigree data were generated and analyzed under the multivariate normal form of the multifactorial model after ascertainment through the upper 5% of the distribution [Boehnke, 1983; Boehnke and Lange, 19841. In that simulation, analysis of ascertained pedigrees by conditioning on probands consistently resulted in underestimates of the additive genetic variance, with corresponding increase in the individual-specific environmental variance, even when ascertainment was single. These biases may have arisen owing to the difficulty of finding a suitable transformation of the ascertained data to approximate multivariate normality [Hanis and Chakraborty, 19841. We were con-

Cholesterols and Triglycerides in Pedigrees 785
cerned that the results of the current analyses might be similarly biased. Several facts argue that this was not the case.
First, ascertainment of the current data set was not through a single tail of the distribution. While ascertainment did result in a sample enriched for probands from the highest and lowest age- and sex-specific deciles, probands came from the entire range of the distribution. Second, the results of our univariate analyses were quite comparable to the results of other studies in which pairs of relatives or families were randomly sampled [Sing and Orr, 1978; Iselius, 1979; Rao et al, 19821.
Third, our results were only slightly affected when two alternative approaches to dealing with ascertainment were employed. Our alternatives were to either 1) exclude the probands from the data and, after normalization and regression, analyze the pedigrees as if randomly sampled, or 2) ignore ascertainment, include the pro- bands, and again, after normalization and regression, analyze the pedigrees as if randomly sampled. For cholesterol, excluding the probands generally resulted in slightly smaller estimates of the additive genetic effect and the shared sibship and shared household environmental effects, and slightly larger values for the individual- specific and shared spouse environmental effects, in comparison with conditioning on probands. Ignoring ascertainment had the reverse effect. The only difference in inference was that without the probands, the shared household effect for cholesterol dropped below the level of statistical significance. For triglyceride, differences were negligible. In the bivariate analyses, ignoring ascertainment gave equivalent results to conditioning on probands. Excluding the probands removed the evidence for a significant shared sibship cross correlation. This might reflect an important difference in the two data sets since the probands were not representative of the pedigree as a whole; a more likely alternative is that it simply reflects the few sib pairs present in the data when the 95 probands, of the total of 264 + 95 = 359 sibs in 95 pedigrees, were excluded.
Previous Studies
Our approach to bivariate modeling assumes that the covariability of cholesterol and triglyceride is due to common genetic and environmental factors. This approach corresponds to the path analytic approaches of Dal Colletto et al [ 19811 and McGue [1983]. Dal Colletto et a1 [ I98 I ] analyzed cholesterol, triglyceride, and lipoprotein fraction measurements on 105 healthy twin pairs in Brazil. They reported a significant genetic cross correlation for cholesterol and triglyceride. However, they failed to allow for the possibility of an individual-specific environmental cross correlation. It seems probable a priori that such an effect would exist: by excluding this effect, the genetic effect was very likely overestimated. In addition, Dal Colletto et al estimated that heritability was .700 for cholesterol and .803 for triglyceride. Both these values, particularly that for triglyceride, are uncommonly high. These facts make their results difficult to interpret.
McGue [ 19831 analyzed cholesterol and triglyceride data in 160 randomly sampled nuclear families, some ascertained through juvenile, others through adult offspring. He found that a common environmental effect was required to explain the coaggregation of cholesterol and triglyceride levels in the families, and that either a genetic or an individual-specific environmental cross correlation was required as well; however, he could not distinguish between the two. While his parameterization of common environmental effects is not directly comparable to ours, his results appear similar, though less definitive. Several reasons could account for this differ-
786 Boehnke et a1
ence in resolution. First, our sample was somewhat larger, 95 probands and 676 relatives as compared to roughly 530 relatives in his study. Second, our 3-generation pedigrees will have provided more contrasts in the data than given by his nuclear families. Third, since the method of maximum likelihood is statistically efficient [Cox and Hinkley, 19741, employing a maximum likelihood approach on complete pedi- grees will have provided greater information for the analysis than could be provided by summarizing data by correlations and then analyzing those correlations as in path analysis. Empirical support for this theoretical statement is provided by Moll and Sing I 19791 and Annest et a1 [ 19791.
An alternative path analytic approach to bivariate modeling was described by tianis (Hanis, 1981; Hank et al, 19831 and applied to weight and blood pressure. Their approach assumes that one trait directly affects the other at the phenotypic level. Their regression approach, while in some ways more general than our model, requires longitudinal data; even with longitudinal data, not all effects may be jointly estimable [Hanis, 1981; Hank et al, 19831.
CONCLUSION
The results of our bivariate analyses suggest that the covariability of cholesterol and triglyceride levels within individuals may be ascribed to (1) the pleiotropic effects of common genes, (2) the common effects of environmental factors shared by sibs, and (3) the common effects of environmental factors specific to the individual. Thus, while human geneticists tend to think of pleiotropy in terms of major loci, here is an example of polygenes with pleiotropic effects on cholesterol and triglyceride levels. We conclude that the factors, genetic and environmental, that determine cholesterol variability are not independent of the genetic and environmental factors that influence triglyceride variability in our sample of pedigrees.
In the current study, we have analyzed data on 771 Caucasians from Rochester, MN. The recent work of the Collaborative Lipid Research Clinics [ 19841 provides an ideal opportunity to repeat this sort of analysis on a much larger data set representing many areas of North America. It would be interesting to determine whether results similar to those of the current study would be obtained in this much larger and more representative population.
ACKNOWLEDGMENTS
We thank Dr. Charles Sing for helpful suggestions and criticisms in the course of this work, and Drs. Ralph Ellefson and Hymie Gordon from the Mayo Clinic for their contributions to this study. We also thank Mrs. Patrice Somerville for expert manuscript preparation. This research was supported in part by grants HL-24489 and AM-33329 and Research Career Development Award K04-HD00307 from the Na- tional Institute of Child Health and Human Development and by Department of Energy contract DEAC0282ER60089.
REFERENCES
Annest JL, Sing CF, Biron P, Mongeau JG (1979): Familial aggregation of blood pressure and weight in adoptive families. 11. Estimation of the relative contributions of genetic and common environ-
Cholesterols and Triglycerides in Pedigrees 787
mental factors to blood pressure correlations between family members. Am J Epidemiol I10:492- 503.
Anncst JL, Sing CF, Biron P, Mongcau JG (1983): Familial aggregation of blood pressure and weight in adoptive families. 111. Analysis of the roles of shared genes and shared household environment in explaining family resemblance for height, weight, and selected weightiheight indices. An1 J Epidemiol i 17:492-506.
Beaty TH, Fajans SS (1982): Estimating genetic and non-genetic components of variance for fasting glucose levels in pedigrees ascertained through non-insulin dependent diabetes. Ann Hum Genet
Beaty TH, Self SG, Chase GA, Kwiterovich PO (1983): Assessment of variance components models on pedigrees using cholesterol, low-density, and high-density lipoprotein measurements. Am J Med Genet 16:117-129.
Boehnke M (1983): Advances in pedigree analysis: Ascertainment, goodness of fit, and optimization. PhD dissertation, University of California, Los Angeles.
Boehnke M , Lange K (1984): Ascertainment and goodness of fit of variance component models for pedigree data. In Rao DC, Elston RC, Kuller LH, Fienleib M, Carter C , Havlik R (eds): “Genetic Epidemiology of Coronary Heart Disease.” New York: Alan R. Liss. Inc., pp 173-192.
Cannings C , Thompson EA (1977): Ascertainment in the sequential sampling of pedigrees. Clin Genet 12:208-212.
Connor SL, Connor WE, Sexton G , Calvin L, Bacon S (1982): The effects of age, body weight and family relationships on plasma lipoproteins and lipids in men, women, and children of randomly selected families. Circulation 65: 1290- 1298.
46:355-362.
Cox DR, Hinkley DV (1974): “Theoretical Statistics.” New York: Halstead Press, pp 287, 304. Dal Colletto GMD, Krieger H, Magalhaes JR (1981): Estimates of genetical and environmental deter-
minants of serum lipid and lipoprotein concentrations in Brazilian twins. Hum Hered 3 1:232- 237.
Daniel C, Wood FS (1971): “Fitting Equations to Data.” New York: John Wiley and Sons, pp 28-29. Darlu P. Rao I X , Hcnrotte JG, Laloucl JM (1982): Genetic regulation of plasma and red blood cell
magnesium concentrations in man. I . Univariate and bivariate path analyses. Am J Hum Genet
Ellefson RD, Elveback LR, Hodgson PA, Weidman WH (1978): Cholesterol and triglycerides in serum lipoproteins of young persons in Rochester, Minnesota. Mayo Clin Proc 53:307-320.
Ernst N , Levy RI (1980): Diet, hyperlipidemia and atherosclerosis. In Goodhart RS, Shils ME (eds): “Modern Nutrition in Health and Disease.” Philadelphia: Lea and Febiger, pp 1045- 1070.
Family Study Committees for the Lipid Research Clinics Program (1984): The collaborative Lipid Research Clinics program family study I. Study design and description of data. Am J Epidemiol
Goldin LR, Elston RC, Graham JB, Miller C H (1980): Genetic analysis of von Willebrand’s discase in two large pedigrees: A multivariate approach. Am J Med Genet 7:279-293.
Hank CL (1981): Multivariate models for human genetic analyses: Development and application to systolic blood pressure and weight. PhD dissertation, University of Michigan, Ann Arbor.
Hanis CL, Chakraborty R ( 1984): Non-random sampling in human genetics: Familial correlations. IMA J Math Appl Med Biol I : 193-213.
Hanis CL, Sing CF, Clarke WR. Schrott HG (1983): Multivariate models for human genetic analysis: Aggregation. coaggregation, and tracking of systolic blood pressure and weight. Am J Hum Genet 35: 1196-1210.
Hartung GH, Foreyt JP, Mitchell RE, Vlasck I, Gotto AM (1980): Relation of diet to high-density- lipoprotein cholesterol in middle-aged marathon runners, joggers, and inactive men. N Engl J Med 302:357-361.
Hopper JL, Culross PR (1983): Covariation between family members as a function of cohabitation history. Behav Genet 13:459-471.
Hopper JL, Mathews JD (1982): Extensions to multivariate normal models for pedigree analysis. Ann Hum Genet 46:373-383.
Hopper JL, Mathews JD (1983): Extensions to multivariate normal models for pedigree analysis. 11. Modeling the effect of shared environment in the analysis of variation in blood lead levels. Am J Epidemiol 117:344-355.
34:874-887.
1 19~93 1-943.
Iselius L (1979): Analysis of family resemblance for lipids and lipoproteins. Clin Genet 15:300-306. Jacobs DR. Barrett-Connor E (1982): Retest reliability of plasma cholesterol and triglyceride: The Lipid
Research Clinics prevalence study. Am J Epidemiol I16:878-885.
788 Boehnke et al
Jacquard A (1974): “The Genetic Structure of Populations.“ New York: Springer-Verlag, p 8. Lange K ( 1978): Central limit theorems for pedigrees. J Math Biol 6:59-66. Lange K ( 1985): Cohabitation, covergence. and environmental covariance. Submitted to Thco Pop Biol. Lange K, Boehnke M (1983): Extensions to pedigree analysis. IV. Covariance components models for
Lange K. Westlake J , Spence MA (1976): Extensions to pedigree analysis. 111. Variance components by
Li CC (1975): “Path Analysis-a Primer.” Pacific Grove, California: Boxwood Press. Malecot G (1969): “The Mathematics of Heredity.” San Francisco: W.H. Freeman, p 8. Martin NG. Eaves LJ (1977): The genetical analysis of covariance structure. Heredity 38:79-95. McGue M (1983): Bivariate path analysis of plasma lipids. Huni Hered 33: 145-152. McGue M , Rao DC, Reich T, Laskarzewski P, Gleuck CJ, Russell JM (1983): The Cincinnati lipid
research clinic family study. Bivariate path analyses of lipoprotein concentrations. Genet Rca Canib 42: 117-135.
Moll PP, Berry TD, Weidman WH, Ellefson R. Gordon H, Kottke BA (1984): Detection of genetic heterogeneity among pedigrees through complex segregation analy An application to hyper- cholesteroleniia. Am J Hum Genet 36: 197-21 1 .
Moll PP, Harburg E, Burns TL, Schork MA, Ozgoren F (1983): Heredity, stress and blood pressure, a family set approach: The Detroit project revisited. J Chron Dis 36:3 17-328.
Moll PP, Powsner R, Sing C F (1979): Analysis of genetic and environmental sources of variation in serum cholestcrol in Tecumseh, Michigan. V. Variance components estimated from pedigrees. Ann Hum Genet 42:343-354.
Moll PP. Sing C F (1979): Sampling strategies for the analysis of quantitative twits. In Sing CF. Skolnick M (eds): “Genetic Analysis of Common Diseases.” New York: Alan R. Liss. pp 307-342.
Moll PP. Sing CF. Brewer GJ, Gilroy TE (1978): Multivariate analysis of the genetic effects on red blood cell glycolysis. In Brewer G (ed): “The Red Cell.” New York: Alan R. Lias. pp 385-405.
Morton NE (1976): Genetic markers in atherosclerosis: A review. J Med Genet 13:81-95. Morton NE, Gulbrandsen CL, Rhoads GG, Kagan A. Lew R (1978): Major loci for lipoprotein
concentrations. Am J Hum Genet 30:583-589. Namboodiri KK. Elston RC. Glucck CJ, Fallat R, Buncher CR, Tsang R (1975): Bivariate analyses of
cholesterol and triglyceride levels in families in which probands have type Ilb lipoprotein phenotype. Am J Hum Genet 27:454-47 I .
Powell MJD (1978): A fast algorithm for nonlinearly constrained optimization calculations. In Dold A, Eckniann B (eds): “Numerical Analysis.” Berlin: Springer-Verlag. pp 144- 157.
Rao CR (1973): “Linear Statistical Inference and its Applications.” New York: John Wiley, pp 17. 32. 432-436. 522.
Rao DC, Lasharzewski PM, Morrison JA, Khoury P, Kelly K, Wctte R, Russell J. Glueck CJ (1982): The Cincinnati research clinic Family study: Cultural and biological determinants of lipids and lipoprotein concentrations. Am J Huni Genet 34:888-903.
Rao DC. Morton NE, Gulbrandsen CL, Rhoads GG. Kagen A. Yee S (1979): Cultural and biological determinants of lipoprotein concentrations. Ann Hum Genet 42:467-477.
Robertson FW (1981): The genetic component in coronary heart disease: A review. Genet Res Camb
Rotter J I , Wong FL, Samloff IM, Varis K , Siurala M, Ihaniaki T, Ellis A, McConnell RB (1982): Evidence for a major dominance component in the variation of seruni pepsinogen I levels. Am .l Hum Genet 34:395-401.
Sing CF, Orr JD ( 1976): Analysis of genetic and environmental sources of variation in serum cholesterol in Tecumseh, Michigan. 111. Identification of genetic cffects using 12 polymorphic genetic blood marker systems. Am J Hum Genet 28:453-464.
Sing CF, Orr JD (1978): Analysis of genetic and environmental sources of variation in serum cholesterol in Tecumsch, Michigan. IV. Separation of polygene from common environment effects. Am J Hum Genet 30:491-504.
Spence MA, Westlakc J, Lange K (1977): Estimation of the variance components for dermal ridgc count. Ann Hum Genet 41: I I 1-115.
Vogler G P (1985): Multivariate path analysis of familial resemblance. Genet Epidcmiol 2:35-53. Voglcr GP, DcFries JC (1985): Bivariate path analysis of familial reaeniblance for reading ability and
multivariate traits. Am J Med Genet 14: 513-524.
the scoring method. Ann Hum Genet 39:485-491.
37: 1-16.
Cholesterols and Triglycerides in Pedigrees 789
symbol processing speed. Behav Genet 15: 11 I - 12 I . Wright S (1921): Correlation and causation. Part I. Method of path coefficients. J Agr Res 20:557-585.
Edited by John M. Opitz and James F. Reynolds
APPENDIX 1 : PARAMETERIZATION USING CROSS CORRELATIONS
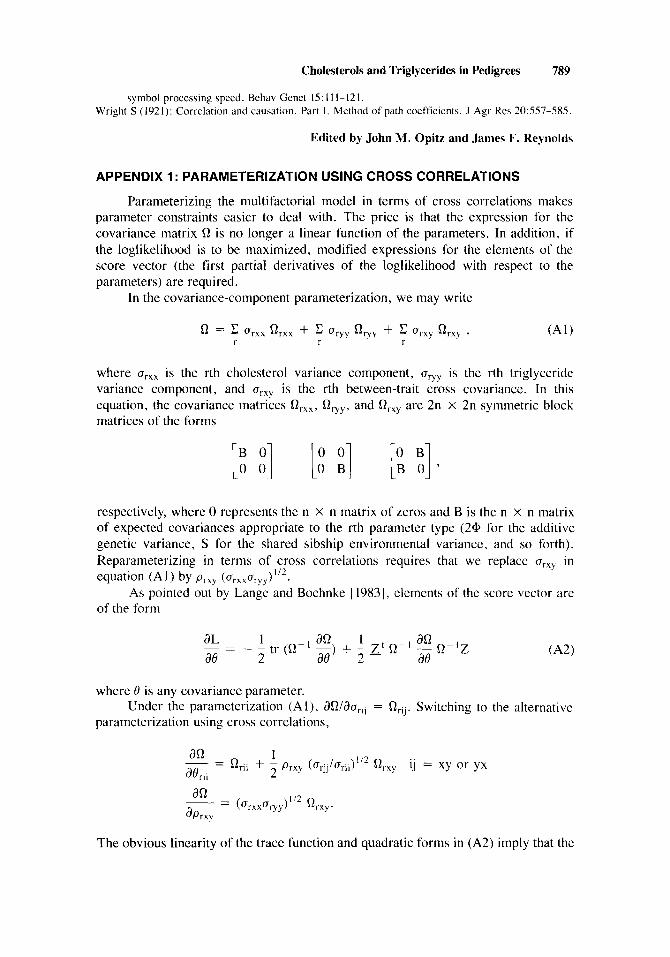
Parameterizing the multifactorial model in terms of cross correlations makes parameter constraints easier to deal with. The price is that the expression for the covariance matrix Q is no longer a linear function of the parameters. In addition, if the loglikelihood is to be maximized, modified expressions for the elements of the score vector (the first partial derivatives of the loglikelihood with respect to the parameters) are required.
In the covariance-component parameterization, we may write
where urxs is the rth cholesterol variance component, uryy is the rth triglyceride variance component, and urry is the rth between-trait cross covariance. In this equation, the covariance matrices Qrsx, Qryy, and Qrsy are 2n x 2n symmetric block matrices of the forms
respectively, where 0 represents the n x n matrix of zeros and B is the n x n matrix of expected covariances appropriate to the rth parameter type (2+ for the additive genetic variance, S for the shared sibship environmental variance, and so forth). Reparameterizing in terms of cross correlations requires that we replace grxb in
As pointed out by Lange and Boehnke [1983], elements of the score vector are
I i2 equation (A11 by P r x y (grxxgryy) .
of the form
where 0 is any covariance parameter.
parameterization using cross correlations, Under the parameterization (Al) , dQ/auri, = Qrij. Switching to the alternative
1 ~ = arii + - prxy (urj,/uri,>"' Qrxy ij = xy or yx aa
a e r i t 2
The obvious linearity of the trace function and quadratic forms in (A2) imply that the
790 Boehnke et a1
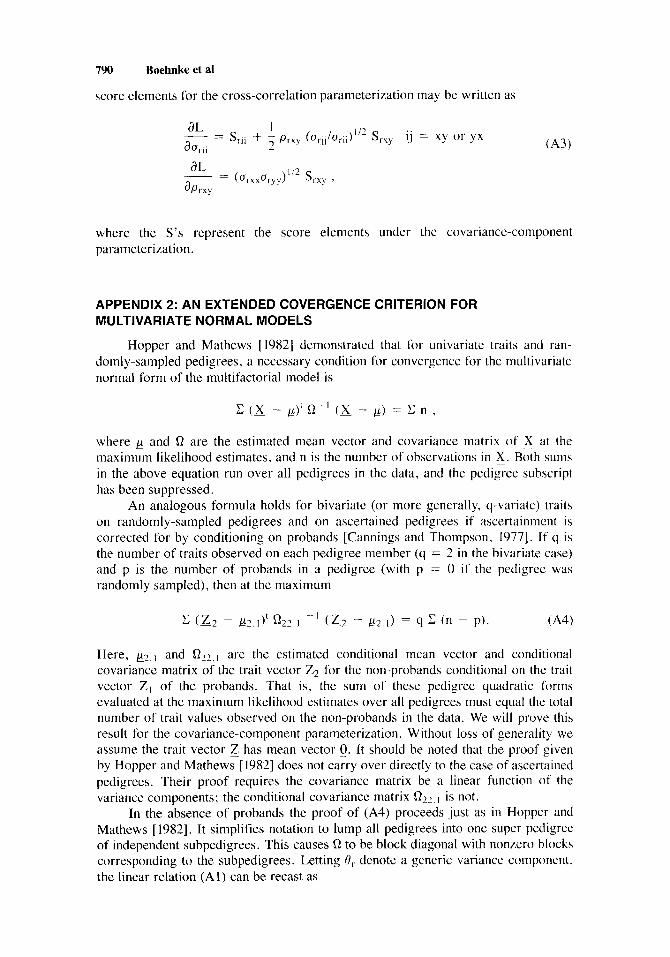
score elements for the cross-correlation parameterization may be written as
where the S’s represent the score elements under the covariance-component parameterization.
APPENDIX 2: AN EXTENDED COVERGENCE CRITERION FOR MULTIVARIATE NORMAL MODELS
Hopper and Mathews 119821 demonstrated that for univariate traits and ran- domly-sampled pedigrees, a necessary condition for convergence for the multivariate normal form of the multifactorial model is
where g and Q are the estimated mean vector and covariance matrix of X at the maximum likelihood estimates, and n is the number of’ observations in X. Both sums in the above equation run over all pedigrees in the data, and the pedigree subscript has been suppressed.
An analogous formula holds for bivariate (or more generally, q-variate) traits on randomly-sampled pedigrees and on ascertained pedigrees if ascertainment is corrected for by conditioning on probands [Cannings and Thompson, 19771. If q is the number of traits observed on each pedigree member (q = 2 in the bivariate case) and p is the number of probands in a pedigree (with p = 0 if the pedigree was randomly sampled), then at the maximum
Here, ~ 2 . 1 and are the estimated conditional mean vector and conditional covariance matrix of the trait vector Z 2 for the non-probands conditional on the trait vector Z I of the probands. That is, the sum of these pedigree quadratic forms evaluated at the maximum likelihood estimates over all pedigrees must equal the total number of trait values observed on the non-probands in the data. We will prove this result for the covariance-component parameterization. Without loss of generality we assume the trait vector Z has mean vector 0. It should be noted that the proof given by Hopper and Mathews [ 19821 does not carry over directly to the case of ascertained pedigrees. Their proof requires the covariance matrix be a linear function of the variance components; the conditional covariance matrix M22, I is not.
In the absence of probands the proof of (A4) proceeds just as in Hopper and Mathews [ 19821. It simplifies notation to lump all pedigrees into one super pedigree of independent subpedigrees. This causes Q to be block diagonal with nonzero blocks corresponding to the subpedigrees. Letting B,. denote a generic variance component, the linear relation (Al) can be recast as

Cholesterols and Triglycerides in Pedigrees 791
At the maximum likelihood estimates the score vanishes, and so
a 0 = C O r - L
r dor
1 I = - - tr(Q-' Q) + - Z' Q - ' Z
2 2 - 1 1
- - tr(I) + - Z' Q - ' 2. 2 2 - 1 1
= - - mq + - Z' Q - ' z, 2 2 -
- -
where I is an identity matrix of size mq X mq, m = En being the total number of people in the sample. An obvious algebraic rearrangement yields (A4) provided we take into account that C' is block diagonal and that we have assumed the mean vector p is zero.
When there are probands in the sample, by a suitable permutation of people and traits, z and !J can be brought into the partioned forms
= If:] = i"" Q21 a 2 2
where the subscripts 1 and 2 refer to the proband and non-proband parts of the sample respectively. The conditional loglikelihood may be written
where LI is the loglikelihood of the probands. Since (A5) must hold for the whole sample as well as the proband sample, one has at the maximum likelihood estimates
a r a8,
a a = C 8 , - L - C C r - L '
r a0, r 88,
0 = COr-L*
1 1 1 1 2 2 - 2 2 -
= - - mq + - Z' Q - ' 2. + - mlq - - Z\ 2.1,
where m is number of people in the whole sample and ml = Cp is the number of probands.
792 Boehnke et a1
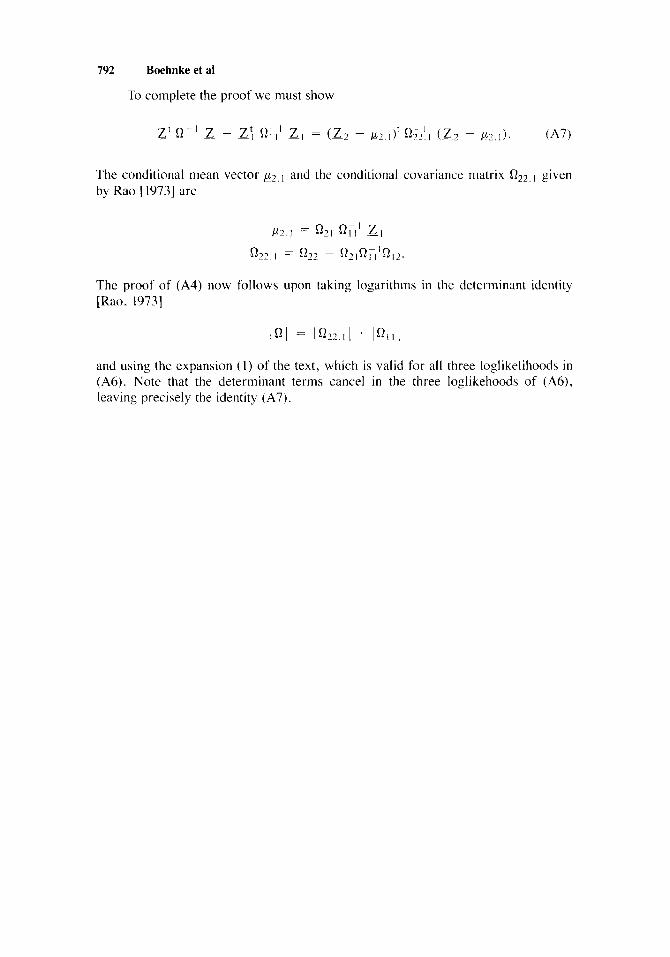
To complete the proof we must show
The conditional mean vector p2. I and the conditional covariance matrix Q22, I given by Rao 119731 are
The proof of (A4) now follows upon taking logarithms in the determinant identity [Rao, 19731
IQI = l Q 2 2 . 1 1 * IQI I I
and using the expansion ( I ) of the text, which is valid for all three loglikelihoods in (A6). Note that the determinant terms cancel in the three loglikehoods of (A6), leaving precisely the identity (A7).