Embed Size (px)
Citation preview
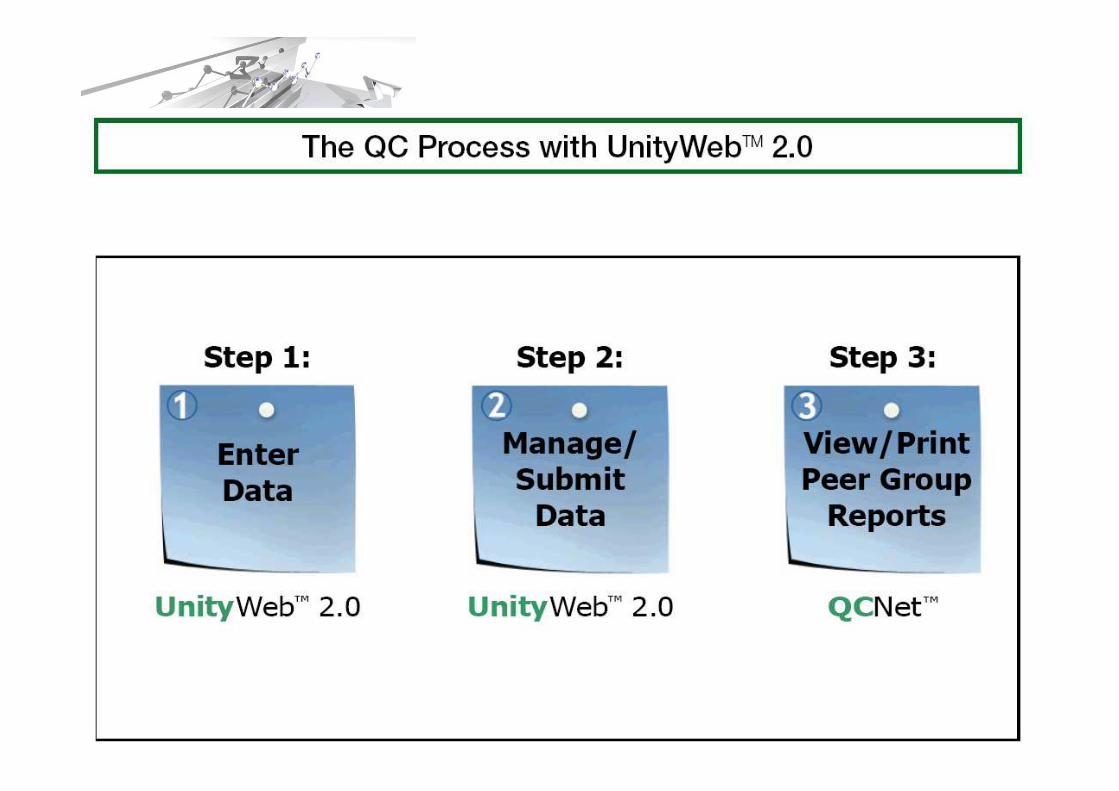
Unity Web 2.0™
Software and Interlab Program
Miroslav Janosik
Agenda
• Unity Interlaboratory system
• QCNet introduction
• Unity Web introduction

Agenda
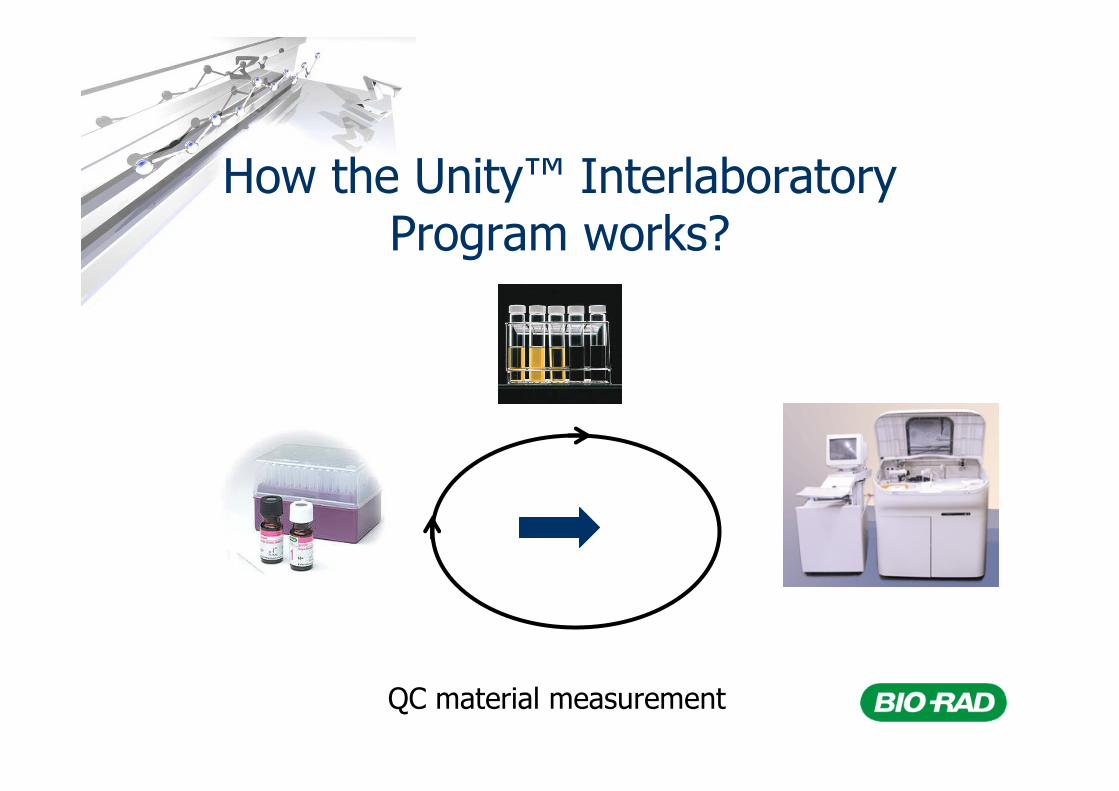
How the Unity™ Interlaboratory Program works?
QC material measurement
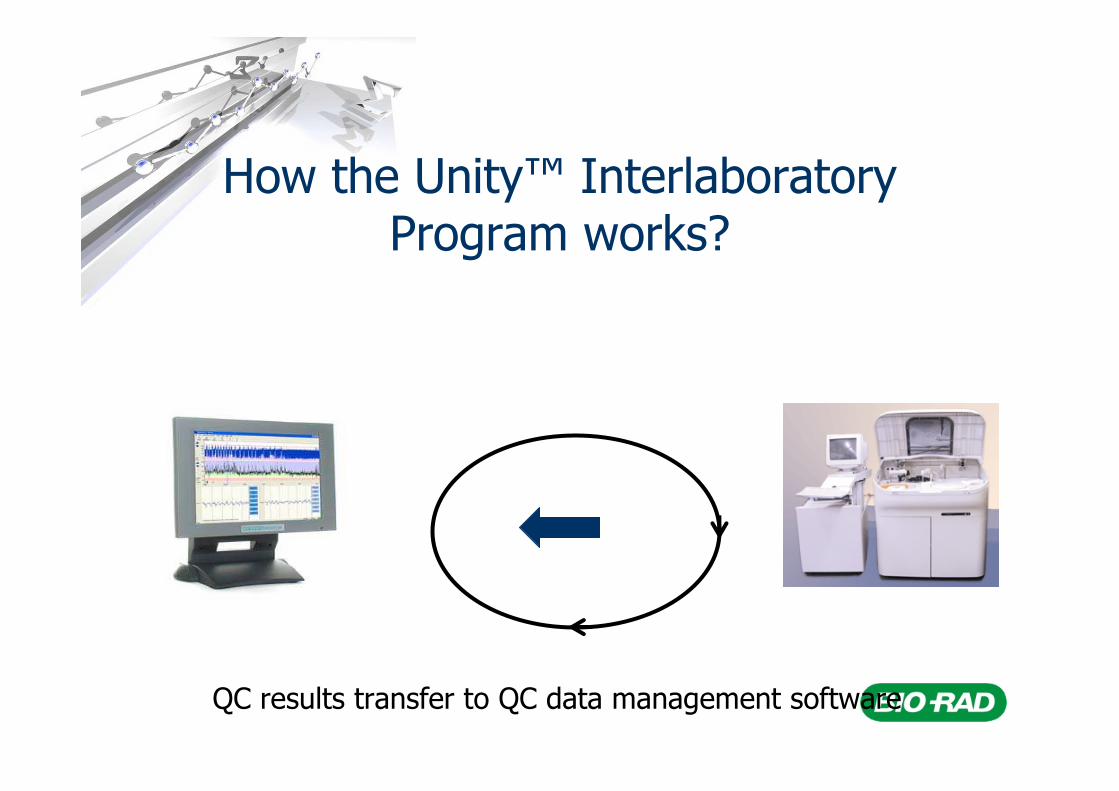
How the Unity™ Interlaboratory Program works?
QC results transfer to QC data management software
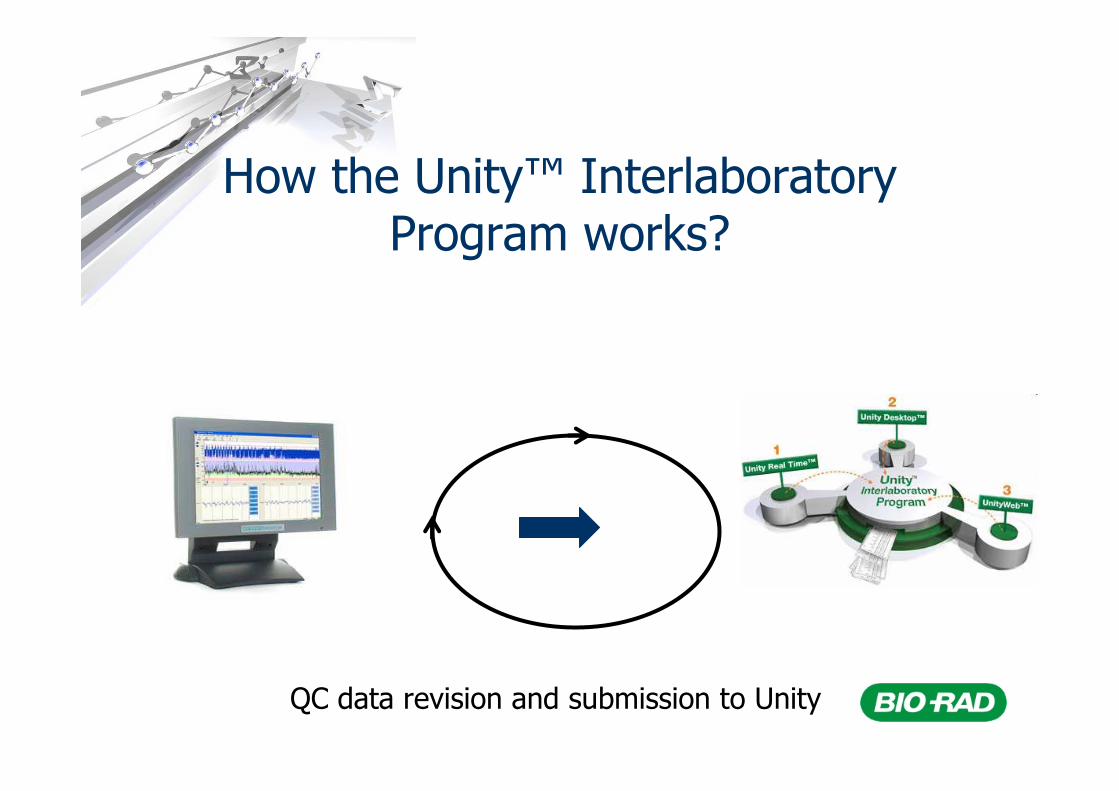
How the Unity™ Interlaboratory Program works?
QC data revision and submission to Unity
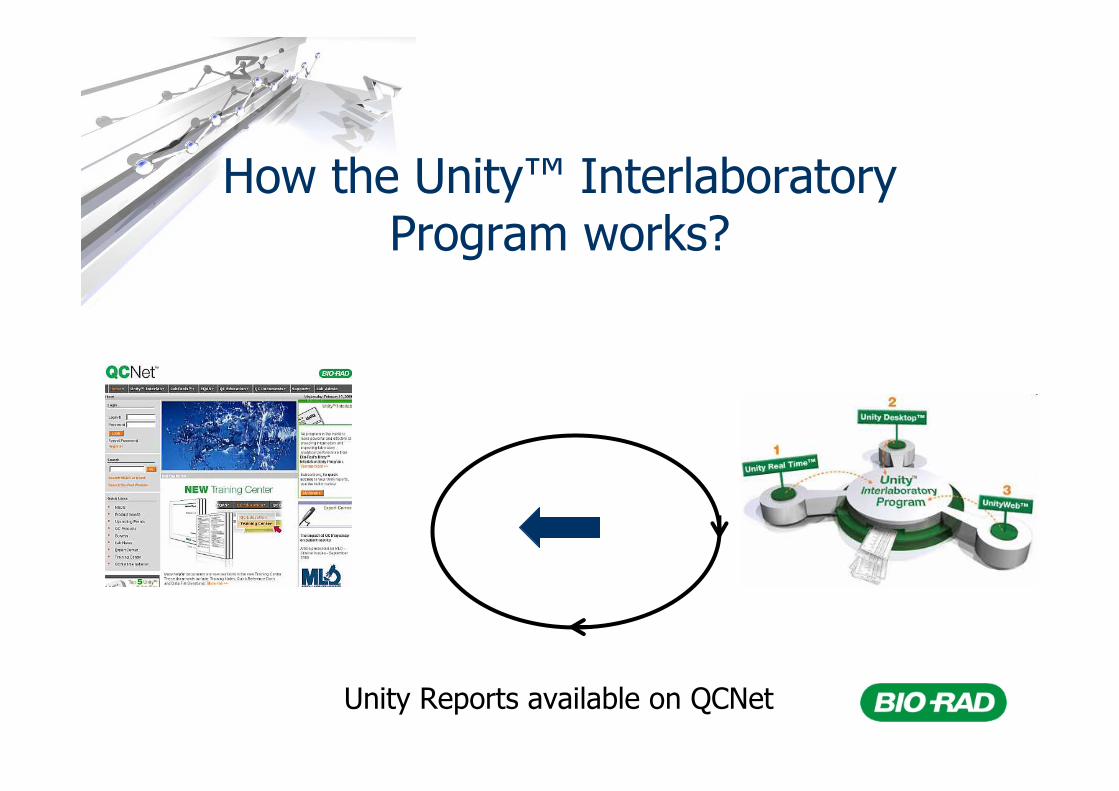
How the Unity™ Interlaboratory Program works?
Unity Reports available on QCNet
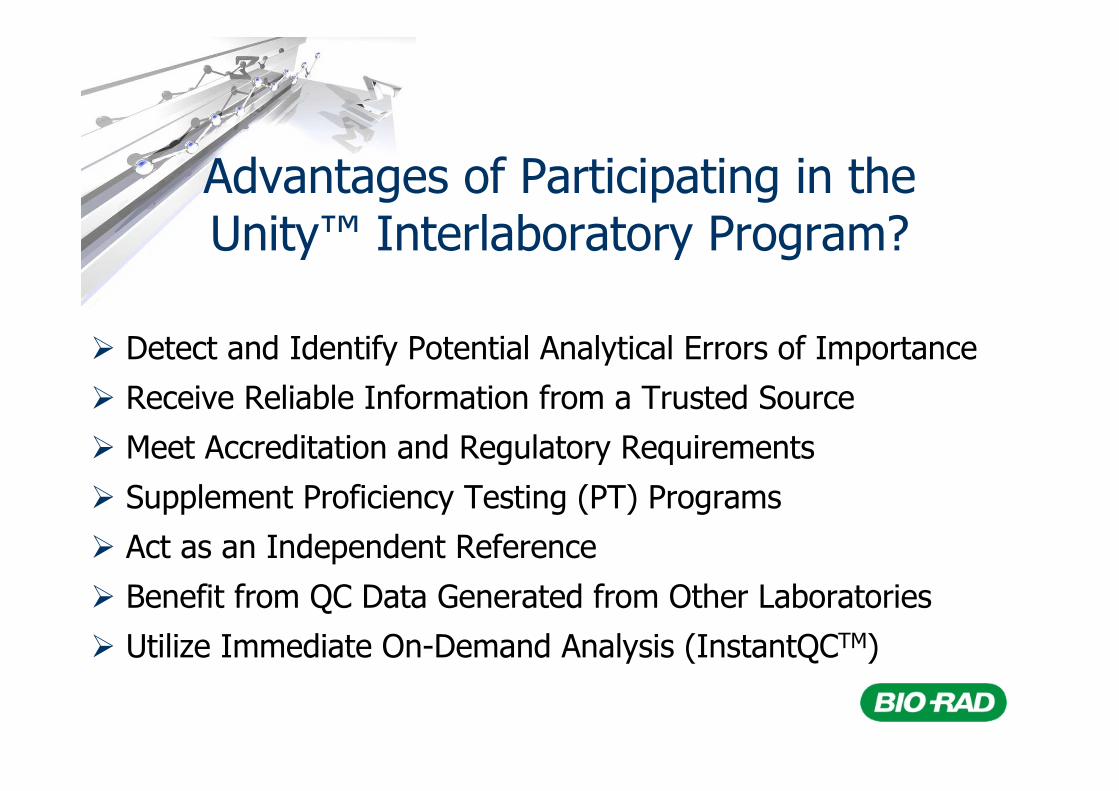
� Detect and Identify Potential Analytical Errors of Importance
� Receive Reliable Information from a Trusted Source
� Meet Accreditation and Regulatory Requirements
� Supplement Proficiency Testing (PT) Programs
� Act as an Independent Reference
� Benefit from QC Data Generated from Other Laboratories
� Utilize Immediate On-Demand Analysis (InstantQCTM)
Advantages of Participating in theUnity™ Interlaboratory Program?
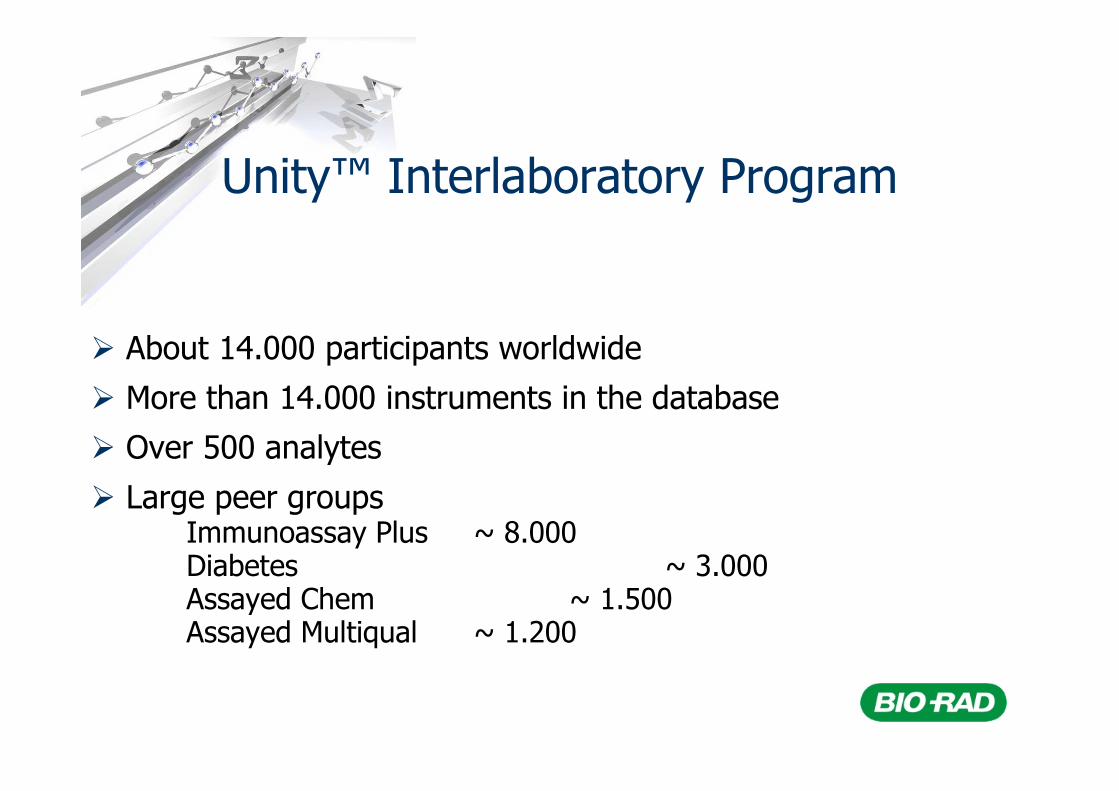
� About 14.000 participants worldwide
� More than 14.000 instruments in the database
� Over 500 analytes
� Large peer groupsImmunoassay Plus ~ 8.000Diabetes ~ 3.000Assayed Chem ~ 1.500Assayed Multiqual ~ 1.200
Unity™ Interlaboratory Program

Unity™ Interlaboratory Reports
Standard Unity™ Reports
Monthly EvaluationLaboratory Performance OverviewLaboratory ComparisonLaboratory Histogram Bias & Imprecision HistogramData Rejection
Optional Unity™ Reports
WorldwideStatistical Profile Affiliated Reports Urinalysis InstantQC™ Reports
Registration
www.qcnet.com
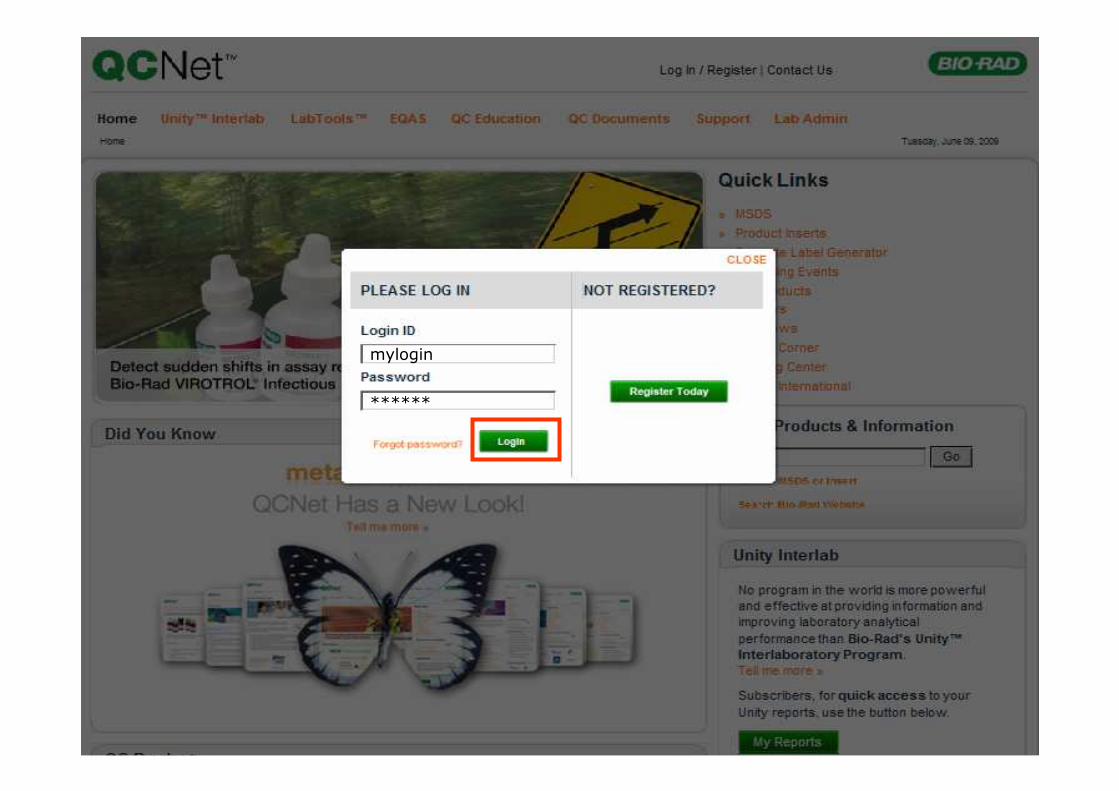
� To register QCNet account
– Go to www.qcnet.com
– Click Register
– Fill out all required fields
– Press Submit buttonmylogin
******
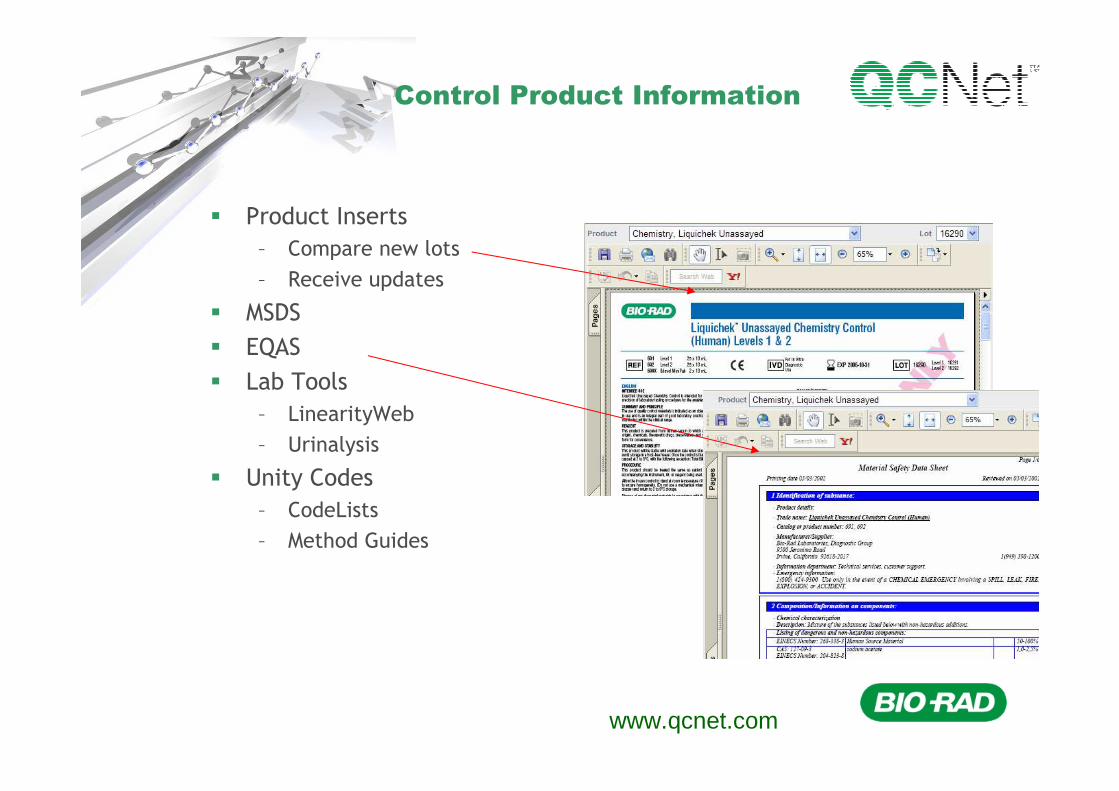
Control Product Information
� Product Inserts
– Compare new lots
– Receive updates
� MSDS
� EQAS
� Lab Tools
– LinearityWeb
– Urinalysis
� Unity Codes
– CodeLists
– Method Guides
www.qcnet.com
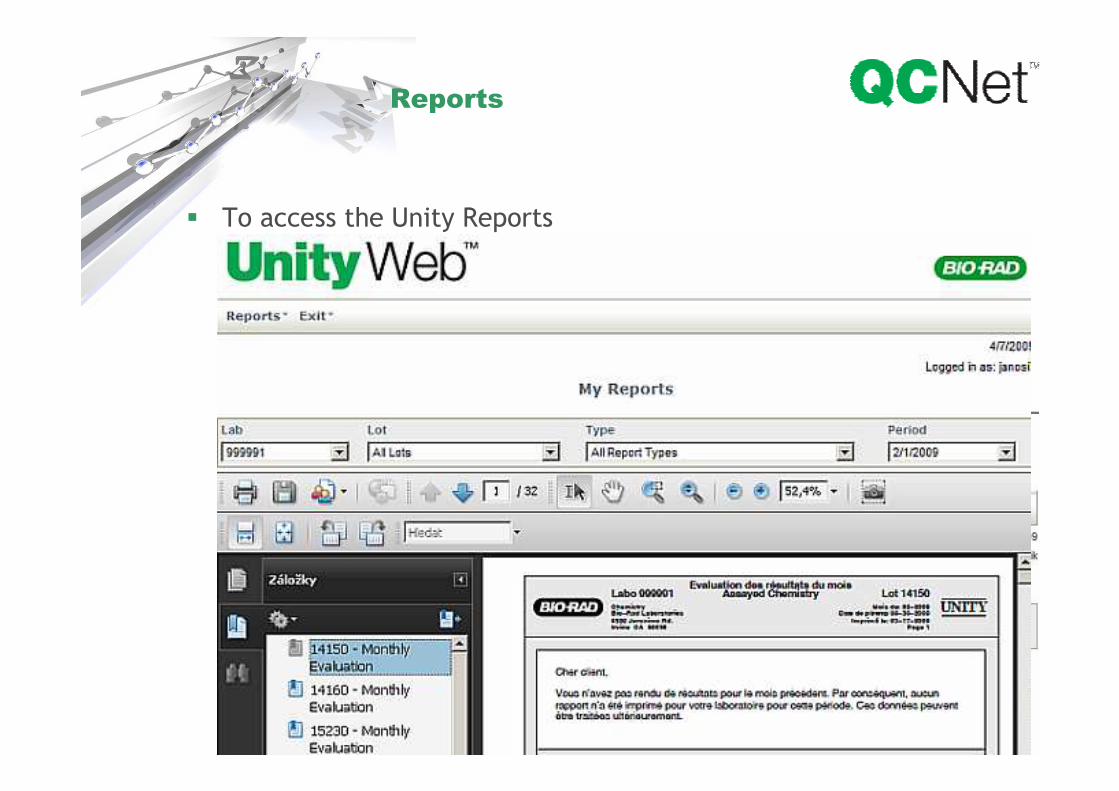
Reports
� To access the Unity Reports– Select from the main menu Unity Interla / Unity Interlab Reports
– A new window will appear
– Select from the main menu Reports / My Reports
– Select from pull down menu Lab number, Lot number, Type andPeriod
www.qcnet.com
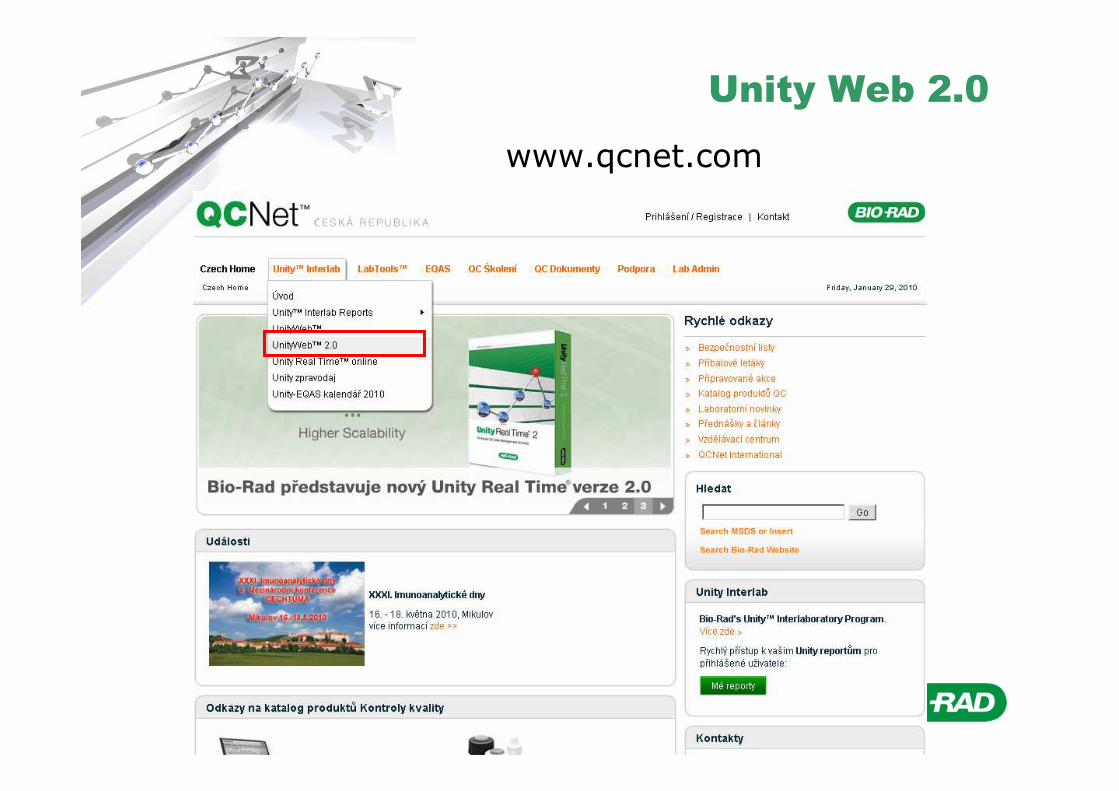
Unity Web 2.0
www.qcnet.com
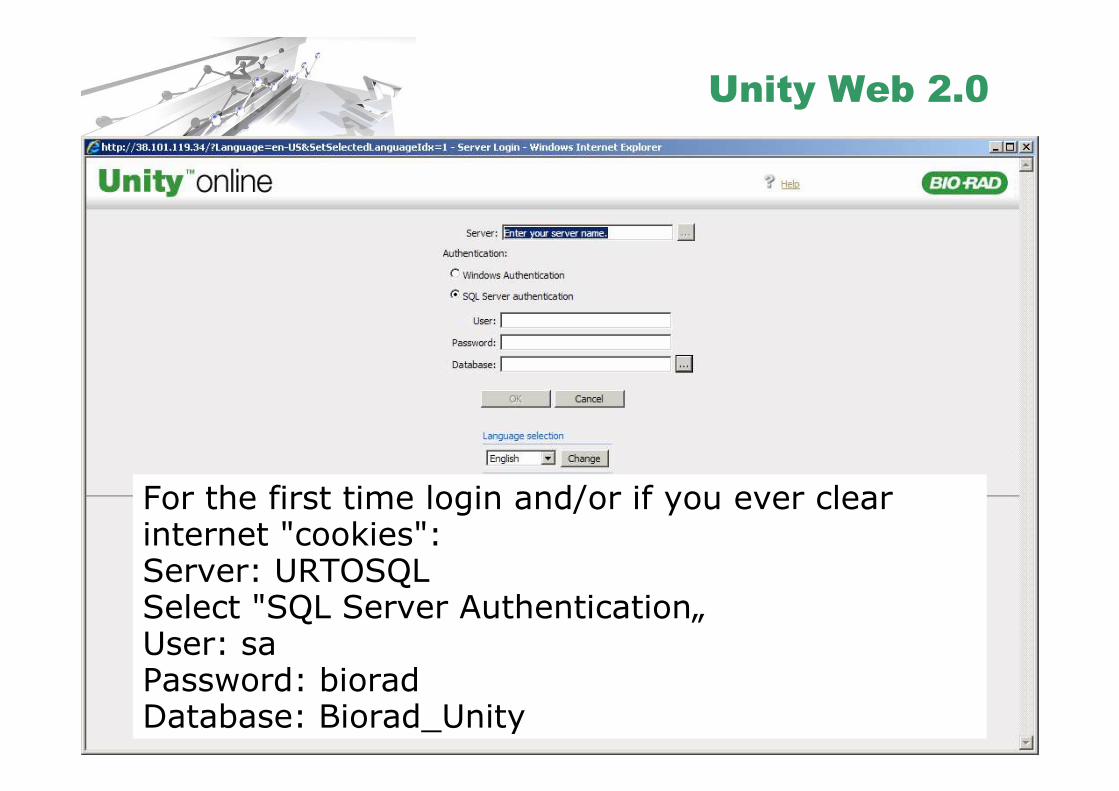
Unity Web 2.0
For the first time login and/or if you ever clear internet "cookies":Server: URTOSQLSelect "SQL Server Authentication„User: saPassword: bioradDatabase: Biorad_Unity
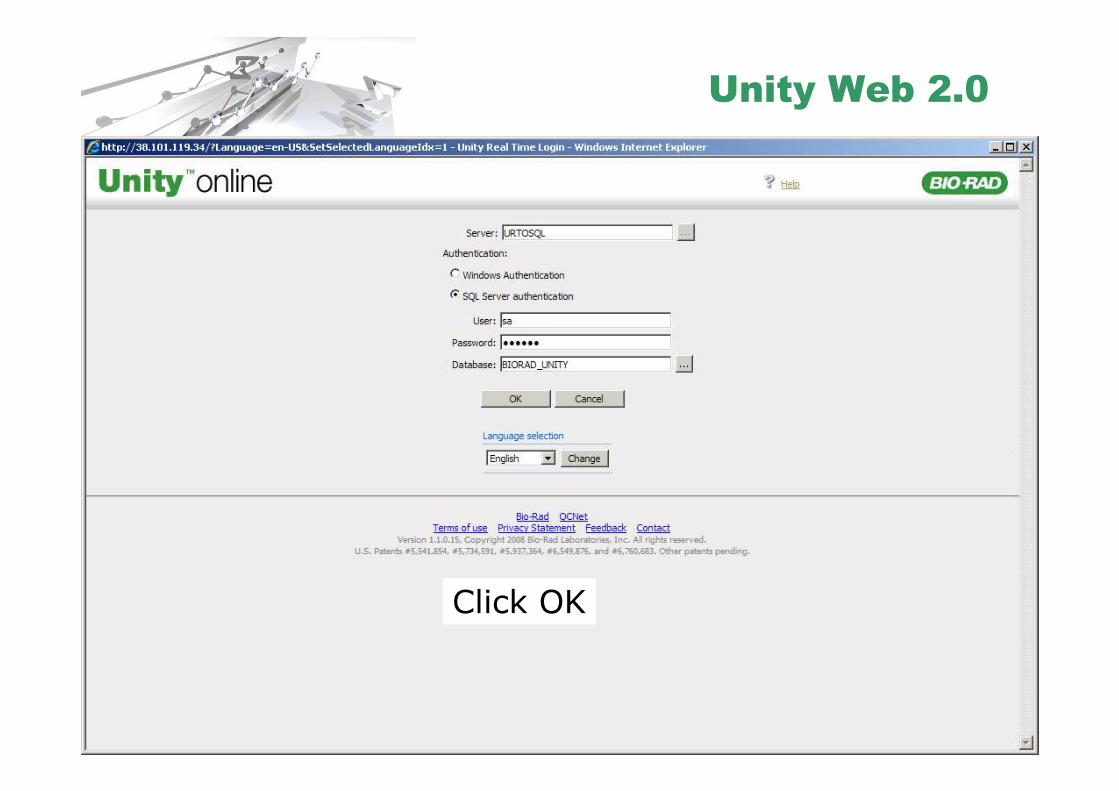
Unity Web 2.0
Click OK
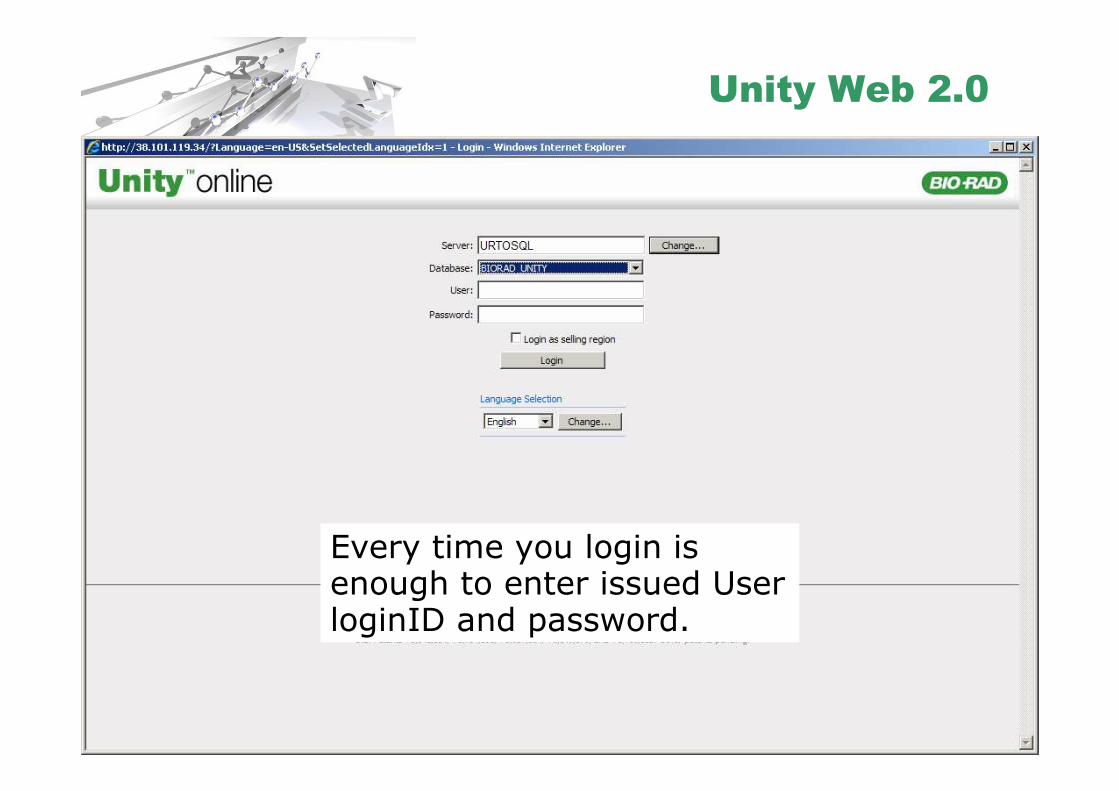
Unity Web 2.0
Every time you login is enough to enter issued UserloginID and password.
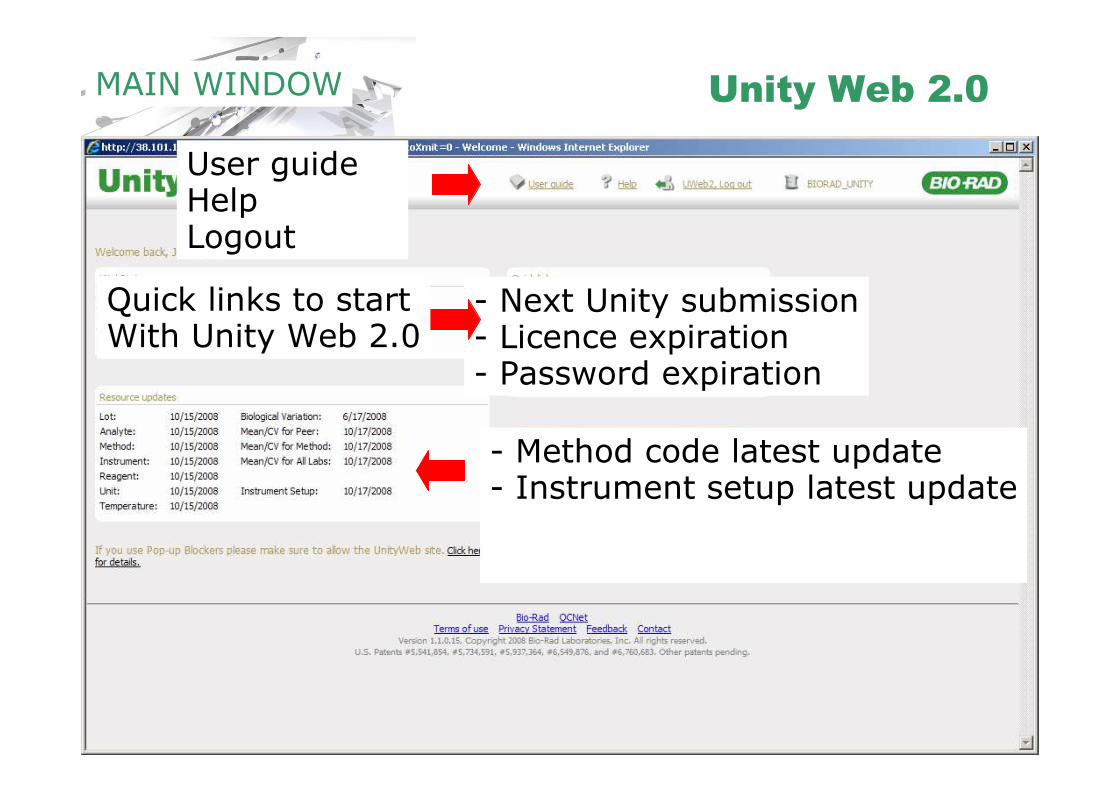
Unity Web 2.0MAIN WINDOW
- Next Unity submission- Licence expiration- Password expiration
- Method code latest update- Instrument setup latest update
Quick links to startWith Unity Web 2.0
User guideHelpLogout
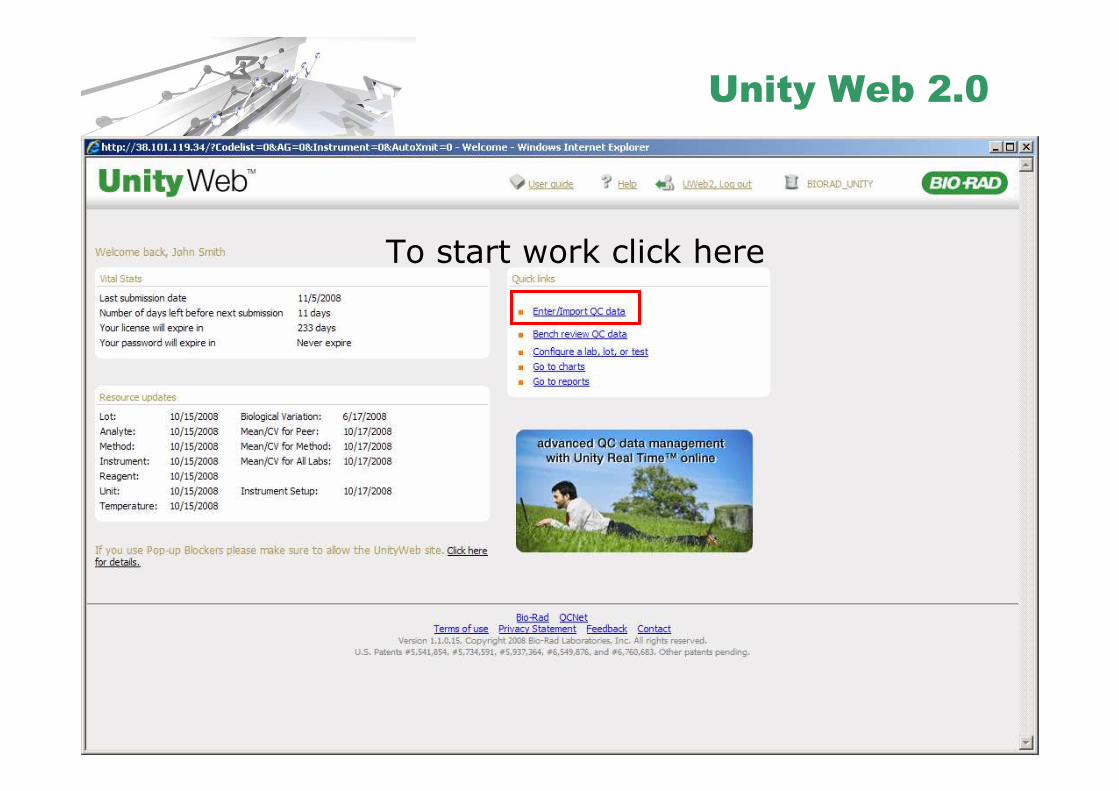
Unity Web 2.0
To start work click here
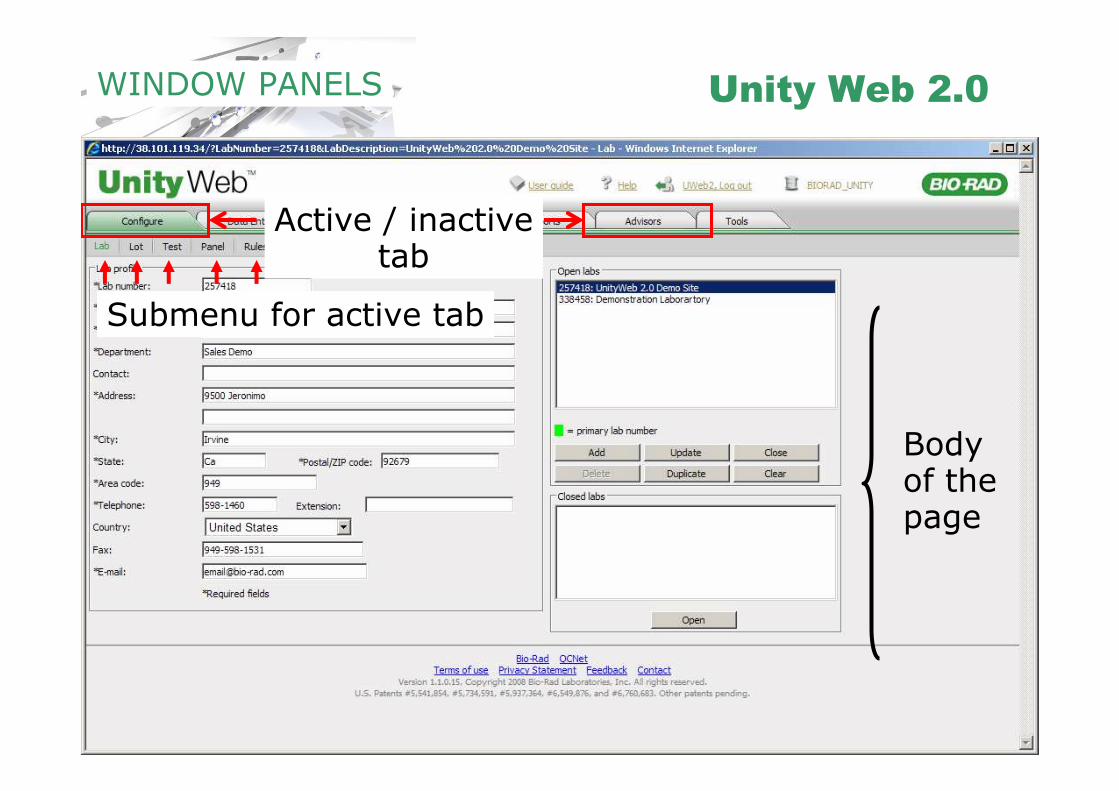
Unity Web 2.0WINDOW PANELS
Active / inactivetab
Submenu for active tab
Bodyof thepage
Unity Web 2.0OVERVIEW OF WINDOW PANELS
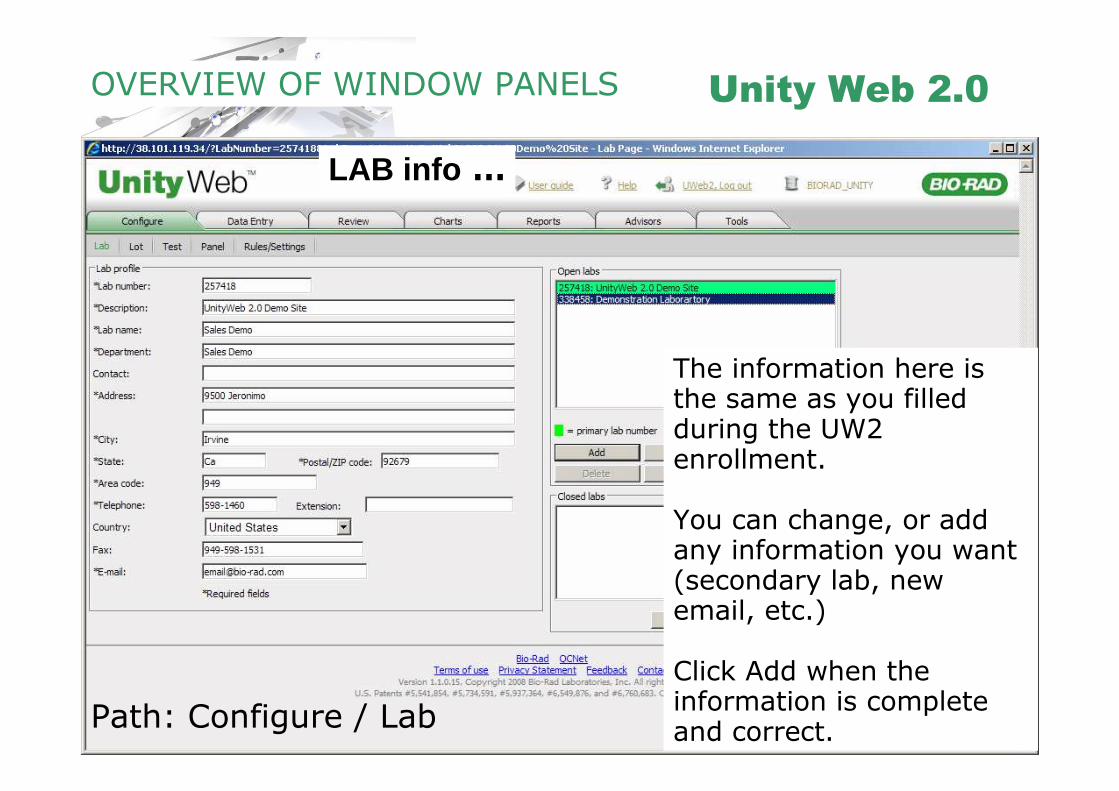
Path: Configure / Lab
The information here is the same as you filled during the UW2 enrollment.
You can change, or add any information you want (secondary lab, new email, etc.)
Click Add when the information is complete and correct.
LAB info …

Unity Web 2.0OVERVIEW OF WINDOW PANELS
Path: Configure / Lot
Select the lab number you want to add lots to.Select a control product from the drop-down list under "Controlname." The list will contain all Bio-Rad control products.
Select a lot number from the drop-down list under "Lot number." Thelist will contain all unexpired lot numbers.Click Add.
The lot number appears in the open lots list.Repeat the steps to add additional lots as needed.
To Add a Lot …
Unity Web 2.0OVERVIEW OF WINDOW PANELS
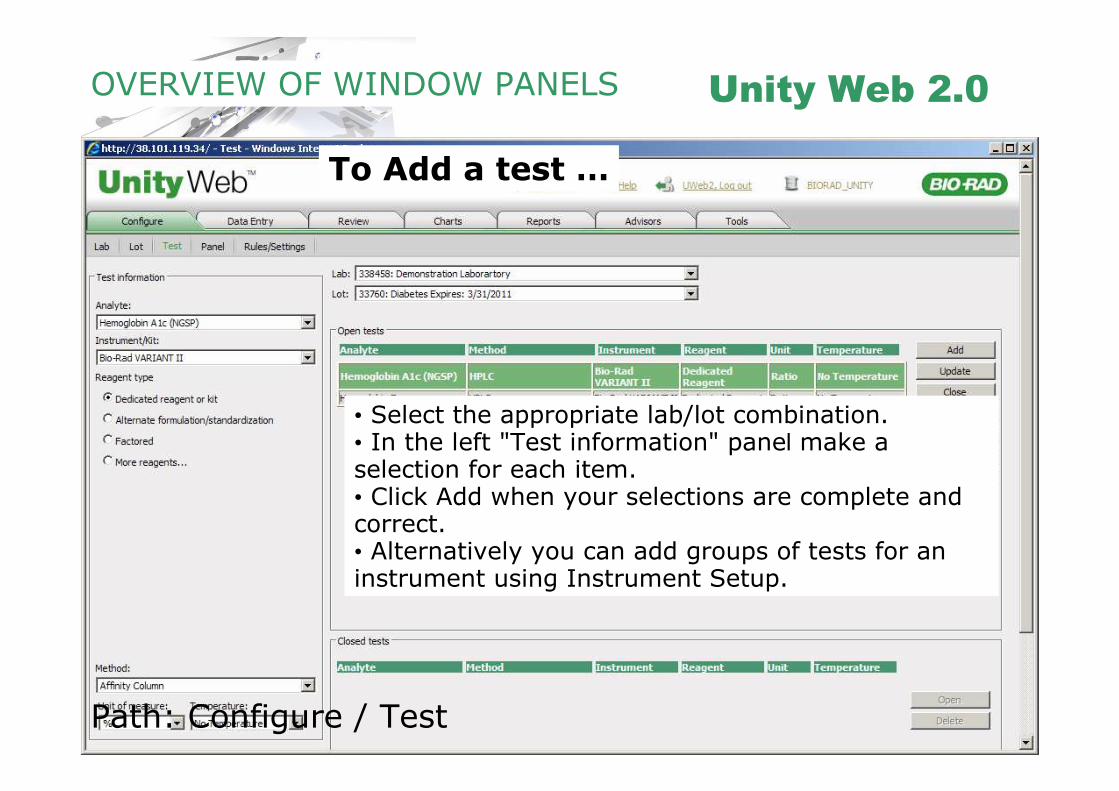
Path: Configure / Test
• Select the appropriate lab/lot combination.• In the left "Test information" panel make a selection for each item.• Click Add when your selections are complete and correct.• Alternatively you can add groups of tests for an instrument using Instrument Setup.
To Add a test …
Unity Web 2.0OVERVIEW OF WINDOW PANELS
Path: Configure / Test
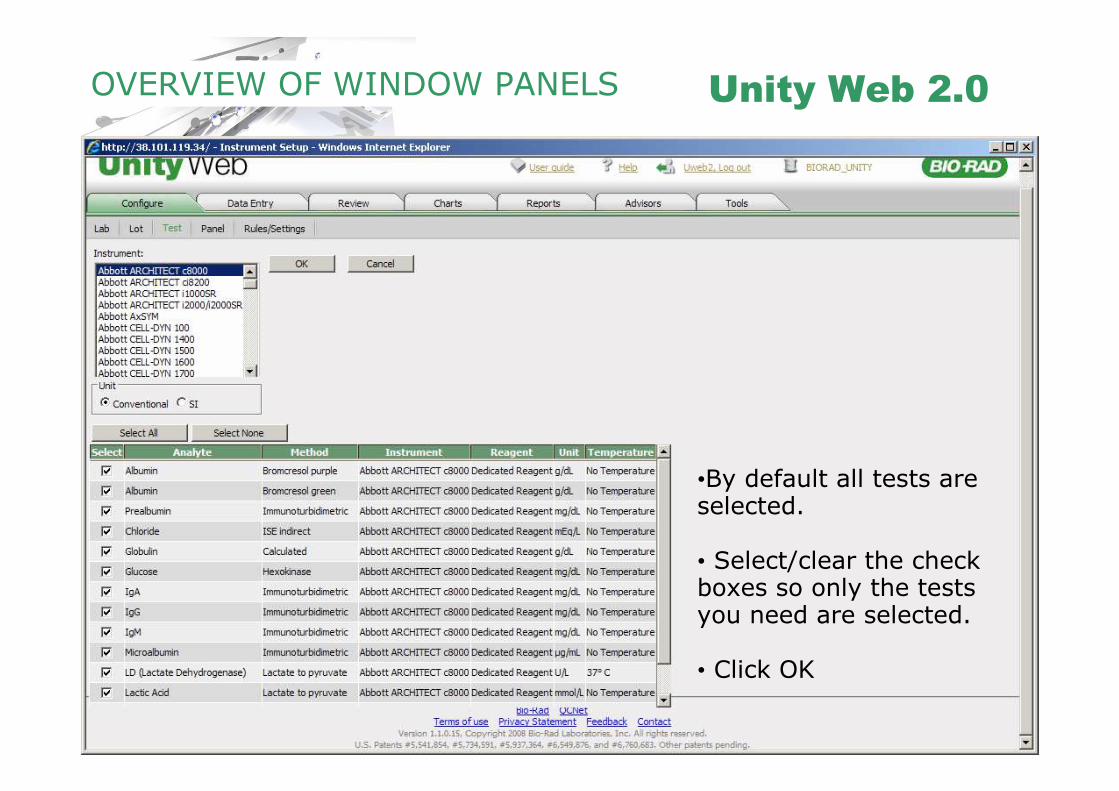
• using Instrument Setup …
- Click instrument setup
To Add a test …
Select the instrument
•By default all tests are selected.
• Select/clear the check boxes so only the tests you need are selected.
• Click OK

Unity Web 2.0OVERVIEW OF WINDOW PANELS
Path: Configure / Test
To Add a test …
The new tests appear in the Open tests list.
Unity Web 2.0OVERVIEW OF WINDOW PANELS
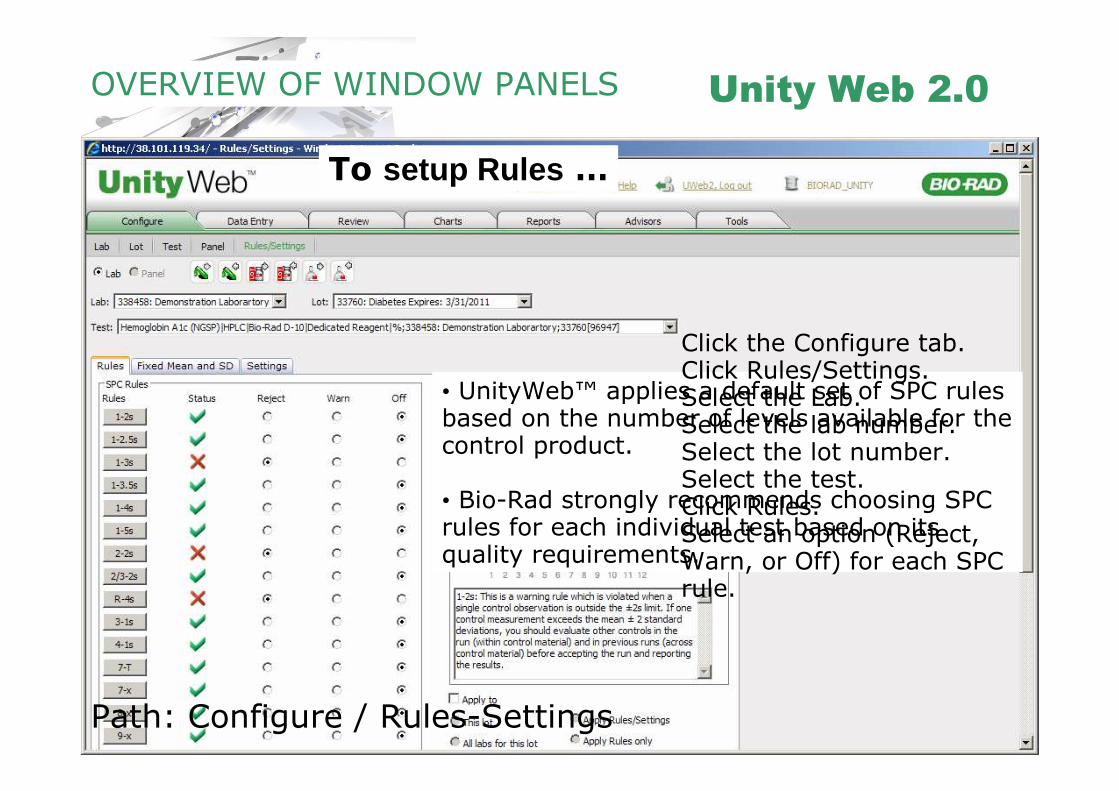
Path: Configure / Rules-Settings
To setup Rules …
• UnityWeb™ applies a default set of SPC rules based on the number of levels available for the control product.
• Bio-Rad strongly recommends choosing SPC rules for each individual test based on its quality requirements.
Click the Configure tab.Click Rules/Settings.Select the Lab.Select the lab number.Select the lot number.Select the test.Click Rules.Select an option (Reject, Warn, or Off) for each SPC rule.
Unity Web 2.0OVERVIEW OF WINDOW PANELS
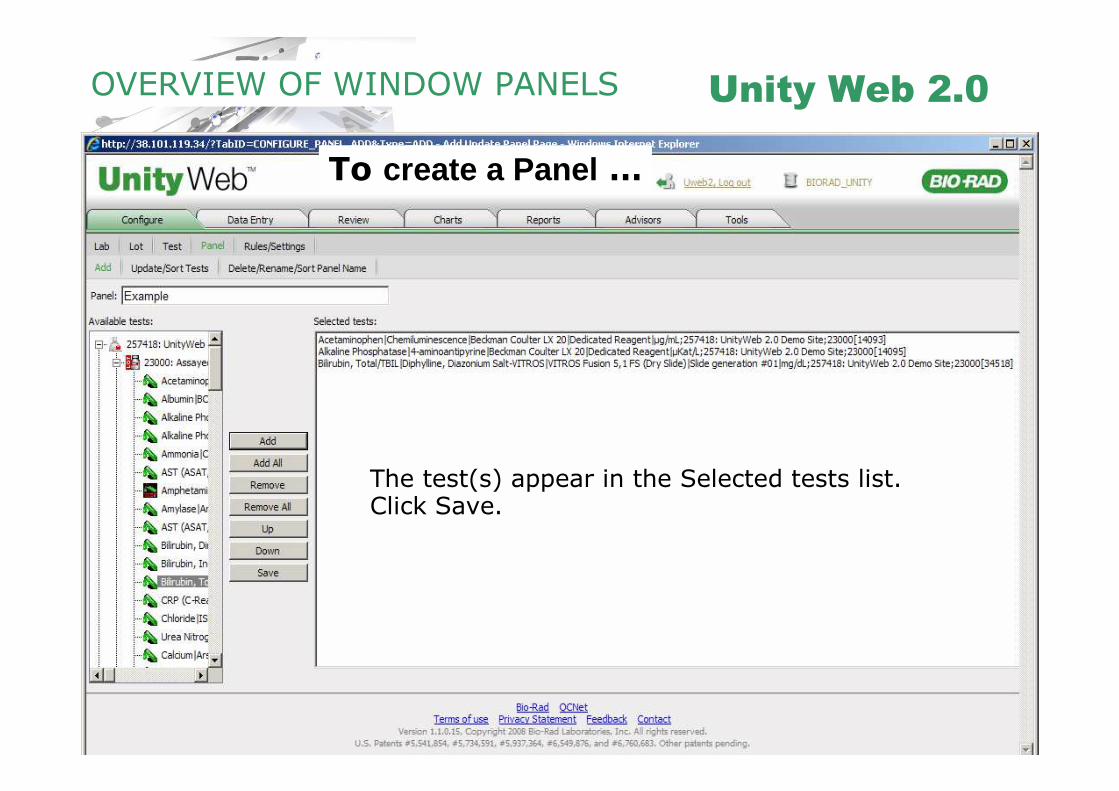
Path: Configure / Panel
A panel is a user-defined group of tests organized to simplify data entry and data review across lab and lot numbers.
Click the Configure tab.Click Panel.Click Add.Type the name for the panel in the Panel box.Select the lot or test to add to the panel from the Available tests navigation tree.Click Add to add the selected test or to add all tests within the selected lot.
To create a Panel …
The test(s) appear in the Selected tests list.Click Save.
Unity Web 2.0OVERVIEW OF WINDOW PANELS
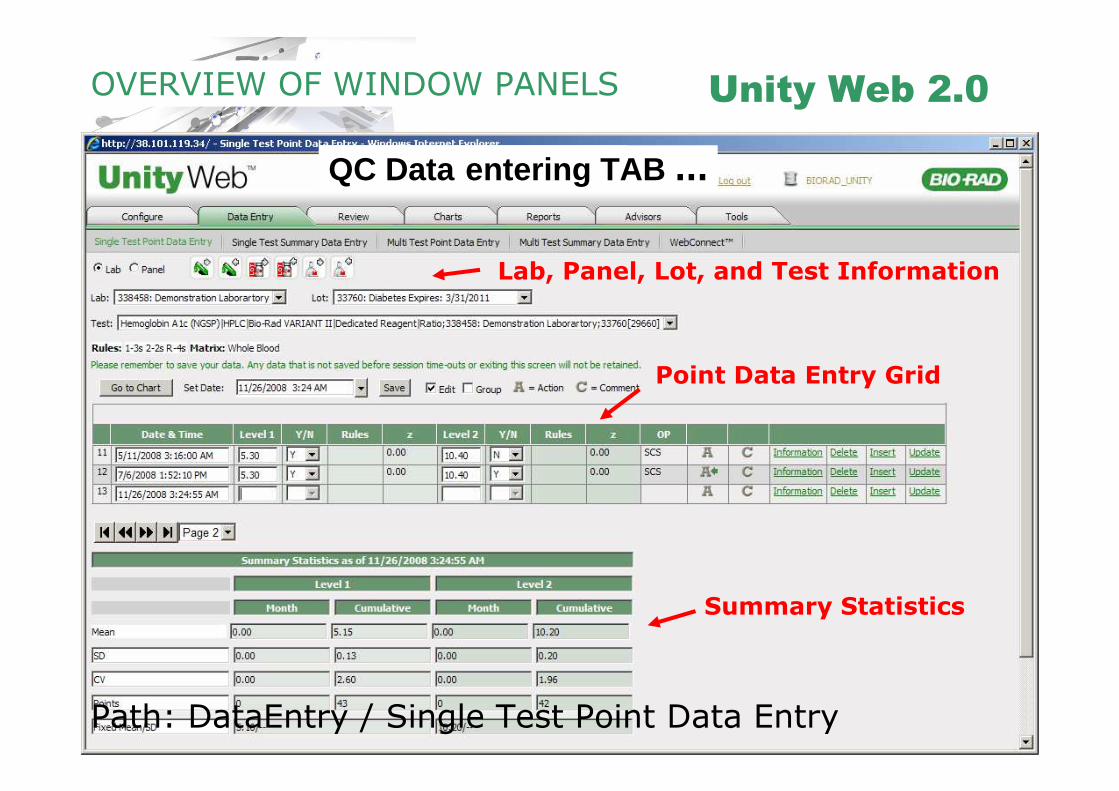
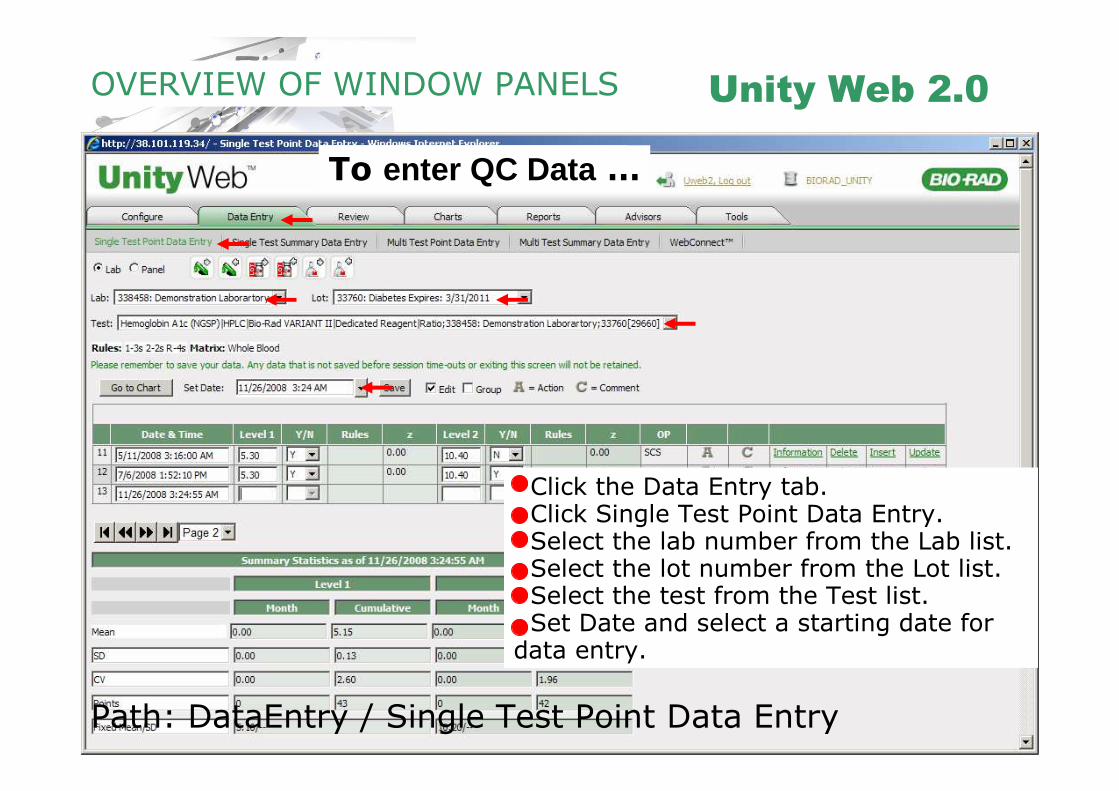
Path: DataEntry / Single Test Point Data Entry
To enter Data …QC Data entering TAB …
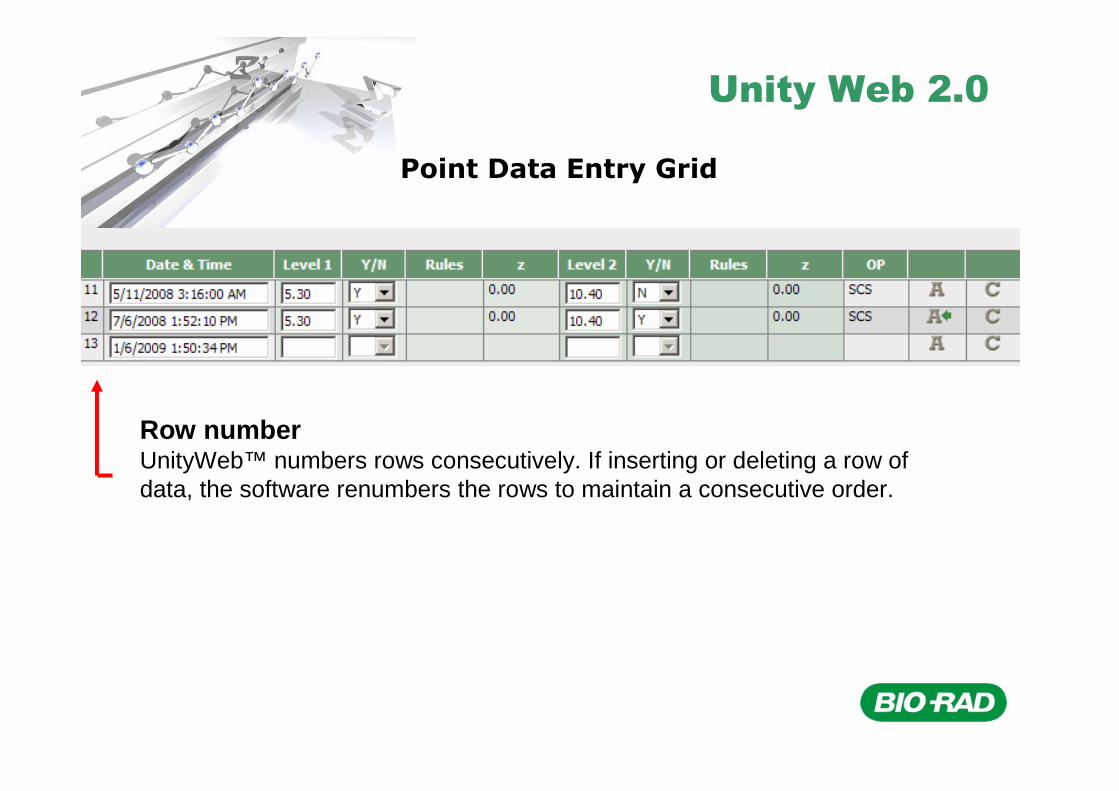
Point Data Entry Grid
Lab, Panel, Lot, and Test Information
Summary Statistics
Point Data Entry Grid
Row numberUnityWeb™ numbers rows consecutively. If inserting or deleting a row ofdata, the software renumbers the rows to maintain a consecutive order.
Unity Web 2.0
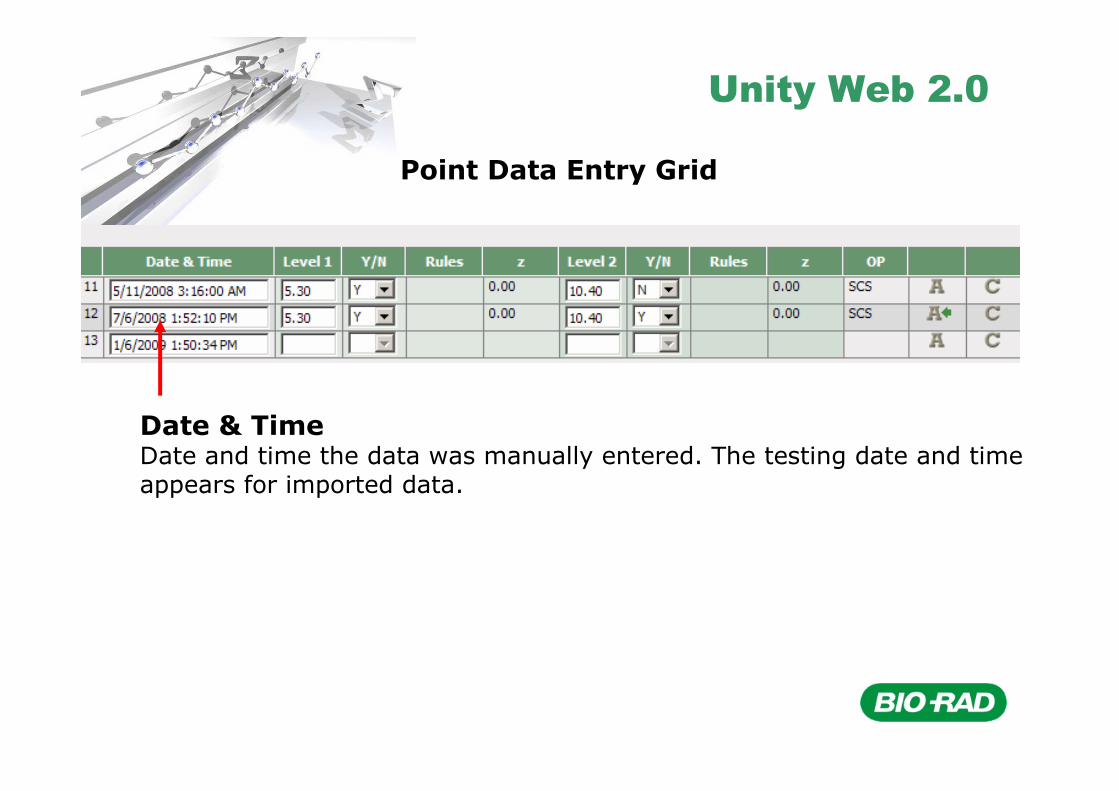
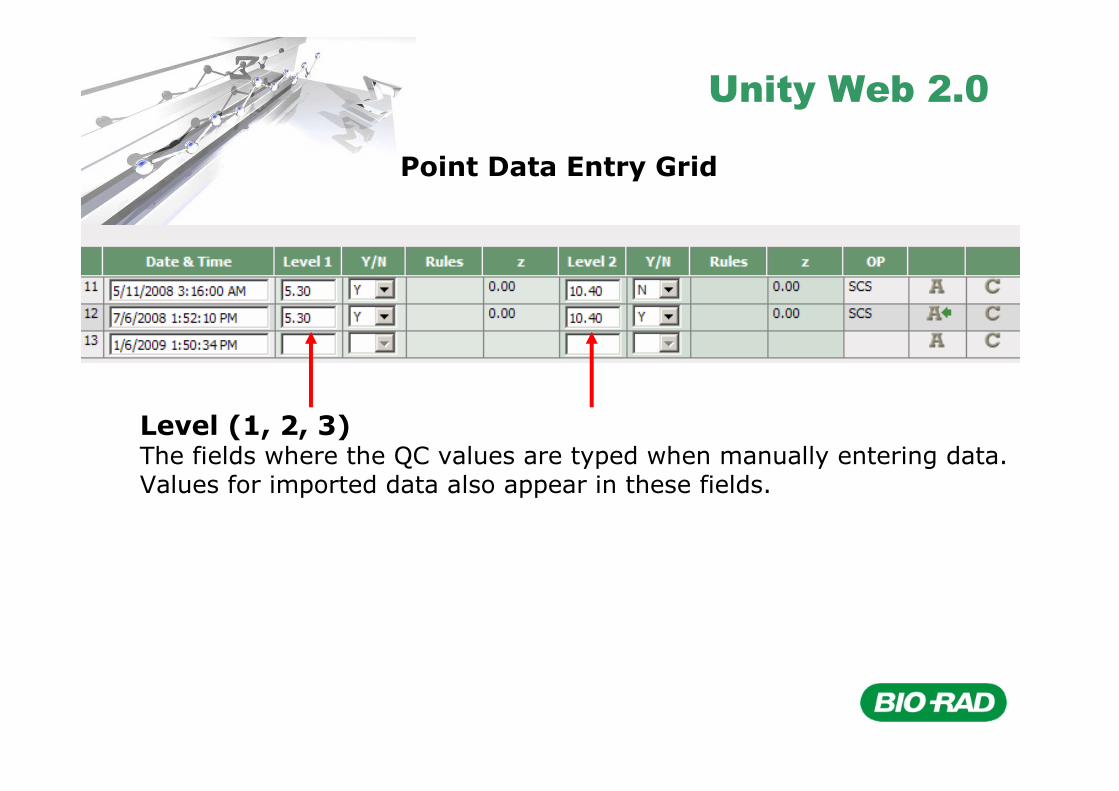
Point Data Entry Grid
Date & TimeDate and time the data was manually entered. The testing date and timeappears for imported data.
Unity Web 2.0
Point Data Entry Grid
Level (1, 2, 3)The fields where the QC values are typed when manually entering data.Values for imported data also appear in these fields.
Unity Web 2.0
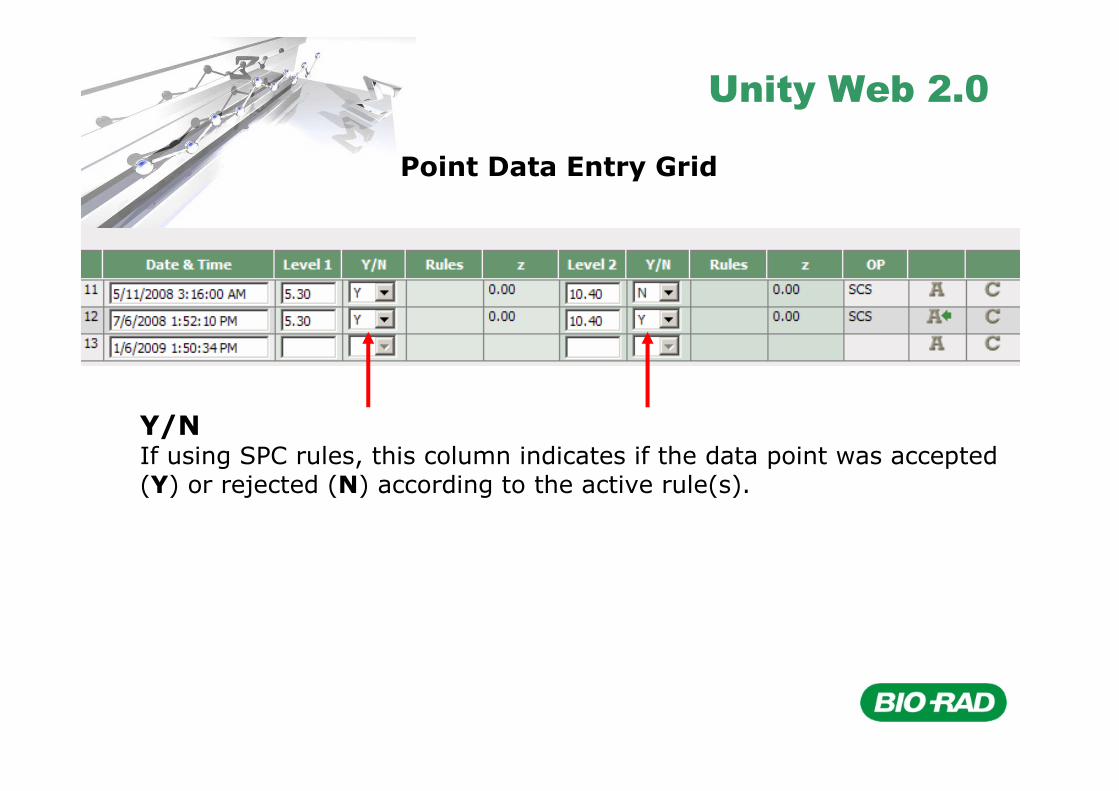
Point Data Entry Grid
Y/NIf using SPC rules, this column indicates if the data point was accepted(Y) or rejected (N) according to the active rule(s).
Unity Web 2.0
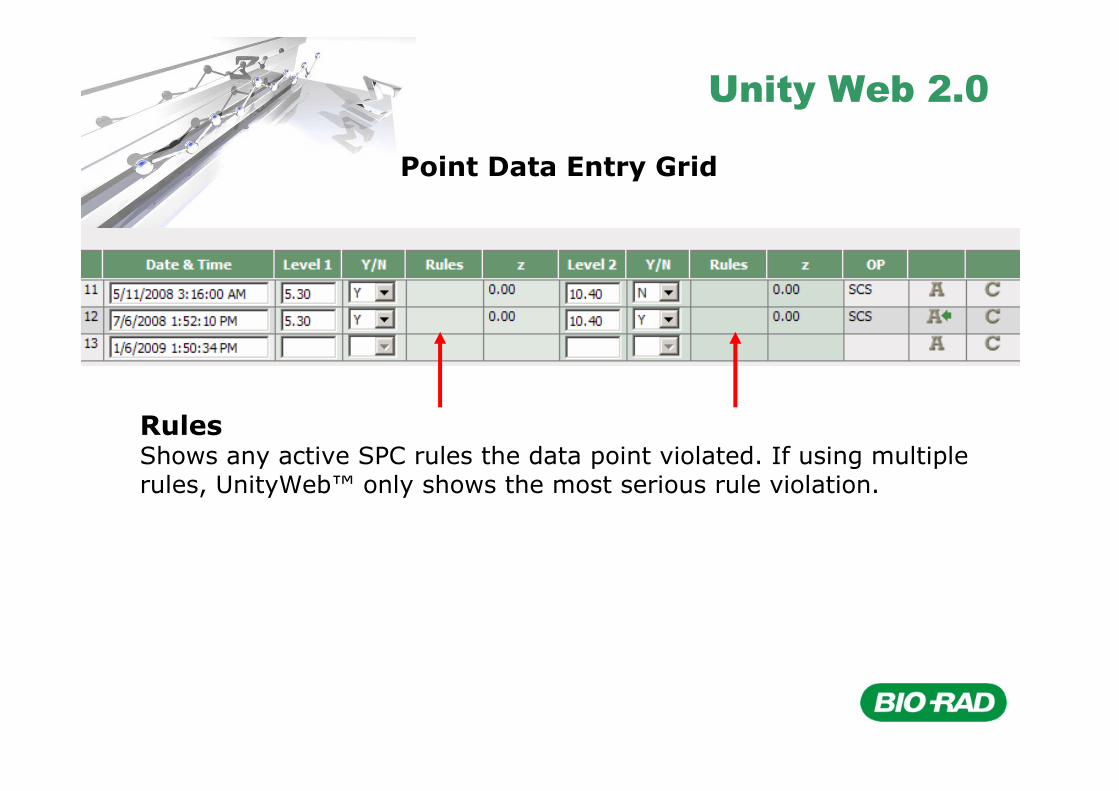
Point Data Entry Grid
RulesShows any active SPC rules the data point violated. If using multiplerules, UnityWeb™ only shows the most serious rule violation.
Unity Web 2.0
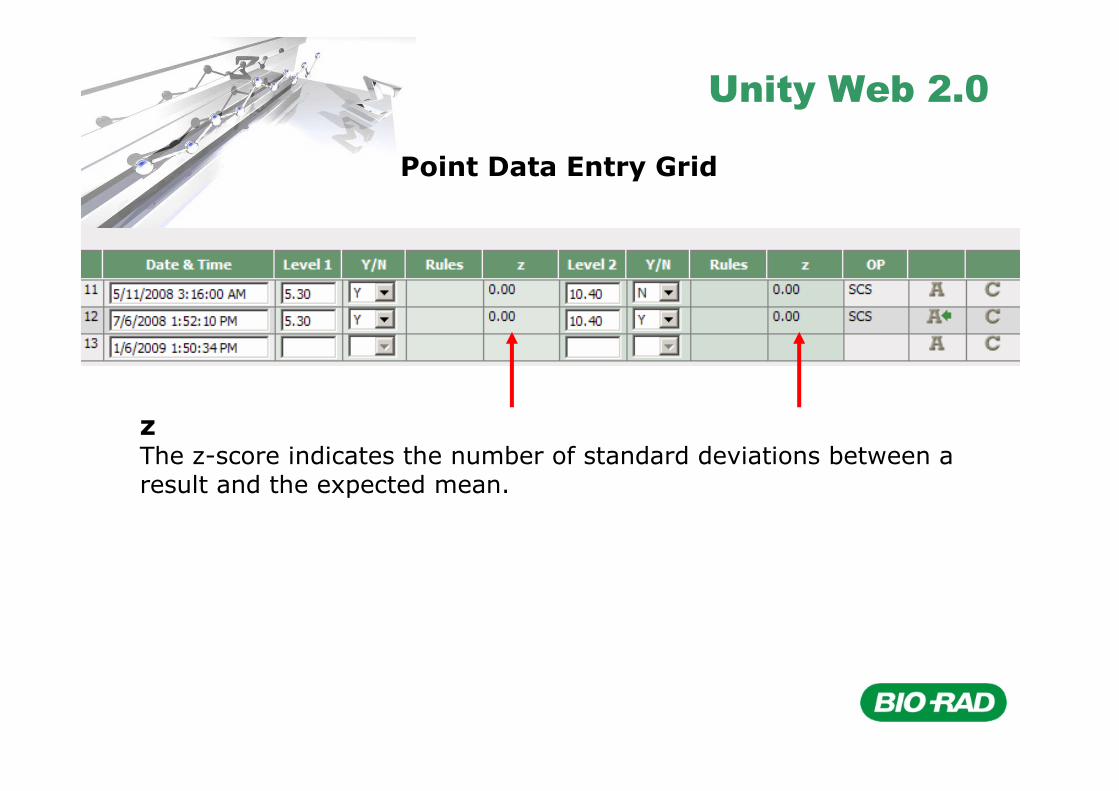
Point Data Entry Grid
zThe z-score indicates the number of standard deviations between aresult and the expected mean.
Unity Web 2.0
Point Data Entry Grid
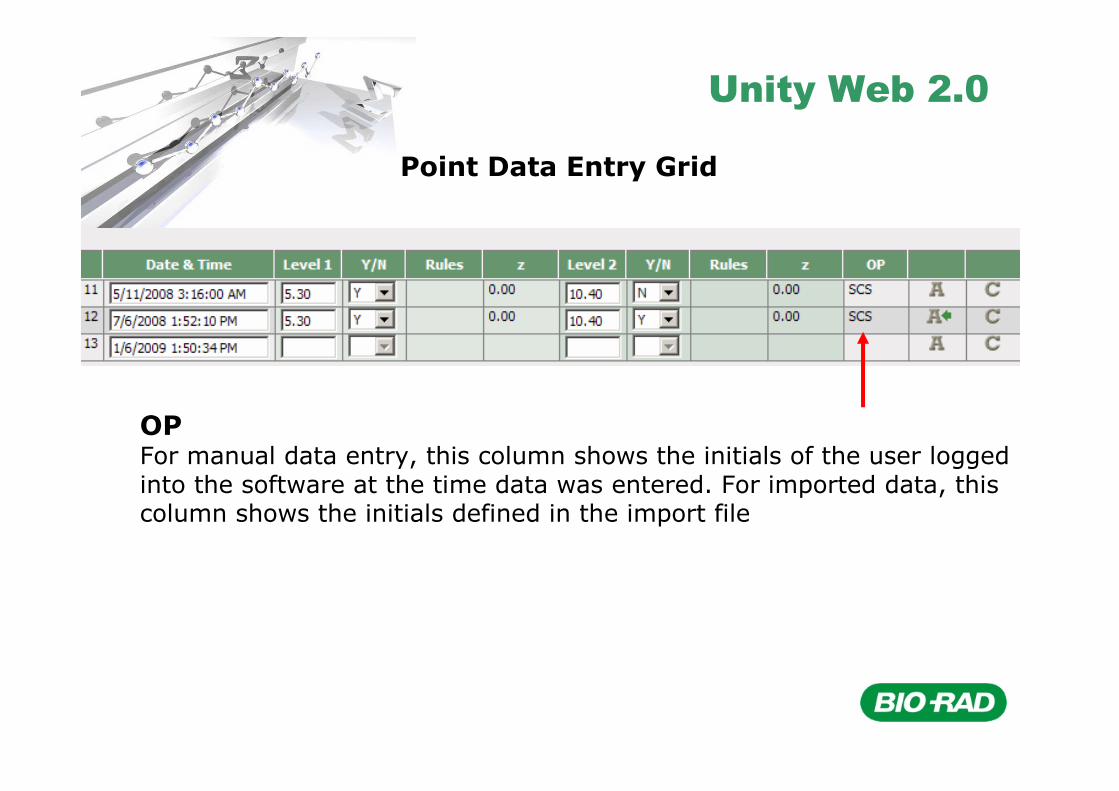
OPFor manual data entry, this column shows the initials of the user loggedinto the software at the time data was entered. For imported data, thiscolumn shows the initials defined in the import file
Unity Web 2.0
Point Data Entry Grid
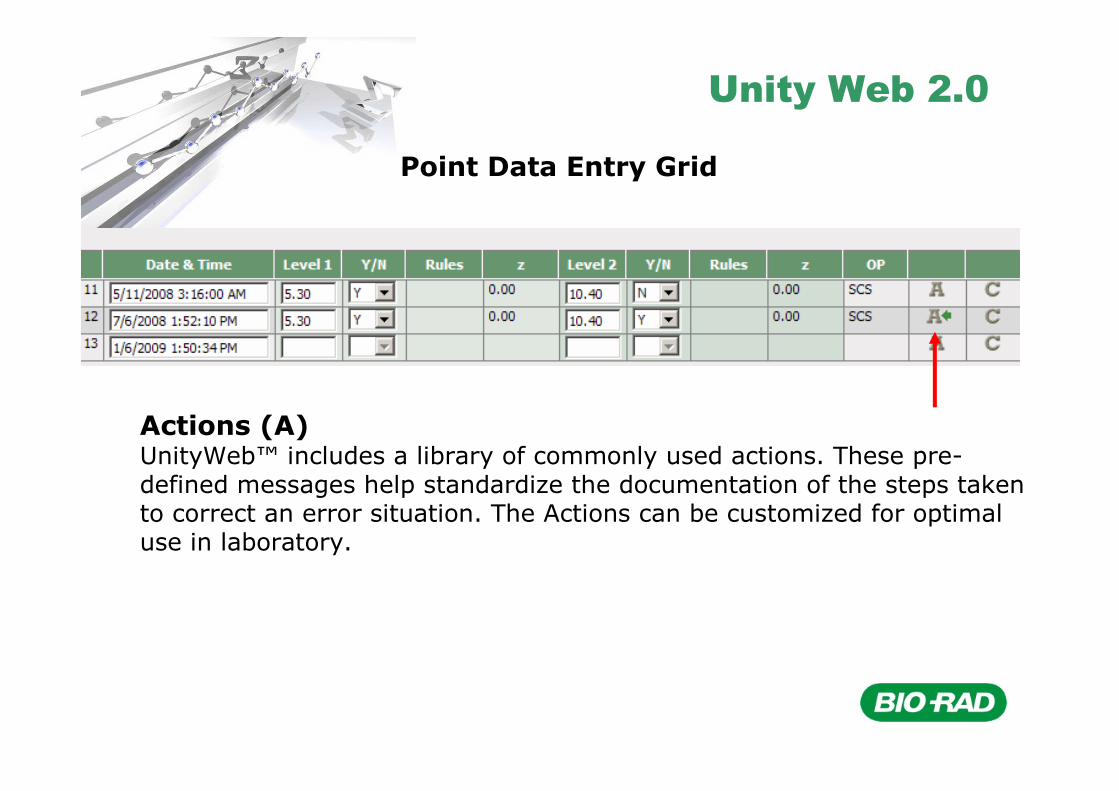
Actions (A)UnityWeb™ includes a library of commonly used actions. These pre-defined messages help standardize the documentation of the steps taken to correct an error situation. The Actions can be customized for optimal use in laboratory.
Unity Web 2.0
Point Data Entry Grid
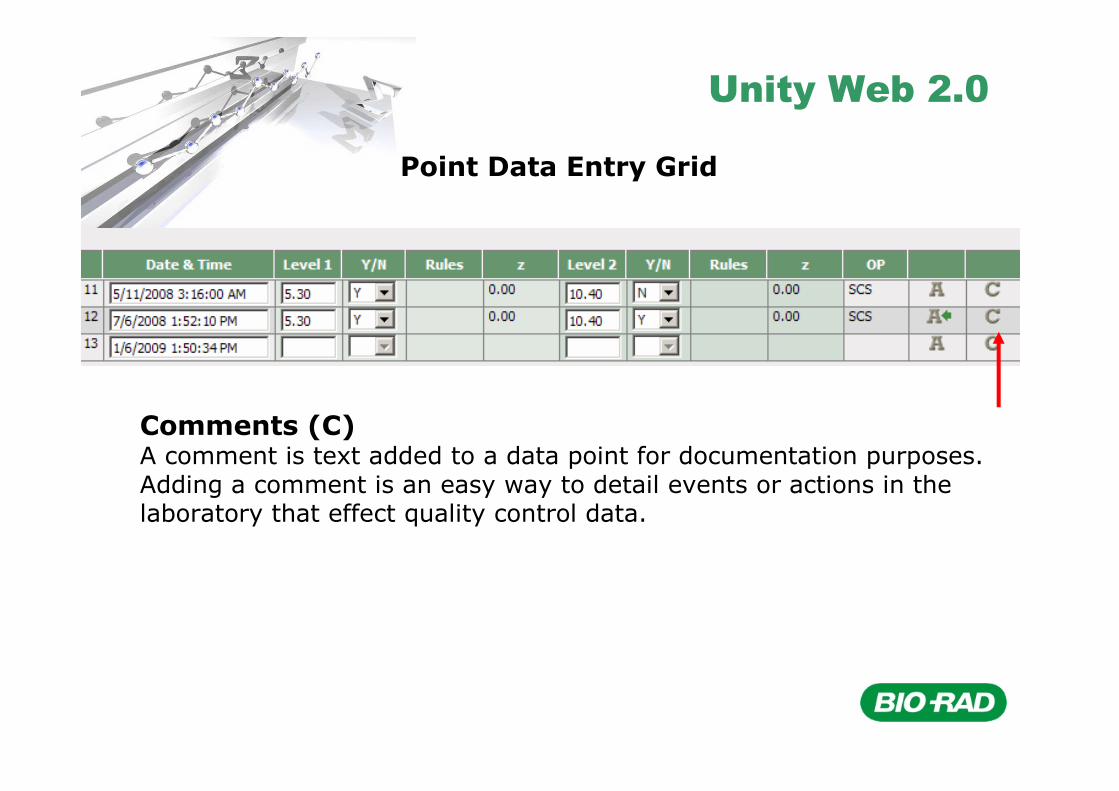
Comments (C)A comment is text added to a data point for documentation purposes. Adding a comment is an easy way to detail events or actions in the laboratory that effect quality control data.
Unity Web 2.0
Summary Statistics
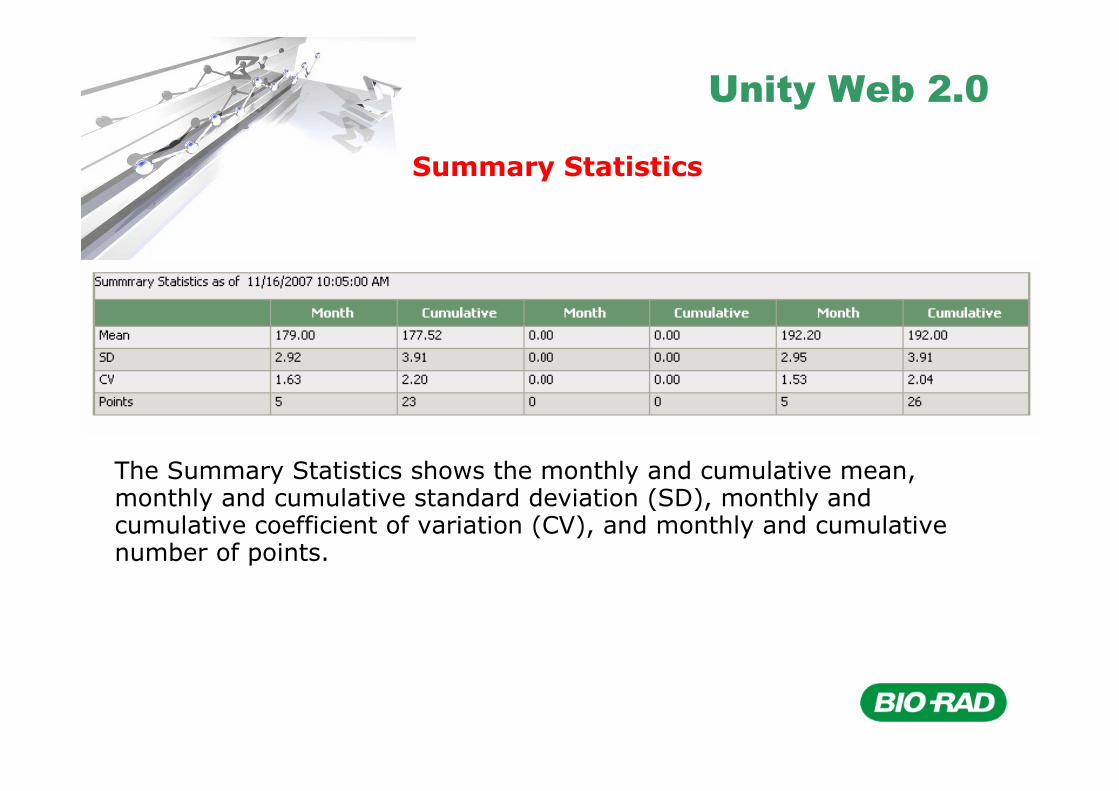
The Summary Statistics shows the monthly and cumulative mean, monthly and cumulative standard deviation (SD), monthly and cumulative coefficient of variation (CV), and monthly and cumulative number of points.
Unity Web 2.0
Unity Web 2.0OVERVIEW OF WINDOW PANELS
Path: DataEntry / Single Test Point Data Entry
To enter Data …To enter QC Data …
• Click the Data Entry tab.• Click Single Test Point Data Entry.• Select the lab number from the Lab list.• Select the lot number from the Lot list.• Select the test from the Test list.• Set Date and select a starting date for data entry.
Unity Web 2.0OVERVIEW OF WINDOW PANELS
Path: DataEntry / Single Test Point Data Entry
To enter Data …
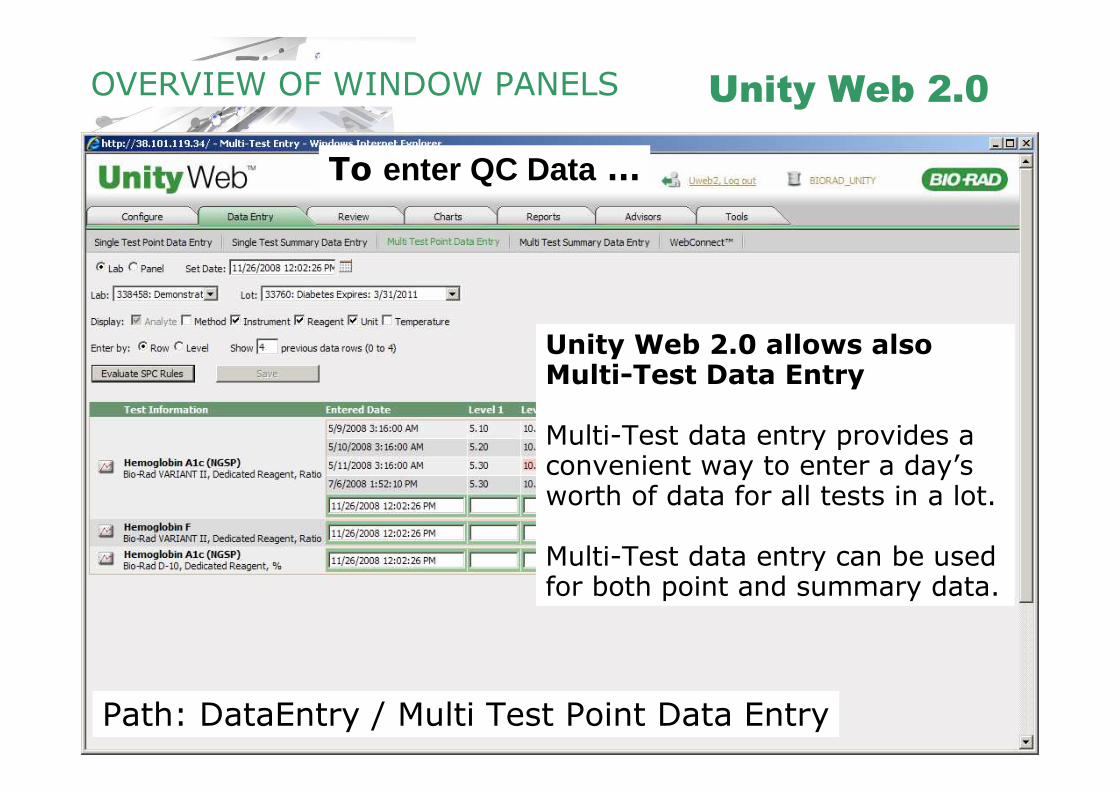
Path: DataEntry / Multi Test Point Data Entry
To enter QC Data …
Unity Web 2.0 allows alsoMulti-Test Data Entry
Multi-Test data entry provides a convenient way to enter a day’s worth of data for all tests in a lot.
Multi-Test data entry can be usedfor both point and summary data.
Unity Web 2.0OVERVIEW OF WINDOW PANELS
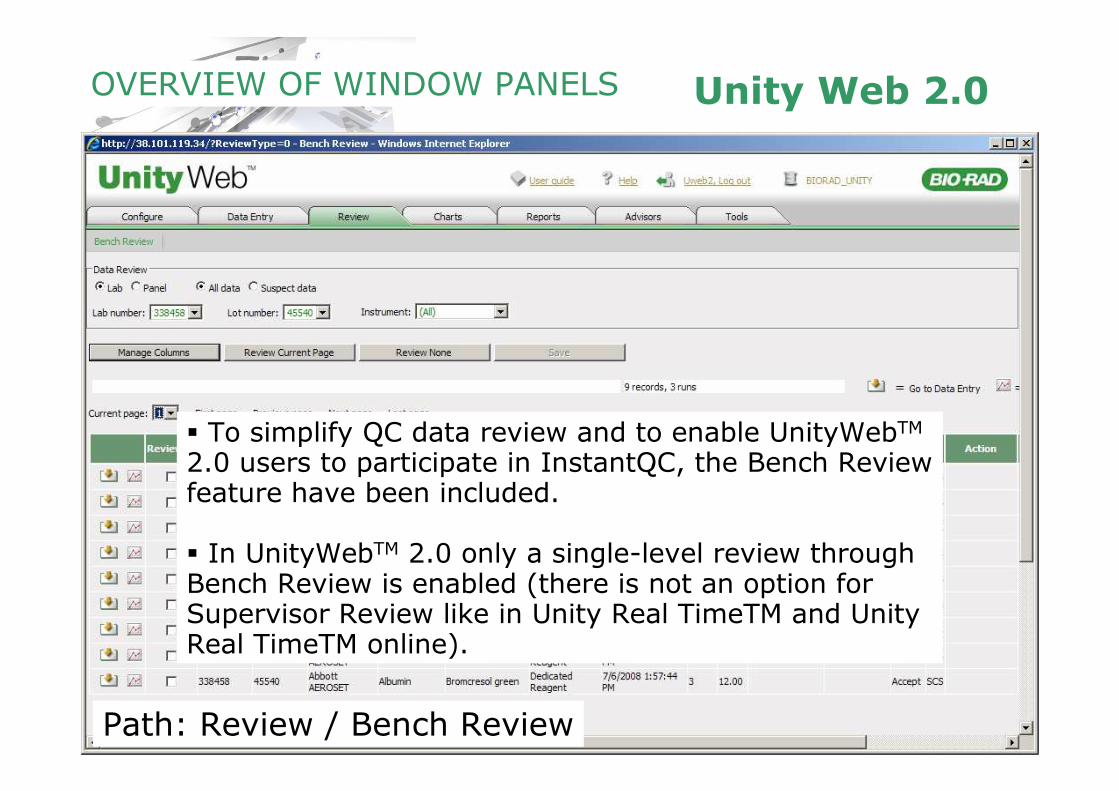
Path: Review / Bench Review
� To simplify QC data review and to enable UnityWebTM
2.0 users to participate in InstantQC, the Bench Review feature have been included.
� In UnityWebTM 2.0 only a single-level review through Bench Review is enabled (there is not an option for Supervisor Review like in Unity Real TimeTM and Unity Real TimeTM online).
Unity Web 2.0OVERVIEW OF WINDOW PANELS
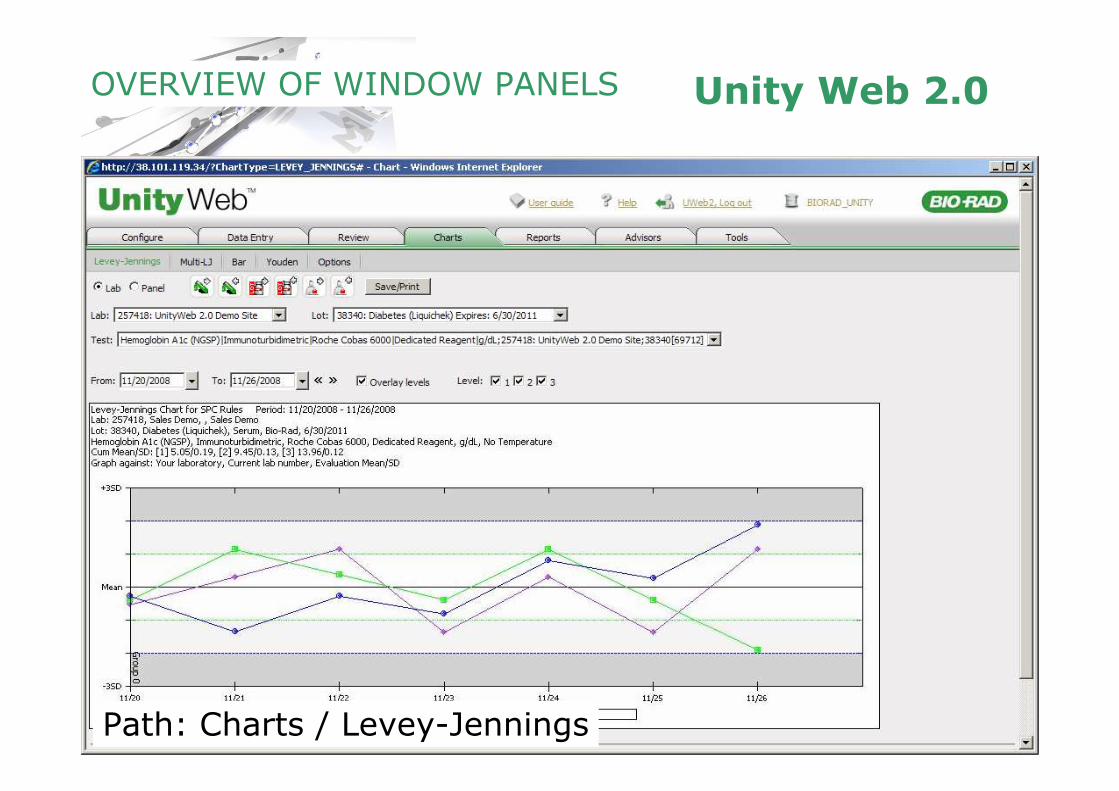
Path: Charts / Levey-Jennings
Unity Web 2.0OVERVIEW OF WINDOW PANELS
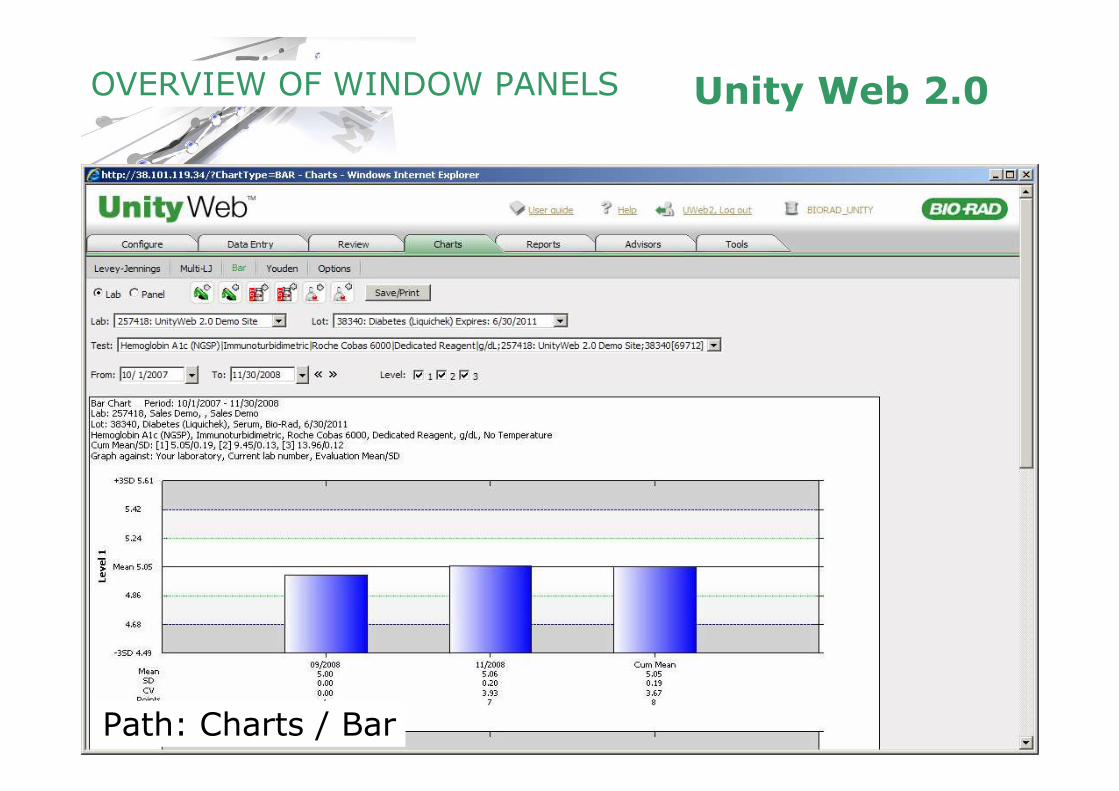
Path: Charts / Bar
Unity Web 2.0OVERVIEW OF WINDOW PANELS
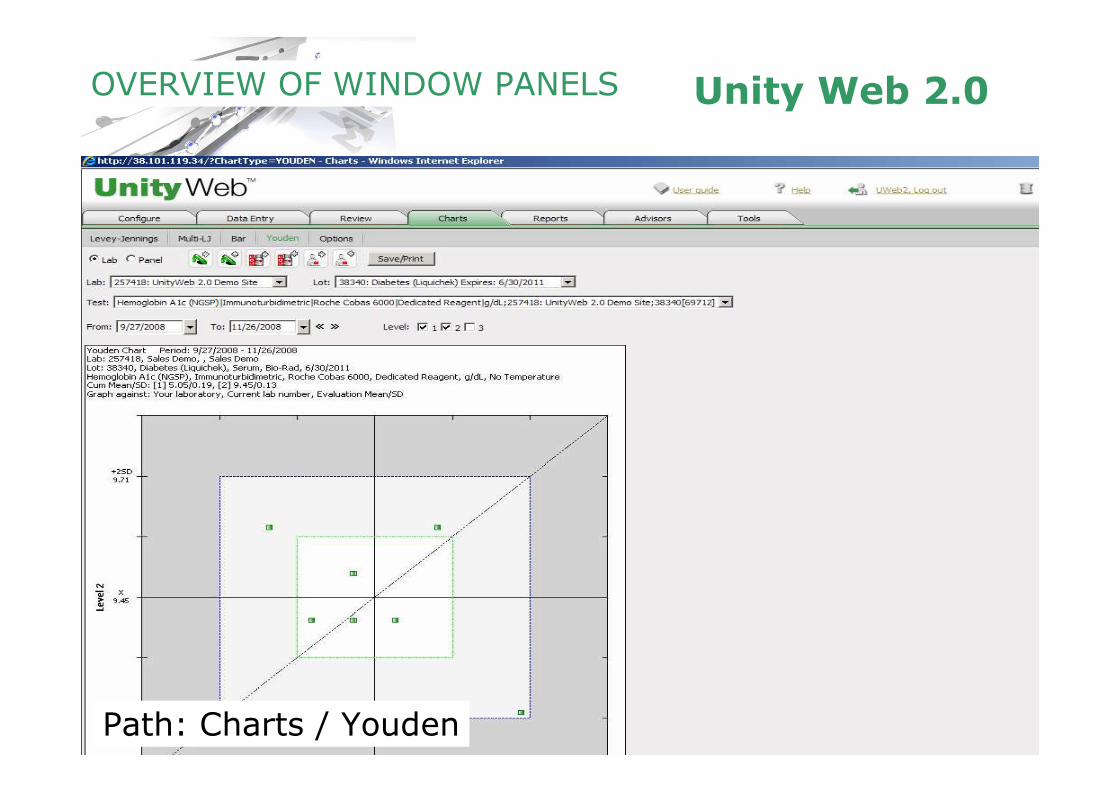
Path: Charts / Youden
Unity Web 2.0OVERVIEW OF WINDOW PANELS
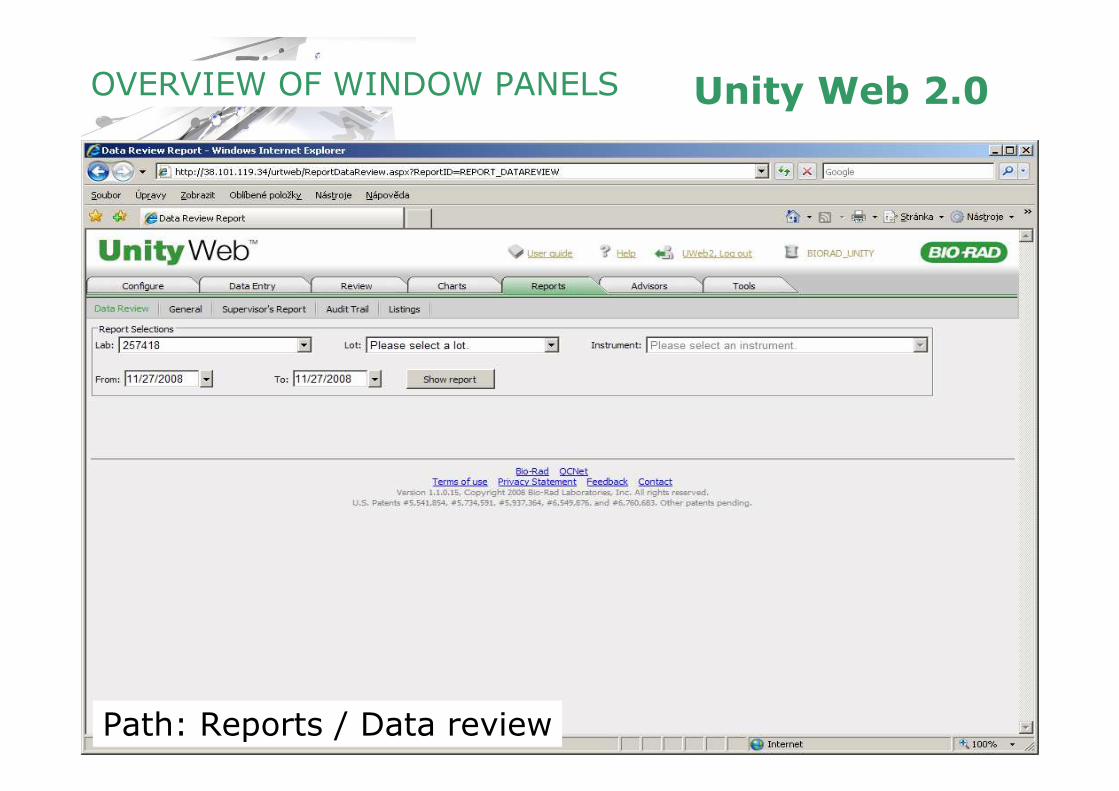
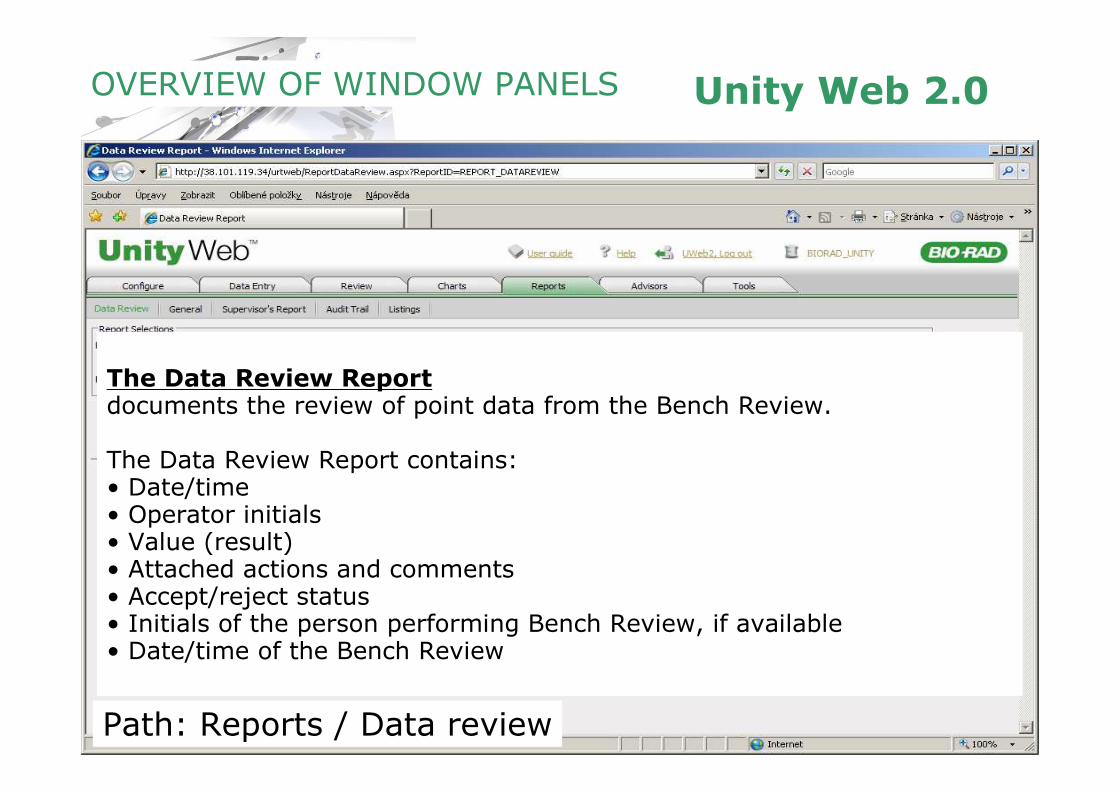
Path: Reports / Data review
Unity Web 2.0OVERVIEW OF WINDOW PANELS
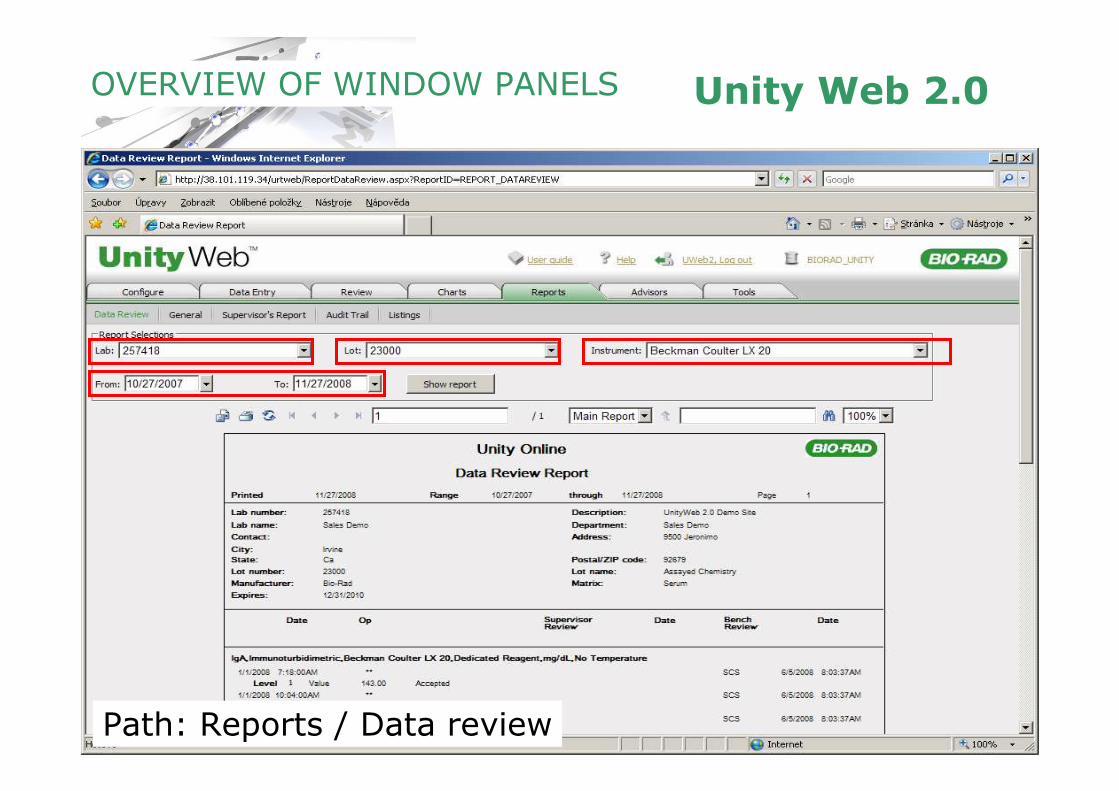
Path: Reports / Data review
Unity Web 2.0OVERVIEW OF WINDOW PANELS
Path: Reports / Data review
The Data Review Reportdocuments the review of point data from the Bench Review.
The Data Review Report contains:• Date/time• Operator initials• Value (result)• Attached actions and comments• Accept/reject status• Initials of the person performing Bench Review, if available• Date/time of the Bench Review
Unity Web 2.0OVERVIEW OF WINDOW PANELS
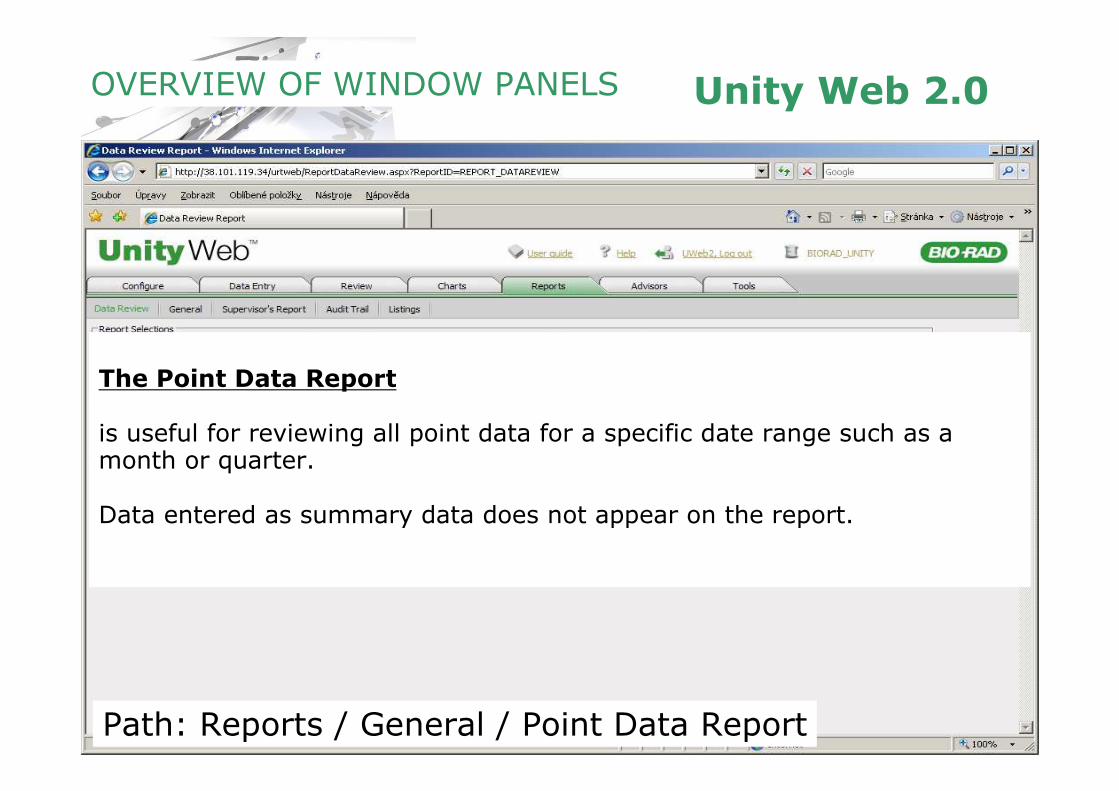
Path: Reports / General / Point Data Report
The Point Data Report
is useful for reviewing all point data for a specific date range such as a month or quarter.
Data entered as summary data does not appear on the report.
Unity Web 2.0OVERVIEW OF WINDOW PANELS
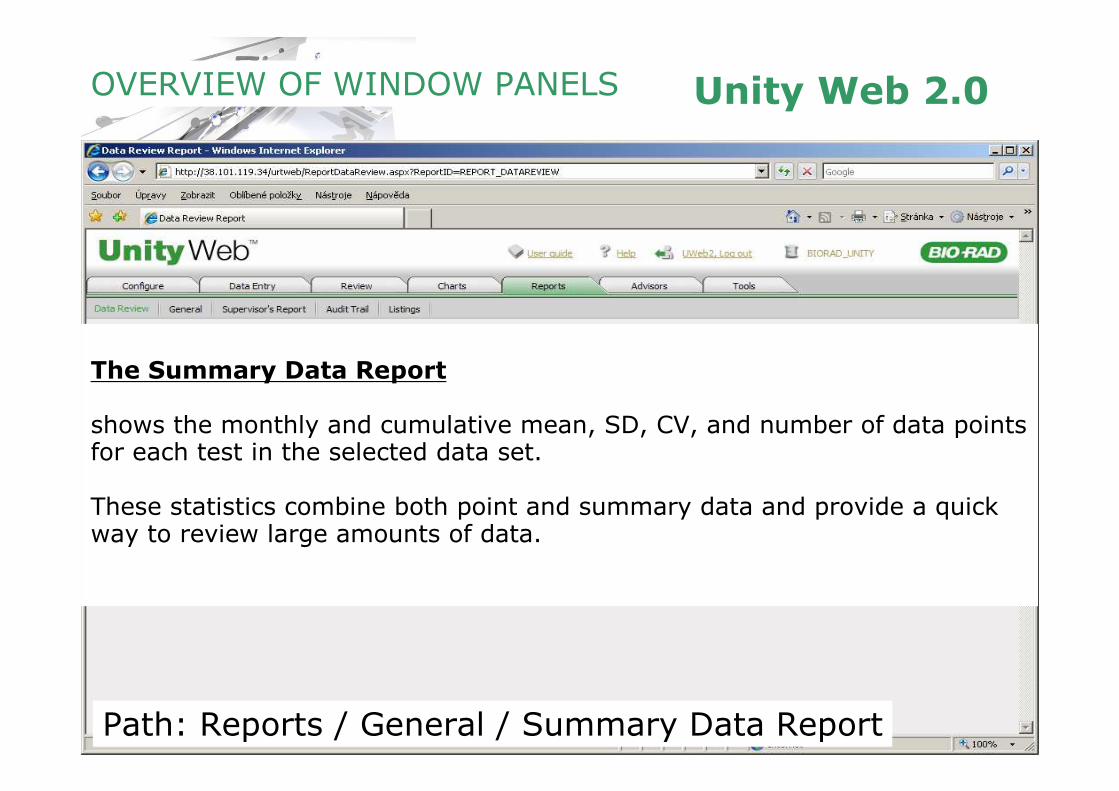
Path: Reports / General / Summary Data Report
The Summary Data Report
shows the monthly and cumulative mean, SD, CV, and number of data points for each test in the selected data set.
These statistics combine both point and summary data and provide a quick way to review large amounts of data.
Unity Web 2.0OVERVIEW OF WINDOW PANELS
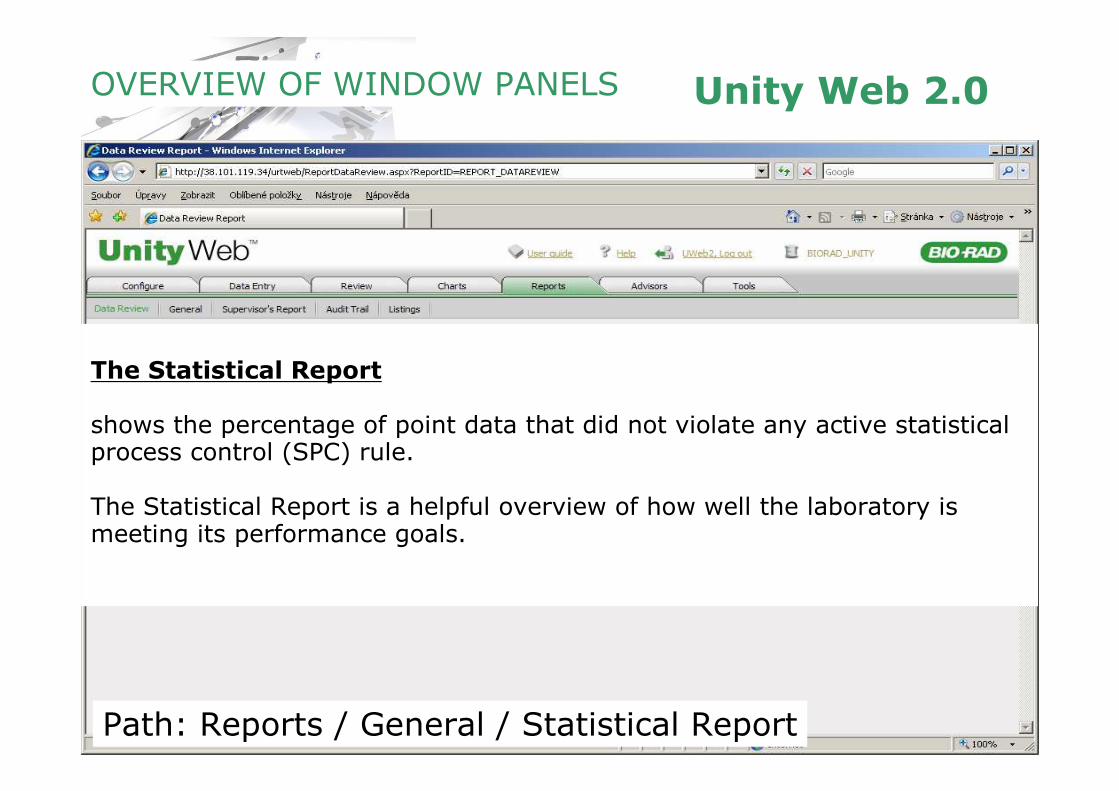
Path: Reports / General / Statistical Report
The Statistical Report
shows the percentage of point data that did not violate any active statistical process control (SPC) rule.
The Statistical Report is a helpful overview of how well the laboratory is meeting its performance goals.
Unity Web 2.0OVERVIEW OF WINDOW PANELS
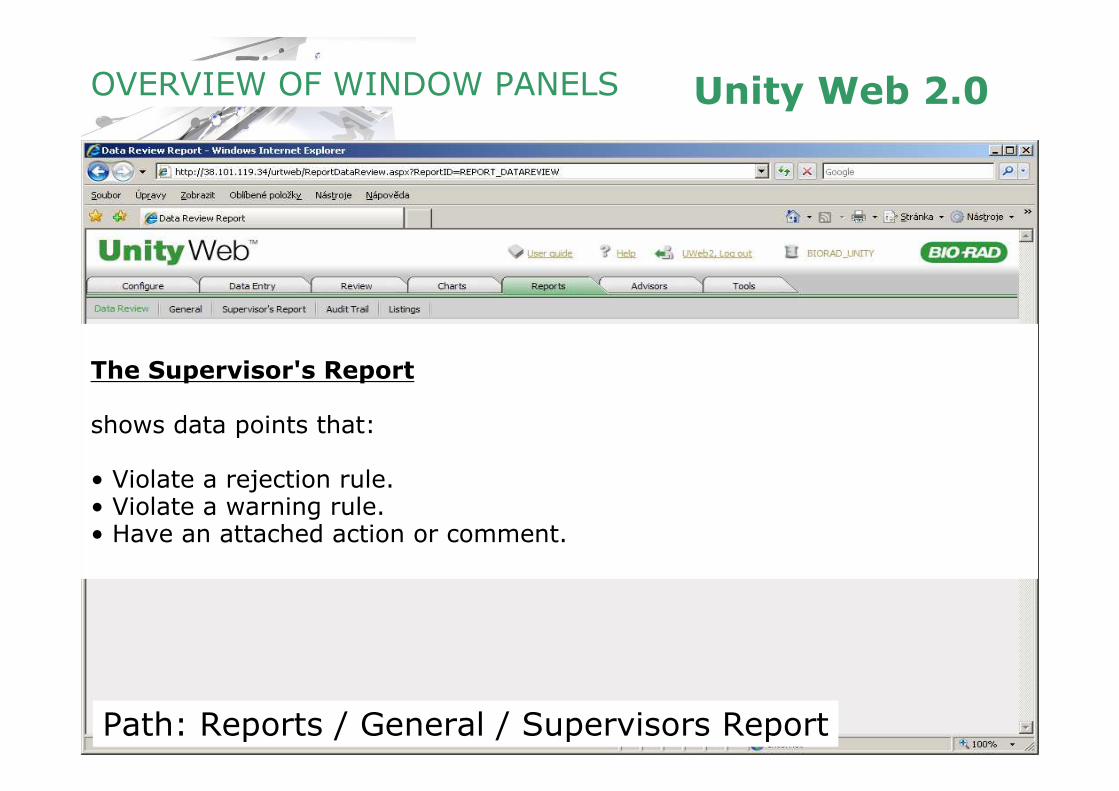
Path: Reports / General / Supervisors Report
The Supervisor's Report
shows data points that:
• Violate a rejection rule.• Violate a warning rule.• Have an attached action or comment.
Unity Web 2.0OVERVIEW OF WINDOW PANELS
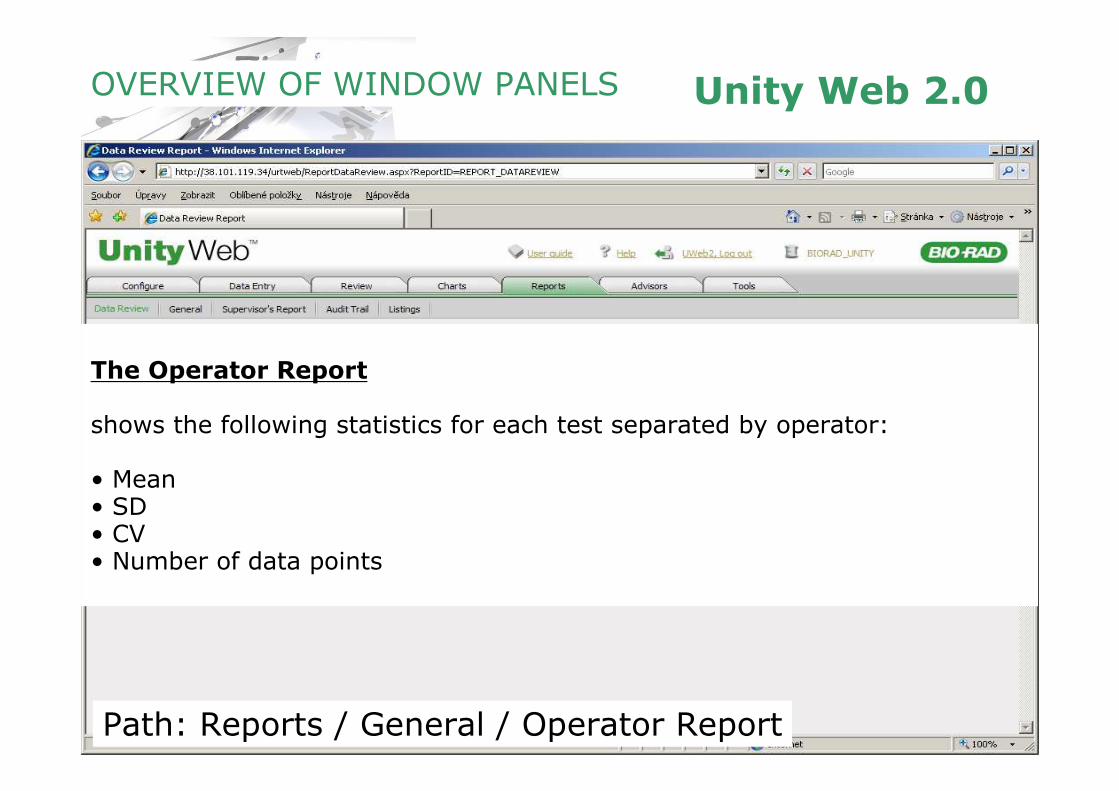
Path: Reports / General / Operator Report
The Operator Report
shows the following statistics for each test separated by operator:
• Mean• SD• CV• Number of data points
Unity Web 2.0OVERVIEW OF WINDOW PANELS
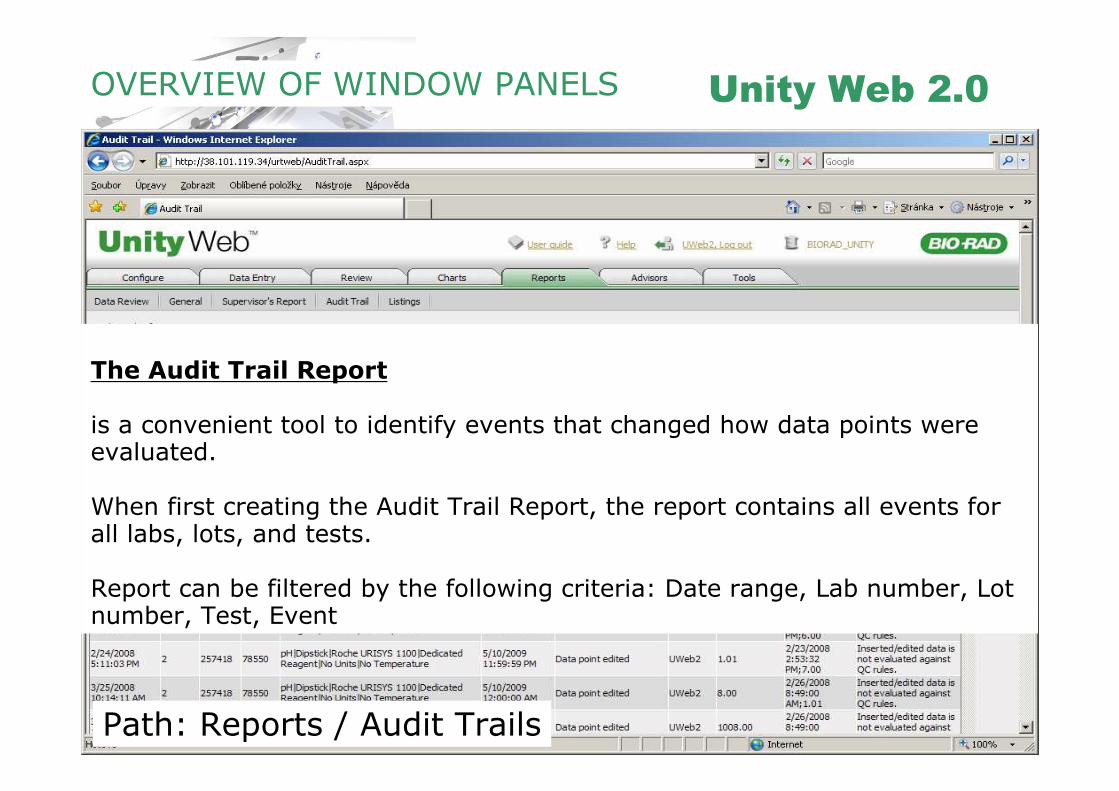
Path: Reports / Audit Trails
The Audit Trail Report
is a convenient tool to identify events that changed how data points were evaluated.
When first creating the Audit Trail Report, the report contains all events for all labs, lots, and tests.
Report can be filtered by the following criteria: Date range, Lab number, Lot number, Test, Event
Unity Web 2.0OVERVIEW OF WINDOW PANELS
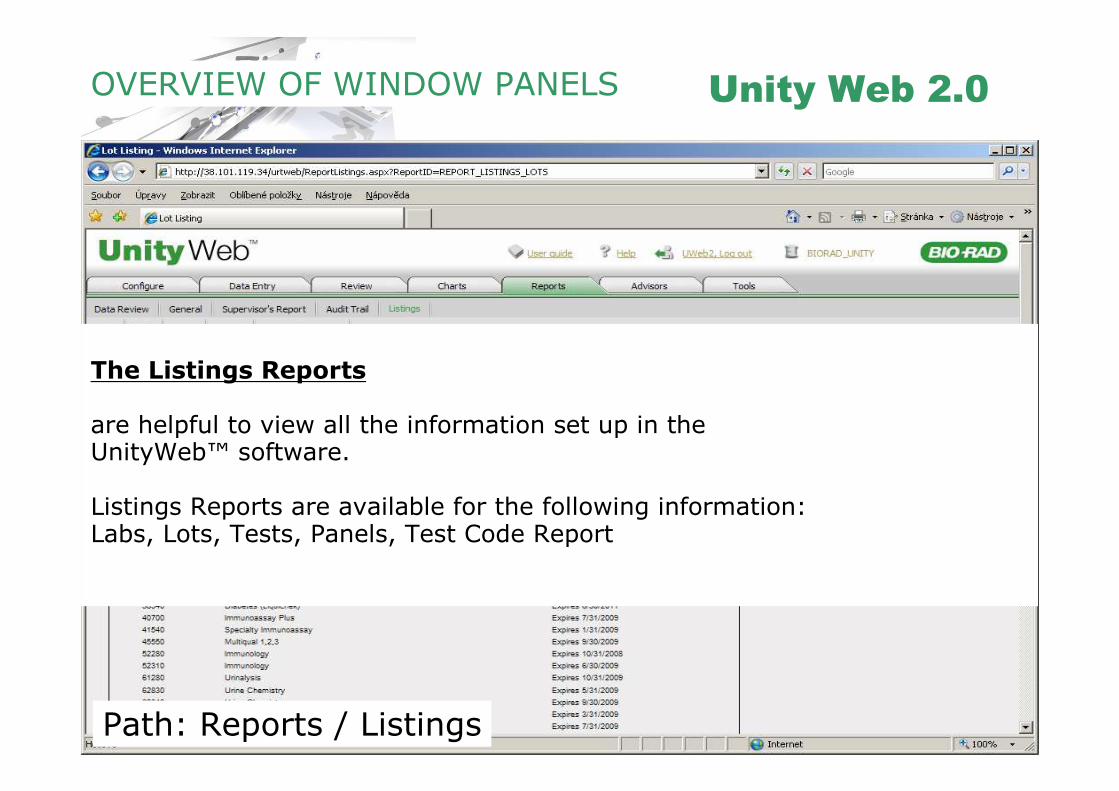
Path: Reports / Listings
The Listings Reports
are helpful to view all the information set up in theUnityWeb™ software.
Listings Reports are available for the following information:Labs, Lots, Tests, Panels, Test Code Report
Unity Web 2.0OVERVIEW OF WINDOW PANELS
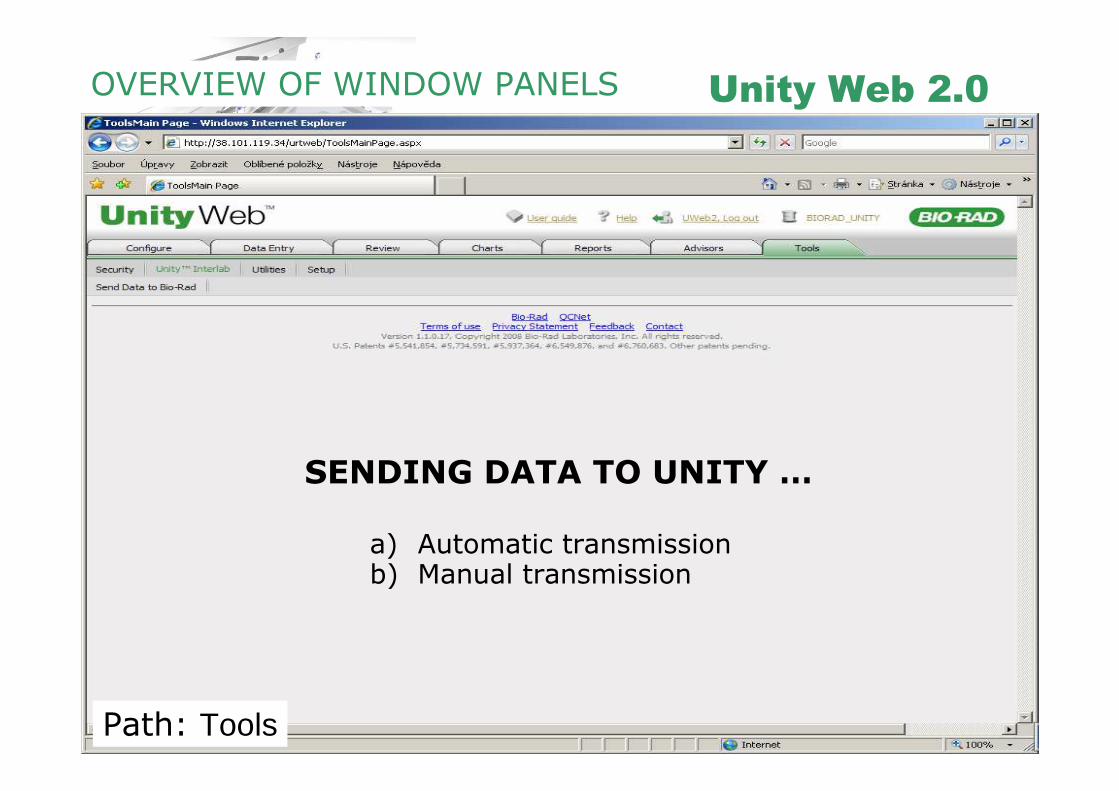
Path: Tools
SENDING DATA TO UNITY …
a) Automatic transmissionb) Manual transmission
Unity Web 2.0OVERVIEW OF WINDOW PANELS
Path: Tools
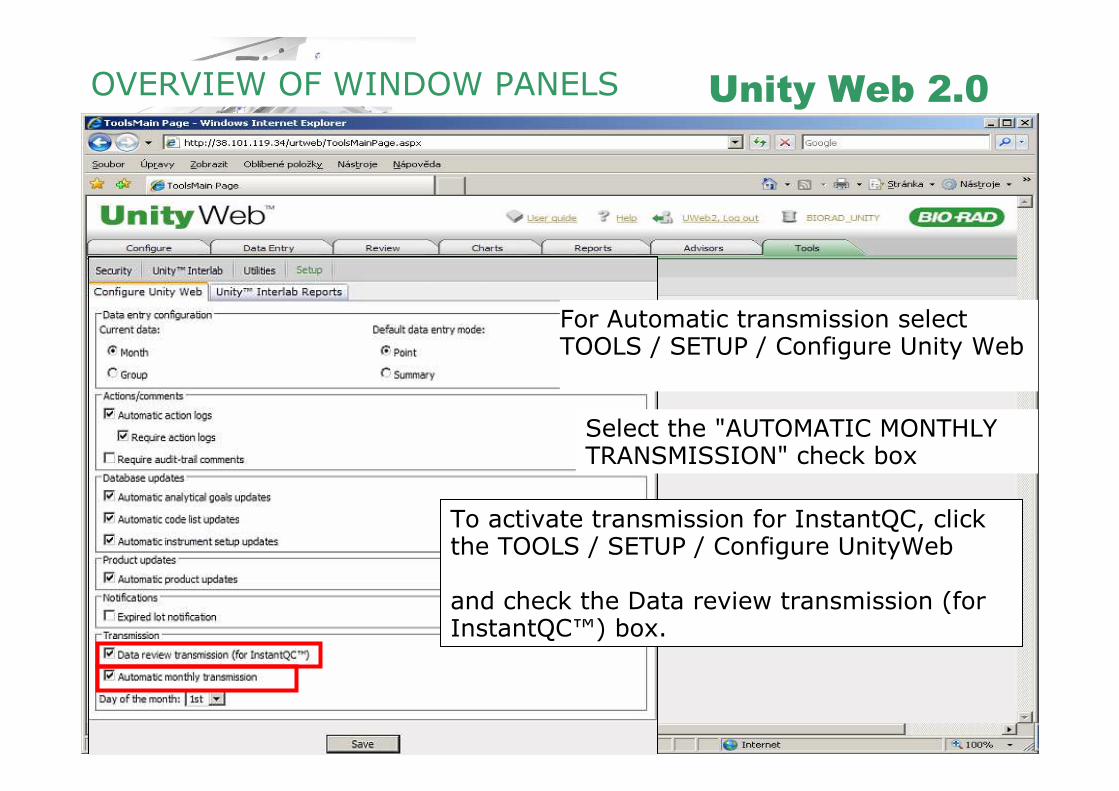
For Automatic transmission select TOOLS / SETUP / Configure Unity Web
Select the "AUTOMATIC MONTHLY TRANSMISSION" check box
To activate transmission for InstantQC, click the TOOLS / SETUP / Configure UnityWeb
and check the Data review transmission (for InstantQC™) box.
Unity Web 2.0OVERVIEW OF WINDOW PANELS
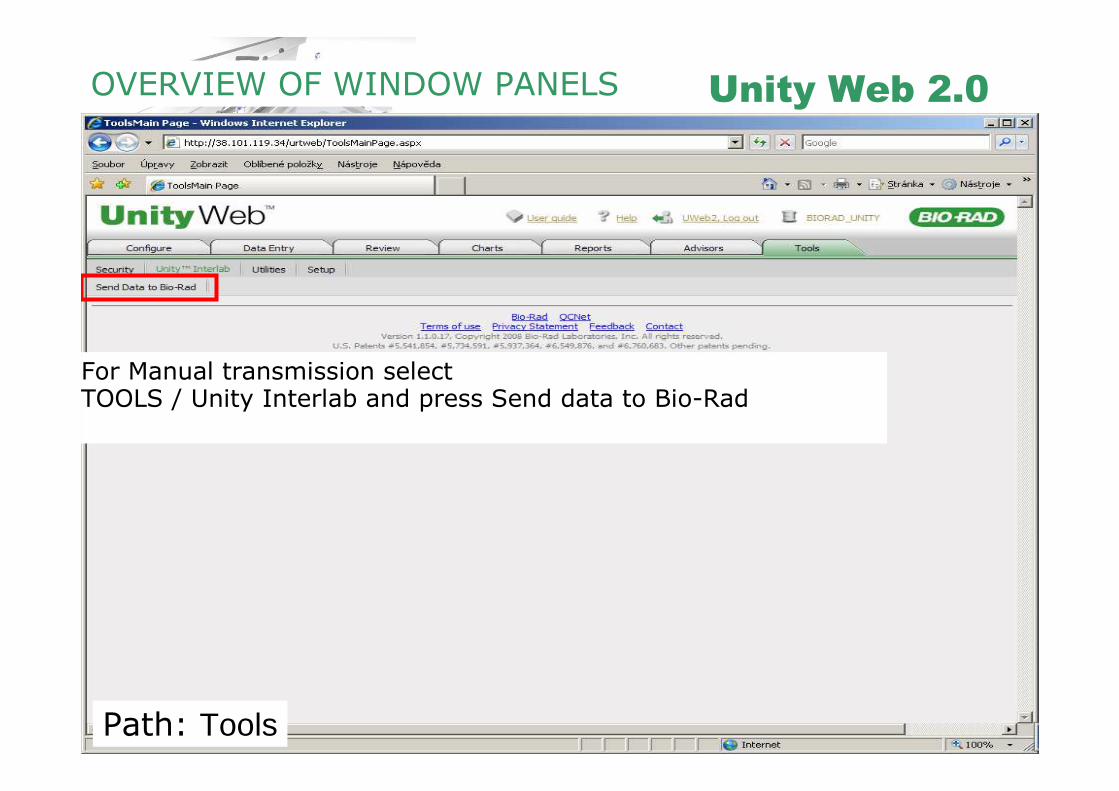
Path: Tools
For Manual transmission select TOOLS / Unity Interlab and press Send data to Bio-Rad
Unity Web 2.0
� Eliminates the need to install, update and
support software on local systems
� The easiest solution to implement for customers
to participate in the Unity™ Interlaboratory
Program
� Facilitates compliance with regulatory and
accreditation requirements (e.g. ISO 15189 and
CLIA).
� Provides high-quality statistical process control
with comprehensive audit trails.
Unity Web 2.0
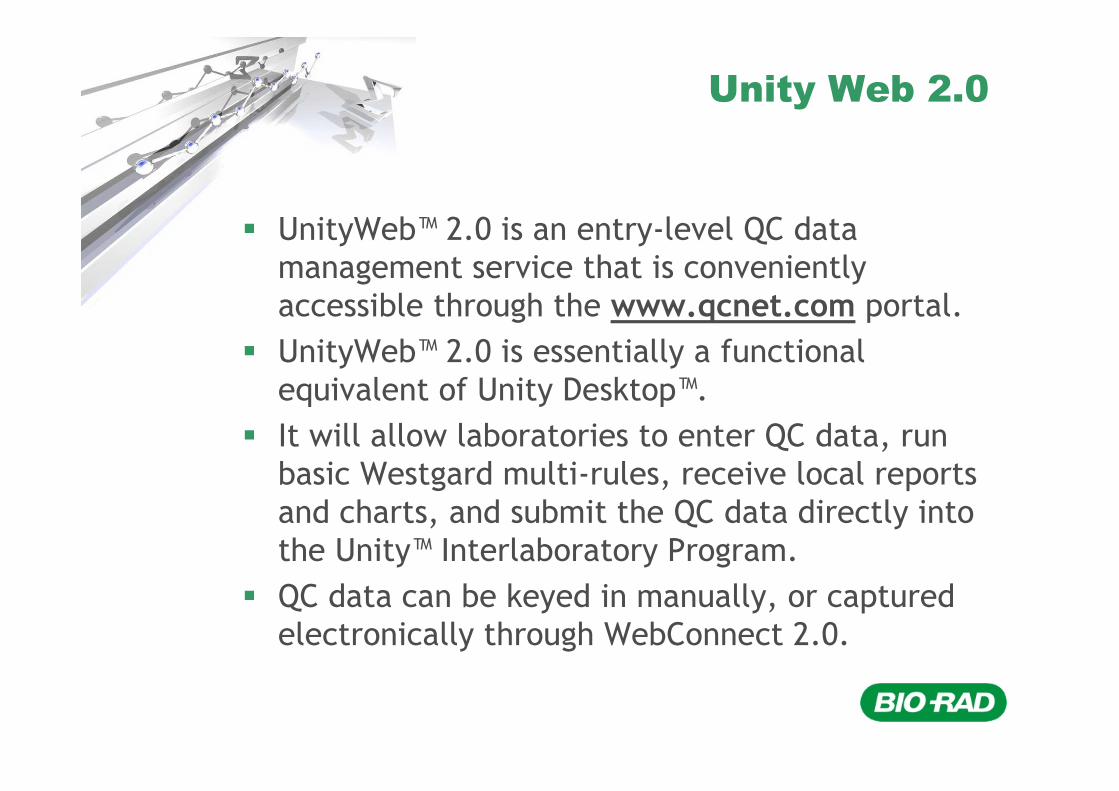
� UnityWeb™ 2.0 is an entry-level QC data
management service that is conveniently
accessible through the www.qcnet.com portal.
� UnityWeb™ 2.0 is essentially a functional
equivalent of Unity Desktop™.
� It will allow laboratories to enter QC data, run
basic Westgard multi-rules, receive local reports
and charts, and submit the QC data directly into
the Unity™ Interlaboratory Program.
� QC data can be keyed in manually, or captured
electronically through WebConnect 2.0.
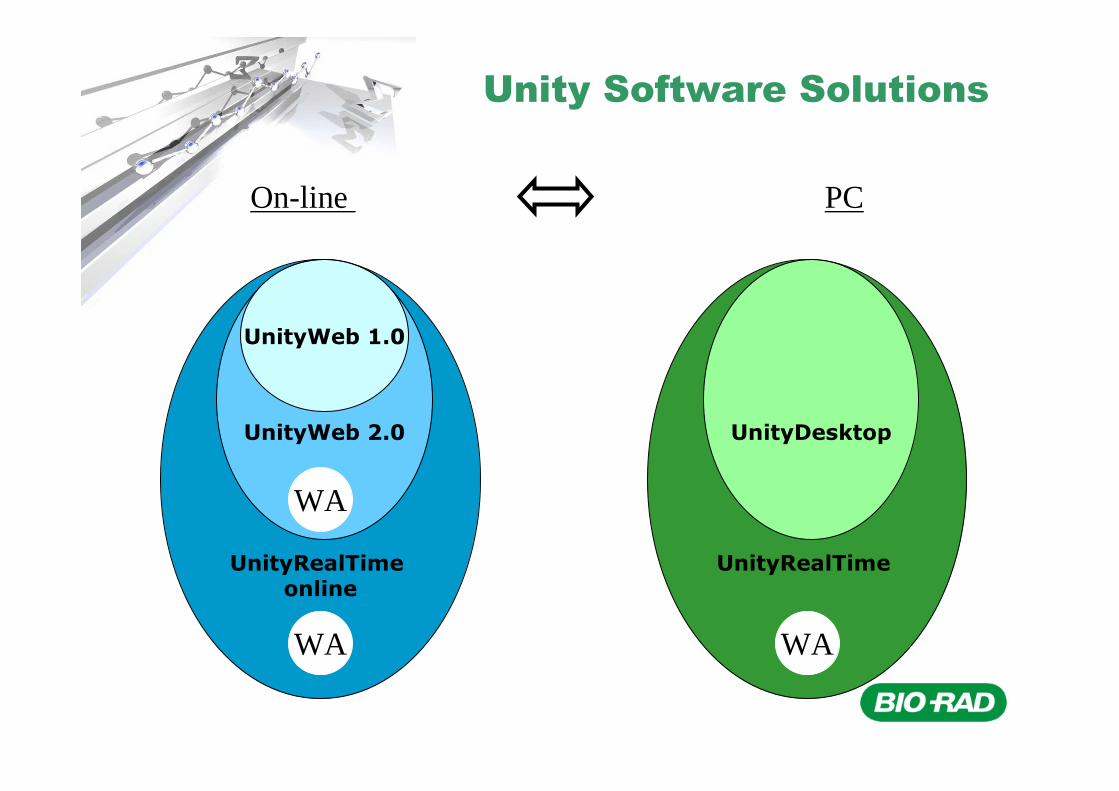
Unity Software Solutions
UnityRealTimeonline
On-line PC
UnityWeb 2.0
UnityWeb 1.0
UnityRealTime
UnityDesktop
WAWA
WA
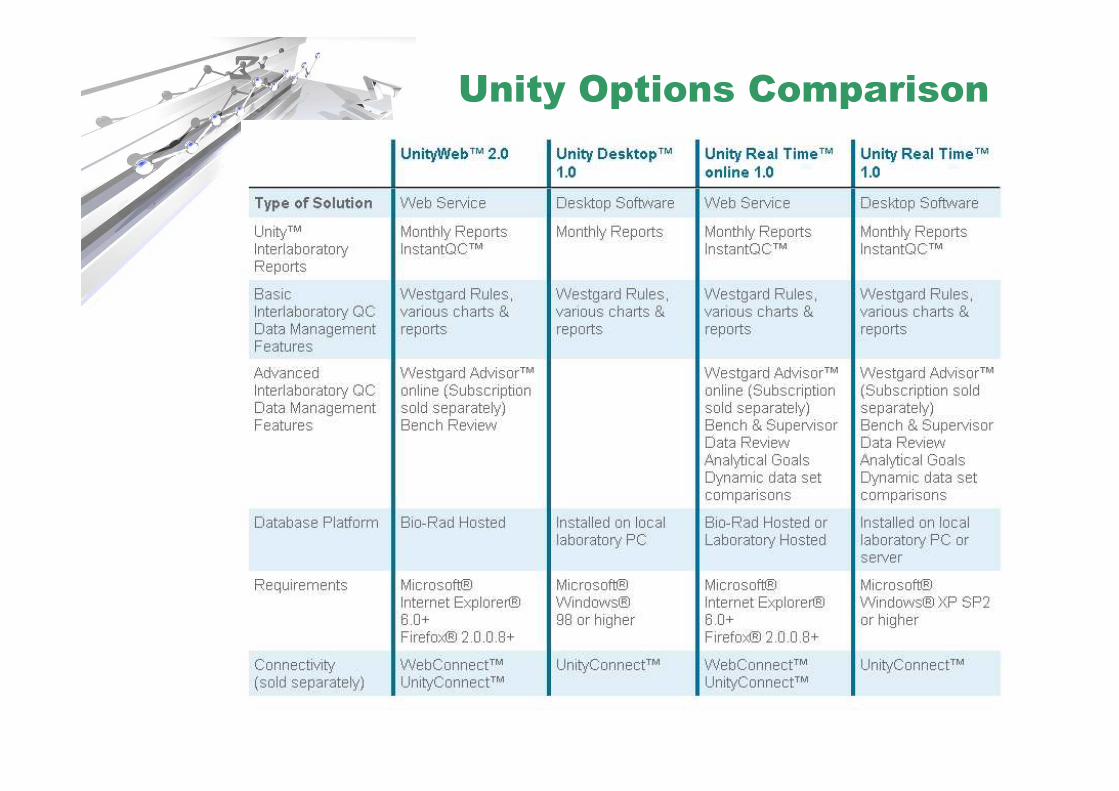
Unity Options Comparison
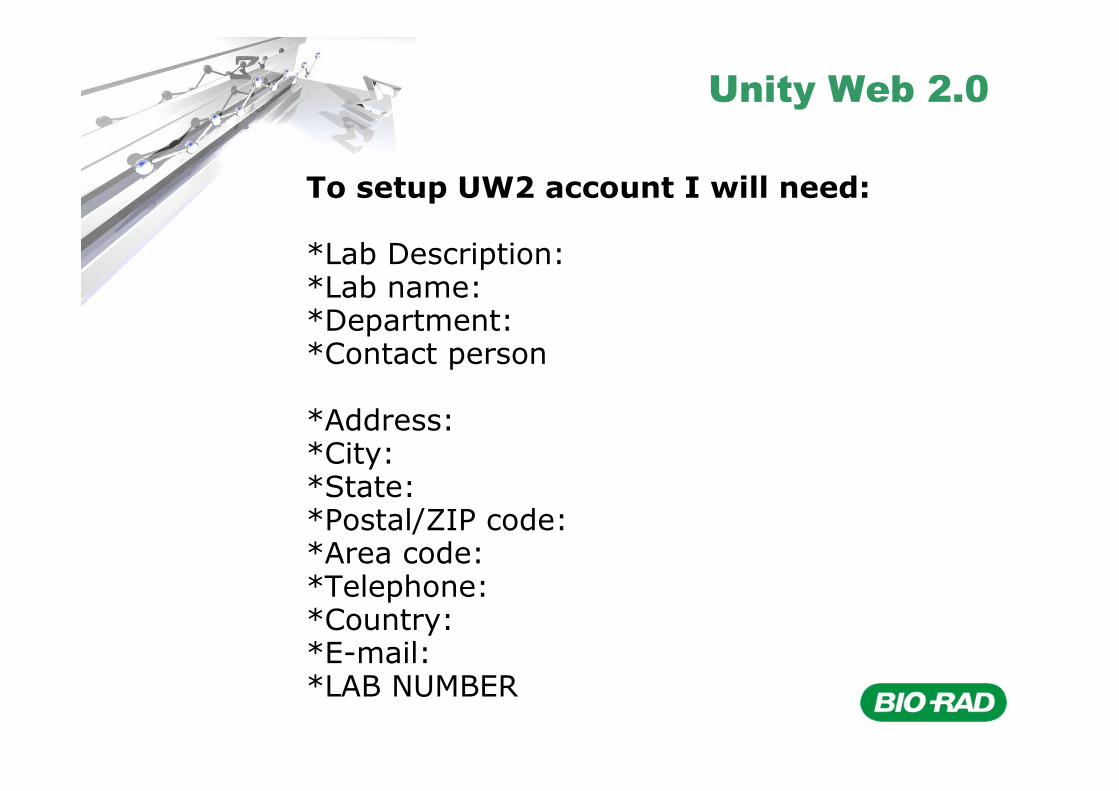
Unity Web 2.0
To setup UW2 account I will need:
*Lab Description: *Lab name: *Department: *Contact person
*Address: *City: *State: *Postal/ZIP code: *Area code: *Telephone: *Country:*E-mail: *LAB NUMBER
Thank You