Embed Size (px)
Citation preview

UBBARYTWfKUUCAI. REPORT SECTION
S SCHOOLKeONTKHST, CAUIOSaU 98840
WPS-57LN70071A
United StatesNaval Postgraduate School
//
A SIMULATOR EVALUATION OF PILOT PERFORMANCE
AND ACCEPTANCE OF AN AIRCRAFT RIGID COCKPIT
CONTROL SYSTEM
by
Donald M. Layton
15 July 1970
This document has been approved for publicrelease and sale; its distribution is unlimited.
FEDDOCSD 208.14/2: NPS-57LN70071
A


NAVAL POSTGRADUATE SCHOOL
Monterey , California
Rear Admiral R. W. McNitt, USN R. F. RinehartSuperintendent Academic Dean
ABSTRACT
:
A ground-based simulator facility employing a two-axiscompensatory tracking task with a random appearing signalwas used to evaluate the performance of one hundred fivepilot and non-pilot test subjects using four separate con-trol sticks -- two moveable and two rigid. Pilot acceptanceof the rigid cockpit controllers was determined by compar-ing individual pilot ratings of the sticks. In general, inboth performance and opinion, the rigid systems were foundto be superior to their moveable counterparts. Steps weretaken to avoid errors due to pilot bias, learning, fatigue,or adapation. The results obtained are subject to severaltest limitations, including the low stick-force levels em-ployed, the lack of aircraft vibration effects, and therealism of the simulation.
This task was supported by: Navy Department, Naval AirSystems Command Air TaskA31310/551/70R0050101
S~\


TABLE OF CONTENTS
I Introduction 7
II Simulator Facility 10
III Control Sticks 13
IV Analog Computer Circuit 19
V Analog Timer Circuit 21
VI Testing Procedure 23
VII Analysis and Classification of Test Subjects ...28
VIII Test Results 32
IX Human Factors Involvement with Test Validity ...36
X Discussion and Conclusions 45
Appendix A - List of Equipment 75
Appendix B - Pilot Flight Experience Data 76
Appendix C - Pilot Scoring and Rating Data 80
Appendix D - Distribution of Test Scores and Ratings ...84
Bibliography 95
Initial Distribution List 97
Form DD 1473 99

LIST OF FIGURES
1. Overall View RED BARON Cockpit 49
2. Internal View RED BARON Cockpit 49
3. Display Console 50
4. Control and Switching Panel 50
5. Wheatstone Bridge Circuit 51
6. Overall View Simulator Facility 52
7. Moveable Deck-mounted Stick 52
8. Moveable Side-arm Stick 53
9. Rigid Deck-mounted Stick 53
10. Rigid Side-arm Stick 54
11. Hand-grip Mold 54
12. Analog Circuit 55
13a Flexure, Rigid Deck-mounted Stick 56
13b Flexure, Rigid Side-arm Stick 57
14. Analog Output from Step Input (longitudinal) 58
15. Analog Output from Step Input (lateral) 58
16. Timing Circuit 59
17. Typical Scoring Run (longitudinal) 60
18. Typical Scoring Run (lateral) 60
19. Average Test Score by each Pilot Classification 61
20. Average Rating by each Pilot Classification 62
21. Average Test Score with each Stick - All Subjects 63
22. Average Test Score by Pilot Class for each Stick 64
23. Average Rating by Pilot Class for each Stick 65
24. Distribution of Test Scores - All Subjects 66
25. Distribution of Pilot Opinions - All Subjects 67
26. Correlation of Pilot Opinion to Performance 68
27. Score-to-Rating Regression Analysis 69
28. Average Correlations of Scores to Opinions 70
29. Average Pilot Scoring Pace Throughout Test Run 71
30. Pilot Frequency Response with Rigid Side-arm Stick 72
31. Pilot Frequency Response with Moveable Center Stick 73
32. Average Pilot Rating for each Stick - All Subjects 74


I. INTRODUCT ION
It has been traditional for aircraft to have cockpit
control sticks that move in a certain direction a given
amount in order to impart movement to the control surfaces.
This type of control has evolved from the low complexity
system where the control stick is directly connected to the
control surfaces (reversible control) so that stick deflect-
ion is a direct measure of control surface deflection. On
modern, high-speed aircraft, however, the forces required
to move the control surfaces may exceed the physical cap-
ability of a human pilot and some form of powered or power-
assisted control system is necessary. In fully powered con-
trol systems, there is no direct force or position coupling
between the pilot's control stick and the control surfaces,
and any cockpit indications must come from 'artificial'
feedback signals.
As the simple mechanical control systems of the past are
replaced by complex linkages and fully-powered or power-boost
controls, numerous problems concerned with flight control
system weight, nonlinear ities , friction, hysteresis, inertia
and backlash arise. These problems, together with the increased
reliance on stability augmentation, have stimulated investi-
gations of electronic control systems (fly-by-wire). Fly-by-
wire research has now advanced to the point where test flights
are being made and favorable and reliable results are being
reported. (Ref. 1).
The change from mechanical to electrical control systems

offers various possibilities for a cockpit controller that
is different from the conventional, deck-mounted moveable
stick. Numerous manipulators have been studied, the most
prominent of which is a side-located, limited motion hand
controller (Refs. 2,3,4,5,6). These systems allow increased
cockpit space for flight displays or for additional control
functions and depend, for the most part, on a reliable fly-
by-wire capability.
The most important parameter when considering different
control sticks is that of the aircraft handling qualities.
The pilot; regards stick feel as a most valuable cue (Ref . 7-}.
Due to the irreversibility of power-assisted electronic flight
control systems, this feel must be provided artificially to
the stick - whether center or side mounted. Inasmuch as the
pilot relies heavily on this stick force, the actual motion
of the controls is of much lesser importance. In fact, it is
widely recognized that, except possibly during the landing
flare, the pilot seldom, if ever, knows the position of his
control stick. (Ref. 4,8). This suggests that a force-only
(rigid) controller could be applicable to a fly-by-wire con-
trol system. Such a rigid stick might prove more satisfactory,
if not for primary control, as a back-up precision tracker to
be used for formation flying, terrain avoidance, weapon con-
trol and delivery, carrier landings, or ground controlled
approaches. Such a back-up system may also prove highly val-
uable in the case of mechanical failure or combat damage to
the primary control system.
8

Limited investigations have been made of rigid sticks
(Refs. 4,9,10,11,12,13,14), but the reported results have
been contradictatory and essentially inconclusive.
Inasmuch as handling qualities are inevitably determined
from pilot opinion, a simulator facility was developed to
permit the evaluation of rigid control sticks by comparing
them to similar conventional, moveable sticks. This simu-
lator, called a Research and Educational Device for Basic
Aeronautics (RED BARON), employs a two-axis, compensatory
tracking task with a repeatable, random-appearing signal.
This investigation used this simulator to measure pilot per-
formance for one hundred five test subjects on each of four
control sticks - two moveable and two rigid. This perform-
ance was compared with individual pilot ratings of the sep-
arate controllers. Personal pilot experience was collected
to insure a thorough test subject analysis. Scores were
also recorded during a portion of the test runs to determine
the effects on the data, if any, of pilot learning, adaption,
or fatigue. An approximate human transfer study was conducted
using two sticks and two subjects for the purpose of correl-
ation. Additional qualitative comments from the test subjects
were recorded and a statistical score-to-rating correlation
study was made.
9

II. SIMULATOR FACILITY
The simulator facility (RED BARON) designed and built
for this evaluation has as its major components a Cathode
Ray Tube display (oscilloscope), an analog computer,
an electronic counter, a low-frequency function generator,
a tape deck, a two-channel visual recorder, an electric
timer, a cockpit environment housing, and interface equip-
ment. An equipment listing is contained in Appendix D.
Figure 1 shows the overall view of the simulator cockpit
environment housing which was constructed on a 96" x 34"
base on which was mounted a salvaged FJ aircraft ejection
seat. A cover was constructed over a frame to create an
aircraft cockpit environment. The CRT display was mounted
in the windscreen area to give the required visual reference
for the tracking problem. Figure 2 shows a partial internal
view of the cockpit with the lower portion of the CRT (with-
out the cover panel), the pilot's seat and the rigid stick
visible.
The tape recorder provides a repeatable testing signal
which is displayed on an X-Y CRT with a five inch grid.
The pilot-operated control stick generates a signal which,
when amplified, acts to cancel out the random input signal
from the tape, moving the displayed pip towards the center
of the grid. The control signal is altered in the analog
computer to simulate actual aircraft dynamics. Thus, in his
efforts to center the pip on the display, the test subject
has a constant display of the error signal.
A ventilator fan, which is activated by the closing of
10

the entrance door, was installed to cool the simulator
cockpit. In addition, a small fan was mounted in the wind-
screen area to cool the CRT assembly.
The test subject could correct for parallax by using
the horizontal and vertical position knobs on the display
console (Fig. 3) to center the pip under the mid-grid lines.
The Airspeed Indicator shown in Figure 3 and a throttle
assembly were not used during this evaluation.
Green and blue indicator lights were installed on the
display console above the CRT (Fig. 3). The green light
indicates when the target pip is in the scoring area
(Scorer) and the blue light indicates when the electronic
counter circuit is energized (Timer). These lights are
duplicated for the facility operator on the Control and
Switching Panel (Fig. 4).
The RED BARON has wiring installed for connection of the
four control units so that any stick, when plugged in, will
be connected to the output terminals when the stick selector
switches on the Control and Switching Panel are in the
proper position. A toggle switch selects Moveable or Rigid
stick systems and a four-position rotary switch selects the
desired control stick.
The two 12-wire bundles from the stick selector switch
are identical. One is routed to the side-arm controller
arm rest and the other goes to the deck-mounted stick area.
At the end of each wire bundle is a sixteen connector plug
which has twelve positions (Fig. 5) as follows:
11

1. Common junction of strain gage terminus (longitudinal)
2. Forward strain gage terminus (longitudinal)
3. Aft strain gage terminus (longitudinal)
4. Moveable stick output (longitudinal)
5. Common junction of strain gages (directional)
6. Left strain gage terminus (directional)
7. Right strain gage terminus (directional)
8. Moveable stick output (directional)
9. Plus five volts (longitudinal)
10. Minus five volts (longitudinal)
11. Plus five volts (directional)
12. Minus five volts (directional)
No rudder pedals or facsimiles thereof were installed
inasmuch as this was to be a two-axis problem and because
rudder is seldom used in single-engine jet aircraft in the
cruise configuration.
An overall view of the facility, including some of the
circuit wiring between system components is shown in Fig-
ure 6.
12

III. CONTROL STICKS
Four different control sticks were constructed for use
in this evaluation. Two of the sticks were of the conventional
moveable type using variable potentiometers as signal gen-
erators. The other two sticks were constructed as rigid types
using strain gages in a Wheatstone Bridge circuit as the
signal generators.
One of the rigid sticks and one of the moveable sticks
were made a"s deck-mounted types and the other two sticks were
made into side-arm controller units.
MOVEABLE DECK-MOUNTED STICK
The major components of the moveable deck-mounted stick
were salvaged from a North American FJ aircraft These parts,
consisting of the stick proper, pitch and roll fulcrums, and
lever arms were mounted on a plywood base. See Figure 7. The
height of the stick from the base is 25 5/8" with a moment
arm of 22" in the pitch direction and a moment arm of 16" in
the roll (lateral) direction. An artificial feel system was
installed to develop a stick force in proportion to stick
displacement simulating the control feel of a jet aircraft.
This artificial feel is provided by springs mounted in both
the fore and aft direction and in the lateral direction. No
bobweights were used. Two variable potentiometers were
mounted on the control unit, one to generate pitch signals,
and one to generate lateral signals. The variable potenti-
ometers are of the one-turn type driven by a 1:4 ratio gear
drive from the stick. The gearing between the stick position
and the simulated control surface deflection is a linear
13

relationship even though the majority of powered control
systems employ a non-linear gearing such that a relatively
greater stick deflection per control deflection will occur
at the neutral stick position. Plus and minus five volts
are the inputs to the potentiometers and the output signals
are the simulated position indicators of the control surfaces.
These outputs become the inputs to the switching circuit
shown in Figure 5, (for clarity, only the moveable hand
stick circuit is shown) and thence into the analog circuit
shown in Figure 12.
The plywood base fits snugly under the cockpit simulator
seat to provide a solid platform for the operation of the
stick. The input and output wires are attached to a sixteen
connector plug which permits the rapid change of control
sticks
.
MOVEABLE HAND STICK
The moveable hand stick, as shown in Figure 8, was mounted
on a quarter inch aluminum box, 3" x 4" x 14" which contains
the lateral variable potentiometer and the lateral articial
feel springs. The pitch potentiometer and the pitch feel
spring are monted externally and forward of the control box.
The pitch and yaw potentiometers have a 1:4 gear ratio with
the output from the plus and minus five volt input fed to
the switching circuit as shown in Figure 12. As in the move-
able deck-mounted stick, the motion of the hand grip is
linear in relation to the simulated control surface deflect-
ion. The control unit is mounted on Velcro fabric for a
quick change capability with the rigid hand stick. The input
14

and output wires are attached to a sixteen connector plug
to permit the rapid change of control sticks.
RIGID DECK-MOUNTED STICK
The rigid deck-mounted stick was constructed from a
salvaged helicopter stick, cut down to a size comparable
to the moveable stick and mounted on an aluminum flange.
See Figure 9. The flexure, shown in Figure 13a, was machined
from one-inch diameter 2024-T4 Alcoa aluminum stock. This
material has an ultimate tensile strength of 68,000 psi
and a yield strength of 47,000 psi at a temperature of 75 F,
(Ref. 15).
It was desired to have the maximum bending stress of the
flexure approximately one-half of the yield stress in order
to provide the maximum possible signal, yet to be well
within the yielding point of the 2024 aluminum. Assuming a
moment arm of approximately two feet, computed from the top
third of the control grip to the center of the flexure, and
a maximum applied force of 15 pounds, the moment becomes
360 inch-pounds. The formula
M MS - CmaX
I bh2/6
was used to calculate the thickness, h = 0.3 inches. An Smax
of 24,000 psi and a 'b' of 1" was used for this calculation.
Four SR-4 strain gages, type FAB-25-12513 , were attached,
as shown in Figure 13a, by Eastman 910 cement and then water-
proofed. The strain gages have a gage factor of 2.07 +_ 1%,
resistances of 120.0 +_ 0.2 ohms, and were designed to be
temperature compensated for aluminum.
15

The strain gages were used as two resistances in a
Wheatstone Bridge that was energized with 10 volts. With
this circuitry, the bending moment applied will cause the
voltage changes in the two strain gages to be additive
while cancelling the effects of a moment applied at right
angles to the flexure. (Ref. 16). The Wheat stcne Bridge
arrangement is shown in Figure 5.
The flexure was pressed into a six inch square piece
of 3/4" aluminum which was then mounted on a plywood base.
A strain gage guard of three inch aluminum thin-walled
tubing was installed around the flexure area to protect
the delicate strain gages and wiring. The attached wires
were connected to a sixteen connector plug for quick change
capability.
RIGID HAND CONTROL STICK
The rigid hand control stick was mounted on an alum-
inum control box similar to that of the moveable hand stick.
See Figure 10. The aluminum flexure, as shown in Figure 13b,
was constructed of material identical to that of the rigid
deck-mounted stick, but the thickness of the flexure was
reduced to 0.15" which resulted in a maximum stress of
25,000 psi, computed for a force of fifteen pounds on a
moment arm of six inches. This compares closely with the
24,000 psi of the deck stick maximum stress computed using
a force of fifteen pounds on a 24 inch moment arm.
Strain gages identical to those used on the deck stick
were attached and similar wiring, plugs and circuits were
used. For clarity, Figure 5 shows only the switching and
16

Wheatstone Bridge circuits for the rigid hand stick.
The hand grips for the hand controllers were made from
an epoxy mixture of five parts APCO 210 Resin and one part
APCO 180 Hardener with carbon lampblack added for color.
The knurled sections of the handles were cast in molds, as
shown in Figure 11, which had been made using a clay hand
grip model.
17


IV. ANALOG COMPUTER CIRCUIT
The inputs to the analog computer are from the Control
and Switching Panel of the simulator, Figure 4, through a
patch panel box and a multi-wire extension. The outputs
from the C & S Panel come from either the variable poten-
tiometers of the moveable controls or from the output ter-
minals of the strain gage Wheatstone Bridge circuits of the
rigid sticks.
The selection of the stick inputs depends on the switch
positions on the simulator C & S Panel. In order to change
these inputs, a toggle switch is used to select either
moveable or rigid systems and a rotary switch is used to
select one of the four sticks. The toggle switch provides
for both changes in the analog input resistors (2,000 ohms
for rigid sticks, 100,000 ohms for moveable sticks) and
feedback resistors (400,000 for rigid sticks, 100,000 ohms
for moveable sticks). These resistor values give an ampli-
fication factor of one for the moveable and two hundred for
the rigid sticks.
The signals are then passed through an additional amplifier
to increase the amplitude by a factor of ten before the
signals enter the longitudinal and directional control
circuits.
The circuit used to amplify the signals and to simulate
aircraft response is shown in Figure 11. The longitudinal
circuit approximates the Short Period motion of an F-4 air-
craft at 0.9 Mach at sea level. The output is considered to
be the pitch angle, 0, effected by the dynamic short period
19

mode. Figure 14 shows the analog computer output after a
step longitudinal input is introduced into the system. In
the short period approximation, since the airspeed is con-
stant, the elevator input results in a 9 change, the mag-
nitude of which is step input time dependent. In addition,
the 6 change, as shown in Figure 14, will remain in the
circuit until removed, due to the lack of airspeed and/or
altitude change with any elevator input. (Ref. 17).
The lateral circuit is an approximation of an aileron
input to a stable aircraft. The response to a step input is
shown in Figure 15. Reference 18 states that the majority
of pilots prefer a system where the aileron is bank-ordering
so that a steady aileron force is required to maintain a
steady bank angle. In the simulator analog circuit, a step
input in the lateral mode, as shown in Figure 15, will
return to the null position after the input is removed
20

V. ANALOG TIMER CIRCUIT
The scoring principle used in the simulator is based on
timing the periods when the display pip is within a pre-
determined scoring area on the CRT display. The test subject,
using the control stick, attempts to cancel out the pre-
recorded taped inputs so as to center the pip on the grid.
The longitudinal error signals and the directional error
signals are summed independently and then amplified by a
factor of ten, as shown in Figure 16. The amplified signals
are passed through a sign changing amplifier, and both the
original signal and the signal with the reversed sign are
fed to diodes which allow current flow in only one direction
when a selected voltage is exceeded.
The increase in signal magnitude is required to activate
the diodes which require a minimum of one-half volt before
passing current. The sign changing amplifiers are necessary
so that both plus and minus signals will trigger the com-
parator, which is biased for signals of but one polarity.
A bias of -0.5 volts is patched to the output side of
the diode bus so that when any summed, amplified signal
exceeds this level the diodes will permit current flow to
the signal comparator input INI terminal. An input of -0.75
volts is patched to the 1N2 terminal of the comparator to
provide a comparator bias signal base. The 1N2 input may
be varied to adjust the size of the CRT display scoring
area..
The comparator relay connects the output of a ten hertz
oscillator to the electronic counter so that when the summed
21

signals (either longitudinal or directional) exceed a speci
fied level, the oscillator signal to the counter ceases.
Since the counter records the ten hertz oscillations, the
electronic counter records the time that the summed signals
(both longitudinal and directional) are within the scoring
area to the nearest tenth of a second.
A switch on the C & S Panel permits the starting and
stopping or" the counting sequence.
The comparator relay also activates the Scorer light
on the cockpit display panel and the C & S Panel to advise
when the signal pip is within the scoring area.
?2

VI. TESTING PROCEDURE
Before the beginning of each test run, the subjects were
briefed as to the operation of the simulator and the testing
plan. Explanations were given as to the nature of the sticks,
the size of the scoring area, and the control motion and/or
force required to produce a given pip deflection. In addition,
the meaning of the Scorer and Timer lights, the testing order
of the sticks, and the testing run length was explained.
The test was initiated by selecting the proper stick
switches on the Control and Switching Panel and turning on
the tape drive. The first two-minute segment of the tape input
was a zero signal to permit the balancing of the potentiom-
eters of the analog circuit (centering the scoring area on
the grid) and to allow the test subject to correct for par-
allax by centering the pip. _)
The input signal for the test run was programmed as follows
1. Two minutes of zero signal.
2. One minute of longitudinal signal only.
3. Thirty seconds of zero signal.
4. One minute of directional signal only.
5. Thirty seconds of zero signal.
6. One minute of combined longitudinal and directional
signal. (Practice run).
7. Thirty seconds of zero signal.
8. Three minutes of combined longitudinal and directional
signal. (Scoring run).
The test subject was informed when the test signal changed
modes and was allowed a thirty second rest period (zero sig-
nal) between each mode Adequate warning was furnished prior
to the start of the scoring run and the test subject was
23

notified when one minute remained in the scoring run.
At the end of the scoring run, a changeover switch was
made to another stick and the testing process was repeated
until each of the four sticks had been used utilizing the
identical input signal.
At the conclusion of the test, the subjects were asked to
complete a questionnaire evaluating the control sticks and
providing precise information concerning their total flight
experience. These evaluations were made before the scores
were disclosed. The questionnaire used is shown in Table 1.
In order to make an adequate evaluation of the controllers,
a suitable rating scale was required. In the past, handling
qualities research has usually employed the standardized
Cooper Rating scale (Ref. 19), or, more recently, the mod-
ified Cooper-Harper scale (Ref. 20). Preliminary testing
during a "shake-down" period disclosed that a finer discrim-
ination was needed than was available with the standardized
scales. Therefore, a new rating scale was devised (Table 2)
which allows for a wider range of "satisfactory" ratings,
while still providing the opportunity for assigning an ad-
verse opinion.
The preliminary testing also disclosed a tendency for the
test subject ' s performance to improve slightly as the test
progressed from one stick to another. For this reason, the
testing order was varied in an effort to cancel, or at least
minimize, the learning function effects. Inasmuch as the pri-
mary purpose of the study was to compare rigid to moveable
sticks, the variation of test order was concerned only with
24

TABLE 1
PILOT QUESTIONAIRRE
Name Test Number
Age Date
FLIGHT EXPERIENCE
Approximate Number of Pilot Hours in:
Single-Engine Jet
Multi-Engine Jet
Single-Engine Prop
Multi-Engine Prop
Helicopter
Light General A/C
Non-Pilot
Type of Operational A/C With Most Experience (F-4, A-4, etc.)
Type of Operational A/C With Most Recent Experience.
How Long Since Piloted Any Aircraft? (If over one month)
How Long Since on Full-Time Operational Flight Status?
PILOT OPINION AND PERFORMANCE
Pilot Rating Test Score Preference
Moveable Center Stick
Moveable Side-Arm Stick
Rigid Center Stick
Rigid Side-Arm Stick __
25

TABLE 2
PILOT RATING SCALE
(Numerical Rating - Descriptive Phrases)
1. Fantastic, could not be improved. Should be in all A/C
2. Excellent control response, no gripes.
3. Good response, pleasant to fly.
4. Good response, would require some getting used to.
5. Satisfactory response, would expect no difficulty.
6. Satisfactory, would expect minor problems at times
7. Acceptable, but with some unpleasant characteristics.
8. Unacceptable for normal operations
9. Unacceptable for any operations.
10. Unsatisfactory, dangerous, uncontrollable.
?6

alternating the rigid and moveable pairs In each pair of
systems, the center-mounted stick was used first.
To determine any possible learning, adaption or fatigue
effects during the tests, partial scores were observed and
recorded at thirty second intervals for thirteen of the test
subjects. Finally, qualitative comments by the test subjects
concerning the validity of the simulation and the applica-
bility of the rigid stick concept were encouraged.
?7

VII. ANALYSIS AND CLASSIFICATION OF TEST SUBJECTS
To properly interpret the data in a test of this type, it
is necessary to have background information on the test sub-
jects. The flight experience data obtained from the test
subjects' questionnaires are shown in tabular form in Appen-
dix A.
Included in the one hundred five test subjects were Naval
Aviators, Naval Flight Officers, private pilots and non-
pilots representing a broad spectrum of aircraft flight
experience. The private pilots and non-pilots tested can
be considered, in general, as representative of the type of
personnel who enter Naval flight training.
PILOT CLASSIFICATION
To facilitate an interesting and meaningful evaluation of
the scores and ratings, the test subjects were classified
into five major groups:
1. Jet (JET) Pilots 31.0%
2. Propeller (PROP) Pilots 24.2%
3. Helicopter (HELO) Pilots 15.5%
4. Private (PRI) Pilots 13.8%
5. Non-pilots (NON) 15.5%
It can be seen that a relatively even distribution was
obtained, there being enough subjects in each category to
insure an accurate data base. Three subjects had significant
experience in two different categories and were therefore
included in both. The classification of each subject is shown
in Appendix B.
28

This division of skills was made for several reasons-
First, it was felt necessary to evaluate the opinions and
performance of the subjects in light of their previous
experience. Different types of pilots use different control
sticks. In general, the jet and helicopter pilots are exper-
ienced with the conventional, deck-mounted moveable control
stick, while propeller and private pilots use yoke or wheel
controllers. Single engine propeller aircraft pilots do use
the center-mounted control stick, but only two subjects
(former T-28 flight instructors) had the majority of their
experience in aircraft of this type. Second, pilot class-
ification of the data could provide some indication of the
type of aircraft in which a rigid stick might be most applic-
able. For example, if the jet pilots preferred a rigid stick
system, this type might be more readily installed in jet
aircraft. Finally, the performance and evaluation of non-
pilots as compared with that of the pilots is required to
determine the effect, if any, of long-established flying
tradition on the opinions of the pilots. It should be mentioned,
however, that all of the non-pilots did have some limited
amount of flight experience, although in most cases this was
less than twenty hours.
TEST SUBJECT ANALYSIS
The average age of the test subjects was 27.9 years, with
67.3% between 27 and 32 years of age. A significant differ-
ence of 5 to 12 years was noted between the age of the non-
pilots (younger) and the pilots
29

80% of the pilots had flown some type of aircraft with-
in one month of the day they were tested (Combat Readiness
Training flying) The average time since any flight was 2.7
months, including five subjects who had not flown for over
a year. In general, the private pilots had not flown recently
The Navy and Marine pilots who were tested were students
at the Naval Postgraduate School and not on operational
flight status. The average time since these pilots had been
on operational flight status was 13 months. 58.7% of the
pilots had been on operational status between 5 and 12
months prior to their test Only nine of the pilots had
not flown operationally in over 2^ years.
A wide variety of Naval aircraft was represented in the
experience bank of the military pilots. These aircraft
included:
JET: A-4, A-6, A-7, F-4, F-8
PROP: A-l, C-121, P-2, P-3, P-5, S-2, T-28
HELO: H-2, H-4, H-24, SH-3
63% of the military pilots had their most recent exper-
ience in the same type of aircraft in which they had had
the most experience. Only one pilot had significant recent
experience in an aircraft of a different type (a Helo pilot
in an S-2).
The average military pilot tested had flown 2200 total
pilot hours with 86.8% having between 1000 and 4000 pilot
hours. The private pilots had significantly less flight
experience, with an average of 200 hours apiece.
30

In general, it may be said that the majority of those
tested were moderately experienced military pilots, about
30 years of age, who had been on operational flight status
one year previous, and were currently making proficiency
flights in the same generic type of aircraft (Jet, Helo , et
cetera) at the time of the tests.
31
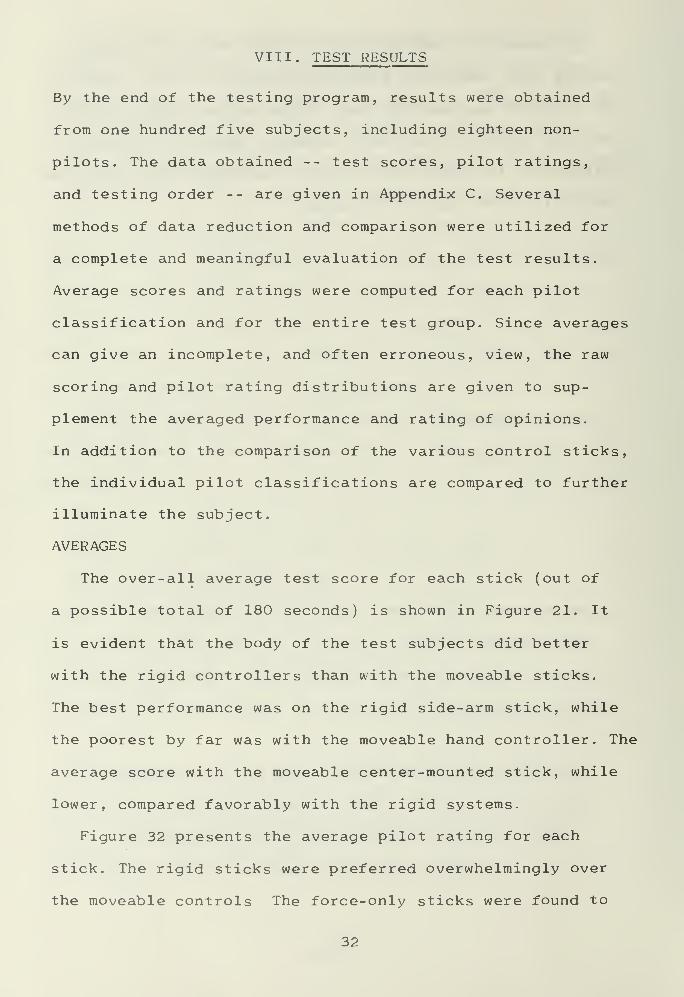
VIII. TEST RESULTS
By the end of the testing program, results were obtained
from one hundred five subjects, including eighteen non-
pilots. The data obtained -- test scores, pilot ratings,
and testing order -- are given in Appendix C. Several
methods of data reduction and comparison were utilized for
a complete and meaningful evaluation of the test results.
Average scores and ratings were computed for each pilot
classification and for the entire test group. Since averages
can give an incomplete, and often erroneous, view, the raw
scoring and pilot rating distributions are given to sup-
plement the averaged performance and rating of opinions.
In addition to the comparison of the various control sticks,
the individual pilot classifications are compared to further
illuminate the subject.
AVERAGES
The over-all average test score for each stick (out of
a possible total of 180 seconds) is shown in Figure 21. It
is evident that the body of the test subjects did better
with the rigid controllers than with the moveable sticks.
The best performance was on the rigid side-arm stick, while
the poorest by far was with the moveable hand controller. The
average score with the moveable center-mounted stick, while
lower, compared favorably with the rigid systems.
Figure 32 presents the average pilot rating for each
stick. The rigid sticks were preferred overwhelmingly over
the moveable controls The force-only sticks were found to
32

have "good response", while the moveable controllers were
rated only "satisfactory". The subjects tended to dislike
the moveable side-arm controller, and little difference
was noted between the two rigid sticks. At least on the
average, pilot opinion correlated with actual performance.
A more detailed score-to-rating correlation study is in-
cluded in Section IX.
COMPARISON OF STICKS
More detailed comparisons of the four control sticks
for particular pilot classes are shown in Figures 19 and
20. These results (Fig. 19) show that all groups did better
with the rigid controls to varying degrees. It can also be
seen that Jet, Helicopter and Non-pilots exhibit variations
in performance identical to those of the overall averages
(Fig. 21); i.e., rigid side-arm -- best, and moveable side-
arm -- worst. Notable differences are: (1) the Prop pilots
did slightly better with the rigid center-mounted stick
than with the rigid hand controller, and (2) private pilots
scored higher with the moveable side stick than with the
deck-mounted moveable stick.
It can be seen from Figure 20 that all pilot groups
preferred the rigid to the moveable controls, and disliked
the moveable side stick. Opinion was fairly evenly divided
as to which stick was the best -- rigid center-mounted or
rigid side-arm. The relative magnitudes of all the rating
averages are about the same, indicating that the pilots'
interpretations of the rating scale was quite uniform.
33

COMPARISON OF PILOT CLASSES
Actual comparison of the different pilot groups for a
particular control stick is shown in Figures 22 and 23 This
analysis reveals that private pilots and non-pilots scored
higher than pilots with the rigid control sticks- As expected,
jet pilots performed better than the other classes with the
moveable center-mounted stick due to their previous experience
with this type of control The results also indicate that
propeller pilots, in general, encounter difficulty with the
sidearm controllers, and both prop and helo pilots tended
to score below the average on all sticks.
SCORE AND RATING DISTRIBUTION
Charts of the test score and pilot rating distributions
were made as a part of the averaging analysis The over-all
performance distribution plot of Figure 24 shows the per-
centage of the total number of test subjects whose final
score lay in each five-second time interval throughout the
range of test scores. A statistical distribution of scores
about the mean is approached with the two rigid sticks and
the moveable center-mounted stick (Fig. 24a,b,c). It is to
be noted that the moveable side-arm controller results are
marked by a rather even distribution of scores concentrated
at the lower end of the scale.
The over-all pilot opinions (Fig. 25) are somewhat more
divided on the moveable systems than on the rigid sticks --
especially in the case of the moveable hand controller, where
the ratings are particularly scattered.
Indentical performance and pilot opinion distribution
34

plots for the different pilot classifications are included
in Appendix E. Facts of interest from these graphs are: (1)
Jet pilot scores on the moveable side stick were divided
into two groupings -- one average and one poor (Fig. E-ld);
(2) Two individual prop pilots scored extremely low on the
rigid side-arm controller -- lowering the over-all perform-
ance average for this classification (Fig. E-3b); and (3)
While the scores of the private pilots were concentrated,
their opinions of all sticks were scattered -- indicating
that perhaps not enough private pilots were tested for a
valid comparison (Figs. E-7, E-8).
35

IX. HUMAN FACTORS INVOLVEMENT WITH TEST VALIDITY
In a test program of this nature, dealing with variations
in pilot ability and the vagaries of personal opinion, a
great deal of care must be taken to insure validity of the
data. Human involvement errors can be introduced by myriad
differences in adaption, learning, fatigue and experience,
and by fluctuations in attention, motivation and judgement.
Safeguards must be established and checks need to be made
to cancel or minimize these possible sources of error.
Several methods of analysis were utilized to determine
the nature of human involvement. A score- to-rating correla-
tion study was conducted to determine the effects, if any,
of pilot bias. A standard regression analysis was applied
to the data as a means of representing each score and
rating on a single graph. Learning, adaption and fatigue
of the test subjects was examined by observing the variation
of performance throughout a run, and the testing order of
the controllers was varied throughout the tests. Additional
information concerning learning and adaption, as well as
variations in stick dynamics, was sought by an approximate
human transfer function study with the simulator. A check
was also made to learn if there was a variation in test
results if the magnitude of the pip deflection were changed.
This was necessary inasmuch as the pip scale may have been
altered during the seven month testing program. Finally, the
realism of the simulation was studied by comparing non-
pilot performance to that of pilots and by soliciting
individual comments from the pilots who were tested
36

SCORE-TO-RATING CORRELATION
With the introduction of a new device like a rigid
control stick, the possibility exists that a pilot could
become enhanced with its novelty and evaluate it accordingly.
On the other hand, a pilot with many hours experience with
a moveable deck-mounted stick might tend to dislike the
rigid controls, even though his performance is superior
while using them. To determine the magnitude of this type
of problem in the testing program, a score-to-opinion cor-
relation analysis was applied. Plotting the over-all average
scores versus the average ratings for each stick as shown
in Figure 26 gives a first approximation as to how well the
pilot opinions correlate with performance. The strong cor-
relation is obvious, since the rating becomes rapidly less
favorable (higher number) with decreasing test scores.
Similarly, in Figure 27, a regression analysis, plotting
score versus rating and reducing the points to a single
line for each controller, shows this strong correlation
of performance to pilot evaluation.
For a more detailed analysis, an individual correlation
factor "r" was calculated for each test subject. These
factors are listed in Table 3, with a perfect correlation
being r = 1.000. This value of r is derived from the square
root of the square to avoid the negative number that would
appear due to the fact that the rating scale is inverted.
That is to say, a decreasing pilot rating occurs with an
increasing rating number. From Table 3 it can be seen that
fifty-six of the one hundred five subjects have a high
37

TABLE 3
INDIVIDUAL PILOT SCORE- TO-RATING CORRELATION FACTORS
Subject r Subject r Subject r Subject r Subject r
' 1 .912 22 .394 43 .000 64 .935 85 .690
2 .978 23 .546 44 .918 65 .515 86 .952
3 .718 24 .829 45 .941 66 .929 87 .880
4 .972 25 .971 46 .669 67 .835 88 .446
5 .350 26 .642 47 .900 68 .733 89 .387
6 .971 27 .932 48 .993 69 .933 90 .670
7 .460 28 .952 49 .758 70 .956 91 • 752
8 .539 29 .994 50 .007 71 .954 92 .325
9 .619 30 .985 51 .914 72 .951 93 .971
10 .911 31 .965 52 .260 73 .749 94 .975
11 .660 32 .926 53 .004 74 .717 95 .873
12 .697 33 .900 54 .532 75 .935 96 .795
13 .978 34 .204 55 .866 76 .979 97 .875
14 .767 35 .453 56 .741 77 .826 98 .529
15 .804 36 .576 57 .796 78 .430 99 .873
16 .746 37 .426 58 .812 79 .886 100 .990
17 .948 38 .952 59 .984 80 .981 101 .702
18 .833 39 .149 60 .493 81 .952 102 .945
19 .967 40 .109 61 .307 82 .892 103 .427
20 .206 41 .990 62 .381 83 .844 104 .595
21 .982 42 .803 63 .572 84 .976 105 .976
38

correlation of .800 or better. Twenty-five percent of the
subjects tested have a poor score-to-correlation (below
.400). A close examination of the scores and ratings of
these subjects reveals the causes of this poor correlation.
Twelve of these testees had poor correlation due to their
nearly identical scores on the separate sticks. The remain-
ing poor correlations can be laid, at least in part, to
pilot bias, as evidenced from the comments of these subjects
The average correlation for each pilot classification is
of interest and is given in Figure 28. As expected, the
less-experienced private and non-pilots had significantly
lower score-to-rating correlations than those of the military
pilots
.
Thus, with a high over-all average correlation of .680,
it appears that pilot bias had little effect on the data.
The majority of the test subjects had relatively high
performance-to-opinion correlations. The poor correlations
were few in number, and the errors introduced tended to be
mutually cancelling.
LEARNING, ADAPTION, AND FATIGUE.
During the preliminary testing it was noted that the
test subject's skill appeared to improve as the testing
progressed. To avoid the possibility of one type of stick
obtaining an advantage over the other, the testing order
(moveable versus rigid) was changed for each subject.
Fifty-three subjects used the rigid controls first and the
remaining fifty-two started with the moveable sticks. Thus
39

any possible learning function effects should have been
nearly eliminated. Evaluating the increase in score from
the first stick used to the next, the average learning
was of the order of one second (0.56% of the maximum possible)
and thus essentially negligible.
An almost universal comment from the test subjects upon
finishing the test was that the tracking task was extremely
tiring. To ascertain further learning, adaption or fatigue
factors, partial test scores were recorded at 30-second
intervals for thirteen test subjects. The results obtained
from this survey are shown in Figure 29. It is evident that
the test scores dropped off rather rapidly during the final
30-second time frame This could be due to the fact that
the subjects were given a notification one-minute prior to
the end of the run. Motivation may have lowered slightly
in anticipation of the completion of a somewhat tedious task.
Little evidence of slow adaption to the controllers can
be found from the results. The subjects in general appear
to have become fully adapted to each stick during the alloted
practice time that preceeded each scoring run. The scores
in the first frames show only a slight improvement in per-
formance, with actually a decrease while using the moveable
side-arm controller. This is not to be considered as being
too surprising since human operator control adaption usually
occurs in one to three seconds following a change in simple
tracking conditions (Ref. 21).
An effort was made to compute an approximate human transfer
function for two test subjects using the RED BARON facility.
40

It was hoped that a more analytical description of human
adaption and learning could be found (Ref. 22). The subjects
completed a sinusoidal tracking task in the directional
mode at various frequencies of oscillation, using the move-
able center-mounted stick and the rigid side-arm controller.
Their frequency responses were recorded and are illustrated
in the Bode plots of Figures 30 and 31. Pilot transfer
functions were obtained from these plots by the asymptotic
approximation method. The similar form of the curves are an
indication that human response, and thus adaption, is com-
parable for a given stick; but that the response to two
different sticks can be quite diverse. No further effort was
made to apply these results to the data since the study was
but approximate and since indications of adaptive difficulty
in the tests were absent
SCORING PIP DEFLECTION
Since the testing program extended over a several month
period, the motion of the pip on the CRT display for a given
control force or displacement could quite possibly have been
changed. This could have occurred due to alternate usage of
the tape deck or actual tape deterioration. Periodic calibra-
tions of the pip were made, but the possibility still existed
that the pip motion could have been altered between the
calibrations. To check this source of error, three subjects
were tested with two different pip deflections -- one larger
and one smaller than the norm. As might be expected, the
scores with a small deflection were higher as the pip was
easier to control. However, little change was found in the
41

relative differences between the four control sticks. Thus
it was assumed that even if small changes occurred in the
pip deflection, the error, for comparison purposes, was
minimal
.
TEST LIMITATIONS AND SIMULATION VALIDITY
Most pilots seemed to agree that while their scores and
ratings were higher with the rigid systems in the simulator,
the situation might be significantly different in an actual
aircraft. Herein lies the major limitation to an opinion
survey of this sort. It was felt by most of the pilots that
actual flight testing would be necessary to determine, for
certain, pilot acceptance or rejection of a rigid control
stick. The relatively high scores of the non-pilot group
cast a further doubt on the realism of the simulation. The
age differential between the non-pilots and the pilots could
well be a factor in this score spread, however.
Another key limitation concerns the low force gradients
incorporated into all four sticks. The maximum force necessary
for full scale deflection of the pip was about one pound,
while the optimum stick force per g in an actual aircraft
is five to seven pounds (Ref. 23). This low force was de-
liberately introduced into this phase of the testing. It
was desired to. have the moveable controls nearly force
independent so that they would be nearly a motion-only type
of system. The rigid controls were rigged for a force that
approximated that of the moveable controls for purposes of
comparison. A more thorough and comprehensive study should
include the effects of variations of stick force and stick
42

force gradients per pip deflection and deflection rate on
pilot opinion and performance A throttle and airspeed indi-
cator have been rigged for this purpose, with the throttle
controlling the feedback resistances of the analog computer
so that increased throttle (as evidenced by increased airspeed
indications) results in increased force requirements. This
system was not energized during this phase of the testing
in order that all those tested could be compared at the same
base.
This study was further limited in that the relative effects
of vibration were ignored. Aircraft vibration can reduce the
manual dexterity of the pilot and introduce an additional
unsteadiness in his control motion. The human body tends to
damp out vibration; thus problems could arise with the side-
arm controllers where the pilot's arm rests on a surface
that would vibrate with the aircraft. Reference 1 reported
that a moveable control stick gave performance superior to
the rigid controller at all exciting frequencies of vibration
tested. Vibration would naturally enter a flight test program
and could also be introduced into a simulator. An interesting
sidelight of vibration effects is the ascertion by several
neuro-muscular experts that there is a low frequency neuro-
muscular response that, if in resonance with external vib-
rations, could incapitate the control function of the human
operator
.
The effects of acceleration on control stick performance
should also be investigated in a flight test situation rather
than in a ground-based simulator.
43

During the course of the testing, several pilots expressed
concern about the effect on a rigid controller of movement of
conventional stick-mounted trim switches and microphone
buttons. While these switches normally create no stick motion
when operated, they would involve the addition of an extra
force on a rigid control stick. Unless unconventional switches
were installed, this would mean applying an opposite compen-
sating force when using the trim tabs, to avoid undesired
control deflection. This problem could be included in further
simulator studies.
A final limitation might lie in the fact that the subjects
tested were not trained test pilots as is the custom in
handling qualities simulator studies. The limited qualitative
nature of the information requested in the evaluation of the
sticks, however, should have relieved this requirement, and
the high score-to-rating correlation achieved by the test
subjects supports this assumption. In addition it was desired
to determine the opinions of average fleet pilots with regard
to the acceptance of a rigid cockpit control system.
44

X. DISCUSSION AND CONCLUSIONS
The purpose of this investigation was to determine the
acceptability to operational military pilots of a rigid
cockpit control system and to evaluate their performance
while using force-only controls. Within the restrictive
framework, of the test limitations mentioned in Section IX,
this has effectively been accomplished. Results were obtained
from one hundred five flying and non-flying test subjects
operating both moveable and rigid controllers in a compensa-
tory tracking task.
To draw specific conclusions from the collected data, it
is necessary to thoroughly analyze the test subject group
in order to ascertain the applicability of the results. At
the same time, particular measurement standards and procedures
must be reviewed to insure validity of the test. Finally, in
a study involving human opinions, the possible sources of
error induced by the subjects and inherent in the test itself
must be examined.
The test subject group consisted of Navy and Marine aviators,
Naval Flight Officers, private pilots and non-pilots. The
pilots who were tested were on proficiency flying status and
therefore may not have been quite as sharp as their active
fleet counterparts. The non-pilot group was highly represnt-
ative of the personnel who enter Naval flight training. A
significant number of each pilot classification -- jet, prop,
helo, private and non-pilot -- was tested to provide a sound
base for significant conclusions. The possible exception was
45

the private pilot class which showed basically erratic
performance and ratings, possibly due to the duration of
time since many of them had flown, and their relatively low
flight experience factor. In general, however, the inexper-
ienced subjects were included in the testing in order to
compare their performance with that of the pilots and the
opinions of the inexperienced groups were of less import-
ance to the study. The wide variety of aircraft included
in the experience of the military pilots represented a
majority of the operational aircraft in the fleet today.
The measurement procedures used in this investigation
were relatively conventional and the test validity was
protected. The use of signal error in a compensatory track-
ing task is a common measure of pilot performance and is a
fairly standard procedure. The revised rating scale, allow-
ing for finer discriminations, was especially devised for
this study. It success is evidenced by the relatively
uniform interpretations it received by the various test
subject classifications.
Numerous precise measurements were conducted to eliminate
errors introduced by the human test subjects and the test
apparatus. The extensive correlation analysis effectively
ruled out test subject bias in most cases. It demonstrated
that the small amount of bias found tended to cancel itself
out; i.e., although some pilots preferred the moveable
system and scored high with the rigid, others preferred
the rigid and scored high with the moveable controls. The
number of negative correlations was few. Alternating the
testing order of the control sxicks virtually eliminated46

pilot learning effect during the course of the test. Even
so, the learning value factor was a very small number. Most
of the test subjects experienced fatigue during the final
30 seconds of the run; however, this only introduced a
difference of about one-half of one percent in the over-all
test score. The fatigue was slightly greater with the move-
able controls -- another indication of their difficulty. No
problem was experienced with test subject adaptation to a
particular control stick. The tape segment alloted to
practice and familiarization allowed time for nearly complete
adaptation. The error due to any possible change in pip
deflection was negligible, since the relative differences
of scores and ratings for each stick remained essentially
constant. These various safeguards and checks greatly min-
imized the various possible sources of error to the data.
In general, the pilots performed better with the rigid
control sticks and preferred them to the moveable systems.
The rigid side-arm controller was the consensus favorite in
both performance and preference. The moveable side-arm stick
was uniformly disliked and its performance was inferior. The
moveable deck-mounted stick was only slightly less preferred
by the pilots than the rigid systems -- the differences in
scores and ratings were not large; whereas the less exper-
ienced private and non-pilots displayed a rather marked
preference of rigid over moveable controllers with a similar
large difference in performance with each system.
These results, as a preliminary indication, suggest that
a rigid controller is certainly feasible either as a primary
47
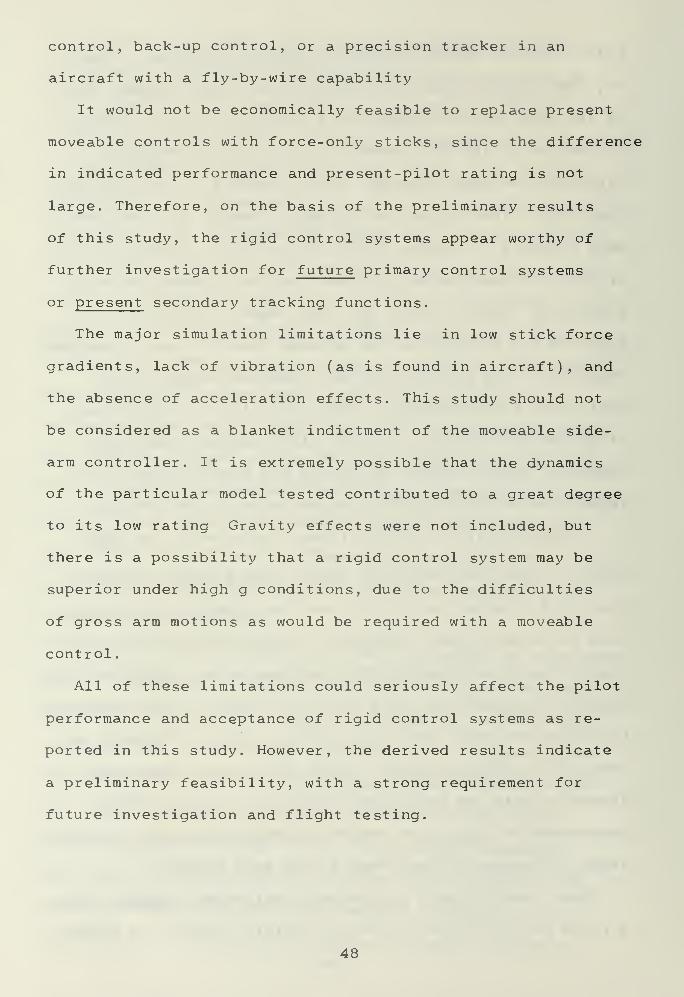
control, back-up control, or a precision tracker in an
aircraft with a fly-by-wire capability
It would not be economically feasible to replace present
moveable controls with force-only sticks, since the difference
in indicated performance and present-pilot rating is not
large. Therefore, on the basis of the preliminary results
of this study, the rigid control systems appear worthy of
further investigation for future primary control systems
or present secondary tracking functions.
The major simulation limitations lie in low stick force
gradients, lack of vibration (as is found in aircraft), and
the absence of acceleration effects. This study should not
be considered as a blanket indictment of the moveable side-
arm controller. It is extremely possible that the dynamics
of the particular model tested contributed to a great degree
to its low rating Gravity effects were not included, but
there is a possibility that a rigid control system may be
superior under high g conditions, due to the difficulties
of gross arm motions as would be required with a moveable
control
.
All of these limitations could seriously affect the pilot
performance and acceptance of rigid control systems as re-
ported in this study. However, the derived results indicate
a preliminary feasibility, with a strong requirement for
future investigation and flight testing.
48

Figure 1. External Overall View of Simulator
Figure 2. Internal View of Simulator Cockpit
49

Figure 3. Display Console
mmmm
;,....,:. '. ' .. .
:
Fiijure 4. Control and Switching Panel
50

RIGID STICK"* —MOVABLE STICK
RIGID HAND STICK "* <ZZS *"MOVABLE HAND STICK
1'
!
*
*« I •
OUTPUT
SeRIGID
500 ^RESISTORS
r^VNAAA
10 v rj1
—VNA/V^^—AAAA^ *^^[
PHANTOM
GROUND
NOV ±L
VAV-A-'WNA* ^^^
qr
I—^WWA'^^ s
OUTPUTSe
MOVABLE
OUTPUTSe
MOVABLE
/"*-,
Ss-
sMOVABLELONGITUDINALPOTENTIOMETER
ss- MOVABLE
, DIRECTIONAL <£-«-S POTENTIOMETER
FIGURE 5.
WHEATSTONE BRIDGE AND SWITCHING CIRCUIT
51

Figure 6. Overall View of Simulator Facility
Figure 7. Moveable Deck-mounted Stick
52

Figure 8. Moveable Hand Control Stick
Figure 9. Rigid Deck-mounted Stick
53

Figure 10 Rigid Hand Control Stick
Figure 11. Hand-Grip Model and Molds
54

3
3O
O<z> IsA$^Q
zo
AoUJ
o
8CO
|©i
Oo
§<
(VJ
UJ
UJ
<2 |2
3 oQ. <X)
>O >
o
oatUJN
55

I\ /\ / \ /\ /\ /\ /\ /I
FIGURE |30,
RIGID STICK FLEXURE INSTALLATION
56

STRAIN GAGES
FIGURE 13b.
RIGID HAND STICK FLEXURE INSTALLATION
57

Figure 14. Analog Computer Response (Longitudinal)
.-.,.
J,r^jr^j^^p-^j-rrifj-r-^-j-it^rjt— r-"n» -,i"''rt—rj-". »y -. i-i .a.ij
i~~vf~'r7—v'7~r T~*y ' '
'/ *J/' " '/"*-> " l^^'J*'"" T ' "Jr^
/ l / ,-; / • / / / / / 7 "'/ / ""/' /— / f'—/''/' /"''/ "/ —7—
'•/ ' / ' r
—"T—[•- 1 4 --•' r
r~^r*~
rf^l i 1 I 7•"II 7 -""7
/ 7-7 ~f~~/ ^7 /•////./' / 1 t 1 i If -t^i-jr^-— 1
:7=t 111 ill 1 1 I / r^ rxz '.,_.;..'; I.aV.:-
™~. —. ,-i'.**-i
- =
—
" voii;
-.' |' i-r
s— j' .>..•-• ~ -,— —^
-—V '- -—'—- "i^~
\' 1 —1
'i \\'\ I Vi I
'" ' -j.i ' .. V
'
^. \ \ . \—4_—\" \—-
'
' v \ V—^—\—J—-^—-^—y ' ^—^—
'
r .qv-'-.—i—'\ —
\—
.\.. \—qjr-
[5 -,.'• PRINTED IN U.S.A.
_ /_ ./ If / / ./ / / / / -I L. 1 _i
—
J. 1 / ' / f/ /
—
rfr-—/ ".:/••
/ ' f i
-^/
'
J
t ^* T'^u?^L* f i J II I " i II I v J I 1 1 1 '1 II 1 I j /HE^^
"t*s--^ —-^1 "--
*?*- .— -. "~ i^
—
:
1s^=F3^ fer i==
U-lAJtA^:; m \. ^~.\, i
"
l
A. J -
|—\ V
V , L ,.w A —J
Figure 15. Analog Computer Response (Directional)
58

(D 3LU a:
Z> ou.
e>
f-
59

3 INSTRUMENTS DIVISION OF CLEVITE CORPORATION CLEVELAND. OHIO ,- , PRINTED
Figure 17. Typical Scoring Run (Longitudinal)
B» ftS L'-gHm&' ~,':! ,,V1JHT"\ -j*^ 5 ^/ •" KPT5C -BC iT -.tV-jI —--, \:'Tr - —
'-^V- :'.^>;irrryrtrrnffWiftvt*ynr»VCT^»y^ >
»Y< j i^fnr\> 4t\ i >y> i-5^y>TWT-y>-)Trry»^Taft^Ygft-KTJtrn'pnntfrrrtynK\ii<VflnfTrrK^
~ —""I
', \*>
L pS^
'',
1! H—
|l1 1
1
i~1 *~1 4- 11 \ fl
—\- \ \ \ \ 1 4 \ \ \ \ \ \ 4 \ \ \ \ \ \ \ \ \ \ \ 4 1 \ 4-4
—V—*A—\—V—V—"\—\—\—^-\—\—\
—
\—\——\—\
—
\—\
—
\—\—V—\—\—\—\—\—\—4
—
\—
Y-—V-—
V
—\—\—\—\—\—\—VTA'PEA—RECORDER \—INffUT
—
tSIIbNaLv DrRECTtQNAL \MODc—\—
^
cHA RT 1slO. RA2922 20 R]RtJSH 1 IV 51"R tj:M EPJTS D VISIOI'—/—f—/~~/—/—/—/
—
1—
*1—
1—/
—
1—
1—/—/
—
1—/
—
1~~^i—
1—
1—
1—
t~~i—1~4—/
—
f—
1—/
—
III j-f 1 I / M— / / ' / "'] " ^
~i—
- -" " -" —
j
-^-k— — =zf=£ =f=— '
—^w
t— ~- —
i
p=^—
rrzrJ—
. Ij^j
\—"V*^
—
¥=fcfc
\—\-\—^~
\- 3==-
P^£= V
—
L^T—
\
Figure 18. Typical Scoring Run (Directional)
eo

i [
CL
oCtf
0.
Oa.
111
V-l
a>
+j 0)
H c •o
Q QJ CU •H+> <y u CO
C X)at -h a> QJ
U U CD rH fH£1 £)
13 15 03 03CQ •h -h a; (U
o U\ > >
< •H -H<x tx s s C
1 1 1 1 •H+->
< CQ O Q 05
U•HU•H
u t/)
I/)
03
CQ
Q
U
CQ
O Oin
o oCO
oCM
oo
o
u
•HCL
£Q X 03
w•H
U H >,if) CQ
CQ rH 0)
V-i
M< +-> u
C en
u
Q0)
01U 03
M
CQ ><
< .
O
u
en•H
spuooas - azoos l-sax
61

28
ex
O
X
O
H
U
CQ
Q
U
CQ
U
CQ
<
Q
U
CQ
<
H(1)
C VQ) -H
QJ U WVH
CL>
C(1)
!J(/) HH
•H *H QJ QJ
en Cft > >•H -H Oos ex
QJ QJ
iiii< CQ U Q
Q ^!
U•HU +->
CO
CQ iH
< u
c
U
O•H
*HH(/)
(/)
03
rH
U
•H
td
CQ
enc•H+->
nj
QJ
enaJ
QJ
><
o
0)
u
0>•Htt,
00 vO IT) ro CM
6?

160 r
140
co
0)
MOu(/)
</)
H
120
100
80
Rigid Rigid Moveable MoveableCenter Side Center Side
Figure 21. Average Test Score With Each Stick
- All Subjects -
63

V•HCO
>
2
a;
+->
c
u
as
(D
>o
X)•HCO
v•H
•H
U
+->
c
U
•H
a o+» OH0) H 0)
QJ
>•HU
a.
•-) CU S Du 2i i i i i
•~) a. i m 2
CL
•->
x
a,
ITS
o•HVHH(/)
(/)
<tf
r-t
u•H
o
CL
u•H
CO
-ao
fx)
M
fie.
CO•H+J
(d
u•HVi•H</)
if)
(T5
rH
U
o
•Hcu
>>
CQ
QJ
MOuCO
HW0)
H0)
cn05
M<D
i
CsJ
CM
0)
M3en•H
O oLO
o o00
oCM
oo
o
spuooes - ajoDQ 3-S3£
64

0)
•Hc/3
8
>os
M<D
HC
U
.a<d
>
2
(1)
•HCD
•o•Hen•H
uCD
+»
c<D
UTJ•Hen•H
[I
;[
*->
a.
x
a.
+>
ma o >
f OH'riCD U CD ^
I I I I I
*-> Cl, I m 2
Ic
Cl•H•H
*-) id
oH«H•H(J)
U)
id
H^ uH +->
iH•HX CL
X•H+->
CD
ouHcou
id
wnoCl
COHHid
u•H
•HCO
(/)
<d
iH
u
orH•HCm
>>
cq
C•HHn3
a
«i
V-l
0)
><
COcm
u
•HCln
CO N vO LO co CM
A^xxTq^^deDov Buiste iduj -
65

20a. Rigid Center
15
c/)
o
•r~i
•H(/)
CD
HMhO
•M
ca;
o
a;
a.
10
5
O I 1
20 -
15 -
10
5
c. Moveable Center
20
15
10 p
5 -
d. Moveable Side
rJL
Zi m20
b. Rigid S id€ i
15
10
5
n •
LTLrn
OZL80 100 120 140 160
Test Score
(5- second Frames)
Figure 24. Distribution of Test Scores
- All Subjects -
h6
180

HUQJ
•r-i
&DCD
H(/)
HVtO
+->
cCD
u»-l
(1)
40 -
30 "
20
10
r
40 J
30
20
10
40 -
30 -
20
10 \
40 h
30
20
10
HZL
a. Rigid Center
=1 1 I1
b. Rigid Side
JZZL 1 I
c. Moveable Center
I 1
d. Moveable Side
,
1
. r=8 104 5 6 7
Pilot Ratings
Increasing Acceptability
Figure 25. Distribution of Pilot Opinions
- All Subjects -
67

150 r-
140
w
coo
C/)
1 1300)
u
o
+->
1/5
j2 120
><
110
100
Moveable Center
Moveable Side
_L J_ X7 8 10
Average Pilot Rating^ Increasing Acceptability
Figure 26. Correlation of Pilot Opinion and Performance
68

180
160 -
Rigid Side
Rigid Center
Moveable Center
Moveable Side
0Co
cn
140
UO
£ 120
H</)
0)
H
100
804 5 6 7 8 9
Pilot RatingIncreasing Acceptability
10
Figure 27. Score- to-Rating Regression Analysis
69

uo+j
o
Co•H
MOu
en
u0)
><
0.8 t-
0.7
0.6
0.5
0.4
0.3
Overall Average
JET PROP HELO PR
I
Pilot Classicication
NON
Figure 28. Average Correlat ons of Scores to Opinions
70

28 r
26
B«J
U
e•HHOCoo
i
OmC•H
>-(
ooCO
24 -
22 "
20
18
Rigid Center
Rigid Side
Moveable Center
Moveable Side
\ // \
\\V \
\\\
\
18030 60 90 120 150
Scoring Run Time - seconds
Figure 29. Average Pilot Scoring Pace Throughout Test Run
71

O0)
DCO
u
•r-i
3CO
o
oNO
oin
o
oCO
CM
co
0)
w\(/}
cnj
•Ho
i
ocCD
3cr0)
M
d
o•H
co
B
i
<D
T)•HCO
o•Hen•Ha.c+->
•Hs
<u
c
aw
a>*
uc<u
3cra»
uh.
HorH•H
oCO
0)
u3en•H
CO
doo CM
I
sxaqxoep - (ox^y epruTiduiy) 6ox §Z
7?

CM
H -H
o ucy a;
•r-» •r->
,Q ,0P DCO CO
O•
r*»
o•
vO
oin
o•H
o M• CO^
IN
+->
o c• ffi
CO u
H,0
V 4c 0)
>o CJ
• 0) sCM <J)
X. MCO Hc •H<ti s•HT3 CD
<tJ ee
i
c
a09
>> QJ
o o a< c
rH 0) >D oCT c«h 3fc cr
cu
ft
•H
rHin •H
• a.
CO
CO
0)
MD
•Hfr,
o»
ooCM
sxaqxoap - (oxi^tf apnixxduiv) 6ol OZ
73

7
c•H
a
HoiH•Ha.
-H•Hr-i
•H
«aou<
c•Hw
0)
uocM
t
1Rigid Rigid Moveable MoveableCenter Side Center Side
Figure 32. Average Pilot Rating For Each Stick
- All Subjects -
74

APPENDIX A
LIST OF EQUIPMENT
1. Analog Computer
Pace TR-10
Electronic Associates, Inc.
2. Timer (Scorer)
Universal EPUT and Timer, Model 7350
Berkeley Division, Beckman Co.
3. Timer
Lab-Chron
Laboratories Industries, Inc.
4. Oscilloscope
Model 120A
Hewlett-Packard Co.
5. Visual Recorder
Two-Channel, Model BL-52U
Brush Electronics Co.
6. Low Frequency Function Generator
Model 202A
Hewlett-Packard Co.
7. Power Supply (2)
Model 3569
Systems Research Corp.
8. Tape Deck
One-half inch, Model FR-100A
Ampex Corp.
75

oM6!UHl-l
COCO<u
2O2h 2;to o Cu a\ a.
Hto
CU CL Oh OO O O JDJ K Ctf tODu O, OU K
O Cu, Oh O OHJOHOJHHHJ2H2WUDiWDitdUtiJWWOWO
a.
o oH H .-I KtO tO tO Ou'-)'-) a \
Hw
CQ
XHIto
<
toMOStoDu
HOM
HOMCu,
Cu
OtoX
a,to
CwtoCO
"I
toco
ooen
o00
i O i
iHI I
I IT) I
r-H
I I
i o oo o
I CO CO
i o oo o
I CM r>
i O i
o
I O i
oi m i
i i i i i i i i i i i i o i i
I I I I I I I I I I I I II
i i 1OO1O1 i iOi i iOo o o o o
I I I f> O I rH I I liHl I ICOrH rH CM rH
O O O i o oo o o in cocm in co i r^CM CM
O CO oo o^ enCM CM
i i O i
I I I I
oo
i o o o o oo o o en o
i <* "<t O CM
o o o o o o oen o o o vo O -^
rH en cm en ih
I I I
I I I I I
I I i oo
I I
I I I I
I I
I I I I i om
I CM
i O • i O O O i
o o o oi en i i i/i to i
CM rH rH
oen
mr-oo
omiiiii i i i
oi i O i i
00I I iH I I
O i I i om o
i i i inCM
o o o oo m in oH HH en
O i i i
mCM I I I
O O i oo o oCM N i N
CM
to
srHt^CMCMinNOOOOOOCMOOOC^OOONOOOOONvOO^OenoOOONONOOCMCMCMCMCn^cncnCMCnCMCnCMCnCMCMCMCMCMCMCMCMCnCMCMCMCMCMCMCM
aOQDco
HCMrO^m^ONCOOOH cMen-^invoNoooorHCMen^tinvONcooopHfHrHrHrHrHiHfHCMCMCMCMCMCMCMCMCMCMCn
76

o
UMH0)17)
<u
O O CXC CUOhOCuDhDhHJHhhHZHHJmmHOhOi-im^ZOmHOJmOOHOdimiiaKWouuMKawKKKKaooaKWawKKauK
cq croX CD
M 3C•HHCou
QW
5;
a,
ou
a,
a,
CO
2
WCO
i i i in oo i
III I
i O i
oi r- i
i i i
i i i
o o co o oCO CM CO
m i oo
I CM
O i
o^ I
CM
oo
ooLOCM
ooCM
I
i
i O O i i O i o oO vO O O CO
II rH I I Q\ I
oo
I I I
I I I
o o oio m toCM CM CM
O i i
oI I
i O i
oI ^f »
O i
oo
o oIO 10
CM
O i
oCM I
iH
I I
I I
oooCM
oo
I I
I I
O CO I I I LO I I
LO ^f <«0
III II
i I O I I i
I I h- I I I
ooo
ooCO
O O O I O i
LO O CO IO
^t I CO I
tH CM
O O O i o oLO IO O LO LO
CO rH I CM CO
i O i i i i
oI CM I I I l
O O i i i o oO LO o oO CO I i i CM OCM
oo
8C^COONCO^^CO^NOCM^NCO^OOCMCOrHCOlO^fHCOr^CM^ON^OC^CMCMCMCMCMCOCMCMCMCOCNJCMCMCMCMCMCMCMCOCMCOCMCOCMCMCMCMCMCMCM
HUU)-iPQ
DCO
HWn^LOvOMXlOOHWfO^in^NOOaOHCMOO^LO^MXJONOCOCOCOCOCOCOCOCOCO^Tt^^^^^^^^lOlOLOlOLniOLOLOlOLO^O
77

oMH<uMfc.
MCOCO
<u
M
o
»->
o<
CO
P- O OOODhOOuDhOOOHOHHHHHZHJZHJJOiHO.-lMOHOZ-JHJZh-lHHHW
I I O i
COII II
I I
I I I I I I I
I I I I I I I
PL, I O i I i i I
'—•. W i iHCQ •0 2 i CM I i I I I
Q)
X 3M C
til C CU i o o o o o o0* W i m m in o m oOh U co I CM CM ^ CM CM r-<
< —
O i I i O i i
o m•St
1I I I r-\ I I
i i o o o o oo o m o o
i i vo m r-\ co o
1 1
1 1
1 1
I I
I I
O i
in1 1
1 1
^* i
i i
1 1
I o O i
m o1 CM
i i
CM I
1 I
i i
i o
I 1
1 I
oI CM 1 1
CM
I I I I I I
I I I I I I
i O i I i
inI CM I I I
i o o i i
O CMI CM 00 l I
i I It O i
oI vO I I I I
I I I
I I
O i O i
m oi ci) i in i
co
i oo
i CMiH
ooCM
OOOOOOO iOOOmomomoo mrnoCMCMiHOCMinCM iCOCM^
CM
I I I O I I I I i I
oi i i in i i i i i i
O i i O i i i i O O i
o o o oCM I I O • I i I MO I
rH rH CM
I i I
I i I
O I oo om i orH CM
i i i
i i i
o o oin m vo
i i
i i
i o i
oi m i
CM
i o i
00
ooCM
omCM
omCM
Ooo
00h-vOCMCONO'<tO00CMvOiHr^C0O^OC>C000C>OCM00C>00CMC>C0a«CMCMCMCOCMCMCOCMCOCMCMCMOOCMCOCOCOCMCMCMCMCOCMCMCMCMCMCMCMCM
tHCMCO^in^ONOOOOiHCMrO^in^ONOOONOrHCMCO'^in^ONCOaiOvOvOvOvOvOvOvOvOvOh-Nt^t^C^NNNh-NCOCOOOCOOOOOOOOOOOCOOv
78

2OMH<UMOhHCOCO
<u
MOh
OtO
CQ -0
CD
X 3H CQ -HZ "H
to c CUDu toOh U CO< w
to
toCO
to
HUto*->
CQDCO
Dh O (X O PU
OKWWmOKWWOKODiKK
I i i i
i i i i
i O i i
oI iH I I
2700350
1400
o o o oin o m oCM CO CM rH
i o O mmoNI CM CO
i i i oo
i i o oo m
I I -^ CM
I Oi i
I O i
oi O i
CM
t I i
i I i
i i oo
i i in
omCM
O O i
^ rHCM rH I
I I
I I
i oo
I vO
i oO
I CO
I I
I I
I I
OOrHOOOCMCOCOCOt^CO^O^rHOCMCOrOCMCMCMCMCMCMCMCOCMCOCOCM
rHCMCO^LnOr-aOOOr-HCMCO^Ln000000000000000rH iH rH rH rH rH
</)
(A H. (r)
U U) 3 M3 u 3
3 3,X K </)
X a n+-> a 3CD +-> u 09•-> CD Oh M M X
"i cu 3CD 01 +->
C CD c CD X•H c •H C rHU\ •H Cfl •H u •Hc a\ C O CD Ohto c to C •P
1 to 1 to a CD
0) i CD 1 •PrH •H rH •H u rtf
O H O (-> •H >c rH c rH rH •H•H 3 •H 3 CD MCO s CO 2 X Oh
1 1 t
Oh
1
Oh
1
o1
Mto to to to J OSco s CO 2 to
XOh
79

oM WH QU) OH
<
QUH
U KX Q
0,
<OUc/>
HO-J
u a(x)
D
mmQcQQQmQQQCQQCQQCQQcQQCQQCQQcQCQQCQCiCQQcqQQmQcq2QmcQmQcqQCQQCQQCQQCQQCQQQ2QcQQcQQ
cxDmoooocoooONccTfNTtNvoooaiioirioot^^oc^^o^oiricoooo
LO^OLncnNnc^inc^^iri^LnLoc^n^^^iri^ooTt'NLriin^fNLnro
ojroh- oj-^vooTtroofO-^^m^^cocvicNjrocNjr- (mcocvj^cmcmojco
c^^ONn^m^^inc^nc^^cnojNinncnvocsjoocMcoojcncocorO'^
NNOrfHOOOinHNh O)CMC0f0Ot^iHNC000rnoJOCX)NON^Ococ\)HHooooooo\OOooacoo^oocMX)aco(>«inocooooocoaoo
avoowocovoooiDHvooNcooo^^^hHainooino^co^OHccooin^cnoj^-^cooojcoiHcoiricocOiHcnrocor^voiHirio^ocvjcN)
iHrHiHr-lfHiHrHiHr-lfHrHiHrHiHrHrHrHiHiHrHiHiHr-4iHrH iHiHrH
TjrnvOHiriwHinoooHvocMOiNHmoN^wai^inwOovotno)NNinNcoooNCN)(,n-^roiHrnNvoO'^Tt(,riOinonvoNco ,^oo)'^'^
Or-ICMO)t^NOJOCMCMinO<JiinQO^Ot^^tvOCN)COiHOO'^vOOCMCN)C\J
iHiHrHfHrHiHiHiHfHiHfHiHiHiHfHrHiHpHpH iH iHiHrHiHrHtHiHiH
Hwn^m^NooaOHoicn^irnoNooaOHNm'tinoMooorHrHiHiHfH»HrHiHrHtHCMCVJOJ<NCN)CNJC\JC\lCMCMrO
80

<
Q
gH
X 3 QM C "ZQ -H <3
Id C OOu O ZtX U h< ^- a
ou
H3Ha.
£2
M wH Qin <xti) o
U3
U
Hu a»-5 CQCQ 2^ 2
QfflQCQQCQQQfflQQQCDQfflCflQfflQQQQmQcQQcDQcDQmQcQQmQmmCimcQcQQmQQcQQcQcQmcQCicqQcqCicqQcq
ooooOLOvonn^inc^u^cNic^LnrfTtinvOLn^NNrO'^'^iriiri^vooo
Nint^invoc^TtcNj^oic^c^c^^in^c^^NLnoopnt^vo^cnroTtvoo
ojc^cMojTt, ^cM^c^c\ic^t^cMrnn^cMC\j^i^'<tT}«'^ir)roc^c\irnrn^
irin(^ro^^c\c^cnc\cMLncNjc^cNj<rioirHc^coTj<Niriiric,oc\]c^c,nTtrj<
oocccoLnt^oO'^ON^oo-^ONiHrHvOvOCMvOCMtVCOinfO
OOHOOONinCO^OvON^OOCMCOHHcMtnHroHOcNMmoiommNcnHO
00rH00Ul^OrH«Hr0Cvl0D'^,^t
, rnv000'^^, O\t, (>OO'Hr0rHC\lLr)(>>HHmwc\Lnoi'Oinil ^vO(,oo<MHOot<iHOfOomcno(«iinNHOiniHiHrHrHiHiHrHiHrHrHiHrHrHiHrH rHiHiHrHiHiHr-l rHiHfHpHrHiH
iri^aDO>c^pHONC\ic»H\oroc\icMCNLricritv-o ,<to^oOcniric^cnoNOiri
iHrHiHr-tiHiHrHrHiHiHiHiHiHrHrHiHrHiHrHiHMr-tiH rH iH rH «H r-l i-H
»OHH\ow(MNinooo^ooomNOinN^^ooaoooooroNrocMO>c\iCNi^n\oir)OOLO^c^N^incn^n^coc^^cnc\iLOOTt, (r)fr)
,*^f,niHiHiHiHrHiHpHiHiHr-lrHrHpHfHiHrHtHiHiHrHiHrHfHtHiHpHiHiHrHtH
HMfOtmvONOOOOHtMfl'tinvONCOaOHM^^in^MO^O
81
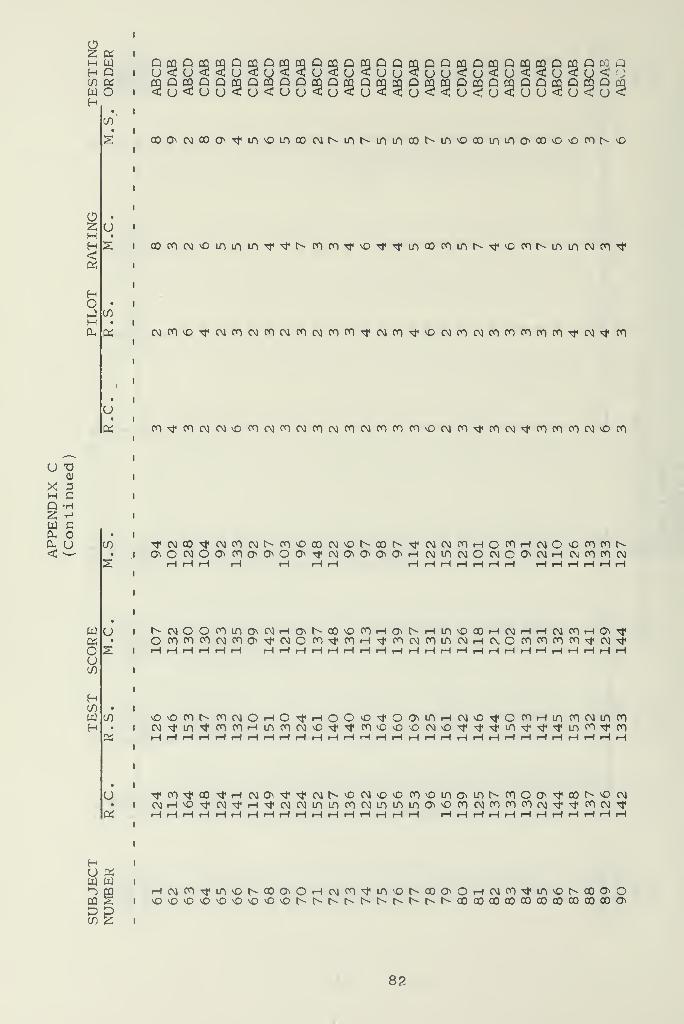
u v0)
X
o.OhOh CJ<
MHCO OhOh O
en
u
u
HU OSOh Oh*~> aOh S^ BCO z
QuCQQCDCQQpQQCQfflQCQQfflQQCQQQcQQCQQfflCQQCQQCiul
Q QU U
QUCQQQffiQCQDfflCQQcQCQ QCQQ
u < uQ QU U
QU
QU
ooorvioooTtirioinoo cMNinNininooNiriocoinifiooo\ovocnN€
coc^c\)OLniriiriTj<T^Nc^ctiTto^^inooniriNTt| vorot^ir)LOOiro ,t
c\jrovo\fCNic^c\inc\i(^cvic^n^c\ico^oc\)coc\icococ^cocO'^CNi'st, co
n^cncNic^voc^c\jnc\jooc\jcncNicnnn\ocMn^cncvi^c^c^roojvooo
OOCVJOOnCOOnOnOO^OJOOOOnNNfnHocoHNO^omroNNlOCMOCMOO^CMH CM CO CO CMrHrHiHiHtHfH iH rH fH iH r-l rH
^c^)00(,Oln!^c^)Ho^^oovofOHo^^Hln>oooHCMHHc^)P^H(H^^Oc^n(ricNiroo>rt'C\)Om^c^iH\}<cnc\ic^iric\irHC\OcocnrorOTtoj'>^iHiHrHrHrHiH rHrHiHiHiHrHiHrHiHrHtHiHiHiHiHiHfHiHiHrHiHrHfH
\0\ofONcnNOHO^HOO^^o^iOHCMvo^ocoHinfONinrn
c\,rHO^c\WrH^c\ic\jifiinc^(>iLnioio^ococ\icoconcN)^^coc\)^
rHCNjOOrtlO^OC^OOONO rHc\)c,0'<tin>oNooo\OrHCMro^invONooootv.fv.fv.t^t^NNh-N00000000000000C00000O
82

QJ
XMDC•H
co
5}H.
0-
2 aH Q
CQQCQQCQCQCQQCO asw o
QCQQCQQQQCQo<:u<!ouu<d
CO
u
Hu a•-> PQCQ £CO Z
Q Q CQ Q CQ Q QU U < U < U U
inooi'^coaooMriONfiocovoo
vOfo^^vOLn'^QOiriiricMvocNj'^ro
^\OCMCMCNiaDrovoc\jrgc\jc\joO(Mir)
CM-^rorococn-^oorococMCNjincMCM
NvOOOW»OWao0^flO<3NN(MOOlXOaOHOOWOOHOfO^Oi
Oi00\OOC\ocX3OONCsjCMLria*OiriOCVlCOCO^OlTirOTtr-tOlOr-ICONxtfiHrHrHrHiHrHiHiHiHrHiHiHrHrHiH
^CJON^DiHCMCNJOJt^O^OirilO,<tt^iri\t, NLn'<t\t*cO'^incoTtNON
tOHN>ocoocnN^ino)€fnaroLn ,,t'^, vocoiHOcvjT}*LocNi'^, Nco
HNCO^lOvONOO^OHNrO^lTiQ\(M3\a»(M>»aOOOOOO
U
uCO
as CO ,«—
•
•
K •H X^ — •H
o CO •H•H ^ •)->
•H M coCO •H QJ
+-> +-» 0)
u CO C Va QJ •HH QJ u COc -o0) •H QJ 0)
U CO rH iH43 .a
V a <ti «l
•H •H 0) QJ
D 0^ > >•H •Ha as 2 S
1
<t
CQ
1
U
1
Q
83

APPENDIX D
DISTRIBUTIONS
of
TEST SCORES
and
RATINGS
84

20
15
10
5
a. Rigid Center
C/)
<D
0)
•H</>
0)
H<HO
Hc
u
20
15
10
5
- b. Rigid Side
l ^_• j
20
15
10
5
c. Moveable Center
80
20 I. Moveable Side
a
15
10
5
1
180100 120 140 160
Test Scores (5-second frames)
Figure D-l. Distribution of Test Scores - Jet Pilots
85

a. Rigid Center
0)
a>
en
H
+->
c<u
ouV
40
30
20
10
40
30
20
10
40
30
20
10
- b. Rigid Side
> c. Moveable Center
40
30
20
10
- d. Moveable Side
123 456 789 10
Pilot Ratings
M.Increasing Acceptability
Figure E>-2. Distribution of Opinions - Jet Pilots
86

V)
<D
<D+J
(/)
CD
H^H
+->
C<D
un(D
a.
30
20
a. Rigid Center
10
i
30 r
20
10
30 r
20
10
20
10
" b . Rigid Side
l i
c. Moveable Center
30 r d. Moveable Side
80 180100 120 140 160
Test Scores (5-second frames)
Figure D-3. Distribution of Test Scores - Prop Pilots
87
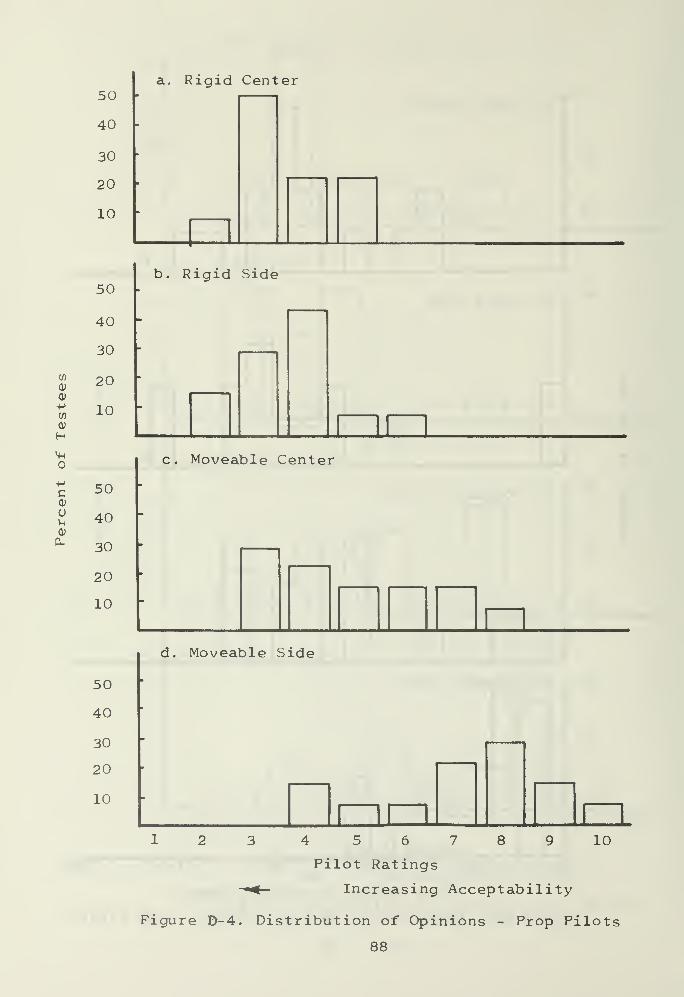
50
40
30
20
10
a. Rigid Center
</)
0)
+->
w0)
HHh
HC0)
on
50
40
30
20
10
50
40
30
20
10
50
40
30
20
10
b. Rigid Side
c. Moveable Center
d. Moveable Side
8 1012 3 4 5 6 7
Pilot Ratings
< Increasing Acceptability
Figure D-4. Distribution of Opinions - Prop Pilots
88

dl
Q)4->
</)
<u
H
o
HCQJ
U
30 •
20
10
a. Rigid Center
x
30 -
20 "
10
b. Rigid Side
30
20
10
c. Moveable Center
30
20
10
d. Moveable Side
80 100 120 140 160
Test Scores (5-second frames)
180
Figure EU5. Distribution of Test Scores - Helo Pilots89

80 -
60
40
20
a. Rigid Center
C/)
a>
HCD
Q)
H<H
c0)
uM0)
a,
80 -
60 *
40
20
b. Rigid Side
80 -
60 -
40 "
20
c. Moveable Center
80
60
40
d. Moveable Side
20
123456789 10
Pilot Ratings
-^— Increasing Acceptability
Figure D-6. Distribution of Opinions - Helo Pilots90

50
40
30
20
10
a. Rigid Center
<D
QJ
•H(/)
<D
Hmo
c<D
O)-i
<D
Oh
50
40
30
20
10
50
40
30
20
10
80
b. Rigid Side
c Moveable C enter
50
40 -
30 --
20 -
10
^^^^ i I 1
d. Moveable Side
180100 120 140 160
Test Scores (5-second frames)
Figure D-7. Distribution of Test Scores - Private Pilots
91

a. Rigid Center50
40
30
20
10
50
40
30
10
S 20QJ
+->
on
to
H
O
•H
c(1)
uuOa.
50
40
30
20
10
50
40
30
20
10
b. Rigid Side
Moveable Center
d. Moveable Side
812 3 4 5 6 7
Pilot Rating
< Increasing Acceptability
Figure D-8. Distribution of Opinions - Private
10
92

40 - a. Rigid Center
30
20
10
L l.„. 1
</)
0)
0>
H(/)
<U
H<H
c
OuQJ
40 - b. Rigid Side
30 -
20
10
i i '1
40
30
20
10
40
30
20
10
c. Moveable Center
-
> J
d. Moveable Side
JL
80X
100 120 140 160
Test Seores (5- second frames)
180
Figure JD-9. Distribution of Test Scores - Non-Pilots
93

60
50
40
30
20
10
60
50
40
</)30
<u
<D 20•Hw0) 10H<H
60+->
C0)
o 50Vh
0) 40
r a. Rigid Center
30
20
10
60
50
40
30
20
10
2 3 4 5 6
b. Rigid Side
8 10
12 3 4 5 6
c. Moveable Center
12 3 4
d. Moveable Side
7 8
8
10
10
101 2 3 4 5 6 7
Pilot Ratings
M. Increasing Acceptability
Figure 1>-10. Distribution of Opinions - Non-Pilots
94

REFERENCES
1. Air Force Flight Dynamics Laboratory Technical Report69-40, Fly-By-Wire Flight Test Program , by Gavin D.Jenney, September 1969.
2. Air Force Flight Dynamics Laboratory Technical Report69-9, A Prototype Fly-By-Wire Flight Control System
,
by J. E. Emfinger, August 1969.
3. Naval Air Test Center Report FT-63R-69, Flight Evaluationof a Stick-hand (palm) Controller in a UH-2C Helicopter
,
by D. M. Hine and R. J. Palma, 2 July 1969.
4. National Advisory Committee for Aeronautics, LangleyAeronautical Laboratory, Research Memorandum L562289,Flight Investigation of a Small Side-located ControlStick Used with Electronic Control Systems in a FighterAirplane , by S. A. Sjoberg, W. R. Russel, W. L. Alford,11 March 1957.
5. Naval Air Test Center Technical Report FT 2123-62R-64,Flight Evaluation of a Side Hand Controller in an F-4AAirplane , by T. M. Kastner and R. H. Soderquist,October 1964.
6. Air Force Flight Test Center Report TN-56-24, An Evaluationof the Side Stick Control System Installed in the F-102A
,
by W. R. Allen and R. M. White, November 1956.
7. Navy Department Bureau of Aeronautics Report AE-61-4V, TheArtificial Feel System , by Mechanical Design Department,Northrop Corporation, May 1953.
8. Navy Department Bureau of Aeronautics Report AE-6-4-III,The Human Pilot , by Mechanical Design Department,Northrop Corporation, August 1954.
9. British Aircraft Corporation Limited, Guided WeaponsDivision Report AD 854431L, Effects on TrackingPerformance of Vibration in Each and in Combinations ofthe Heave, Sway and Roll Axes , by C. R. Shurmen, October1967.
10. Air Force Flight Dynamics Laboratory, Research and Tech-nology Division, Technical Report 66-138, Human PilotDynamics with Various Manipulators , by D. T. McRuer andR. E. Magdeleno, December 1966.
11. Air Force Dynamics Laboratory, Research and TechnologyDivision Technical Report 67-53, Fly-By- Wire Techniques ,
by F. L. Milke and J. E. Emfinger, July 1967.
95

12. Air Force Flight Dynamics Laboratory, Research and Tech-nology Division Technical Report 66-72, Effects ofManipulator Restraints on Human Operator Performance
,
by R. E. Magdeleno and D. T. McRuer , December 1966.
13. Second Annual NASA-University Conference on Manual ControlNational Aeronautics and Space Administration SpecialReport SP-128, An Evaluation of Three Types of HandControllers Under Random Vertical Vibration , by A. Z.Weisy, R. W. Allen and C. J. Goddard, March 1966.
14. Tustin, A. , Automatic and Manual Control , Academic Press1964.
15. ALCOA Aluminum Handbook , Aluminum Company of America, 1962,
16. Perry, C. C. and Lissner, H. R. Strain Gage Primer , 2 ed.McGraw-Hill, 1962.
17. Air Force Flight Dynamics Laboratory Research and Tech-nology Division Technical Report TR-66-163, FlightInvestigation of Longitudinal Short Period FrequencyRequirements and PIO Tendencies , by D. A. DiFranco,June 1967.
18. Air Force Flight Dynamics Laboratory Research and Tech-nology Division Technical Report TR-65-39, GroundSimulator Evaluations of Coupled Roll-Spiral ModeEffects on Aircraft Handling Qualities , by F. D. Newell,March 1965.
19. Cooper, G. E. , "Understanding and Interpreting PilotOpinion." Aeronautical Engineering Review , March 1957.
20. National Aeronautics and Space Administration TechnicalNote D-5153, The Use of Pilot Rating in the Evaluationof Aircraft Handling Qualities , by G. E. Cooper and R. P,
Harper, Jr., April 1969.
21. National Aeronautics and Space Administration TechnicalNote D-2255, The Adaptive Dynamic Response Character-istics of the Human Operator in Simple Manual Control
,
by L. R. Young, D. M. Green, J. T. Elkind, and J. A.Kelly, April 1964.
22. AirForce Flight Dynamics Laboratory Research and Tech-nology Division, Technical Report 65-15, Human PilotDynamics in Compensatory Systems - Theory, Models, andExperiments with Contrlled Element and Forcing FunctionVariations , by D. T. McRuer, D. Graham, E. Krendel andW. Reisener, Jr., July 1963.
23. Naval Training Device Center Technical Report 1146-1,Criteria for Acceptable Representation of AirplaneDynamic Responses in Simulators used for Pilot Training
,
by F. D. Newell, October 1962.
96

INITIAL DISTRIBUTION LIST
No. Copies
1. Defense Documentation Center 20Cameron StationAlexandria, Virginia 22314
2. Library 2Naval Postgraduate SchoolMonterey, California 93940
3. Commander Naval Air Systems Command 4Navy DepartmentWashington, D.C. 20360
(Air-310C)(Air-340D)(Air-510H)(Air-530113)
4. Air Force Systems Command 1
Flight Dynamics Laboratory (FDCC)Wright-Patterson Air Force Base, Ohio 45433
5. Chairman 1
Department of AeronauticsNaval Postgraduate SchoolMonterey, California 93940
6. Associate Professor Donald M. Layton 1
Department of AeronauticsNaval Postgraduate SchoolMonterey, California 93940
7. Dean of Research Administration 2
Naval Postgraduate School
Monterey, California 93940
97


UNCLASSIFIEDSecurity Classification
DOCUMENT CONTROL DATA -R&D(Security classification of title, body ol abstract and indexing annotation must be entered when the overall report Is classified)
1 ORIGINATING 4CTIVITV fCorpor«l« aulhorj
Naval Postgraduate SchoolMonterey, California
2a. REPORT SECURITY CLASSIFICATION
Unclassified2b. GROUP
3 REPORT TITLE
A Simulator Evaluation of Pilot Performance and Acceptance of
an Aircraft Rigid Cockpit Control System4 descriptive NOTES (Type of report and. inclusive dates)
Technical Report, 19705 au THORISI (First name, middle initial, last name)
Layton, Donald M.
6 REPOR T D A TE
15 July 19707«. TOTAL NO. OF PAGES
1007b. NO. OF REFS
238a. CONTRACT OR GRANT NO
b. PROJEC T NO.
9a. ORIGINATOR'S REPORT NUMBER(S)
NPS-57LN70071A
Air Task A31310/551/70R00501019b. OTHER REPORT NO(S) (Any other numbers that may be assigned
thit report) "
10 DISTRIBUTION STATEMENT
This document has been approved for public release and sale; its
distribution is unlimited.
11. SUPPLEMENTARY NOTES 12. SPONSORING MILITARY ACTIVITY
Naval Air Systems Command
13. ABSTRACTA* ground-based simulator facil
tracking task with a random appearperformance of one hundred five pifour separate control sticks -- twacceptance of the rigid cockpit coindividual pilot ratings of the stand opinion, the rigid systems werable counterparts. Steps were takelearning, fatigue, or adaptationseveral test limitations, includinthe lack of aircraft vibration efftion
.
ity employing signallot and noo moveablentroller
s
icks. In ge found ton to avoidThe resultg the lowects, and
ing a two-axis compensatorywas used to evaluate the
n-pilot test subjects usingand two rigid. Pilot
was determined by comparingeneral, in both performancebe superior to their move-errors due to pilot bias,
s obtained are subject tostick-force levels employedthe realism of the simula-
DD FORMi nov ee
S/N 0101 -807-681 1
1473 (PAGE n UNCLASSIFIED99 Security Classification
A-31408
UNCLASSIFIEDSecurity Classification
key wo R OS
Simulator
Aircraft Controls
Human Factors
Side-arm Controllers
DD, FNo*r 691473 back)
S/N 0101-807-6821
ROLE ROUE
UNCLASSIFIED100 Security Classification

U133994

DUDLEY KNOX LIBRARY - RESEARCH REPORTS
5 6853 01068950 8 •