Embed Size (px)
Citation preview
United StatesDepartment ofAgriculture
Forest Service
Pacific NorthwestResearch Station
Research PaperPNW-RP-544March 2002
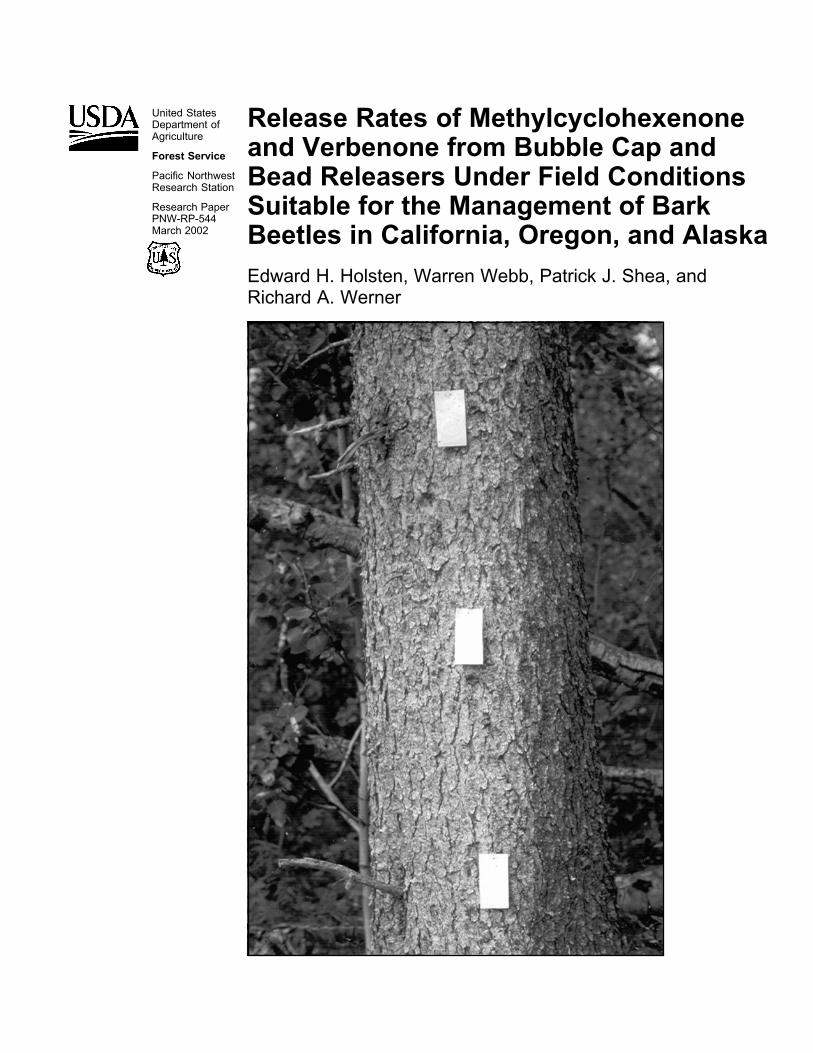
Release Rates of Methylcyclohexenoneand Verbenone from Bubble Cap andBead Releasers Under Field ConditionsSuitable for the Management of BarkBeetles in California, Oregon, and AlaskaEdward H. Holsten, Warren Webb, Patrick J. Shea, andRichard A. Werner
This publication reports research involving pesticides, it does not contain recommenda-tions for their use, nor does it imply that the uses discussed here have been registered.All uses of pesticides must be registered by appropriate state or federal agencies, orboth, before they can be recommended.
CAUTION: Pesticides can be injurious to humans, domestic animals, desirable plants,and fish or other wildlife—if they are not handled or applied properly. Use all pesticidesselectively and carefully. Follow recommended practices for the disposal of surpluspesticides and pesticide containers.
Edward H. Holsten is a research entomologist, U.S. Department of Agriculture, ForestService, Pacific Northwest Research Station, 3301 C Street, Suite 522, Anchorage, AK99503; Warren Webb was an associate professor (retired), Forest Science Depart-ment, Oregon State University, Corvallis, OR 97331-7501; Patrick J. Shea was a re-search entomologist (retired), U.S. Department of Agriculture, Forest Service, PacificSouthwest Research Station, Davis, CA 95616; and Richard A. Werner was a re-search entomologist (retired), U.S. Department of Agriculture, Forest Service, PacificNorthwest Research Station, Institute of Northern Forestry, Fairbanks, AK 99775-5500(now closed).
Authors
Erratafor PNW-RP-544
1. Equation 2 on page 3 is changed to the following: dy/dX=b + 2cX
2. Text on page 6, paragraph 1, second to last sentence, should read: The slopes, however, were not significantly different between the four sites.
Holsten, Edward H.; Webb, Warren; Shea, Patrick J.; Werner, Richard A. 2002.Release rates of methylcyclohexenone and verbenone from bubble cap and beadreleasers under field conditions suitable for the management of bark beetles inCalifornia, Oregon, and Alaska. Res. Pap. PNW-RP-544. Portland, OR: U.S. De-partment of Agriculture, Forest Service, Pacific Northwest Research Station. 21 p.
Devices releasing antiaggregation pheromones, such as MCH (3-methyl-2-cyclohexen-1-one) and verbenone (4-methylene-6,6-dimethylbicyclo(3.1.1)hept-2-ene), are usedexperimentally to manipulate destructive populations of bark beetles. Two slow releasedevices, bubble caps attached to boles of trees and granular beads placed on theground, were tested in forests of California, Oregon, and Alaska to determine theirrelease rates. The hypothesis was that ambient air and soil temperatures were majordeterminants in the release rates of the releaser devices. Release rates of both bubblecaps and beads differed greatly. The fastest rate was for bubble caps at a warm, Cali-fornia pine (Pinus spp.) site where it was 15 times faster than the rate at a cool Sitkaspruce (Picea sitchensis Bong. Carr.) site in Alaska. Beads released MCH quickly andwere rendered ineffective in less than 2 weeks. Little or no release occurred thereafter,regardless of the amount of pheromone remaining in the bead, or litter layer tempera-ture. Release rates determined under field conditions are useful for the field entomolo-gist and are vital to the development of models for semiochemical dispersion.
Keywords: Semiochemicals, release rates, antiaggregation pheromones, bark beetles,temperature, MCH, verbenone.
The data reported here are from studies on the release rates of MCH and verbenonefrom two commonly used release devices, bubble caps and beads. These studies werecarried out in California, Oregon, and Alaska. Release rates of both bubble caps andbeads varied greatly. Ambient air and litter layer temperatures were the major determi-nants in release rates of the releaser devices. The fastest release rates from bubblecaps occurred at a warm California pine site and were 15 times the rate from a coolspruce site in Alaska. Bead releasers quickly released semiochemicals for about 2weeks. Little or no release occurred thereafter, regardless of the amount of pheromoneremaining in the bead, or litter layer temperature.
1 Introduction
1 Materials and Methods
1 Study Area Characteristics
2 Experimental Design
2 Quantification of Release Rate
3 Temperature
3 Results and Discussion
3 Release from Bubble Caps
11 Release from Beads
17 Conclusions
17 Acknowledgments
18 English Equivalents
18 Literature Cited
Abstract
Summary
Contents

This page has been left blank intentionally.Document continues on next page.
1
In the past few decades, outbreaks of various types of bark beetles in western NorthAmerica, including Alaska, have brought about renewed interest in these devastatingforest pests. Spruce beetle (Dendroctonus rufipennis (Kirby)) infestations impactedmore than 1 000 000 ha of forested land in south-central Alaska in the last decade(Matthews and others 1997). Many of these infested stands have over 90 percent treemortality. The impact of these outbreaks and the anticipated impact of future outbreakshave stimulated the continuation of basic and applied research on the use of semio-chemicals to manipulate populations of bark beetles (Holsten 1994, Shea 1995, Werner1994, Werner and Holsten 1995).
Bark beetle semiochemical communication systems are complex, involving insectphysiology, pheromone chemistry, and microclimate processes in the forest standatmosphere. There have been many successful applications of semiochemicals tomanage forest pests. An aerial application of verbenone in northwestern Montana sig-nificantly reduced the attack of lodgepole pine (Pinus contorta Dougl. ex Loud.) by themountain pine beetle (Dendroctonus ponderosae Hopkins) (Shea and others 1992).Antiaggregation pheromones, however, have periodically failed to reduce tree attack bythe mountain pine beetle (Amman 1993, Borden 1995) and the spruce beetle (Holstenand Werner 1985, 1987; Zogas 2001). These failures could be caused by technicalproblems involving the deployment, consistent release, longevity of releasers, and dis-persion of semiochemicals from the releaser, as well as the influence of the microcli-mate within the stand. Inconsistency in effectiveness of semiochemical applicationscould lead to a reluctance of manufacturers to produce semiochemicals for operationaluses and cause forest pest managers to be hesitant to use these chemicals for pestmanagement strategies (Borden 1995).
The inconclusive results of semiochemical field tests indicate a need to obtain system-atic knowledge on release rates from releaser devices—rates that are hypothesizedto be strongly controlled by temperatures in the field. This report describes the resultsof field tests on the release of MCH (3-methyl-2-cyclohexen-1-one) and verbenone(4-methylene-6,6-dimethylbicyclo(3.1.1)hept-2-ene) from bubble cap and bead releas-ers. MCH is the antiaggregation pheromone of the spruce beetle and the Douglas-firbeetle (D. pseudotsugae Hopkins). Verbenone is the antiaggregation pheromone of themountain pine beetle, western pine beetle (D. brevicomis Hopkins), and the southernpine beetle (D. frontalis Zimmerman).
The pheromones MCH and verbenone, formulated in bubble caps and beads providedby Phero Tech, Inc. (Delta, British Columbia, Canada)1 were placed at several fieldsites in California, Oregon, and Alaska.
Darling Ridge, California—This study site was located on a southwest facing slopein the Eldorado National Forest, about 1000 m elevation on the west side of the SierraNevada. The vegetation was a mixed stand of ponderosa pine (Pinus ponderosaDougl. ex Loud.), white fir (Abies concolor (Gord. & Glend.) Lindl.), incense-cedar(Calocedrus decurrens (Torr.) Florin), and California black oak (Quercus kelloggiiNewb.).
Silver Forks, California—This site was also located on the west side of the SierraNevada but at an elevation of 1700 m. The overstory was diverse, dominated by whitefir, incense-cedar, and Douglas-fir (Pseudotsuga menziesii (Mirb.) Franco) with sugarpine (Pinus lambertiana Dougl.) and ponderosa pine as minor species.
Introduction
Materials andMethodsStudy AreaCharacteristics
1 The use of trade or firm names in this publication is forreader information and does not imply endorsement bythe U.S. Department of Agriculture of any product orservice.
2
Santiam Pass, Oregon—This site was located in the Cascade Range at an elevationof 1000 m. The open canopy comprised mostly Douglas-fir 15 to 25 m tall.
Enterprise, Oregon—This site was located in the Wallowa Mountains in northeastOregon at an elevation of about 1500 m. A closed canopy Douglas-fir stand dominatedthe site.
Cooper Landing, Alaska—This site was dominated by 100-year-old Lutz spruce(Picea X lutzii Little) (mean diameter-at-breast-height (d.b.h.) of 30 cm) located on asouth aspect at an elevation of 300 m about 150 km south of Anchorage on the SterlingHighway. The stand canopy was closed with an understory of 12 cm d.b.h. paper birch(Betula papyrifera Marsh). The litter layer, about 3 cm thick, was composed primarily ofbirch leaves.
Seward, Alaska—The overstory of this site was a 150-year-old closed-canopy Sitkaspruce stand (P. sitchensis (Bong.) Carr.) located on a flat area at about 300 m eleva-tion 15 km north of Seward, Alaska, on the Kenai Peninsula. Mean d.b.h. of the sprucewas 55 cm; the understory was sparsely scattered spruce seedlings and a layer ofmoss 7 cm thick.
We used MCH bubble caps with release rates2 of 24 °C at all study locations. In addi-tion, we used MCH bubble caps with release rates2 of 17 °C at the two Alaska sites.These 17 °C caps are significantly more effective in the cooler Alaska temperaturesbecause they have a thinner membrane and thus a faster release rate than the 24 °Ccaps (Werner 1994, Werner and Holsten 1995). Only verbenone releasers were placedat the California sites.
Bubble caps were placed 2 m above the ground on the north side of trees, except inAlaska where they were placed on the south side. Four to five bubble caps were col-lected every 2 weeks for laboratory analyses. Shipment was made directly to the For-estry Sciences Laboratory of the USDA Forest Service, Pacific Northwest ResearchStation, in Corvallis, Oregon. Some bubble cap samples were analyzed immediatelyto determine residual levels of MCH and verbenone; others were frozen and storedfor later analyses.
In addition to the bubble cap studies, MCH beads were distributed at each site on theforest floor. Verbenone beads were distributed only at the Silver Forks and DarlingRidge sites in California. Ten beads were randomly selected every 2 weeks from eachstudy site and shipped to the Forestry Sciences Laboratory.
The initial amount of semiochemical in bubble caps was provided by the manufacturer.The best method for determining release of semiochemical from bubble caps was toweigh the fluid content of the bubble caps brought in from the field. Simply weighing in-tact bubble caps was not as accurate because contaminants such as dirt, water, orpitch could cause weight changes. The semiochemical weights were regressed againsttime. Representative samples of MCH and verbenone from bubble caps from eachstudy site were extracted with hexane and analyzed qualitatively by gas chromatogra-phy and mass spectrometry to check for possible degradation to inactive compounds.
The MCH and verbenone beads were about 2.1 percent MCH and 2.6 percentverbenone, respectively; the remaining mass was polypropylene polymers. Each beadwas sectioned in the laboratory with a razor blade and extracted with 1 milliliter of hex-ane. Concentrations of MCH and verbenone were determined by gas chromatography.
Experimental Design
Quantification of ReleaseRate
2 Bubble cap release rates determined at thesetemperatures by the manufacturer.
3
A more appropriate way, perhaps, to analyze the data is to estimate the actual releaserates. It is these rates that are expected to be strongly controlled by temperature. Re-lease rates are estimated by first fitting a model to each data set and then calculatingrelease rates by taking the first derivative or the slope of the line generated by the data-driven model. The model that is satisfactory for all data sets is the form
y = a + bX + cXX (1)
where
X is days,
y is residual chemical in grams, and
a, b, c are parameters generated by fitting the model to the data.
The first derivative of this model is
dy/dX = b + 2cX (2)
where dy/dX is the release rate in grams per day.
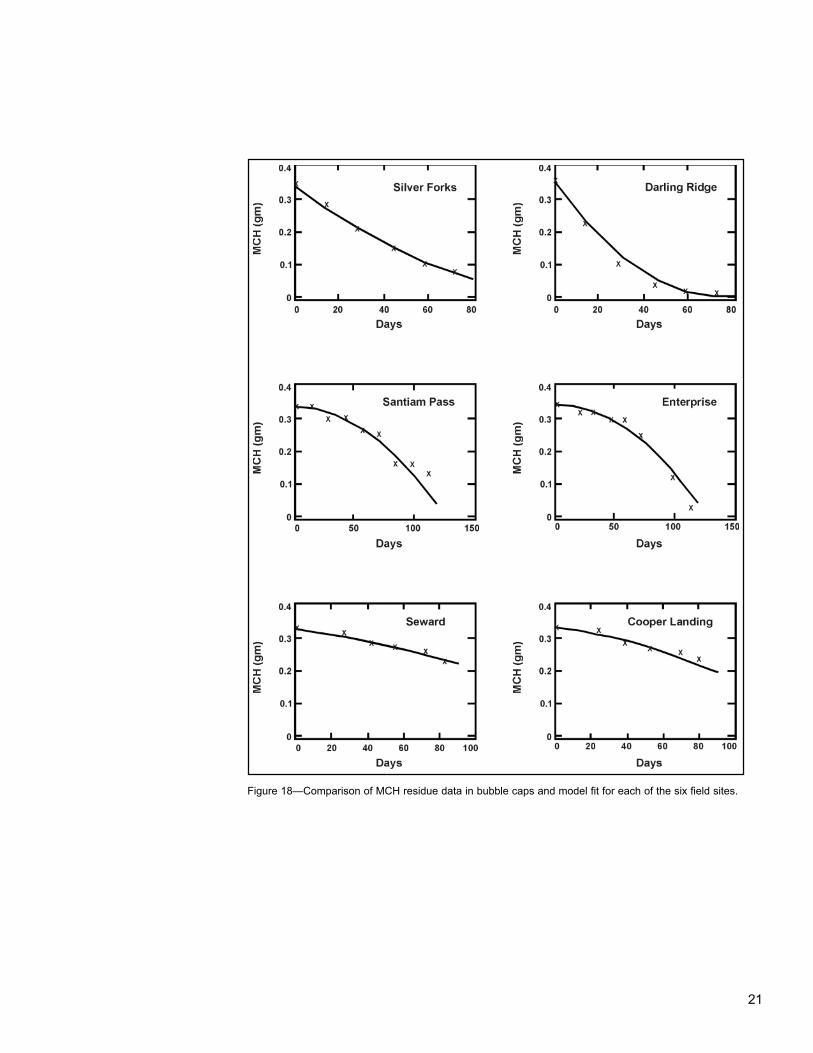
If the parameter c approaches zero, the release rate is b, or is constant with time. Anydeviation from a constant release rate in the field is estimated from the value of the pa-rameter c. Figure 18 in the appendix shows the fit of the model to each field data set for24 °C bubble caps. Release rates are taken directly from the model lines derived foreach field site. Figure 18 is a measure of the confidence expected in the calculated re-lease rates.
Temperature measurements were made at each study site coincident with the releaserstudy. Each site had a weather station with an Omnidata data recorder (Omnidata In-ternational Inc., Logan, Utah) which received input from two exposed sensors; oneplaced on the tree bole at a height near the bubble caps and the other 2 to 3 cm belowthe surface of the litter layer. We thought litter layer temperatures were important fac-tors controlling the release rates, especially in Alaska where the litter temperatures aremuch lower than in warmer climates for which the beads were originally formulated.Temperature data were collected at 2-hour intervals.
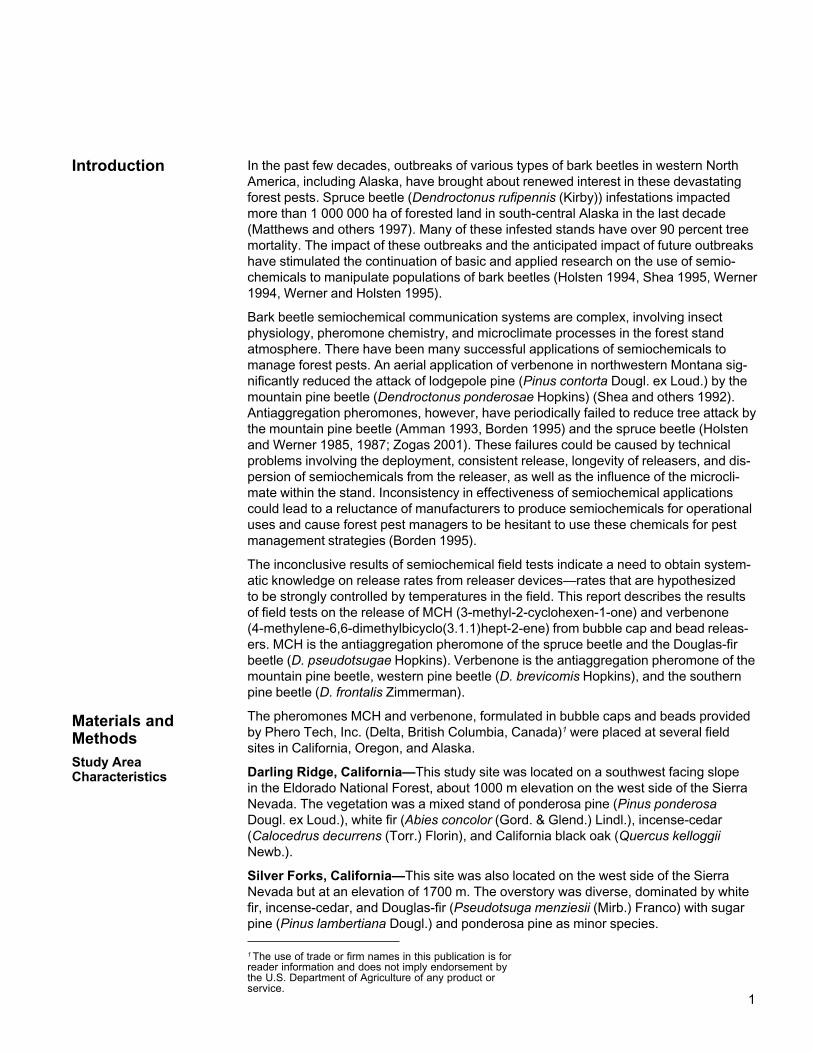
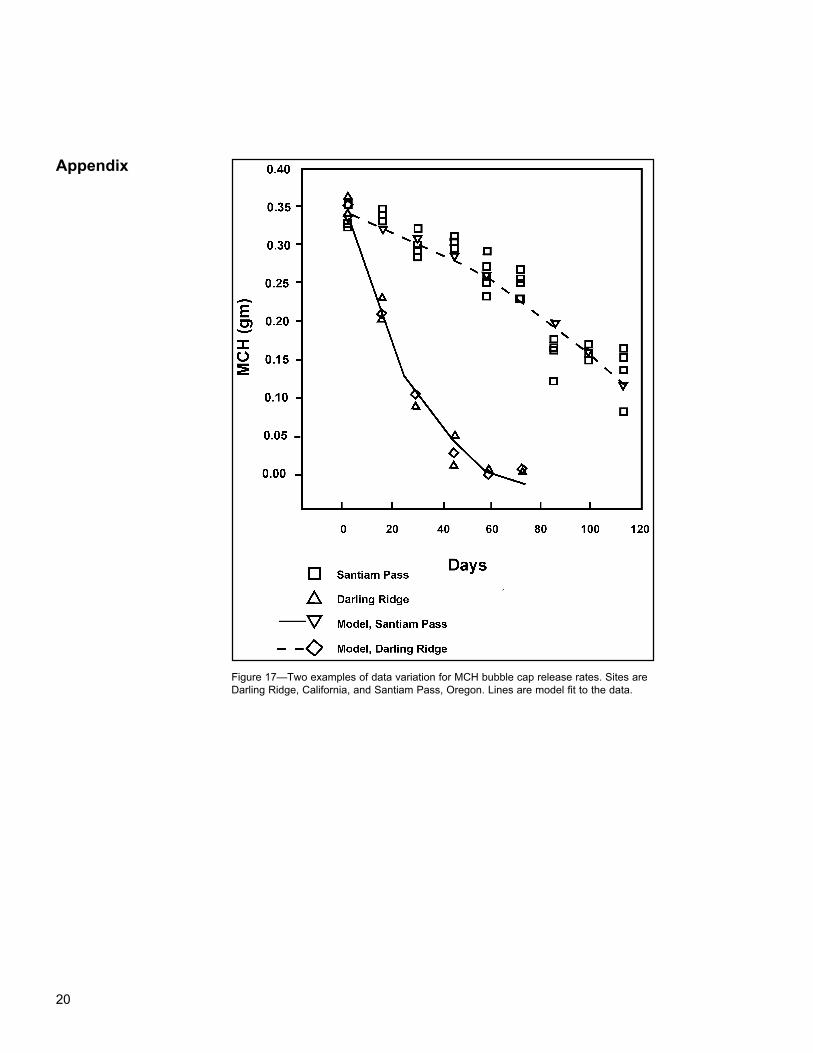
In general, MCH release rates in 24 °C bubble caps were similar at study sites inOregon and Alaska (Enterprise, Santiam Pass, Cooper Landing, and Seward), whereasMCH released faster at the Darling Ridge and Silver Forks sites in California (fig. 1).The residual MCH at the Darling Ridge site decreased especially fast compared to theother sites. The variation in the residual MCH for the 4 to 5 caps at Darling Ridge andSantiam Pass for each sampling period is shown in figure 17 (see app.); other siteshave similar variations.
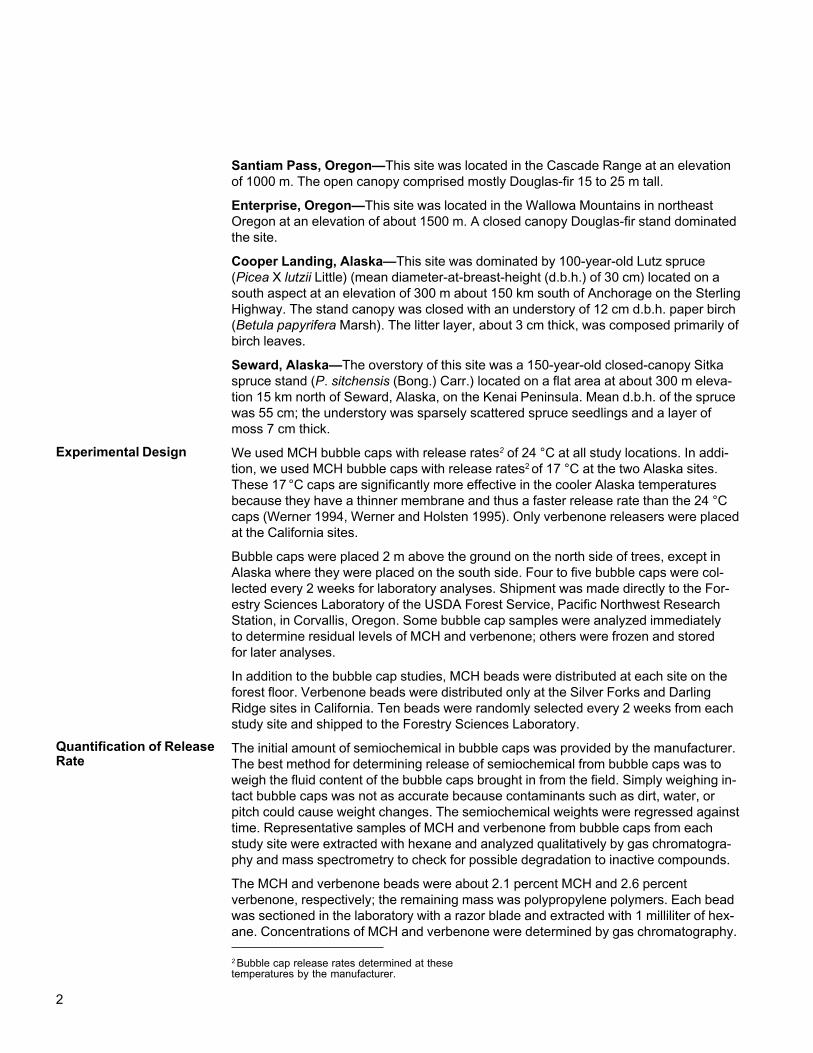
The 17 °C bubble caps began with higher amounts of MCH and declined faster thanthe 24 °C caps at the two Alaska sites (fig. 2). The residual MCH in the 17 °C caps atthe Cooper Landing site decreased more rapidly than at the other sites, whereas theloss of MCH in the 17 °C bubble caps at the Seward site was markedly reduced aftera rapid, initial loss.
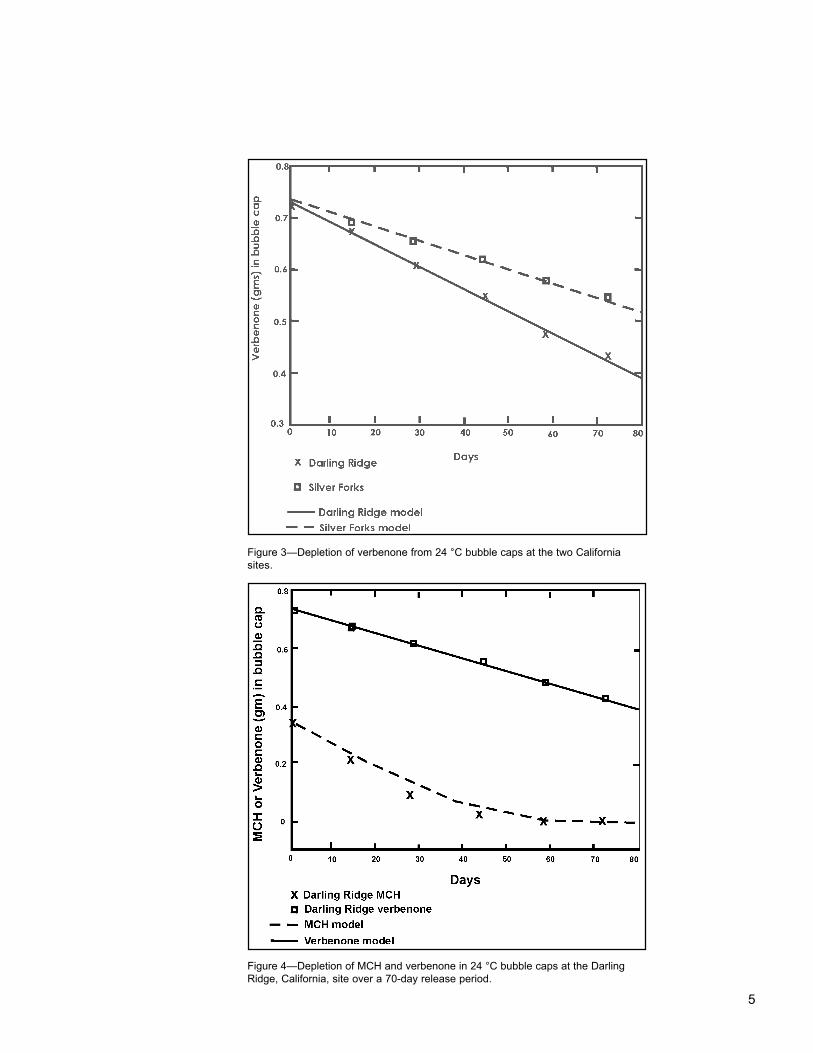
In contrast to the MCH bubble cap data, verbenone appeared to decline in a well-defined linear fashion at the Darling Ridge and Silver Forks sites (fig. 3). The rateof verbenone loss appeared to be faster at the Darling Ridge site. The MCH lossapproached an exponential decline compared to the linear decline in residual lossof verbenone at the Darling Ridge site (fig. 4).
Temperature
Results andDiscussionRelease from BubbleCaps
4
Figure 1—Depletion of MCH from 24 °C bubble caps at two sites each inCalifornia, Oregon, and Alaska. MCH was allowed to elute for 75 days inCalifornia and 115 days in Oregon and Alaska.
Figure 2—Depletion of MCH from 24 and 17 °C bubble caps at the two Alaskasites.
5
Figure 3—Depletion of verbenone from 24 °C bubble caps at the two Californiasites.
Figure 4—Depletion of MCH and verbenone in 24 °C bubble caps at the DarlingRidge, California, site over a 70-day release period.
6
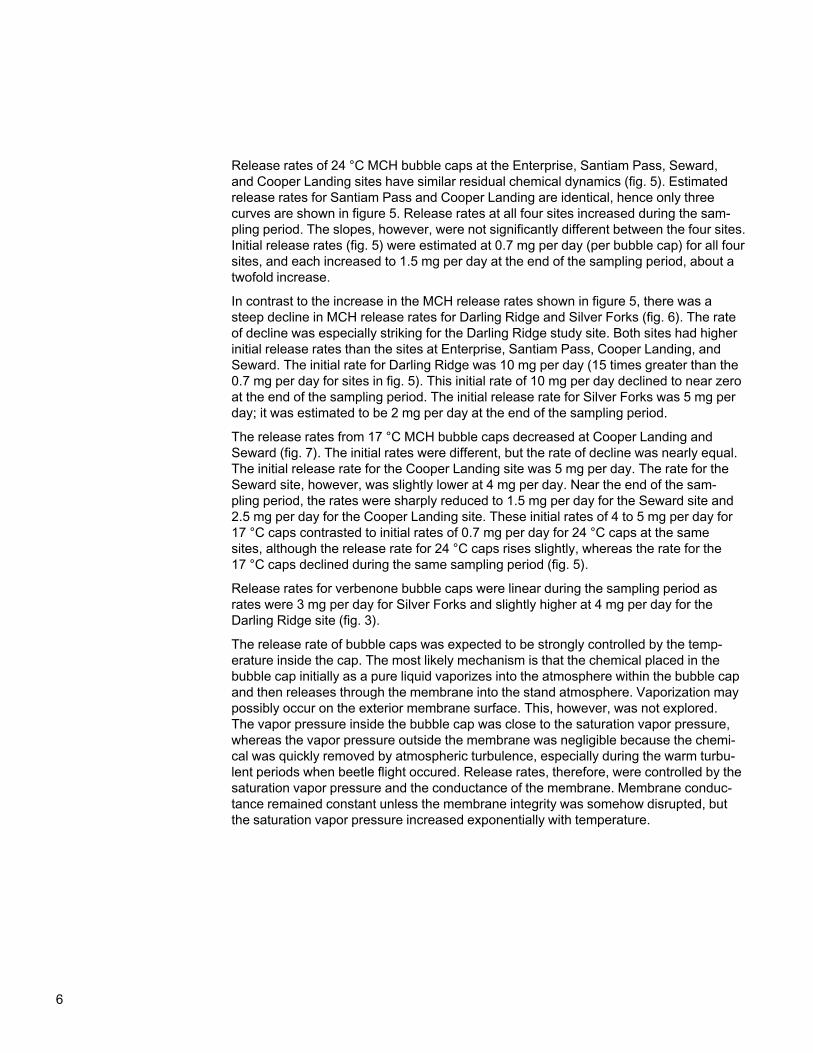
Release rates of 24 °C MCH bubble caps at the Enterprise, Santiam Pass, Seward,and Cooper Landing sites have similar residual chemical dynamics (fig. 5). Estimatedrelease rates for Santiam Pass and Cooper Landing are identical, hence only threecurves are shown in figure 5. Release rates at all four sites increased during the sam-pling period. The slopes, however, were not significantly different between the four sites.Initial release rates (fig. 5) were estimated at 0.7 mg per day (per bubble cap) for all foursites, and each increased to 1.5 mg per day at the end of the sampling period, about atwofold increase.
In contrast to the increase in the MCH release rates shown in figure 5, there was asteep decline in MCH release rates for Darling Ridge and Silver Forks (fig. 6). The rateof decline was especially striking for the Darling Ridge study site. Both sites had higherinitial release rates than the sites at Enterprise, Santiam Pass, Cooper Landing, andSeward. The initial rate for Darling Ridge was 10 mg per day (15 times greater than the0.7 mg per day for sites in fig. 5). This initial rate of 10 mg per day declined to near zeroat the end of the sampling period. The initial release rate for Silver Forks was 5 mg perday; it was estimated to be 2 mg per day at the end of the sampling period.
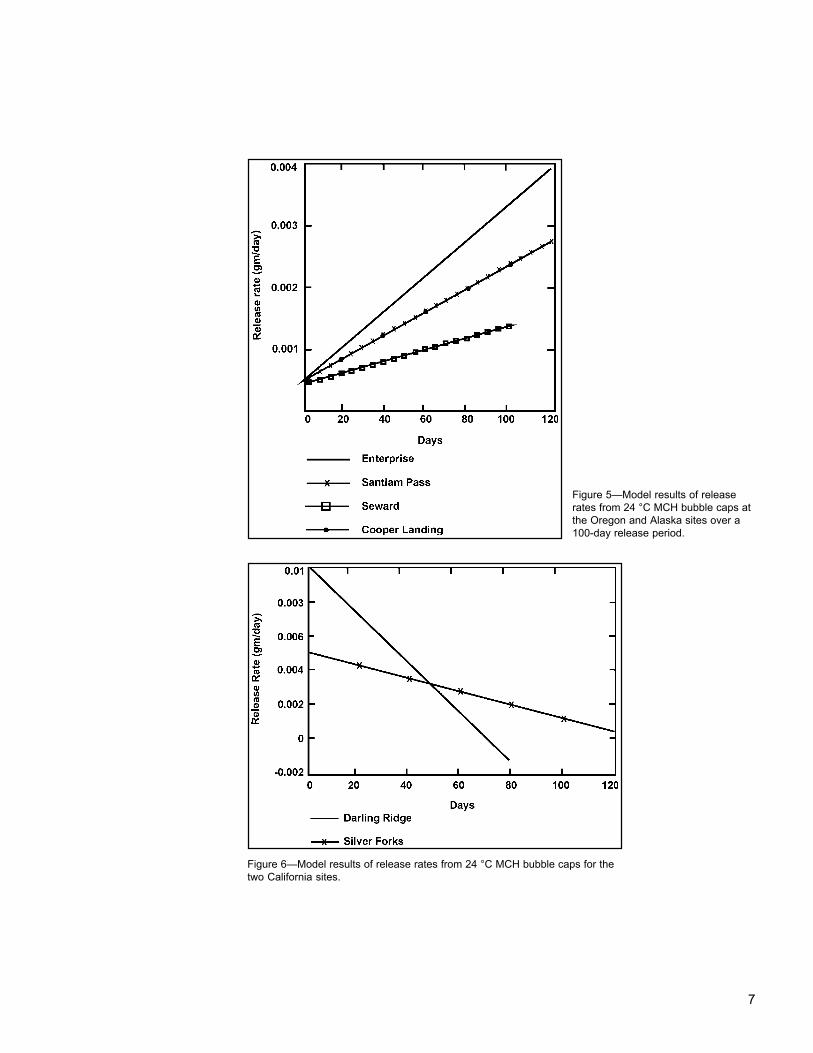
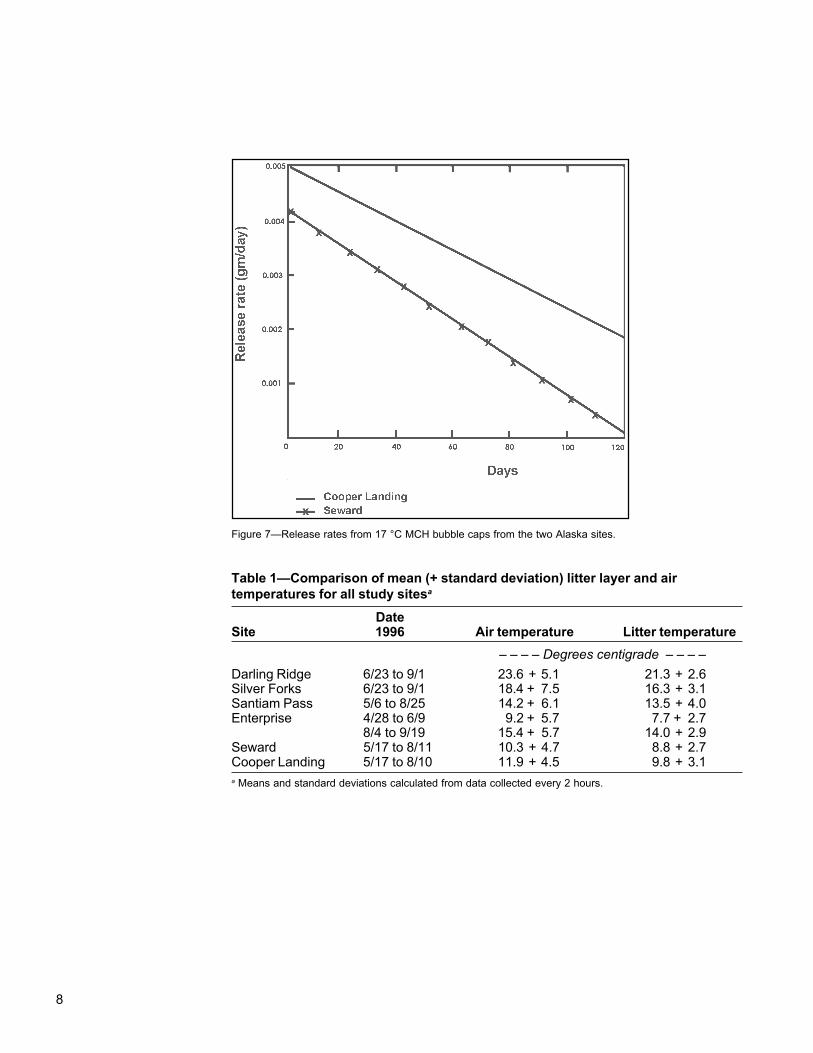
The release rates from 17 °C MCH bubble caps decreased at Cooper Landing andSeward (fig. 7). The initial rates were different, but the rate of decline was nearly equal.The initial release rate for the Cooper Landing site was 5 mg per day. The rate for theSeward site, however, was slightly lower at 4 mg per day. Near the end of the sam-pling period, the rates were sharply reduced to 1.5 mg per day for the Seward site and2.5 mg per day for the Cooper Landing site. These initial rates of 4 to 5 mg per day for17 °C caps contrasted to initial rates of 0.7 mg per day for 24 °C caps at the samesites, although the release rate for 24 °C caps rises slightly, whereas the rate for the17 °C caps declined during the same sampling period (fig. 5).
Release rates for verbenone bubble caps were linear during the sampling period asrates were 3 mg per day for Silver Forks and slightly higher at 4 mg per day for theDarling Ridge site (fig. 3).
The release rate of bubble caps was expected to be strongly controlled by the temp-erature inside the cap. The most likely mechanism is that the chemical placed in thebubble cap initially as a pure liquid vaporizes into the atmosphere within the bubble capand then releases through the membrane into the stand atmosphere. Vaporization maypossibly occur on the exterior membrane surface. This, however, was not explored.The vapor pressure inside the bubble cap was close to the saturation vapor pressure,whereas the vapor pressure outside the membrane was negligible because the chemi-cal was quickly removed by atmospheric turbulence, especially during the warm turbu-lent periods when beetle flight occured. Release rates, therefore, were controlled by thesaturation vapor pressure and the conductance of the membrane. Membrane conduc-tance remained constant unless the membrane integrity was somehow disrupted, butthe saturation vapor pressure increased exponentially with temperature.
7
Figure 5—Model results of releaserates from 24 °C MCH bubble caps atthe Oregon and Alaska sites over a100-day release period.
Figure 6—Model results of release rates from 24 °C MCH bubble caps for thetwo California sites.
8
Figure 7—Release rates from 17 °C MCH bubble caps from the two Alaska sites.
Table 1—Comparison of mean (+ standard deviation) litter layer and airtemperatures for all study sitesa
DateSite 1996 Air temperature Litter temperature
– – – – Degrees centigrade – – – –Darling Ridge 6/23 to 9/1 23.6 + 5.1 21.3 + 2.6Silver Forks 6/23 to 9/1 18.4 + 7.5 16.3 + 3.1Santiam Pass 5/6 to 8/25 14.2 + 6.1 13.5 + 4.0Enterprise 4/28 to 6/9 9.2 + 5.7 7.7 + 2.7
8/4 to 9/19 15.4 + 5.7 14.0 + 2.9Seward 5/17 to 8/11 10.3 + 4.7 8.8 + 2.7Cooper Landing 5/17 to 8/10 11.9 + 4.5 9.8 + 3.1a Means and standard deviations calculated from data collected every 2 hours.
9
The hypothesis is that the differences in the field release rates (shown in figs. 1 through7) can be explained by temperature differences. Table 1 is a compilation of the averagedaily air and litter layer temperatures for the six study sites. The sites in California(Darling Ridge and Silver Forks) had considerably warmer temperatures than the othersites, 23.6 and 18.4 °C, respectively. These temperatures explained the high initial re-lease rates at these sites because release rates increased exponentially with tempera-ture. The Oregon Douglas-fir sites had lower temperatures than the California pinesites, but somewhat higher temperatures than the Alaska spruce sites. Oregon andAlaska sites had release rates that were not significantly different from each other, al-though the average temperatures seem to be significantly different. At lower tempera-tures, release rates varied less with temperature. Rates were still affected bytemperature, but the magnitude was more difficult to demonstrate with field data.
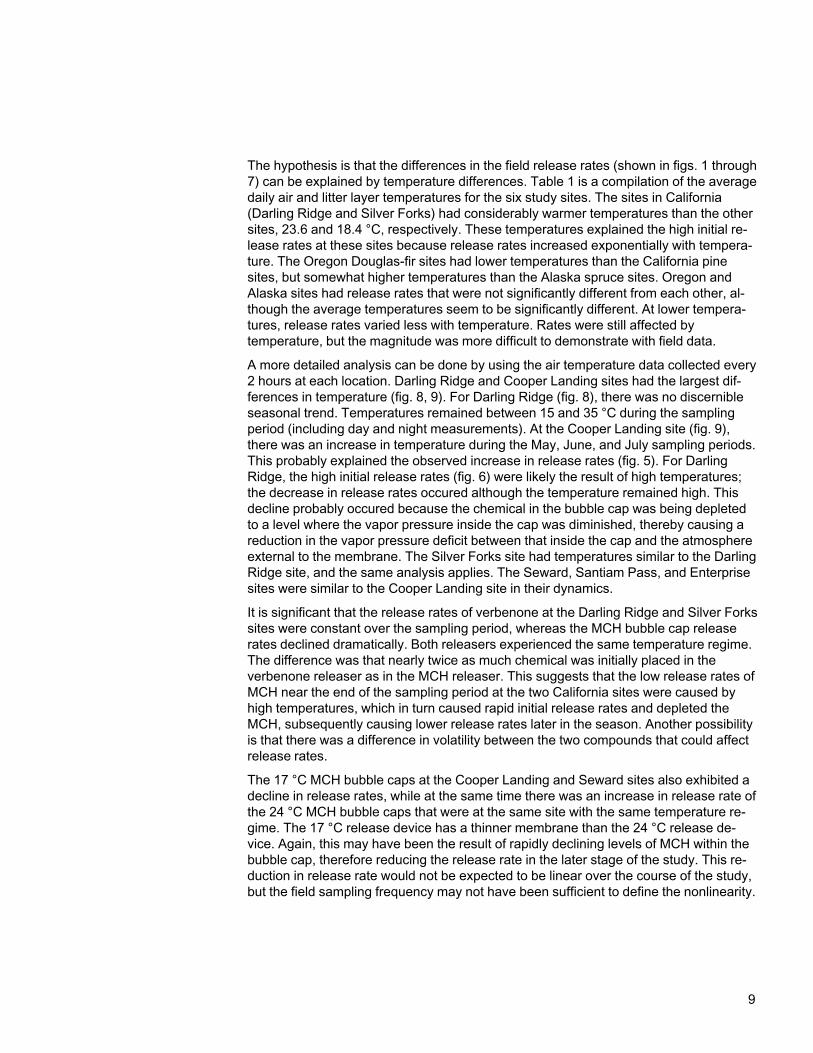
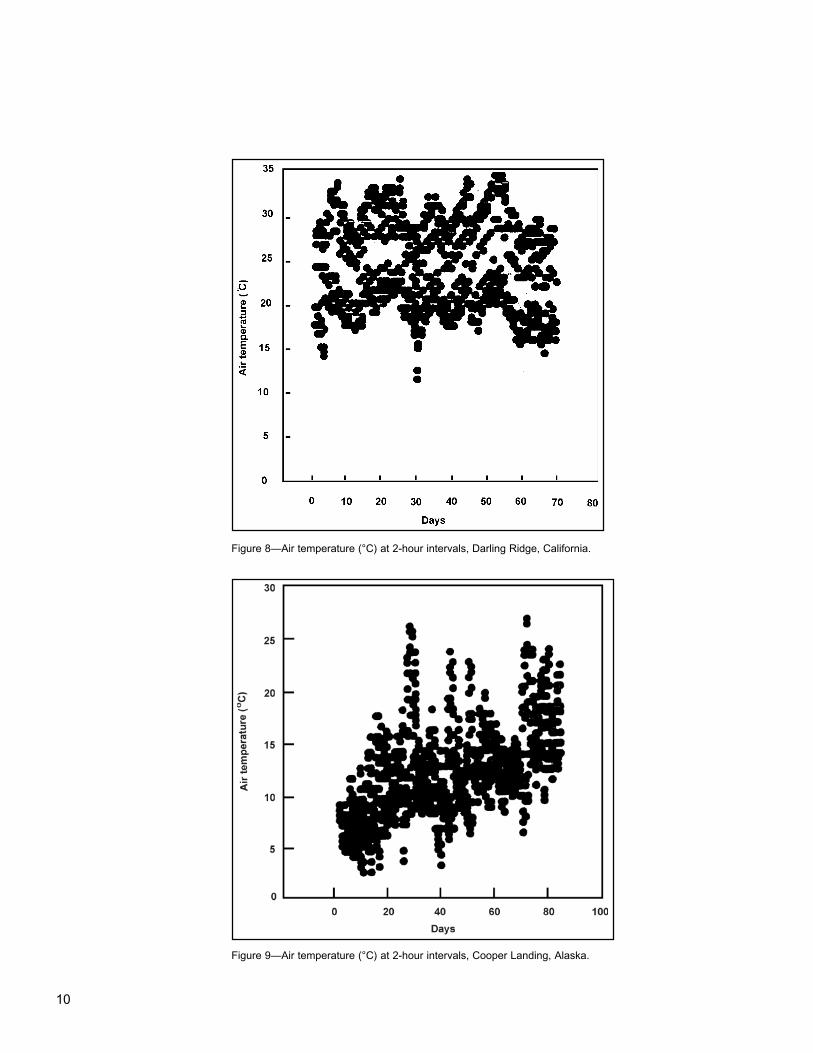
A more detailed analysis can be done by using the air temperature data collected every2 hours at each location. Darling Ridge and Cooper Landing sites had the largest dif-ferences in temperature (fig. 8, 9). For Darling Ridge (fig. 8), there was no discernibleseasonal trend. Temperatures remained between 15 and 35 °C during the samplingperiod (including day and night measurements). At the Cooper Landing site (fig. 9),there was an increase in temperature during the May, June, and July sampling periods.This probably explained the observed increase in release rates (fig. 5). For DarlingRidge, the high initial release rates (fig. 6) were likely the result of high temperatures;the decrease in release rates occured although the temperature remained high. Thisdecline probably occured because the chemical in the bubble cap was being depletedto a level where the vapor pressure inside the cap was diminished, thereby causing areduction in the vapor pressure deficit between that inside the cap and the atmosphereexternal to the membrane. The Silver Forks site had temperatures similar to the DarlingRidge site, and the same analysis applies. The Seward, Santiam Pass, and Enterprisesites were similar to the Cooper Landing site in their dynamics.
It is significant that the release rates of verbenone at the Darling Ridge and Silver Forkssites were constant over the sampling period, whereas the MCH bubble cap releaserates declined dramatically. Both releasers experienced the same temperature regime.The difference was that nearly twice as much chemical was initially placed in theverbenone releaser as in the MCH releaser. This suggests that the low release rates ofMCH near the end of the sampling period at the two California sites were caused byhigh temperatures, which in turn caused rapid initial release rates and depleted theMCH, subsequently causing lower release rates later in the season. Another possibilityis that there was a difference in volatility between the two compounds that could affectrelease rates.
The 17 °C MCH bubble caps at the Cooper Landing and Seward sites also exhibited adecline in release rates, while at the same time there was an increase in release rate ofthe 24 °C MCH bubble caps that were at the same site with the same temperature re-gime. The 17 °C release device has a thinner membrane than the 24 °C release de-vice. Again, this may have been the result of rapidly declining levels of MCH within thebubble cap, therefore reducing the release rate in the later stage of the study. This re-duction in release rate would not be expected to be linear over the course of the study,but the field sampling frequency may not have been sufficient to define the nonlinearity.
10
Figure 8—Air temperature (°C) at 2-hour intervals, Darling Ridge, California.
Figure 9—Air temperature (°C) at 2-hour intervals, Cooper Landing, Alaska.
11
There was no residual verbenone found in beads analyzed after 2 weeks in the fieldfrom either the Darling Ridge or Silver Forks sites. Either the active compound releasedcompletely from the bead during this period or degraded down to an inactive derivative.This is in contrast to the results obtained from an aerial application of verbenone beadsin northwestern Montana (Shea and others 1992). In this study, more than half theverbenone was available for release from the beads after 2 weeks.
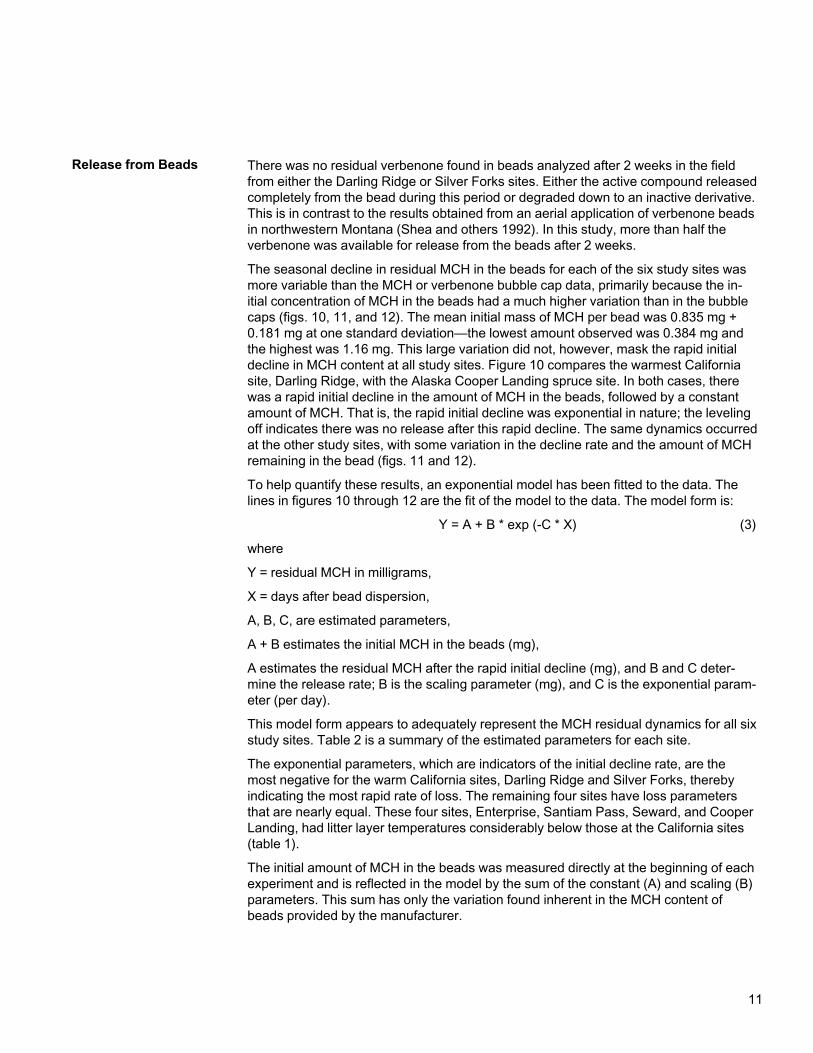
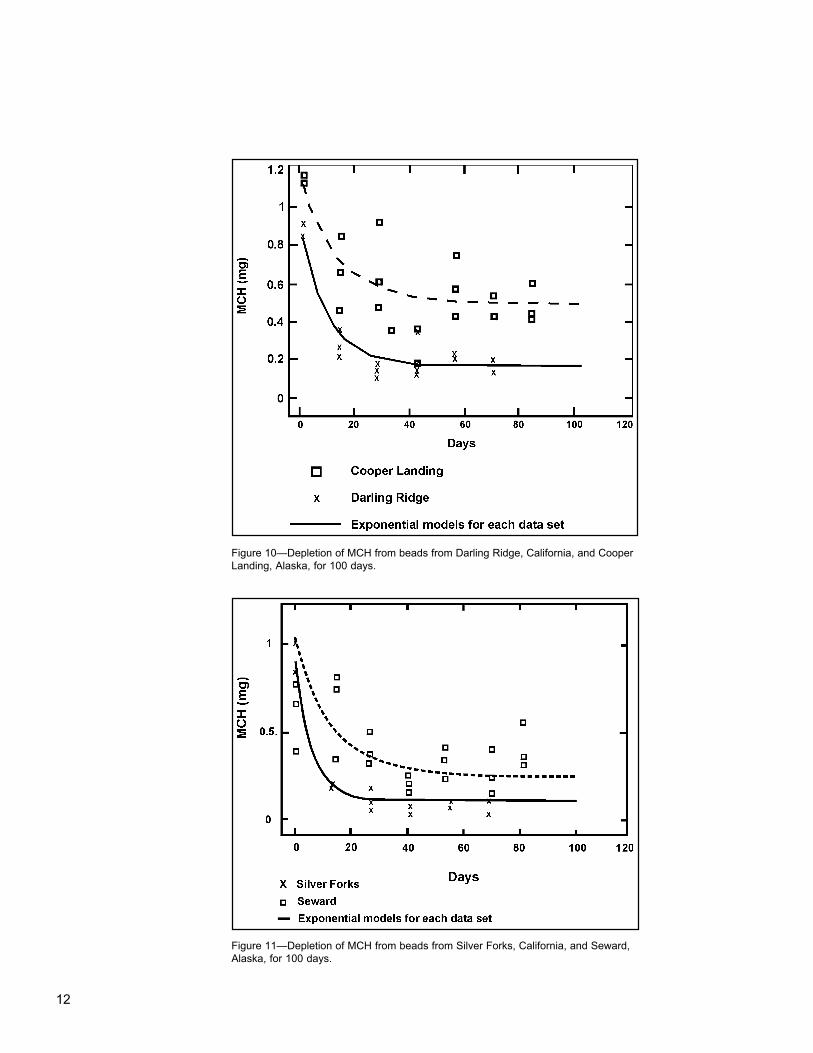
The seasonal decline in residual MCH in the beads for each of the six study sites wasmore variable than the MCH or verbenone bubble cap data, primarily because the in-itial concentration of MCH in the beads had a much higher variation than in the bubblecaps (figs. 10, 11, and 12). The mean initial mass of MCH per bead was 0.835 mg +0.181 mg at one standard deviation—the lowest amount observed was 0.384 mg andthe highest was 1.16 mg. This large variation did not, however, mask the rapid initialdecline in MCH content at all study sites. Figure 10 compares the warmest Californiasite, Darling Ridge, with the Alaska Cooper Landing spruce site. In both cases, therewas a rapid initial decline in the amount of MCH in the beads, followed by a constantamount of MCH. That is, the rapid initial decline was exponential in nature; the levelingoff indicates there was no release after this rapid decline. The same dynamics occurredat the other study sites, with some variation in the decline rate and the amount of MCHremaining in the bead (figs. 11 and 12).
To help quantify these results, an exponential model has been fitted to the data. Thelines in figures 10 through 12 are the fit of the model to the data. The model form is:
Y = A + B * exp (-C * X) (3)
where
Y = residual MCH in milligrams,
X = days after bead dispersion,
A, B, C, are estimated parameters,
A + B estimates the initial MCH in the beads (mg),
A estimates the residual MCH after the rapid initial decline (mg), and B and C deter-mine the release rate; B is the scaling parameter (mg), and C is the exponential param-eter (per day).
This model form appears to adequately represent the MCH residual dynamics for all sixstudy sites. Table 2 is a summary of the estimated parameters for each site.
The exponential parameters, which are indicators of the initial decline rate, are themost negative for the warm California sites, Darling Ridge and Silver Forks, therebyindicating the most rapid rate of loss. The remaining four sites have loss parametersthat are nearly equal. These four sites, Enterprise, Santiam Pass, Seward, and CooperLanding, had litter layer temperatures considerably below those at the California sites(table 1).
The initial amount of MCH in the beads was measured directly at the beginning of eachexperiment and is reflected in the model by the sum of the constant (A) and scaling (B)parameters. This sum has only the variation found inherent in the MCH content ofbeads provided by the manufacturer.
Release from Beads
12
Figure 10—Depletion of MCH from beads from Darling Ridge, California, and CooperLanding, Alaska, for 100 days.
Figure 11—Depletion of MCH from beads from Silver Forks, California, and Seward,Alaska, for 100 days.
13
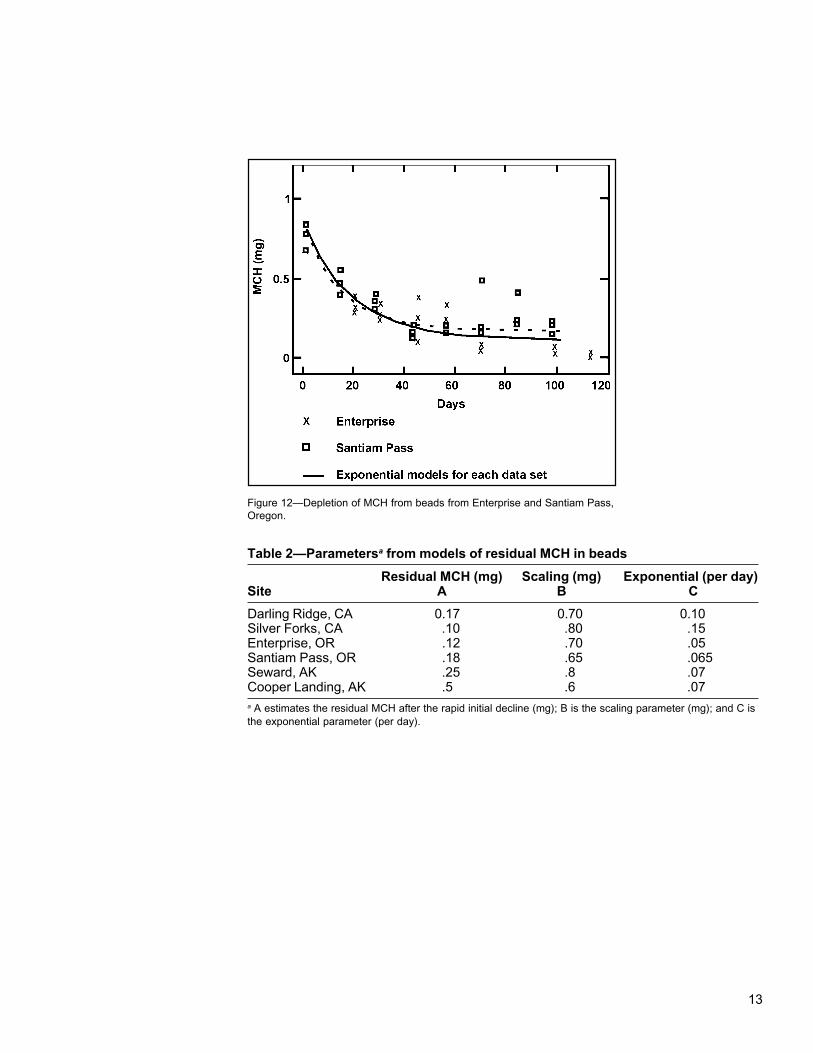
Figure 12—Depletion of MCH from beads from Enterprise and Santiam Pass,Oregon.
Table 2—Parametersa from models of residual MCH in beadsResidual MCH (mg) Scaling (mg) Exponential (per day)
Site A B CDarling Ridge, CA 0.17 0.70 0.10Silver Forks, CA .10 .80 .15Enterprise, OR .12 .70 .05Santiam Pass, OR .18 .65 .065Seward, AK .25 .8 .07Cooper Landing, AK .5 .6 .07a A estimates the residual MCH after the rapid initial decline (mg); B is the scaling parameter (mg); and C isthe exponential parameter (per day).
14
The constant parameter (A) estimates the residual MCH found in the beads after therapid initial decline; after this amount was reached, the data suggest there was no fur-ther release. The sites in California and Oregon had similar amounts, whereas theAlaska sites had higher amounts. The Cooper Landing spruce site showed high re-sidual, 0.5 mg, which is about 50 percent of the initial MCH in the beads, similar to pre-vious findings in Alaska (Holsten and Werner 1985). For some reason, the total amountof MCH in the beads was not releasing, and this amount seemed somewhat tempera-ture dependent—lower temperatures resulted in a higher amount of MCH not availablefor release. This conclusion should be considered preliminary because there is con-siderable variation in the data. With the bead and similar plastics, MCH is within asubstrate composed of a framework of interlocking polymer molecules that expand inhigher temperatures and contract at lower temperatures. The beads are loaded byheating them in the lab and then soaking or spraying them with MCH3. This would beconsistent with the high variation noted in the pheromone load of the beads and thehigher retention of residual MCH in colder environments. Thus the short-term releaseof a pheromone from beads followed by no release may be a function of the initialamount of pheromone on the bead surface and not from the polymer matrix.
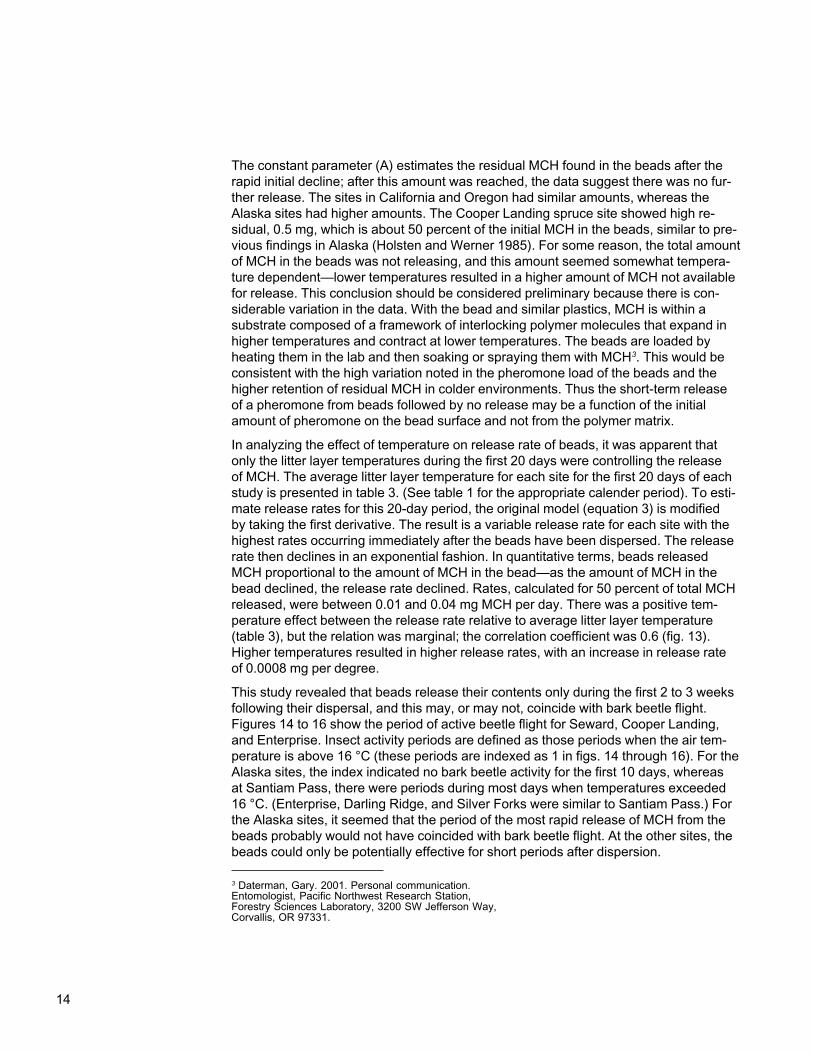
In analyzing the effect of temperature on release rate of beads, it was apparent thatonly the litter layer temperatures during the first 20 days were controlling the releaseof MCH. The average litter layer temperature for each site for the first 20 days of eachstudy is presented in table 3. (See table 1 for the appropriate calender period). To esti-mate release rates for this 20-day period, the original model (equation 3) is modifiedby taking the first derivative. The result is a variable release rate for each site with thehighest rates occurring immediately after the beads have been dispersed. The releaserate then declines in an exponential fashion. In quantitative terms, beads releasedMCH proportional to the amount of MCH in the bead—as the amount of MCH in thebead declined, the release rate declined. Rates, calculated for 50 percent of total MCHreleased, were between 0.01 and 0.04 mg MCH per day. There was a positive tem-perature effect between the release rate relative to average litter layer temperature(table 3), but the relation was marginal; the correlation coefficient was 0.6 (fig. 13).Higher temperatures resulted in higher release rates, with an increase in release rateof 0.0008 mg per degree.
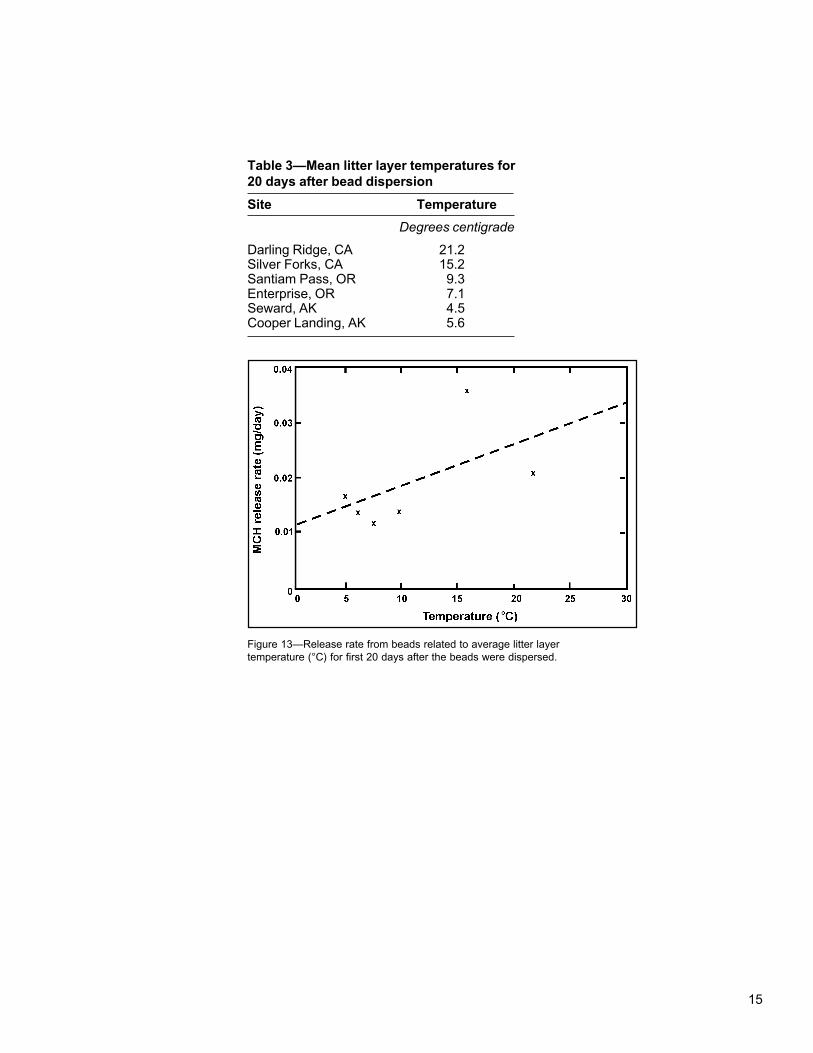
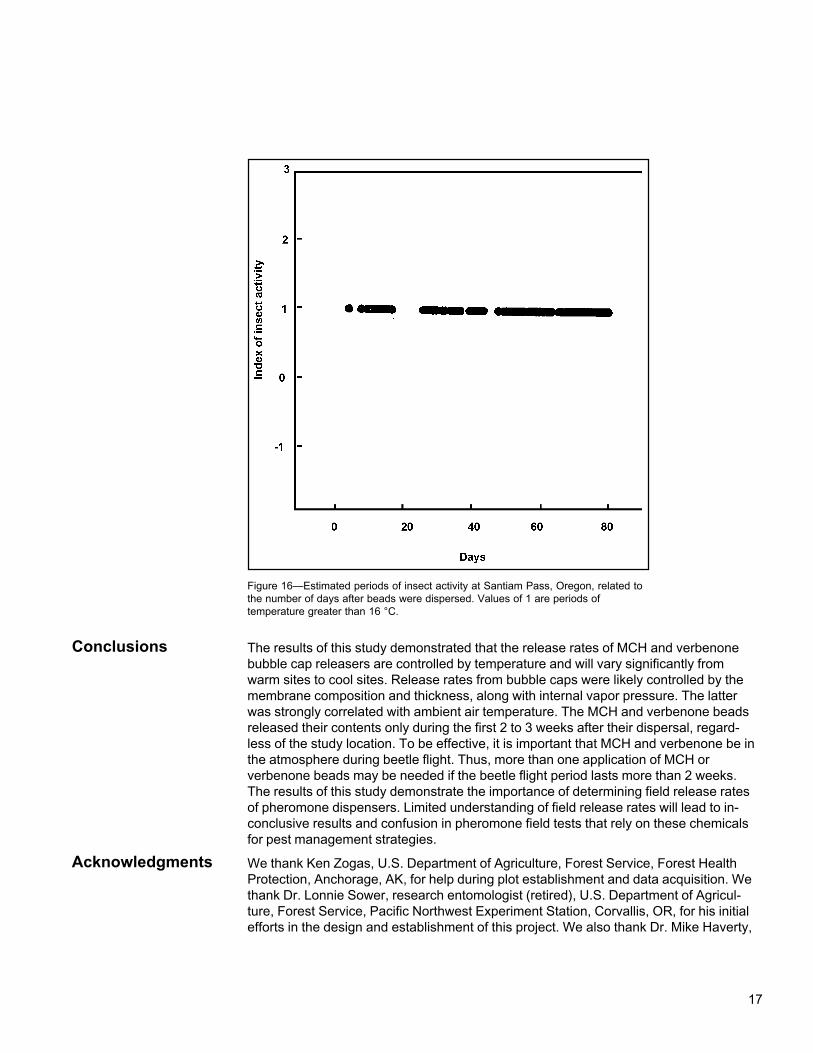
This study revealed that beads release their contents only during the first 2 to 3 weeksfollowing their dispersal, and this may, or may not, coincide with bark beetle flight.Figures 14 to 16 show the period of active beetle flight for Seward, Cooper Landing,and Enterprise. Insect activity periods are defined as those periods when the air tem-perature is above 16 °C (these periods are indexed as 1 in figs. 14 through 16). For theAlaska sites, the index indicated no bark beetle activity for the first 10 days, whereasat Santiam Pass, there were periods during most days when temperatures exceeded16 °C. (Enterprise, Darling Ridge, and Silver Forks were similar to Santiam Pass.) Forthe Alaska sites, it seemed that the period of the most rapid release of MCH from thebeads probably would not have coincided with bark beetle flight. At the other sites, thebeads could only be potentially effective for short periods after dispersion.
3 Daterman, Gary. 2001. Personal communication.Entomologist, Pacific Northwest Research Station,Forestry Sciences Laboratory, 3200 SW Jefferson Way,Corvallis, OR 97331.
15
Table 3—Mean litter layer temperatures for20 days after bead dispersionSite Temperature
Degrees centigrade
Darling Ridge, CA 21.2Silver Forks, CA 15.2Santiam Pass, OR 9.3Enterprise, OR 7.1Seward, AK 4.5Cooper Landing, AK 5.6
Figure 13—Release rate from beads related to average litter layertemperature (°C) for first 20 days after the beads were dispersed.
16
Figure 14—Estimated periods of insect activity at Seward, Alaska,related to the number of days after beads were distributed. Values of 1are periods of temperature greater than 16 °C.
Figure 15—Estimated periods of insect activity at Cooper Landing,Alaska, related to the number of days after beads were distributed.Values of 1 are periods of temperature greater than 16 °C.
17
The results of this study demonstrated that the release rates of MCH and verbenonebubble cap releasers are controlled by temperature and will vary significantly fromwarm sites to cool sites. Release rates from bubble caps were likely controlled by themembrane composition and thickness, along with internal vapor pressure. The latterwas strongly correlated with ambient air temperature. The MCH and verbenone beadsreleased their contents only during the first 2 to 3 weeks after their dispersal, regard-less of the study location. To be effective, it is important that MCH and verbenone be inthe atmosphere during beetle flight. Thus, more than one application of MCH orverbenone beads may be needed if the beetle flight period lasts more than 2 weeks.The results of this study demonstrate the importance of determining field release ratesof pheromone dispensers. Limited understanding of field release rates will lead to in-conclusive results and confusion in pheromone field tests that rely on these chemicalsfor pest management strategies.
We thank Ken Zogas, U.S. Department of Agriculture, Forest Service, Forest HealthProtection, Anchorage, AK, for help during plot establishment and data acquisition. Wethank Dr. Lonnie Sower, research entomologist (retired), U.S. Department of Agricul-ture, Forest Service, Pacific Northwest Experiment Station, Corvallis, OR, for his initialefforts in the design and establishment of this project. We also thank Dr. Mike Haverty,
Figure 16—Estimated periods of insect activity at Santiam Pass, Oregon, related tothe number of days after beads were dispersed. Values of 1 are periods oftemperature greater than 16 °C.
Conclusions
Acknowledgments
18
research entomologist, U.S. Department of Agriculture, Forest Service, Pacific South-west Research Station, Albany, CA; Iral Ragenovich, entomologist, U.S. Department ofAgriculture, Forest Service, State and Private Forestry, Portland, OR; and Dr. HaroldThistle, Forest Meteorologist, U.S. Department of Agriculture, Forest Service, ForestHealth Technology Enterprise Team, Morgantown, WV, for their helpful technical re-views.
When you know: Multiply by: To find:
Celsius (°C) 1.8 and add 32 Fahrenheit
Centimeters (cm) 2.54 Inches
Hectares (ha) 2.47 Acres
Kilometers (km) 0.621 Miles
Meters (m) 3.281 Feet
Square meters (m2) 1.20 Square yards
Millimeters (mm) 0.254 Inches
Amman, G.D. 1993. Potential of verbenone for reducing lodgepole and ponderosapine mortality caused by mountain pine beetle in high-value situations. In: Shea, P.J.tech. coord. Proceedings of the symposium on management of western bark beetleswith pheromones: research and development. Gen. Tech. Rep. PSW-GTR-150.Albany, CA: U.S. Department of Agriculture, Forest Service, Pacific SouthwestResearch Station: 33-37.
Borden, J.H. 1995. From identifying semiochemicals to developing a suppressiontactic: a historical review. In: Salom, S.M.; Hobson, K.R., eds. Proceedings of thenational Entomological Society meeting: application of semiochemicals for manage-ment of bark beetle infestations. INT-GTR-318. Ogden, UT: U.S. Department ofAgriculture, Forest Service, Intermountain Research Station: 3-10.
Holsten, E.H. 1994. The role of spruce beetle pheromones as management strategiesin Alaska. In: Shea, P.J., tech. coord. Proceedings of the symposium on manage-ment of western bark beetles with pheromones: research and development. Gen.Tech. Rep. PSW-GTR-150. Albany, CA: U.S. Department of Agriculture, ForestService, Pacific Southwest Research Station: 11-14.
Holsten, E.H., Werner, R.A. 1985. Evaluation of a controlled release formulation ofMethylcyclohexenone (MCH) in preventing spruce beetle attacks in Alaska. Tech.Rep. R10-9. Anchorage, AK: U.S. Department of Agriculture, Forest Service, ForestPest Management, Alaska Region. 9 p.
Holsten, E.H., Werner, R.A. 1987. Use of MCH bubble caps in preventing sprucebeetle attacks in Alaska. Tech. Rep. R10-14. Anchorage, AK: U.S. Departmentof Agriculture, Forest Service, Forest Pest Management, Alaska Region. 12 p.
Matthews, K.; Wittwer, D.; Zogas, K. [and others]. 1997. Forest insect and diseaseconditions in Alaska—1996. Gen. Tech. Rep. R10-TP-67. U.S. Department ofAgriculture, Forest Service, Alaska Region. 42 p.
English Equivalents
Literature Cited
19
Shea, P.J. 1995. Use of insect pheromones to manage forest insects. In: Biorationalpest control agents. [Publisher unknown]. American Chemical Society SymposiumSeries: 272-283. Chapter 20.
Shea, P.J.; McGregor, M.D.; Daterman, G.E. 1992. Aerial application of verbeneonereduces attack of lodgepole pine by mountain pine beetle. Canadian Journal ofForest Research. 22: 436-441.
Werner, R.A. 1994. Research on the use of semiochemicals to manage spruce beetlesin Alaska. In: Shea, P.J., tech. coord. Proceedings of the symposium onmanagement of western bark beetles with pheromones: research and development.Gen. Tech. Rep. PSW-GTR-150. Albany, CA: U.S. Department of Agriculture, ForestService, Pacific Southwest Research Station: 15-21.
Werner, R.A.; Holsten, E.H. 1995. Current status of research with the spruce beetle,Dendroctonus rufipennis. In: Salom, S.M.; Hobson, K.R., eds. Proceedings of thenational Entomological Society of America meeting: application of semiochemicalsfor management of bark beetle infestations. Gen. Tech. Rep. INT-GTR-318. Ogden,UT: U.S. Department of Agriculture, Forest Service, Intermountain Research Station:23-29.
Zogas, K. 2001. Summary of thirty years of field testing of MCH: antiaggregationpheromone of the spruce bark beetle and the Douglas-fir beetle. Tech. Rep.R10-TP-91. U.S.Department of Agriculture, Forest Service, Alaska Region. 27 p.
20
Figure 17—Two examples of data variation for MCH bubble cap release rates. Sites areDarling Ridge, California, and Santiam Pass, Oregon. Lines are model fit to the data.
Appendix
21
Figure 18—Comparison of MCH residue data in bubble caps and model fit for each of the six field sites.

This page has been left blank intentionally.Document continues on next page.
The Forest Service of the U.S. Department of Agriculture is dedicated to the principleof multiple use management of the Nation’s forest resources for sustained yields ofwood, water, forage, wildlife, and recreation. Through forestry research, cooperationwith the States and private forest owners, and management of the National Forests andNational Grasslands, it strives—as directed by Congress—to provide increasinglygreater service to a growing Nation.
The U.S. Department of Agriculture (USDA) prohibits discrimination in all its programsand activities on the basis of race, color, national origin, gender, religion, age, disability,political beliefs, sexual orientation, or marital or family status. (Not all prohibited basesapply to all programs.) Persons with disabilities who require alternative means forcommunication of program information (Braille, large print, audiotape, etc.) shouldcontact USDA’s TARGET Center at (202) 720-2600 (voice and TDD).
To file a complaint of discrimination, write USDA, Director, Office of Civil Rights, Room326-W, Whitten Building, 14th and Independence Avenue, SW, Washington, DC20250-9410 or call (202) 720-5964 (voice and TDD). USDA is an equal opportunityprovider and employer.
Pacific Northwest Research Station
Web site http://www.fs.fed.us/pnwTelephone (503) 808-2592Publication requests (503) 808-2138FAX (503) 808-2130E-mail [email protected] address Publications Distribution
Pacific Northwest Research StationP.O. Box 3890Portland, OR 97208-3890
U.S. Department of AgriculturePacific Northwest Research Station333 S.W. First AvenueP.O. Box 3890Portland, OR 97208-3890
Official BusinessPenalty for Private Use, $300