Embed Size (px)
Citation preview
(12) United States PatentHolland et al.
(54) LEAK DETECTION USINGSTRUCTURE-BORNE NOISE
(75) Inventors: Stephen D. Holland, Ames, IA (US);Dale E. Chimenti, Ames, IA (US);Ronald A. Roberts, Ames, IA (US)
(73) Assignee: Iowa State University ResearchFoundation, Inc., Ames, IA (US)
(*) Notice: Subject to any disclaimer, the term of thispatent is extended or adjusted under 35U.S.C. 154(b) by 621 days.
(21) Appl. No.: 11/413,523
(22) Filed: Apr. 28, 2006
Related U.S. Application Data
(60) Provisional application No. 60/676,428, filed on Apr.29, 2005.
(51) Int. Cl.G01M 3104 (2006.01)
(52) U.S. Cl . ..................... 73/40.5 R; 73/45.5 A; 73/49;73/52
(58) Field of Classification Search .................. 73/49.3,73/52,40.5
See application file for complete search history.
(56) References Cited
U.S. PATENT DOCUMENTS
5,341,670 A * 8/1994 Brook et al . ............. 73/40.5 A6,138,512 A * 10/2000 Roberts et al . ................ 73/5706,701,776 B2 * 3/2004 Stetter ........................ 73/49.26,804,992 B2 * 10/2004 Goodman et al. ........ 73/40.5 A6,886,389 BI * 5/2005 Hagar ......................... 73/40.7
(lo) Patent No.: US 7,739,899 B1(45) Date of Patent: Jun. 22, 2010
6,995,038 B2 * 2/2006 Egawa et al ................. 438/106
OTHER PUBLICATIONS
Foster, J.L., "A debris avoidance feasibility study for robotic satel-lites", The Orbital Debris Quarterly News, 8(3), 2-3, 2004.Stansbery, E., et al., "Haystack orbital debris Radar measurementsupdates", The Orbit Debris Quarterly News, 9(1), 3-5, 2005i.Crisco, P.H., "Historical small debris collision activities", TheOrbital Debris Quarterly News, 8(4), 6-7, 2004.Lion, J.C., "Collision activities in the future orbital debris environ-ment", The Orbital Debris Quarterly News, 8(4), 8, 2004.Bernhard, R.P., et al., "Orbital debris as detected on exposed space-craft", The Orbital Debris Quarterly News, 2(4), 3-4, 1997.Schonberg, W.P., "Protecting spacecraft against meteoroid/orbitaldebris impact damage: An overview", Space Debris, 1, 195-210,2000.Anz-Meador, P., "ISS Space Shuttles examined for debris impacts",The Orbital Debris Quarterly News, 6(2), 3, 2001.Oberg, J., "Crews find `Culbrit' in space station leak www.msnbc.msn.com,", Jan. 11, 2003, (Date retrieved: Mar. 11, 2005).
(Continued)
Primary Examiner J M Saint Surin(74) Attorney, Agent, or Firm McKee, Voorhees & Sease,P.L.C.
(57) ABSTRACT
A method for detection and location of air leaks in a pressurevessel, such as a spacecraft, includes sensing structure-borneultrasound waveforms associated with turbulence caused by aleak from a plurality of sensors and cross correlating thewaveforms to determine existence and location of the leak.Different configurations of sensors and corresponding meth-ods can be used. An apparatus for performing the methods isalso provided.
14 Claims, 9 Drawing Sheets
https://ntrs.nasa.gov/search.jsp?R=20100028088 2018-06-01T20:01:47+00:00Z

US 7,739,899 B1Page 2
OTHER PUBLICATIONS
Holland, S., et al., "Two-sensor ultrasonic spacecraft leak detectionusing structure-borne noise", Acoustic Research Letters Online(ARLO), 6(2),63-68, 2005.National Aeronautics and Space Administration, International spacestation complex operations emergency procedures: all expeditionflights, Mission Operations Directorate Operations Division, Aug.16, 2000.Kim, J.W., et al., "ISS leak localization using attitude response,"AIAA Guidance, Navigation, and Control Conference, Montreal,CA, Aug. 2001, AIAA paper #01-4272.Zak, A., Cosmonauts' flight plan: find the leak on MIR, www.space.com, Mar. 31, 2000, (Date retrieved: Mar. 23, 2005).Semkin, N.D., et al., "A device for detecting the location of a gas leakin a spacecraft module," Instru. Exper. Techn. 46(5), 711-716, 2003.Studor, G., "Ultrasonic Detectors in Space, www.ctrlsys.com", May22, 2002, (Date retrieved: Mar. 23, 2005).
Corsaro, R., et al., "PINDROP An acoustic particle impact detec-tor," The Orbital Debris Quarterly News, 8(3), 3-4, 2004.
Kim, J.W., "International space station leak localization using venttorque estimation", 55th International Astronautical Conference,Vancouver, BC, IAC-04-A.4.10, Oct. 2004.
Anon, "Stopping leaks in space", Machine Design, 75, 32, 2003.
Ziola, S.M., et al., "Source location in thin plates using cross-corre-lation", J. Aeon. Soc. Am., 90, 2551-2556, 1991.Rewerts, L.E., et al., "Dispersion compensation in acoustic emissionpipeline leak location", in Review of Progress in QNDE, 16A, 427-434, 1997.Rewerts, L.E., et al., "The role of propagation characteristics inacoustic emission pipeline leak location", in Review of Progress inQNDE, 17A, 501-508,1998.
* cited by examiner
Br,
BOr AOr
U.S. Patent ,Tun. 22, 2010 Sheet 1 of 9 US 7,739,899 B1
(Single frequency,single mode) Ac:jyr-;
. Aejwt —jkd,
Random d, dz
Phase 'A(7 ^t leak
Correlation: A*Ae'k(d^)ejwtreal difference of
distances
FIG.1
50 LEAK
54 "::::::.... ..SENSOR SITE B
SENSOR SITE A
FIG. 2
leak
52
r-„
xAoSENSOR SITE A
FIG. 3
U.S. Patent ,Tun. 22, 2010 Sheet 2 of 9 US 7,739,899 B1
52
x
FIG. 4
U.S. Patent Jun. 22, 2010 Sheet 3 of 9 US 7,739,899 B1
U.S. Patent Jun. 22,2010 Sheet 4 of 9 US 7,739,899 BI
ll.^
r A
naR
IVZL
U.S. Patent ,Tun. 22, 2010 Sheet 5 of 9 US 7,739,899 B1
100 PZT disk 116
.................................................................... ..................................................
8x8 array elements 1 02U
9940
y 904a^
32 channel MUX
.4Preamp
....................................................................
Computer1 1 8
FIG. 6
2 mm
146 0 0 0 8 I
9 •00••40••.6.1......
NI
17 0 0 • 0. 0 0 0_24._.._...
25 000 0 ®290 0 032
33••••40•••40 102
41.0 000 0 0 048
49 0000 000.56
5700000.0060
32 channel MUX 106
908Preamp 1 10
F
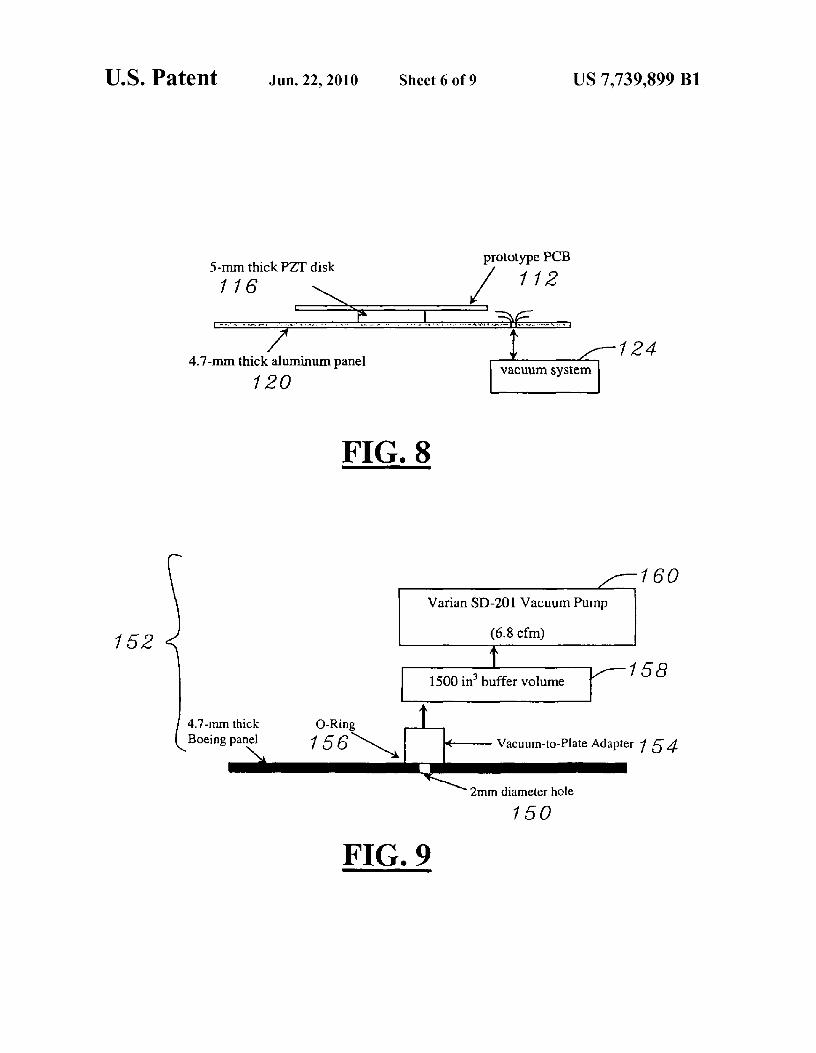
5-mm thick PZT disk
116prototype PCB
/ 112
U.S. Patent Jun. 22, 2010 Sheet 6 of 9
US 7,739,899 B1
4.7-mm thick aluminum panel
120124
vacuum system
FIG. 8
160Varian SD-201 Vacuum Pump
952 (6.8 cfm)
1500 in buffer volume158
4.7-mm thick O-RingBoeing panel 15 6 Vacuum-to-Plate Adapter 154
2mm diameter hole
150
FIG. 9
U.S. Patent ,Tun. 22, 2010 Sheet 7 of 9 US 7,739,899 B1
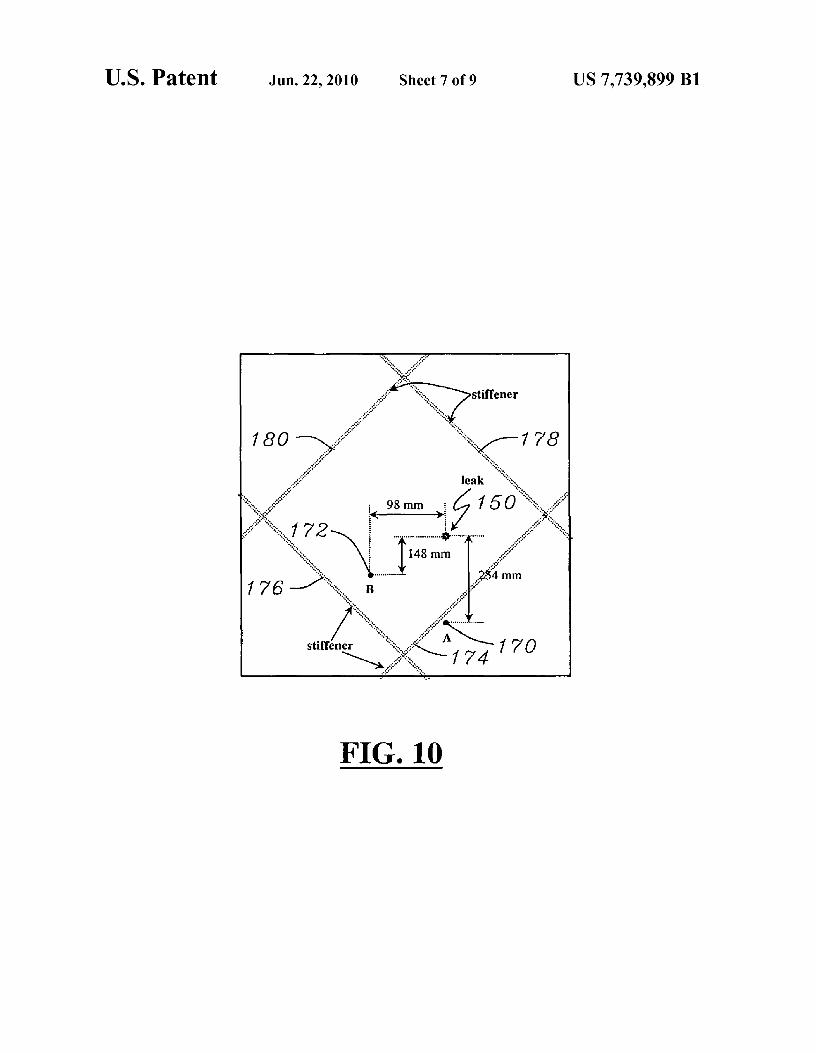
stiffener
180 —:: <::: 178leak
98 mm 15 0 __e
:. 172 148 mm
234 mm
176 -^ :::.. B
stiffener A
174
FIG. 10
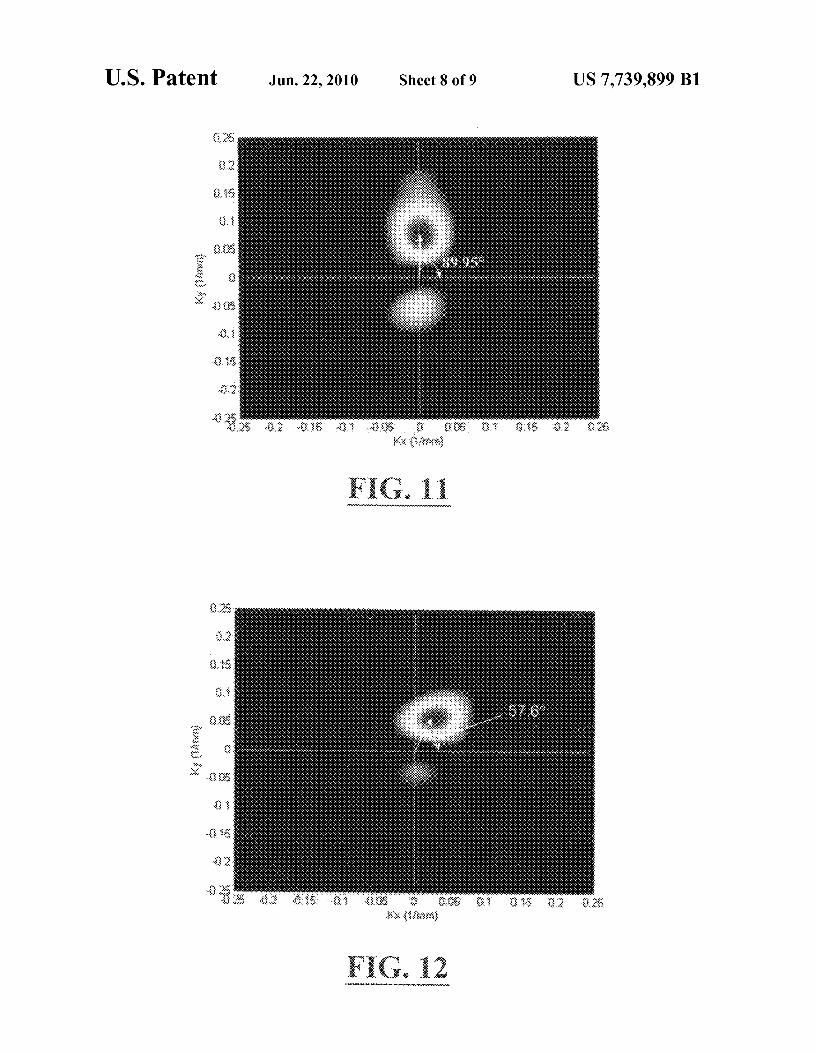
FIG. 1 -1.
U.S. Patent Jun.22,2010 Sheet 8 of 9 US 7,739,899 BI
FIG. 12
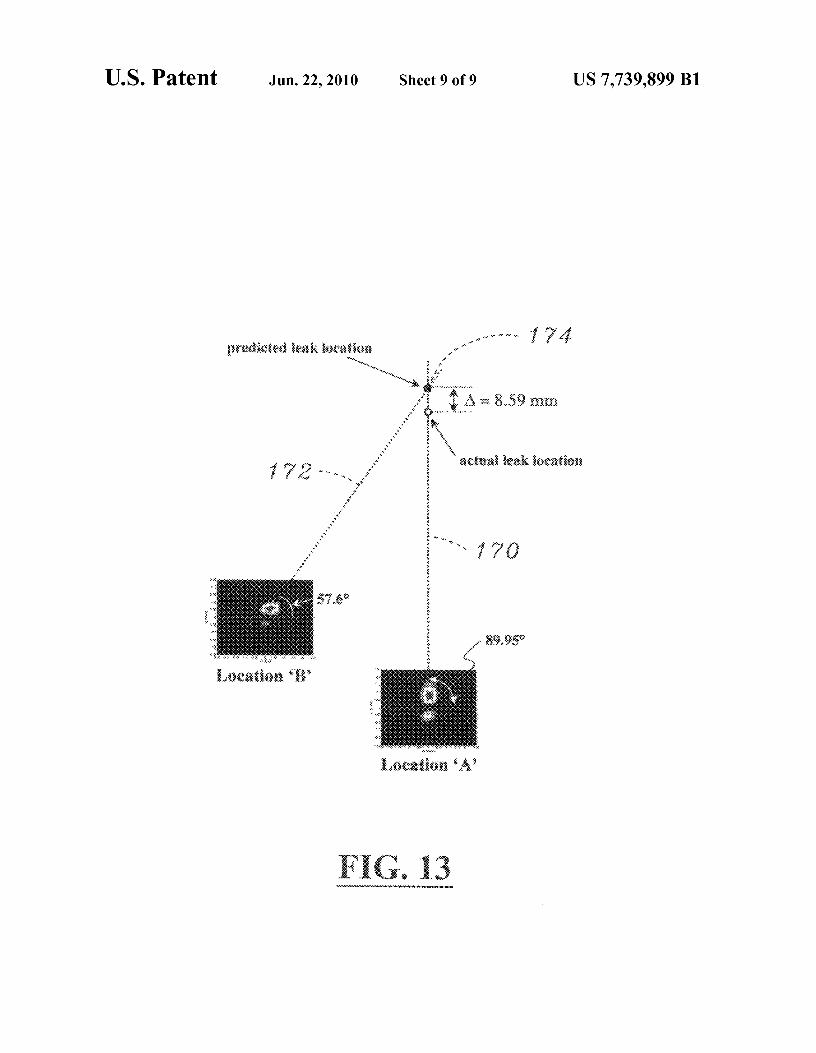
prediOwl Wak 1CWation174
= 8-59 mm
nal Wok Im-ation
f 70
1 89,95WO
U.S. Patent Jun. 22,2010
Sheet 9 of 9 US 7,739,899 BI
-Location 'A'
F I %"'G 0 13
US 7,739,899 B11
LEAK DETECTION USINGSTRUCTURE-BORNE NOISE
RELATED APPLICATIONS
This application claims priority to U.S. Provisional PatentApplication No. 60/676,428, filed Apr. 29, 2005, herebyincorporated by reference in its entirety.
GRANT REFERENCE
The work presented in this application was supported inpart by a federal grant from the NASA, Grant No. NAG-1-02098, the government may have certain rights in this inven-tion.
BACKGROUND OF THE INVENTION
The present invention relates to leak detection and deter-mining leak location. To assist in understanding the presentinvention, problems related to detecting and locating air leaksin spacecraft are described. It should be understood, however,that the present invention can be used for detection of leaksand location of leaks in any number of other types of vessels,particularly pressure vessels, and is in no way limited tospacecraft.
It has been well known for a long time that orbital objects,such as meteoroids and space debris, are among the serious,but inevitable, threats to spacecraft intended for prolongedhabitation. Technically, collisions with objects larger than10-cm can be avoided using databases compiled by debris-tracking systems, such as the Haystack orbital debris radarsand optical telescopes [1,2]. The strikes of small objectsbetween 0.10 and 10.0 mm cannot, however, be avoided usingthe current devices. Furthermore, because the objects strikethe spacecraft at high speeds, up to 10 to 15 km/s [3], evensmall particles in the size range of 1 mm could result inpenetration of the pressure vessel and subsequent loss of air.
Referring to several reports [4-7], the major sources of thesmall particles are fragments of payloads, paint flakes, solidrocket motor slag and discharge, exploded rocket bodies, andextraterrestrial micrometeorites. Clearly, there will a higherprobability of collisions with smaller objects if space explo-ration includes trips with longer operational times.
An example of a current long-endurance spacecraft is theInternational Space Station (ISS), now orbiting in low Earthorbit (LEO) with an altitude between 360 km and 440 km withan inclination of 51.6 degrees. It is designed to provide anEarth orbiting facility in order to develop advanced technol-ogy for human and robotic exploration of space. Ever sincethe ISS has launched in 1998, there have been many compo-nent replacements, which are mainly caused by the impact ofhigh-speed micrometeorites and space resident debris [8]. Inparticular, the impacts of small objects cause air leaks whenthey strike a pressurized module on the ISS. As reported byNASA in January 2004 [9], parts of the ISS were nearlyclosed off for three weeks due to the air leaks. Although thesize of the air leak was too small to endanger the crew andmission immediately, it was a time-consuming process to findand seal the leaks.
Accordingly, immediate location of the source of the leakson the ISS is essential to provide the crew with maximumsafety, minimize unnecessary mission effort, and maintainthe operational status. By doing so, the crew can performincreasingly ambitious mission goals for longer periods withless ground supports. However, regardless of size of the airleaks, the detection and location of air leaks is a very difficult
2and time-consuming process because the size of an ISS mod-ule and the complexity of its construction. The crew cannotinspect the entire series of modules immediately. In addition,the ultrasound noise generated by escaping air at supersonic
5 speed from small holes into the vacuum of space is notaudible or detectable inside the ISS because of the nature ofthe leaks. Leaks on spacecraft occur from one atmosphereinto vacuum and produce almost none of the characteristicdetectable high-frequency sound, such as that typically
io exploited by industrial leak detection apparatus.Conventionally, the crew on the ISS follows the sequential
module leak isolation process [10]. The process involves veryinefficient and time-consuming tasks, where the crew moni-tors the pressure difference while sequentially closing each
15 hatch. Because it is not easy to discern very small pressuredifferences, the isolation process still does not reduce the leakdetection time and risk of the crew's safety. Compared to theISS, the MIR, a Russian space station, employs airflow induc-tion sensors installed in the hatchways to continually monitor
20 airflow and its rate of change [1 I ]. Since the airflow inductionsensors are designed to detect the very small changes in theairflow, they are also sensitive to the circulating air in amodule. So, the crew must stop all the venting systems in asuspicious module to find air-leaks, and this action could
25 cause more serious problems. In addition, pinpointing a leaklocation is not possible because the sensors are designed onlyto localize leaking to a specific module losing a measurableamount of air, and not to find its exact location within themodule.
30 With the demands of more efficient leak detection systemson the ISS, active research has been performed to develop airleak detection systems. In 2000, Russian engineers have puttheir best efforts into an acoustic monitor called "OT 2-K" todetect air leaks on the MIR [12]. This sensor directs possible
35 leak locations by measuring the noise level generated byescaping air. In the lab test, the sensor can detect the airbornenoise in air escaping from a surgical needle at a distance ofapproximately 5 m. However, due to the nature of its workingprinciple, it is not an efficient detector or locator of leaks
40 inside a module. Instead, the crew must use the sensor outsideof the module, an extremely time-consuming and often dan-gerous activity. Semkin et. al [13] have proposed a multipa-rameter transducer, which consists of one ionization sensor,four piezoelectric microphones, two thermocouple sensors,
45 and a data processing unit in a single package. The dimen-sions of the transducer are 80x I00x80 mm, and its weight isless than 0.35 kg. Analyzing the measurements obtained byeach sensor, the transducer is capable of detecting gas leakson the MIR from the holes with 0.1-5 mm in diameter at a
5o distance of 1.5 m from the transducer. However, the detect-able zone is very small and restricted so that it is not a fullyfunctional sensor to locate air leaks on a large-scale spacestation.
Recently, a company, called CTRL Systems, Inc., has55 developed and tested an ultrasonic leak detector (UL 1018)
to locate air leaks on the ISS [14] . The detector is a hand-held,non-destructive diagnostic tool, which detects ultrasound in anarrow frequency band around 40 kHz. The outputs are sup-plied to a headset as well as to an analog meter. This method,
6o however, is based on the same principle as most of the otherindustrial leak detectors, and is also not efficient for locatingair leaks on the ISS because it was originally designed todetect leaks from pressurized vessels, where air is escapinginto an atmospheric environment of 1 bar from a pressurized
65 vessel at a pressure of atleast 1 bar gage, or 2 bar absolute. Onthe contrary, the air leaks on the ISS are leaks into vacuum,where the direction of the escaping airflow is into the vacuum
US 7,739,899 B13
4of space. Corsaro et al. [15] have proposed a prototype system
location method using a very thin aluminum plate, in which
of an acoustic particle impact detector, called "Particle the method utilizes the classical plate theory and cross-cor-Impact Noise-Detection and Ranging On Autonomous Plat- relation technique. Given a priori knowledge of the waveform (PINDROP)". The PINDROP is designed to detect speed in a certain frequency range, the method can properlyhypervelocity impacts by small particles and locate the 5 locate the leaks in the thin plate. Their study is limited to veryimpact sites using the propagation characteristics of the thin plates whose thickness is less than 2.5 mm.acoustic wave generated on a panel. The detector consists of
Although a simple cross correlation method is marginally
a conventional aerogel particle-capture array to collect and
capable of locating the leaks, it provides unambiguous indi-characterize the small particles in space, acoustic sensor to cations of a leak only if it satisfies the simplified assumptionlocate their impact sites and autonomous data acquisition unit io of a single mode of propagation with a non-dispersive (orto process the collected data. As a active material in an acous- frequency-independent) wave speed. In fact, the structure-tic sensor, poly-vanylidene fluoride (PVDF) is selected, bone noise in a plate-like structure, such as the outer skin ofowing to its unique advantages over other piezoelectric mate- spacecraft, is evidently carried by multiple dispersive modesrials, such as high sensitivity in response to sudden changes in of plate wave propagation. In a dispersive medium, the struc-strain, very low mass, and flexible installation. To predict 15 ture-borne noise propagates with a different velocity at everyaccurately the signal arrival time, an acoustic propagation
frequency so that the cross correlation technique is not suit-
model is developed and embedded in the data acquisition unit. able to adequately provide an exact location of the leakThis model is used to locate the impact sites using the relative source. The method provides much poorer results as thetime-of-arrival at three or more sensor locations. Although
received signals become more dispersive. Examples of
this detector is not designed to find the exact location of air 20 ambiguous indications in dispersive media are shown in Ref-leaks on the ISS, it provides the crew with valuable informa- erences 20-23. In addition, the temporal shape of the propa-tion when they are tracking down suspicious leak locations. gating structure-borne noise does not remain in constant.
Kim et. al [11, 16] have developed a leak localization
Furthermore, the effect of the dispersion becomes more seri-software for the ISS. The software uses the measurements ous as the distance between the sensors at remote locationsfrom pressure gages, spacecraft attitude and rate sensors. 25 and the leak source increases. As a result, the cross correlationWhen air leaks occur, the vent thrust generates a small torque technique is not a viable option to locate leaks in dispersiveon the space station. To preserve the spacecraft's attitude, a media or structures.reaction torque is needed to stabilize the ISS, depending on
In orderto compensate the dispersion-related drawbacks of
the size and location of the leak. The software infers from the the cross correlation technique in source location, Rewerts etdynamics of the ISS stabilization, considering the geometri- 3o al. [20-21] have demonstrated a dispersion compensationcal structure of the ISS, a probable leak location and the method in a 1-dimensional structure for water-filled pipe-estimated hole size. According to the developers, their soft- lines. This method isolates particular modes from the dis-ware can locate holes with a diameter as small as 0.4 inches persed measurements as well as utilizing the advantages of(»1 cm). With its outstanding functionalities, NASA is plan- the cross correlation technique. Steri et al. [22-23] havening to employ the software system on ISS in the near future 35 extended the work of Rewert, et al. and showed a robust[17]. In order to detect and predict the location of air leaks mode-compensating leak location method in a highly disper-accurately, however, exact knowledge of the ISS geometric sive structure, with a leak and sensors arranged in a collinearstructure is required. If the spacecraft geometry changes, such
fashion. This method isolates the contributing modes of
as through the addition of more modules or docking with
propagation and determines the compensation for the fre-other spacecraft, the software must be entirely reconfigured to 4o quency dependence of the contributing mode wave speed. Toaccount for those variations in the spacecraft moment of
adequately isolate the particular modes, it performs temporal
inertia and mass. and spatial Fourier transforms on the received signals. TheseIn addition to developing the complex leak detection sys- works also emphasize that the signals need not be collected
tems, it is desired to utilize the structure-borne noise so that simultaneously for the cross correlations among several pairsthe location of a leak is detected by remotely positioned 45 of sensors, owing to the stationary property of the powersensors. One of the simple and widely used approaches is to spectrum of the cross-correlated signals.use cross correlation. The technique assumes in the analysis
Despite these works, significant problems remain in leak
thatreceived signals by sensors atremote locations satisfy the
detection. What is needed is a sensitive and reliable means toconditions of a single mode of propagation with a non-dis- locate an air leak in pressurized, habitable and long-endur-persive (or frequency-independent) wave speed. Under the 5o ance spacecraft. Such a method should be able to locate airassumptions, the received signals are simply non-dispersed
leaks accurately with the requisite speed.
time-delayed replica of the signal generated at the leak. Thetime delay corresponds to the distance between the sensors
SUMMARY OF THE INVENTIONand the leak source. They are, however, time-shifted withdifferent amplitude because of differences in propagation 55 Therefore, it is a primary object, feature, or advantage ofpaths of the signals. The location of peak on a time scale in the
the present invention to improve over the state of the art.cross correlation function corresponds to the time delay, and, It is a further object, feature, or advantage of the presentthrough the speed of sound in the structure, the location of the
invention to provide for rapid detection of air leaks in aleak. spacecraft skin, such as those caused by impact with space
In 1969, White [18] first used a cross-correlation technique 60 debris or meteorites.to determine a leak location on a thin plate, assuming that the
Another object, feature, or advantage of the present inven-structure-borne noise is propagating in all directions with the tion is the detection of air leaks in a spacecraft skin by usingsame propagation speed. The temporal shape of the measure- ultrasonic waves in the spacecraft skin and not just airbornements is also assumed to be unchanging with distance. How- noise.ever, the results of the cross correlation do not clearly show a 65 Yet another object, feature, or advantage of the presentlarge peak. Instead, it shows a gradual rise and fall of sinu- invention is to provide a continuous system for leak detectionsoidal function. Ziola et. al. [19] demonstrates a simple leak
and the determination of leak location.
US 7,739,899 B15
A further object, feature, or advantage of the present inven-tion is to provide for a method and system for detection of airleaks that is capable of accommodating multiple dispersivemodes of plate wave propagation.
A further object, feature, or advantage of the present inven- 5
tion is to provide a framework for leak detection of a pressurevessel flexible enoughto allow a number of different of sensorconfigurations and corresponding specific methodologies tobe used.
A still further object, feature, of the invention is to provide ioa method for leak detection and location suitable for use withany number of types of pressure vessels.
One or more of these and/or other objects, features, oradvantages of the present invention will be apparent from thespecification and claims that follow. 15
In one embodiment, a coupled phased-array method isused. This method provides an all-encompassing data set torepresent what could be measured if time and complexitywere irrelevant. Such a method is impractical due the numberof sensors and complexity of calculations required. However, 20
use of this method is helpful in fully understanding the prob-lems and issued involved.
In another embodiment, a two-dimensional phased arraymethod is provided. This methodology reduces the quantityof data required in the coupled array measurement to a pair of 25
independent, two-dimensional array measurements. For eacharray measurement, one sensor is fixed and the other isscanned across an array. This reduces the number of correla-tions relative to the coupled phase-array method.
In another embodiment, a distributed sensor is used. In this 30
method, leaks are located using only correlations betweensignals from a few isolated point sensors. This method com-pares the measured correlations from a few arbitrarily distrib-uted sensors with synthetic correlations calculated from allpossible leak locations and identifies the closest match as the 35
location of the leak.In another embodiment, a dual-sensor method is used. In
this method, leak detection is performed by measuring leak-into-vacuum cross-correlations of noise signals from twoadjacent transducers as the transducer pair is rotated to deter- 40
mine the relative phase delay as a function of rotation angle.The direction to the leak is found from the variation of phasewith angle of from synthetic aperture analysis. The leak isthen located through triangulation from two or more sensor-pair locations. 45
According to one aspect of the invention, a method fordetection of air leaks in a pressure vessel is provided. Themethod includes sensing structure-borne ultrasound wave-forms from a plurality of sensors and determining when crosscorrelation between the waveforms indicates presence of a 50
leak. The ultrasound waveforms are associated with turbu-lence caused by the leak. The method also provides for locat-ing the leak using the cross correlation between the wave-forms. The ultra sound waveforms may be in a range of about300 kHz to 600 kHz. The present invention provides numer- 55
ous configurations of sensors to be used along with corre-sponding methodologies as may be appropriate for differentenvironments or applications of the invention. For example,the sensors may be configured as a two-dimensional phasedarray, distributed on an inner surface of the pressure vessel, or 60
may include two rotatable sensors.According to another aspect of the invention, a system for
detection of leaks in a pressure vessel is provided. The systemincludes a plurality of acoustic sensors adapted for sensingstructure-borne ultrasound waveforms associated with turbu- 65
lence caused by a leak in the pressure vessel and an intelligentcontrol, such as a computer or other computing device, opera-
6tively connected to the plurality of acoustic sensors. Thesensors may be of different types, configured in differentmanners and corresponding methodologies are then used forleak detection and leak location. The pressure vessel may bea spacecraft.
According to another aspect of the present invention, amethod for location of an air leak in a pressure vessel includesreceiving a leak noise signal associated with the air leak in thepressure vessel at a plurality of sensor locations to provide aplurality of leak noise waveforms, cross correlating the leaknoise waveforms, and determining location of the leak basedon results of the step of cross correlating the leak noise wave-forms. The results from the cross correlation are a function ofthe leak noise waveform as well as sensor parameters associ-ated with the sensors. The sensor parameters can include thesensor locations, geometry, etc. A Fourier analysis may beapplied to the results of the cross correlation to determinedirection to the leak from the sensors. The location of the airleak may then be triangulated based on the direction to theleak from each sensor.
BRIEF DESCRIPTION OF THE DRAWINGS
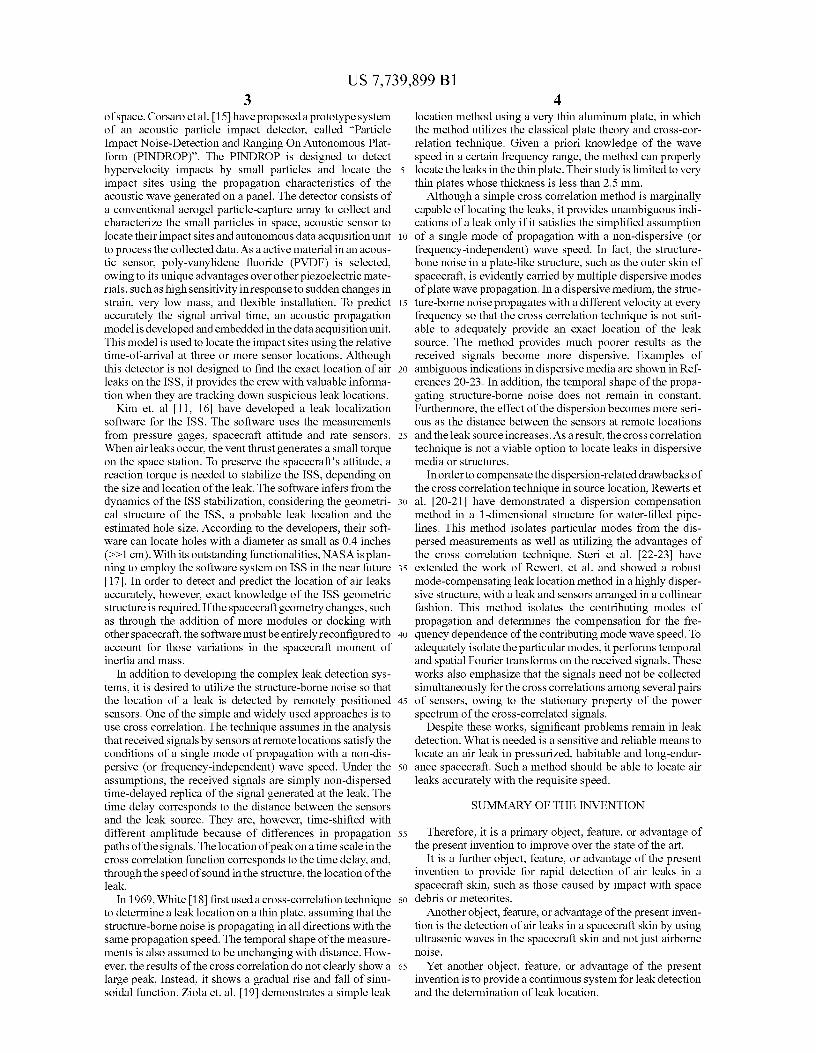
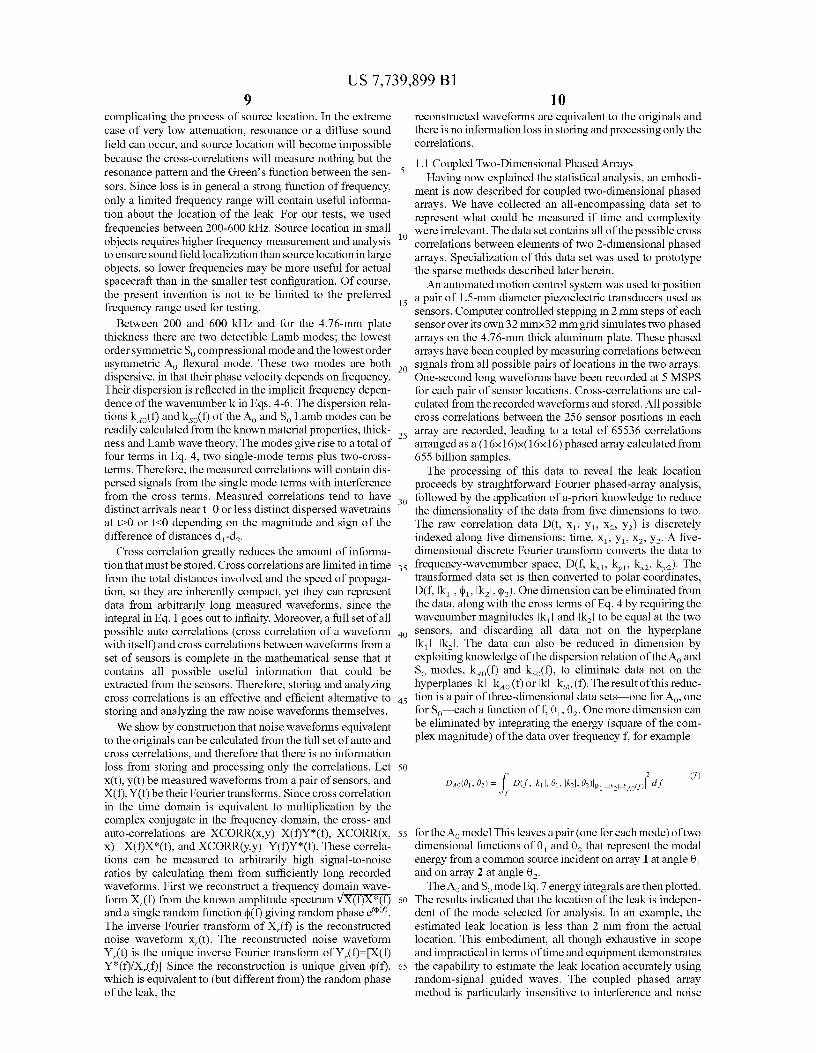
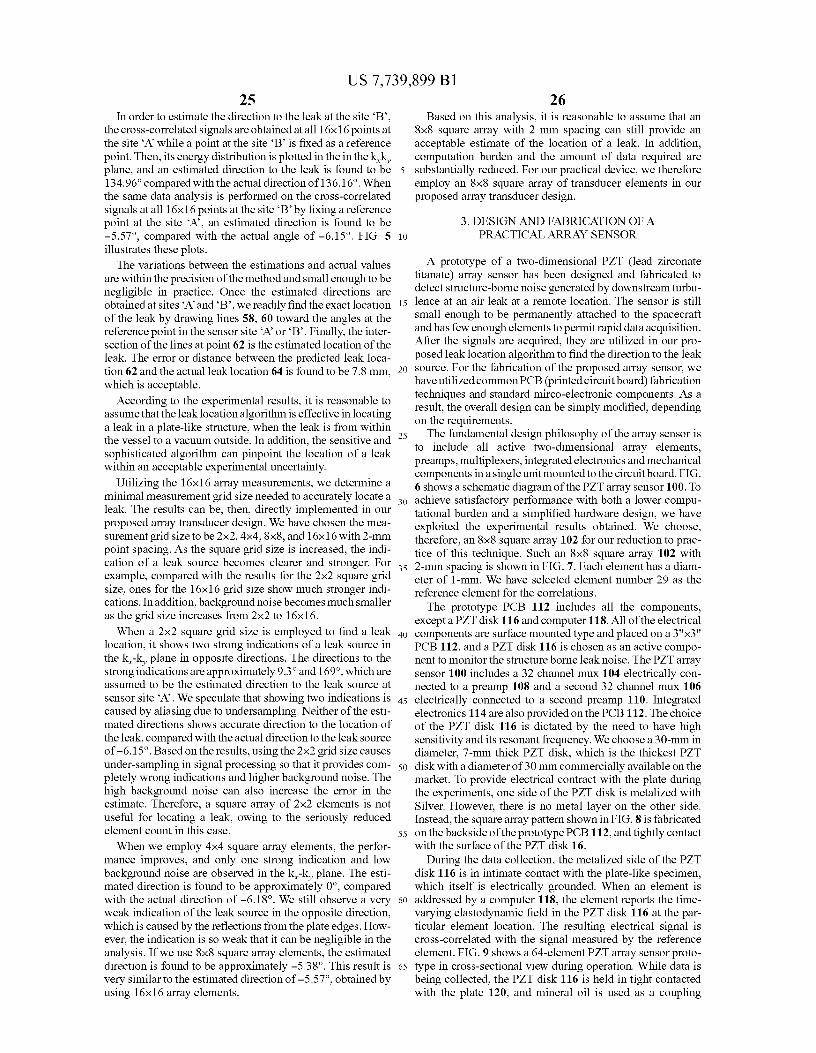
FIG.1 is a diagram illustrating how a correlation operationtransforms random noise waveforms into predictable func-tion of the leak spectrum, leak location, and detector geom-etry.
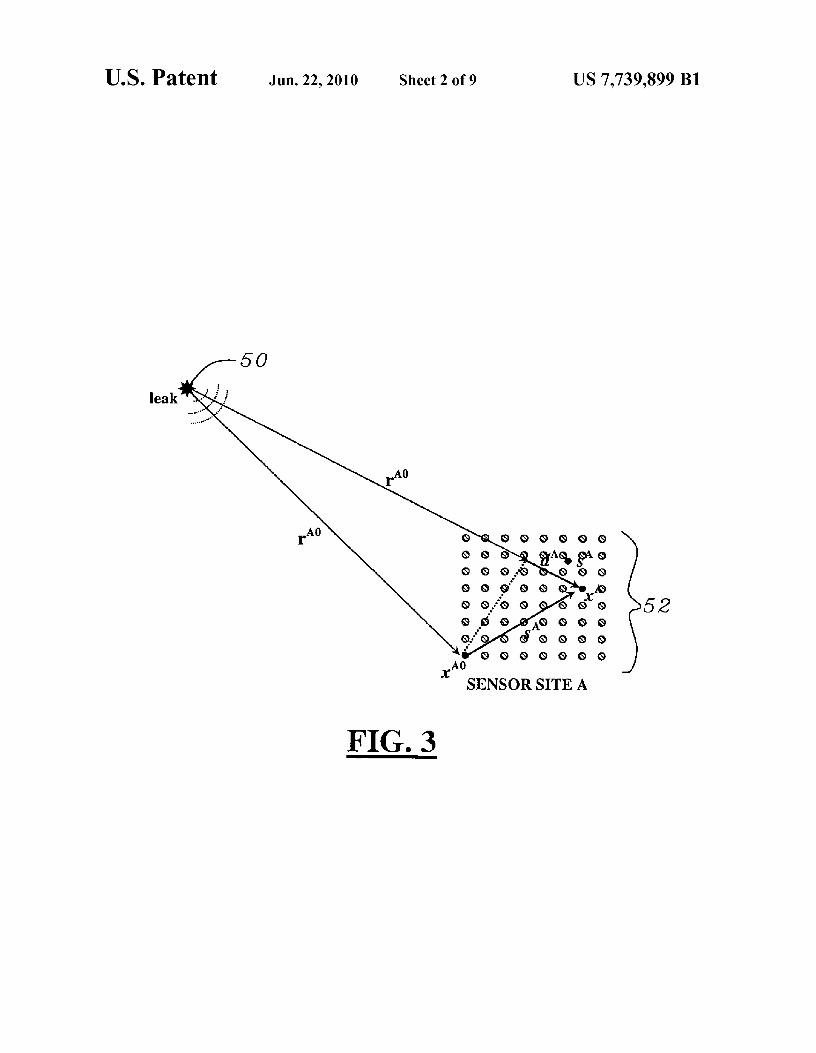
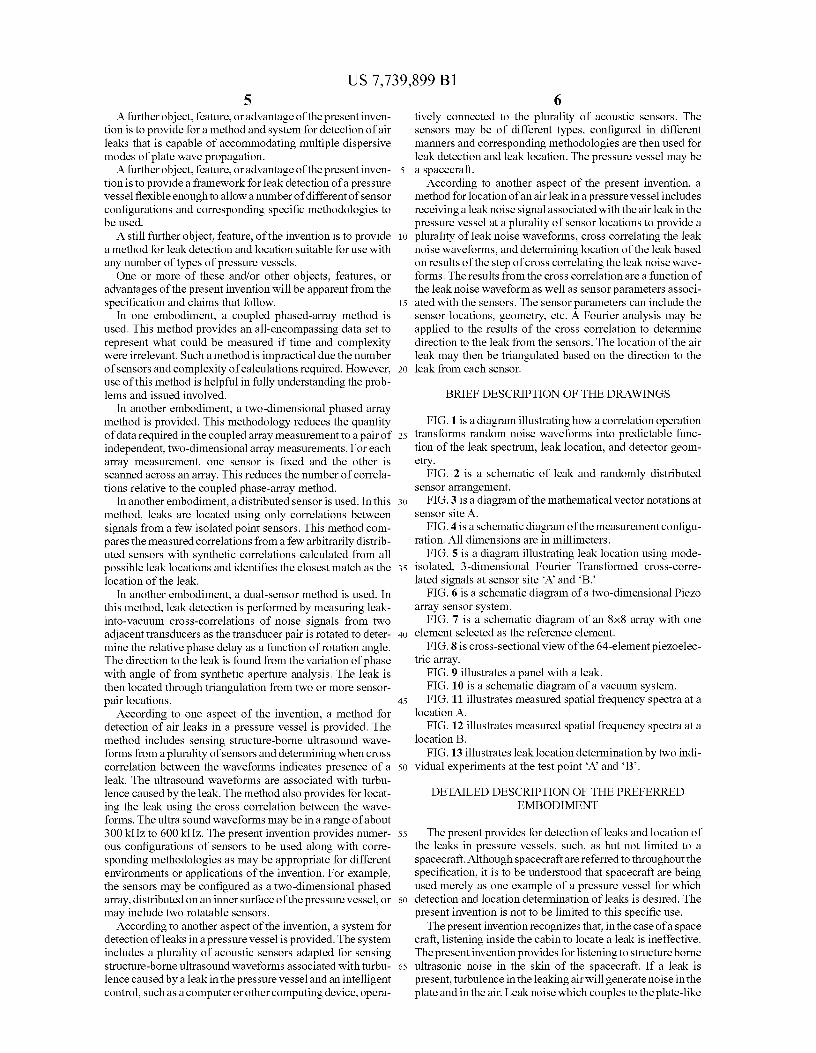
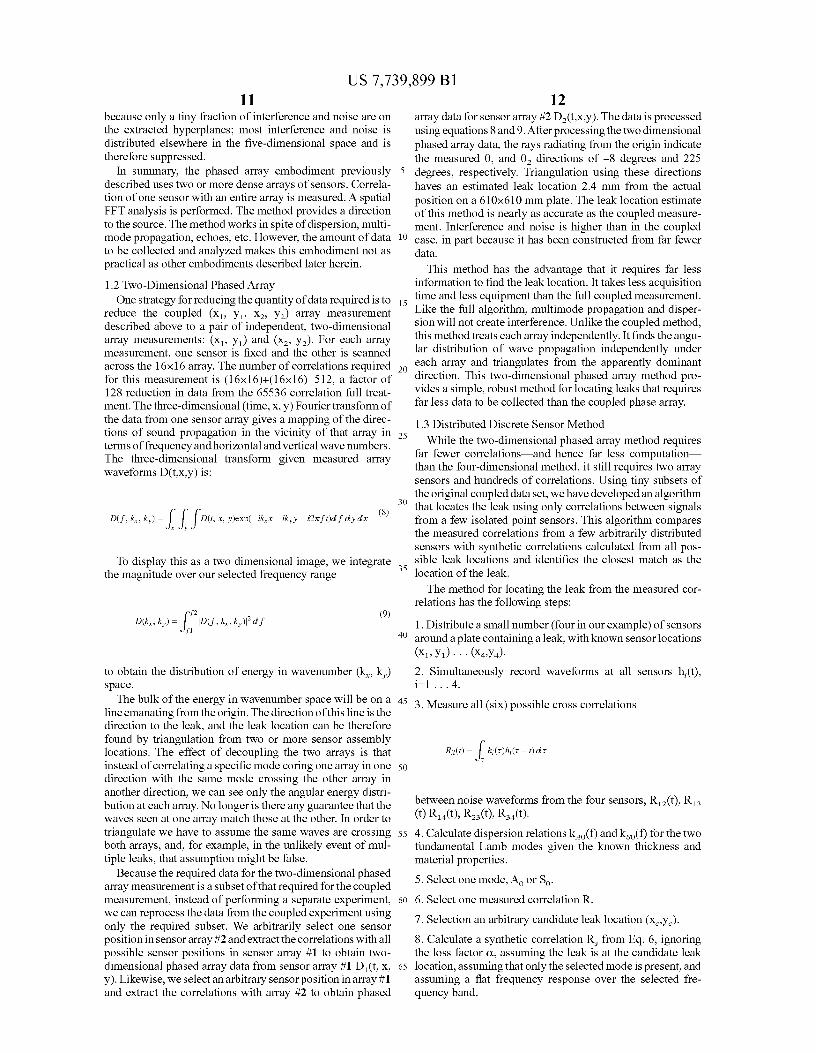
FIG. 2 is a schematic of leak and randomly distributedsensor arrangement.
FIG. 3 is a diagram of the mathematical vector notations atsensor site A.
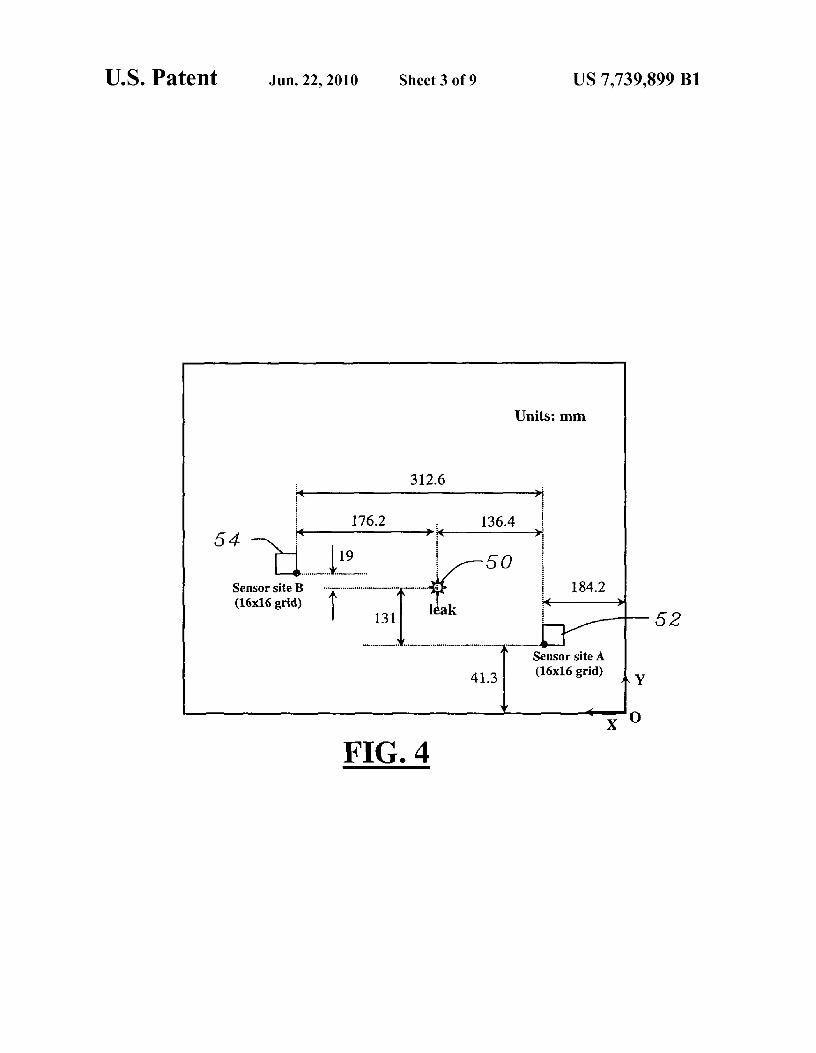
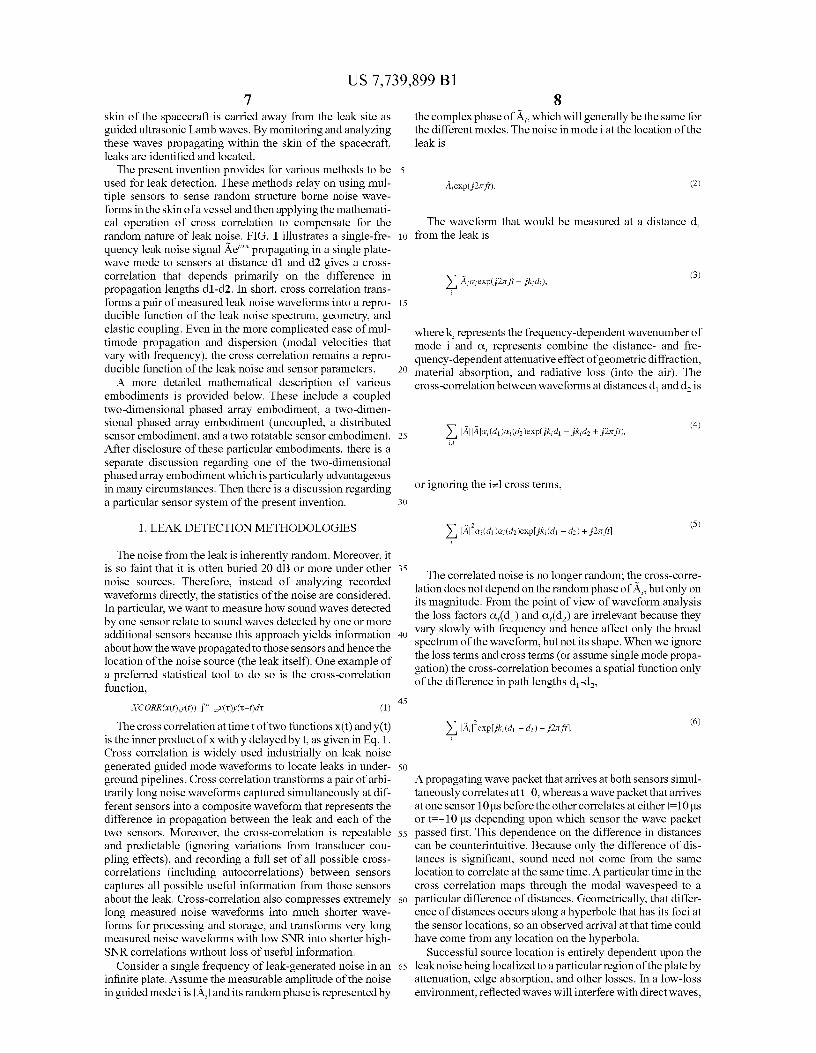
FIG. 4 is a schematic diagram of the measurement configu-ration. All dimensions are in millimeters.
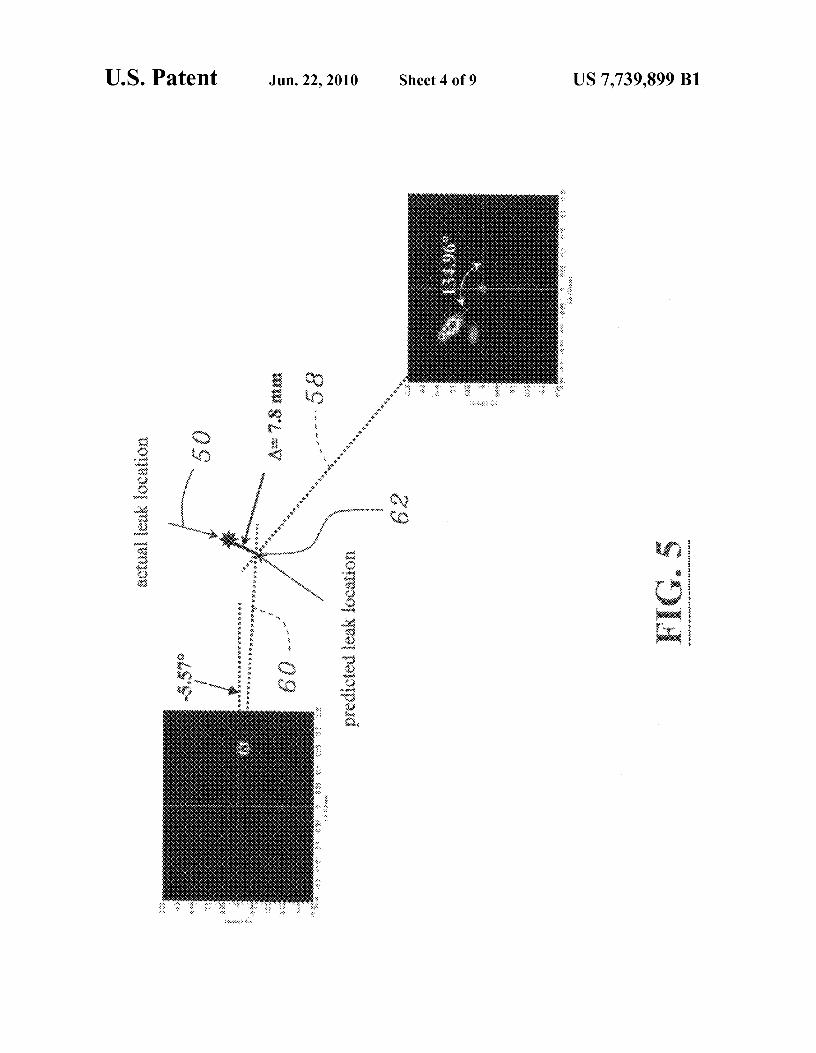
FIG. 5 is a diagram illustrating leak location using mode-isolated, 3-dimensional Fourier Transformed cross-corre-lated signals at sensor site `A' and B.'
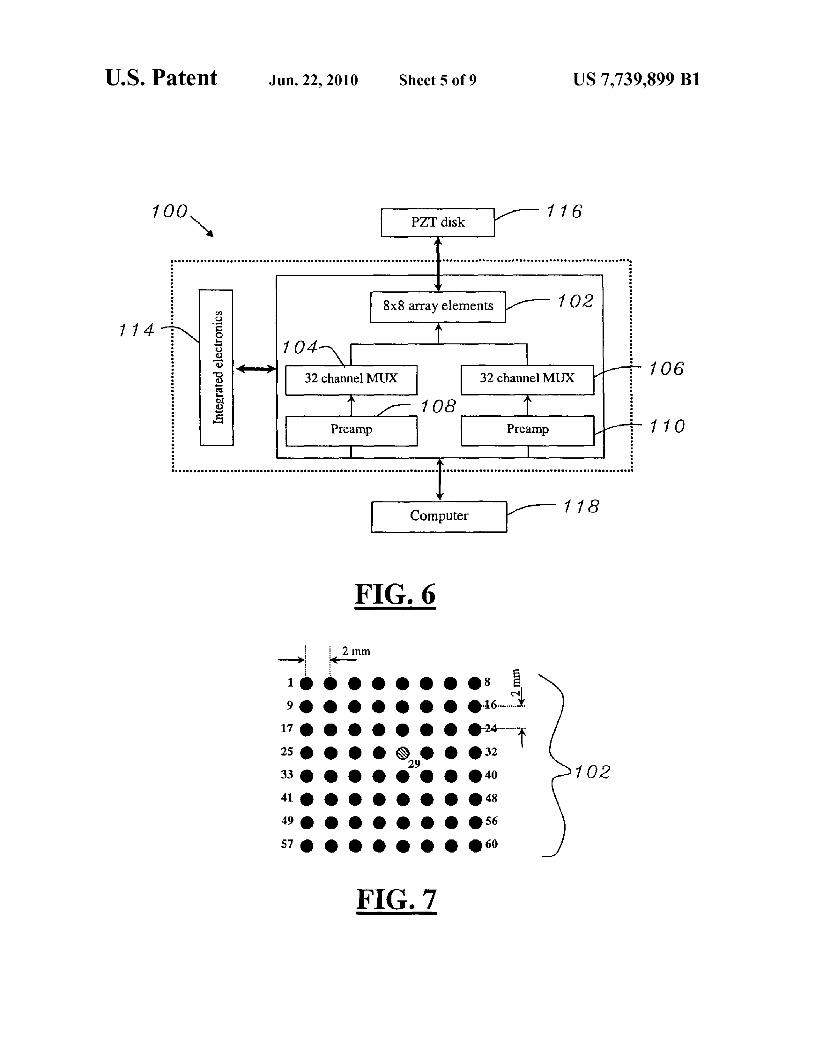
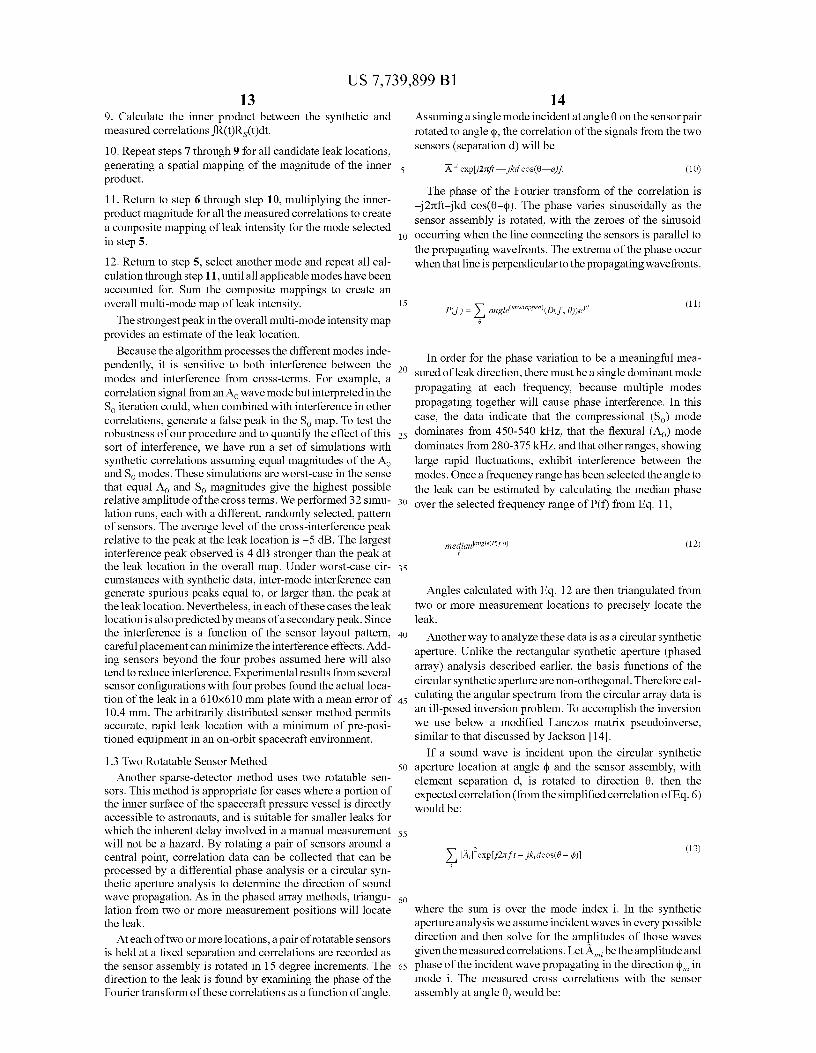
FIG. 6 is a schematic diagram of a two-dimensional Piezoarray sensor system.
FIG. 7 is a schematic diagram of an 8x8 array with oneelement selected as the reference element.
FIG. 8 is cross-sectional view of the 64-element piezoelec-tric array.
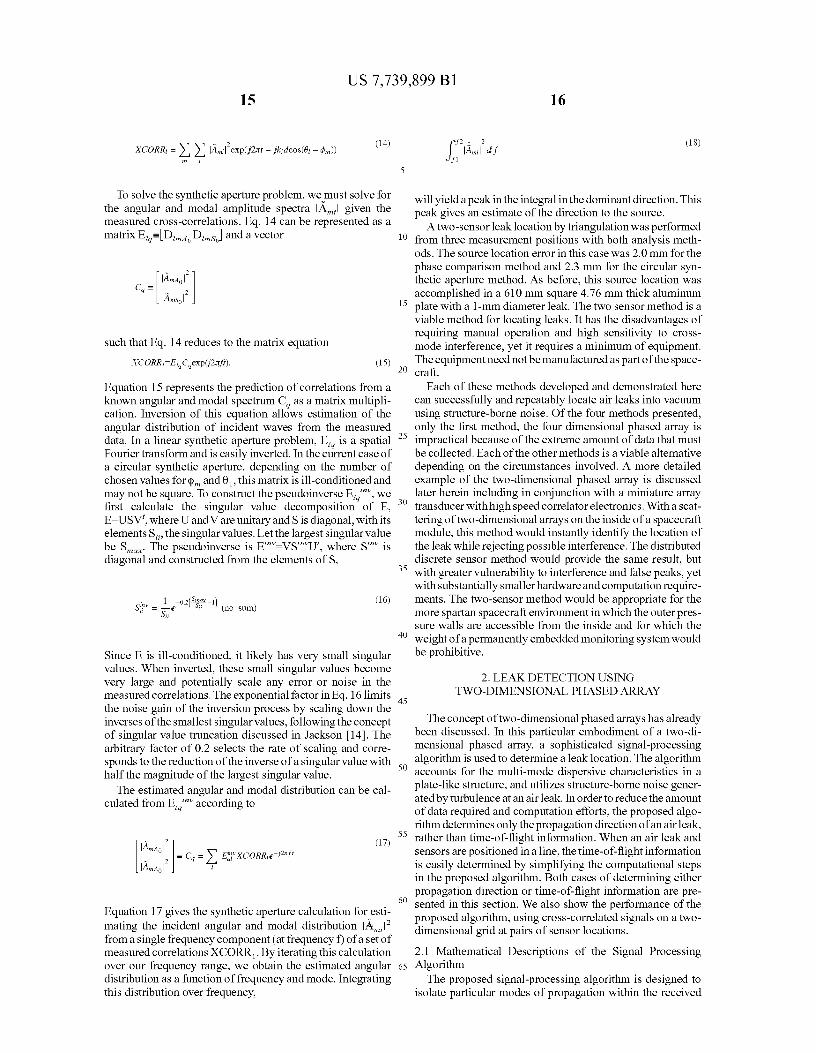
FIG. 9 illustrates a panel with a leak.FIG. 10 is a schematic diagram of a vacuum system.FIG. 11 illustrates measured spatial frequency spectra at a
location A.FIG. 12 illustrates measured spatial frequency spectra at a
location B.FIG. 13 illustrates leak location determinationby two indi-
vidual experiments at the test point `A' and `B'.
DETAILED DESCRIPTION OF THE PREFERREDEMBODIMENT
The present provides for detection of leaks and location ofthe leaks in pressure vessels, such, as but not limited to aspacecraft. Although spacecraft are referred to throughout thespecification, it is to be understood that spacecraft are beingused merely as one example of a pressure vessel for whichdetection and location determination of leaks is desired. Thepresent invention is not to be limited to this specific use.
The present invention recognizes that, in the case of a spacecraft, listening inside the cabin to locate a leak is ineffective.The present invention provides for listening to structure borneultrasonic noise in the skin of the spacecraft. If a leak ispresent, turbulence in the leaking air will generate noise in theplate and in the air. Leak noise which couples to the plate-like
US 7,739,899 B1
45(1)
7skin of the spacecraft is carried away from the leak site asguided ultrasonic Lamb waves. By monitoring and analyzingthese waves propagating within the skin of the spacecraft,leaks are identified and located.
The present invention provides for various methods to beused for leak detection. These methods relay on using mul-tiple sensors to sense random structure borne noise wave-forms in the skin of a vessel and then applying the mathemati-cal operation of cross correlation to compensate for therandom nature of leak noise. FIG. 1 illustrates a single-fre-quency leak noise signal Ae"' propagating in a single plate-wave mode to sensors at distance dl and d2 gives a cross-correlation that depends primarily on the difference inpropagation lengths dl-d2. In short, cross correlation trans-forms a pair of measured leak noise waveforms into a repro-ducible function of the leak noise spectrum, geometry, andelastic coupling. Even in the more complicated case of mul-timode propagation and dispersion (modal velocities thatvary with frequency), the cross correlation remains a repro-ducible function of the leak noise and sensor parameters.
A more detailed mathematical description of variousembodiments is provided below. These include a coupledtwo-dimensional phased array embodiment, a two-dimen-sional phased array embodiment (uncoupled, a distributedsensor embodiment, and a two rotatable sensor embodiment.After disclosure of these particular embodiments, there is aseparate discussion regarding one of the two-dimensionalphased array embodiment which is particularly advantageousin many circumstances. Then there is a discussion regardinga particular sensor system of the present invention.
1. LEAK DETECTION METHODOLOGIES
The noise from the leak is inherently random. Moreover, itis so faint that it is often buried 20 dB or more under othernoise sources. Therefore, instead of analyzing recordedwaveforms directly, the statistics of the noise are considered.In particular, we want to measure how sound waves detectedby one sensor relate to sound waves detected by one or moreadditional sensors because this approach yields informationabout how the wave propagated to those sensors and hence thelocation of the noise source (the leak itself). One example ofa preferred statistical tool to do so is the cross-correlationfunction,
XCORR(x(t),y(t)) J`"_arx(t)y(t-t)dt
The cross correlation at time t of two functions x(t) and y(t)is the inner product of x with y delayed by t, as given in Eq. 1.Cross correlation is widely used industrially on leak noisegenerated guided mode waveforms to locate leaks in under-ground pipelines. Cross correlation transforms a pair of arbi-trarily long noise waveforms captured simultaneously at dif-ferent sensors into a composite waveform that represents thedifference in propagation between the leak and each of thetwo sensors. Moreover, the cross-correlation is repeatableand predictable (ignoring variations from transducer cou-pling effects), and recording a full set of all possible cross-correlations (including autocorrelations) between sensorscaptures all possible useful information from those sensorsabout the leak. Cross-correlation also compresses extremelylong measured noise waveforms into much shorter wave-forms for processing and storage, and transforms very longmeasured noise waveforms with low SNR into shorter high-SNR correlations without loss of useful information.
Consider a single frequency of leak-generated noise in aninfinite plate. Assume the measurable amplitude of the noisein guidedmode i is IAI and its randomphase is representedby
8the complex phase of A,, which will generally be the same forthe different modes. The noise in mode i at the location of theleak is
A; exp(p2)T ft). (2)
The waveform that would be measured at a distance d,10 from the leak is
Y, A;a;exp(p2)rft— pk;d;), (3)
15
where k, represents the frequency-dependent wavenumber ofmode i and a, represents combine the distance- and fre-quency-dependent attenuative effect of geometric diffraction,
20 material absorption, and radiative loss (into the air). Thecross-correlation between waveforms at distances d, and d2 'S
25 AIIAIa;(di)aa(d2)exp(9k;di — 9ka d2 + 92)T f0, (4)i,d
or ignoring the i;-1 cross terms,30
y' —d2)+92n f t] (5)
35The correlated noise is no longer random; the cross-corre-
lation does not depend on the random phase of A,, but only onits magnitude. From the point of view of waveform analysisthe loss factors a{d i ) and a{dz) are irrelevant because they
40 vary slowly with frequency and hence affect only the broadspectrum of the waveform, but not its shape. When we ignorethe loss terms and cross terms (or assume single mode propa-gation) the cross-correlation becomes a spatial function onlyof the difference in path lengths d,-dz,
y' [pk; (di — d2) + p2)r ft]. (6)
50A propagating wave packet that arrives at both sensors simul-taneously correlates at t-0, whereas a wave packet that arrivesat one sensor 10 µs before the other correlates at either t=10 µsor t=-10 µs depending upon which sensor the wave packet
55 passed first. This dependence on the difference in distancescan be counterintuitive. Because only the difference of dis-tances is significant, sound need not come from the samelocation to correlate at the same time. A particular time in thecross correlation maps through the modal wavespeed to a
60 particular difference of distances. Geometrically, that differ-ence of distances occurs along a hyperbole that has its foci atthe sensor locations, so an observed arrival at that time couldhave come from any location on the hyperbola.
Successful source location is entirely dependent upon the65 leak noise being localized to a particular region of the plate by
attenuation, edge absorption, and other losses. In a low-lossenvironment, reflected waves will interfere with direct waves,
US 7,739,899 B19
complicating the process of source location. In the extremecase of very low attenuation, resonance or a diffuse soundfield can occur, and source location will become impossiblebecause the cross -correlations will measure nothing but theresonance pattern and the Green ' s function between the sen- 5sors. Since loss is in general a strong function of frequency,only a limited frequency range will contain useful informa-tion about the location of the leak. For our tests, we usedfrequencies between 200 -600 kHz. Source location in smallobjects requires higher frequency measurement and analysis ioto ensure sound field localization than source location in largeobjects, so lower frequencies may be more useful for actualspacecraft than in the smaller test configuration. Of course,the present invention is not to be limited to the preferredfrequency range used for testing. is
Between 200 and 600 kHz and for the 4.76-mm platethickness there are two detectible Lamb modes; the lowestorder symmetric So compressional mode and the lowest orderasymmetric AO flexural mode. These two modes are both 20dispersive, in that their phase velocity depends on frequency.Their dispersion is reflected in the implicit frequency depen-dence of the wavenumber k in Eqs. 4-6. The dispersion rela-tions k,,(f) and k,,(f) of the A O and So Lamb modes can bereadily calculated from the known material properties, thick- 25ness and Lamb wave theory. The modes give rise to a total offour terms in Eq. 4, two single -mode terms plus two -cross-terms. Therefore, the measured correlations will contain dis-persed signals from the single mode terms with interferencefrom the cross terms. Measured correlations tend to have 30distinct arrivals near t-0 or less distinct dispersed wavetrainsat t>0 or t<0 depending on the magnitude and sign of thedifference of distances d,-d2'
Cross correlation greatly reduces the amount of informa-tionthatmustbe stored. Cross correlations arelimitedintime 35from the total distances involved and the speed of propaga-tion, so they are inherently compact, yet they can representdata from arbitrarily long measured waveforms, since theintegral in Eq. 1 goes out to infinity. Moreover, a full set of allpossible auto correlations (cross correlation of a waveform 40with itself) and cross correlations between waveforms from aset of sensors is complete in the mathematical sense that itcontains all possible useful information that could beextracted from the sensors. Therefore, storing and analyzingcross correlations is an effective and efficient alternative to 45storing and analyzing the raw noise waveforms themselves.
We show by construction that noise waveforms equivalentto the originals can be calculated from the full set of auto andcross correlations, and therefore that there is no informationloss from storing and processing only the correlations. Let 50x(t), y(t) be measured waveforms from a pair of sensors, andX(f), Y(f) be their Fourier transforms. Since cross correlationin the time domain is equivalent to multiplication by thecomplex conjugate in the frequency domain, the cross- and
10reconstructed waveforms are equivalent to the originals andthere is no information loss in storing and processing only thecorrelations.
1.1 Coupled Two-Dimensional Phased ArraysHaving now explained the statistical analysis, an embodi-
ment is now described for coupled two-dimensional phasedarrays. We have collected an all-encompassing data set torepresent what could be measured if time and complexitywere irrelevant. The data set contains all of the possible crosscorrelations between elements of two 2-dimensional phasedarrays. Specialization of this data set was used to prototypethe sparse methods described later herein.
An automated motion control system was used to positiona pair of 1.5-mm diameter piezoelectric transducers used assensors. Computer controlled stepping in 2 mm steps of eachsensor over its own 32 mmx32 mm grid simulates two phasedarrays on the 4.76-mm thick aluminum plate. These phasedarrays have been coupled by measuring correlations betweensignals from all possible pairs of locations in the two arrays.One-second long waveforms have been recorded at 5 MSPSfor each pair of sensor locations. Cross -correlations are cal-culated from the recorded waveforms and stored. All possiblecross correlations between the 256 sensor positions in eacharray are recorded, leading to a total of 65536 correlationsarranged as a (I6x16)x(16x l6) phased array calculated from655 billion samples.
The processing of this data to reveal the leak locationproceeds by straightforward Fourier phased-array analysis,followed by the application of a-priori knowledge to reducethe dimensionality of the data from five dimensions to two.The raw correlation data D(t, x i , y l , xz, yz) is discretelyindexed along five dimensions: time, x 1 , yi , xz, yz . A five-dimensional discrete Fourier transform converts the data tofrequency-wavenumber space, D(f, k, 1 , kyl , kxz , kyz). Thetransformed data set is then converted to polar coordinates,D(f, Ik, I, ^1, Ikzl, C). One dimension can be eliminated fromthe data, along with the cross terms of Eq. 4 by requiring thewavenumber magnitudes Ik, I and Ik z l to be equal at the twosensors, and discarding all data not on the hyperplaneIki l=lkz l. The data can also be reduced in dimension byexploiting knowledge of the dispersion relation of the AO andSo modes, k,,(f) and k,, (f), to eliminate data not on thehyperplanes IkI=k,, (f) or Ikl=kso (f). The result of this reduc-tion is a pair of three -dimensional data sets one for A0, onefor So—each a function off, 01, 02- One more dimension canbe eliminated by integrating the energy (square of the com-plex magnitude) of the data over frequency f, for example
Dno(01, 02) _ f
zI D (f, Ikil, 01, Ik2l, 02)llkl -Jk2J=kno(f)1 df
(7)
f
auto-correlations are XCORR(x,y)=X(f)Y*(f), XCORR(x, 55 fortheAo model This leaves a pair (one for eachmode)oftwox)= X(f)X *(f), and XCORR(y,y)=Y(f)Y*(f). These correla- dimensional functions of 0 1 and O z that represent the modaltions can be measured to arbitrarily high signal-to-noise energy from a common source incident on array 1 at angle O1ratios by calculating them from sufficiently long recorded and on array 2 at angle Oz.waveforms. First we reconstruct a frequency domain wave- TheAO and So mode Eq. 7 energy integrals are then plotted.form X,,(f) from the known amplitude spectrum 1lX(f)X*(f) 6o The results indicated that the location of the leak is indepen-and a single random function ^(f) giving random phase e`-pw . dent of the mode selected for analysis. In an example, theThe inverse Fourier transform of X,,(f) is the reconstructed estimated leak location is less than 2 mm from the actualnoise waveform x,,(t). The reconstructed noise waveform location. This embodiment, all though exhaustive in scopeY,,(t) is the unique inverse Fourier transform of Y,,(f)=[X(f) and impractical in terms of time and equipment demonstratesY*(f)/X,,(f)] Since the reconstruction is unique given ^(f), 65 the capability to estimate the leak location accurately usingwhich is equivalent to (but different from) the random phase random-signal guided waves. The coupled phased arrayof the leak, the method is particularly insensitive to interference and noise
US 7,739,899 B111
because only a tiny fraction of interference and noise are onthe extracted hyperplanes; most interference and noise isdistributed elsewhere in the five-dimensional space and istherefore suppressed.
In summary, the phased array embodiment previouslydescribed uses two or more dense arrays of sensors. Correla-tion of one sensor with an entire array is measured. A spatialFFT analysis is performed. The method provides a directionto the source. The method works in spite of dispersion, multi-mode propagation, echoes, etc. However, the amount of datato be collected and analyzed makes this embodiment not aspractical as other embodiments described later herein.
1.2 Two-Dimensional Phased ArrayOne strategy for reducing the quantity of data required is to
reduce the coupled (x,, y i , x21 y2) array measurementdescribed above to a pair of independent, two-dimensionalarray measurements: (x l , yj and (x21 y2). For each arraymeasurement, one sensor is fixed and the other is scannedacross the 16x16 array. The number of correlations requiredfor this measurement is (16x16)+(16x16)=512, a factor of128 reduction in data from the 65536 correlation full treat-ment. The three-dimensional (time, x, y) Fourier transform ofthe data from one sensor array gives a mapping of the direc-tions of sound propagation in the vicinity of that array interms of frequency and horizontal and vertical wave numbers.The three-dimensional transform given measured arraywaveforms D(t,x,y) is:
D(f, kx, ky) _ J D(t, x, Y)exp(—ikxx — ikYY — c2)r f t)d f ray dx (8)Y
To display this as a two dimensional image, we integratethe magnitude over our selected frequency range
D(kx , ky) _ t2 ID(f, k_ ky)12df(9)
n
to obtain the distribution of energy in wavenumber (kx, ky)space.
The bulk of the energy in wavenumber space will be on aline emanating from the origin. The direction of this line is thedirection to the leak, and the leak location can be thereforefound by triangulation from two or more sensor assemblylocations. The effect of decoupling the two arrays is thatinstead of correlating a specific mode coring one array in onedirection with the same mode crossing the other array inanother direction, we can see only the angular energy distri-bution at each array. No longer is there any guarantee that thewaves seen at one array match those at the other. In order totriangulate we have to assume the same waves are crossingboth arrays, and, for example, in the unlikely event of mul-tiple leaks, that assumption might be false.
Because the required data for the two-dimensional phasedarray measurement is a subset of that required for the coupledmeasurement, instead of performing a separate experiment,we can reprocess the data from the coupled experiment usingonly the required subset. We arbitrarily select one sensorposition in sensor array #2 and extract the correlations with allpossible sensor positions in sensor array #1 to obtain two-dimensional phased array data from sensor array #1 D 1 (t, x,y). Likewise, we select an arbitrary sensor position in array #1and extract the correlations with array #2 to obtain phased
12array data for sensor array #2 D 2 (t,x,y). The data is processedusing equations 8 and 9. After processing the two dimensionalphased array data, the rays radiating from the origin indicatethe measured 0, and 0 2 directions of —8 degrees and 225
5 degrees, respectively. Triangulation using these directionshaves an estimated leak location 2.4 mm from the actualposition on a 610x610 mm plate. The leak location estimateof this method is nearly as accurate as the coupled measure-ment. Interference and noise is higher than in the coupled
10 case, in part because it has been constructed from far fewerdata.
This method has the advantage that it requires far lessinformation to find the leak location. It takes less acquisitiontime and less equipment than the full coupled measurement.
15 Like the full algorithm, multimode propagation and disper-sion will not create interference. Unlike the coupled method,this method treats each array independently. It finds the angu-lar distribution of wave propagation independently undereach array and triangulates from the apparently dominant
20 direction. This two-dimensional phased array method pro-vides a simple, robust method for locating leaks that requiresfar less data to be collected than the coupled phase array.
1.3 Distributed Discrete Sensor Method25 While the two-dimensional phased array method requires
far fewer correlations and hence far less computationthan the four-dimensional method, it still requires two arraysensors and hundreds of correlations. Using tiny subsets ofthe original coupled data set, we have developed an algorithm
30 that locates the leak using only correlations between signalsfrom a few isolated point sensors. This algorithm comparesthe measured correlations from a few arbitrarily distributedsensors with synthetic correlations calculated from all pos-sible leak locations and identifies the closest match as the
35 location of the leak.The method for locating the leak from the measured cor-
relations has the following steps:
1. Distribute a small number (four in our example) of sensors40
/around a plate containing a leak, with known sensor locations(X 11 YJ . . . (X4ey4)•
2. Simultaneously record waveforms at all sensors h (t),i=1 ... 4.
45 3. Measure all (six) possible cross correlations
Rid(t) — f 'h'(T)hj(T —t)dr
50
between noisewaveforms from the four sensors, R 12 (t), R13(t) R14(t), R23(t), R34(t)•
55 4. Calculate dispersion relations k,,(f) and kso(f) for the twofundamental Lamb modes given the known thickness andmaterial properties.
5. Select one mode, Ao or So.
60 6. Select one measured correlation R.
7. Selection an arbitrary candidate leak location (x,,y,).
8. Calculate a synthetic correlation RS from Eq. 6, ignoringthe loss factor a, assuming the leak is at the candidate leak
65 location, assuming that only the selected mode is present, andassuming a flat frequency response over the selected fre-quency band.
US 7,739,899 B113
9. Calculate the inner product between the synthetic andmeasured correlations fR(t)Rs(t)dt.
10. Repeat steps 7 through 9 for all candidate leak locations,generating a spatial mapping of the magnitude of the innerproduct.
11. Return to step 6 through step 10, multiplying the inner-product magnitude for all the measured correlations to createa composite mapping of leak intensity for the mode selectedin step 5.
12. Return to step 5, select another mode and repeat all cal-culation through step 11, until all applicable modes have beenaccounted for. Sum the composite mappings to create anoverall multi-mode map of leak intensity.
The strongest peak in the overall multi-mode intensity mapprovides an estimate of the leak location.
Because the algorithm processes the different modes inde-pendently, it is sensitive to both interference between themodes and interference from cross-terms. For example, acorrelation signal from anAo wave mode but interpreted in theSo iteration could, when combined with interference in othercorrelations, generate a false peak in the S o map. To test therobustness of our procedure and to quantify the effect of thissort of interference, we have run a set of simulations withsynthetic correlations assuming equal magnitudes of the Aoand S o modes. These simulations are worst-case in the sensethat equal Ao and So magnitudes give the highest possiblerelative amplitude of the cross terms. We performed 32 simu-lation runs, each with a different, randomly selected, patternof sensors. The average level of the cross-interference peakrelative to the peak at the leak location is —5 dB. The largestinterference peak observed is 4 dB stronger than the peak atthe leak location in the overall map. Under worst-case cir-cumstances with synthetic data, inter-mode interference cangenerate spurious peaks equal to, or larger than, the peak atthe leak location. Nevertheless, in each of these cases the leaklocation is also predicted by means of a secondary peak. Sincethe interference is a function of the sensor layout pattern,careful placement can minimize the interference effects. Add-ing sensors beyond the four probes assumed here will alsotend to reduce interference. Experimental results from severalsensor configurations with four probes found the actual loca-tion of the leak in a 610x610 mm plate with a mean error of10.4 mm. The arbitrarily distributed sensor method permitsaccurate, rapid leak location with a minimum of pre-posi-tioned equipment in an on-orbit spacecraft environment.
1.3 Two Rotatable Sensor MethodAnother sparse-detector method uses two rotatable sen-
sors. This method is appropriate for cases where a portion ofthe inner surface of the spacecraft pressure vessel is directlyaccessible to astronauts, and is suitable for smaller leaks forwhich the inherent delay involved in a manual measurementwill not be a hazard. By rotating a pair of sensors around acentral point, correlation data can be collected that can be
processed by a differential phase analysis or a circular syn-thetic aperture analysis to determine the direction of soundwave propagation. As in the phased array methods, triangu-lation from two or more measurement positions will locatethe leak.
At each of two or more locations, a pair of rotatable sensorsis held at a fixed separation and correlations are recorded asthe sensor assembly is rotated in 15 degree increments. Thedirection to the leak is found by examining the phase of theFourier transform of these correlations as a function of angle.
14Assuming a single mode incident at angle 0 on the sensor pairrotated to angle ^, the correlation of the signals from the twosensors (separation d) will be
5 IAh expUltf1—jkd cos(6—e)J. (10)
The phase of the Fourier transform of the correlation isj27tft—jkd cos(()—^). The phase varies sinusoidally as thesensor assembly is rotated, with the zeroes of the sinusoid
10 occurring when the line connecting the sensors is parallel tothe propagating wavefronts. The extrema of the phase occurwhen that line is perpendicular to the propagating wavefronts.
15P(f) _ Y, angled°"""°°P`d)(D(f, 0))C''
(11)
e
In order for the phase variation to be a meaningful mea-20 sured of leak direction, there must be a single dominant mode
propagating at each frequency, because multiple modespropagating together will cause phase interference. In thiscase, the data indicate that the compressional (S o) mode
25 dominates from 450-540 kHz, that the flexural (A o) modedominates from 280-375 kHz, and that other ranges, showinglarge rapid fluctuations, exhibit interference between themodes. Once a frequency range has been selected the angle tothe leak can be estimated by calculating the median phase
30 over the selected frequency range of P(f) from Eq. 11,
median[°"g)`(P(f))] (12)f
35
Angles calculated with Eq. 12 are then triangulated fromtwo or more measurement locations to precisely locate theleak.
40 Another way to analyze these data is as a circular syntheticaperture. Unlike the rectangular synthetic aperture (phasedarray) analysis described earlier, the basis functions of thecircular synthetic aperture are non-orthogonal. Therefore cal-
45 culating the angular spectrum from the circular array data isan ill-posed inversion problem. To accomplish the inversionwe use below a modified Lanczos matrix pseudoinverse,similar to that discussed by Jackson [14].
If a sound wave is incident upon the circular synthetic50 aperture location at angle ^ and the sensor assembly, with
element separation d, is rotated to direction 0, then theexpected correlation (from the simplified correlation of Eq. 6)would be:
55
y' ^A;12exp[j2"f,—pk;dcos(B-0)](13)
60where the sum is over the mode index i. In the syntheticaperture analysis we assume incident waves in every possibledirection and then solve for the amplitudes of those wavesgiven the measured correlations. Let A my be the amplitude and
65 phase of the incident wave propagating in the direction ^_ inmode i. The measured cross correlations with the sensorassembly at angle 0, would be:
US 7,739,899 B115
16
XCORR, = Y^
Am; z exp jlTt - pk;dcos(01 - Om))
(14)IAm;I df (18)
fl
5
To solve the synthetic aperture problem, we must solve forthe angular and modal amplitude spectra IAJ given themeasured cross -correlations. Eq. 14 can be represented as amatrix E,q°[D imA O Dims.] and a vector
IAmAo lzC9 -
lAmso l z
such that Eq. 14 reduces to the matrix equation
XCORRiE,,Cgexp(T2jtft). (15)
Equation 15 represents the prediction of correlations from aknown angular and modal spectrum C. as a matrix multipli-cation. Inversion of this equation allows estimation of theangular distribution of incident waves from the measureddata. In a linear synthetic aperture problem, E1q is a spatialFourier transform and is easily inverted. In the current case ofa circular synthetic aperture, depending on the number ofchosen values for ^m and 0 1 , this matrix is ill-conditioned andmay not be square. To construct the pseudoinverse E iq""', wefirst calculate the singular value decomposition of E,E=USVt, where U and V are unitary and S is diagonal, with itselements S,,, the singular values. Let the largest singular valuebe Sm„. The pseudoinverse is E” '=VS" °" Ut, where S""' isdiagonal and constructed from the elements of S,
will yield a peak in the integral in the dominant direction. Thi speak gives an estimate of the direction to the source.
A two-sensor leak location by triangulation was performed10 from three measurement positions with both analysis meth-
ods. The source location error in this case was 2.0 mm for thephase comparison method and 2.3 mm for the circular syn-thetic aperture method. As before, this source location wasaccomplished in a 610 mm square 4.76 mm thick aluminum
15 plate with a 1-mm diameter leak. The two sensor method is aviable method for locating leaks. It has the disadvantages ofrequiring manual operation and high sensitivity to cross-mode interference, yet it requires a minimum of equipment.The equipment need not be manufactured as part of the space-
20 craft.
Each of these methods developed and demonstrated herecan successfully and repeatably locate air leaks into vacuumusing structure -borne noise. Of the four methods presented,only the first method, the four dimensional phased array is
25 impractical because of the extreme amount of data that mustbe collected. Each of the other methods is a viable alternativedepending on the circumstances involved. A more detailedexample of the two -dimensional phased array is discussedlater herein including in conjunction with a miniature array
30 transducer with high speed correlator electronics. Witha scat-tering of two-dimensional arrays on the inside of a spacecraftmodule, this method would instantly identify the location ofthe leak while rejecting possible interference. The distributeddiscrete sensor method would provide the same result, but
35 with greater vulnerability to interference and false peaks, yetwith substantially smaller hardware and computation require-ments. The two-sensor method would be appropriate for themore spartan spacecraft environment in which the outer pres-sure walls are accessible from the inside and for which the
40 weight of a permanently embedded monitoring system wouldbe prohibitive.
2. LEAK DETECTION USINGTWO-DIMENSIONAL PHASED ARRAY
45
The concept of two-dimensional phased arrays has alreadybeen discussed. In this particular embodiment of a two-di-mensional phased array, a sophisticated signal-processingalgorithm is used to determine a leak location. The algorithm
50 accounts for the multi-mode dispersive characteristics in aplate-like structure, and utilizes structure -borne noise gener-ated by turbulence at an air leak. In order to reduce the amountof data required and computation efforts, the proposed algo-rithm determines only the propagation direction of an air leak,
55 rather than time-of-flight information. When an air leak andsensors are positioned in a line, the time -of-flight informationis easily determined by simplifying the computational stepsin the proposed algorithm. Both cases of determining eitherpropagation direction or time-of-flight information are pre-
60 sented in this section. We also show the performance of theproposed algorithm, using cross -correlated signals on a two-dimensional grid at pairs of sensor locations.
2.1 Mathematical Descriptions of the Signal Processing65 Algorithm
The proposed signal-processing algorithm is designed toisolate particular modes of propagation within the received
1 -o.2(sm^-1^(16)
Sh _e s (no sum)s;;
Since E is ill-conditioned, it likely has very small singularvalues. When inverted, these small singular values becomevery large and potentially scale any error or noise in themeasured correlations. The exponential factor in Eq. 16 limitsthe noise gain of the inversion process by scaling down theinverses of the smallest singular values, following the conceptof singular value truncation discussed in Jackson [14]. Thearbitrary factor of 0.2 selects the rate of scaling and corre-sponds to the reduction of the inverse of a singular value withhalf the magnitude of the largest singular value.
The estimated angular and modal distribution can be cal-culated from E,q" °" according to
I AmAo Iz(17)
_ = C9 = Eq"'XCORR,, j2 ft
I AmAo z,l
Equation 17 gives the synthetic aperture calculation for esti-mating the incident angular and modal distribution IAmil2from a single frequency component (at frequency f) of a set ofmeasured correlations XCORRI . By iterating this calculationover our frequency range, we obtain the estimated angulardistribution as a function of frequency and mode. Integratingthis distribution over frequency,
US 7,739,899 B117
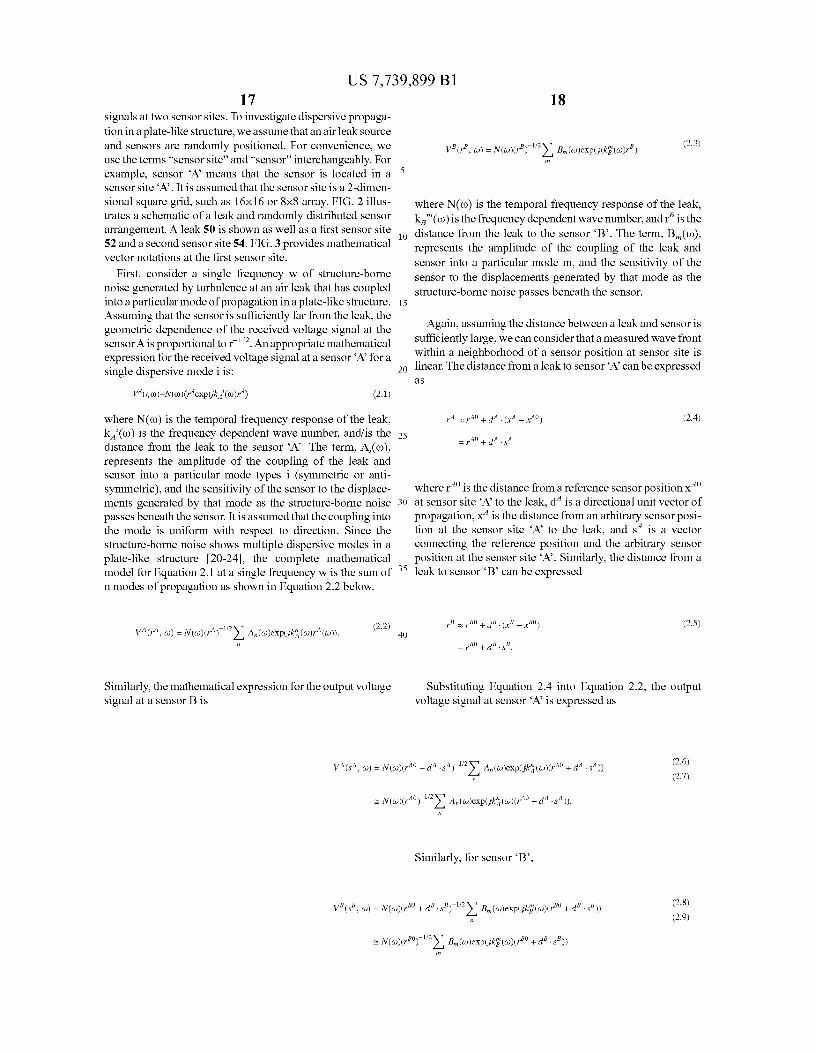
signals at two sensor sites. To investigate dispersive propaga-tion in a plate-like structure, we assume that an air leak sourceand sensors are randomly positioned. For convenience, weuse the terms "sensor site" and "sensor" interchangeably. Forexample, sensor `A' means that the sensor is located in asensor site W. It is assumed that the sensor site is a 2-dimen-sional square grid, such as 16xI6 or 8x8 array. FIG. 2 illus-trates a schematic of a leak and randomly distributed sensorarrangement. A leak 50 is shown as well as a first sensor site52 and a second sensor site 54. FIG. 3 provides mathematicalvector notations at the first sensor site.
First, consider a single frequency w of structure-bornenoise generated by turbulence at an air leak that has coupledinto a particular mode of propagation in a plate-like structure.Assuming that the sensor is sufficiently far from the leak, thegeometric dependence of the received voltage signal at thesensorA is proportional to r 112 . An appropriate mathematicalexpression for the received voltage signal at a sensor `A' for asingle dispersive mode i is:
W(rw) N(w)(rexpYk, 1 (w)r4) (2.1)
where N(w) is the temporal frequency response of the leak,kA`(w) is the frequency dependent wave number, and/is thedistance from the leak to the sensor W. The term, A (w),represents the amplitude of the coupling of the leak andsensor into a particular mode types i (symmetric or anti-symmetric), and the sensitivity of the sensor to the displace-ments generated by that mode as the structure-borne noisepasses beneath the sensor. It is assumed that the coupling intothe mode is uniform with respect to direction. Since thestructure-borne noise shows multiple dispersive modes in aplate-like structure [20-24], the complete mathematicalmodel for Equation 2.1 at a single frequency w is the sum ofn modes of propagation as shown in Equation 2.2 below.
18
VB (,', w) = N(w)(r') 1"2, B
m(,))exp (O(ke (w)re)(2.3)
5
where N(w) is the temporal frequency response of the leak,kBm (w) is the frequency dependent wave number, and r 8 is the
10 distance from the leak to the sensor `B'. The term, Bjw),represents the amplitude of the coupling of the leak andsensor into a particular mode m, and the sensitivity of thesensor to the displacements generated by that mode as thestructure-borne noise passes beneath the sensor.
15
Again, assuming the distance between a leak and sensor issufficiently large, we can consider that a measured wave frontwithin a neighborhood of a sensor position at sensor site is
20 linear. The distance from a leak to sensor `A' can be expressedas
r ^ rAO + dA . (xA _ xAO) (2.4)
25 _rAO+dA.SA
where rA0 is the distance from a reference sensor position xA030 at sensor site `A' to the leak, dA is a directional unit vector of
propagation, xA is the distance from an arbitrary sensor posi-tion at the sensor site `A' to the leak, and sA is a vector
connecting the reference position and the arbitrary sensorposition at the sensor site W. Similarly, the distance from a
35 leak to sensor `B' can be expressed
VA (r A ^) = N (&)) (rA ) 112 A n(&))exp(OkA (&)) rA (&))).(2.2)
40
rB rBO + dB . (xB — xBO) (2.5)
I = rBO + dB .,B
Similarly, the mathematical expression for the output voltage Substituting Equation 2.4 into Equation 2.2, the outputsignal at a sensor B is voltage signal at sensor `A' is expressed as
VA (SA , &)) =N (&)) (rAO+dA.SA
) 11z Y,An(&))exp(jkA(&))(rAO+dA.SA))(2.6)
n (2.7)
N(&))(rAO) 112
Y,Aa(&))exp(OkA(&))(rAO+dA.SA))
Similarly, for sensor `B',
VB (SB , ^)= N(w)(rao+dB.SB) 112 Bm(w)exp(Oka(w)(rB° +dB.SB))(2.8)
(2.9)
N(&))(rBO) 112Bm(&))exp (Oke (&))(rB° + dB. SB))
US 7,739,899 B119
In Equation 2.7 and 2.9, it is assumed that reduction of thesignal amplitude owing to diffraction is negligible.
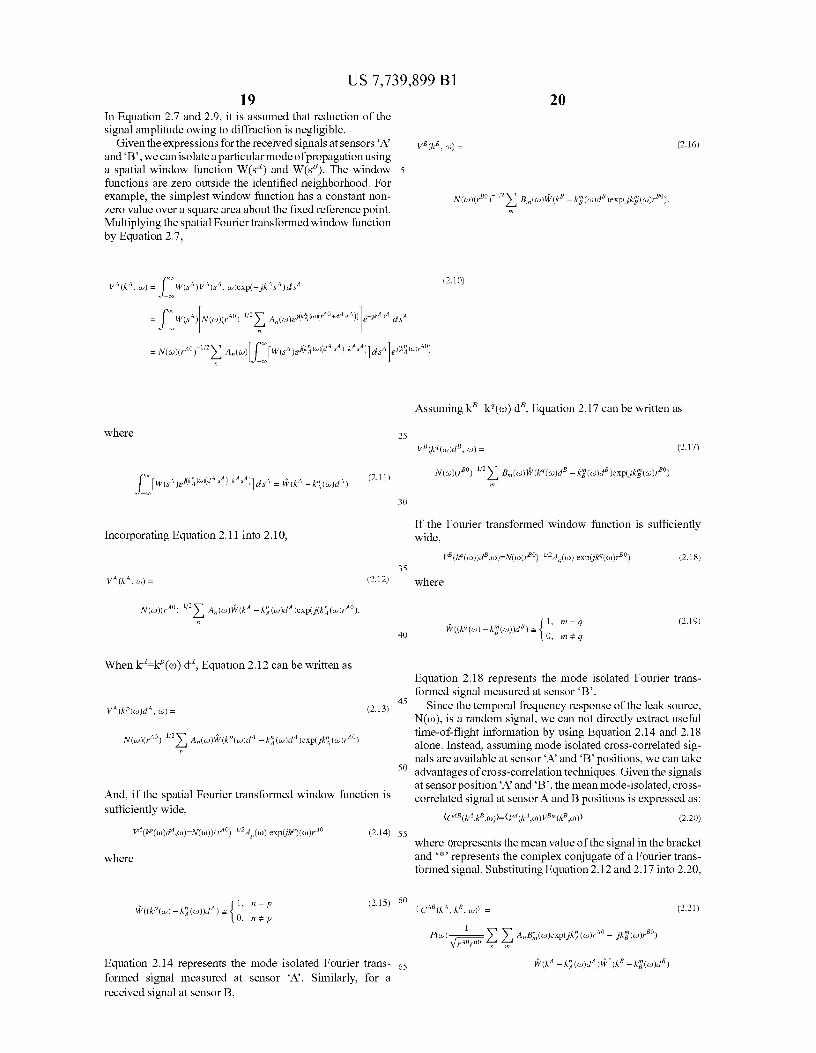
Given the expressions for the received signals at sensors `A'and `B', we can isolate a particular mode of propagation usinga spatial window function W(s') and W(s'). The windowfunctions are zero outside the identified neighborhood. Forexample, the simplest window function has a constant non-zero value over a square area about the fixed reference point.Multiplying the spatial Fourier transformed window functionby Equation 2.7,
20
VB (kB , .) _ (2.16)
N(o)(,B,) 112Y, & (o)W (kB - ke (m)dB )exp(pke (&))rBO).
VA (kA , W (SA ) VA (SA , o))exp(-9kASA)dSA
(2.10)
W (SA )LN (.)(YAO)- 1/2^ An(&))e'(kA (^,)(.AO+dA.sA )11 C ' kAsA
I
dSA
=N(^)(YAO^ 112^ A,()) I ^[W (SA)^;(k A(t^)(dA"sA^-k AA ^]d J^1lkA (-)40)
Assuming kB=k7(w) e, Equation 2.17 can be written as
where 25
VB (k9 (w)dB , w) _(2.17)
/ N(&))(rBO) 1)2^ B,n(c))W(k9(c))dB-^(&))dB)expJka(&))rBO)fW(SA)^1lkA«)ldA'SA)-kn a)^ ^S A W(kA -kA(m)dA)
2.11)m
30
If the Fourier transformed window function is sufficientlyIncorporating Equation 2.11 into 2. 10, wide,
VB (e(w))da w) N(c)(r80)-",4,(w) expUe(w)r') (2.18)35
VA (0, w) (2.12) where
N(.)(rAO)- 112 An(m)W(kA-kgO)dA)exp(9(kA(w)rAO).1, m = g (2.19)n
40 W ((k (w) - ke (&)))dB ) - { 0, m # R
When O=V(w) dA, Equation 2.12 can be written asEquation 2.18 represents the mode isolated Fourier trans-formed signal measured at sensor `B'.
45 Since the temporal frequency re sponseV^(kp(^)dA, _ (2.13) l f
1? 61 Y of the leak source,1?N(w), is a random signal, we can not directly extract useful
AO 1)z time-of-flight information by using Equation 2.14 and 2.18
YnN(m)(r ) An(w)w(kp(w)dA -kq(w)d A )exp( ,^kq (&))r AO) alone. Instead, assuming mode isolated cross -correlated sig-
nals are available at sensor' and `B' positions, we can takeSo advantages of cross-correlation techniques. Given the signals
at sensor position `A' and ` B', the mean mode-isolated, cross-And, if the spatial Fourier transformed window function is correlated signal at sensor and B positions is expressed as:sufficiently wide,
(c1B(k1,k$,O))>_(T1(k1,w)r7B*(k$,w)> (2.20)
N(w))(,-10)- 1rzAP(w) exp(jkP)(0))r A0 (2.14) 55where grepresents the mean value of the signal in the bracket
where
and '*' represents the complex conjugate of a Fourier trans-formed signal. Substituting Equation 2.12 and 2.17 into 2.20,
((k° (o)) - kA (&)))d)d A) 1, n = p (2.15)
f
60 CAB (kA kB ^)) - (2.21)W =
0 , n * P
P(w)1
^ AnBm(^)exp(Okn(w)rno _ 9ka(^)rBO)
r-AOr-BO n m
Equation 2.14 represents the mode isolated Fourier trans- 65 w(kA - kq(w)dA)w"(kB-ke((,)dB)formed signal measured at sensor W. Similarly, for areceived signal at sensor B,
US 7,739,899 B121
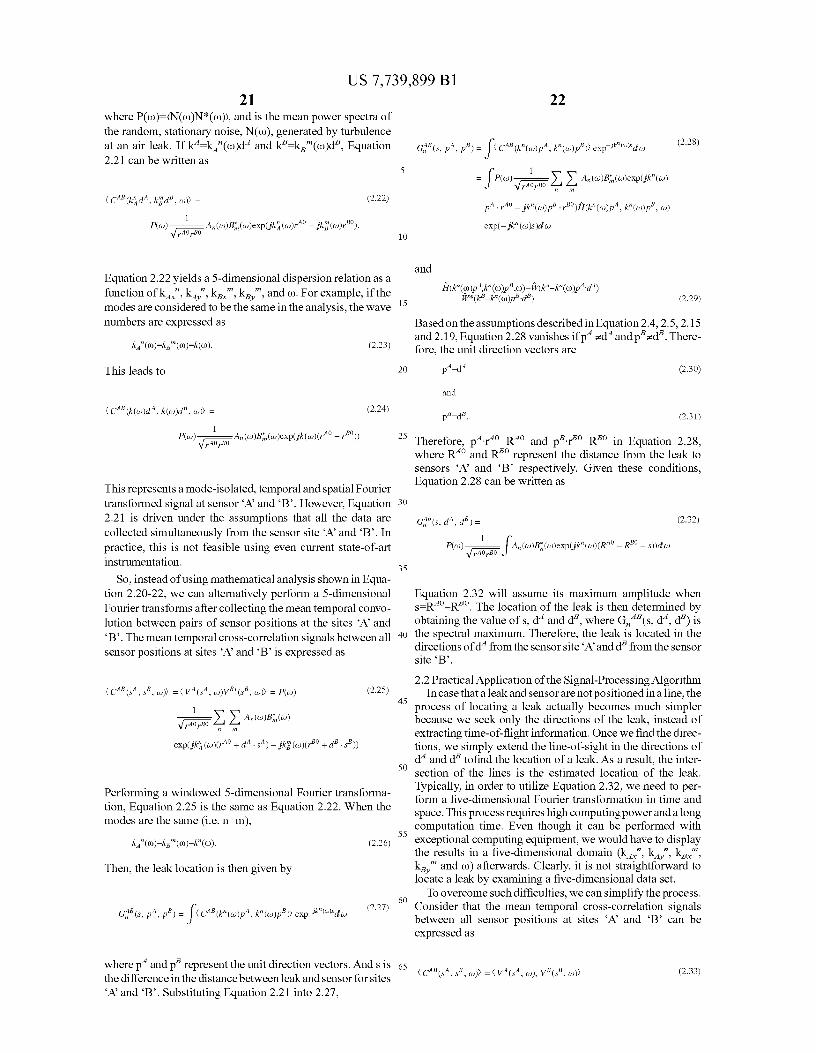
where P(w)-(N(w)N*(w)), and is the mean power spectra ofthe random, stationary noise, N(w), generated by turbulenceat an air leak. If kA=kA"(w)d` and k' k,-(w)e, Equation2.21 can be written as
CAB (k'A , kBde , w)) (2.22)
P(w) 1 A,(w)Bm(w)exp(OkA(w)rAl - 9k8(w)rBO).7r A0rB0
Equation 2.22 yields a 5-dimensional dispersion relation as afunction of k,:, kAy", kB,-, kBy-, and w. For example, if themodes are considered to be the same in the analysis, the wavenumbers are expressed as
kA'(w)=k,,-(w)=k(w). (2.23)
This leads to
CAB (k(w)d A , k(w)de , w)) _ (2.24)
22
Cne s, P A, ( CAB k" (.)P A , k" w e) ex -j0('0d&)
(2.28)( P , P) _ ( ( )P) p
5 1- P((,))^ A,(&))Bm(&))exp(Ok°(^)
rA0rB0
P A . rAO - 9k" ((,)PB
. r B' )
h (k" ((,
)PA ,
V (w)PB , w)
exp(- pk" (w)s)dw
10
and
H(k"(w)PA,k'(w)PB,w)=fV(k4-k"(w)PA'd")
15YV*(1^-k"(w)PB'dB) (2.29)
Based on the assumptions described in Equation 2.4, 2.5, 2.15and 2.19, Equation 2.28 vanishes if p-4 ;-e and pB ;.e. There-fore, the unit direction vectors are
20pA_dA (2.30)
and
pB-dB . (2.31)
P(w1
) A,(w)Bm(w)exp(Ok(w)(rA0 - rB0r
)7)AOrB0
This represents a mode-isolated, temporal and spatial Fouriertransformed signal at sensor `A and `B'. However, Equation2.21 is driven under the assumptions that all the data arecollected simultaneously from the sensor site `A' and `B'. Inpractice, this is not feasible using even current state-of-artinstrumentation.
So, instead of using mathematical analysis shown in Equa-tion 2.20-22, we can alternatively perform a 5-dimensionalFourier transforms after collecting the mean temporal convo-lution between pairs of sensor positions at the sites `A' and`B'. The mean temporal cross-correlation signals between allsensor positions at sites `A' and `B' is expressed as
( CAB (SA, s8 , w)) _ ( V A (sA , .)VB, (sB , w)) = P(w) (2.25)
1^^ An(w)Bm(w)
rA0 r80
exp(9k 'A ((,))(r AO + d A . SA) - 9kB ((,)(,Bo + dB 'se))
Performing a windowed 5-dimensional Fourier transforma-tion, Equation 2.25 is the same as Equation 2.22. When themodes are the same (i.e. n=m),
kA"(w)=k,,-(w)-k (w). (2.26)
Then, the leak location is then given by
Cnes, A e J ( CAB k"((,)P A , k" m e ) ex -,k'(')'dw(2.27)
( P ,P )_ ( ( )P) p
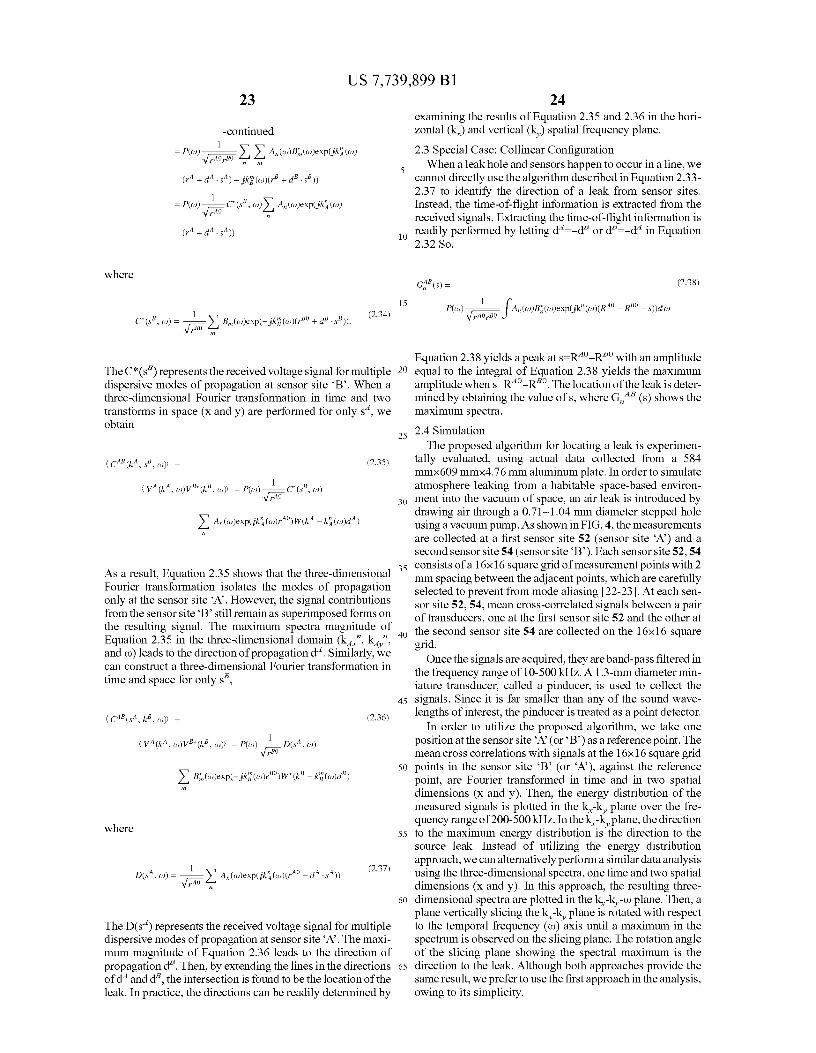
25 Therefore, 13'-r"-RA ' and pB,rao=RBO in Equation 2.28,where RA0 and RB0 represent the distance from the leak tosensors `A' and `B' respectively. Given these conditions,Equation 2.28 can be written as
30
Cne (s, d A , dB ) _ (2.32)
P(w)1
J A,(w)B;,(w)exp(Ok" (w)(RAO - RBO - s))dw
rA0rB0
35
Equation 2.32 will assume its maximum amplitude whens=RAO_RBO The location of the leak is then determined byobtaining the value of s, dA and d8, where G"AB(s, dA , d8) is
40 the spectral maximum. Therefore, the leak is located in thedirections of dA from the sensor site `A' and dB from the sensorsite `B'.
2.2 Practical Application of the Signal-Processing AlgorithmIn case that a leak and sensor are not positioned in a line, the
45 process of locating a leak actually becomes much simplerbecause we seek only the directions of the leak, instead ofextracting time-of-flight information. Once we find the direc-tions, we simply extend the line-of-sight in the directions of
50 dA and dB tofind the location of a leak. As a result, the inter-
section of the lines is the estimated location of the leak.Typically, in order to utilize Equation 2.32, we need to per-form a five-dimensional Fourier transformation in time andspace. This process requires high computing power and a long
55 computation time. Even though it can be performed withexceptional computing equipment, we would have to displaythe results in a five-dimensional domain (kAx", kAy", kBxm,kBym and w) afterwards. Clearly, it is not straightforward tolocate a leak by examining a five-dimensional data set.
To overcome such difficulties, we can simplify the process.6o Consider that the mean temporal cross-correlation signals
between all sensor positions at sites `A' and `B' can beexpressed as
where pA and p8 represent the unit direction vectors. And s is 65 ethe difference in the distance between leak and sensor for sites cAB (s A ,se ,w)>=CvA (sA ,w),v (se ,wp 2.33)
`A and `B'. Substituting Equation 2.21 into 2.27,
US 7,739,899 B124
examining the results of Equation 2.35 and 2.36 in the hori-zontal (k,) and vertical (k,) spatial frequency plane.
2.3 Special Case: Collinear Configuration5 When a leak hole and sensors happen to occur in a line, we
cannot directly use the algorithm described in Equation 2.33-2.37 to identify the direction of a leak from sensor sites.Instead, the time-of-flight information is extracted from thereceived signals. Extracting the time-of-flight information is
to readily performed by letting dA=—da or e —d' in Equation2.32 So,
23
-continued
_ 1— P(m)^' A,(&))Bm(^)expJkn(&))
rAOrB0
(rA+dA SA) - jke (0)(rB+dB.SB))
— P(w) —
C, (SB , &)) Y, A, (w)exp(9kA (w)rA0
(rA + dA . SA))
whereGn8(s) - (2.38)
1
ra01 (2.34) 15
P(w) rAOrao ,^A°(&))B,(&))expJ1e(&))(RAO — R BO — s))d&)
C (Se, Y,u') Bm(&))exp(-9ke (&)) (r80 + dB -sB))
The C* (sa) represents the received voltage signal for multipledispersive modes of propagation at sensor site `B'. When athree-dimensional Fourier transformation in time and twotransforms in space (x and y) are performed for only sA , weobtain
( CAB (k A , SB , .)) o (2.35)
V A (k A , .) VB'(kB , J)) =P()) 1 C'(SB , J)rA0
Y, A (w)exp(OkA(w)rAO)W(kA — kA(&))dA)
As a result, Equation 2.35 shows that the three-dimensionalFourier transformation isolates the modes of propagationonly at the sensor site `A'. However, the signal contributionsfrom the sensor site `B' still remain as superimposed forms onthe resulting signal. The maximum spectra magnitude ofEquation 2.35 in the three-dimensional domain (kAx", kAy",
and w) leads to the direction of propagation e. Similarly, wecan construct a three-dimensional Fourier transformation intime and space for only sa,
( CAB (SA , kB , .)) o (2.36)
( VA (k A,.)VB'(kB, ^)) - P(&)) 1 D(SA,&))
rB0
Y, Bm (.)exp(-9ke (.)r B0 ) W' (kB — ke ((,)dB)
where
D(SA, w)= 1rAO
A (m)exp(pkq(w)(r"o+dA .sA)) 2.37
The D(s-4) represents the received voltage signal for multipledispersive modes of propagation at sensor site `A'. The maxi-mum magnitude of Equation 2.36 leads to the direction ofpropagation e. Then, by extending the lines in the directionsof dA and da, the intersection is found to be the location of theleak. In practice, the directions can be readily determined by
Equation 2.38 yields a peak at s=RA'—Rao with an amplitude20 equal to the integral of Equation 2.38 yields the maximum
amplitude when s=RA0—Rao The location of the leak is deter-mined by obtaining the value of s, where G'Aa (s) shows themaximum spectra.
25 2.4 SimulationThe proposed algorithm for locating a leak is experimen-
tally evaluated, using actual data collected from a 584mmx609 mmx4.76 mm aluminum plate. In order to simulateatmosphere leaking from a habitable space-based environ-
30 ment into the vacuum of space, an air leak is introduced bydrawing air through a 0.71-1.04 mm diameter stepped holeusing a vacuum pump. As shown in FIG. 4, the measurementsare collected at a first sensor site 52 (sensor site `A') and asecond sensor site 54 (sensor site `B'). Each sensor site 52, 54
35 consists of a 16xI6 square grid of measurement points with 2mm spacing between the adjacent points, which are carefullyselected to prevent from mode aliasing [22-23]. At each sen-sor site 52, 54, mean cross-correlated signals between a pairof transducers, one at the first sensor site 52 and the other at
40 the second sensor site 54 are collected on the 16xI6 squaregrid.
Once the signals are acquired, they are band-pass filtered inthe frequency range of 10-500 kHz. A 1.3-mm diameter min-iature transducer, called a pinducer, is used to collect the
45 signals. Since it is far smaller than any of the sound wave-lengths of interest, the pinducer is treated as a point detector.
In order to utilize the proposed algorithm, we take oneposition at the sensor site `A' (or `B') as a reference point. Themean cross correlations with signals at the 16x16 square grid
50 points in the sensor site `B' (or `A'), against the referencepoint, are Fourier transformed in time and in two spatialdimensions (x and y). Then, the energy distribution of themeasured signals is plotted in the kx-ky plane over the fre-quency range of 200-500 kHz. In the kx-ky plane, the direction
55 to the maximum energy distribution is the direction to thesource leak. Instead of utilizing the energy distributionapproach, we can alternatively perform a similar data analysisusing the three-dimensional spectra, one time and two spatialdimensions (x and y). In this approach, the resulting three-
6o dimensional spectra are plotted in the kx-ky-w plane. Then, aplane vertically slicing the kx-ky plane is rotated with respectto the temporal frequency (w) axis until a maximum in thespectrum is observed on the slicing plane. The rotation angleof the slicing plane showing the spectral maximum is the
65 direction to the leak. Although both approaches provide thesame result, we prefer to use the first approach in the analysis,owing to its simplicity.
US 7,739,899 B125
In order to estimate the direction to the leak at the site `B',the cross-correlated signals are obtained at all 16x16 points atthe site `A' while a point at the site `B' is fixed as a referencepoint. Then, its energy distribution is plotted in the in the kxk,plane, and an estimated direction to the leak is found to be134.96° compared with the actual direction of 136.16°. Whenthe same data analysis is performed on the cross-correlatedsignals at all 16x16 points at the site `B' by fixing a referencepoint at the site `A', an estimated direction is found to be—5.57°, compared with the actual angle of —6.15°. FIG. 5illustrates these plots.
The variations between the estimations and actual valuesare within the precision of the method and small enough to benegligible in practice. Once the estimated directions areobtained at sites `A' and `B', we readily find the exact locationof the leak by drawing lines 58, 60 toward the angles at thereference point in the sensor site `A' or `B'. Finally, the inter-section of the lines at point 62 is the estimated location of theleak. The error or distance between the predicted leak loca-tion 62 and the actual leak location 64 is found to be 7.8 mm,which is acceptable.
According to the experimental results, it is reasonable toassume that the leak location algorithm is effective in locatinga leak in a plate-like structure, when the leak is from withinthe vessel to a vacuum outside. In addition, the sensitive andsophisticated algorithm can pinpoint the location of a leakwithin an acceptable experimental uncertainty.
Utilizing the 16x16 array measurements, we determine aminimal measurement grid size needed to accurately locate aleak. The results can be, then, directly implemented in ourproposed array transducer design. We have chosen the mea-surement grid size to be 2x2, 4x4, 8x8, and 16x 16 with 2-mmpoint spacing. As the square grid size is increased, the indi-cation of a leak source becomes clearer and stronger. Forexample, compared with the results for the 2x2 square gridsize, ones for the 16x16 grid size show much stronger indi-cations. In addition, background noise becomes much smalleras the grid size increases from 2x2 to 16x16.
When a 2x2 square grid size is employed to find a leaklocation, it shows two strong indications of a leak source inthe k,-ky plane in opposite directions. The directions to thestrong indications are approximately 9.3' and 169°, which areassumed to be the estimated direction to the leak source atsensor site `A'. We speculate that showing two indications iscaused by aliasing due to undersampling. Neither of the esti-mated directions shows accurate direction to the location ofthe leak, compared with the actual direction to the leak sourceof —6.15°. Based on the results, using the 2x2 grid size causesunder-sampling in signal processing so that it provides com-pletely wrong indications and higher background noise. Thehigh background noise can also increase the error in theestimate. Therefore, a square array of 2x2 elements is notuseful for locating a leak, owing to the seriously reducedelement count in this case.
When we employ 4x4 square array elements, the perfor-mance improves, and only one strong indication and lowbackground noise are observed in the k,-ky plane. The esti-mated direction is found to be approximately 0°, comparedwith the actual direction of —6.18°. We still observe a veryweak indication of the leak source in the opposite direction,which is caused by the reflections from the plate edges. How-ever, the indication is so weak that it can be negligible in theanalysis. If we use 8x8 square array elements, the estimateddirection is found to be approximately —5.38°. This result isvery similar to the estimated direction of —5.57°, obtained byusing 16x16 array elements.
26Based on this analysis, it is reasonable to assume that an
8x8 square array with 2 mm spacing can still provide anacceptable estimate of the location of a leak. In addition,computation burden and the amount of data required are
5 substantially reduced. For our practical device, we thereforeemploy an 8x8 square array of transducer elements in ourproposed array transducer design.
3. DESIGN AND FABRICATION OF Aio PRACTICAL ARRAY SENSOR
A prototype of a two-dimensional PZT (lead zirconatetitanate) array sensor has been designed and fabricated todetect structure-borne noise generated by downstream turbu-
15 lence at an air leak at a remote location. The sensor is stillsmall enough to be permanently attached to the spacecraftand has few enough elements to permit rapid data acquisition.After the signals are acquired, they are utilized in our pro-posed leak location algorithm to find the direction to the leak
20 source. For the fabrication of the proposed array sensor, wehave utilized common PCB (printed circuit board) fabricationtechniques and standard mirco -electronic components. As aresult, the overall design can be simply modified, dependingon the requirements.
25 The fundamental design philosophy of the array sensor isto include all active two-dimensional array elements,preamps, multiplexers, integrated electronics and mechanicalcomponents in a single unit mounted to the circuitboard. FIG.6 shows a schematic diagram of the PZT array sensor 100. To
30 achieve satisfactory performance with both a lower compu-tational burden and a simplified hardware design, we haveexploited the experimental results obtained. We choose,therefore, an 8x8 square array 102 for our reduction to prac-tice of this technique. Such an 8x8 square array 102 with
35 2-mm spacing is shown in FIG. 7. Each element has a diam-eter of 1-mm. We have selected element number 29 as thereference element for the correlations.
The prototype PCB 112 includes all the components,except a PZT disk 116 and computer 118. All of the electrical
40 components are surface mounted type and placed on a 3"x3"PCB 112, and a PZT disk 116 is chosen as an active compo-nent to monitor the structure borne leak noise. The PZT arraysensor 100 includes a 32 channel mux 104 electrically con-nected to a preamp 108 and a second 32 channel mux 106
45 electrically connected to a second preamp 110. Integratedelectronics 114 are also provided on the PCB 112. The choiceof the PZT disk 116 is dictated by the need to have highsensitivity and its resonant frequency. We choose a 30-mm indiameter, 7-mm thick PZT disk, which is the thickest PZT
5o disk with a diameter of 30 mm commercially available on themarket. To provide electrical contract with the plate duringthe experiments, one side of the PZT disk is metalized withSilver. However, there is no metal layer on the other side.Instead, the square array pattern shown in FIG. 8 is fabricated
55 on the backside of the prototype PCB 112, and tightly contactwith the surface of the PZT disk 16.
During the data collection, the metalized side of the PZTdisk 116 is in intimate contact with the plate-like specimen,which itself is electrically grounded. When an element is
6o addressed by a computer 118, the element reports the time-varying elastodynamic field in the PZT disk 116 at the par-ticular element location. The resulting electrical signal iscross-correlated with the signal measured by the referenceelement. FIG. 9 shows a 64-element PZT array sensor proto-
65 type in cross-sectional view during operation. While data isbeing collected, the PZT disk 116 is held in tight contactedwith the plate 120, and mineral oil is used as a coupling
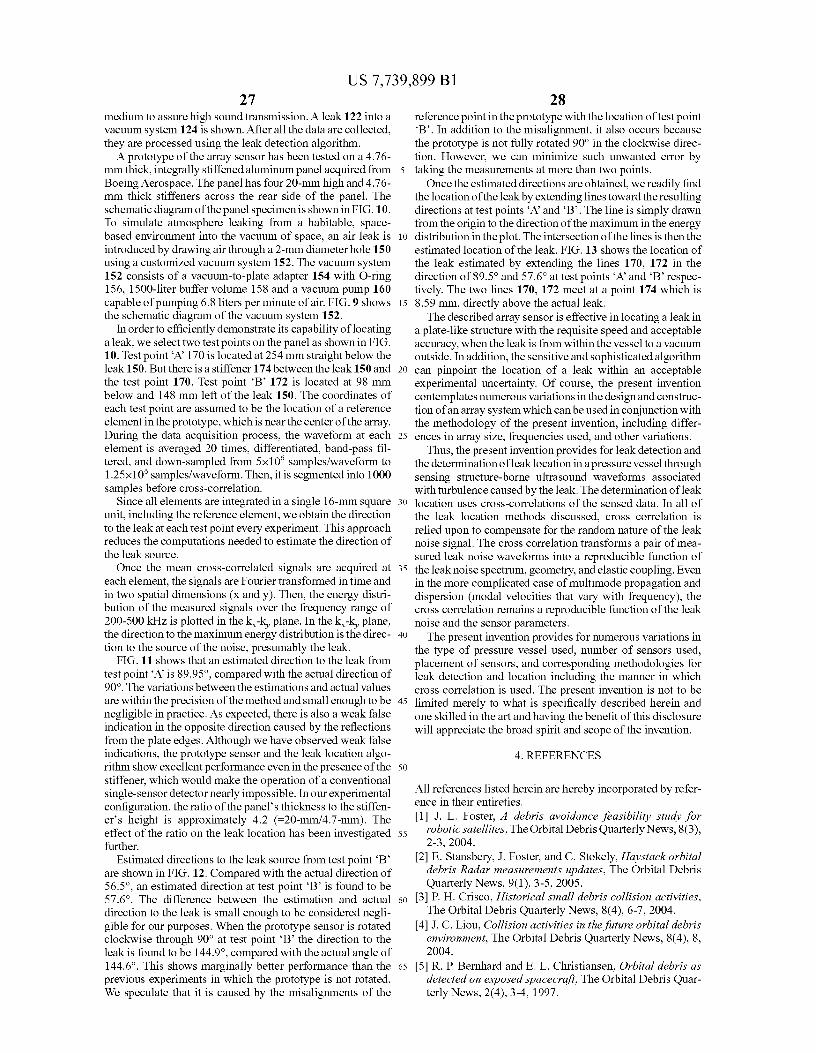
US 7,739,899 B127
28medium to assure high sound transmission. A leak 122 into avacuum system 124 is shown. After all the data are collected,they are processed using the leak detection algorithm.
A prototype of the array sensor has been tested on a 4.76-mm thick, integrally stiffened aluminum panel acquired fromBoeing Aerospace. The panel has four 20-mm high and 4.76-mm thick stiffeners across the rear side of the panel. Theschematic diagram of the panel specimen is shown in FIG. 10.To simulate atmosphere leaking from a habitable, space-based environment into the vacuum of space, an air leak isintroduced by drawing air through a 2-mm diameter hole 150using a customized vacuum system 152. The vacuum system152 consists of a vacuum-to-plate adapter 154 with O-ring156, 1500-liter buffer volume 158 and a vacuum pump 160capable of pumping 6.8 liters per minute of air. FIG. 9 showsthe schematic diagram of the vacuum system 152.
In order to efficiently demonstrate its capability of locatinga leak, we select two test points on the panel as shown in FIG.10. Test point `A' 170 is located at 254 mm straight below theleak 150. But there is a stiffener 174 between the leak 150 andthe test point 170. Test point `B' 172 is located at 98 mmbelow and 148 mm left of the leak 150. The coordinates ofeach test point are assumed to be the location of a referenceelement in the prototype, which is near the center of the array.During the data acquisition process, the waveform at eachelement is averaged 20 times, differentiated, band-pass fil-tered, and down-sampled from 5x10 6 samples/waveform to1.25x106 samples/waveform. Then, it is segmented into 1000samples before cross-correlation.
Since all elements are integrated in a single 16-mm squareunit, including the reference element, we obtain the directionto the leak at each test point every experiment. This approachreduces the computations needed to estimate the direction ofthe leak source.
Once the mean cross-correlated signals are acquired ateach element, the signals are Fourier transformed in time andin two spatial dimensions (x and y). Then, the energy distri-bution of the measured signals over the frequency range of200-500 kHz is plotted in the k,-k, plane. In the k,-k, plane,the direction to the maximum energy distribution is the direc-tion to the source of the noise, presumably the leak.
FIG. 11 shows that an estimated direction to the leak fromtest point `A is 89.95°, compared with the actual direction of90°. The variations between the estimations and actual valuesare within the precision of the method and small enough to benegligible in practice. As expected, there is also a weak falseindication in the opposite direction caused by the reflectionsfrom the plate edges. Although we have observed weak falseindications, the prototype sensor and the leak location algo-rithm show excellent performance even in the presence of thestiffener, which would make the operation of a conventionalsingle-sensor detector nearly impossible. In our experimentalconfiguration, the ratio of the panel's thickness to the stiffen-er's height is approximately 4.2 (=20-mm/4.7-mm). Theeffect of the ratio on the leak location has been investigatedfurther.
Estimated directions to the leak source from test point `B'are shown in FIG. 12. Compared with the actual direction of56.5°, an estimated direction at test point `B' is found to be57.6°. The difference between the estimation and actualdirection to the leak is small enough to be considered negli-gible for our purposes. When the prototype sensor is rotatedclockwise through 90° at test point `B' the direction to theleak is found to be 144.9°, compared with the actual angle of144.6°. This shows marginally better performance than theprevious experiments in which the prototype is not rotated.We speculate that it is caused by the misalignments of the
reference point in the prototype with the location of test point`B'. In addition to the misalignment, it also occurs becausethe prototype is not fully rotated 90° in the clockwise direc-tion. However, we can minimize such unwanted error by
5 taking the measurements at more than two points.Once the estimated directions are obtained, we readily find
the location of the leak by extending lines toward the resultingdirections at test points `A' and '13'. The line is simply drawnfrom the origin to the direction of the maximum in the energy
10 distribution in the plot. The intersection of the lines is then theestimated location of the leak. FIG. 13 shows the location ofthe leak estimated by extending the lines 170, 172 in thedirection of 89.5° and 57.6° at test points `A' and `B' respec-tively. The two lines 170, 172 meet at a point 174 which is
15 8.59 mm, directly above the actual leak.The described array sensor is effective in locating a leak in
a plate-like structure with the requisite speed and acceptableaccuracy, when the leak is from within the vessel to a vacuumoutside. In addition, the sensitive and sophisticated algorithm
20 can pinpoint the location of a leak within an acceptableexperimental uncertainty. Of course, the present inventioncontemplates numerous variations in the design and construc-tion of an array system which can be used in conjunction withthe methodology of the present invention, including differ-
25 ences in array size, frequencies used, and other variations.Thus, the present invention provides for leak detection and
the determination of leak location in a pressure vessel throughsensing structure-borne ultrasound waveforms associatedwith turbulence caused by the leak. The determination of leak
30 location uses cross-correlations of the sensed data. In all ofthe leak location methods discussed, cross correlation isrelied upon to compensate for the random nature of the leaknoise signal. The cross correlation transforms a pair of mea-sured leak noise waveforms into a reproducible function of
35 the leak noise spectrum, geometry, and elastic coupling. Evenin the more complicated case of multimode propagation anddispersion (modal velocities that vary with frequency), thecross correlation remains a reproducible function of the leaknoise and the sensor parameters.
40 The present invention provides for numerous variations inthe type of pressure vessel used, number of sensors used,placement of sensors, and corresponding methodologies forleak detection and location including the manner in whichcross correlation is used. The present invention is not to be
45 limited merely to what is specifically described herein andone skilled in the art and having the benefit of this disclosurewill appreciate the broad spirit and scope of the invention.
4. REFERENCES50
All references listed herein are hereby incorporated by refer-ence in their entireties.[1] J. L. Foster, A debris avoidance feasibility study for
55 robotic satellites, The Orbital Debris Quarterly News, 8(3),2-3,2004.
[2] E. Stansbery, J. Foster, and C. Stokely, Haystack orbitaldebris Radar measurements updates, The Orbital DebrisQuarterly News, 9(1), 3-5, 2005.
60 [3] P. H. Crisco, Historical small debris collision activities,The Orbital Debris Quarterly News, 8(4), 6-7, 2004.
[4] J. C. Liou, Collision activities in the future orbital debrisenvironment, The Orbital Debris Quarterly News, 8(4), 8,2004.
65 [5] R. P. Bernhard and E. L. Christiansen, Orbital debris asdetected on exposed spacecraft, The Orbital Debris Quar-terly News, 2(4), 3-4, 1997.
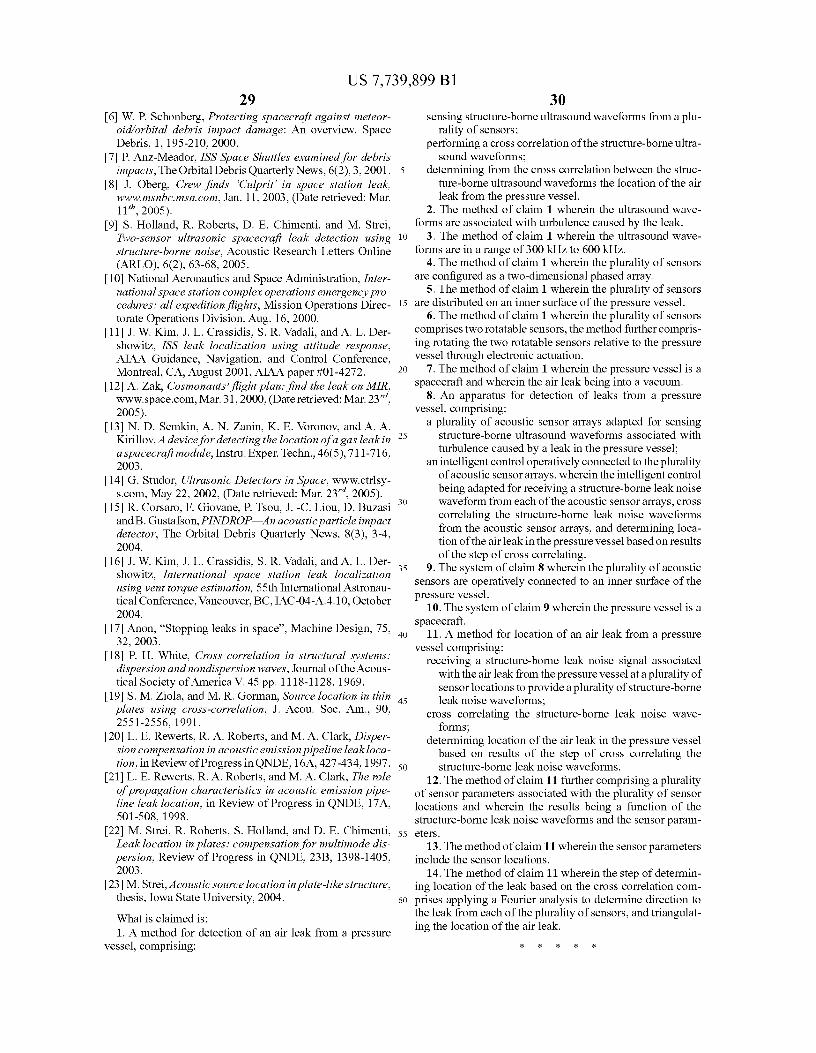
US 7,739,899 B129
[6] W. P. Schonberg, Protecting spacecraft against meteor-oid/orbital debris impact damage: An overview, SpaceDebris, 1, 195-210, 2000.
[7] P. Anz-Meador, ISS Space Shuttles examined for debrisimpacts, The Orbital Debris Quarterly News, 6(2), 3, 2001.
[8] J. Oberg, Crew finds `Culprit' in space station leak,www.msnbc.msn.com, Jan. 11, 2003, (Date retrieved: Mar.11 th , 2005).
[9] S. Holland, R. Roberts, D. E. Chimenti, and M. Strei,Two-sensor ultrasonic spacecraft leak detection usingstructure-borne noise, Acoustic Research Letters Online(ARLO), 6(2), 63-68, 2005.
[10] National Aeronautics and Space Administration, Inter-national space station complex operations emergency pro-cedures: all expedition flights, Mission Operations Direc-torate Operations Division, Aug. 16, 2000.
[II] J. W. Kim, J. L. Crassidis, S. R. Vadali, and A. L. Der-showitz, ISS leak localization using attitude response,AIAA Guidance, Navigation, and Control Conference,Montreal, CA, August 2001, AIAA paper #01-4272.
[12] A. Zak, Cosmonauts' flight plan: find the leak on MIR,www.space.com, Mar. 31,2000, (Date retrieved: Mar. 23d,2005).
[13] N. D. Semkin, A. N. Zanin, K. E. Voronov, and A. A.Kirillov, A device for detecting the location ofa gas leak ina spacecraft module, Instru. Exper. Techn., 46(5), 711-716,2003.
[14] G. Studor, Ultrasonic Detectors in Space, www.ctrlsy-s.com, May 22, 2002, (Date retrieved: Mar. 23''d 2005).
[15] R. Corsaro, F. Giovane, P. Tsou, J. -C. Liou, D. Buzasiand B. Gustafson, PINDROP An acousticparticle impactdetector, The Orbital Debris Quarterly News, 8(3), 3-4,2004.
[16] J. W. Kim, J. L. Crassidis, S. R. Vadali, and A. L. Der-showitz, International space station leak localizationusing vent torque estimation, 55th International Astronau-tical Conference, Vancouver, BC, IAC-04-A.4.10, October2004.
[17] Anon, "Stopping leaks in space", Machine Design, 75,32, 2003.
[18] P. H. White, Cross correlation in structural systems:dispersion and nondispersion waves, Journal of the Acous-tical Society ofAmerica V. 45 pp. 1118-1128, 1969.
[19] S. M. Ziola, and M. R. Gorman, Source location in thinplates using cross-correlation, J. Acou. Soc. Am., 90,2551-2556,1991.
[20] L. E. Rewerts, R. A. Roberts, and M. A. Clark, Disper-sion compensation in acoustic emission pipeline leakloca-tion, in Review of Progress in QNDE, 16A, 427-434,1997.
[21] L. E. Rewerts, R. A. Roberts, and M. A. Clark, The roleof propagation characteristics in acoustic emission pipe-line leak location, in Review of Progress in QNDE, 17A,501-508, 1998.
[22] M. Strei, R. Roberts, S. Holland, and D. E. Chimenti,Leak location in plates: compensation for multimode dis-persion, Review of Progress in QNDE, 2313, 1398-1405,2003.
[23] M. Strei, Acoustic source location in plate-like structure,thesis, Iowa State University, 2004.
What is claimed is:1. A method for detection of an air leak from a pressure
vessel, comprising:
30sensing structure-borne ultrasound waveforms from a plu-
rality of sensors;performing a cross correlation of the structure-borne ultra-
sound waveforms;5 determining from the cross correlation between the struc-
ture-borne ultrasound waveforms the location of the airleak from the pressure vessel.
2. The method of claim 1 wherein the ultrasound wave-forms are associated with turbulence caused by the leak.
10 3. The method of claim 1 wherein the ultrasound wave-forms are in a range of 300 kHz to 600 kHz.
4. The method of claim 1 wherein the plurality of sensorsare configured as a two-dimensional phased array.
5. The method of claim 1 wherein the plurality of sensors15 are distributed on an inner surface of the pressure vessel.
6. The method of claim 1 wherein the plurality of sensorscomprises two rotatable sensors, the method further compris-ing rotating the two rotatable sensors relative to the pressurevessel through electronic actuation.
20 7. The method of claim 1 wherein the pressure vessel is aspacecraft and wherein the air leak being into a vacuum.
8. An apparatus for detection of leaks from a pressurevessel, comprising:
a plurality of acoustic sensor arrays adapted for sensing25 structure-borne ultrasound waveforms associated with
turbulence caused by a leak in the pressure vessel;an intelligent control operatively connected to the plurality
of acoustic sensor arrays, wherein the intelligent controlbeing adapted for receiving a structure-borne leak noise
30 waveform from each of the acoustic sensor arrays, crosscorrelating the structure-borne leak noise waveformsfrom the acoustic sensor arrays, and determining loca-tion of the air leak in the pressure vessel based on resultsof the step of cross correlating.
35 9. The system of claim 8 wherein the plurality of acousticsensors are operatively connected to an inner surface of thepressure vessel.
10. The system of claim 9 wherein the pressure vessel is aspacecraft.
40 11. A method for location of an air leak from a pressurevessel comprising:
receiving a structure-borne leak noise signal associatedwith the air leak from the pressure vessel at a plurality ofsensor locations to provide a plurality of structure-borne
45 leak noise waveforms;cross correlating the structure-borne leak noise wave-
forms;determining location of the air leak in the pressure vessel
based on results of the step of cross correlating the50 structure-borne leak noise waveforms.
12. The method of claim 11 further comprising a pluralityof sensor parameters associated with the plurality of sensorlocations and wherein the results being a function of thestructure-borne leak noise waveforms and the sensor param-
55 eters.13. The method of claim 11 wherein the sensor parameters
include the sensor locations.14. The method of claim 11 wherein the step of determin-
ing location of the leak based on the cross correlation com-60 prises applying a Fourier analysis to determine direction to
the leak from each of the plurality of sensors, and triangulat-ing the location of the air leak.


![United States Patent [19] [11] Patent Number: 6,157,815](https://img.pdfslide.us/doc/110x75/62416bdfa2fd610df03a51a4/united-states-patent-19-11-patent-number-6157815.jpg)


![US006048508A United States Patent [19] [11] Patent Number](https://img.pdfslide.us/doc/110x75/620734fe49d709492c2f0184/us006048508a-united-states-patent-19-11-patent-number.jpg)
![USOOS874439A United States Patent [19] [11] Patent Number](https://img.pdfslide.us/doc/110x75/61cbc75a3684732fd2471a2e/usoos874439a-united-states-patent-19-11-patent-number-.jpg)