Embed Size (px)
Citation preview

United StatesDepartmentof Agriculture
Forest Service
Rocky MountainResearch Station
Research PaperRMRS-RP-20
February 2000
Stream ChannelResponses to StreamflowDiversion on SmallStreams of the SnakeRiver Drainage, IdahoCarolyn C. BohnJohn G. King

Rocky Mountain Research Station324 25th Street
Ogden, UT 84401
The Authors ____________________Carolyn C. Bohn is a Hydrologist on the Aquatics/Watershed Research Work Unit, Boise, ID. She receiveda B.A. degree in zoology from the University of Washing-ton and an M.S. degree in rangeland watershed manage-ment from Oregon State University. She joined the Wa-tershed Research Work Unit in 1988, supporting studiesof logging effects on sediment production, riverbed re-covery from sedimentation, and riparian ground water.
The use of trade or firm names in this publication is for reader information and does notimply endorsement by the U.S. Department of Agriculture or any product or service
Abstract __________________________________________Bohn, Carolyn C.; King, John G. 2000. Stream channel responses to streamflow diversion on
small streams of the Snake River drainage, Idaho. Res. Pap. RMRS-RP-20. Ogden, UT: U.S.Department of Agriculture, Forest Service, Rocky Mountain Research Station. 19 p.
The effects on channels of small, low-head seasonal water diversions in the Snake River drainagewere investigated. Channels below small diversions were compared to the channels immediatelyabove the same diversions to determine if differences in flow conveyance, substrate sediment sizedistribution, or streamside vegetation density were present. Estimates of flow conveyance were greaterabove the diversions, as measured by the area between the edges of vegetation on both banks, andby frequent-flow indicators, which generally approximated bankfull stage. No significant difference insubstrate particle size or in channel roughness was found between channels above and belowdiversions. Although use histories of the diversions were not available, limited observations andconversations with users suggest that many of the diversion structures did not substantially divert highspringtime flows so that passage of channel-forming flows probably occurred. Some diversionstructures apparently divert or trap a portion of the bedload. Stem diameters of vegetation 6 to 48 inchesabove the ground were significantly larger above the diversions. Tests of stem densities were notsignificant. Stratification by substrate, season and size of diversion, community type, and source ofsummer water may be necessary to properly evaluate the effects of small diversions on vegetation stemdensity and vigor. The elevation of the edge of vegetation appears to be a viable alternative to frequentflow or bankfull indicators for estimating flow conveyance. It also addresses the question of vegetativeencroachment into the channel. Use of the edge of vegetation as a channel feature for flow estimatesmerits further testing. It appears that the operation of the small forest stream diversions studied has notsubstantially altered most of the parameters studied. Past hydrographs and historical hydrologic data,however, are needed to fully evaluate the channel and vegetation responses.
Keywords: diversions, flow indicators, Snake River basin, channel effects
John G. King is a Research Hydrologist on the Aquatics/Watershed Research Work Unit, Boise, ID. He receivedan undergraduate degree in forest resources and anM.S. degree in forest hydrology from the University ofMinnesota, and a ph.D. from the University of Idaho inforest hydrology. His research has focused on sedimen-tation and hydrologic responses to various types of landmanagement activities, and interactions between sub-strate characteristics and the redd environment for sev-eral salmonid species.

1USDA Forest Service Res. Pap. RMRS-RP-20. 2000
Abstract—The effects on channels of small, low-head seasonalwater diversions in the Snake River drainage were investigated.Channels below small diversions were compared to the channelsimmediately above the same diversions to determine if differencesin flow conveyance, substrate sediment size distribution, or stream-side vegetation density were present. Estimates of flow conveyancewere greater above the diversions, as measured by the area betweenthe edges of vegetation on both banks, and by frequent-flow indica-tors, which generally approximated bankfull stage. No significantdifference in substrate particle size or in channel roughness wasfound between channels above and below diversions. Although usehistories of the diversions were not available, limited observationsand conversations with users suggest that many of the diversionstructures did not substantially divert high springtime flows so thatpassage of channel-forming flows probably occurred. Some diver-sion structures apparently divert or trap a portion of the bedload.Stem diameters of vegetation 6 to 48 inches above the ground weresignificantly larger above the diversions. Tests of stem densitieswere not significant. Stratification by substrate, season and size ofdiversion, community type, and source of summer water may benecessary to properly evaluate the effects of small diversions onvegetation stem density and vigor. The elevation of the edge ofvegetation appears to be a viable alternative to frequent flow orbankfull indicators for estimating flow conveyance. It also ad-dresses the question of vegetative encroachment into the channel.Use of the edge of vegetation as a channel feature for flow estimatesmerits further testing. It appears that the operation of the smallforest stream diversions studied has not substantially altered mostof the parameters studied. Past hydrographs and historical hydro-logic data, however, are needed to fully evaluate the channel andvegetation responses.
Introduction ____________________Alluvial channels form and change in response to
the streamflow and sediment they convey (Leopold1994; Leopold and others 1964; Schumm 1977). Chan-nel adjustments are usually represented by changes inmeasurable indices such as channel width, depth,
slope, and roughness, and are believed to result froma disturbance in the balance of streamflow energy andsediment transport. It has been suggested that reduc-ing streamflow without reducing sediment load willnecessitate sediment deposition below the point offlow reduction. It is further hypothesized that vegeta-tion can then establish on previously inundated orperiodically scoured surfaces, increasing the channelbed friction, and thus facilitating sediment depositionand reducing channel size. These channel adjust-ments may affect the channel’s ability to convey therange of flows carried by the channel before flowreductions. Since aquatic and riparian life depends onthe patterns of sediment accumulation, channel geom-etry, and flow regimes, the biotic component of thestream system may also be impacted by altered flowlevels. Downstream responses to large impoundmentsrange from reduced channel capacity and sedimenta-tion to channel degradation (Collier and others 1996;Gregory and Park 1974; Petts 1984; Petts and Green-wood 1985; Williams and Wolman 1984). The conse-quences of small, low-head seasonal water diversionsremain poorly understood.
Objectives _____________________The objectives of this study were to determine if
changes in flow conveyance, substrate sediment sizedistribution, or streamside vegetation density occurfrom small, low-head water withdrawal from foreststreams in the Snake River drainage. Previous studiesof small diversions in Wyoming and Colorado (Chavez1996; Ryan 1997; Wesche 1991) found some changes inchannel dimensions when as much as 40 to 50 percentof flow was diverted over long periods. Most of thestreams examined in this study have a small portionof the annual hydrograph diverted all or part of theyear, usually with minimal instream structures andlittle or no impoundment. This is in contrast to damsand large diversions that alter peak flows signifi-cantly. Because channel width and depth may varynaturally within small distances, flow conveyance
Stream Channel Responsesto Streamflow Diversion onSmall Streams of the SnakeRiver Drainage, IdahoCarolyn C. BohnJohn G. King

2 USDA Forest Service Res. Pap. RMRS-RP-20. 2000
was selected as a parameter for this study; flowconveyance is independent of natural variation inchannel dimensions.
Literature Review _______________Recent controversies over instream flows have re-
sulted in a few studies of water diversions on low-orderstreams. In 1988 and 1989, the USDA Forest Servicestudied stream channels above and below water diver-sions on 20 streams in Colorado (Chavez 1996). Physi-cal characteristics such as pebble size, bankfull area,width and depth, streamflows, and channel gradientswere measured above and below the diversions. Be-tween 72 percent and 91 percent of the streams showeddecreases in all parameters below the diversions,supporting the theory of channel changes in responseto water diversion.
Ryan (1997) investigated several subalpine chan-nels with diversions in the Colorado Rocky Mountains.Approximately 40 to 60 percent of the annual wateryield had been diverted from these streams for anumber of decades, although high flows of a 5 to50 year return frequency may have been allowed topass. Ryan examined a number of channel attributesof diverted and undiverted stream reaches withoutdetecting consistent changes. At the subreach chan-nel-unit scale, she was able to detect either the forma-tion of a low surface or a line of vegetation, coincidentwith the new 1.5 year flow level within the formercutbanks of diverted streams. To Ryan, this implied aloss of “functioning width” where former channel bot-toms were no longer inundated regularly. Thesechanges were limited to wider, unconstrained, pool-riffle channels with gravel bars. Narrow, steep step-pool channels were not measurably affected.
A study of channel geometry in Wyoming indicatedthat depth, area, and conveyance capacity were re-duced below water diversions in channels with gradi-ents less than 1.5 percent (Wesche 1991). Channelwidth and mean depth decreased on these channels,which reduced conveyance capacity from an average of270 c.f.s. to an average of 123 c.f.s. Approximately 46percent of the flow had been diverted for an average of66 years from at least six of the 20 low-gradientchannels studied. The age of the diversion was not asignificant factor, perhaps because all but one diver-sion were over 50 years old. Channel geometry and bedcomposition of the seven streams with gradients greaterthan 1.5 percent did not differ significantly above andbelow the diversions after more than 35 years of anestimated average flow reduction of 70 percent.
Some fluvial geomorphologists hypothesize that re-ducing streamflow without reducing sediment loadwill induce channel changes through sediment deposi-tion below the point of flow reduction. This hypothesis
derives from Wolman and Miller’s work (1960) linkingflood frequency and sediment transport rate. Theyproposed using the product of the frequency of flowevents and the sediment transport rate as a measure-ment of the amount of geomorphic work performed byevents of different frequencies and magnitudes. Theiranalysis of selected rivers showed that most of thelong-term sediment loads were carried by moderate,but relatively frequent, events. These moderate eventsoccur about every 1 to 2 years, and often approximatethe bankfull stage. Larger, more powerful events movesediment at a higher rate, but occur less frequently.Over time, the sum of the sediment moved by themoderate flows outweighed the amount moved bylarger events, and thus is thought to play a moresignificant role in shaping the channel. Wolman andMiller (1960) referred to these moderate flows as“effective” discharges. The concept of effective dis-charge has become a fundamental model of geomor-phic work.
The frequency of effective discharge was corrobo-rated by Andrews (1980), who compared the effectivedischarge to the bankfull discharge (the dischargethat filled the channel to the level of the floodplain) at15 gaging stations in the Yampa River basin inColorado and Wyoming. The recurrence intervals ofthe effective discharges were between 1.18 and 3.26years, and nearly equaled the bankfull discharges atall gaging stations. Andrews and Nankervis (1995)also found agreement between the field-determinedbankfull discharge and the computed effective dis-charge for 17 alluvial gravel-bed streams throughoutthe Rocky Mountain region. Eighty percent of the longterm mean bedload was transported by dischargesranging between 0.8 and 1.6 times the bankfull dis-charges. By measuring bedload over a 6 year period,Carling (1988) also found that the “dominant dis-charge,” or “that discharge which transports most bedsediment in a stream that is close to steady-stateconditions,” was close to bankfull discharge. Overbankflows were important in initiating channel change.Carling emphasized that his findings did not apply to“streams that are unable to adjust their form freely orare out of equilibrium.” Most recently, Whiting andothers (1997) confirmed that the effective dischargefor headwater streams in central and northern Idahoaverages about 80 percent of bankfull discharge andhas a recurrence interval of 1.5 years. Flows lowerthan 80 percent of bankfull accounted for very little ofthe sediment movement on these Idaho streams. Themodest magnitude of the effective discharge suggeststhat even small diversions could reduce streamflowsufficiently to alter channel form.
Sediment may also be shunted out of the stream bysome diversion structures. Johnson and Smith(1979) estimated that 15 irrigation ditches in a small
3USDA Forest Service Res. Pap. RMRS-RP-20. 2000
irrigated valley in southwestern Idaho diverted asmuch as 560 t (metric ton) of suspended sediment fromthe main streams each year—about 17 percent of thetotal sediment load of the monitored streams.
The connection between streamflow and streamsidevegetation communities along low-order streams hasalso raised questions about the effects of divertingstreamflow. Harris and others (1987) reported in-creased shrub cover and decreased vegetated channelwidth along some diverted streams in the SierraNevada, CA. Such vegetation encroachment couldincrease channel roughness, inducing sedimentation.While the direct effect of roughness due to vegetationon flow velocity is poorly understood, there is evidenceof sedimentation due to in-channel vegetation.
King (1961) reported aggradation accompanied bypioneering vegetation within a Wyoming channel. Thestream reach he studied was below the confluence ofan ephemeral stream that had been dammed. Hesuggested that reduced inflow from the tributary causedsedimentation that was followed by vegetation pio-neering on the deposition, and that the vegetationthen induced further sedimentation. Flume experi-ments simulating herbaceous vegetation in a low-gradient stream support entrapment of fine sediment(median grain size 0.09 mm) by some vegetation (Abtand others 1994; Clary and others 1996). They foundthat, for their test conditions, vegetation significantlyincreased sediment deposition and retained 30 to 70percent of deposited sediment during flushing flows.The length of the vegetated strip and the height of thevegetation were important variables.
Masterman and Thorne (1992) developed a theoreti-cal procedure to predict the effect of bank vegetationon channel capacity. In their analysis, flexible, 0.8 mhigh plants reduced channel discharge capacity morethan 5 percent in channels with width-depth ratiosless than 9. Channels with width-depth ratios lessthan 16 may also be significantly affected.
Not all research supports the encroachment of veg-etation into channels carrying reduced streamflows.Stromberg and Patten (1990) reported a strong posi-tive relationship between tree growth and streamflowvolume (or stream stage) for riparian species in theeastern Sierra Nevada, CA. In Wesche’s 1991 study ofsmall, low-gradient streams in Wyoming, about half ofthe 20 streams examined showed no change in thecanopy, shrub, or grass densities below the diversions.Of the streams that appeared to respond vegetativelyto reduced flows, approximately equal numbers showedincreases and decreases in the canopy and shrubdensities. The density of grass decreased at six streams,but increased at only two streams. Plant densitydecreased most often in low-gradient channels wherethe vegetated area increased due to encroachment.The effects of water diversion on the width of the
riparian corridor were modeled on small streams inthe arid eastern Sierra of California (Taylor 1982).Water diversion in this study apparently createddrought stress; diverting 25 percent of the flow signifi-cantly decreased the extent of riparian vegetation. Fordiversions greater than 25 percent of the flow, the lossof vegetation was related to the amount of waterdiverted. Although the composition of the vegetationcommunities were not measured or modeled, Taylorsuggested that because streams with larger flow ratessupport more complex vegetation communities,streams experiencing reduced flows would lose veg-etative complexity.
Plant water stress in response to water diversionwas also studied by Smith and others (1991) at twosites in the eastern Sierra Nevada. Water stress indi-cators were measured in a high runoff year and a lowrunoff year. About 9 to 33 percent of the streamflowwas diverted at one site, and 70 to 98 percent wasdiverted at a second site. Their data suggested thatsoil water at sites with high diversion rates was notsufficient to meet peak evaporative needs late insummer.
Leighton and Risser (1989) developed a vegetationmodel that indicated little physiological plant stressoccurred until a significant reduction in streamflowwas achieved. Young plants were the most vulnerable.Isotope analysis of tree xylem water suggested a shiftin water source from soil water in May, to surfacewater in July, to ground water in September.
Perhaps the literature addressing riparian plantresponses to reduced streamflow is best summarizedby Harris and others (1987), whose report on plantcommunities along diverted streams stated that“…riparian communities in the Sierra Nevada re-spond in an individualistic manner to hydroelectricdiversions. This could be true in other mountainousregions of the western USA as well.”
Site Selection and SamplingDesign ________________________
The diversion sites selected for this study are on low-order forest streams on public land in the Snake Riverdrainage (fig. 1). Most are located throughout south-ern and central Idaho, but four are in eastern Oregonand one is in western Wyoming. A list of potentialstudy sites was initially developed by asking ForestService and Bureau of Land Management hydrolo-gists for locations of diversions on public land withflows low enough to wade in summer, channels undis-turbed by channelization, riprap, or severe grazing,and without flow regulation by upstream reservoirs ormajor diversions. We eliminated candidates withclearly different stream types above and below thepoint of diversions to accomodate paired studies (above

4 USDA Forest Service Res. Pap. RMRS-RP-20. 2000
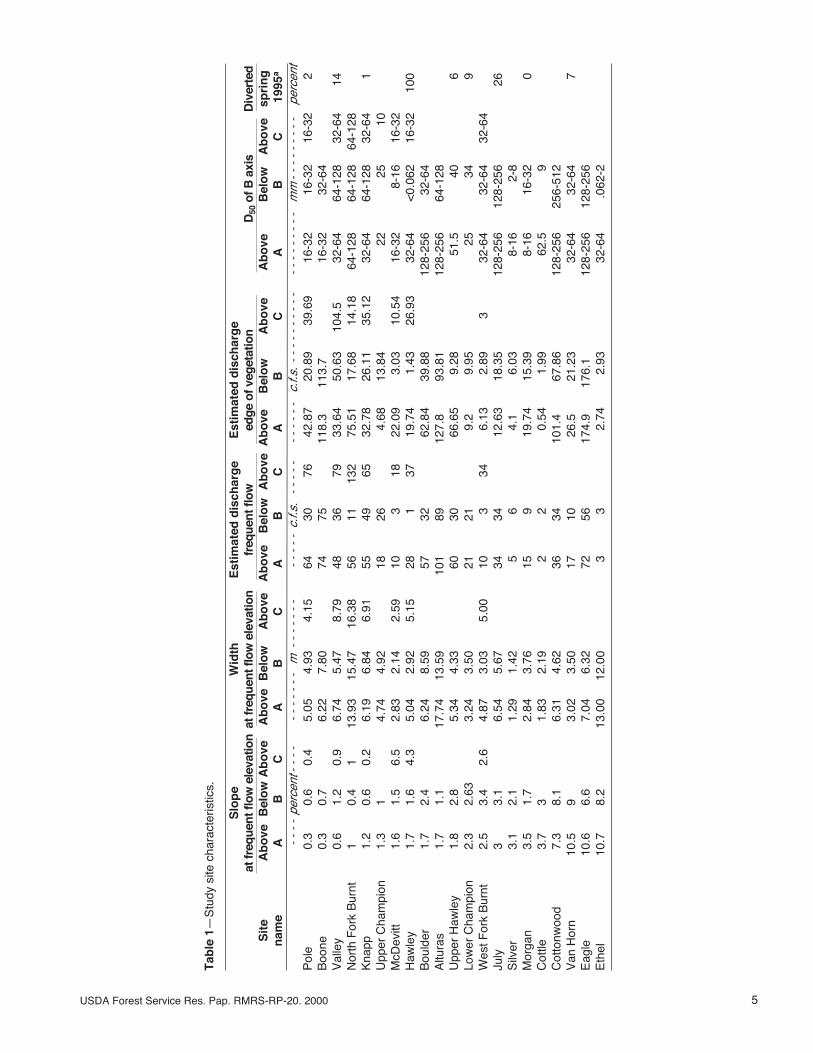
versus below). Because diversions are often located ata break in stream gradient, this was a difficult crite-rion to satisfy, but variablity between pairs was mini-mal (table 1). Other candidate diversions were addedfrom lists of water rights and by chance discovery.Each candidate was evaluated by field inspection,resulting in the selection of 21 sites on low-order,snowmelt-driven forest streams, with gradients rang-ing between 0.3 percent and 10.7 percent, and bankfullflows ranging between about 2 c.f.s. and 101 c.f.s.(table 1). Seventeen sites were initially sampled in1993; an additional four sites were located and sampledin 1994.
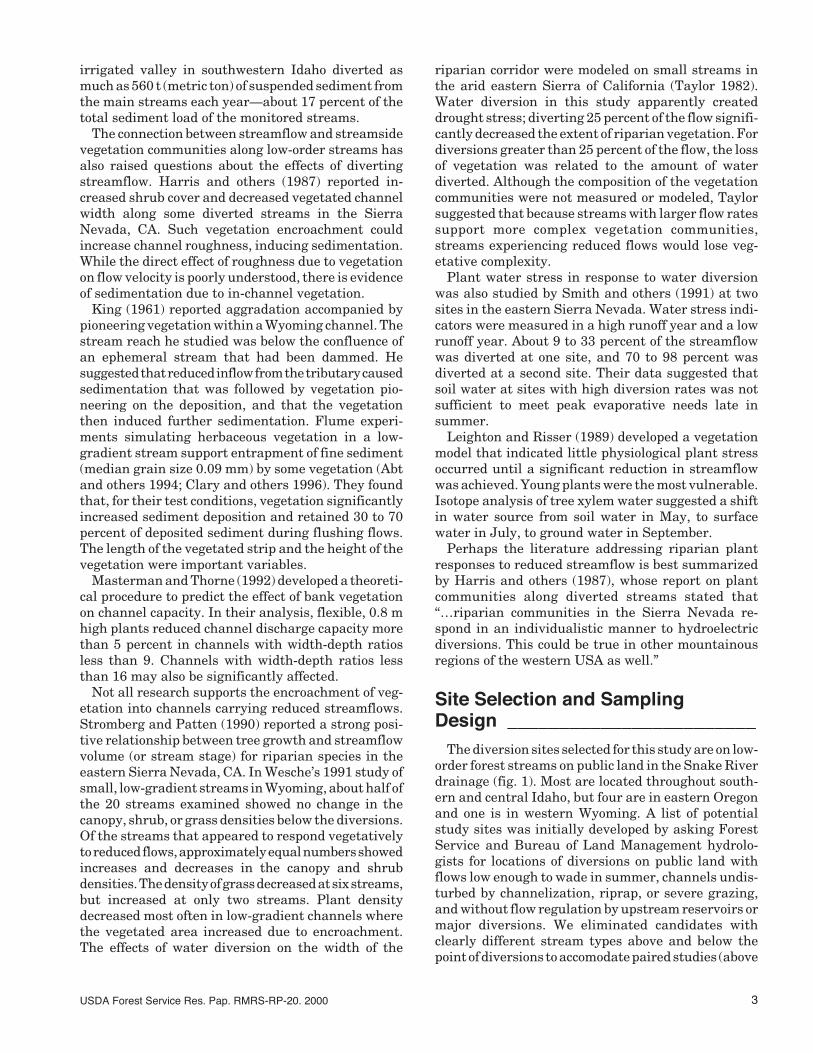
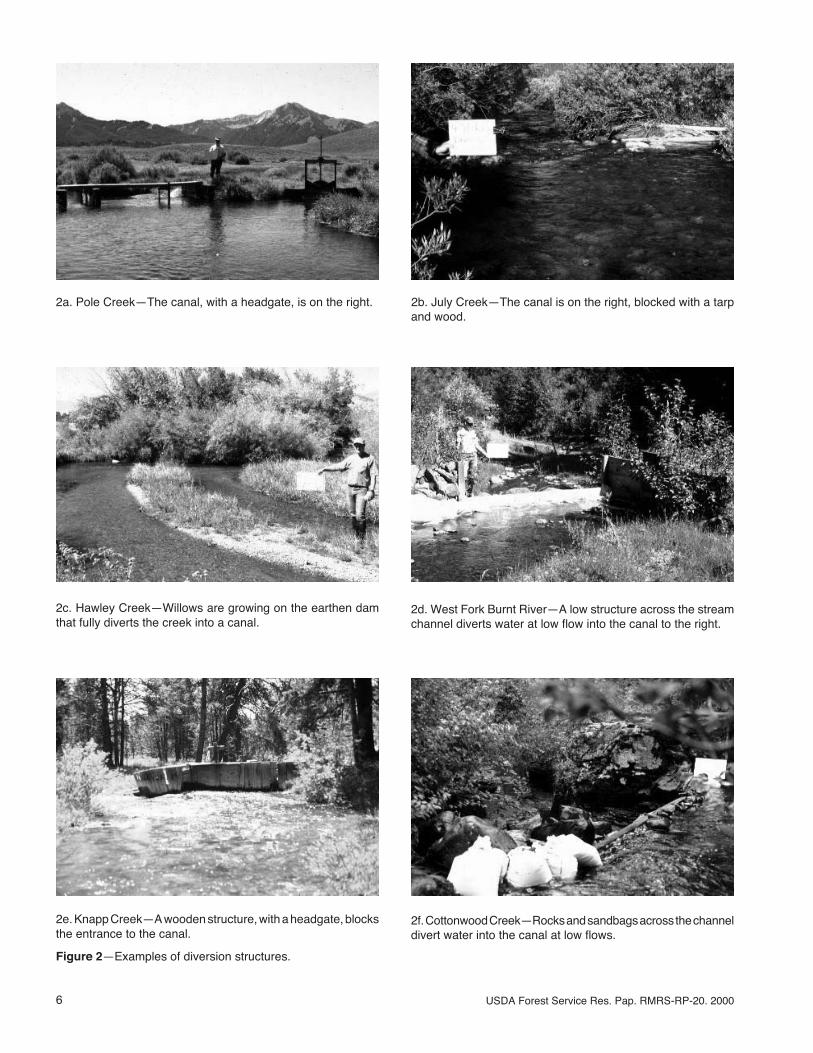
Most diversions were low structures of wood, con-crete, or rock and tarps (fig. 2). Some had headgatesand others appeared to be reconstructed each spring.Rarely, small earthen dams that captured essentiallyall flow were found. Hydrologic records were not avail-able for any of the study sites, but observations, briefconversations with a few irrigators, and some mea-surements in spring 1995 suggest a wide variation inamount and period of diversion. Although the waterrights associated with many of the diversions were
located, the histories of actual use could not be deter-mined. A few of the water rights dated back as far as1876 or as recent as the 1960’s and 1970’s, but mostoriginated between 1900 and 1935. The exact site ofthe older diversions may have changed, and some usemay have been discontinuous, depending on culturaland climatic conditions. Most structures appeared topass spring snowmelt flows of bankfull and higher,and probably diverted only a portion of summer flows.Some appeared to divert flow throughout the year.
Each stream site was divided at the diversion intoabove “A” and below “B” stream reaches (fig. 3). Thistype of reach pairing was chosen because local varia-tions could distort comparisons between groups ofdiverted streams and groups of free-flowing streams.In addition, a third stream reach, designated “C,” wasestablished upstream of “A” at seven sites to deter-mine the relevance of spatial variability of the streamcharacteristics. All “C” data were collected in 1994,while the “A” and “B” data from the same sites weregathered in 1993. Thus, some comparisions between“A” and “C” may be confounded by spring flows ofdiffering magnitude. Within each reach, data werecollected along cross-stream transects with end pointsstaked well above the bank of the active channel, andusually at some topographical break. The transectswere spaced two stream widths apart, beginning asclose to the diversion as possible while still avoidingdiversion influences such as ponding above or scourholes below. Most reaches had five transects; sitessurveyed in 1994 had three transects, and occasion-ally, a 1993 site changed stream type before fivetransects spaced properly were staked, and so fewertransects were surveyed. Data were gathered on chan-nel geometry and bed-surface particle-size distribu-tion at all the transects. Flow discharge at time ofsurvey (low flow), channel gradient, and vegetationdensity and stem size data were collected from the firstand last transects of each reach.
In addition to the extensive sampling in the sum-mers of 1993 and 1994, flow and sediment dischargewere sampled at accessible sites during the 1995spring runoff. Discharge, gradient, bedload, and sus-pended sediment samples were collected from 10 sitesduring spring 1995, and pebble counts were made inthe summer after the flow had receded.
Methods _______________________
Flow Conveyance
Many diversion structures are placed in locationsassociated with change in the channel, such as achange in the slope or a change from confining valleywalls to a broader valley floor. Although sites for thisstudy were selected to minimize the effects of placing
Snake River
Boise
Figure 1—Location of diversion study sites.
5USDA Forest Service Res. Pap. RMRS-RP-20. 2000
Tab
le 1
—S
tudy
site
cha
ract
eris
tics.
Slo
pe
Wid
thE
stim
ated
dis
char
ge
Est
imat
ed d
isch
arg
eat
freq
uent
flow
ele
vatio
nat
freq
uent
flow
ele
vatio
nfr
eque
nt fl
owed
ge o
f veg
etat
ion
D50
of B
axi
sD
iver
ted
Sit
eA
bo
veB
elo
wA
bo
veA
bo
veB
elo
wA
bo
veA
bo
veB
elo
wA
bo
veA
bo
veB
elo
wA
bo
veA
bo
veB
elo
wA
bo
vesp
rin
gn
ame
AB
CA
BC
AB
CA
BC
AB
C 1
995a
- - -
- pe
rcen
t- -
- -
- - -
- - -
- m
- - -
- - -
- - -
- - -
c.f.
s.- -
- - -
- -
- - -
- c.
f.s. -
- - -
- - -
- - -
- -
- - -
- - -
- m
m- -
- - -
- - -
- pe
rcen
tP
ole
0.3
0.6
0.4
5.05
4.93
4.15
6430
7642
.87
20.8
939
.69
16-3
216
-32
16-3
22
Boo
ne0.
30.
76.
227.
8074
7511
8.3
113.
716
-32
32-6
4V
alle
y0.
61.
20.
96.
745.
478.
7948
3679
33.6
450
.63
104.
532
-64
64-1
2832
-64
14N
orth
For
k B
urnt
10.
41
13.9
315
.47
16.3
856
1113
275
.51
17.6
814
.18
64-1
2864
-128
64-1
28K
napp
1.2
0.6
0.2
6.19
6.84
6.91
5549
6532
.78
26.1
135
.12
32-6
464
-128
32-6
41
Upp
er C
ham
pion
1.3
14.
744.
9218
264.
6813
.84
2225
10M
cDev
itt1.
61.
56.
52.
832.
142.
5910
318
22.0
93.
0310
.54
16-3
28-
1616
-32
Haw
ley
1.7
1.6
4.3
5.04
2.92
5.15
281
3719
.74
1.43
26.9
332
-64
<0.
062
16-3
210
0B
ould
er1.
72.
46.
248.
5957
3262
.84
39.8
812
8-25
632
-64
Altu
ras
1.7
1.1
17.7
413
.59
101
8912
7.8
93.8
112
8-25
664
-128
Upp
er H
awle
y1.
82.
85.
344.
3360
3066
.65
9.28
51.5
406
Low
er C
ham
pion
2.3
2.63
3.24
3.50
2121
9.2
9.95
2534
9W
est F
ork
Bur
nt2.
53.
42.
64.
873.
035.
0010
334
6.13
2.89
332
-64
32-6
432
-64
July
33.
16.
545.
6734
3412
.63
18.3
512
8-25
612
8-25
626
Silv
er3.
12.
11.
291.
425
64.
16.
038-
162-
8M
orga
n3.
51.
72.
843.
7615
919
.74
15.3
98-
1616
-32
0C
ottle
3.7
31.
832.
192
20.
541.
9962
.59
Cot
tonw
ood
7.3
8.1
6.31
4.62
3634
101.
467
.86
128-
256
256-
512
Van
Hor
n10
.59
3.02
3.50
1710
26.5
21.2
332
-64
32-6
47
Eag
le10
.66.
67.
046.
3272
5617
4.9
176.
112
8-25
612
8-25
6E
thel
10.7
8.2
13.0
012
.00
33
2.74
2.93
32-6
4.0
62-2
6 USDA Forest Service Res. Pap. RMRS-RP-20. 2000
Figure 2—Examples of diversion structures.
2a. Pole Creek—The canal, with a headgate, is on the right. 2b. July Creek—The canal is on the right, blocked with a tarpand wood.
2c. Hawley Creek—Willows are growing on the earthen damthat fully diverts the creek into a canal.
2d. West Fork Burnt River—A low structure across the streamchannel diverts water at low flow into the canal to the right.
2e. Knapp Creek—A wooden structure, with a headgate, blocksthe entrance to the canal.
2f. Cottonwood Creek—Rocks and sandbags across the channeldivert water into the canal at low flows.

7USDA Forest Service Res. Pap. RMRS-RP-20. 2000
diversions at breaks in channel gradient or type,channel characteristics such as width and depth maynot always be directly comparable above and below thepoint of diversion. The conveyance capacity of streamchannels should remain constant over short distancesbecause the volume of water that must be conveyedremains relatively constant. Because a change in con-veyance capacity is a good indication of channelchanges, conveyance capacity was selected as themain test criterion. If the flow is reduced and sedimentis deposited, channel response should be detectable bycomparing the conveyance capacity in the undisturbedchannel above the point of diversion to the conveyancecapacity below the diversion.
Channel gradients were determined from the thal-weg distance between the first and last transects ofeach sample area. Elevation changes were measuredwith a surveyor’s level and rod at the elevation of afeature approximating bankfull. (The feature usedwas called “frequent flow” and will be defined later inthis section.)
Streamflow and channel geometry were measuredat 21 sites in the summer of 1993 or 1994. There is nota standard method for estimating the discharge ofmountain streams. Hydrologists differ on how to esti-mate velocity because the energy dispersed by frictionand turbulent flow over rocks and bedforms is difficultto estimate. Williams (1978) evaluated several meth-ods of estimating bankfull discharge at ungaged sites,and concluded that the best estimates were from hisempirical formula (Qb = 4.0Ab
1.21S0.28), which usesslope, channel cross-sectional area, and coefficientsderived from regression of 233 bankfull discharges.Jarrett (1984, 1990) developed a similar equation,estimating discharge from area, hydraulic radius, andslope, but using different coefficients that were em-pirically derived specifically from small mountainstreams. Jarrett’s equation (Q = 3.81AR0.83S0.12) wasdeveloped from streams with slopes ranging from 0.2to 4.0 percent , and hydraulic radii ranging from 0.15to 2.1 m. It assumes no backwater and relatively lowsuspended sediment levels. Jarrett’s equation wasused to estimate streamflow in this study because thenecessary assumptions were met well, and estimateswere reasonable. The assumptions for Jarrett’s equa-tion were violated only by slopes on two of the studystreams that exceeded 4.0 percent (table 1), and hy-draulic radii less than 0.15 for five study streams at“frequent flow” stage.
The appropriateness of Jarrett’s equation for thestreams in this study was verified by testing estimatesmade with the equation against instantaneous springrunoff flow measurements at 10 of the 21 sites in 1995.Although some estimates varied substantially frommeasured flows, most estimates were within the ex-pected range of error, based on variances in Jarrett’sdata set (fig. 4). The equation performed best with highflows, although it tended to underpredict the highflows. Only data collected above diversions were usedto test the performance of the equation.
Two channel features were used to define the stageelevations for calculating conveyance estimates, “fre-quent flow,” and the edge of vegetation. “Frequentflow” is a term used in this study to refer to a fre-quently occurring flow, which probably coincided withthe bankfull stage at most locations. The frequent-flow elevation was identified by a series of indicatorson the banks such as change in vegetation, banktopography, or bank sediment sizes. These indicatorsare sometimes used to identify bankfull (Harrelsonand others 1994); however, the definition of bankfullmay vary depending on the application. The frequent-flow elevation is usually approximately the same el-evation as the tops of local channel bars.
The other channel feature used as a stage elevationfor discharge estimates was the edge of vegetation.
Flowdirection
Diversion
Canal
C3C2
C1
A5A4
A3
A2
A1
B5B4
B3
B2
B1
Figure 3—Sampling design.

8 USDA Forest Service Res. Pap. RMRS-RP-20. 2000
The average flow within the edges of vegetation wasused because of the interest in reduced conveyancecapacity due to vegetative encroachment. The flowdischarges at the elevation of frequent flow and theedge of vegetation on both the right and the left bankswere calculated using Jarrett’s (1984, 1990) equationand averaged for the transects above each diversion,and then for the transects below. The edge of vegeta-tion was defined as the edge of rooted vegetation,including grasses.
Discharge estimates at each stream were pooled intogroup “A” for above the diversions and group “B” forbelow the diversions, and then tested for normal dis-tribution. Because normality for both the frequentflow groups and the edge-of-vegetation groups wasrejected, differences between “A” and “B” were testedwith the Wilcoxon signed-rank test. An analysis ofspatial variability in flow discharge was also con-ducted using the seven “A” and “C” pairs. Although the“A” and “C” pairs were normally distributed, they weretested by Wilcoxon signed-rank tests for uniformity.Data for the “A” transects for all members of thissubset were recorded in 1993, while all “C” measure-ments were recorded in 1994.
Substrate
Changes in particle-size distribution of the channelbed may indicate deposition due to reducedstreamflows. Deposition can eventually alter the chan-nel geometry and the channel capacity for conveyingflows. The pebble-count technique (Kondolf 1997;Wolman 1954) is an accepted method of characterizingthe particle-size distribution of a bed surface. It usesan impartial collection of at least 100 samples gath-ered along a grid or transect to represent the popula-tion of pebbles. Care must be taken, however, to notbias the sample against particles less than 15 mm
(Fripp and Diplas 1993). The pebble count method canalso be subject to variation due to different operators(Wohl and others 1996).
Particle-size distribution data were gathered by theWolman (1954) pebble-count method along establishedcross-section transects. Sampling began at the fre-quent-flow elevation on one bank and ended at fre-quent flow on the other bank. Pebble samples wereequally spaced along the transect and selected with apointer as the sampler looked away. The B-axis (theintermediate size axis) and the vertical height of thepebble above the bed surface (z) of approximately20 evenly spaced pebbles were measured at eachtransect in 1993 or 1994. B-axis lengths were recordedin size classes in 1994, and in millimeters in 1995 (seetable 2 for list of size classes used). Vertical heightswere recorded in millimeters. Data within each reach(“A,” “B,” and “C”) were pooled for a total of at least 100point samples representing bed surface sediments ineach area. Wilcoxon signed-rank tests and Chi-squaretests were used to determine differences in particle-size distributions of the B-axis measurements aboveand below diversions. The D50 and D84 of the sampleswere determined and tested. D50 is the particle diam-eter size that is equal to or greater than 50 percent ofthe particle diameters. D84 is equal to or greater than84 percent of the particles sampled. Both D50 and D84are often used to represent particle-size distributionsfor comparisons of reaches or over time. Channel-bedroughness (Bathurst 1985; Ugarte and Madrid 1994;Wiberg and Smith 1991), represented by the ratio ofthe vertical pebble height to hydraulic radius (z:R),was also tested for significant differences between “A”and “B,” using Wilcoxon signed-rank tests.
Vegetation
Vegetation analyses focused on the location, den-sity, and diameter of plant stems. These data wereused to establish the edge of vegetation for flow esti-mates and to represent plant cover and vigor aboveand below diversions. Vegetation data were collectedat 17 diversion sites in 1993, and at the seven “C”streams in 1994. Data were collected at low flows in a1-foot wide band across the channel at transects 1 and5. The bands extended from the ends of the transects,located at the top of channel banks, to the edges ofvegetation at the channels. Stem counts were made intwo vertical layers, 0 to 6 inches (Layer 1) and >6 to 48inches (Layer 2) from the ground. Only woody stemswere counted; no grasses or herbaceous growth wereincluded. All stem diameters equal to or greater than1 cm were measured and recorded, and diameters lessthan 1 cm were tallied. Dead logs and branches werecounted, but if they were greater than 1 cm in diam-eter, they were excluded from the analysis.
Figure 4—Fit of predicted flow using Jarrett’s equation.
0
10
20
30
40
50
60
70
80
90
100
110
120
130
140
150
0 10 20 30 40 50 60 70 80 90 100 110 120 130 140 150
Measured discharge (c.f.s)
Pre
dict
ed d
isch
arge
(c.
f.s)
Jarrett’s data
Idaho high flows
Idaho low flows
Jarrett’s equationQ = 3.81 AR0.83 S0.12
R2 (Jarrett’s data) = .92R2 (Id. high flows) = .93R2 (Id. low flows) = .59
1:1 Line

9USDA Forest Service Res. Pap. RMRS-RP-20. 2000
The data were analyzed using Wilcoxon signed-ranktests of “A” against “B.” Stem density and averagestem diameters above and below the diversions werestratified by layers and stem sizes (<1 cm and = >1 cm)for the analysis.
Sediment Transport
Ten streams were revisited in the spring and fall of1995. Bedload and suspended sediment samples weregathered at high flows above and below these diver-sions on at least 1 and up to 4 days in the spring, andWolman pebble counts were made during lower flowsin the fall. Both sediment samples were collected alongthe same transects at equally spaced verticals, withequal sampling time (bedload) or transit rate (sus-pended sediment) at each sample vertical (Edwardsand Glysson 1988). Suspended sediment samples werecollected with a DH-48 sampler and then filtered,dried, and weighed. Bedload was sampled with a3 inch Helley-Smith bedload sampler using 0.25 mmmesh sampling bags. Each transect was traversedtwice for bedload, and the samples from each verticalwere composited but the transects were not. Thesamples were oven-dried, and sieved through sievesizes 0.063, 0.125, 0.25, 0.5, 1, 2, 4, 8, 16, 32, and64 mm. Each size fraction was weighed to calculatepercent of total sample, and the results of each sizefraction from the two traverses were averaged. Par-ticle diameters less than 0.25 mm were not included inthe analysis because they were smaller than the meshsize of the sample bag. The percent fines (0.25 to0.5 mm) were calculated for all samples; rate of bedloadtransport (g per min) for the full stream width was
calculated from the samples that had accompanyingstream-width data. For uniformity, Wilcoxon signed-rank tests were used to compare sediment loads aboveand below all diversion sites for both normally distrib-uted data and where normal distribution of the datawas rejected.
Results ________________________
Flow Conveyance
Figure 5 shows the estimated conveyances at fre-quent-flow level, plotting flows above and below eachdiversion against each other. The plot indicates thatconveyances above diversions are generally larger
Table 2—Pebble-count size classes.
Size classes For sites: Size classes For sites:
mm mm<0.062 Eagle <0.062 Pole.062-<2 Ethel .062-<2 Boone2-<8 Silver 2-<8 Valley8-<16 Cottonwood 8-<16 North Fork Burnt16-<64 Boulder 16-<32 Knapp64-<256 32-<64 Upper Champion256-<512 64-<128 McDevitt512-<4096 128-<256 Hawley
256-<512 Upper Hawley512-<4096 Lower Champion
West Fork BurntJulyMorganCottleVan HornAlturas
0
20
40
60
80
100
120
140
160
180
0 20 40 60 80 100 120 140 160 180
Above diversion (c.f.s)
Bel
ow d
iver
sion
(c.
f.s)
1:1 Line
Hawley
Eagle
EthelPole
July
Trendline
Figure 5—Frequent flow discharge, above versusbelow diversions.
10 USDA Forest Service Res. Pap. RMRS-RP-20. 2000
than their paired reaches below. The two-tail Wilcoxonsigned-rank test of “A” and “B” pairs was significant(table 3). The paired T-test of the seven “C” sites pairedwith the appropriate “A” data was also significant atp = 0.0180 (table 3), which suggests natural spatialvariation independent of the diversion. Further ex-amination of the data revealed that flow below wasabout 7 c.f.s. less than above the diversions, whileflows in “C” reaches averaged 24 c.f.s. more than in the“A” reaches. Most likely, this huge disparity between“C” and “A” reaches is due to temporal or observerdifferences rather than spatial differences becausethese reaches were surveyed in different years and bydifferent crews. This underscores the difficulty inuniformly identifiying the frequent-flow indicators,particularly following spring runoffs of differing mag-nitudes. Identifying frequent-flow indicators may bemore subjective than is acceptable for researchpurposes.
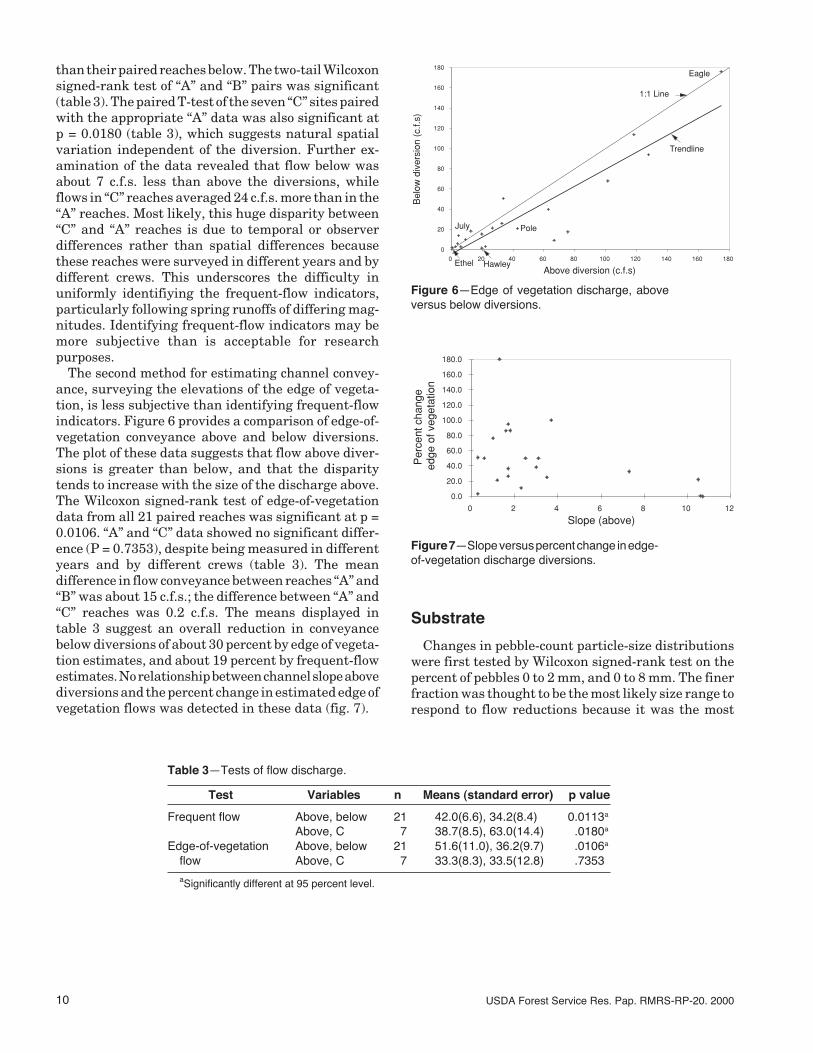
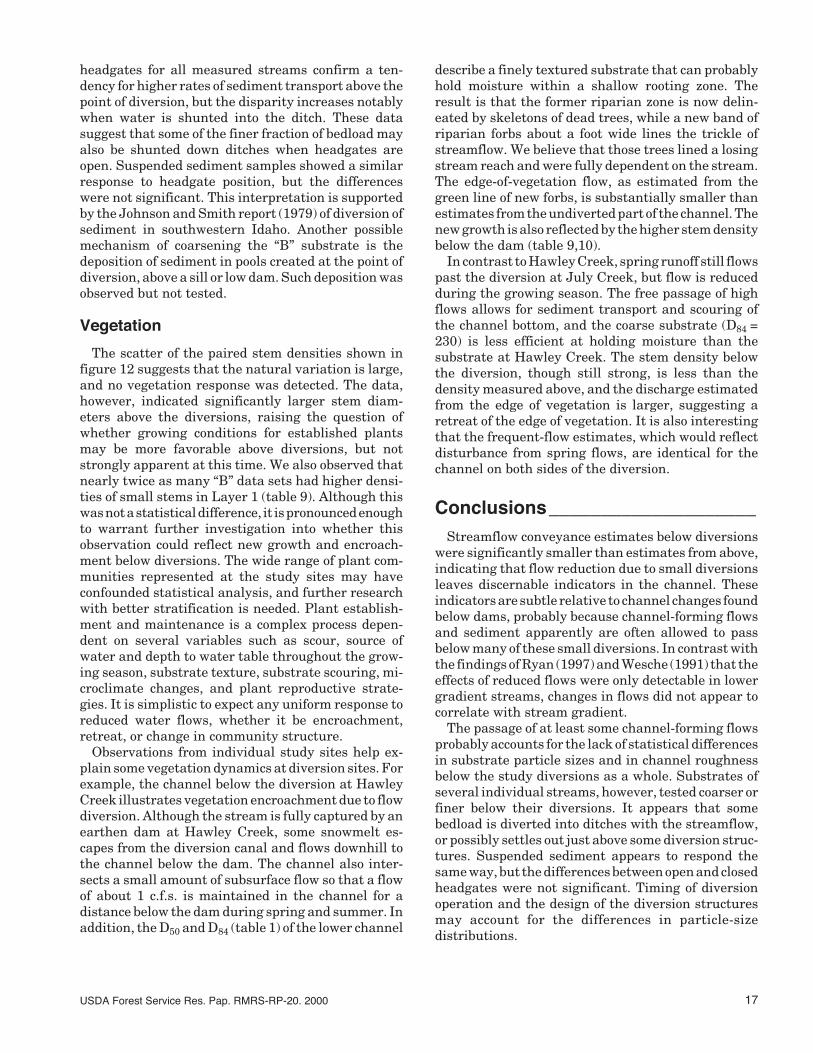
The second method for estimating channel convey-ance, surveying the elevations of the edge of vegeta-tion, is less subjective than identifying frequent-flowindicators. Figure 6 provides a comparison of edge-of-vegetation conveyance above and below diversions.The plot of these data suggests that flow above diver-sions is greater than below, and that the disparitytends to increase with the size of the discharge above.The Wilcoxon signed-rank test of edge-of-vegetationdata from all 21 paired reaches was significant at p =0.0106. “A” and “C” data showed no significant differ-ence (P = 0.7353), despite being measured in differentyears and by different crews (table 3). The meandifference in flow conveyance between reaches “A” and“B” was about 15 c.f.s.; the difference between “A” and“C” reaches was 0.2 c.f.s. The means displayed intable 3 suggest an overall reduction in conveyancebelow diversions of about 30 percent by edge of vegeta-tion estimates, and about 19 percent by frequent-flowestimates. No relationship between channel slope abovediversions and the percent change in estimated edge ofvegetation flows was detected in these data (fig. 7).
Substrate
Changes in pebble-count particle-size distributionswere first tested by Wilcoxon signed-rank test on thepercent of pebbles 0 to 2 mm, and 0 to 8 mm. The finerfraction was thought to be the most likely size range torespond to flow reductions because it was the most
Table 3—Tests of flow discharge.
Test Variables n Means (standard error) p value
Frequent flow Above, below 21 42.0(6.6), 34.2(8.4) 0.0113a
Above, C 7 38.7(8.5), 63.0(14.4) .0180a
Edge-of-vegetation Above, below 21 51.6(11.0), 36.2(9.7) .0106a
flow Above, C 7 33.3(8.3), 33.5(12.8) .7353aSignificantly different at 95 percent level.
0.0
20.0
40.0
60.0
80.0
100.0
120.0
140.0
160.0
180.0
0 2 4 6 8 10 12
Slope (above)
Per
cent
cha
nge
edge
of v
eget
atio
n
0
20
40
60
80
100
120
140
160
180
0 20 40 60 80 100 120 140 160 180
Above diversion (c.f.s)
Bel
ow d
iver
sion
(c.
f.s)
Eagle
1:1 Line
July
Ethel Hawley
Pole
Trendline
Figure 6—Edge of vegetation discharge, aboveversus below diversions.
Figure 7—Slope versus percent change in edge-of-vegetation discharge diversions.

11USDA Forest Service Res. Pap. RMRS-RP-20. 2000
abundant size by weight in the sediment transportsamples. Although the average percent of the finefraction was somewhat larger below the diversions,the tests were not significant in any of the test years(table 4). Tests of D50 and of D84 also failed to distin-guish any significant differences between reaches aboveand below the diversions (table 4). Nonetheless, largedifferences in the percent of fine material were foundbetween “A” and “B” at some of the individual sites(fig. 8, 9), so the “A” and “B” pairs at each individualdiversion were examined by Chi-square tests for sizesless than 8 mm and less than 32 mm (table 5). Ten ofthe 21 streams had significantly different (p = 0.1)percentages of particles 0 to 8 mm above and below thediversions. Thirteen of the 21 sites showed significantdifferences between “A” and “B” for particles 0 to32 mm. Of the 7 “C” sites, none differed significantlyfrom its “A” reach in the 0 to 8 mm group, and only 2differed significantly in the 0 to 32 mm group (table 5).Some of these streams, however, had significantlyfiner material above the diversion; others were finerbelow (fig. 10).
A series of Wilcoxon signed-rank tests were used tosearch for changes in channel-bed roughness. The D50and D84 of the vertical axes (z) from the 1993 to 1994pebble counts were used with the estimated hydraulicradius (R) or frequent flow in a ratio z:R. The D50 andD84 measures of the vertical axes from 1995 pebblecounts were also used in a ratio with the R of themeasured spring flows. The data were stratified by theslope of the “A” reach, so that slopes of 0 to 4 percentwere in one group and slopes greater that 4 percentwere in another group. Although the 4 percent breakoffwas somewhat arbitrary, it was chosen because itbegins a gap in the data between the steep streams(greater than 7 percent ) and the rest of the streams.No significant differences between “A” and “B,” and“A” and “C” were detected at the 0.05 level (table 6).
Table 4—Tests of pebble-count results.
Test Variables Year n Means (standard error) p value
D50 Above, below 1993-1994 21 71.3(13.4), 70.4(19.3) 0.7113Above, below 1995 10 44.1(9.4), 44.4(8.5) .8785
D84 Above, below 1993-1994 21 33.7(9.6), 41.2(13.2) .7815Above, below 1995 10 105(18.4), 114.4(21.8) .9593
percent - - - - percent - - - - <2 mm Above, below 1993-1994 21 13.3(1.8), 19.8(4.8) .6639
Above, C 1993-1994 7 10.4(2.6), 13.5(2.2) .1763Above, below 1995 10 8.1(1.4), 9.9(2.1) .4443
<8 mm Above, below 1993-1994 21 20.4(2.2), 26.2(5.1) .6143Above, C 1993-1994 7 20.0(3.1), 20.4(2.5) .7353Above, below 1995 10 15.2(2.2), 20.1(4.8) .375
Figure 8—Percent of pebbles 0 to 2 mm, aboveversus below diversions.
Figure 9—Percent of pebbles 2 to 8 mm, aboveversus below diversions.
0
5
10
15
20
25
30
35
40
45
50
0 5 10 15 20 25 30 35 40 45 50
Percent above diversion, 2 to 8 mm
Per
cnet
bel
ow d
iver
sion
, 2 to
8 m
m1:1 Line
Eagle
Ethel
HawleyPole
July
0
10
20
30
40
50
60
70
80
90
100
0 10 20 30 40 50 60 70 80 90 100
Percent above diversion, 0 to 2 mm
Per
cent
bel
ow d
iver
sion
, 0 to
2 m
m
Hawley
Ethel
1:1 Line
Eagle
Pole
July

12 USDA Forest Service Res. Pap. RMRS-RP-20. 2000
Table 5—Chi-square probabilities of 1993-1994 pebble counts.Bold indicates the reach with the higher percent offines.
Site (reach) 0-8 0-32- - - - - - - - mm - - - - - - -
Alturas (A,B) .0184a,b 0.2157Boone (A,B) .0029b .0007b
Boulder (A,B) .1725 .0260b
North Fork Burnt (A,B) .6826 .3603West Fork Burnt (A,B) .5538 .3120Lower Champion (A,B) .0584b .0873b
Upper Champion (A,B) .1752 .0582b
Cottle (A,B) .0465b .0086b
Cottonwood (A,B) .0244b .0070b
Eagle (A,B) .7823 .2629Ethel (A,B) .0000b .0000b
Hawley (A,B) .0000b .0000b
Upper Hawley (A,B) .8952 .6036July (A,B) .6866 .4780Knapp (A,B) .0595b .0042b
McDevitt (A,B) .0664b .0088b
Morgan (A,B) .0649 .0384b
Pole (A,B) .3576 .0110b
Silver (A,B) .3759 .1464Valley (A,B) .4881 .0986b
Van Horn (A,B) .0093b .1824North Fork Burnt (A,C) .1932 .1887West Fork Burnt (A,C) .9944 .0625b
Hawley (A,C) .9167 .4527Knapp (A,C) .4213 .2031McDevitt (A,C) .2295 .0208b
Pole (A,C) .2087 .4152Valley (A,C) .3236 .5064
aAt least one cell had <5 observation.bSignificant difference between Above and Below at 0.1 level.
Table 6—Tests of roughness, pebble size: R.
Test Variables Year n Means p value
D50:R A versus B, all data 1993-1994 21 0.1122, 0.1051 0.6389D84:R A versus B, all data 1993-1994 21 .4250, .3584 .5202D50:R A versus C, all data 1994 7 .0929, .0789 .0630D84:R A versus C, all data 1994 7 .3111, .2529 .1282D50:R A versus B, slopes 0-4 percent 1993-1994 17 .1002, .1076 .1773D84:R A versus B, slopes 0-4 percent 1993-1994 17 .3283, .3225 .3088D50:R A versus B, slopes >4 percent 1993-1994 4 .1635, .0944 .0679D84:R A versus B, slopes >4 percent 1993-1994 4 .8359, .5110 .7150D50:R A versus B, all data 1995 9 .0801, .0899 .5147D84:R A versus B, all data 1995 9 .2347, .2776 .6784Vertical axis D50 A versus B, all data 1993-1994 21 24.19, 21.33 .3293Vertical axis D84 A versus B, all data 1993-1994 21 83.73, 70.95 .6019
0
10
20
30
40
50
60
70
80
90
100
0 10 20 30 40 50 60 70 80 90 100
Percent pebbles above diversions
Per
cent
peb
bles
bel
ow d
iver
sion
s
Percent pebbles 0- 8 mm
0-8 mm, not significantly
Percent pebbles 0-32 mm
0-32 mm, not significantly
1:1 Line
Finer Coarser
Coa
rser
Fin
er
different
different
Figure 10—Chi-square analyses of pebblecounts.
Sediment Transport
The Wilcoxon signed-rank tests comparing the rateof bedload transport (g per min) above and belowdiversions showed significantly reduced bedload trans-port rate below diversions (table 7). The transport ratefor the finest fraction of the captured bedload (0.25 to0.5 mm) also tested significant, although the percentby weight for the same fraction did not. When the datawere stratified by whether the ditches were carryingwater, the transport rate above the diversions withdry ditches was not significantly different from below,with p = 0.1282 testing all data and p = 0.1763 for thefraction 0.25 to 0.5 mm. The total bedload transportrate and the transport rate for the 0.25 to 0.5 mmfraction were significantly greater above diversionswhere water was being diverted into ditches (p =0.0425 and p = 0.0630). The mean rates of transport

13USDA Forest Service Res. Pap. RMRS-RP-20. 2000
Table 7—Tests of bedload transport.
Test Variables Year n Means p value
g/minRate A versus B, all data 1995 14 497.8, 175.3 0.0085a
Rate A versus B, gate open 1995 7 786.5, 219.0 .0425a
Rate A versus B, gate closed 1995 7 209.2, 131.7 .1282percent percent
Fines (0.25-0.5 mm) A versus B, all data 1995 20 19.2, 26.8 .0897a
Fines (0.25-0.5 mm) A versus B, gate open 1995 11 17.9, 27.3 .1748Fines (0.25-0.5 mm) A versus B, gate closed 1995 9 20.7, 26.1 .3743
mmRate for 0.25-0.5 A versus B, all data 1995 14 50.0, 22.9 0.0245a
Rate for 0.25-0.5 A versus B, gate open 1995 7 72.6, 23.9 0.0630a
Rate for 0.25-0.5 A versus B, gate closed 1995 7 27.4, 21.9 0.1763
aSignificant at 0.10 level.
above and below were relatively close when theheadgates were closed and generally quite differentwith the headgates open, as displayed by the trendlines in figure 11. It is possible that at least some of theditches or diversion systems may have been extractingsignificant portions of the bedload.
Suspended sediment concentrations were deter-mined from the DH-48 sampler stream samples, andthen converted to grams per second using accompany-ing flow measurements. Although large differencesbetween the mean rates of suspended sediment dis-charge above and below diversions were found atdiversions with open headgates, the differences werenot statistically significant when tested with Wilcoxonsigned-rank tests (table 8). It is an interesting obser-vation, however, that the mean rates of suspendedsediment discharge were very close when the headgateswere closed, as was seen with the bedload samples.
Vegetation
Stem densities varied widely, and there was not astatistical difference between “A” and “B” data (fig. 12;table 9,10). In Layer 2 (6 to 48 inches), however, stemdiameters were significantly larger above diversionsthan below (p = 0.021); diameters in this layer did notdiffer significantly between “A” and “C” (table 11).0
500
1,000
1,500
2,000
2,500
3,000
0 500 1,000 1,500 2,000 2,500 3,000
Above (grams per minute)
Bel
ow (
gram
s pe
r m
inut
e)
Water beingdiverted
No water diverted
Trend line forwater beingdiverted
Trend line forno waterdiverted
Pole6/14/95
1:1 Line
Hawley6/5/95
Hawley5/24/95
Pole5/17/95
Figure 11—Bedload transport rates (average of2 passes).
Table 8—Wilcoxon signed-rank tests of suspended sediment.
Test Variables Year n Means (standard error) p valueg/minRate A versus B, all data 1995 15 33.9 (18.2), 16.7 (5.2) 0.2524Rate A versus B, gate open 1995 10 42.7 (27.0), 16.2 (7.0) .1309Rate A versus B, gate closed 1995 5 16.4 (8.2), 17.6 (8.2) .6858
mg/lConcentration A versus B, all data 1995 18 24.5 (6.3), 33.8 (14.5) .7019Concentration A versus B, gate open 1995 11 28.3 (10.1), 38.0 (23.6) .7646Concentration A versus B, gate closed 1995 7 18.5 (3.8), 27.3 (7.5) .3980

14 USDA Forest Service Res. Pap. RMRS-RP-20. 2000
Discussion _____________________
Flow Conveyance
The statistical tests and plots (table 3; fig. 5, 6) offlow discharges indicate reduced conveyance belowdiversions. While diverted streams, by definition, havereduced flow, these findings are important becausethey suggest there are identifiable markers associatedwith reduced flows within the diverted channels thatdiffer significantly from undiverted channel pairs. Onaverage, the edge-of-vegetation discharge estimates
decreased about 26 percent below the diversions inthis study, and about 29 percent by frequent-flowestimates. Wesche (1991) reported a 67 percent aver-age decrease in conveyance capacity on low-gradientstreams with almost half the flow diverted, but hissteeper gradient streams actually showed small in-creases in estimated discharges. Ryan (1997) alsoidentified both vegetative and geomorphic indicationsof reduced flows within her low-gradient study chan-nels. Effects of gradient were not apparent in the smalldiversions of this study, however. We suspect that theuse history may be the primary influence at thesesites.
Frequent flow and edge of vegetation measure fun-damentally different processes. Frequent flow is de-fined by physical channel features; the edge of vegeta-tion depends on the establishment and survivability ofvegetation during the growing season. Frequent flowwill be similar above and below diversions where largeportions of the annual peaks are allowed to pass, as iscommon for small diversions. Pronounced changes inchannel geometry are often found below large damsand diversions where the annual hydrographs aresignificantly altered and channel-forming flows areeliminated or reduced. The edge-of-vegetation dis-charge is more indicative of growing season condi-tions, and the smaller edge-of-vegetation dischargeestimates below diversions appear to indicate vegeta-tive encroachment. Encroachment is of particular in-terest because it potentially impacts flood conveyance
Figure 12—Average stem densities, all layersand diameter sizes.
0
5
10
15
20
25
0 5 10 15 20 25
Stems per square ft above diversions
Ste
ms
per
squa
re ft
bel
ow d
iver
sion
s
July
HawleyEagle Ethel
Pole
1:1 Line
Table 9—Test of stem densities for layer 1 (0 to 6 inches).
Stems less than1 cm Stems greater than 1 cmSite Above Below Site Above Below
- - stems per square ft - - - - stems per square ft - -July 10.33 7.71 July 0.21 0.00Alturas 7.23 5.04 Alturas .45 .15Boone 2.06 3.85 Boone .27 .11Boulder .23 .52 Boulder .10 .12Cottonwood 1.10 .83 Cottonwood .47 .09Eagle .66 1.30 Eagle .03 .10Ethel 2.53 1.55 Ethel .09 .00Hawley 2.05 2.16 Hawley .00 .14Knapp 2.71 4.99 Knapp .07 .08McDevitt 1.15 7.83 McDevitt .21 .47Morgan 2.00 4.21 Morgan .20 .19North Fork Burnt 1.03 .90 North Fork Burnt .35 .19Pole 2.78 3.03 Pole .00 .00Valley 1.34 1.74 Valley .00 .13Van Horn 1.04 1.52 Van Horn .25 .04West Fork Burnt 1.99 .24 West Fork Burnt .03 .31
Mean 2.52 2.96 Mean .17 .13Standard deviation 2.62 2.43 Standard deviation 0.16 .12P value 0.4080 p value 0.4532

15USDA Forest Service Res. Pap. RMRS-RP-20. 2000
Table 11—Test of average stem diameters.
Layer 1 Layer 1 Layer 2 Layer 2(0-6 inches) (0-6 inches) (>6-48 inches) (>6-48 inches)
Site Above vs. Below “C” vs. Above Site Above vs. Below “C” vs. Above
July 1.50 0.00 July 1.65 0.00Alturas 5.00 1.67 Alturas 3.22 1.50Boone 1.80 1.56 Boone 2.50 1.50Boulder 6.16 2.57 Boulder 10.66 2.67Cottonwood 7.98 3.75 Cottonwood 6.46 2.61Eagle 1.00 2.58 Eagle 2.50 2.23Ethel 1.75 .00 Ethel 2.00 .00Hawley .00 1.86 4.00 0.00 Hawley 2.00 .00 3.35 2.00Knapp 5.23 2.17 1.00 5.23 Knapp 2.85 .00 1.00 2.85McDevitt 2.31 3.38 2.95 2.31 McDevitt 2.40 4.00 2.13 2.40Morgan 1.83 1.92 Morgan 2.67 2.17North Fork Burnt 3.44 5.07 3.00 3.44 North Fork Burnt 3.08 4.67 2.16 3.08Pole .00 .00 1.00 .00 Pole .00 .00 .00 .00Valley .00 2.00 1.00 .00 Valley .00 1.80 1.80 .00Van Horn 13.21 3.00 Van Horn 2.50 .00West Fork Burnt 3.50 3.08 9.25 3.50 West Fork Burnt 3.50 2.09 100.00 3.50
Mean 3.42 2.16 3.17 2.07 Mean 3.00 1.58 15.78 1.97Standard deviation 3.50 1.39 2.94 2.12 Standard deviation 2.50 1.50 37.15 1.43
p value = 0.2051 p value = 0.2359 p value = 0.0213 p value = 0.6715
Table 10—Test of stem densities for layer 2 (6 to 48 inches)
Stems less than1 cm Stems greater than 1 cmSite Above Below Site Above Below
- - stems per square ft - - - - stems per square ft - -July 9.98 7.36 July 0.35 0.00Alturas 6.23 2.83 Alturas .22 .03Boone 3.17 3.26 Boone .30 .01Boulder .59 .35 Boulder .04 .05Cottonwood 2.02 1.55 Cottonwood .75 .43Eagle 1.06 2.28 Eagle .01 .45Ethel 3.37 1.90 Ethel .09 .00Hawley 1.04 2.43 Hawley .05 .00Knapp 4.32 4.18 Knapp .05 .00Mc Devitt 1.23 .90 Mc Devitt .13 .16Morgan 2.13 8.99 Morgan .13 .40North Fork Burnt River 1.83 1.22 NF .42 .04Pole 1.94 1.55 Pole .00 .00Valley 1.65 6.12 Valley .00 .22Van Horn 1.32 1.41 Van Horn .25 .00West Fork Burnt River 1.92 .64 West Fork Burnt River .02 .38
Mean 2.74 2.93 Mean .18 .14Standard deviation 2.40 2.52 Standard deviation .20 .18p value 0.4691 p value 0.4532

16 USDA Forest Service Res. Pap. RMRS-RP-20. 2000
by altering the channel’s roughness. Channel gradientand response did not appear to be related. In contrast,Wesche (1991) and Ryan (1997) were clear that onlylow-gradient streams were affected in their studies.
Typically, flow diversion reduced both frequent flowand edge-of-vegetation conveyance estimates. It maybe instructive, however, to examine one of the streamsthat did not follow this general trend. Eagle Creekcarries the greatest estimated edge-of-vegetation flowof all the study streams. It is a steep, high-energystream, and no water was diverted during the springprior to sampling in the summer of 1993, due to a breakin the canal. Eagle Creek is the first of several streamsthat are fully captured by a common, earthen canalthat intersects the stream, so that water must passthrough a wooden headgate off the canal to continueflowing downstream. The headgates leak a little evenwhen closed, and are probably fully or partially openduring most snowmelt seasons. The estimated edge-of-vegetation flow above the diversion was 175 c.f.s.,and flow below was estimated at 176 c.f.s. The fre-quent flow estimates for Eagle Creek, however, droppednotably (72 c.f.s. above and 56 c.f.s. below), eventhough steep-gradient, high-energy streams such asEagle Creek are generally not considered to be alluvialand, therefore, are less susceptible to moderate flowchanges and spring runoff passed through the canalprior to sampling. The D50 particle size, which wouldbe expected to change if there was a change in streampower, was the same above and below the canal. Theseresults are contrary to data from other study sites, andseem to suggest that there is insufficient dischargebelow the headgate to maintain the frequent-flowindicators at a high level, but sufficient leakage tosupport the vegetative community. Because spring1993 snowmelt flows were allowed to pass down-stream, the data may also be evidence that frequent-flow indicators are not necessarily valid in high-gradi-ent streams that are not building floodplains or bars.
Substrate and Sediment Transport
The T-tests of all paired sites for differences in thepercent of fine particles in the substrates were nonsig-nificant. The Chi-square results of substrate differ-ences at each site were often significant, but thenumber of sites that had significantly more fine par-ticles below and more fines above the diversions wasnearly equal (table 5; fig. 8). It appears from these datathat, although particle size distributions above andbelow an individual diversion may differ significantly,they do not differ in a predictable way, and may bewithin the natural variation of the system. Variationin the diversion structures may also account for theinconsistent results; sediment moves downstreamreadily during bankfull flows at some sites, but is
trapped or diverted by structures at other sites. Inter-pretation of these data is further complicated by thefact that roughness did not change significantly belowdiversions, despite reduced conveyance, and typicallylarger width:depth ratios (table 6). Changes in rough-ness would be expected if sedimentation occurred dueto reduced flows. The study sites at Hawley Creek andEthel Creek stand out in figures 8 and 9 because theyhave unusually high percentages of fine particles. Thediversion structure at Hawley Creek is an earthendam blocking the channel and fully capturing thestream for an unlined canal, which then traverses theslope above the dry channel before turning away.During spring runoff, and quite possibly during othertimes of the year, some streamflow overtops the canalin several places and runs downhill to the channelbelow the dam. There is also seepage beneath the damand canal that surfaces below the dam to help supplythe trickle of water down the center of the channel. Theformer streambanks appear trampled and eroded bygrazing animals and time. Thus, fine sediment isprobably supplied by the eroding banks and overlandflow from the canal, but the remnant flow is notenough to transport it.
The streamflow at Ethel Creek is also captured by anunlined canal, but some flow is allowed to pass througha headgate into the channel below during springrunoff, and perhaps at other times as well. The coars-est fraction of the bedload can drop out in the shallowgradient of the canal, but the rest passes through theheadgate to the channel below. Because of the reducedflow and somewhat lessened gradient, we can specu-late that stream power below the canal is not compe-tent to continue transporting all of the remainingbedload, and the portion that settles there is finer thanwhat originated above. The seepage from the canaland whatever flow leaks through the headgate sup-port a mossy encroachment that also can help filter outsediment. While these are two extreme and somewhatunusual examples, the factor they share in common isa loss of competency due to reduced flows, and thissame factor probably exists to a lesser degree at othersites.
Data from Pole Creek suggest how some streamsubstrates can coarsen below diversions. Figure 11displays bedload transport rates from Pole Creek ontwo different dates. On May 17, 1995, all flow re-mained in the stream channel; the rate of sedimenttransport above the diversion was somewhat lowerthan below it (71 g per min above and 197 g per minbelow). In contrast, when the same streamflow wasdiverted into the ditch on June 14, 1995, the rate oftransport was much greater above the diversion (2,924g per min above and 1,120 g per min below). Thetrendlines for bedload transport with open and closed
17USDA Forest Service Res. Pap. RMRS-RP-20. 2000
headgates for all measured streams confirm a ten-dency for higher rates of sediment transport above thepoint of diversion, but the disparity increases notablywhen water is shunted into the ditch. These datasuggest that some of the finer fraction of bedload mayalso be shunted down ditches when headgates areopen. Suspended sediment samples showed a similarresponse to headgate position, but the differenceswere not significant. This interpretation is supportedby the Johnson and Smith report (1979) of diversion ofsediment in southwestern Idaho. Another possiblemechanism of coarsening the “B” substrate is thedeposition of sediment in pools created at the point ofdiversion, above a sill or low dam. Such deposition wasobserved but not tested.
Vegetation
The scatter of the paired stem densities shown infigure 12 suggests that the natural variation is large,and no vegetation response was detected. The data,however, indicated significantly larger stem diam-eters above the diversions, raising the question ofwhether growing conditions for established plantsmay be more favorable above diversions, but notstrongly apparent at this time. We also observed thatnearly twice as many “B” data sets had higher densi-ties of small stems in Layer 1 (table 9). Although thiswas not a statistical difference, it is pronounced enoughto warrant further investigation into whether thisobservation could reflect new growth and encroach-ment below diversions. The wide range of plant com-munities represented at the study sites may haveconfounded statistical analysis, and further researchwith better stratification is needed. Plant establish-ment and maintenance is a complex process depen-dent on several variables such as scour, source ofwater and depth to water table throughout the grow-ing season, substrate texture, substrate scouring, mi-croclimate changes, and plant reproductive strate-gies. It is simplistic to expect any uniform response toreduced water flows, whether it be encroachment,retreat, or change in community structure.
Observations from individual study sites help ex-plain some vegetation dynamics at diversion sites. Forexample, the channel below the diversion at HawleyCreek illustrates vegetation encroachment due to flowdiversion. Although the stream is fully captured by anearthen dam at Hawley Creek, some snowmelt es-capes from the diversion canal and flows downhill tothe channel below the dam. The channel also inter-sects a small amount of subsurface flow so that a flowof about 1 c.f.s. is maintained in the channel for adistance below the dam during spring and summer. Inaddition, the D50 and D84 (table 1) of the lower channel
describe a finely textured substrate that can probablyhold moisture within a shallow rooting zone. Theresult is that the former riparian zone is now delin-eated by skeletons of dead trees, while a new band ofriparian forbs about a foot wide lines the trickle ofstreamflow. We believe that those trees lined a losingstream reach and were fully dependent on the stream.The edge-of-vegetation flow, as estimated from thegreen line of new forbs, is substantially smaller thanestimates from the undiverted part of the channel. Thenew growth is also reflected by the higher stem densitybelow the dam (table 9,10).
In contrast to Hawley Creek, spring runoff still flowspast the diversion at July Creek, but flow is reducedduring the growing season. The free passage of highflows allows for sediment transport and scouring ofthe channel bottom, and the coarse substrate (D84 =230) is less efficient at holding moisture than thesubstrate at Hawley Creek. The stem density belowthe diversion, though still strong, is less than thedensity measured above, and the discharge estimatedfrom the edge of vegetation is larger, suggesting aretreat of the edge of vegetation. It is also interestingthat the frequent-flow estimates, which would reflectdisturbance from spring flows, are identical for thechannel on both sides of the diversion.
Conclusions____________________Streamflow conveyance estimates below diversions
were significantly smaller than estimates from above,indicating that flow reduction due to small diversionsleaves discernable indicators in the channel. Theseindicators are subtle relative to channel changes foundbelow dams, probably because channel-forming flowsand sediment apparently are often allowed to passbelow many of these small diversions. In contrast withthe findings of Ryan (1997) and Wesche (1991) that theeffects of reduced flows were only detectable in lowergradient streams, changes in flows did not appear tocorrelate with stream gradient.
The passage of at least some channel-forming flowsprobably accounts for the lack of statistical differencesin substrate particle sizes and in channel roughnessbelow the study diversions as a whole. Substrates ofseveral individual streams, however, tested coarser orfiner below their diversions. It appears that somebedload is diverted into ditches with the streamflow,or possibly settles out just above some diversion struc-tures. Suspended sediment appears to respond thesame way, but the differences between open and closedheadgates were not significant. Timing of diversionoperation and the design of the diversion structuresmay account for the differences in particle-sizedistributions.

18 USDA Forest Service Res. Pap. RMRS-RP-20. 2000
The response of vegetation to these small diversionswas not strong. Stem diameters in Layer 2 (>6 to 48inches above the ground) were significantly largerabove the diversions, which may indicate more favor-able conditions. No other vegetation test was statisti-cally significant. Stratification by substrate, seasonand size of diversion, community type, source of sum-mer water, or other variables may be necessary toevaluate the effects of diversions on stem density andvigor.
Flow estimates at the elevation of an identifiablechannel feature are necessary to compare the convey-ance of two stream reaches. Flow estimates werecomputed for elevations of two features in this study:frequent-flow indicators, which approximated bankfull,and the edge of vegetation. The edge of vegetationappears to be a viable alternative to frequent-flowindicators or bankfull for conveyance comparisons.The edge of vegetation may be more reliable thanfrequent-flow indicators because conveyance estimatesof both free-flowing reaches (“A” and “C”) also differedwhen calculated from frequent flow levels. The edge ofvegetation also addresses the question of vegetativeencroachment into the channel more directly. En-croachment is of particular interest because of itspotential impact on channel roughness and flood-flowconveyance. These concepts merit further testing.
It appears that the operation of the small foreststream diversions has not substantially altered mostparameters studied. However, the few statisticalchanges that were detected, coupled with some pro-voking observations and analyses of individual streams,suggest a trend toward alteration that is not substan-tially detectable yet. Hydrographs from above andbelow the points of diversion and historical data areneeded to fully evaluate the channel and vegetationresponses to reduced flows.
References _____________________Abt, Steven; Clary, Warren; Thornton, Christopher. 1994. Sedi-
ment deposition and entrapment in vegetated streambeds. Jour-nal of Irrigation and Drainage Engineering. 120(6): 1098-1111.
Andrews, Edmund. 1980. Effective and bankfull discharges ofstreams in the Yampa River Basin, Colorado and Wyoming.Journal of Hydrology. 46: 311-330.
Andrews, E. D.; Nankervis, J. M. 1995. Effective discharge and thedesign of channel maintenance flows for gravel-bed rivers. Natu-ral and anthropogenic influences in fluvial geormorphology.Geophysical Monograph 89. American Geophysical Union.
Bathurst, James. 1985. Flow resistance estimation in mountainrivers. Journal of Hydraulic Engineering. 111(4): 625-643.
Carling, Paul. 1988. The concept of dominant discharge applied totwo gravel-bed streams in relation to channel stability thresh-olds. Earth Surface Processes and Landforms. 13: 355-367.
Chavez, Lela. 1996. Above-below diversion study. In: Neary, Dan;Ross, Kim; Coleman, Sandra, eds. National Hydrology Workshopproceedings; 1992 April 27-May 1; Phoenix, AZ. Gen. Tech. Rep.RM-GTR-279. Fort Collins, CO: U.S. Department of Agriculture,Forest Service, Rocky Mountain Forest and Range ExperimentStation.
Clary, Warren; Thornton, Christopher; Abt, Steven. 1996. Riparianstubble height and recovery of degraded streambanks. Range-lands. 18(4): 137-140.
Collier, Michael; Webb, Robert; Schmidt, John. 1996. Dams andrivers, a primer on the downstream effects of dams. Circular1126. Denver, CO: U.S. Geological Survey, Branch of InformationServices. 94 p.
Edwards, Thomas; Glysson, G. Douglas. 1988. Field methods formeasurement of fluvial sediment. Open File Report 86-531.Reston, VA: U.S. Geological Survey.
Fripp, Jon; Diplas, Panayiotis. 1993. Surface sampling in gravelstreams. Journal of Hydraulic Engineering. 119(4): 473-489.
Gregory, K. J.; Park, C. 1974. Adjustment of river channel capacitydownstream from a reservoir. Water Resources Research. 10(4):870-873.
Harrelson, Cheryl; Rawlins, C.L; Potyondy, John. 1994. Streamchannel reference sites: an illustrated guide to field technique.Gen. Tech. Rep. RM-245. Fort Collins, CO: U.S. Department ofAgriculture, Forest Service, Rocky Mountain Forest and RangeExperiment Station. 61 p.
Harris, Richard; Fox, Carl; Risser, Roland. 1987. Inpacts of hydro-electric development on riparian vegetation in the Sierra NevadaRegion, California, USA. Environmental Management. 11(4):519-527.
Jarrett, Robert. 1984. Hydraulics of high-gradient streams. Journalof Hydraulic Engineering. 110(11): 1519-1539.
Jarrett, Robert. 1990. Hydrologic and hydraulic research in moun-tain rivers. Water Resources Bulletin. 26(3): 419-429.
Johnson, Clifton; Smith, Jeffrey. 1979. Reducing stream sedimentloads by irrigation diversions. Transactions of the ASAE. 22(3):573-576.
King, Norman. 1961. An example of channel aggradation induced byflood control. In: Short papers in the geologic and hydrologicsciences, articles 1-146, U.S. Geological Survey Professional Pap.424-B: B29-B32.
Kondolf, G. Mathias. 1997. Application of the pebble count: notes onpurpose, method, and variants. Journal of the American WaterResources Association. 33(1): 79-87.
Leighton, Jeffrey; Risser, Roland. 1989. A riparian vegetationecophysiological response model. In: Proceedings of the Califor-nia riparian systems conference: protection, management, andrestoration for the 1990’s. Gen. Tech. Rep. PSW-110. Albany, CA:U.S. Department of Agriculture, Forest Service, Pacific South-west Forest and Range Experiment Station.
Leopold, Luna. 1994. A view of the river. Cambridge, MA: HarvardUniversity Press. 298 p.
Leopold, Luna; Wolman, M. Gordon; Miller, John P. 1964. Fluvialprocesses in geomorphology. San Francisco, CA: W. H. Freemanand Company. 522 p.
Masterman, Richard; Thorne, Colin. 1992. Predicting influence ofbank vegetation on channel capacity. Journal of Hydraulic Engi-neering. 118(7): 1052-1058.
Petts, G. E. 1984. Impounded rivers. New York: Wiley and Sons:133.
Petts, G. E.; Greenwood, M. 1985. Channel changes and inverte-brate faunas below Nant-Y-Moch dam, River Rheidol, Wales, UK.Hydrobiologia. 122: 65-80.
Ryan, Sandra. 1997. Morphologic response of subalpine streams totransbasin flow diversion. Journal of the American Water Re-sources Association. 33(4): 839-854.
Schumm, Stanley. 1977. The fluvial system. New York: John Wileyand Sons. 338 p.
Smith, Stanley; Wellington, A. Bruce; Nachlinger, Janet; Fox, Carl.1991. Functional responses of riparian vegetation to streamflowdiversion in the Eastern Sierra Nevada. Ecological Applications.1(1): 89-97.
Stromberg, Julie; Patten, Duncan. 1990. Riparian vegetationinstream flow requirements: a case study from a diverted streamin the Eastern Sierra Nevada, CA, USA. EnvironmentalMangement. 14(2): 185-194.
Taylor, Dean W. 1982. Eastern Sierra riparian vegetation: ecologi-cal effects of stream diversions. Contribution No. 6. Mono BasinResearch Group. Report to: Bishop CA: U.S. Department ofAgriculture, Forest Service, Inyo National Forest. 54 p.

19USDA Forest Service Res. Pap. RMRS-RP-20. 2000
Ugarte, Alfonso; Madrid, Manuel. 1994. Roughness coefficient inmountain rivers. Hydraulic Engineering: 652-656.
Wesche, Thomas. 1991. Flushing flow requirements of mountainstream channels. WWRC-91-18. Final Report submitted to Wyo-ming Water Research Center, University of Wyoming, Laramie,WY, and the Wyoming Water Development Commission, HerschlerBuilding, Cheyenne, WY. 195 p.
Whiting, Peter; Stamm, John; Moog, Doug; Orndorff, Rik. 1997.Sediment transporting flows in headwater streams. Completionreport for Contract 93818-RJVA, July 15, 1997. Ogden, UT: U.S.Department of Agriculture, Forest Service Intermountain Re-search Station.
Wiberg, Patricia; Smith, J. Dungan. 1991. Velocity distribution andbed roughness in high-gradient streams. Water Resources Re-search. 27(5): 825-838.
Williams, Garnett. 1978. Bank-full discharge of rivers. Water Re-sources Research. 14(6): 1141-1153.
Williams, Garnett; Wolman, M. Gordon. 1984. Downstream effectsof dams on alluvial rivers. Geological Survey Professional Pap.128G. 83 p.
Wohl, Ellen; Anthony, Deborah; Madsen, Susan; Thompson,Douglas. 1996. A comparison of surface sampling methods forcoarse fluvial sediments. Water Resources Research. 32(10):3219-3226.
Wolman, M. Gordon. 1954. A method of sampling coarse river-bedmaterial. Transactions American Geophysical Union. 35(6):951-956.
Wolman, M. Gordon; Miller, John. 1960. Magnitude and frequencyof forces in geomorphic processes. Journal of Geology. 68: 54-74.


You may order additional copies of this publication by sending yourmailing information in label form through one of the following media.Please specify the publication title and Research Paper number.
Fort Collins Service Center
Telephone (970) 498-1392
FAX (970) 498-1396
E-mail rschneider/[email protected]
Web site http://www.fs.fed.us/rm
Mailing Address Publications DistributionRocky Mountain Research Station240 West Prospect RoadFort Collins, CO 80526
Federal Recycling Program Printed on Recycled Paper

The U.S. Department of Agriculture (USDA) prohibits discrimination in all itsprograms and activities on the basis of race, color, national origin, sex, religion,age, disability, political beliefs, sexual orientation, or marital or familial status. (Notall prohibited bases apply to all programs.) Persons with disabilities who requirealternative means for communication of program information (Braille, large print,audiotape, etc.) should contact USDA’s TARGET Center at (202) 720-2600 (voiceand TDD).
To file a complaint of discrimination, write USDA, Director, Office of Civil Rights,Room 326-W, Whitten Building, 1400 Independence Avenue, SW, Washington, DC(202) 50-9410 or call (202) 720-5964 (voice or TDD). USDA is an equal opportu-nity provider and employer.
The Rocky Mountain Research Station develops scientific informa-tion and technology to improve management, protection, and use ofthe forests and rangelands. Research is designed to meet the needsof National Forest managers, Federal and State agencies, public andprivate organizations, academic institutions, industry, and individuals.
Studies accelerate solutions to problems involving ecosystems,range, forests, water, recreation, fire, resource inventory, land recla-mation, community sustainability, forest engineering technology,multiple use economics, wildlife and fish habitat, and forest insectsand diseases. Studies are conducted cooperatively, and applicationsmay be found worldwide.
Research Locations
Flagstaff, Arizona Reno, NevadaFort Collins, Colorado* Albuquerque, New MexicoBoise, Idaho Rapid City, South DakotaMoscow, Idaho Logan, UtahBozeman, Montana Ogden, UtahMissoula, Montana Provo, UtahLincoln, Nebraska Laramie, Wyoming
*Station Headquarters, Natural Resources Research Center,2150 Centre Avenue, Building A, Fort Collins, CO 80526


![[James Thurber] Alarms and Diversions](https://img.pdfslide.us/doc/110x75/55cf9bfd550346d033a821f0/james-thurber-alarms-and-diversions.jpg)