Embed Size (px)
Citation preview
United States Department of Education Miguel A. Cardona, Ed.D. Secretary
Federal Student Aid Richard Cordray Chief Operating Officer
Finance Directorate Richard Lucas Chief Financial Officer
November 19, 2021
This publication is in the public domain. Authorization to reproduce it, in whole, or in part, is granted. While permission to reprint this publication is not necessary, the citation should be: U.S. Department of Education, Federal Student Aid, Federal Student Aid: Fiscal Year 2021 Annual Report, Washington, D.C., 2021.
This publication is available under Performance Reports located on the Federal Student Aid website at StudentAid.gov/strategic-planning-reporting.
To connect to Federal Student Aid through social media, please visit the Federal Student Aid website at StudentAid.gov or on Twitter at @FAFSA.
Federal Student Aid strives to improve and enhance the content quality, report layout, and public accessibility of the Annual Report. Suggestions on how this report can be made more informative and useful are welcome. The public and other stakeholders are encouraged to submit all questions and comments to [email protected].
Fiscal Year 2021 Annual Report | Federal Student Aid i
Contents
Contents
Introduction...................................................................... iii Letter from the Chief Operating Officer of Federal Student Aid .......................... v About This Report ................................................................................................. viii Overview of the Federal Student Aid Annual Report ........................................... ix
Management’s Discussion and Analysis (Unaudited) ......... 1 Overview of Management’s Discussion and Analysis .......................................... 3 Fiscal Year 2021 Organizational Highlights ........................................................... 4
Looking Forward at Federal Student Aid .............................................................. 4 Federal Student Aid by the Numbers ................................................................... 7
Mission and Organizational Structure ................................................................... 9 Mission ........................................................................................................... 9 Organizational Structure ................................................................................. 10 Mission, Vision, and Core Values ...................................................................... 11 Federal Student Financial Aid Programs............................................................. 14
Performance Management .................................................................................... 19 Performance Management Processes at Federal Student Aid ................................ 21 Agency Priority Goals ...................................................................................... 25 Quality of Performance Data ............................................................................ 26
Analysis of Financial Statements ......................................................................... 27 Introduction .................................................................................................. 27 Balance Sheet ................................................................................................ 29 Statement of Net Cost .................................................................................... 41 Statement of Changes in Net Position ............................................................... 42 Statement of Budgetary Resources ................................................................... 42 Financial Management Highlights ..................................................................... 43
Analysis of Systems, Controls, and Legal Compliance ..................................... 44
Annual Performance Report (Unaudited) ......................... 47 Overview of the Annual Performance Report ...................................................... 49 Introduction to the Annual Performance Report ................................................. 50 Strategic Goals, Objectives, Performance Metrics, and Results ....................... 51
Understanding the Performance Section ............................................................ 56 Strategic Goal 1: Empower a High-Performing Organization................................. 57 Strategic Goal 2: Provide World-Class Customer Experience to the Students, Parents, and Borrowers We Serve .................................................................... 65 Strategic Goal 3: Increase Partner Engagement and Oversight Effectiveness ......... 85 Strategic Goal 4: Strengthen Data Protection and Cybersecurity Safeguards .......... 94 Strategic Goal 5: Enhance the Management and Transparency of the Portfolio ..... 105
Fiscal Year 2021 Accomplishments of Federal Student Aid ............................ 121
ii Fiscal Year 2021 Annual Report | Federal Student Aid
Contents
Additional Required Reporting (Unaudited) ................... 125 Overview of Additional Required Reporting ...................................................... 127 Legislative and Regulatory Recommendations ................................................ 128 Annual Bonus Awards ......................................................................................... 129 Report of the Federal Student Aid Ombudsman ............................................... 130
Summary of All Cases Received in Fiscal Year 2021 .......................................... 130 Activities of the Ombudsman ......................................................................... 141 Ombudsman Recommendations ..................................................................... 144
Financial Section ............................................................ 147 Overview of the Financial Section ...................................................................... 149 Financial Statements ........................................................................................... 150
Consolidated Balance Sheets ......................................................................... 151 Consolidated Statements of Net Cost .............................................................. 152 Consolidated Statements of Changes in Net Position ......................................... 153 Combined Statements of Budgetary Resources ................................................ 154
Notes to the Financial Statements ..................................................................... 155 Required Supplementary Information (Unaudited) ........................................... 192 Independent Auditors’ Report ............................................................................ 199
Office of Inspector General Audit Transmittal ................................................... 199 Independent Auditors’ Report ........................................................................ 201
Other Information (Unaudited) ...................................... 213 Other Information ................................................................................................. 215
Summary of Financial Statement Audit and Management Assurances ................. 215 Management Challenges ............................................................................... 215 Payment Integrity ........................................................................................ 215
Appendices .................................................................... 217 Appendix A: Performance Metrics and Target Changes .................................. 219 Appendix B: Data Validation and Verification Matrix ........................................ 227 Appendix C: Glossary of Acronyms and Terms ................................................ 243 Appendix D: Availability of the FSA Report....................................................... 249

Fiscal Year 2021 Annual Report | Federal Student Aid iii
Introduction
Introduction
iv Fiscal Year 2021 Annual Report | Federal Student Aid
Introduction
This page is intentionally left blank
Fiscal Year 2021 Annual Report | Federal Student Aid v
Introduction
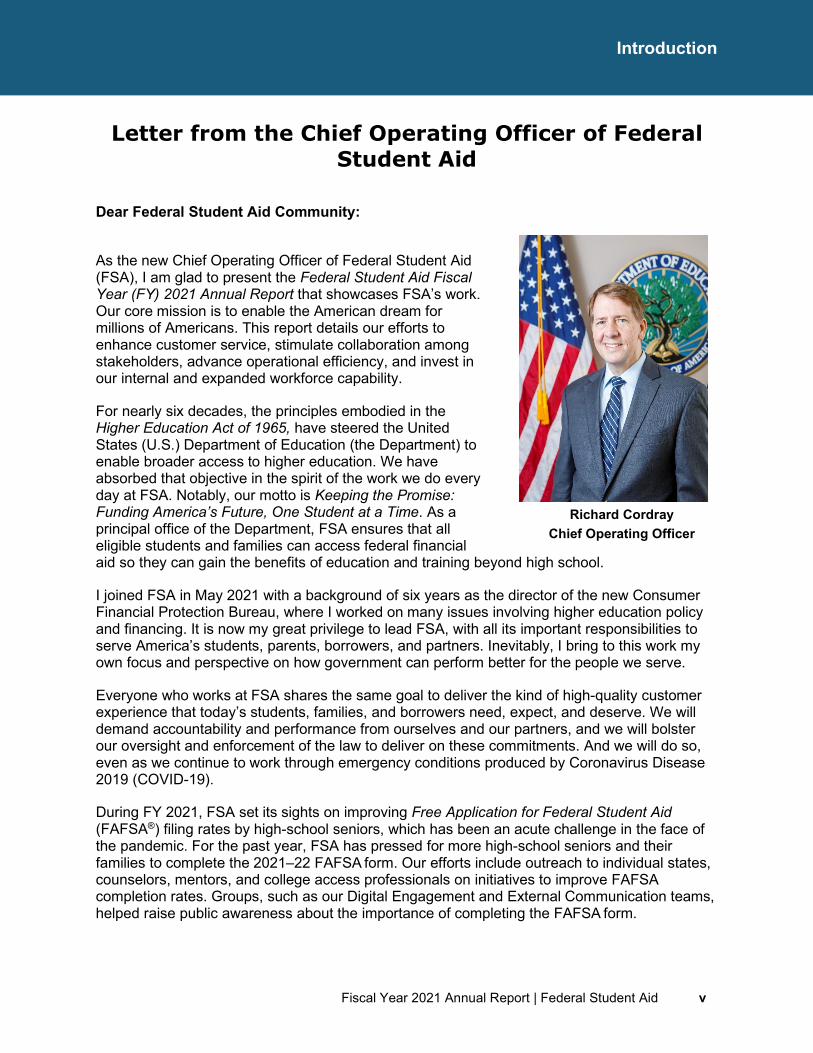
Letter from the Chief Operating Officer of Federal Student Aid
Dear Federal Student Aid Community:
As the new Chief Operating Officer of Federal Student Aid (FSA), I am glad to present the Federal Student Aid Fiscal Year (FY) 2021 Annual Report that showcases FSA’s work. Our core mission is to enable the American dream for millions of Americans. This report details our efforts to enhance customer service, stimulate collaboration among stakeholders, advance operational efficiency, and invest in our internal and expanded workforce capability.
For nearly six decades, the principles embodied in the Higher Education Act of 1965, have steered the United States (U.S.) Department of Education (the Department) to enable broader access to higher education. We have absorbed that objective in the spirit of the work we do every day at FSA. Notably, our motto is Keeping the Promise: Funding America’s Future, One Student at a Time. As a principal office of the Department, FSA ensures that all eligible students and families can access federal financial aid so they can gain the benefits of education and training beyond high school.
I joined FSA in May 2021 with a background of six years as the director of the new Consumer Financial Protection Bureau, where I worked on many issues involving higher education policy and financing. It is now my great privilege to lead FSA, with all its important responsibilities to serve America’s students, parents, borrowers, and partners. Inevitably, I bring to this work my own focus and perspective on how government can perform better for the people we serve.
Everyone who works at FSA shares the same goal to deliver the kind of high-quality customer experience that today’s students, families, and borrowers need, expect, and deserve. We will demand accountability and performance from ourselves and our partners, and we will bolster our oversight and enforcement of the law to deliver on these commitments. And we will do so, even as we continue to work through emergency conditions produced by Coronavirus Disease 2019 (COVID-19).
During FY 2021, FSA set its sights on improving Free Application for Federal Student Aid (FAFSA®) filing rates by high-school seniors, which has been an acute challenge in the face of the pandemic. For the past year, FSA has pressed for more high-school seniors and their families to complete the 2021–22 FAFSA form. Our efforts include outreach to individual states, counselors, mentors, and college access professionals on initiatives to improve FAFSA completion rates. Groups, such as our Digital Engagement and External Communication teams, helped raise public awareness about the importance of completing the FAFSA form.
Richard Cordray
Chief Operating Officer
vi Fiscal Year 2021 Annual Report | Federal Student Aid
Introduction
The COVID-19 emergency persists today. Throughout this period, FSA has maintained its organizational productivity by shifting more resources and assistance online to serve students, families, and partner institutions. In FY 2021, FSA provided approximately $112.0 billion in federal grants, loans, and work-study funds to more than 10.1 million students at approximately 5,600 participating postsecondary schools. FSA transformed challenges into opportunities, particularly as more than 1,400 FSA employees normally stationed in 11 offices around the country instead functioned entirely in a virtual work posture.
While expanding access to higher education is fundamental to our mission, we also focus on the size and complexities of the federal student loan portfolio, which now surpasses $1.6 trillion. This accumulated debt weighs heavily on many Americans and their families, and the decisions we make and execute in managing this portfolio will have lasting effects on their lives. We recognize the need to enhance our stewardship of the various programs, products, services, and operations that address the nation’s accumulated student loan debt. Just as access to higher education itself shapes people’s futures, so do the decisions we must make about the accumulated costs they bear from pursuing their educational programs.
FSA has also worked diligently to ensure that student loan servicers comply with the Coronavirus Aid, Relief, and Economic Security Act (CARES Act) provisions for student loan relief and subsequent extensions. These provisions suspended loan payments, temporarily set the interest rate on all Department-held loans at 0%, and stopped collections on defaulted loans. In late FY 2021, the Department announced a final extension of the student loan payment pause through Jan. 31, 2022. At that point, the payment, interest, and collections pause will end, and the period of student loan repayment for millions of borrowers begins. FSA is currently engaged in an intensive readiness campaign to ensure borrowers and the public are aware of the coming changes, as well as preparing for the heavy service demands that are expected to accompany the resumption of payments.
In FY 2021, FSA worked to improve customer service with an enhanced user experience, proactive partner engagement, and streamlined organizational capabilities. These efforts require innovative planning, including implementation of the ongoing Next Gen Federal Student Aid (Next Gen FSA) initiative that is designed to deliver intuitive, self-service tools for students, parents, and borrowers, including a new primary website for customers at StudentAid.gov. Among the new and improved customer tools that we rolled out are:
• expanded access to FSA’s virtual assistant, Aidan®;
• an update to Loan Simulator that incorporates CARES Act flexibilities for borrowers;
• a redesigned entrance and exit counseling, and Borrower Defense to Repayment Application, in Spanish;
• a redesigned Annual Student Loan Acknowledgment (Acknowledgment) tool featuring easy-to-understand learning modules and a tailored experience for students and parents; and
• improvements to the myStudentAid mobile app with a variety of new features.
FSA seeks to be the most trusted source of information about federal student aid. We do that by promoting transparency, accountability, and proactive assistance. For instance, in FY 2021,
Fiscal Year 2021 Annual Report | Federal Student Aid vii
Introduction
FSA adjudicated approximately 65,500 borrower defense applications and closed 91% of outstanding Freedom of Information Act requests.
FSA conducts oversight, enforcement, and compliance of the postsecondary schools that participate in the federal student aid programs, but also recognizes the importance of finding ways to help schools successfully administer the federal student aid programs. In FY 2021, we fulfilled our oversight responsibilities by resolving more than 1,700 deficient audits and flagged financial statements, and processing more than 5,000 eligibility-related actions, including recertification applications. Additionally, FSA has reduced the number of outstanding Program Reviews. In FY 2021, we issued more than 320 Program Review Reports and Final Program Review Determinations to institutions and third-party servicers subjected to a program review.
Through Project Success, FSA worked to improve student retention, graduation, and cohort default rates at more than 247 minority-serving institutions. These services, which are provided by guaranty agencies without additional charge to participating schools, include tools, programs, and other resources that seek to help students increase their financial literacy and achieve their higher education goals. FSA is also committed to continuing its work beyond Project Success to provide robust regulatory training and technical assistance to minority-serving institutions.
During FY 2021, FSA continued to implement the Federal Student Aid: Strategic Plan, Fiscal Years 2020–24, which is our road map for improving our programs, products, services, and operations. The plan fully reflects our commitment to serve our customers and partners even better while also meeting all new and existing requirements.
I invite you to review the entire report to appreciate what FSA achieved in FY 2021, and to gain a better sense of what lies ahead for our students, our borrowers, and their families.
Sincerely,
Richard Cordray Chief Operating Officer Federal Student Aid United States Department of Education November 19, 2021
viii Fiscal Year 2021 Annual Report | Federal Student Aid
Introduction
About This Report
FSA, a principal office of the U.S. Department of Education (the Department), is required by legislation to produce an annual report, which details the organization’s fiscal year financial and program performance. The Federal Student Aid FY 2021 Annual Report (Annual Report) is a comprehensive document that provides an analysis of FSA’s financial and program performance results for FY 2021 and exhibits the organization’s effectiveness in accomplishing its mission. The Annual Report enables the President of the United States, the U.S. Congress (Congress), and the public to assess the organization’s performance relative to its mission and determine whether FSA has demonstrated accountability for the resources entrusted to it.
This report presents information about FSA’s performance as a Performance-Based Organization (PBO), its initiatives, accomplishments, and challenges, as required by the U.S. Office of Management and Budget (OMB) Circular A-11, Preparation, Submission and Execution of the Budget, Part 6, Section 260 (OMB Circular A-11), and Circular A-136, Financial Reporting Requirements (OMB Circular A-136). The report also satisfies the requirements included in the following federal statutes:
• Higher Education Act of 1965, as amended
• Federal Managers’ Financial Integrity Act of 1982
• Chief Financial Officers Act of 1990
• Federal Credit Reform Act of 1990
• Government Performance and Results Act of 1993
• Government Management Reform Act of 1994
• Federal Financial Management Improvement Act of 1996
• Reports Consolidation Act of 2000
• Improper Payments Information Act of 2002, amended
• Government Performance and Results Modernization Act of 2010
• Improper Payments Elimination and Recovery Act of 2010
• Improper Payments Elimination and Recovery Improvement Act of 2012
• Payment Integrity Information Act of 2019
The Department produces the U.S. Department of Education FY 2021 Agency Financial Report (AFR). That report provides a comprehensive view of the Department’s stewardship over its resources and includes a summary of the information contained in the Annual Report.
The Annual Report is available at StudentAid.gov/strategic-planning-reporting.
Fiscal Year 2021 Annual Report | Federal Student Aid ix
Introduction
Overview of the Federal Student Aid Annual Report
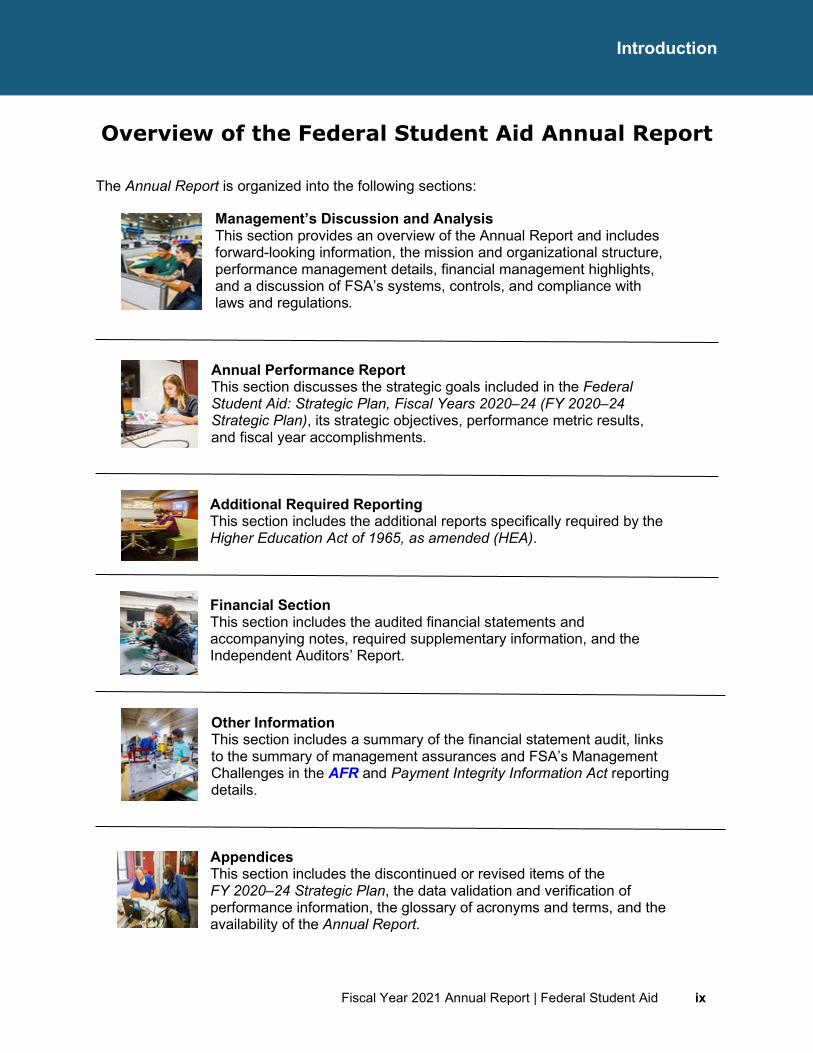
The Annual Report is organized into the following sections:
Management’s Discussion and Analysis This section provides an overview of the Annual Report and includes forward-looking information, the mission and organizational structure, performance management details, financial management highlights, and a discussion of FSA’s systems, controls, and compliance with laws and regulations.
Annual Performance Report This section discusses the strategic goals included in the Federal Student Aid: Strategic Plan, Fiscal Years 2020–24 (FY 2020–24 Strategic Plan), its strategic objectives, performance metric results, and fiscal year accomplishments.
Additional Required Reporting This section includes the additional reports specifically required by the Higher Education Act of 1965, as amended (HEA).
Financial Section This section includes the audited financial statements and accompanying notes, required supplementary information, and the Independent Auditors’ Report.
Other Information This section includes a summary of the financial statement audit, links to the summary of management assurances and FSA’s Management Challenges in the AFR and Payment Integrity Information Act reporting details.
Appendices This section includes the discontinued or revised items of the FY 2020–24 Strategic Plan, the data validation and verification of performance information, the glossary of acronyms and terms, and the availability of the Annual Report.
x Fiscal Year 2021 Annual Report | Federal Student Aid
Introduction
This page is intentionally left blank
Fiscal Year 2021 Annual Report | Federal Student Aid 1
Management’s Discussion and Analysis
Management’s Discussion and Analysis (Unaudited)
2 Fiscal Year 2021 Annual Report | Federal Student Aid
Management’s Discussion and Analysis
This page is intentionally left blank
Fiscal Year 2021 Annual Report | Federal Student Aid 3
Management’s Discussion and Analysis
Overview of Management’s Discussion and Analysis
Management’s Discussion and Analysis provides an overview of the Annual Report. It includes the following subsections:
• Fiscal Year 2021 Organizational Highlights: Fiscal Year 2021 Organizational Highlights presents Looking Forward at Federal Student Aid, which details the most important events and challenges that FSA faces and discusses the actions taken and progress made by FSA in addressing those challenges. This subsection also includes a presentation of Federal Student Aid by the Numbers.
• Mission and Organizational Structure: Mission and Organizational Structure provides the history of FSA; its mission, organizational structure, vision, and core values. The section also includes a discussion of the federal student aid programs.
• Performance Management: Performance Management presents an overview of FSA’s strategic planning and performance management framework. This subsection includes an overview of the FY 2020–24 Strategic Plan, a discussion of the agency priority goals and the quality of FSA’s performance data.
• Analysis of Financial Statements: Analysis of Financial Statements provides an overview of FSA’s financial data, an analysis of the financial data presented in the audited financial statements, a discussion of FSA’s financial management highlights, and the limitations of financial statements.
• Analysis of Systems, Controls, and Legal Compliance: Analysis of Systems, Controls, and Legal Compliance provides FSA’s management assessment in conjunction with the Department’s assessment on FSA’s internal controls related to the Federal Manager’s Financial Integrity Act of 1982 and its compliance with other laws and regulations related to the compliance of financial systems with federal requirements.
4 Fiscal Year 2021 Annual Report | Federal Student Aid
Management’s Discussion and Analysis
Fiscal Year 2021 Organizational Highlights
Looking Forward at Federal Student Aid
In FY 2021, FSA adapted to major shifts in administrative priorities while simultaneously managing the impact of the COVID-19 national emergency on the Title IV of the Higher Education Act of 1965, as amended (Title IV) Programs. All FSA stakeholders, from students to institutions, have required a heightened level of federal engagement to assist them with the challenges of the present moment. In response to this unprecedented time, FSA advanced its capabilities to meet the needs of an evolving digital environment while working to provide better service to students and borrowers, including improving the performance framework associated with loan servicing. In FY 2022, it will be essential for FSA to continue to focus on the major goals in customer service, institutional oversight, cybersecurity, and portfolio management within the FY 2020–24 Strategic Plan.
The FSA strategic plan is guided by the most important aspect of FSA’s mission—the student. The costs and complexity associated with attending a postsecondary institution can make it difficult for students and families to navigate the financial aid programs, thereby underscoring the need for proactive assistance and guidance. For this reason, FSA will place an emphasis on increasing customer knowledge about the Free Application for Federal Student Aid (FAFSA®) and the associated application periods. By providing timely information and technical assistance on the FAFSA form to students, parents, school counselors, college access professionals, and others, FSA will support FAFSA form completion for this academic year and beyond. Consistent with the Administration’s overall effort, the FAFSA form will continue to serve as FSA’s primary vehicle to increase access to postsecondary education for current and future students in America.
In conjunction with communication efforts regarding the FAFSA form, the StudentAid.gov website and myStudentAid mobile app have been enhanced to further support customers. The updates released in FY 2021 improved FSA’s digital engagement by expanding the features and capabilities of the technology that allowed students, parents, and borrowers to gain insight into its program and take action throughout the student aid lifecycle. The significance of the enhancements to the digital products is that they were driven by customer feedback. During the year, FSA conducted a series of customer listening sessions to gather data reflective of customer issues and behavior. This information was utilized to inform operational changes and improve customer satisfaction.
The customer-centric approach will extend to FSA’s work in FY 2022 and beyond. Prior to the close of the fiscal year, FSA procured a customer feedback management tool that will allow it to deploy numerous surveys across its digital contact center and communications channels beginning in the first quarter of FY 2022. FSA’s team will have the ability to review open-ended feedback, including survey comments, social media mentions, and complaints to identify trends and insights. This tool will be an important addition to the communication and operational strategy FSA must execute to effectively manage the successful return to repayment for the millions of borrowers it serves.
The final extension to the CARES Act benefits occurred in August 2021 and will end on Jan. 31, 2022. With the fiduciary responsibility for the entire federal student loan portfolio, FSA
Fiscal Year 2021 Annual Report | Federal Student Aid 5
Management’s Discussion and Analysis
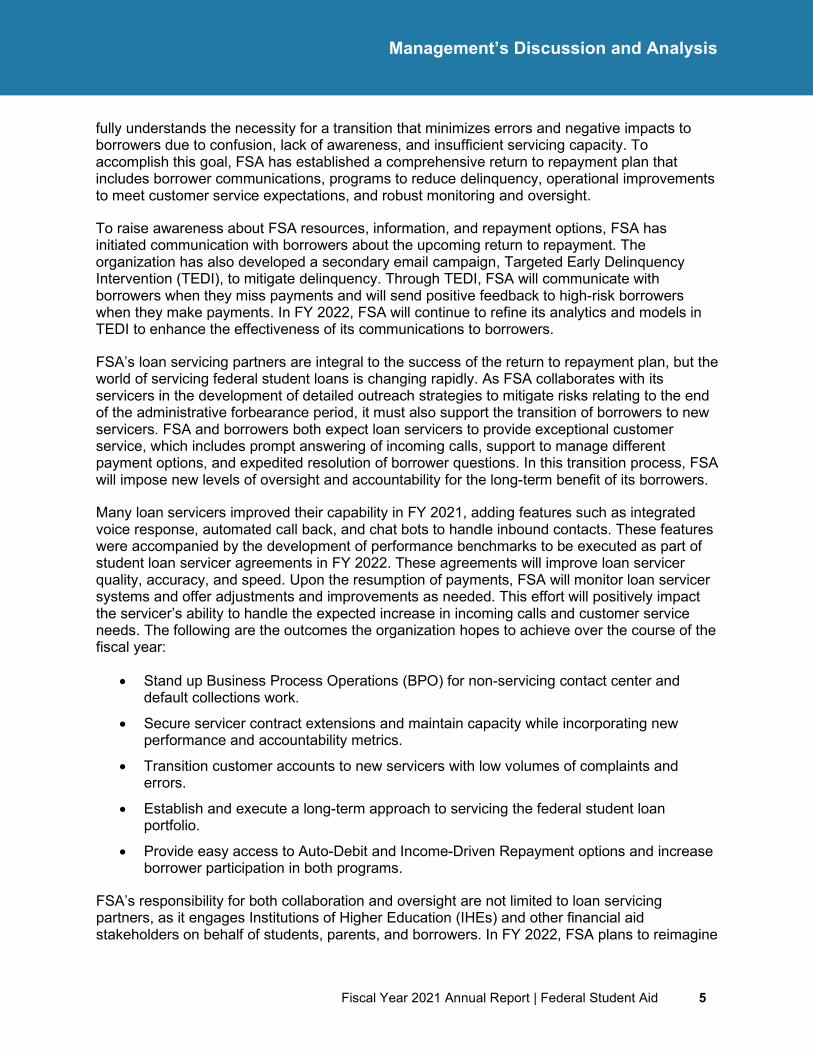
fully understands the necessity for a transition that minimizes errors and negative impacts to borrowers due to confusion, lack of awareness, and insufficient servicing capacity. To accomplish this goal, FSA has established a comprehensive return to repayment plan that includes borrower communications, programs to reduce delinquency, operational improvements to meet customer service expectations, and robust monitoring and oversight.
To raise awareness about FSA resources, information, and repayment options, FSA has initiated communication with borrowers about the upcoming return to repayment. The organization has also developed a secondary email campaign, Targeted Early Delinquency Intervention (TEDI), to mitigate delinquency. Through TEDI, FSA will communicate with borrowers when they miss payments and will send positive feedback to high-risk borrowers when they make payments. In FY 2022, FSA will continue to refine its analytics and models in TEDI to enhance the effectiveness of its communications to borrowers.
FSA’s loan servicing partners are integral to the success of the return to repayment plan, but the world of servicing federal student loans is changing rapidly. As FSA collaborates with its servicers in the development of detailed outreach strategies to mitigate risks relating to the end of the administrative forbearance period, it must also support the transition of borrowers to new servicers. FSA and borrowers both expect loan servicers to provide exceptional customer service, which includes prompt answering of incoming calls, support to manage different payment options, and expedited resolution of borrower questions. In this transition process, FSA will impose new levels of oversight and accountability for the long-term benefit of its borrowers.
Many loan servicers improved their capability in FY 2021, adding features such as integrated voice response, automated call back, and chat bots to handle inbound contacts. These features were accompanied by the development of performance benchmarks to be executed as part of student loan servicer agreements in FY 2022. These agreements will improve loan servicer quality, accuracy, and speed. Upon the resumption of payments, FSA will monitor loan servicer systems and offer adjustments and improvements as needed. This effort will positively impact the servicer’s ability to handle the expected increase in incoming calls and customer service needs. The following are the outcomes the organization hopes to achieve over the course of the fiscal year:
• Stand up Business Process Operations (BPO) for non-servicing contact center and default collections work.
• Secure servicer contract extensions and maintain capacity while incorporating new performance and accountability metrics.
• Transition customer accounts to new servicers with low volumes of complaints and errors.
• Establish and execute a long-term approach to servicing the federal student loan portfolio.
• Provide easy access to Auto-Debit and Income-Driven Repayment options and increase borrower participation in both programs.
FSA’s responsibility for both collaboration and oversight are not limited to loan servicing partners, as it engages Institutions of Higher Education (IHEs) and other financial aid stakeholders on behalf of students, parents, and borrowers. In FY 2022, FSA plans to reimagine
6 Fiscal Year 2021 Annual Report | Federal Student Aid
Management’s Discussion and Analysis
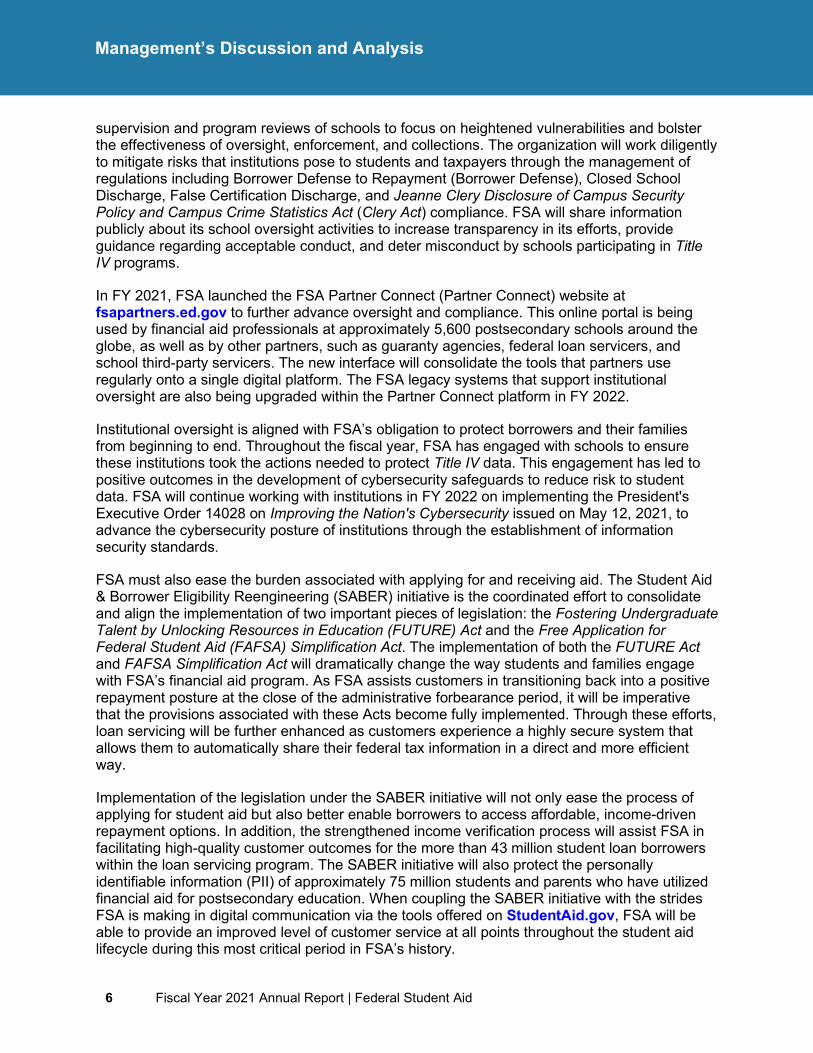
supervision and program reviews of schools to focus on heightened vulnerabilities and bolster the effectiveness of oversight, enforcement, and collections. The organization will work diligently to mitigate risks that institutions pose to students and taxpayers through the management of regulations including Borrower Defense to Repayment (Borrower Defense), Closed School Discharge, False Certification Discharge, and Jeanne Clery Disclosure of Campus Security Policy and Campus Crime Statistics Act (Clery Act) compliance. FSA will share information publicly about its school oversight activities to increase transparency in its efforts, provide guidance regarding acceptable conduct, and deter misconduct by schools participating in Title IV programs.
In FY 2021, FSA launched the FSA Partner Connect (Partner Connect) website at fsapartners.ed.gov to further advance oversight and compliance. This online portal is being used by financial aid professionals at approximately 5,600 postsecondary schools around the globe, as well as by other partners, such as guaranty agencies, federal loan servicers, and school third-party servicers. The new interface will consolidate the tools that partners use regularly onto a single digital platform. The FSA legacy systems that support institutional oversight are also being upgraded within the Partner Connect platform in FY 2022.
Institutional oversight is aligned with FSA’s obligation to protect borrowers and their families from beginning to end. Throughout the fiscal year, FSA has engaged with schools to ensure these institutions took the actions needed to protect Title IV data. This engagement has led to positive outcomes in the development of cybersecurity safeguards to reduce risk to student data. FSA will continue working with institutions in FY 2022 on implementing the President's Executive Order 14028 on Improving the Nation's Cybersecurity issued on May 12, 2021, to advance the cybersecurity posture of institutions through the establishment of information security standards.
FSA must also ease the burden associated with applying for and receiving aid. The Student Aid & Borrower Eligibility Reengineering (SABER) initiative is the coordinated effort to consolidate and align the implementation of two important pieces of legislation: the Fostering Undergraduate Talent by Unlocking Resources in Education (FUTURE) Act and the Free Application for Federal Student Aid (FAFSA) Simplification Act. The implementation of both the FUTURE Act and FAFSA Simplification Act will dramatically change the way students and families engage with FSA’s financial aid program. As FSA assists customers in transitioning back into a positive repayment posture at the close of the administrative forbearance period, it will be imperative that the provisions associated with these Acts become fully implemented. Through these efforts, loan servicing will be further enhanced as customers experience a highly secure system that allows them to automatically share their federal tax information in a direct and more efficient way.
Implementation of the legislation under the SABER initiative will not only ease the process of applying for student aid but also better enable borrowers to access affordable, income-driven repayment options. In addition, the strengthened income verification process will assist FSA in facilitating high-quality customer outcomes for the more than 43 million student loan borrowers within the loan servicing program. The SABER initiative will also protect the personally identifiable information (PII) of approximately 75 million students and parents who have utilized financial aid for postsecondary education. When coupling the SABER initiative with the strides FSA is making in digital communication via the tools offered on StudentAid.gov, FSA will be able to provide an improved level of customer service at all points throughout the student aid lifecycle during this most critical period in FSA’s history.
Fiscal Year 2021 Annual Report | Federal Student Aid 7
Management’s Discussion and Analysis
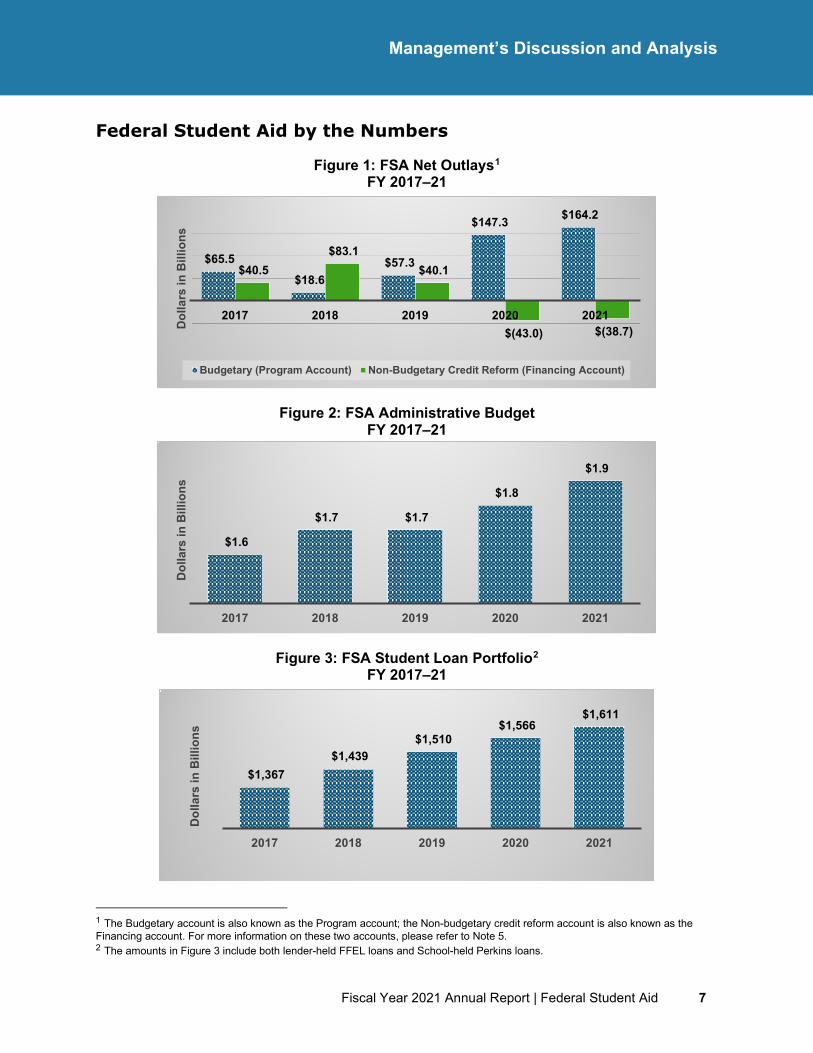
Federal Student Aid by the Numbers
Figure 1: FSA Net Outlays1 FY 2017–21
Figure 2: FSA Administrative Budget FY 2017–21
Figure 3: FSA Student Loan Portfolio2 FY 2017–21
1 The Budgetary account is also known as the Program account; the Non-budgetary credit reform account is also known as the Financing account. For more information on these two accounts, please refer to Note 5. 2 The amounts in Figure 3 include both lender-held FFEL loans and School-held Perkins loans.
$65.5 $18.6
$57.3
$147.3 $164.2
$40.5 $83.1
$40.1
$(43.0) $(38.7)2017 2018 2019 2020 2021
Dol
lars
in B
illio
ns
Budgetary (Program Account) Non-Budgetary Credit Reform (Financing Account)
$1.6
$1.7 $1.7
$1.8
$1.9
2017 2018 2019 2020 2021
Dol
lars
in B
illio
ns
$1,367 $1,439
$1,510 $1,566
$1,611
2017 2018 2019 2020 2021
Dol
lars
in B
illio
ns
8 Fiscal Year 2021 Annual Report | Federal Student Aid
Management’s Discussion and Analysis
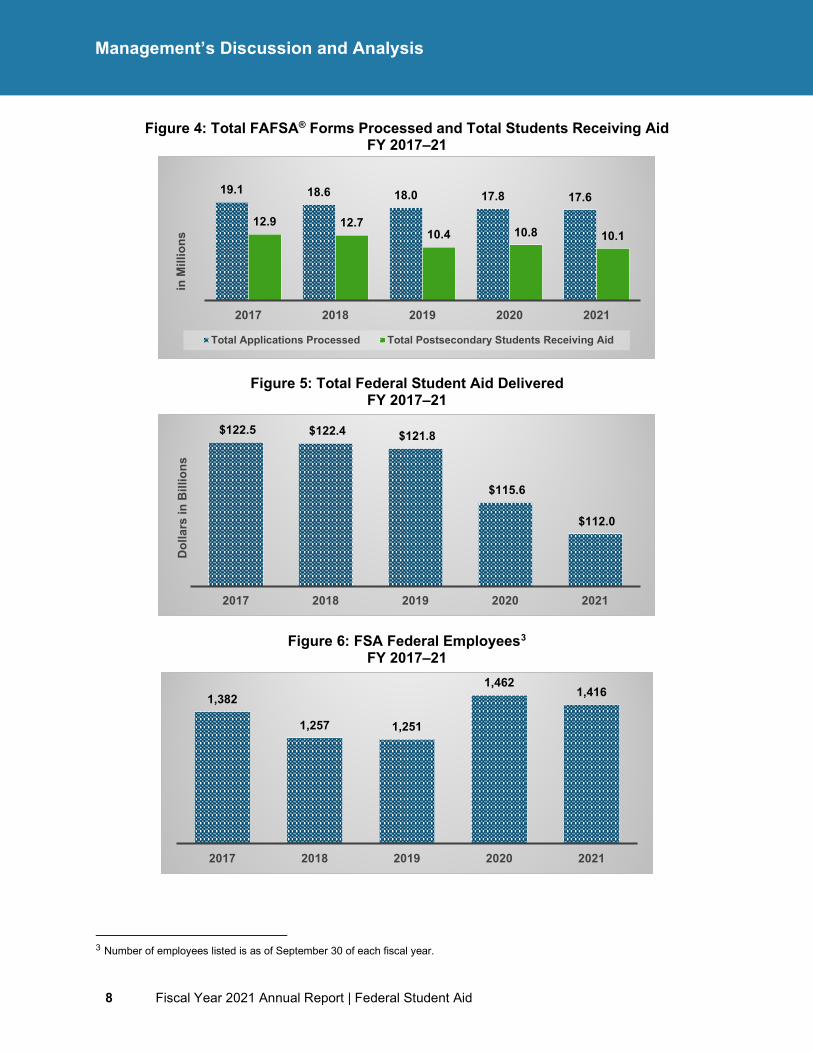
Figure 4: Total FAFSA® Forms Processed and Total Students Receiving Aid FY 2017–21
Figure 5: Total Federal Student Aid Delivered FY 2017–21
Figure 6: FSA Federal Employees3 FY 2017–21
3 Number of employees listed is as of September 30 of each fiscal year.
19.1 18.6 18.0 17.8 17.6
12.9 12.710.4 10.8 10.1
2017 2018 2019 2020 2021
in M
illio
ns
Total Applications Processed Total Postsecondary Students Receiving Aid
$122.5 $122.4 $121.8
$115.6
$112.0
2017 2018 2019 2020 2021
Dol
lars
in B
illio
ns
1,382
1,257 1,251
1,4621,416
2017 2018 2019 2020 2021
Fiscal Year 2021 Annual Report | Federal Student Aid 9
Management’s Discussion and Analysis
Mission and Organizational Structure
Mission
FSA, a principal office of the Department, seeks to ensure that all eligible individuals can benefit from federal financial assistance for education beyond high school. As the nation’s largest provider of federal student financial aid, FSA is responsible for implementing and managing federal student financial assistance programs authorized under the HEA. Specifically, Title IV of the HEA authorizes the federal student assistance programs for which FSA is responsible. These programs provide grants, loans, and work-study funds to students attending colleges or career and technical schools.
To execute the Title IV programs, FSA is responsible for a range of functions across the student aid lifecycle, which include:
• Informing students and families about the availability of the federal student aid programs and the process of applying for and receiving aid from those programs,
• Processing millions of FAFSA forms,
• Accurately disbursing, reconciling, and accounting for billions of dollars of federal student aid funds delivered to students annually,
• Managing the outstanding federal student loan portfolio and securing repayment from federal student loan borrowers,
• Offering free assistance to students, parents, and borrowers throughout the entire financial aid process, and
• Providing oversight and monitoring of all program participants—schools, financial entities, and students—to ensure compliance with the laws, regulations, and policies governing the federal student aid programs.
This complex, multifaceted mission calls on a range of staff skills, and demands coordination by all levels of management. Designated as a PBO by Congress in 1998, FSA emphasizes tangible results and efficient performance, as well as continuous improvement of the processes and systems that support its mission.
10 Fiscal Year 2021 Annual Report | Federal Student Aid
Management’s Discussion and Analysis
Organizational Structure
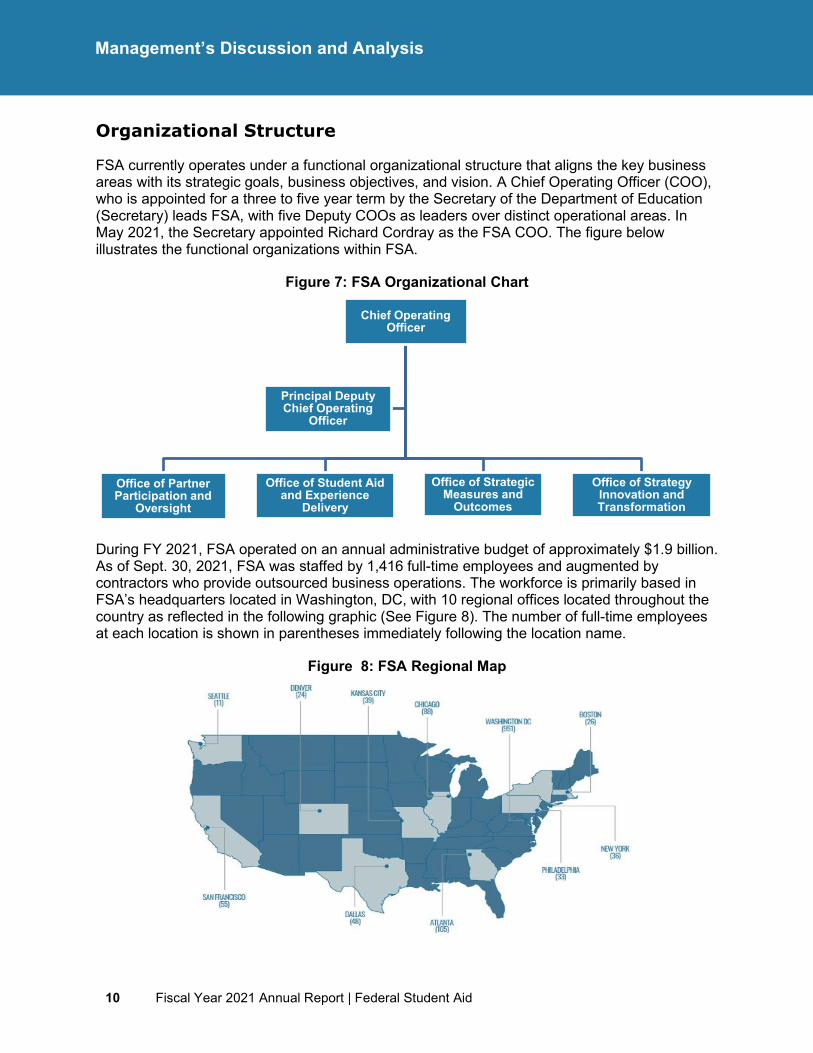
FSA currently operates under a functional organizational structure that aligns the key business areas with its strategic goals, business objectives, and vision. A Chief Operating Officer (COO), who is appointed for a three to five year term by the Secretary of the Department of Education (Secretary) leads FSA, with five Deputy COOs as leaders over distinct operational areas. In May 2021, the Secretary appointed Richard Cordray as the FSA COO. The figure below illustrates the functional organizations within FSA.
Figure 7: FSA Organizational Chart
During FY 2021, FSA operated on an annual administrative budget of approximately $1.9 billion. As of Sept. 30, 2021, FSA was staffed by 1,416 full-time employees and augmented by contractors who provide outsourced business operations. The workforce is primarily based in FSA’s headquarters located in Washington, DC, with 10 regional offices located throughout the country as reflected in the following graphic (See Figure 8). The number of full-time employees at each location is shown in parentheses immediately following the location name.
Figure 8: FSA Regional Map
Chief Operating Officer
Office of Partner Participation and
Oversight
Office of Student Aid and Experience
Delivery
Office of Strategic Measures and
Outcomes
Office of Strategy Innovation and Transformation
Principal Deputy Chief Operating
Officer
Fiscal Year 2021 Annual Report | Federal Student Aid 11
Management’s Discussion and Analysis
Mission, Vision, and Core Values
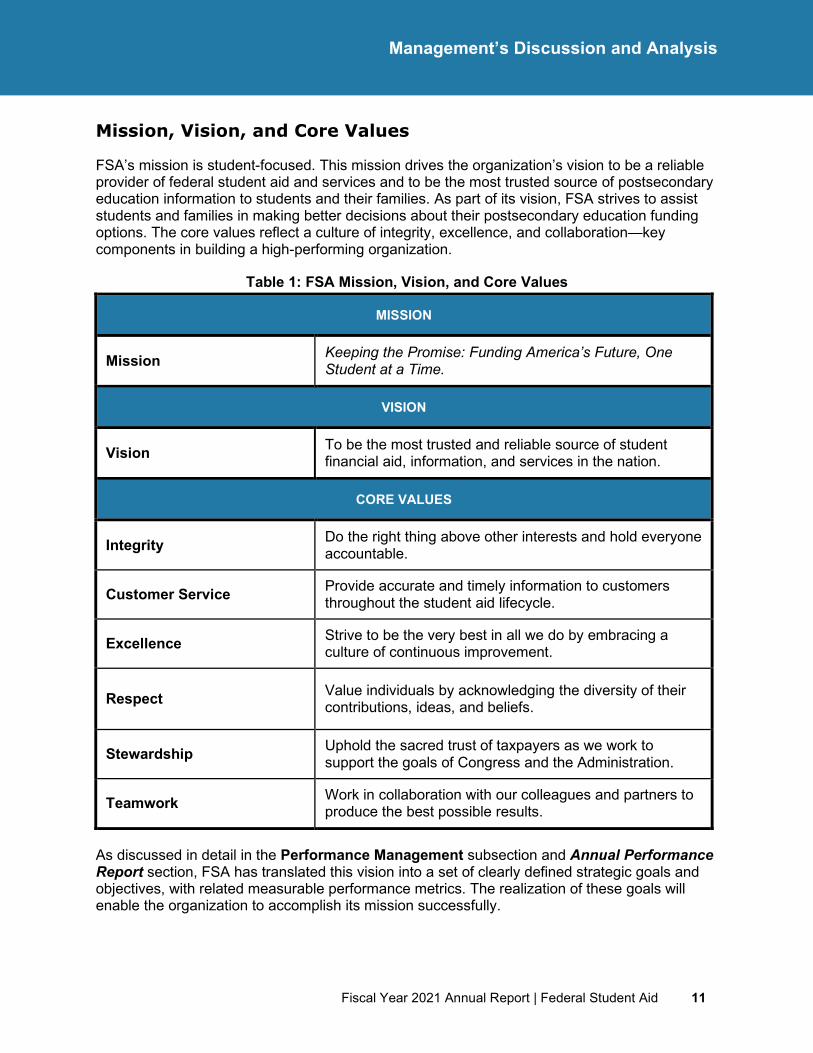
FSA’s mission is student-focused. This mission drives the organization’s vision to be a reliable provider of federal student aid and services and to be the most trusted source of postsecondary education information to students and their families. As part of its vision, FSA strives to assist students and families in making better decisions about their postsecondary education funding options. The core values reflect a culture of integrity, excellence, and collaboration—key components in building a high-performing organization.
Table 1: FSA Mission, Vision, and Core Values
MISSION
Mission Keeping the Promise: Funding America’s Future, One Student at a Time.
VISION
Vision To be the most trusted and reliable source of student financial aid, information, and services in the nation.
CORE VALUES
Integrity Do the right thing above other interests and hold everyone accountable.
Customer Service Provide accurate and timely information to customers throughout the student aid lifecycle.
Excellence Strive to be the very best in all we do by embracing a culture of continuous improvement.
Respect Value individuals by acknowledging the diversity of their contributions, ideas, and beliefs.
Stewardship Uphold the sacred trust of taxpayers as we work to support the goals of Congress and the Administration.
Teamwork Work in collaboration with our colleagues and partners to produce the best possible results.
As discussed in detail in the Performance Management subsection and Annual Performance Report section, FSA has translated this vision into a set of clearly defined strategic goals and objectives, with related measurable performance metrics. The realization of these goals will enable the organization to accomplish its mission successfully.
12 Fiscal Year 2021 Annual Report | Federal Student Aid
Management’s Discussion and Analysis
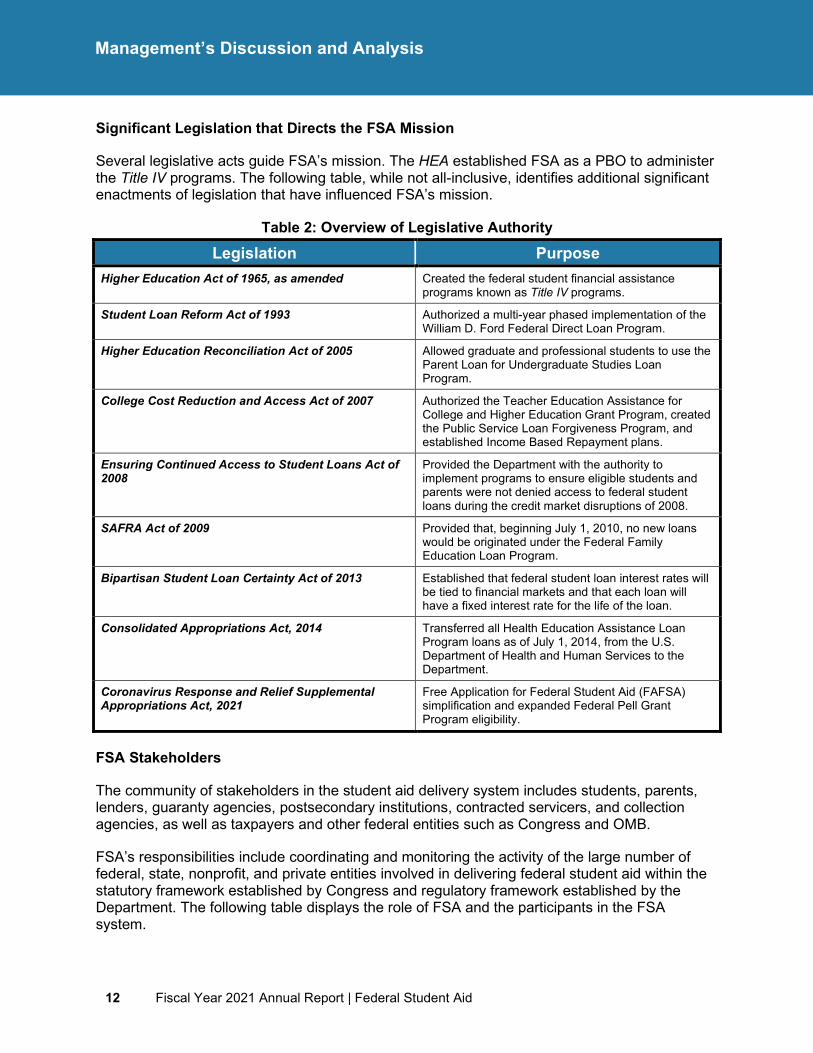
Significant Legislation that Directs the FSA Mission
Several legislative acts guide FSA’s mission. The HEA established FSA as a PBO to administer the Title IV programs. The following table, while not all-inclusive, identifies additional significant enactments of legislation that have influenced FSA’s mission.
Table 2: Overview of Legislative Authority Legislation Purpose
Higher Education Act of 1965, as amended Created the federal student financial assistance programs known as Title IV programs.
Student Loan Reform Act of 1993 Authorized a multi-year phased implementation of the William D. Ford Federal Direct Loan Program.
Higher Education Reconciliation Act of 2005 Allowed graduate and professional students to use the Parent Loan for Undergraduate Studies Loan Program.
College Cost Reduction and Access Act of 2007 Authorized the Teacher Education Assistance for College and Higher Education Grant Program, created the Public Service Loan Forgiveness Program, and established Income Based Repayment plans.
Ensuring Continued Access to Student Loans Act of 2008
Provided the Department with the authority to implement programs to ensure eligible students and parents were not denied access to federal student loans during the credit market disruptions of 2008.
SAFRA Act of 2009 Provided that, beginning July 1, 2010, no new loans would be originated under the Federal Family Education Loan Program.
Bipartisan Student Loan Certainty Act of 2013 Established that federal student loan interest rates will be tied to financial markets and that each loan will have a fixed interest rate for the life of the loan.
Consolidated Appropriations Act, 2014 Transferred all Health Education Assistance Loan Program loans as of July 1, 2014, from the U.S. Department of Health and Human Services to the Department.
Coronavirus Response and Relief Supplemental Appropriations Act, 2021
Free Application for Federal Student Aid (FAFSA) simplification and expanded Federal Pell Grant Program eligibility.
FSA Stakeholders
The community of stakeholders in the student aid delivery system includes students, parents, lenders, guaranty agencies, postsecondary institutions, contracted servicers, and collection agencies, as well as taxpayers and other federal entities such as Congress and OMB.
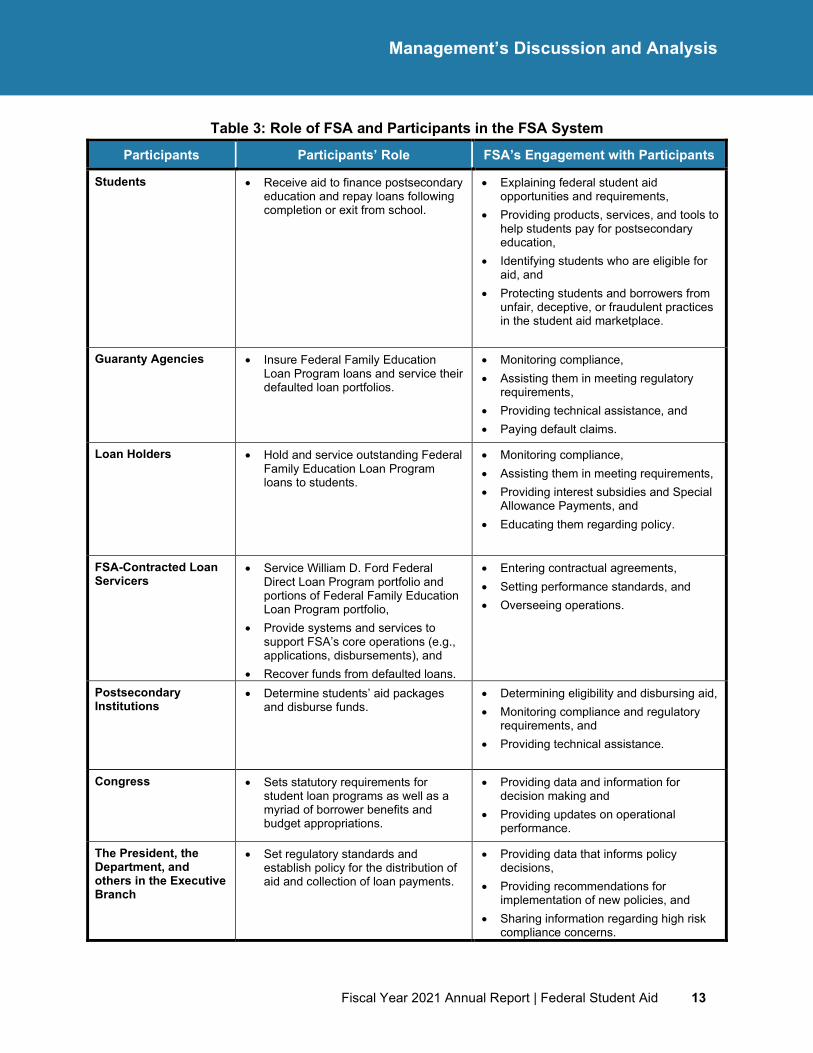
FSA’s responsibilities include coordinating and monitoring the activity of the large number of federal, state, nonprofit, and private entities involved in delivering federal student aid within the statutory framework established by Congress and regulatory framework established by the Department. The following table displays the role of FSA and the participants in the FSA system.
Fiscal Year 2021 Annual Report | Federal Student Aid 13
Management’s Discussion and Analysis
Table 3: Role of FSA and Participants in the FSA System
Participants Participants’ Role FSA’s Engagement with Participants
Students • Receive aid to finance postsecondary education and repay loans following completion or exit from school.
• Explaining federal student aid opportunities and requirements,
• Providing products, services, and tools to help students pay for postsecondary education,
• Identifying students who are eligible for aid, and
• Protecting students and borrowers from unfair, deceptive, or fraudulent practices in the student aid marketplace.
Guaranty Agencies • Insure Federal Family Education Loan Program loans and service their defaulted loan portfolios.
• Monitoring compliance, • Assisting them in meeting regulatory
requirements, • Providing technical assistance, and • Paying default claims.
Loan Holders • Hold and service outstanding Federal Family Education Loan Program loans to students.
• Monitoring compliance, • Assisting them in meeting requirements, • Providing interest subsidies and Special
Allowance Payments, and • Educating them regarding policy.
FSA-Contracted Loan Servicers
• Service William D. Ford Federal Direct Loan Program portfolio and portions of Federal Family Education Loan Program portfolio,
• Provide systems and services to support FSA’s core operations (e.g., applications, disbursements), and
• Recover funds from defaulted loans.
• Entering contractual agreements, • Setting performance standards, and • Overseeing operations.
Postsecondary Institutions
• Determine students’ aid packages and disburse funds.
• Determining eligibility and disbursing aid, • Monitoring compliance and regulatory
requirements, and • Providing technical assistance.
Congress • Sets statutory requirements for student loan programs as well as a myriad of borrower benefits and budget appropriations.
• Providing data and information for decision making and
• Providing updates on operational performance.
The President, the Department, and others in the Executive Branch
• Set regulatory standards and establish policy for the distribution of aid and collection of loan payments.
• Providing data that informs policy decisions,
• Providing recommendations for implementation of new policies, and
• Sharing information regarding high risk compliance concerns.
14 Fiscal Year 2021 Annual Report | Federal Student Aid
Management’s Discussion and Analysis
Federal Student Financial Aid Programs
Each year, FSA delivers billions of dollars in financial aid to students through the Title IV programs of the HEA. These programs collectively represent the nation’s largest source of federal financial aid for postsecondary education students. This aid covers expenses such as tuition and fees, room and board, books and supplies, and transportation. Federal financial aid is mainly distributed to students through:
• Loans: Student aid funds that are borrowed to help pay for eligible education programs and must be repaid with interest,
• Grants: Student aid funds that do not have to be repaid, unless other conditions apply, and
• Work-Study: Part-time employment program that allows students enrolled in college to earn money to help pay for school.
To obtain federal financial aid, prospective aid recipients must complete the FAFSA form. In FY 2021, FSA processed more than 17.6 million FAFSA forms, resulting in the delivery of approximately $112.0 billion in Title IV aid to more than 10.1 million postsecondary students and their families. These students attended approximately 5,600 active institutions of postsecondary education that participate in federal student aid programs, and which are accredited by agencies recognized by the Secretary.
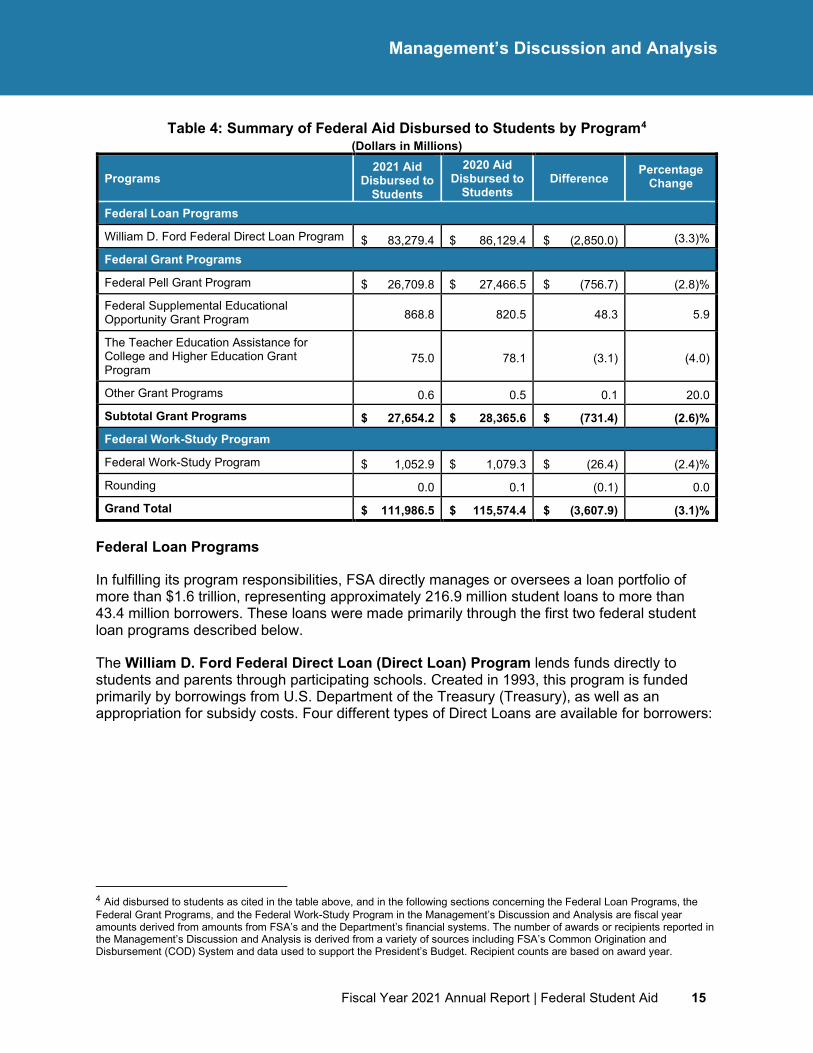
The following table presents a comparison of the amounts of Title IV aid disbursed to students by program in FY 2021 and FY 2020. A summary discussion of each Title IV program is presented in the paragraphs after the table.
Fiscal Year 2021 Annual Report | Federal Student Aid 15
Management’s Discussion and Analysis
Table 4: Summary of Federal Aid Disbursed to Students by Program4 (Dollars in Millions)
Programs 2021 Aid
Disbursed to Students
2020 Aid Disbursed to
Students Difference
Percentage Change
Federal Loan Programs
William D. Ford Federal Direct Loan Program $ 83,279.4 $ 86,129.4 $ (2,850.0) (3.3)%
Federal Grant Programs
Federal Pell Grant Program $ 26,709.8 $ 27,466.5 $ (756.7) (2.8)%
Federal Supplemental Educational Opportunity Grant Program 868.8 820.5 48.3 5.9
The Teacher Education Assistance for College and Higher Education Grant Program
75.0 78.1 (3.1) (4.0)
Other Grant Programs 0.6 0.5 0.1 20.0
Subtotal Grant Programs $ 27,654.2 $ 28,365.6 $ (731.4) (2.6)% Federal Work-Study Program
Federal Work-Study Program $ 1,052.9 $ 1,079.3 $ (26.4) (2.4)%
Rounding 0.0 0.1 (0.1) 0.0
Grand Total $ 111,986.5 $ 115,574.4 $ (3,607.9) (3.1)%
Federal Loan Programs
In fulfilling its program responsibilities, FSA directly manages or oversees a loan portfolio of more than $1.6 trillion, representing approximately 216.9 million student loans to more than 43.4 million borrowers. These loans were made primarily through the first two federal student loan programs described below.
The William D. Ford Federal Direct Loan (Direct Loan) Program lends funds directly to students and parents through participating schools. Created in 1993, this program is funded primarily by borrowings from U.S. Department of the Treasury (Treasury), as well as an appropriation for subsidy costs. Four different types of Direct Loans are available for borrowers:
4 Aid disbursed to students as cited in the table above, and in the following sections concerning the Federal Loan Programs, the Federal Grant Programs, and the Federal Work-Study Program in the Management’s Discussion and Analysis are fiscal year amounts derived from amounts from FSA’s and the Department’s financial systems. The number of awards or recipients reported in the Management’s Discussion and Analysis is derived from a variety of sources including FSA’s Common Origination and Disbursement (COD) System and data used to support the President’s Budget. Recipient counts are based on award year.
16 Fiscal Year 2021 Annual Report | Federal Student Aid
Management’s Discussion and Analysis
• Direct Subsidized Loans: Federal loans based on financial need made to undergraduate students for which the federal government generally does not charge interest while the borrower is in school, in grace, or in deferment status. If the interest is not paid during the grace period, the interest is added to the loan’s principal balance.
• Direct Unsubsidized Loans: Federal loans made to undergraduate students and graduate students for which the borrower is fully responsible for paying the interest regardless of the loan status. Interest on unsubsidized loans accrues from the date of disbursement and continues throughout the life of the loan.
• Direct Parent Loans for Undergraduate Students (PLUS) Loans: Federal loans made to graduate or professional students and parents of dependent undergraduate students for which the borrower is fully responsible for paying the interest regardless of the loan status.
• Direct Consolidation Loans: Federal loans that allow the borrower to combine multiple existing federal student loans into one new loan. The borrower will only have to make one monthly payment on the consolidation loan, and the repayment term of the loan may be longer than the terms of the original loans, which may result in a lower monthly payment.
As of Sept. 30, 2021, FSA’s portfolio of Direct Loans included $1.1 trillion in credit program receivables, net. In FY 2021, the Department made $83.3 billion5 in net loans to 7.2 million recipients.
Under the Federal Family Education Loan (FFEL) Program, students and parents obtained federal loans through private lenders. Guaranty Agencies insure lenders against borrower default; the federal government, in turn, reinsures the guaranty agencies. Federal subsidies ensure private lenders earn a certain yield on the loans they hold.
The passage of the SAFRA Act, which was included in the Health Care and Education Reconciliation Act of 2010 (HCERA) (Pub. L. 111-152), ended the origination of new FFEL Program loans as of July 1, 2010. Nevertheless, FSA, lenders, and guaranty agencies continue to service and collect outstanding FFEL Program loans. FSA, FFEL lenders, and guaranty agencies held a FFEL Program loan portfolio of approximately $105.9 billion as of Sept. 30, 2021. Of this portfolio, $58.2 billion represented FSA’s credit program receivables, net, comprised of $42.1 billion in loans acquired under the Ensuring Continued Access to Student Loans Act of 2008 (ECASLA) authorization and $16.1 billion acquired under the "traditional" (Non-ECASLA) guaranteed loan program. In FY 2021, FSA made gross payments of approximately $350.2 million to lenders for interest and special allowance subsidies and $3.7 billion to guaranty agencies for reinsurance claims and fees paid for account maintenance, default aversion, and collection activities.
ECASLA authorized the Department to implement a number of programs to ensure credit market disruptions did not deny eligible students and parents access to federal student loans for the 2008–09 and 2009–10 academic years. The authority for two ECASLA Programs, the Loan Purchase Commitment Program, and the Loan Participation Interest Purchase Program, expired
5 Excludes consolidation loans of $21.5 billion.
Fiscal Year 2021 Annual Report | Federal Student Aid 17
Management’s Discussion and Analysis
after Sept. 30, 2010. The third ECASLA Program, the Asset-Backed Commercial Paper Conduit (ABCP Conduit) Program, ended in January 2014.
The Federal Perkins Loan Program was one of three campus-based student aid programs. These federal loans were made by schools to undergraduate and graduate students who demonstrate financial need. Historically, participating schools received a certain amount of funds each year from FSA for distribution under this program, which supplemented funds in a school’s revolving fund, from which new disbursements were made. These funds enabled eligible institutions to offer low-interest loans to students based on financial need. Once the full amount of the school’s funds had been awarded to students, no additional loans were to be made under this program for the year. The Federal Perkins Loan Program Extension Act of 2015 eliminated the authorization for schools to make new Federal Perkins loan disbursements as of Sept. 30, 2017 and ended all Perkins loan disbursements by June 30, 2018.
The Health Education Assistance Loan (HEAL) Program was transferred to the Department from the U.S. Department of Health and Human Services in FY 2014 under the Consolidated Appropriations Act, 2014 (Pub. L. 113-76). This program enabled graduate students in schools of medicine, osteopathy, dentistry, veterinary medicine, optometry, podiatry, public health, pharmacy, chiropractic, or programs in health administration and clinical psychology to obtain federally insured loans through participating lenders. Since Sept. 30, 1998, no new loans have been originated through this program; however, borrowers are still obligated to repay any outstanding loans obtained through the program.
The Department assumed responsibility for the program and the authority to administer, service, collect, and enforce the loans. Credit program receivables, net of allowance for subsidy, were approximately $413.0 million for FY 2021.
Federal Grant Programs
In fulfilling its responsibility for administering Title IV aid, FSA oversaw the disbursement of approximately $27.7 billion in grants to approximately 6.2 million recipients. The following provides a summary for each grant program, including aid disbursed in FY 2021.
The Federal Pell Grant (Pell Grant) Program helps ensure financial access to postsecondary education by providing grant aid to low-income and middle-income undergraduate students. Considered the foundation of a student’s financial aid package, Pell Grants vary according to the financial circumstances of students and their families. In FY 2021, the Department disbursed $26.7 billion in Pell Grants averaging approximately $4,300 to approximately 6.2 million students. The maximum Pell Grant award was $6,345 in the 2020–21 award year and increased to $6,495 in the 2021–22 award year.
The Federal Supplemental Educational Opportunity Grant Program is one of three campus-based programs through which the Department provides funds directly to eligible institutions. Funds provided through this program enable eligible institutions to offer grants to students based on need. Federal grants distributed under this program are administered directly by the financial aid office at each participating school. Each participating school receives a certain amount of Federal Supplemental Educational Opportunity Grant funds each year from FSA. Once the full amount of the school’s grant funds has been awarded to students, no additional awards can be made under this program for the year. This form of aid does not require
18 Fiscal Year 2021 Annual Report | Federal Student Aid
Management’s Discussion and Analysis
repayment. In FY 2021, approximately $868.8 million were disbursed through approximately 1.7 million campus-based awards.
The Teacher Education Assistance for College and Higher Education (TEACH) Grant Program provides individual awards up to $4,000 per year to students agreeing to teach mathematics, science, or other specialized subjects in a high-poverty school for at least four years within eight years of their graduation. This grant program began in the 2008–09 school year, starting July 1, 2008. For any award year 2020–21 or 2021–22 TEACH Grant first disbursed on or after Oct. 1, 2020, and before Oct. 1, 2021, the maximum award is $3,772. For any award year 2021–22 TEACH Grant first disbursed on or after Oct. 1, 2021, and before Oct. 1, 2022, the maximum award is $3,772. If students fail to fulfill the service requirements specific to the program, their TEACH Grants convert to Direct Unsubsidized Loans, with interest accruing from the time of the award. During FY 2021, there were 3,236 involuntary conversions and 2,597 voluntary conversions from TEACH grant status to direct unsubsidized loans. Those grantees who are involuntarily converted to loan status have the right to appeal an involuntary conversion. During FY 2021 there were approximately 1,125 reinstatements from a loan status back to grant status. In FY 2021, the Department disbursed approximately 24,000 grants totaling $75.0 million under the TEACH Grant Program.
The Iraq and Afghanistan Service Grant Program, which became effective July 1, 2010, provides non-need-based grants to students whose parent or guardian was a member of the Armed Forces and died in Iraq or Afghanistan because of military service after Sept. 11, 2001. These grants are awarded to students who are not eligible for a Pell Grant based on financial need, but meet the remaining Pell Grant eligibility requirements, and:
• Have a parent or guardian who was a member of the U.S. Armed Forces and died as a result of military service in Iraq or Afghanistan after the 9/11 events, and
• Were under 24 years old or enrolled in college at least part-time at the time of the parent or guardian’s death.
For any award year 2021–22 Iraq and Afghanistan Service Grant first disbursed on or after Oct. 1, 2020, and before Oct. 1, 2021, the maximum award is approximately $5,983. For any award year 2021–22 Iraq and Afghanistan Service Grant first disbursed on or after Oct. 1, 2021, and before Oct. 1, 2022, the maximum award is approximately $6,125. The Department disbursed approximately $0.6 million to support fewer than 100 awards in FY 2021.
Federal Work-Study Program
The Federal Work-Study Program is one of three campus-based programs through which the Department provides funds directly to eligible institutions. Funds provided through this program enable eligible institutions to offer part-time employment to undergraduate, graduate, and professional students based on financial need, allowing them to earn money to help pay education expenses. The program is available to full-time or part-time students and encourages community service work. The work is often related to the student’s course of study. In FY 2021, approximately $1.1 billion were disbursed through more than 651,000 campus-based awards.
Fiscal Year 2021 Annual Report | Federal Student Aid 19
Management’s Discussion and Analysis
Performance Management
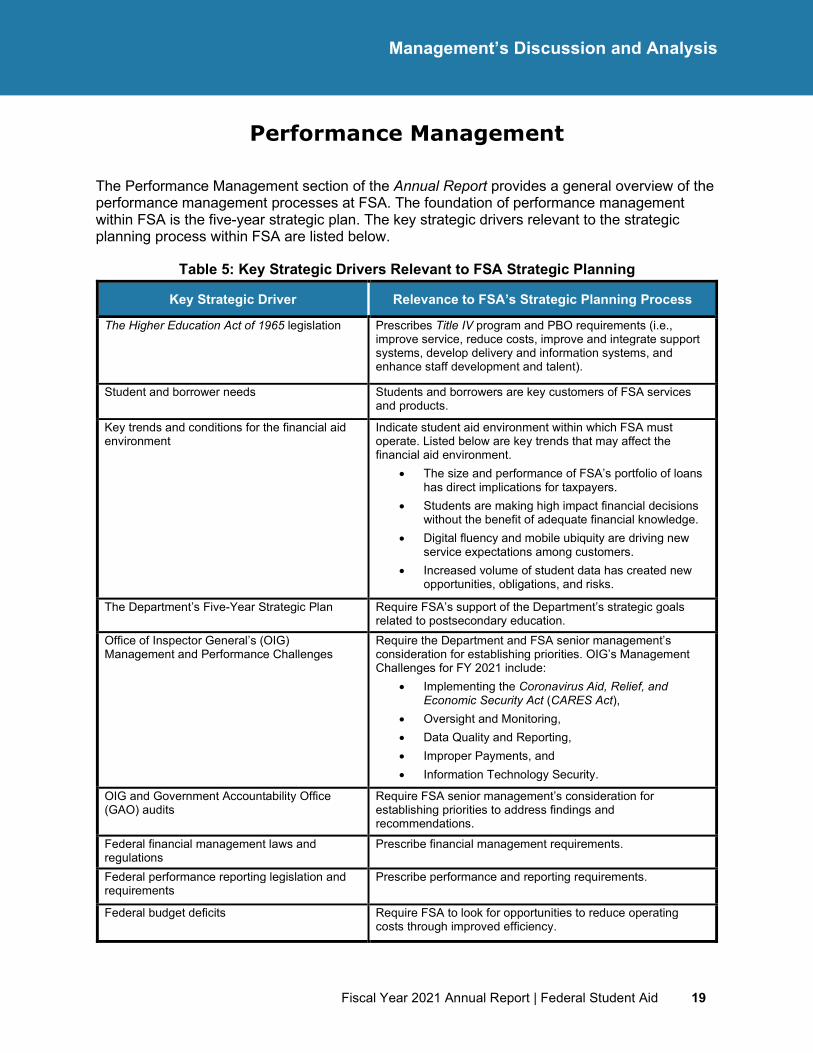
The Performance Management section of the Annual Report provides a general overview of the performance management processes at FSA. The foundation of performance management within FSA is the five-year strategic plan. The key strategic drivers relevant to the strategic planning process within FSA are listed below.
Table 5: Key Strategic Drivers Relevant to FSA Strategic Planning
Key Strategic Driver Relevance to FSA’s Strategic Planning Process
The Higher Education Act of 1965 legislation Prescribes Title IV program and PBO requirements (i.e., improve service, reduce costs, improve and integrate support systems, develop delivery and information systems, and enhance staff development and talent).
Student and borrower needs Students and borrowers are key customers of FSA services and products.
Key trends and conditions for the financial aid environment
Indicate student aid environment within which FSA must operate. Listed below are key trends that may affect the financial aid environment.
• The size and performance of FSA’s portfolio of loans has direct implications for taxpayers.
• Students are making high impact financial decisions without the benefit of adequate financial knowledge.
• Digital fluency and mobile ubiquity are driving new service expectations among customers.
• Increased volume of student data has created new opportunities, obligations, and risks.
The Department’s Five-Year Strategic Plan Require FSA’s support of the Department’s strategic goals related to postsecondary education.
Office of Inspector General’s (OIG) Management and Performance Challenges
Require the Department and FSA senior management’s consideration for establishing priorities. OIG’s Management Challenges for FY 2021 include:
• Implementing the Coronavirus Aid, Relief, and Economic Security Act (CARES Act),
• Oversight and Monitoring, • Data Quality and Reporting, • Improper Payments, and • Information Technology Security.
OIG and Government Accountability Office (GAO) audits
Require FSA senior management’s consideration for establishing priorities to address findings and recommendations.
Federal financial management laws and regulations
Prescribe financial management requirements.
Federal performance reporting legislation and requirements
Prescribe performance and reporting requirements.
Federal budget deficits Require FSA to look for opportunities to reduce operating costs through improved efficiency.
20 Fiscal Year 2021 Annual Report | Federal Student Aid
Management’s Discussion and Analysis
The key strategic drivers inform the strategic planning process, aligning FSA with the PBO requirements outlined in the HEA while ensuring future consistency and accountability. In this way, the key strategic drivers influence the development and implementation of FSA’s strategic plan, as well as the development and tracking of performance metrics. The Performance Management section illustrates the outcome of this effort by discussing the following:
• FSA’s performance management processes,
• FSA’s FY 2020–24 strategic goals,
• FSA’s alignment to the Department of Education Strategic Plan for Fiscal Year 2018–22 (FY 2018–22 Strategic Plan), and
• FSA’s efforts to validate the quality of performance data reported.
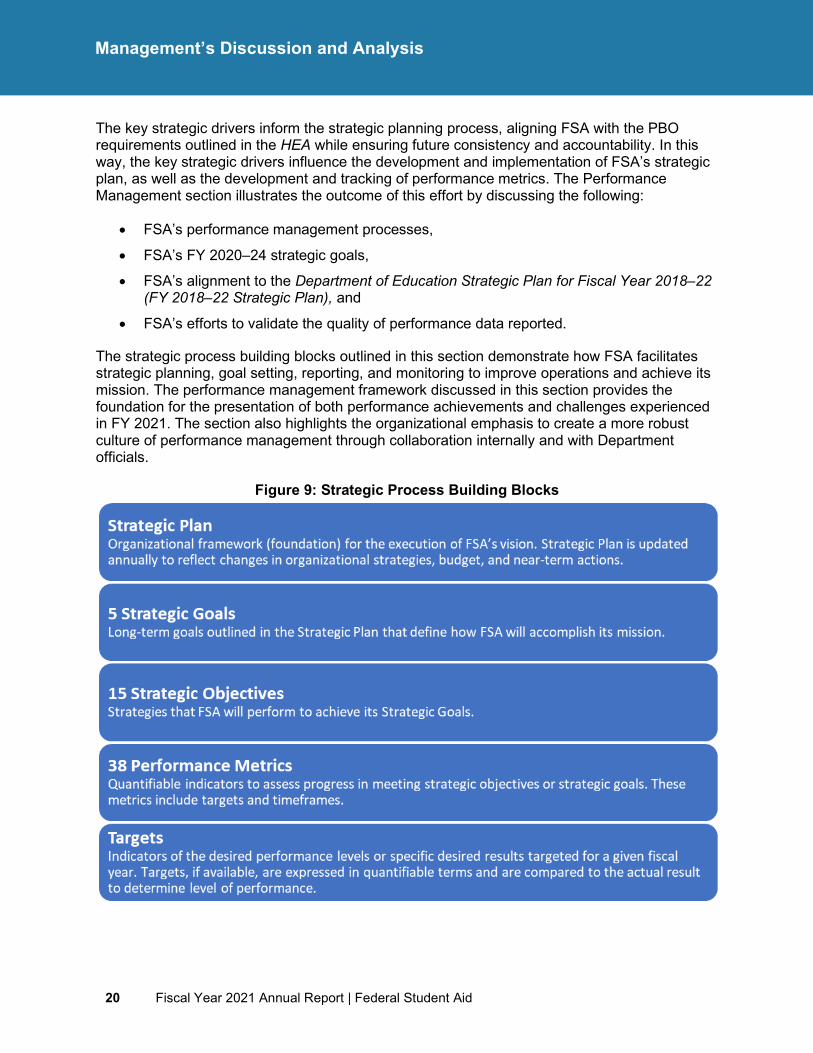
The strategic process building blocks outlined in this section demonstrate how FSA facilitates strategic planning, goal setting, reporting, and monitoring to improve operations and achieve its mission. The performance management framework discussed in this section provides the foundation for the presentation of both performance achievements and challenges experienced in FY 2021. The section also highlights the organizational emphasis to create a more robust culture of performance management through collaboration internally and with Department officials.
Figure 9: Strategic Process Building Blocks
Fiscal Year 2021 Annual Report | Federal Student Aid 21
Management’s Discussion and Analysis
Performance Management Processes at Federal Student Aid
During FY 2021, FSA used a tiered performance management framework to establish goals and communicate, measure, and report performance:
• FSA FY 2020–24 Strategic Plan
• Weekly Organization Briefings
• Bi-Weekly Performance Accountability Meetings
• Annual Performance Report
• Department’s Quarterly and Annual Performance Reviews
• Agency Priority Goals (APGs)
FSA FY 2020‒24 Strategic Plan
The FY 2020–24 Strategic Plan outlines goals, objectives, and performance metrics that provide a roadmap for how FSA will successfully operate, respond to change, and execute its mission moving forward. These strategic goals collectively provide the framework for continuous improvement at FSA, guide the organization in managing its programs more effectively, and offer clear strategic direction to all of FSA’s internal and external constituencies. To provide the framework to effectively achieve these outcomes, the five-year strategic goals must be:
• Appropriate to the mission of the organization,
• Realistic and measurable,
• Achievable in the time frame established,
• Challenging in their performance targets, and
• Understandable to the layperson with language that is unambiguous and terminology that is adequately defined.
Each strategic goal encompasses objectives and identifies performance metrics to measure FSA’s level of success in meeting the strategic goal. For each performance metric, FSA identifies a target level of performance for each fiscal year. FSA sets the target level of performance at a challenging, but realistic level that is achievable within the timeframe. Meeting or exceeding the target indicates that FSA succeeded in attaining the established performance metric, while falling short of the target indicates that FSA did not attain the performance metric.
FSA is committed to continuous performance improvement and conducts frequent reviews of its strategic plan. During FY 2021, FSA reviewed its FY 2020–24 Strategic Plan and identified changes that would improve delivery of its mission and enhance its performance reporting. As a result of its strategic review, FSA refined its performance measurements to reflect better strategies in driving progress towards achieving strategic objectives and present a more accurate measure of FSA’s performance in meeting the goals. During the annual update effort in FY 2021, 6 performance metrics were discontinued from 44 metrics, resulting in a total of 38 metrics to reflect shifts in strategies or objectives derived from the analysis of outcomes, success criteria, and other evidence. To read more about performance measurement and metric
22 Fiscal Year 2021 Annual Report | Federal Student Aid
Management’s Discussion and Analysis
target changes, refer to the Annual Performance Report and Appendices sections included in this report.
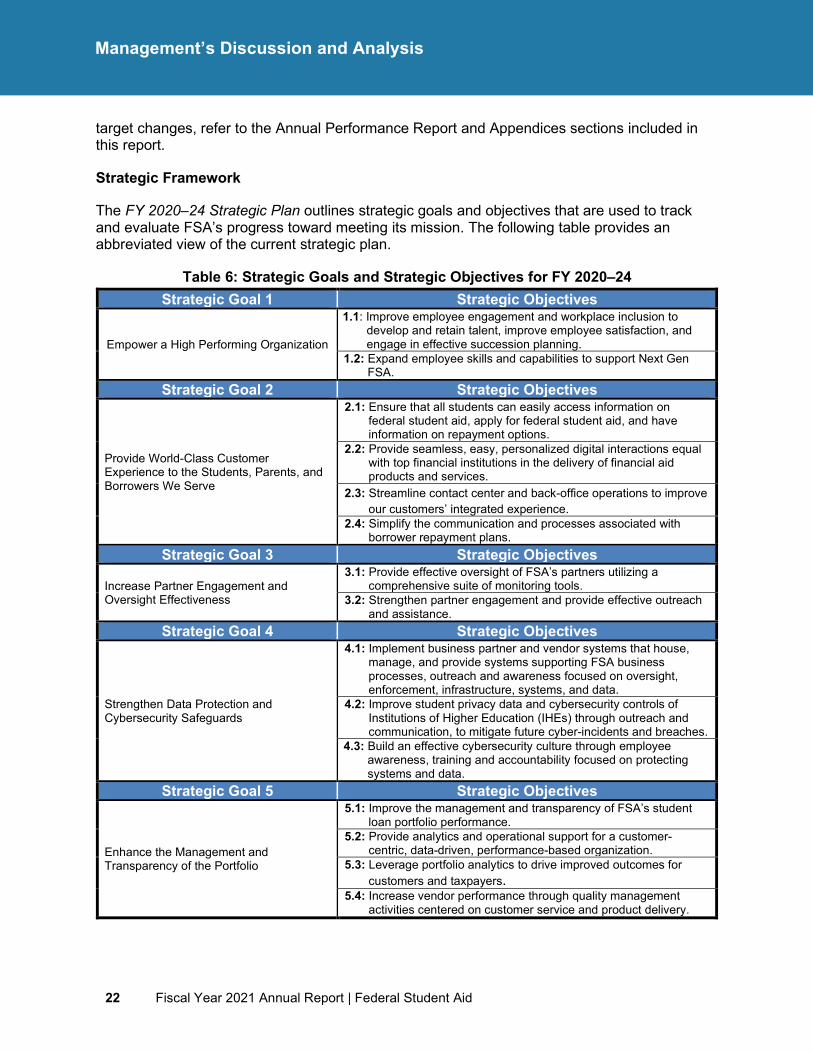
Strategic Framework
The FY 2020–24 Strategic Plan outlines strategic goals and objectives that are used to track and evaluate FSA’s progress toward meeting its mission. The following table provides an abbreviated view of the current strategic plan.
Table 6: Strategic Goals and Strategic Objectives for FY 2020‒24 Strategic Goal 1 Strategic Objectives
Empower a High Performing Organization
1.1: Improve employee engagement and workplace inclusion to develop and retain talent, improve employee satisfaction, and engage in effective succession planning.
1.2: Expand employee skills and capabilities to support Next Gen FSA.
Strategic Goal 2 Strategic Objectives
Provide World-Class Customer Experience to the Students, Parents, and Borrowers We Serve
2.1: Ensure that all students can easily access information on federal student aid, apply for federal student aid, and have information on repayment options.
2.2: Provide seamless, easy, personalized digital interactions equal with top financial institutions in the delivery of financial aid products and services.
2.3: Streamline contact center and back-office operations to improve our customers’ integrated experience.
2.4: Simplify the communication and processes associated with borrower repayment plans.
Strategic Goal 3 Strategic Objectives
Increase Partner Engagement and Oversight Effectiveness
3.1: Provide effective oversight of FSA’s partners utilizing a comprehensive suite of monitoring tools.
3.2: Strengthen partner engagement and provide effective outreach and assistance.
Strategic Goal 4 Strategic Objectives
Strengthen Data Protection and Cybersecurity Safeguards
4.1: Implement business partner and vendor systems that house, manage, and provide systems supporting FSA business processes, outreach and awareness focused on oversight, enforcement, infrastructure, systems, and data.
4.2: Improve student privacy data and cybersecurity controls of Institutions of Higher Education (IHEs) through outreach and communication, to mitigate future cyber-incidents and breaches.
4.3: Build an effective cybersecurity culture through employee awareness, training and accountability focused on protecting systems and data.
Strategic Goal 5 Strategic Objectives
Enhance the Management and Transparency of the Portfolio
5.1: Improve the management and transparency of FSA’s student loan portfolio performance.
5.2: Provide analytics and operational support for a customer-centric, data-driven, performance-based organization.
5.3: Leverage portfolio analytics to drive improved outcomes for customers and taxpayers.
5.4: Increase vendor performance through quality management activities centered on customer service and product delivery.
Fiscal Year 2021 Annual Report | Federal Student Aid 23
Management’s Discussion and Analysis
Weekly Organization Briefings
The Organization Briefings in FY 2021 have enhanced the strategic alignment within FSA in operations, products, and accountability in achieving results. Discussions in the briefings enabled attendees to make strategic connections between the work that is performed throughout FSA and its impact on its stakeholders. Information discussed in the briefings also contributed to developing the FY 2021 Annual Report. These briefings evolved from the Daily Standup meetings which began in FY 2020 for senior leaders to discuss hot topics. The transformation from hot topic discussions to Organization Briefings in the second quarter of FY 2021 enabled FSA to perform strategic reviews of its performance metrics and other performance related topics. It also expanded the leadership discussions to a broader audience of FSA leaders, managers, supervisors, and subject matter experts across headquarters and ten regional offices. Offering the briefings to a broader audience helped increase the attendees’ access to information across FSA and enabled the organization to gain a diverse perspective on strategic planning and performance management efforts.
During FY 2021, participants were surveyed to gain insight into the strengths and benefits of the briefings, as well as the opportunities for improving performance discussions. Approximately 70% of the survey respondents found the briefings effective in providing information that would help FSA to achieve its performance goals as an organization. In following the OMB’s guidance for strategic planning and performance reporting, FSA developed helpful guides, processes, and tools to strengthen its performance discussions and methodologies in data collection and reporting. To further advance FSA’s strategic framework, the Organization Briefings established various themes that illustrated the efforts of specific business areas in advancing the goals and objectives of the FY 2020–24 Strategic Plan.
Over the course of seven months, FSA developed an extensive catalog of presentations from the Organization Briefings, including a mid-year strategic performance review series highlighting performance progress, risk management, accomplishments, and opportunities in business areas. The frequent data-driven and results-oriented analyses offered greater transparency and accountability in managing FSA’s strategies to achieve its goals and objectives while strengthening partnerships across FSA, the Department, and with external stakeholders. In addition, the briefing themes and structure benefitted the attendees with tools and knowledge to develop their competencies to drive for results, serve customers, and build successful teams and coalitions within and outside the organization. These competencies are executive core qualifications identified by the Office of Personnel Management (OPM) to assess executive experience and potential.
Bi-Weekly Performance Accountability Meetings
Throughout FY 2021, FSA measured and analyzed performance based upon performance metric results outlined in the FY 2020–24 Strategic Plan, as well as various internal metrics used for operational management. The analysis of performance is a transparent process within the organization, executed through weekly performance reports and bi-weekly accountability meetings with the FSA leadership and management team.
Detailed analyses of specified performance metrics are developed and provided to the FSA leadership and management team in the form of dashboards. The organization updates 27 dashboards, with approximately 90 metrics on a weekly basis. Areas of focus and metrics are added as FSA identifies potential concerns or opportunities for improvement.
24 Fiscal Year 2021 Annual Report | Federal Student Aid
Management’s Discussion and Analysis
Progress on designated performance metrics, both negative and positive, is discussed in an open forum during the bi-weekly meetings. For any performance metrics not on track, the analysis must include identification of the root cause of the unexpected result and a recommendation of the appropriate corrective actions necessary to improve performance. Performance dashboards for the FY 2020–24 Strategic Plan and the performance metrics associated with the Department’s Quarterly Performance Review were also maintained throughout FY 2021 and utilized to discuss performance metric progress on a quarterly basis.
Annual Performance Report
To report progress on meeting the strategic goals, FSA prepares and publishes an Annual Performance Report, which is included in the Annual Report. In addition to the Annual Performance Report, the Annual Report includes FSA management’s discussion and analysis of financial and performance results, its audited financial statements and notes, and the report of the independent auditors.
Department of Education Quarterly and Annual Performance Reviews
The Department conducts quarterly data-driven performance reviews with principal offices on progress towards achieving agency priorities. The Quarterly Performance Review framework primarily focuses on process improvements and capacity building, providing principal offices an opportunity to establish specific milestones.
FSA’s FY 2020–24 Strategic Plan supports the Department’s overall strategic goals and directions, as defined in the Department’s FY 2018–22 Strategic Plan. Currently, FSA tracks the performance of 14 metrics that support the following Department’s strategic goals:
• Goal 2: Expand postsecondary educational opportunities; improve outcomes to foster economic opportunity; and promote an informed, thoughtful, and productive citizenry.
• Goal 3: Strengthen the quality, accessibility, and use of education data through better management, increased privacy protections, and transparency.
The Department will publish its Department of Education Strategic Plan for Fiscal Years 2022–26 in February 2022, and establish updated strategic goals, objectives, and performance indicators to assess progress toward the Administration’s priorities of increasing postsecondary education access, affordability, completion, and post-enrollment success.
Fiscal Year 2021 Annual Report | Federal Student Aid 25
Management’s Discussion and Analysis
Agency Priority Goals
APGs are a performance accountability structure of the Government Performance and Results Modernization Act of 2010 (GPRA Modernization Act) (Pub. L. 111-352) that provide agencies a mechanism to focus on leadership priorities, set outcomes, and measure results, bringing focus to mission areas where agencies need to drive significant progress and change. APG statements are outcome-oriented, ambitious, and measurable with specific targets that reflect a near-term result or achievement agency leadership wants to accomplish within approximately 24 months.
In collaboration with OMB, the Department established five APGs for FY 2020 and FY 2021 that align with the Department’s FY 2018–22 Strategic Plan. Quarterly progress reporting to Performance.gov is currently paused while the Biden-Harris Administration establishes updated goals, priorities, and a management agenda in meeting the intent of GPRA Modernization Act. The Department will develop FY 2022 and FY 2023 APGs that focus on the priorities of the current Administration.
26 Fiscal Year 2021 Annual Report | Federal Student Aid
Management’s Discussion and Analysis
Quality of Performance Data
Ensuring the integrity of the data required to determine performance results is a critical step in reporting performance. For this step, FSA developed and implemented a Validation and Verification Matrix. Specifically, FSA uses this matrix as a tool to validate the completeness and reliability of the underlying data gathered and used to calculate each performance metric for the reporting period, including the performance results reported in this Annual Report. For each performance metric, this matrix is used to document the following: data source, availability, security procedures, and known limitations; whether data are subject to FSA’s OMB Circular A-123 Internal Control Review process; and procedures for accessing the data, calculating the performance metric, and validating and verifying the data gathered.
For a discussion of data validation and verification for each performance metric, please see the Data Validation and Verification subsection, located in the Appendices section.
Fiscal Year 2021 Annual Report | Federal Student Aid 27
Management’s Discussion and Analysis
Analysis of Financial Statements
Introduction
The Analysis of Financial Statements section provides an overview of FSA’s financial results for FY 2021. This section assists readers in understanding FSA’s financial results, position, and condition as reflected in the financial statements and notes located in the Financial Section of this report. The financial analysis explains major changes in assets, liabilities, costs, and budgetary resources. It also includes comparisons of the current year to the four prior years and discusses the relevance of significant balances, amounts, and trends reflected in the financial statements and notes.
FSA is committed to providing sound management, financial systems, and controls to ensure students receive aid and repay loans according to applicable laws and regulations. FSA’s financial statements are prepared in accordance with established federal accounting standards and reporting requirements. The financial statements are subject to an annual independent audit to determine whether FSA’s financial statements present fairly FSA’s financial position, net cost, changes in net position, and budgetary resources. In FY 2021, FSA achieved an unmodified audit opinion on its financial statements for the 20th consecutive year.
FSA presents its financial statements and notes in the format required by OMB Circular A-136. For FY 2021 and FY 2020, the Balance Sheet, Statement of Net Cost, and Statement of Changes in Net Position were prepared on a consolidated basis, whereas the Statement of Budgetary Resources was prepared on a combined basis. These financial statements, along with the Independent Auditors’ Report on these statements, can be found in the Financial Section.
FSA has oversight responsibilities for more than $1.6 trillion in federal student loans, of which it directly owns and manages approximately $1.5 trillion. The remaining balance represents non-defaulted FFEL Guaranteed loans held by lenders and Federal Perkins loans held by schools, as detailed in Note 5. As described in Note 1 and Note 5, FSA reports its portfolio of federal student loans on its Balance Sheet, on the line-item Credit Program Receivables, Net. This is the gross amount of loans and interest receivable less an allowance for the present value of amounts not expected to be recovered (Allowance for Subsidy). Subsidy Expense is a factor included in the Allowance for Subsidy and represents an estimate in present value terms of the cost to the government of Direct Loans and loan guarantees. Subsidy Expense is recorded in the year a loan is disbursed and updated annually through a re-estimation process. It includes default costs (net of recoveries), contractual payments paid to third-party private collection agencies, and net borrowing costs, less any origination or other fees collected. If the net cost to the government is greater than zero, then the subsidy expense is said to be positive. However, the subsidy expense may also be zero (break-even), or it may be negative if the estimated cost of providing loans to borrowers is less than the value of collections received as interest and fees. As of Sept. 30, 2021, FSA reported $1,164.8 billion in Credit Program Receivables, Net after deducting an Allowance for Subsidy of approximately $322.0 billion. Credit Program Receivables, Net was 0.4% less than the prior-year amount. This decrease was primarily due to $63.7 billion increase in the FY 2021 Allowance for Subsidy (24.7%). The reasons for the adjustment to the Allowance for Subsidy estimate are explained in Note 5.
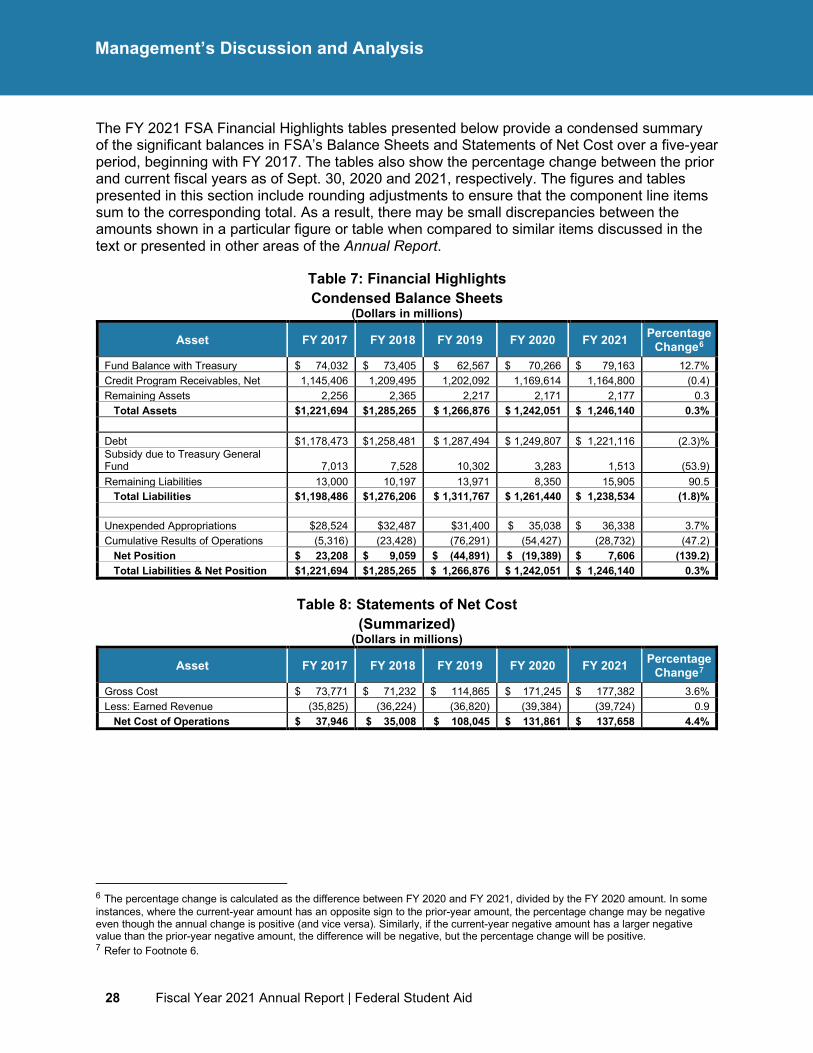
28 Fiscal Year 2021 Annual Report | Federal Student Aid
Management’s Discussion and Analysis
The FY 2021 FSA Financial Highlights tables presented below provide a condensed summary of the significant balances in FSA’s Balance Sheets and Statements of Net Cost over a five-year period, beginning with FY 2017. The tables also show the percentage change between the prior and current fiscal years as of Sept. 30, 2020 and 2021, respectively. The figures and tables presented in this section include rounding adjustments to ensure that the component line items sum to the corresponding total. As a result, there may be small discrepancies between the amounts shown in a particular figure or table when compared to similar items discussed in the text or presented in other areas of the Annual Report.
Table 7: Financial Highlights Condensed Balance Sheets
(Dollars in millions)
Asset FY 2017 FY 2018 FY 2019 FY 2020 FY 2021 Percentage Change6
Fund Balance with Treasury $ 74,032 $ 73,405 $ 62,567 $ 70,266 $ 79,163 12.7% Credit Program Receivables, Net 1,145,406 1,209,495 1,202,092 1,169,614 1,164,800 (0.4) Remaining Assets 2,256 2,365 2,217 2,171 2,177 0.3
Total Assets $1,221,694 $1,285,265 $ 1,266,876 $ 1,242,051 $ 1,246,140 0.3% Debt $1,178,473 $1,258,481 $ 1,287,494 $ 1,249,807 $ 1,221,116 (2.3)% Subsidy due to Treasury General Fund 7,013 7,528 10,302 3,283 1,513 (53.9) Remaining Liabilities 13,000 10,197 13,971 8,350 15,905 90.5
Total Liabilities $1,198,486 $1,276,206 $ 1,311,767 $ 1,261,440 $ 1,238,534 (1.8)% Unexpended Appropriations $28,524 $32,487 $31,400 $ 35,038 $ 36,338 3.7% Cumulative Results of Operations (5,316) (23,428) (76,291) (54,427) (28,732) (47.2)
Net Position $ 23,208 $ 9,059 $ (44,891) $ (19,389) $ 7,606 (139.2) Total Liabilities & Net Position $1,221,694 $1,285,265 $ 1,266,876 $ 1,242,051 $ 1,246,140 0.3%
Table 8: Statements of Net Cost (Summarized)
(Dollars in millions)
Asset FY 2017 FY 2018 FY 2019 FY 2020 FY 2021 Percentage Change7
Gross Cost $ 73,771 $ 71,232 $ 114,865 $ 171,245 $ 177,382 3.6% Less: Earned Revenue (35,825) (36,224) (36,820) (39,384) (39,724) 0.9
Net Cost of Operations $ 37,946 $ 35,008 $ 108,045 $ 131,861 $ 137,658 4.4%
6 The percentage change is calculated as the difference between FY 2020 and FY 2021, divided by the FY 2020 amount. In some instances, where the current-year amount has an opposite sign to the prior-year amount, the percentage change may be negative even though the annual change is positive (and vice versa). Similarly, if the current-year negative amount has a larger negative value than the prior-year negative amount, the difference will be negative, but the percentage change will be positive. 7 Refer to Footnote 6.
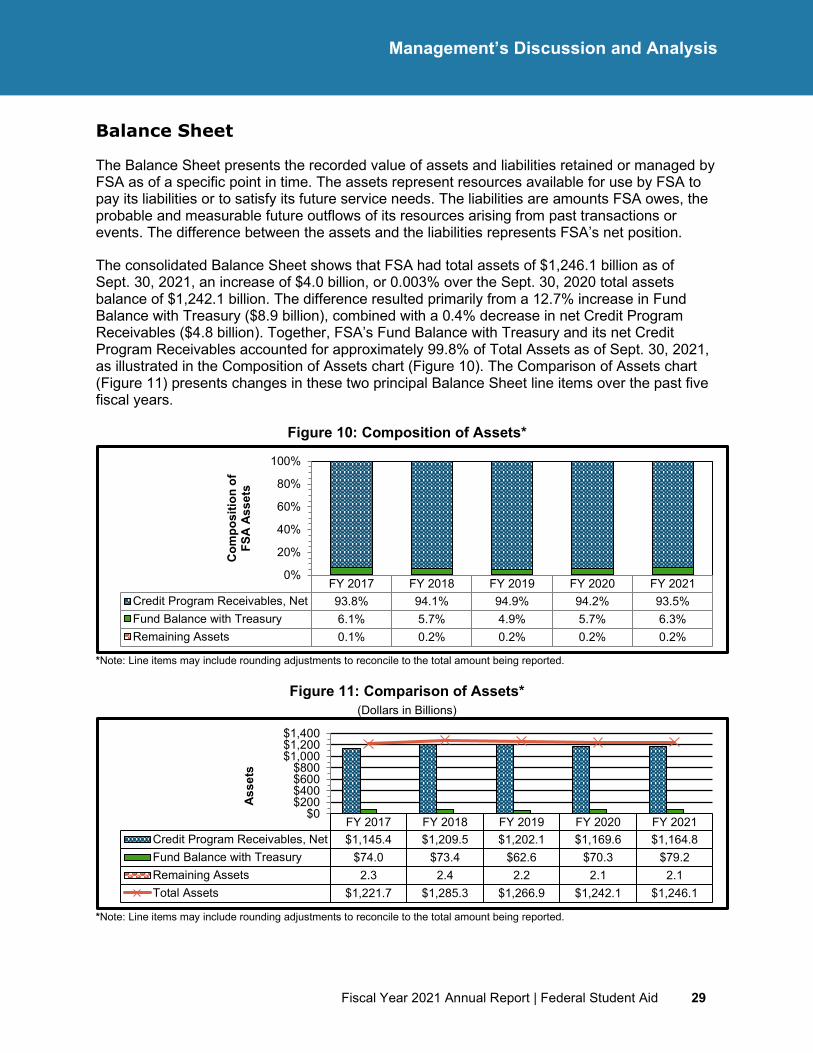
Fiscal Year 2021 Annual Report | Federal Student Aid 29
Management’s Discussion and Analysis
Balance Sheet
The Balance Sheet presents the recorded value of assets and liabilities retained or managed by FSA as of a specific point in time. The assets represent resources available for use by FSA to pay its liabilities or to satisfy its future service needs. The liabilities are amounts FSA owes, the probable and measurable future outflows of its resources arising from past transactions or events. The difference between the assets and the liabilities represents FSA’s net position.
The consolidated Balance Sheet shows that FSA had total assets of $1,246.1 billion as of Sept. 30, 2021, an increase of $4.0 billion, or 0.003% over the Sept. 30, 2020 total assets balance of $1,242.1 billion. The difference resulted primarily from a 12.7% increase in Fund Balance with Treasury ($8.9 billion), combined with a 0.4% decrease in net Credit Program Receivables ($4.8 billion). Together, FSA’s Fund Balance with Treasury and its net Credit Program Receivables accounted for approximately 99.8% of Total Assets as of Sept. 30, 2021, as illustrated in the Composition of Assets chart (Figure 10). The Comparison of Assets chart (Figure 11) presents changes in these two principal Balance Sheet line items over the past five fiscal years.
Figure 10: Composition of Assets*
*Note: Line items may include rounding adjustments to reconcile to the total amount being reported.
Figure 11: Comparison of Assets* (Dollars in Billions)
*Note: Line items may include rounding adjustments to reconcile to the total amount being reported.
FY 2017 FY 2018 FY 2019 FY 2020 FY 2021Credit Program Receivables, Net 93.8% 94.1% 94.9% 94.2% 93.5%Fund Balance with Treasury 6.1% 5.7% 4.9% 5.7% 6.3%Remaining Assets 0.1% 0.2% 0.2% 0.2% 0.2%
0%
20%
40%
60%
80%
100%
Com
posi
tion
of
FSA
Asse
ts
FY 2017 FY 2018 FY 2019 FY 2020 FY 2021Credit Program Receivables, Net $1,145.4 $1,209.5 $1,202.1 $1,169.6 $1,164.8Fund Balance with Treasury $74.0 $73.4 $62.6 $70.3 $79.2Remaining Assets 2.3 2.4 2.2 2.1 2.1Total Assets $1,221.7 $1,285.3 $1,266.9 $1,242.1 $1,246.1
$0$200$400$600$800
$1,000$1,200$1,400
Asse
ts
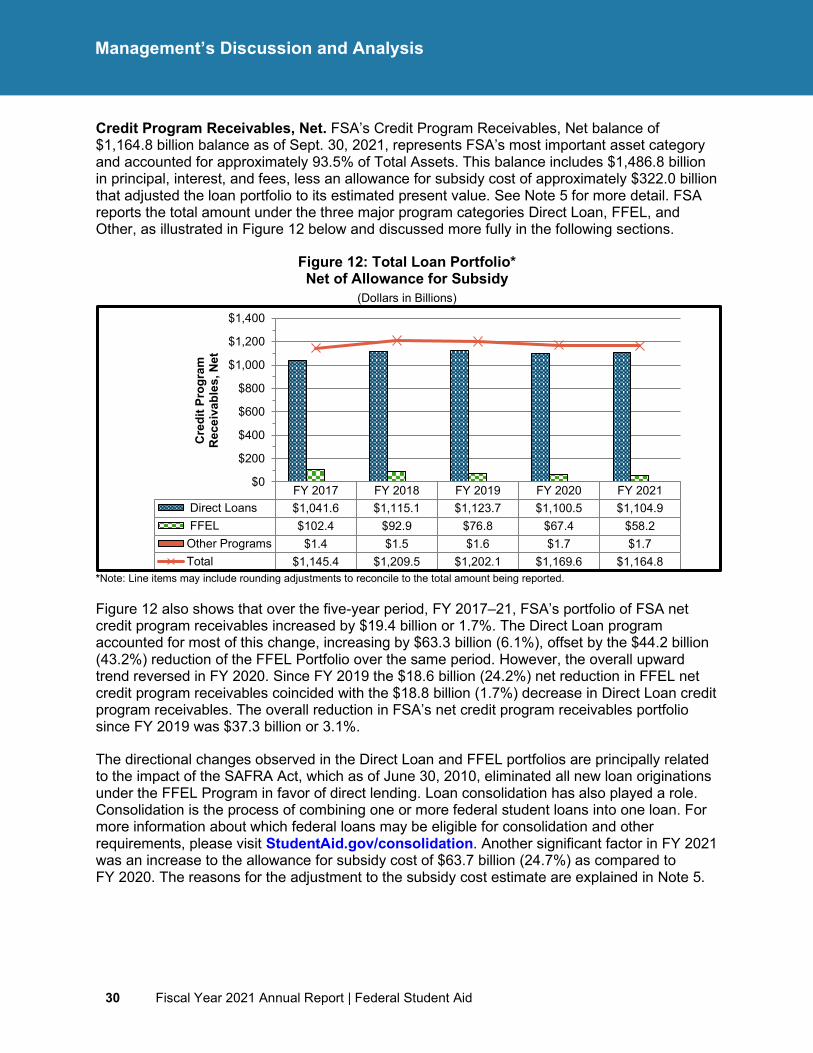
30 Fiscal Year 2021 Annual Report | Federal Student Aid
Management’s Discussion and Analysis
Credit Program Receivables, Net. FSA’s Credit Program Receivables, Net balance of $1,164.8 billion balance as of Sept. 30, 2021, represents FSA’s most important asset category and accounted for approximately 93.5% of Total Assets. This balance includes $1,486.8 billion in principal, interest, and fees, less an allowance for subsidy cost of approximately $322.0 billion that adjusted the loan portfolio to its estimated present value. See Note 5 for more detail. FSA reports the total amount under the three major program categories Direct Loan, FFEL, and Other, as illustrated in Figure 12 below and discussed more fully in the following sections.
Figure 12: Total Loan Portfolio* Net of Allowance for Subsidy
(Dollars in Billions)
*Note: Line items may include rounding adjustments to reconcile to the total amount being reported.
Figure 12 also shows that over the five-year period, FY 2017–21, FSA’s portfolio of FSA net credit program receivables increased by $19.4 billion or 1.7%. The Direct Loan program accounted for most of this change, increasing by $63.3 billion (6.1%), offset by the $44.2 billion (43.2%) reduction of the FFEL Portfolio over the same period. However, the overall upward trend reversed in FY 2020. Since FY 2019 the $18.6 billion (24.2%) net reduction in FFEL net credit program receivables coincided with the $18.8 billion (1.7%) decrease in Direct Loan credit program receivables. The overall reduction in FSA’s net credit program receivables portfolio since FY 2019 was $37.3 billion or 3.1%.
The directional changes observed in the Direct Loan and FFEL portfolios are principally related to the impact of the SAFRA Act, which as of June 30, 2010, eliminated all new loan originations under the FFEL Program in favor of direct lending. Loan consolidation has also played a role. Consolidation is the process of combining one or more federal student loans into one loan. For more information about which federal loans may be eligible for consolidation and other requirements, please visit StudentAid.gov/consolidation. Another significant factor in FY 2021 was an increase to the allowance for subsidy cost of $63.7 billion (24.7%) as compared to FY 2020. The reasons for the adjustment to the subsidy cost estimate are explained in Note 5.
FY 2017 FY 2018 FY 2019 FY 2020 FY 2021 Direct Loans $1,041.6 $1,115.1 $1,123.7 $1,100.5 $1,104.9 FFEL $102.4 $92.9 $76.8 $67.4 $58.2Other Programs $1.4 $1.5 $1.6 $1.7 $1.7Total $1,145.4 $1,209.5 $1,202.1 $1,169.6 $1,164.8
$0
$200
$400
$600
$800
$1,000
$1,200
$1,400
Cre
dit P
rogr
am
Rec
eiva
bles
, Net
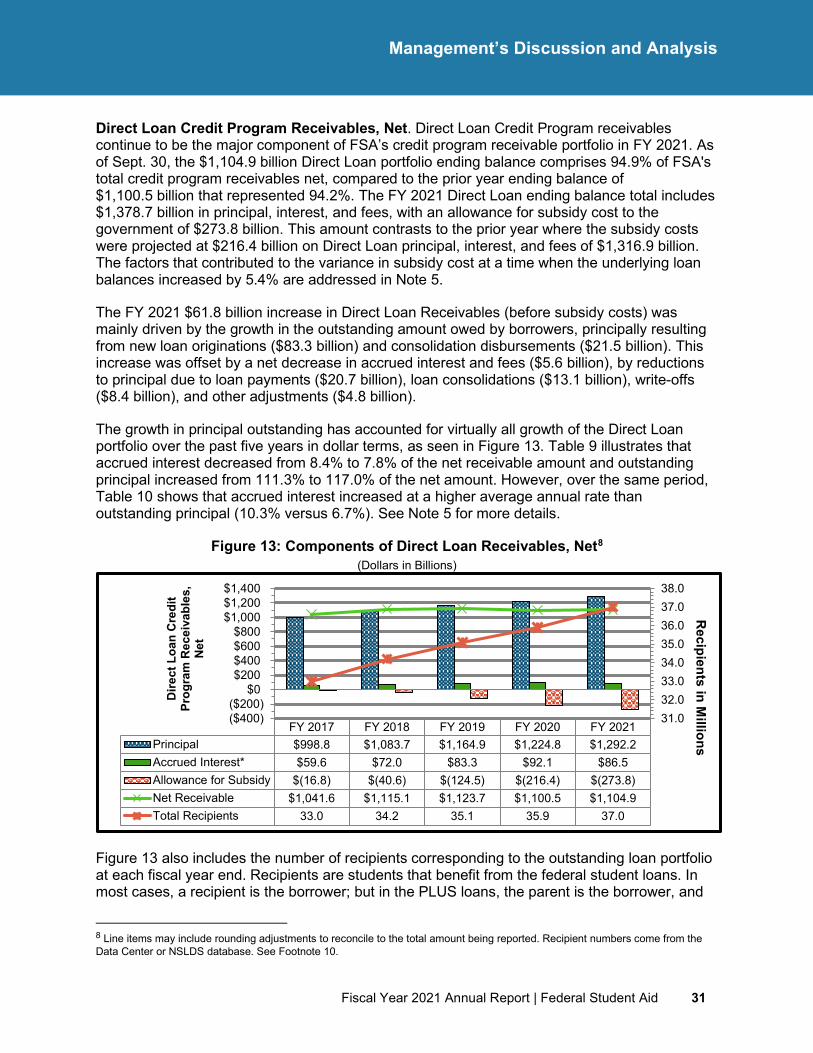
Fiscal Year 2021 Annual Report | Federal Student Aid 31
Management’s Discussion and Analysis
Direct Loan Credit Program Receivables, Net. Direct Loan Credit Program receivables continue to be the major component of FSA’s credit program receivable portfolio in FY 2021. As of Sept. 30, the $1,104.9 billion Direct Loan portfolio ending balance comprises 94.9% of FSA's total credit program receivables net, compared to the prior year ending balance of $1,100.5 billion that represented 94.2%. The FY 2021 Direct Loan ending balance total includes $1,378.7 billion in principal, interest, and fees, with an allowance for subsidy cost to the government of $273.8 billion. This amount contrasts to the prior year where the subsidy costs were projected at $216.4 billion on Direct Loan principal, interest, and fees of $1,316.9 billion. The factors that contributed to the variance in subsidy cost at a time when the underlying loan balances increased by 5.4% are addressed in Note 5.
The FY 2021 $61.8 billion increase in Direct Loan Receivables (before subsidy costs) was mainly driven by the growth in the outstanding amount owed by borrowers, principally resulting from new loan originations ($83.3 billion) and consolidation disbursements ($21.5 billion). This increase was offset by a net decrease in accrued interest and fees ($5.6 billion), by reductions to principal due to loan payments ($20.7 billion), loan consolidations ($13.1 billion), write-offs ($8.4 billion), and other adjustments ($4.8 billion).
The growth in principal outstanding has accounted for virtually all growth of the Direct Loan portfolio over the past five years in dollar terms, as seen in Figure 13. Table 9 illustrates that accrued interest decreased from 8.4% to 7.8% of the net receivable amount and outstanding principal increased from 111.3% to 117.0% of the net amount. However, over the same period, Table 10 shows that accrued interest increased at a higher average annual rate than outstanding principal (10.3% versus 6.7%). See Note 5 for more details.
Figure 13: Components of Direct Loan Receivables, Net8
(Dollars in Billions)
Figure 13 also includes the number of recipients corresponding to the outstanding loan portfolio at each fiscal year end. Recipients are students that benefit from the federal student loans. In most cases, a recipient is the borrower; but in the PLUS loans, the parent is the borrower, and
8 Line items may include rounding adjustments to reconcile to the total amount being reported. Recipient numbers come from the Data Center or NSLDS database. See Footnote 10.
FY 2017 FY 2018 FY 2019 FY 2020 FY 2021Principal $998.8 $1,083.7 $1,164.9 $1,224.8 $1,292.2Accrued Interest* $59.6 $72.0 $83.3 $92.1 $86.5Allowance for Subsidy $(16.8) $(40.6) $(124.5) $(216.4) $(273.8)Net Receivable $1,041.6 $1,115.1 $1,123.7 $1,100.5 $1,104.9Total Recipients 33.0 34.2 35.1 35.9 37.0
31.032.033.034.035.036.037.038.0
($400)($200)
$0$200$400$600$800
$1,000$1,200$1,400
Recipients in M
illions
Dire
ct L
oan
Cre
dit
Prog
ram
Rec
eiva
bles
, N
et
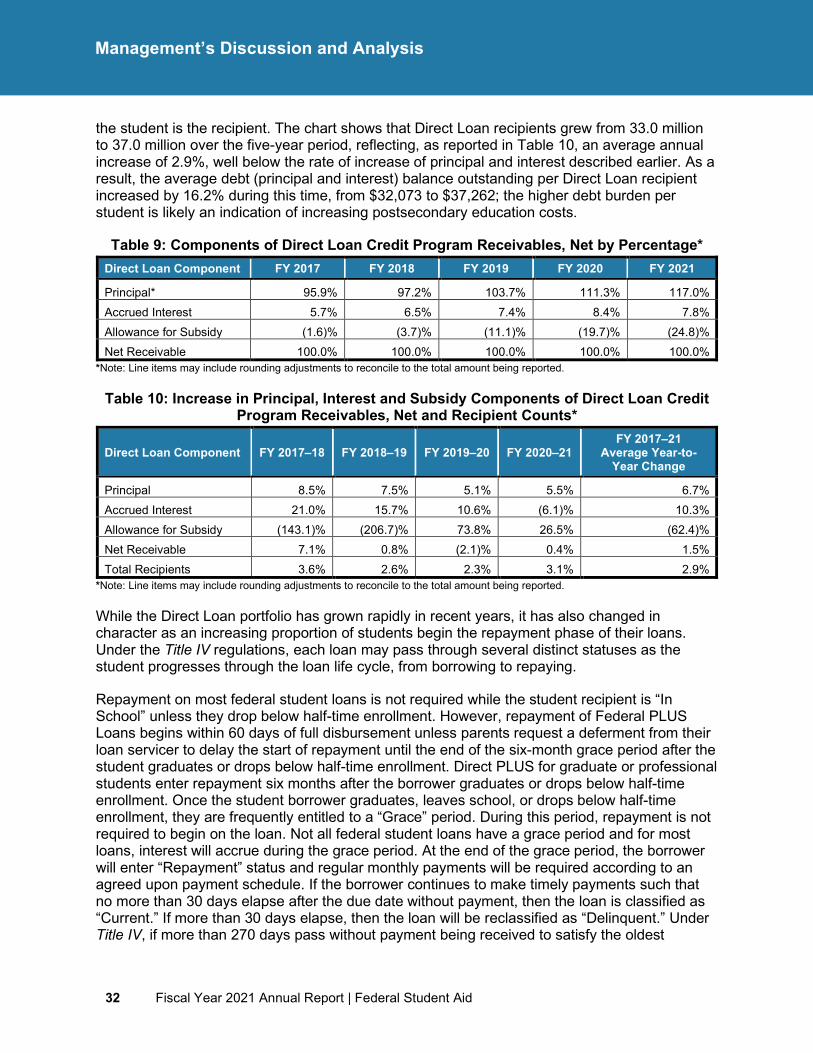
32 Fiscal Year 2021 Annual Report | Federal Student Aid
Management’s Discussion and Analysis
the student is the recipient. The chart shows that Direct Loan recipients grew from 33.0 million to 37.0 million over the five-year period, reflecting, as reported in Table 10, an average annual increase of 2.9%, well below the rate of increase of principal and interest described earlier. As a result, the average debt (principal and interest) balance outstanding per Direct Loan recipient increased by 16.2% during this time, from $32,073 to $37,262; the higher debt burden per student is likely an indication of increasing postsecondary education costs.
Table 9: Components of Direct Loan Credit Program Receivables, Net by Percentage* Direct Loan Component FY 2017 FY 2018 FY 2019 FY 2020 FY 2021
Principal* 95.9% 97.2% 103.7% 111.3% 117.0% Accrued Interest 5.7% 6.5% 7.4% 8.4% 7.8% Allowance for Subsidy (1.6)% (3.7)% (11.1)% (19.7)% (24.8)% Net Receivable 100.0% 100.0% 100.0% 100.0% 100.0%
*Note: Line items may include rounding adjustments to reconcile to the total amount being reported.
Table 10: Increase in Principal, Interest and Subsidy Components of Direct Loan Credit Program Receivables, Net and Recipient Counts*
Direct Loan Component FY 2017–18 FY 2018–19 FY 2019–20 FY 2020–21 FY 2017–21
Average Year-to-Year Change
Principal 8.5% 7.5% 5.1% 5.5% 6.7% Accrued Interest 21.0% 15.7% 10.6% (6.1)% 10.3% Allowance for Subsidy (143.1)% (206.7)% 73.8% 26.5% (62.4)% Net Receivable 7.1% 0.8% (2.1)% 0.4% 1.5% Total Recipients 3.6% 2.6% 2.3% 3.1% 2.9%
*Note: Line items may include rounding adjustments to reconcile to the total amount being reported.
While the Direct Loan portfolio has grown rapidly in recent years, it has also changed in character as an increasing proportion of students begin the repayment phase of their loans. Under the Title IV regulations, each loan may pass through several distinct statuses as the student progresses through the loan life cycle, from borrowing to repaying.
Repayment on most federal student loans is not required while the student recipient is “In School” unless they drop below half-time enrollment. However, repayment of Federal PLUS Loans begins within 60 days of full disbursement unless parents request a deferment from their loan servicer to delay the start of repayment until the end of the six-month grace period after the student graduates or drops below half-time enrollment. Direct PLUS for graduate or professional students enter repayment six months after the borrower graduates or drops below half-time enrollment. Once the student borrower graduates, leaves school, or drops below half-time enrollment, they are frequently entitled to a “Grace” period. During this period, repayment is not required to begin on the loan. Not all federal student loans have a grace period and for most loans, interest will accrue during the grace period. At the end of the grace period, the borrower will enter “Repayment” status and regular monthly payments will be required according to an agreed upon payment schedule. If the borrower continues to make timely payments such that no more than 30 days elapse after the due date without payment, then the loan is classified as “Current.” If more than 30 days elapse, then the loan will be reclassified as “Delinquent.” Under Title IV, if more than 270 days pass without payment being received to satisfy the oldest
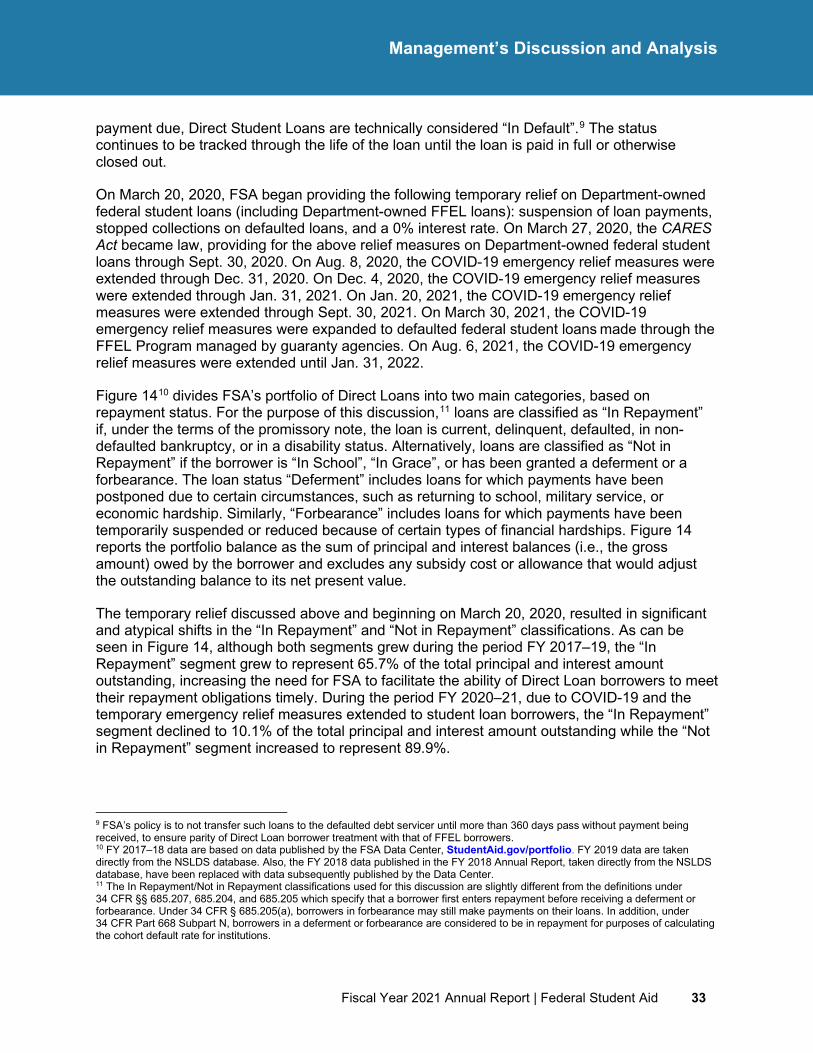
Fiscal Year 2021 Annual Report | Federal Student Aid 33
Management’s Discussion and Analysis
payment due, Direct Student Loans are technically considered “In Default”.9 The status continues to be tracked through the life of the loan until the loan is paid in full or otherwise closed out.
On March 20, 2020, FSA began providing the following temporary relief on Department-owned federal student loans (including Department-owned FFEL loans): suspension of loan payments, stopped collections on defaulted loans, and a 0% interest rate. On March 27, 2020, the CARES Act became law, providing for the above relief measures on Department-owned federal student loans through Sept. 30, 2020. On Aug. 8, 2020, the COVID-19 emergency relief measures were extended through Dec. 31, 2020. On Dec. 4, 2020, the COVID-19 emergency relief measures were extended through Jan. 31, 2021. On Jan. 20, 2021, the COVID-19 emergency relief measures were extended through Sept. 30, 2021. On March 30, 2021, the COVID-19 emergency relief measures were expanded to defaulted federal student loans made through the FFEL Program managed by guaranty agencies. On Aug. 6, 2021, the COVID-19 emergency relief measures were extended until Jan. 31, 2022.
Figure 1410 divides FSA’s portfolio of Direct Loans into two main categories, based on repayment status. For the purpose of this discussion,11 loans are classified as “In Repayment” if, under the terms of the promissory note, the loan is current, delinquent, defaulted, in non-defaulted bankruptcy, or in a disability status. Alternatively, loans are classified as “Not in Repayment” if the borrower is “In School”, “In Grace”, or has been granted a deferment or a forbearance. The loan status “Deferment” includes loans for which payments have been postponed due to certain circumstances, such as returning to school, military service, or economic hardship. Similarly, “Forbearance” includes loans for which payments have been temporarily suspended or reduced because of certain types of financial hardships. Figure 14 reports the portfolio balance as the sum of principal and interest balances (i.e., the gross amount) owed by the borrower and excludes any subsidy cost or allowance that would adjust the outstanding balance to its net present value.
The temporary relief discussed above and beginning on March 20, 2020, resulted in significant and atypical shifts in the “In Repayment” and “Not in Repayment” classifications. As can be seen in Figure 14, although both segments grew during the period FY 2017–19, the “In Repayment” segment grew to represent 65.7% of the total principal and interest amount outstanding, increasing the need for FSA to facilitate the ability of Direct Loan borrowers to meet their repayment obligations timely. During the period FY 2020–21, due to COVID-19 and the temporary emergency relief measures extended to student loan borrowers, the “In Repayment” segment declined to 10.1% of the total principal and interest amount outstanding while the “Not in Repayment” segment increased to represent 89.9%.
9 FSA’s policy is to not transfer such loans to the defaulted debt servicer until more than 360 days pass without payment being received, to ensure parity of Direct Loan borrower treatment with that of FFEL borrowers. 10 FY 2017–18 data are based on data published by the FSA Data Center, StudentAid.gov/portfolio. FY 2019 data are taken directly from the NSLDS database. Also, the FY 2018 data published in the FY 2018 Annual Report, taken directly from the NSLDS database, have been replaced with data subsequently published by the Data Center. 11 The In Repayment/Not in Repayment classifications used for this discussion are slightly different from the definitions under 34 CFR §§ 685.207, 685.204, and 685.205 which specify that a borrower first enters repayment before receiving a deferment or forbearance. Under 34 CFR § 685.205(a), borrowers in forbearance may still make payments on their loans. In addition, under 34 CFR Part 668 Subpart N, borrowers in a deferment or forbearance are considered to be in repayment for purposes of calculating the cohort default rate for institutions.
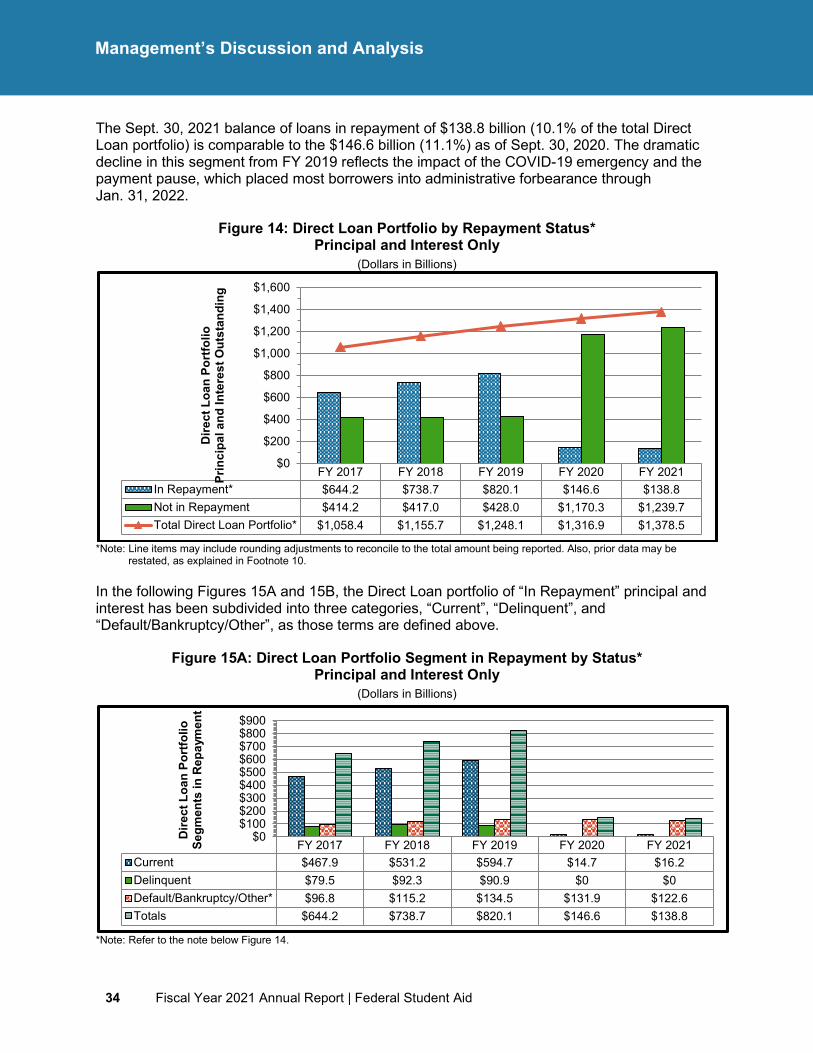
34 Fiscal Year 2021 Annual Report | Federal Student Aid
Management’s Discussion and Analysis
The Sept. 30, 2021 balance of loans in repayment of $138.8 billion (10.1% of the total Direct Loan portfolio) is comparable to the $146.6 billion (11.1%) as of Sept. 30, 2020. The dramatic decline in this segment from FY 2019 reflects the impact of the COVID-19 emergency and the payment pause, which placed most borrowers into administrative forbearance through Jan. 31, 2022.
Figure 14: Direct Loan Portfolio by Repayment Status* Principal and Interest Only
(Dollars in Billions)
*Note: Line items may include rounding adjustments to reconcile to the total amount being reported. Also, prior data may be
restated, as explained in Footnote 10.
In the following Figures 15A and 15B, the Direct Loan portfolio of “In Repayment” principal and interest has been subdivided into three categories, “Current”, “Delinquent”, and “Default/Bankruptcy/Other”, as those terms are defined above.
Figure 15A: Direct Loan Portfolio Segment in Repayment by Status* Principal and Interest Only
(Dollars in Billions)
*Note: Refer to the note below Figure 14.
FY 2017 FY 2018 FY 2019 FY 2020 FY 2021In Repayment* $644.2 $738.7 $820.1 $146.6 $138.8Not in Repayment $414.2 $417.0 $428.0 $1,170.3 $1,239.7Total Direct Loan Portfolio* $1,058.4 $1,155.7 $1,248.1 $1,316.9 $1,378.5
$0
$200
$400
$600
$800
$1,000
$1,200
$1,400
$1,600
Dire
ct L
oan
Port
folio
Pr
inci
pal a
nd In
tere
st O
utst
andi
ng
FY 2017 FY 2018 FY 2019 FY 2020 FY 2021Current $467.9 $531.2 $594.7 $14.7 $16.2Delinquent $79.5 $92.3 $90.9 $0 $0Default/Bankruptcy/Other* $96.8 $115.2 $134.5 $131.9 $122.6Totals $644.2 $738.7 $820.1 $146.6 $138.8
$0$100$200$300$400$500$600$700$800$900
Dire
ct L
oan
Port
folio
Se
gmen
ts in
Rep
aym
ent
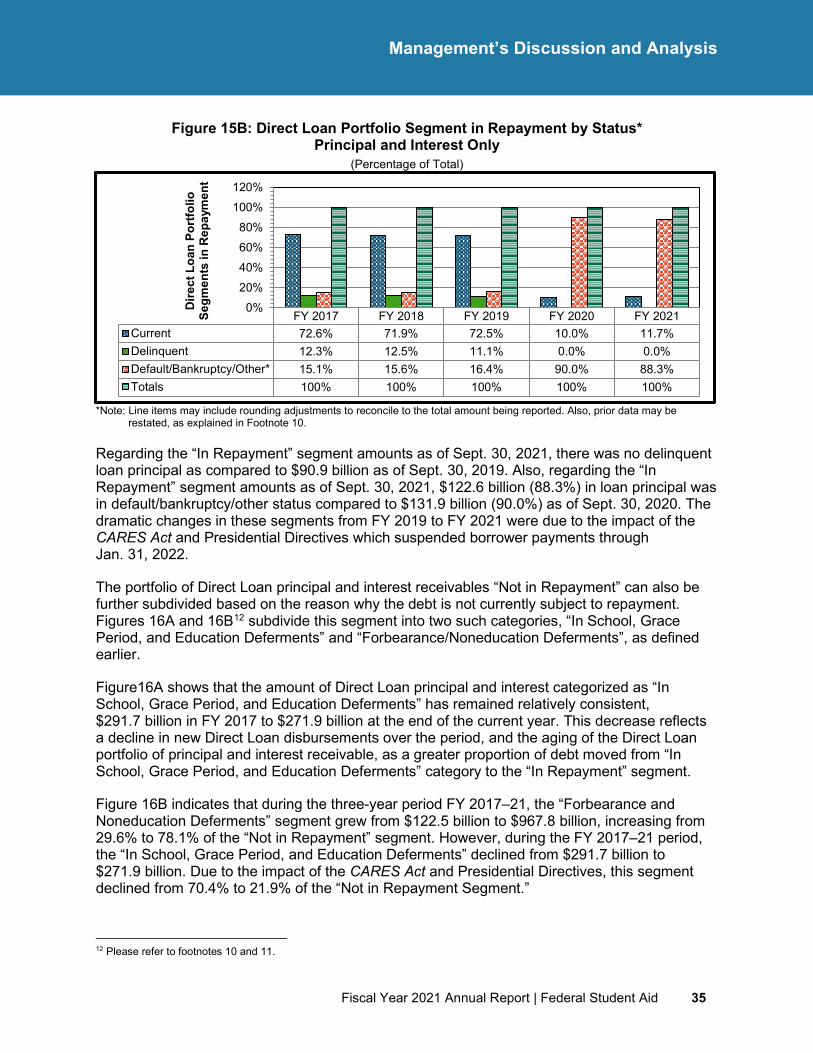
Fiscal Year 2021 Annual Report | Federal Student Aid 35
Management’s Discussion and Analysis
Figure 15B: Direct Loan Portfolio Segment in Repayment by Status* Principal and Interest Only
(Percentage of Total)
*Note: Line items may include rounding adjustments to reconcile to the total amount being reported. Also, prior data may be restated, as explained in Footnote 10.
Regarding the “In Repayment” segment amounts as of Sept. 30, 2021, there was no delinquent loan principal as compared to $90.9 billion as of Sept. 30, 2019. Also, regarding the “In Repayment” segment amounts as of Sept. 30, 2021, $122.6 billion (88.3%) in loan principal was in default/bankruptcy/other status compared to $131.9 billion (90.0%) as of Sept. 30, 2020. The dramatic changes in these segments from FY 2019 to FY 2021 were due to the impact of the CARES Act and Presidential Directives which suspended borrower payments through Jan. 31, 2022.
The portfolio of Direct Loan principal and interest receivables “Not in Repayment” can also be further subdivided based on the reason why the debt is not currently subject to repayment. Figures 16A and 16B12 subdivide this segment into two such categories, “In School, Grace Period, and Education Deferments” and “Forbearance/Noneducation Deferments”, as defined earlier.
Figure16A shows that the amount of Direct Loan principal and interest categorized as “In School, Grace Period, and Education Deferments” has remained relatively consistent, $291.7 billion in FY 2017 to $271.9 billion at the end of the current year. This decrease reflects a decline in new Direct Loan disbursements over the period, and the aging of the Direct Loan portfolio of principal and interest receivable, as a greater proportion of debt moved from “In School, Grace Period, and Education Deferments” category to the “In Repayment” segment.
Figure 16B indicates that during the three-year period FY 2017–21, the “Forbearance and Noneducation Deferments” segment grew from $122.5 billion to $967.8 billion, increasing from 29.6% to 78.1% of the “Not in Repayment” segment. However, during the FY 2017–21 period, the “In School, Grace Period, and Education Deferments” declined from $291.7 billion to $271.9 billion. Due to the impact of the CARES Act and Presidential Directives, this segment declined from 70.4% to 21.9% of the “Not in Repayment Segment.”
12 Please refer to footnotes 10 and 11.
FY 2017 FY 2018 FY 2019 FY 2020 FY 2021Current 72.6% 71.9% 72.5% 10.0% 11.7%Delinquent 12.3% 12.5% 11.1% 0.0% 0.0%Default/Bankruptcy/Other* 15.1% 15.6% 16.4% 90.0% 88.3%Totals 100% 100% 100% 100% 100%
0%20%40%60%80%
100%120%
Dire
ct L
oan
Port
folio
Se
gmen
ts in
Rep
aym
ent
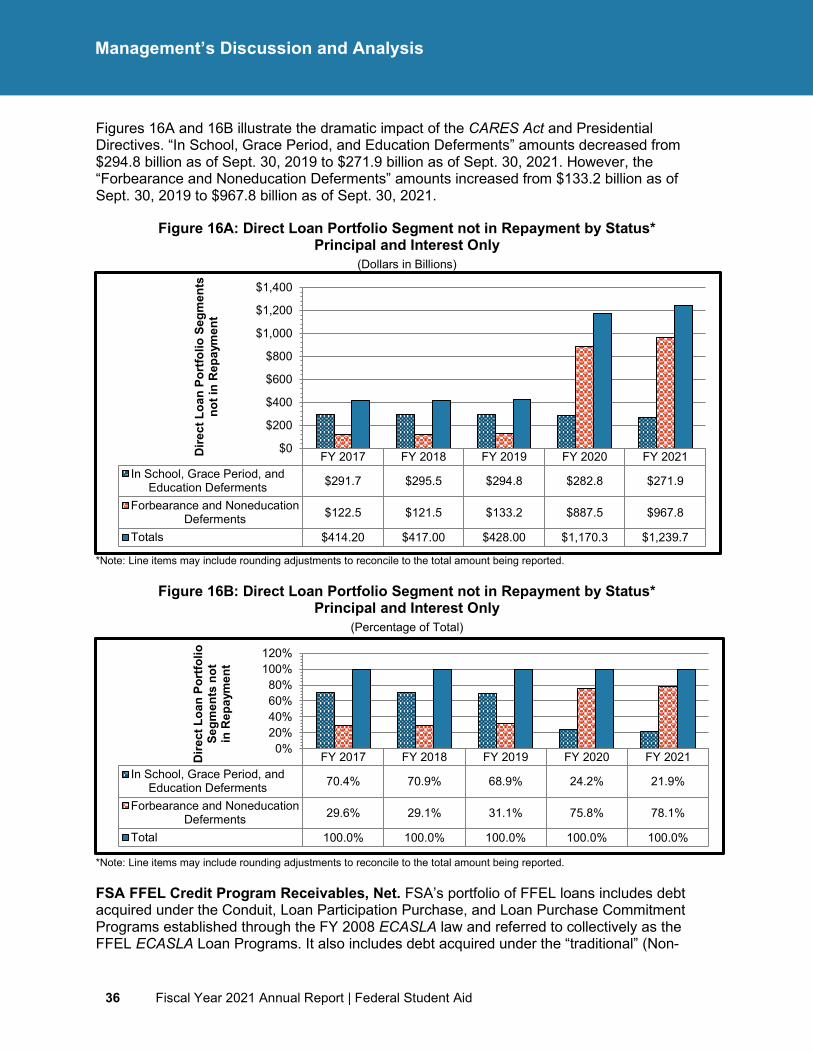
36 Fiscal Year 2021 Annual Report | Federal Student Aid
Management’s Discussion and Analysis
Figures 16A and 16B illustrate the dramatic impact of the CARES Act and Presidential Directives. “In School, Grace Period, and Education Deferments” amounts decreased from $294.8 billion as of Sept. 30, 2019 to $271.9 billion as of Sept. 30, 2021. However, the “Forbearance and Noneducation Deferments” amounts increased from $133.2 billion as of Sept. 30, 2019 to $967.8 billion as of Sept. 30, 2021.
Figure 16A: Direct Loan Portfolio Segment not in Repayment by Status* Principal and Interest Only
(Dollars in Billions)
*Note: Line items may include rounding adjustments to reconcile to the total amount being reported.
Figure 16B: Direct Loan Portfolio Segment not in Repayment by Status* Principal and Interest Only
(Percentage of Total)
*Note: Line items may include rounding adjustments to reconcile to the total amount being reported.
FSA FFEL Credit Program Receivables, Net. FSA’s portfolio of FFEL loans includes debt acquired under the Conduit, Loan Participation Purchase, and Loan Purchase Commitment Programs established through the FY 2008 ECASLA law and referred to collectively as the FFEL ECASLA Loan Programs. It also includes debt acquired under the “traditional” (Non-
FY 2017 FY 2018 FY 2019 FY 2020 FY 2021In School, Grace Period, and
Education Deferments $291.7 $295.5 $294.8 $282.8 $271.9
Forbearance and NoneducationDeferments $122.5 $121.5 $133.2 $887.5 $967.8
Totals $414.20 $417.00 $428.00 $1,170.3 $1,239.7
$0
$200
$400
$600
$800
$1,000
$1,200
$1,400
Dire
ct L
oan
Port
folio
Seg
men
ts
not i
n R
epay
men
t
FY 2017 FY 2018 FY 2019 FY 2020 FY 2021In School, Grace Period, and
Education Deferments 70.4% 70.9% 68.9% 24.2% 21.9%
Forbearance and NoneducationDeferments 29.6% 29.1% 31.1% 75.8% 78.1%
Total 100.0% 100.0% 100.0% 100.0% 100.0%
0%20%40%60%80%
100%120%
Dire
ct L
oan
Port
folio
Se
gmen
ts n
ot
in R
epay
men
t
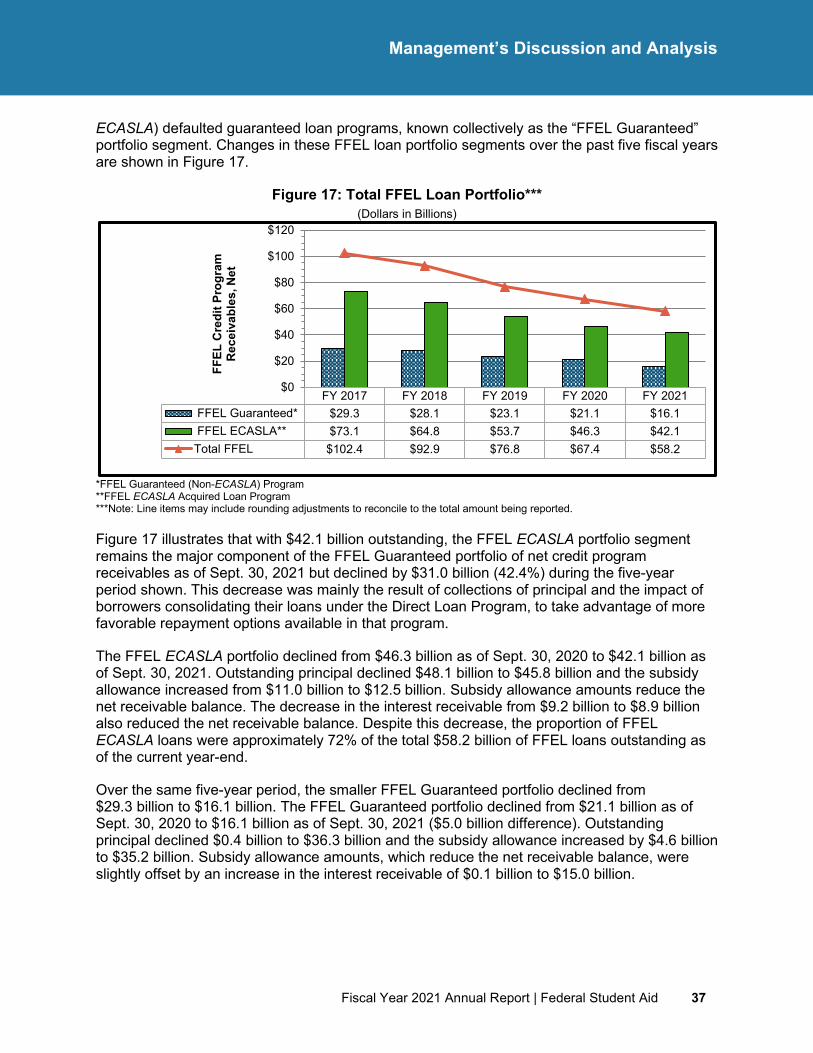
Fiscal Year 2021 Annual Report | Federal Student Aid 37
Management’s Discussion and Analysis
ECASLA) defaulted guaranteed loan programs, known collectively as the “FFEL Guaranteed” portfolio segment. Changes in these FFEL loan portfolio segments over the past five fiscal years are shown in Figure 17.
Figure 17: Total FFEL Loan Portfolio*** (Dollars in Billions)
*FFEL Guaranteed (Non-ECASLA) Program **FFEL ECASLA Acquired Loan Program ***Note: Line items may include rounding adjustments to reconcile to the total amount being reported.
Figure 17 illustrates that with $42.1 billion outstanding, the FFEL ECASLA portfolio segment remains the major component of the FFEL Guaranteed portfolio of net credit program receivables as of Sept. 30, 2021 but declined by $31.0 billion (42.4%) during the five-year period shown. This decrease was mainly the result of collections of principal and the impact of borrowers consolidating their loans under the Direct Loan Program, to take advantage of more favorable repayment options available in that program.
The FFEL ECASLA portfolio declined from $46.3 billion as of Sept. 30, 2020 to $42.1 billion as of Sept. 30, 2021. Outstanding principal declined $48.1 billion to $45.8 billion and the subsidy allowance increased from $11.0 billion to $12.5 billion. Subsidy allowance amounts reduce the net receivable balance. The decrease in the interest receivable from $9.2 billion to $8.9 billion also reduced the net receivable balance. Despite this decrease, the proportion of FFEL ECASLA loans were approximately 72% of the total $58.2 billion of FFEL loans outstanding as of the current year-end.
Over the same five-year period, the smaller FFEL Guaranteed portfolio declined from $29.3 billion to $16.1 billion. The FFEL Guaranteed portfolio declined from $21.1 billion as of Sept. 30, 2020 to $16.1 billion as of Sept. 30, 2021 ($5.0 billion difference). Outstanding principal declined $0.4 billion to $36.3 billion and the subsidy allowance increased by $4.6 billion to $35.2 billion. Subsidy allowance amounts, which reduce the net receivable balance, were slightly offset by an increase in the interest receivable of $0.1 billion to $15.0 billion.
FY 2017 FY 2018 FY 2019 FY 2020 FY 2021 FFEL Guaranteed* $29.3 $28.1 $23.1 $21.1 $16.1 FFEL ECASLA** $73.1 $64.8 $53.7 $46.3 $42.1Total FFEL $102.4 $92.9 $76.8 $67.4 $58.2
$0
$20
$40
$60
$80
$100
$120FF
EL C
redi
t Pro
gram
R
ecei
vabl
es, N
et
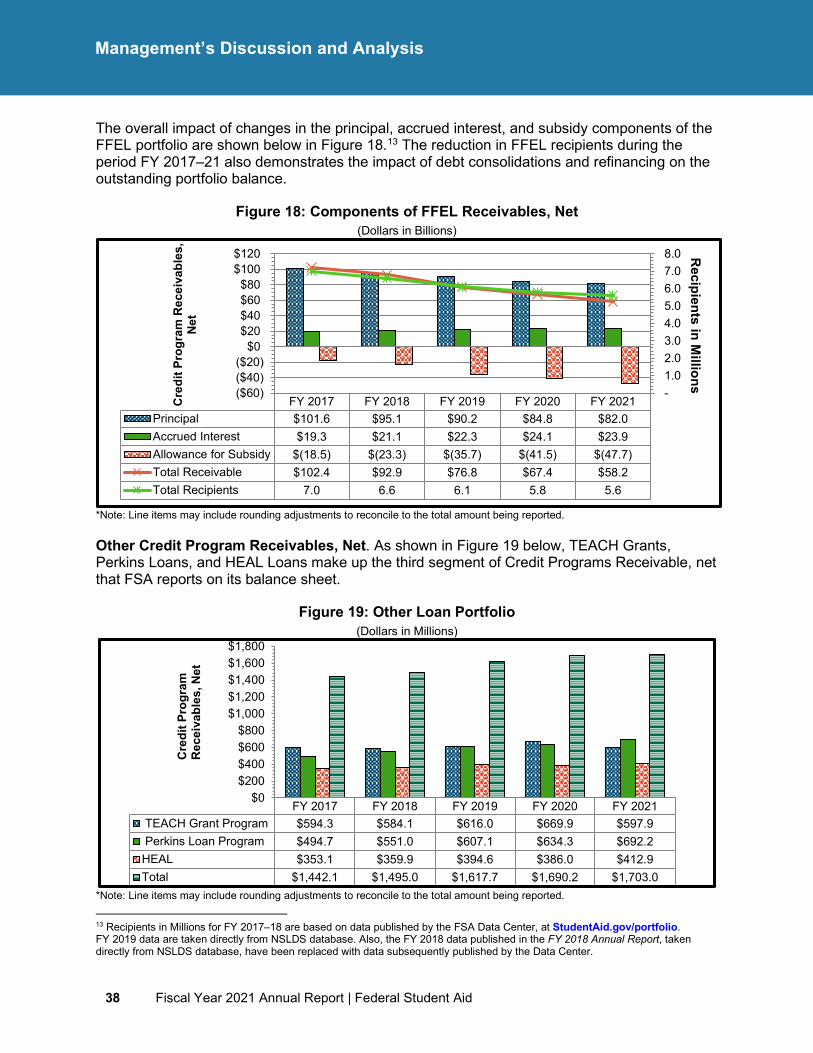
38 Fiscal Year 2021 Annual Report | Federal Student Aid
Management’s Discussion and Analysis
The overall impact of changes in the principal, accrued interest, and subsidy components of the FFEL portfolio are shown below in Figure 18.13 The reduction in FFEL recipients during the period FY 2017–21 also demonstrates the impact of debt consolidations and refinancing on the outstanding portfolio balance.
Figure 18: Components of FFEL Receivables, Net (Dollars in Billions)
*Note: Line items may include rounding adjustments to reconcile to the total amount being reported.
Other Credit Program Receivables, Net. As shown in Figure 19 below, TEACH Grants, Perkins Loans, and HEAL Loans make up the third segment of Credit Programs Receivable, net that FSA reports on its balance sheet.
Figure 19: Other Loan Portfolio (Dollars in Millions)
*Note: Line items may include rounding adjustments to reconcile to the total amount being reported.
13 Recipients in Millions for FY 2017–18 are based on data published by the FSA Data Center, at StudentAid.gov/portfolio. FY 2019 data are taken directly from NSLDS database. Also, the FY 2018 data published in the FY 2018 Annual Report, taken directly from NSLDS database, have been replaced with data subsequently published by the Data Center.
FY 2017 FY 2018 FY 2019 FY 2020 FY 2021Principal $101.6 $95.1 $90.2 $84.8 $82.0Accrued Interest $19.3 $21.1 $22.3 $24.1 $23.9Allowance for Subsidy $(18.5) $(23.3) $(35.7) $(41.5) $(47.7)Total Receivable $102.4 $92.9 $76.8 $67.4 $58.2Total Recipients 7.0 6.6 6.1 5.8 5.6
- 1.0 2.0 3.0 4.0 5.0 6.0 7.0 8.0
($60)($40)($20)
$0$20$40$60$80
$100$120 R
ecipients in Millions
Cre
dit P
rogr
am R
ecei
vabl
es,
Net
FY 2017 FY 2018 FY 2019 FY 2020 FY 2021 TEACH Grant Program $594.3 $584.1 $616.0 $669.9 $597.9 Perkins Loan Program $494.7 $551.0 $607.1 $634.3 $692.2HEAL $353.1 $359.9 $394.6 $386.0 $412.9Total $1,442.1 $1,495.0 $1,617.7 $1,690.2 $1,703.0
$0$200$400$600$800
$1,000$1,200$1,400$1,600$1,800
Cre
dit P
rogr
am
Rec
eiva
bles
, Net
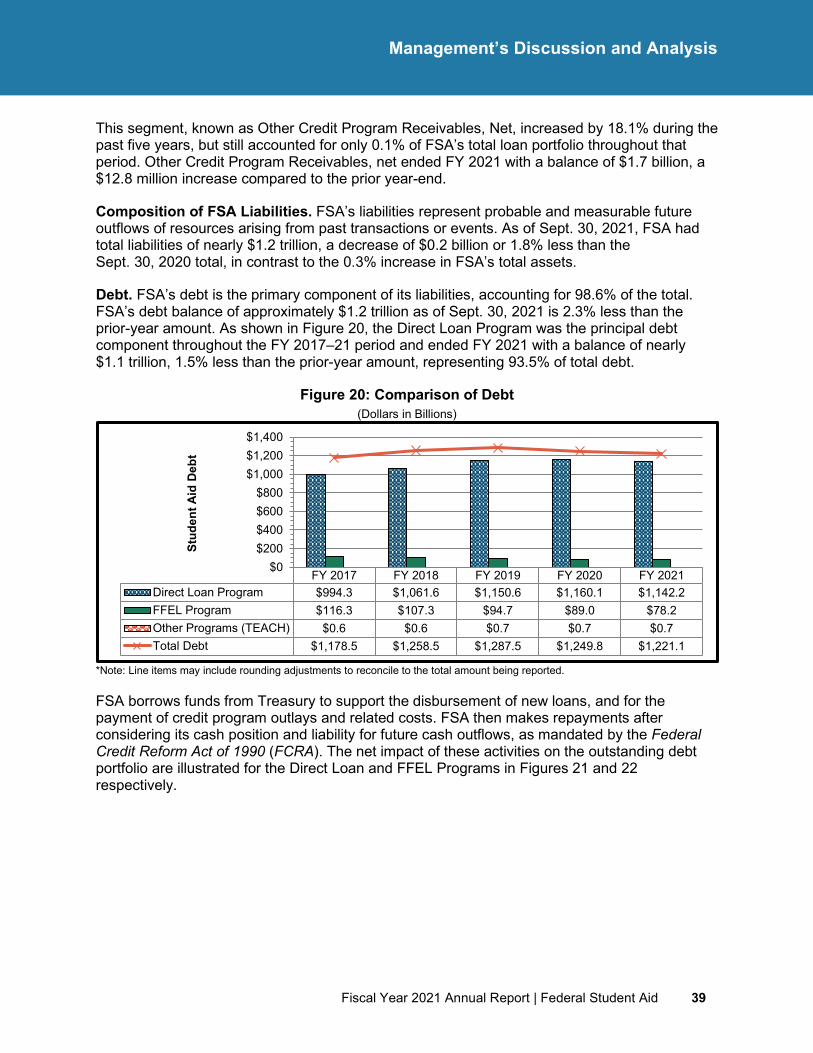
Fiscal Year 2021 Annual Report | Federal Student Aid 39
Management’s Discussion and Analysis
This segment, known as Other Credit Program Receivables, Net, increased by 18.1% during the past five years, but still accounted for only 0.1% of FSA’s total loan portfolio throughout that period. Other Credit Program Receivables, net ended FY 2021 with a balance of $1.7 billion, a $12.8 million increase compared to the prior year-end.
Composition of FSA Liabilities. FSA’s liabilities represent probable and measurable future outflows of resources arising from past transactions or events. As of Sept. 30, 2021, FSA had total liabilities of nearly $1.2 trillion, a decrease of $0.2 billion or 1.8% less than the Sept. 30, 2020 total, in contrast to the 0.3% increase in FSA’s total assets.
Debt. FSA’s debt is the primary component of its liabilities, accounting for 98.6% of the total. FSA’s debt balance of approximately $1.2 trillion as of Sept. 30, 2021 is 2.3% less than the prior-year amount. As shown in Figure 20, the Direct Loan Program was the principal debt component throughout the FY 2017–21 period and ended FY 2021 with a balance of nearly $1.1 trillion, 1.5% less than the prior-year amount, representing 93.5% of total debt.
Figure 20: Comparison of Debt (Dollars in Billions)
*Note: Line items may include rounding adjustments to reconcile to the total amount being reported.
FSA borrows funds from Treasury to support the disbursement of new loans, and for the payment of credit program outlays and related costs. FSA then makes repayments after considering its cash position and liability for future cash outflows, as mandated by the Federal Credit Reform Act of 1990 (FCRA). The net impact of these activities on the outstanding debt portfolio are illustrated for the Direct Loan and FFEL Programs in Figures 21 and 22 respectively.
FY 2017 FY 2018 FY 2019 FY 2020 FY 2021Direct Loan Program $994.3 $1,061.6 $1,150.6 $1,160.1 $1,142.2FFEL Program $116.3 $107.3 $94.7 $89.0 $78.2Other Programs (TEACH) $0.6 $0.6 $0.7 $0.7 $0.7Total Debt $1,178.5 $1,258.5 $1,287.5 $1,249.8 $1,221.1
$0$200$400$600$800
$1,000$1,200$1,400
Stud
ent A
id D
ebt
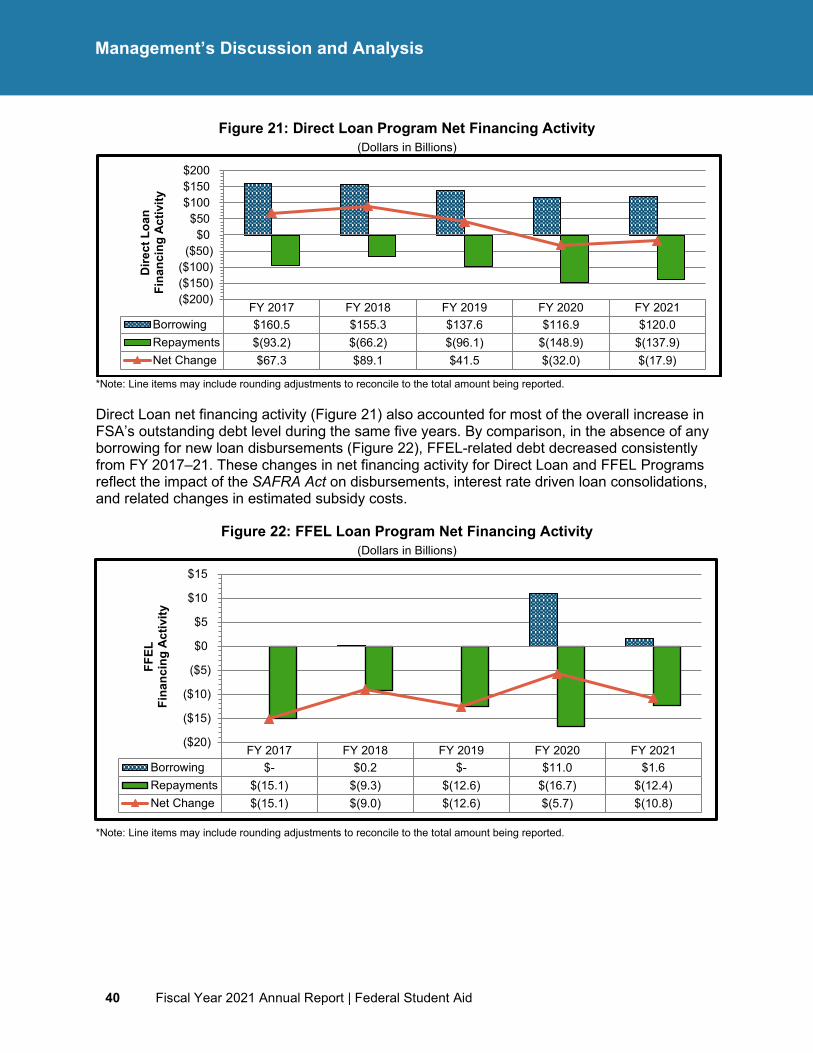
40 Fiscal Year 2021 Annual Report | Federal Student Aid
Management’s Discussion and Analysis
Figure 21: Direct Loan Program Net Financing Activity (Dollars in Billions)
*Note: Line items may include rounding adjustments to reconcile to the total amount being reported.
Direct Loan net financing activity (Figure 21) also accounted for most of the overall increase in FSA’s outstanding debt level during the same five years. By comparison, in the absence of any borrowing for new loan disbursements (Figure 22), FFEL-related debt decreased consistently from FY 2017–21. These changes in net financing activity for Direct Loan and FFEL Programs reflect the impact of the SAFRA Act on disbursements, interest rate driven loan consolidations, and related changes in estimated subsidy costs.
Figure 22: FFEL Loan Program Net Financing Activity (Dollars in Billions)
*Note: Line items may include rounding adjustments to reconcile to the total amount being reported.
FY 2017 FY 2018 FY 2019 FY 2020 FY 2021Borrowing $160.5 $155.3 $137.6 $116.9 $120.0Repayments $(93.2) $(66.2) $(96.1) $(148.9) $(137.9)Net Change $67.3 $89.1 $41.5 $(32.0) $(17.9)
($200)($150)($100)($50)
$0$50
$100$150$200
Dire
ct L
oan
Fina
ncin
g Ac
tivity
FY 2017 FY 2018 FY 2019 FY 2020 FY 2021Borrowing $- $0.2 $- $11.0 $1.6Repayments $(15.1) $(9.3) $(12.6) $(16.7) $(12.4)Net Change $(15.1) $(9.0) $(12.6) $(5.7) $(10.8)
($20)
($15)
($10)
($5)
$0
$5
$10
$15
FFEL
Fi
nanc
ing
Activ
ity
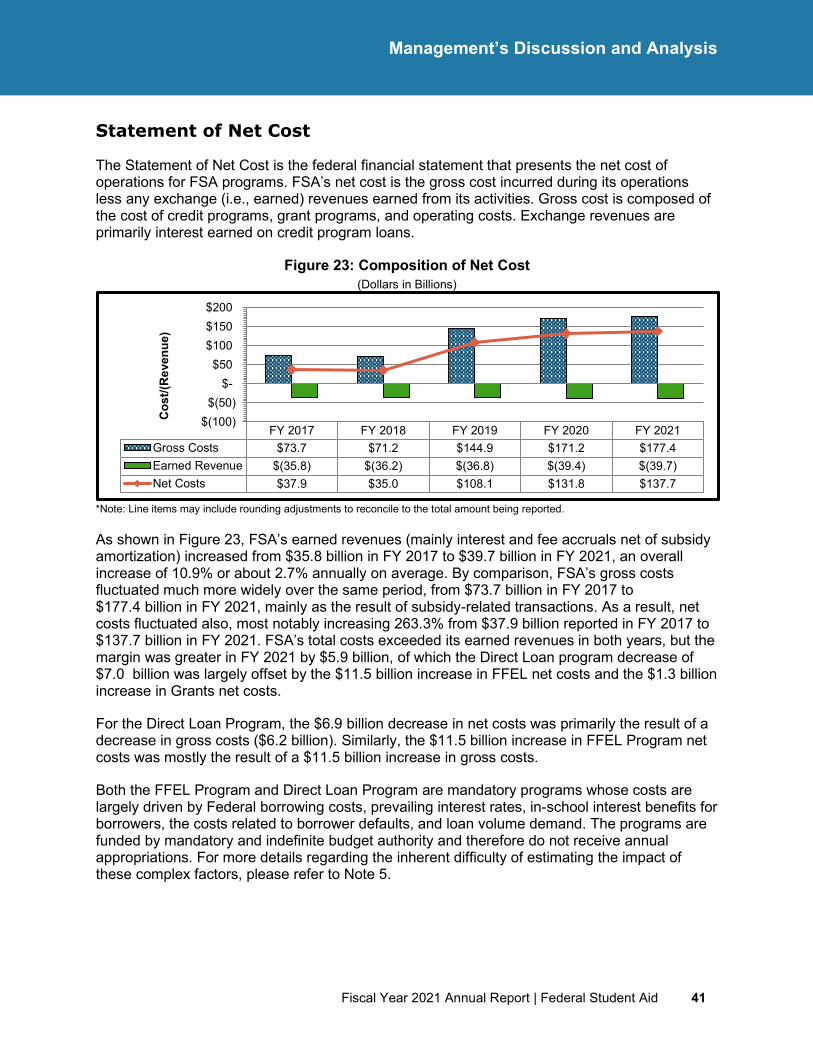
Fiscal Year 2021 Annual Report | Federal Student Aid 41
Management’s Discussion and Analysis
Statement of Net Cost
The Statement of Net Cost is the federal financial statement that presents the net cost of operations for FSA programs. FSA’s net cost is the gross cost incurred during its operations less any exchange (i.e., earned) revenues earned from its activities. Gross cost is composed of the cost of credit programs, grant programs, and operating costs. Exchange revenues are primarily interest earned on credit program loans.
Figure 23: Composition of Net Cost (Dollars in Billions)
*Note: Line items may include rounding adjustments to reconcile to the total amount being reported.
As shown in Figure 23, FSA’s earned revenues (mainly interest and fee accruals net of subsidy amortization) increased from $35.8 billion in FY 2017 to $39.7 billion in FY 2021, an overall increase of 10.9% or about 2.7% annually on average. By comparison, FSA’s gross costs fluctuated much more widely over the same period, from $73.7 billion in FY 2017 to $177.4 billion in FY 2021, mainly as the result of subsidy-related transactions. As a result, net costs fluctuated also, most notably increasing 263.3% from $37.9 billion reported in FY 2017 to $137.7 billion in FY 2021. FSA’s total costs exceeded its earned revenues in both years, but the margin was greater in FY 2021 by $5.9 billion, of which the Direct Loan program decrease of $7.0 billion was largely offset by the $11.5 billion increase in FFEL net costs and the $1.3 billion increase in Grants net costs.
For the Direct Loan Program, the $6.9 billion decrease in net costs was primarily the result of a decrease in gross costs ($6.2 billion). Similarly, the $11.5 billion increase in FFEL Program net costs was mostly the result of a $11.5 billion increase in gross costs.
Both the FFEL Program and Direct Loan Program are mandatory programs whose costs are largely driven by Federal borrowing costs, prevailing interest rates, in-school interest benefits for borrowers, the costs related to borrower defaults, and loan volume demand. The programs are funded by mandatory and indefinite budget authority and therefore do not receive annual appropriations. For more details regarding the inherent difficulty of estimating the impact of these complex factors, please refer to Note 5.
FY 2017 FY 2018 FY 2019 FY 2020 FY 2021Gross Costs $73.7 $71.2 $144.9 $171.2 $177.4Earned Revenue $(35.8) $(36.2) $(36.8) $(39.4) $(39.7)Net Costs $37.9 $35.0 $108.1 $131.8 $137.7
$(100) $(50)
$- $50
$100 $150 $200
Cos
t/(R
even
ue)
42 Fiscal Year 2021 Annual Report | Federal Student Aid
Management’s Discussion and Analysis
Statement of Changes in Net Position
The Statement of Changes in Net Position presents those amounts that caused the net position section of the Balance Sheet to change from the beginning to the end of the reporting period and is affected by changes in its two components, cumulative results of operations and unexpended appropriations.
FSA’s net position as of Sept. 30, 2021, was $7.6 billion, an increase of $27.0 billion compared to the previous Sept. 30 net position. The difference reflects an increase in the cumulative results of operations by the amount of $25.7 billion, from $(54.4) billion in FY 2020 to $(28.7) billion in FY 2021, of which $30.0 billion of the increase related to the Direct Loan Program and $(4.7) billion was attributable to the FFEL Program. In addition, unexpended appropriations increased by $1.3 billion, of which $1.4 billion were attributable to the combined Perkins Loan and Grants Programs, with the $0.3 billion decrease in Direct Loan Program unexpended appropriations accounting for most of the remaining difference.
Statement of Budgetary Resources
The Statement of Budgetary Resources compares the budgetary resources provided with the status or execution of those resources. It also details the composition of the resources and shows the amount of net outlays. Appropriations are available to cover the subsidy cost of each loan program and administrative expenses. Subsidy expense represents the difference between the net present value of expected future cash flows and the face value of each loan portfolio. Appropriation authority is available as needed on a permanent basis to finance costs resulting from loans guaranteed in the years before FY 1992. The Pell Grant Program receives appropriations to cover actual grant disbursements.
This statement shows that as of Sept. 30, 2021, FSA had $381.0 billion in combined total budgetary resources, of which $39.8 billion remained unobligated and not apportioned. This compared to $389.1 billion in budgetary resources twelve months earlier of which $38.9 billion were unobligated and not apportioned. Overall budgetary resources decreased by $8.1 billion or 2.0%, primarily as the net result of increases in budgetary resources for the Direct Loan Program ($6.6 billion).
FSA’s Net Outlays after Distributed Offsetting Receipts as of Sept. 30, 2021, were $125.5 billion, an increase of $21.1 billion or 20.2% compared to the prior Sept. 30 amount of $104.4 billion. The Direct Loan Program accounted for a $19.5 billion increase, with a FFEL increase of $1.9 billion and a $0.3 billion decrease attributable to the combined Perkins Loan and Grants Programs. FFEL Program activity was mainly due to an increase in net outlays $6.6 billion, together with a decrease in distributed offsetting receipts $6.3 billion. Additional information is provided in Note 12.
Limitations of Financial Statements
The principal financial statements are prepared to report the financial position, financial condition, and results of operations, pursuant to the requirements of 31 U.S.C. § 3515(b). The statements are prepared from records of Federal entities in accordance with Federal generally accepted accounting principles (GAAP) and the formats prescribed by OMB. Reports used to
Fiscal Year 2021 Annual Report | Federal Student Aid 43
Management’s Discussion and Analysis
monitor and control budgetary resources are prepared from the same records. Users of the statements are advised that the statements are for a component of the U.S. Government.
Financial Management Highlights
Financial Impact of the Coronavirus Disease 2019
In response to the COVID-19 emergency, Congress enacted the CARES Act on March 27, 2020. As part of the CARES Act, FSA received $40.0 million to support efforts related to loan forbearance, default collection wage garnishment assistance for student loan borrowers, servicing system modifications, systems support of COVID-19 telework, and hiring of temporary employees. In FY 2020, FSA obligated $13.9 million, committed approximately $3.0 million, and the remaining balance carried over into FY 2021.
The Coronavirus Response and Relief Supplemental Appropriations Act, 2021, which was part of the Consolidated Appropriations Act, 2021, was signed into law December 2020, and provided additional relief funding in the amount of $30 million. In FY 2021, FSA obligated $24.0 million and carried over $6.0 million into FY 2022. The American Rescue Plan Act of 2021 which was signed into law in March 2021 and provided $91.1 million in relief funding. During FY 2021, FSA obligated $42.9 and carried over $48.2 million into FY 2022.
The CARES Act provided emergency relief measures in the Direct Loan program that included suspending loan payments, halting collections on defaulted loans, and setting interest rates to 0% through Sept. 30, 2020. In response, FSA stopped all federal wage garnishments and collection actions for borrowers with federally held loans in default, and FSA paid approximately 2.3 million refunds of Treasury Offset Program and Administrative Wage Garnishments totaling $2.5 billion. Emergency relief measures were repeatedly extended and expanded subsequent to the CARES Act. On Aug. 6, 2021, the COVID-19 relief measures were extended through Jan. 31, 2022.
44 Fiscal Year 2021 Annual Report | Federal Student Aid
Management’s Discussion and Analysis
Analysis of Systems, Controls, and Legal Compliance
FSA adheres to the Government Accountability Office (GAO) published guidance on internal control and recognizes that internal control is an integral part of managing an organization. Internal control includes the plans, methods, and procedures used to meet the organization’s missions, goals, and objectives. In carrying out these components of internal control, FSA supports an environment for performance-based management. Internal control also serves as the first line of defense in safeguarding assets and preventing and detecting errors and fraud. Internal control helps government program managers achieve desired results through effective stewardship of public resources.
Internal controls should provide reasonable assurance that the objectives of the agency are being achieved in the following categories:
• Effective and efficient operations
• Reliability of reporting for internal and external use
• Compliance with applicable laws and regulations14
FSA is responsible for establishing and maintaining effective internal control over reporting and financial management systems that meet the objectives of the Federal Managers’ Financial Integrity Act of 1982 and annually assessing the effectiveness and efficiency of its internal controls over operations and compliance with applicable laws and regulations in accordance with OMB Circular A-123, Management’s Responsibility for Enterprise Risk Management and Internal Control (OMB Circular A-123). FSA continues to coordinate with the Department and internally to execute these requirements.
Based on the results of this year’s assessment, FSA reported to the Department’s management that its internal control over operations, including internal controls intended to prevent, detect and recover improper payments, and compliance with applicable laws and regulations, as of Sept. 30, 2021, was operating effectively, with the exception of the Payment Integrity Information Act of 2019 as noted in the Legal Compliance section of the Department’s AFR. This section also includes information regarding the Department’s compliance with the Debt Collection Improvement Act of 1996, as amended by the Digital Accountability and Transparency Act of 2014.
In addition, FSA, working with the Department, conducted its current year assessment of the effectiveness of internal control in accordance with the requirements of OMB Circular A-123, Appendix A, Management of Reporting and Data Integrity Risk (OMB Circular A-123, Appendix A). OMB Circular A-123, Appendix A provides requirements to agencies for conducting management’s assessment of internal control over reporting. The scope of FSA’s assessment focuses on new processes and processes with high-risk profiles that are tested every year. Processes with lower-risk profiles are reviewed and tested on a 4-year cycle. In FY 2021, FSA continued to rely on audits of external service providers conducted by independent public
14 Government Accountability Office Standards for Internal Control in the Federal Government, GAO-14-704G, Sept. 10, 2014, p.5.
Fiscal Year 2021 Annual Report | Federal Student Aid 45
Management’s Discussion and Analysis
accountants in accordance with Statement on Standards for Attestation Engagements Number 18, Reporting on Controls at a Service Organization.
FSA’s participation in the Department's implementation of the requirements of OMB Circular A-123, including Appendix A, enables it to continue to build upon its internal control framework. This framework will be used in continuing efforts to monitor and improve internal control. Please refer to the Analysis of Systems, Controls and Legal Compliance section of the Department’s AFR for additional information related to management’s assurances and disclosures.
Please also refer to the Analysis of Systems, Controls and Legal Compliance section of the Department’s AFR for information related to the Department's compliance with the Federal Financial Management Improvement Act of 1996.
FSA’s financial management systems strategy is formulated and managed as part of the Department’s strategy. For details on FSA’s financial management systems strategy, please refer to the Financial Management Systems Strategy narrative found in the Management’s Discussion and Analysis section of the Department’s AFR.

46 Fiscal Year 2021 Annual Report | Federal Student Aid
Management’s Discussion and Analysis
This page is intentionally left blank
Fiscal Year 2021 Annual Report | Federal Student Aid 47
Annual Performance Report
Annual Performance Report (Unaudited)
48 Fiscal Year 2021 Annual Report | Federal Student Aid
Annual Performance Report
This page is intentionally left blank
Fiscal Year 2021 Annual Report | Federal Student Aid 49
Annual Performance Report
Overview of the Annual Performance Report
The Annual Performance Report section of the FSA FY 2021 Annual Report provides detailed performance information on FSA’s progress in achieving the goals and objectives described in the FY 2020–24 Strategic Plan. The subsections of the Annual Performance Report are listed and briefly discussed below:
• Introduction to the Annual Performance Report: The Introduction to the Annual Performance Report provides an overview of the Annual Performance Report and includes a high-level summary of the FY 2020–24 Strategic Plan.
• Performance Results by Strategic Goal: This subsection details the results of each overall strategic goal by strategic objective and performance metric. Each strategic objective provides an overview and a performance summary and analysis, including noteworthy progress and focused improvement. Each performance metric includes a table that presents five years of data results, where available, as well as its current target and results. The performance metric section also includes a discussion of the metric definition, data source, and performance period.
• Fiscal Year 2021 Accomplishments of Federal Student Aid: This subsection describes additional accomplishments that were not measured by the performance metrics included in the strategic plan but were the result of initiatives that FSA undertook to support the implementation of the strategic plan or legislative changes.
50 Fiscal Year 2021 Annual Report | Federal Student Aid
Annual Performance Report
Introduction to the Annual Performance Report
The FSA strategic plan guides FSA toward achieving its vision “To be the most trusted and reliable source of student financial aid, information, and services in the nation.” Through the strategic plan, FSA documents the strategic goals, objectives, and performance metrics of the organization. The FSA Annual Report provides a detailed view of the past year’s goals, challenges, and accomplishments in the context of FSA’s FY 2020–24 Strategic Plan.
The strategic goals are:
• Strategic Goal 1: Empower a High-Performing Organization • Strategic Goal 2: Provide World-Class Customer Experience to the Students, Parents,
and Borrowers We Serve
• Strategic Goal 3: Increase Partner Engagement and Oversight Effectiveness • Strategic Goal 4: Strengthen Data Protection and Cybersecurity Safeguards • Strategic Goal 5: Enhance the Management and Transparency of the Portfolio
FSA is committed to continuous performance improvement and conducts frequent reviews of its strategic plan. During FY 2021, FSA reviewed the FY 2020–24 Strategic Plan and identified changes that would improve delivery of its mission and enhance its performance reporting. As a result of its strategic review, FSA refined its performance measurements to reflect better strategies in driving progress towards achieving strategic objectives and present a more accurate measure of FSA’s performance in meeting the goals. To read more about performance measure and metric target changes, refer to the Appendices section.
FSA supports the Department’s overall strategic goals and objectives, as defined in the Department’s FY 2018–22 Strategic Plan. During the COVID-19 emergency and administrative forbearance period, the top priority remains engagement and outreach communications with students, parents, borrowers, institutions, and loan servicers to inform them about student aid information and relief measures for eligible loans. Currently, the Department is drafting a new strategic plan and will publish its Department of Education Strategic Plan for Fiscal Years 2022–26 in February 2022. The Department’s strategic plan will establish updated strategic goals, objectives, and performance indicators to assess progress toward the Administration’s priorities of increasing postsecondary education access, affordability, completion, and post-enrollment success. FSA will review its strategic plan and align future strategies and actions to support the Department’s new priorities in FY 2022 to deliver an enhanced customer experience to borrowers through effective communication and a manageable return to repayment process.
FSA is required, by the PBO-enabling legislation, to report annually its level of performance and the associated results. This section, the Annual Performance Report, satisfies this annual reporting requirement. For additional performance-related information—including a more complete discussion of FSA’s mission, organization, and performance management—refer to the Management’s Discussion and Analysis section. To read more about FSA’s strategic plans refer to StudentAid.gov/strategic-planning-and-reporting.
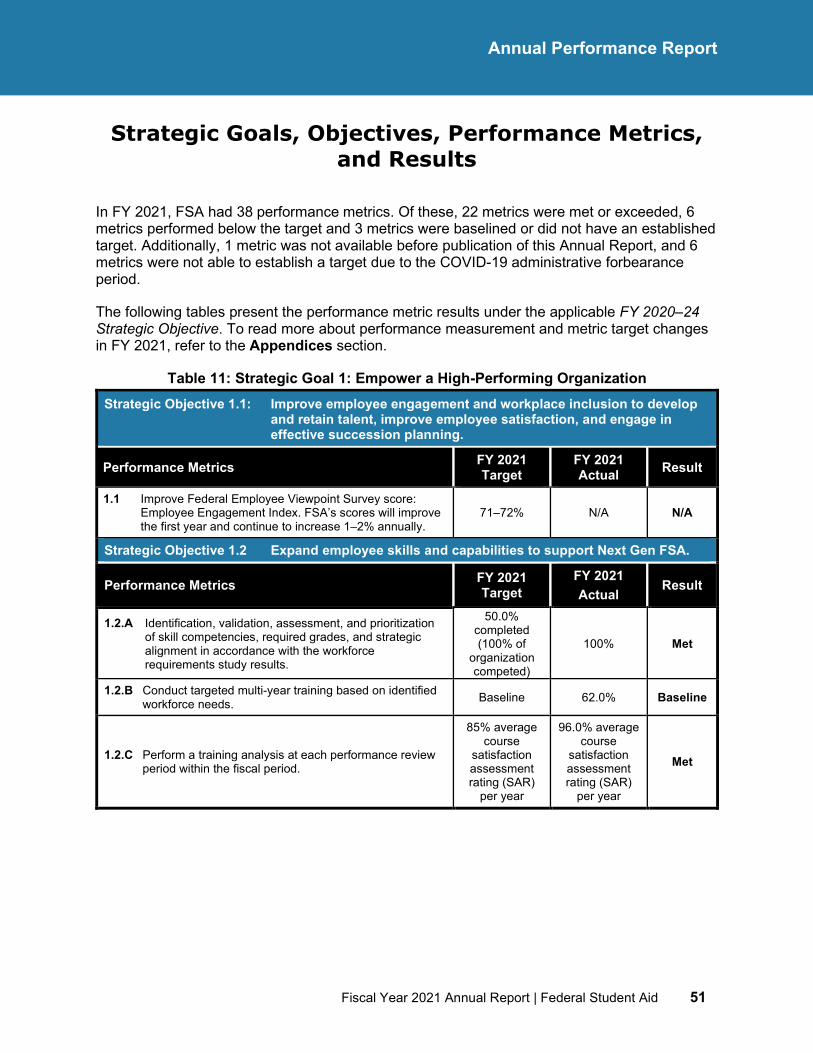
Fiscal Year 2021 Annual Report | Federal Student Aid 51
Annual Performance Report
Strategic Goals, Objectives, Performance Metrics, and Results
In FY 2021, FSA had 38 performance metrics. Of these, 22 metrics were met or exceeded, 6 metrics performed below the target and 3 metrics were baselined or did not have an established target. Additionally, 1 metric was not available before publication of this Annual Report, and 6 metrics were not able to establish a target due to the COVID-19 administrative forbearance period.
The following tables present the performance metric results under the applicable FY 2020–24 Strategic Objective. To read more about performance measurement and metric target changes in FY 2021, refer to the Appendices section.
Table 11: Strategic Goal 1: Empower a High-Performing Organization Strategic Objective 1.1: Improve employee engagement and workplace inclusion to develop
and retain talent, improve employee satisfaction, and engage in effective succession planning.
Performance Metrics FY 2021 Target
FY 2021 Actual Result
1.1 Improve Federal Employee Viewpoint Survey score: Employee Engagement Index. FSA’s scores will improve the first year and continue to increase 1–2% annually.
71–72% N/A N/A
Strategic Objective 1.2 Expand employee skills and capabilities to support Next Gen FSA.
Performance Metrics FY 2021 Target
FY 2021 Actual
Result
1.2.A Identification, validation, assessment, and prioritization of skill competencies, required grades, and strategic alignment in accordance with the workforce requirements study results.
50.0% completed (100% of
organization competed)
100% Met
1.2.B Conduct targeted multi-year training based on identified workforce needs. Baseline 62.0% Baseline
1.2.C Perform a training analysis at each performance review period within the fiscal period.
85% average course
satisfaction assessment rating (SAR)
per year
96.0% average course
satisfaction assessment rating (SAR)
per year
Met
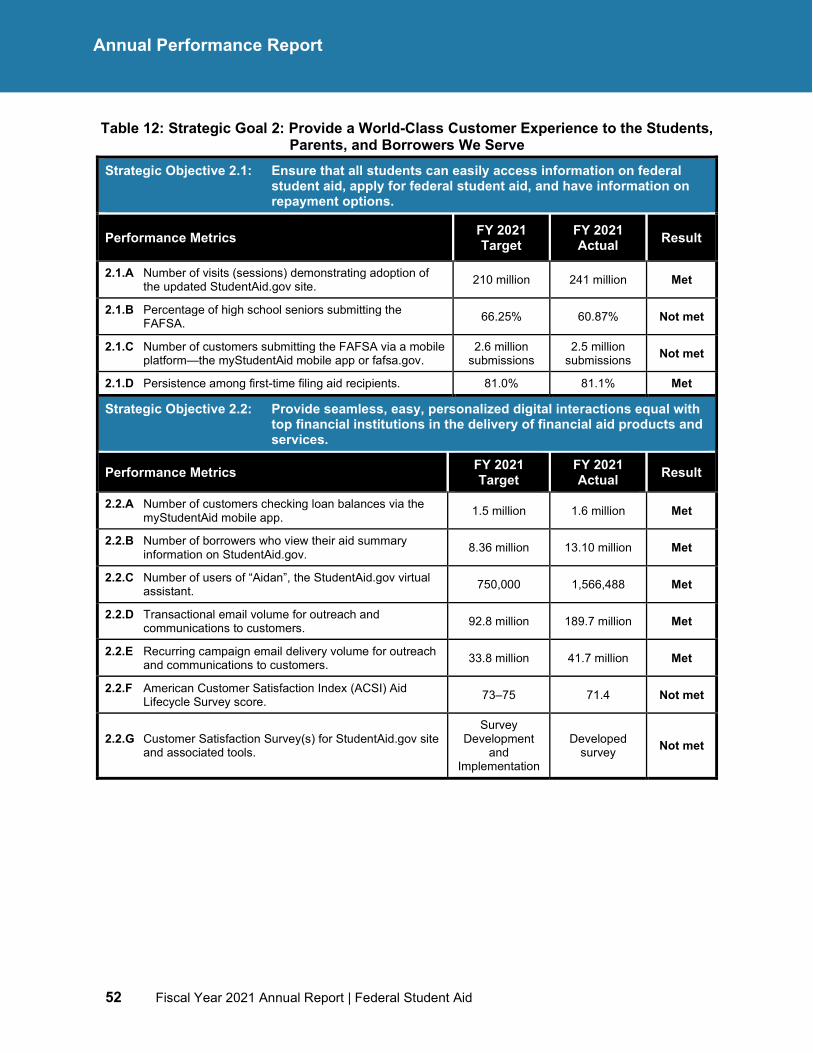
52 Fiscal Year 2021 Annual Report | Federal Student Aid
Annual Performance Report
Table 12: Strategic Goal 2: Provide a World-Class Customer Experience to the Students, Parents, and Borrowers We Serve
Strategic Objective 2.1: Ensure that all students can easily access information on federal student aid, apply for federal student aid, and have information on repayment options.
Performance Metrics FY 2021 Target
FY 2021 Actual Result
2.1.A Number of visits (sessions) demonstrating adoption of the updated StudentAid.gov site. 210 million 241 million Met
2.1.B Percentage of high school seniors submitting the FAFSA. 66.25% 60.87% Not met
2.1.C Number of customers submitting the FAFSA via a mobile platform—the myStudentAid mobile app or fafsa.gov.
2.6 million submissions
2.5 million submissions Not met
2.1.D Persistence among first-time filing aid recipients. 81.0% 81.1% Met
Strategic Objective 2.2: Provide seamless, easy, personalized digital interactions equal with top financial institutions in the delivery of financial aid products and services.
Performance Metrics FY 2021 Target
FY 2021 Actual Result
2.2.A Number of customers checking loan balances via the myStudentAid mobile app. 1.5 million 1.6 million Met
2.2.B Number of borrowers who view their aid summary information on StudentAid.gov. 8.36 million 13.10 million Met
2.2.C Number of users of “Aidan”, the StudentAid.gov virtual assistant. 750,000 1,566,488 Met
2.2.D Transactional email volume for outreach and communications to customers. 92.8 million 189.7 million Met
2.2.E Recurring campaign email delivery volume for outreach and communications to customers. 33.8 million 41.7 million Met
2.2.F American Customer Satisfaction Index (ACSI) Aid Lifecycle Survey score. 73–75 71.4 Not met
2.2.G Customer Satisfaction Survey(s) for StudentAid.gov site and associated tools.
Survey Development
and Implementation
Developed survey Not met
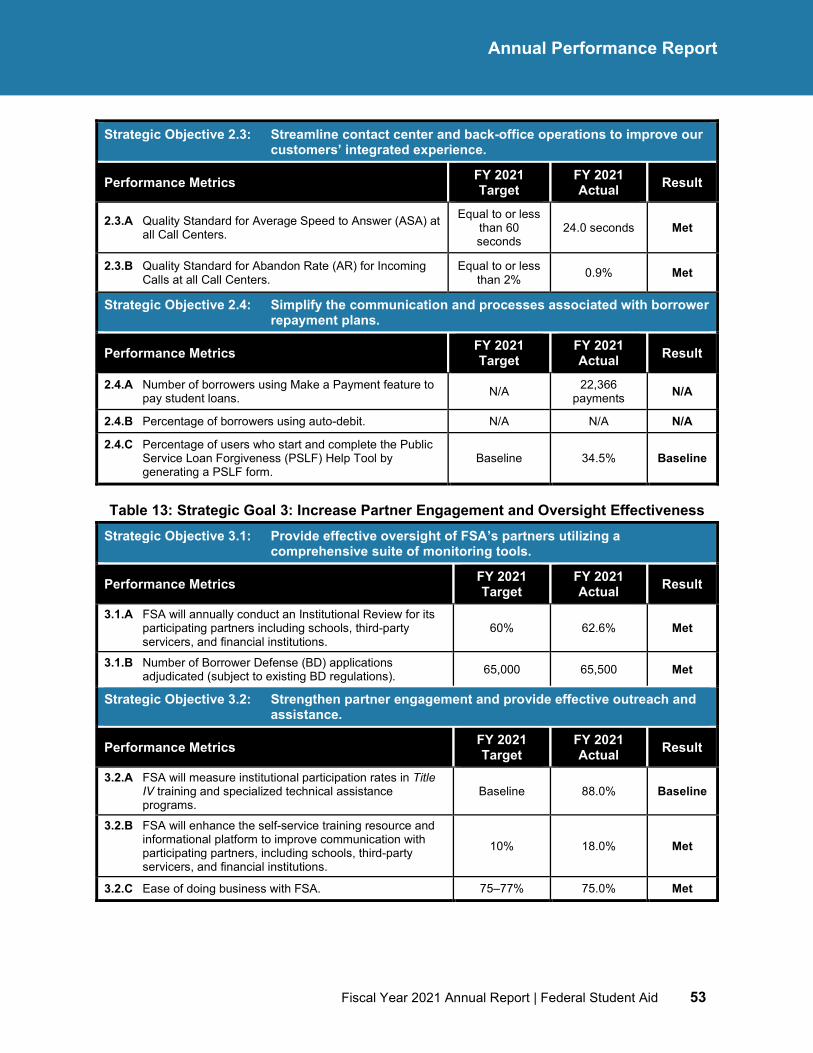
Fiscal Year 2021 Annual Report | Federal Student Aid 53
Annual Performance Report
Strategic Objective 2.3: Streamline contact center and back-office operations to improve our customers’ integrated experience.
Performance Metrics FY 2021 Target
FY 2021 Actual Result
2.3.A Quality Standard for Average Speed to Answer (ASA) at all Call Centers.
Equal to or less than 60 seconds
24.0 seconds Met
2.3.B Quality Standard for Abandon Rate (AR) for Incoming Calls at all Call Centers.
Equal to or less than 2% 0.9% Met
Strategic Objective 2.4: Simplify the communication and processes associated with borrower repayment plans.
Performance Metrics FY 2021 Target
FY 2021 Actual Result
2.4.A Number of borrowers using Make a Payment feature to pay student loans. N/A 22,366
payments N/A
2.4.B Percentage of borrowers using auto-debit. N/A N/A N/A
2.4.C Percentage of users who start and complete the Public Service Loan Forgiveness (PSLF) Help Tool by generating a PSLF form.
Baseline 34.5% Baseline
Table 13: Strategic Goal 3: Increase Partner Engagement and Oversight Effectiveness Strategic Objective 3.1: Provide effective oversight of FSA’s partners utilizing a
comprehensive suite of monitoring tools.
Performance Metrics FY 2021 Target
FY 2021 Actual Result
3.1.A FSA will annually conduct an Institutional Review for its participating partners including schools, third-party servicers, and financial institutions.
60% 62.6% Met
3.1.B Number of Borrower Defense (BD) applications adjudicated (subject to existing BD regulations). 65,000 65,500 Met
Strategic Objective 3.2: Strengthen partner engagement and provide effective outreach and assistance.
Performance Metrics FY 2021 Target
FY 2021 Actual Result
3.2.A FSA will measure institutional participation rates in Title IV training and specialized technical assistance programs.
Baseline 88.0% Baseline
3.2.B FSA will enhance the self-service training resource and informational platform to improve communication with participating partners, including schools, third-party servicers, and financial institutions.
10% 18.0% Met
3.2.C Ease of doing business with FSA. 75–77% 75.0% Met
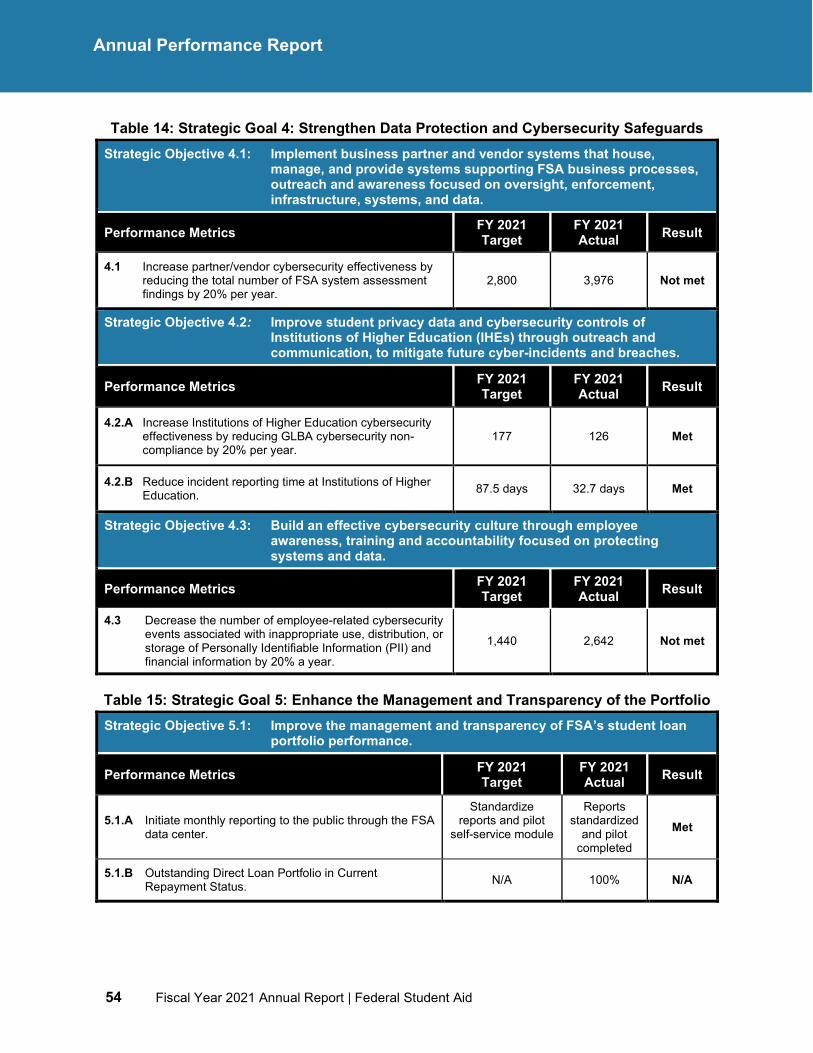
54 Fiscal Year 2021 Annual Report | Federal Student Aid
Annual Performance Report
Table 14: Strategic Goal 4: Strengthen Data Protection and Cybersecurity Safeguards Strategic Objective 4.1: Implement business partner and vendor systems that house,
manage, and provide systems supporting FSA business processes, outreach and awareness focused on oversight, enforcement, infrastructure, systems, and data.
Performance Metrics FY 2021 Target
FY 2021 Actual Result
4.1 Increase partner/vendor cybersecurity effectiveness by reducing the total number of FSA system assessment findings by 20% per year.
2,800 3,976 Not met
Strategic Objective 4.2: Improve student privacy data and cybersecurity controls of Institutions of Higher Education (IHEs) through outreach and communication, to mitigate future cyber-incidents and breaches.
Performance Metrics FY 2021 Target
FY 2021 Actual Result
4.2.A Increase Institutions of Higher Education cybersecurity effectiveness by reducing GLBA cybersecurity non-compliance by 20% per year.
177 126 Met
4.2.B Reduce incident reporting time at Institutions of Higher Education. 87.5 days 32.7 days Met
Strategic Objective 4.3: Build an effective cybersecurity culture through employee awareness, training and accountability focused on protecting systems and data.
Performance Metrics FY 2021 Target
FY 2021 Actual Result
4.3 Decrease the number of employee-related cybersecurity events associated with inappropriate use, distribution, or storage of Personally Identifiable Information (PII) and financial information by 20% a year.
1,440 2,642 Not met
Table 15: Strategic Goal 5: Enhance the Management and Transparency of the Portfolio Strategic Objective 5.1: Improve the management and transparency of FSA’s student loan
portfolio performance.
Performance Metrics FY 2021 Target
FY 2021 Actual Result
5.1.A Initiate monthly reporting to the public through the FSA data center.
Standardize reports and pilot
self-service module
Reports standardized
and pilot completed
Met
5.1.B Outstanding Direct Loan Portfolio in Current Repayment Status. N/A 100% N/A
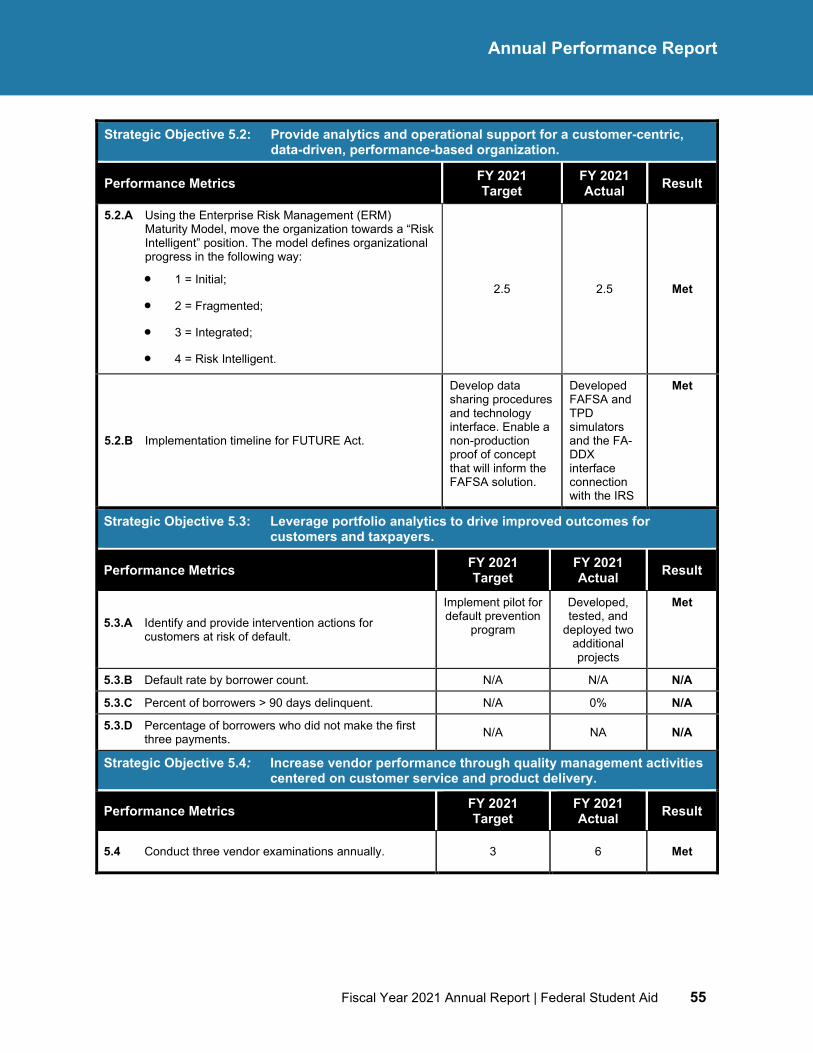
Fiscal Year 2021 Annual Report | Federal Student Aid 55
Annual Performance Report
Strategic Objective 5.2: Provide analytics and operational support for a customer-centric, data-driven, performance-based organization.
Performance Metrics FY 2021 Target
FY 2021 Actual Result
5.2.A Using the Enterprise Risk Management (ERM) Maturity Model, move the organization towards a “Risk Intelligent” position. The model defines organizational progress in the following way:
• 1 = Initial;
• 2 = Fragmented;
• 3 = Integrated;
• 4 = Risk Intelligent.
2.5 2.5 Met
5.2.B Implementation timeline for FUTURE Act.
Develop data sharing procedures and technology interface. Enable a non-production proof of concept that will inform the FAFSA solution.
Developed FAFSA and TPD simulators and the FA-DDX interface connection with the IRS
Met
Strategic Objective 5.3: Leverage portfolio analytics to drive improved outcomes for customers and taxpayers.
Performance Metrics FY 2021 Target
FY 2021 Actual Result
5.3.A Identify and provide intervention actions for customers at risk of default.
Implement pilot for default prevention
program
Developed, tested, and
deployed two additional projects
Met
5.3.B Default rate by borrower count. N/A N/A N/A
5.3.C Percent of borrowers > 90 days delinquent. N/A 0% N/A
5.3.D Percentage of borrowers who did not make the first three payments. N/A NA N/A
Strategic Objective 5.4: Increase vendor performance through quality management activities centered on customer service and product delivery.
Performance Metrics FY 2021 Target
FY 2021 Actual Result
5.4 Conduct three vendor examinations annually. 3 6 Met
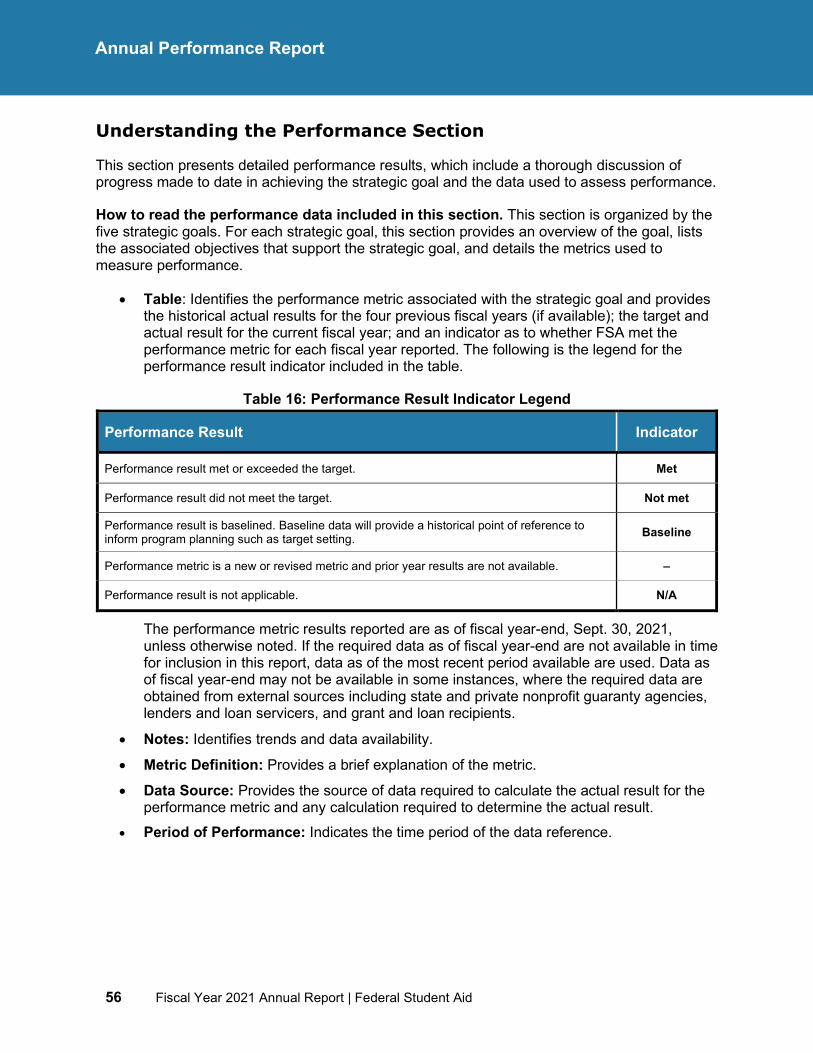
56 Fiscal Year 2021 Annual Report | Federal Student Aid
Annual Performance Report
Understanding the Performance Section
This section presents detailed performance results, which include a thorough discussion of progress made to date in achieving the strategic goal and the data used to assess performance.
How to read the performance data included in this section. This section is organized by the five strategic goals. For each strategic goal, this section provides an overview of the goal, lists the associated objectives that support the strategic goal, and details the metrics used to measure performance.
• Table: Identifies the performance metric associated with the strategic goal and provides the historical actual results for the four previous fiscal years (if available); the target and actual result for the current fiscal year; and an indicator as to whether FSA met the performance metric for each fiscal year reported. The following is the legend for the performance result indicator included in the table.
Table 16: Performance Result Indicator Legend
Performance Result Indicator
Performance result met or exceeded the target. Met
Performance result did not meet the target. Not met
Performance result is baselined. Baseline data will provide a historical point of reference to inform program planning such as target setting. Baseline
Performance metric is a new or revised metric and prior year results are not available. –
Performance result is not applicable. N/A
The performance metric results reported are as of fiscal year-end, Sept. 30, 2021, unless otherwise noted. If the required data as of fiscal year-end are not available in time for inclusion in this report, data as of the most recent period available are used. Data as of fiscal year-end may not be available in some instances, where the required data are obtained from external sources including state and private nonprofit guaranty agencies, lenders and loan servicers, and grant and loan recipients.
• Notes: Identifies trends and data availability.
• Metric Definition: Provides a brief explanation of the metric. • Data Source: Provides the source of data required to calculate the actual result for the
performance metric and any calculation required to determine the actual result. • Period of Performance: Indicates the time period of the data reference.
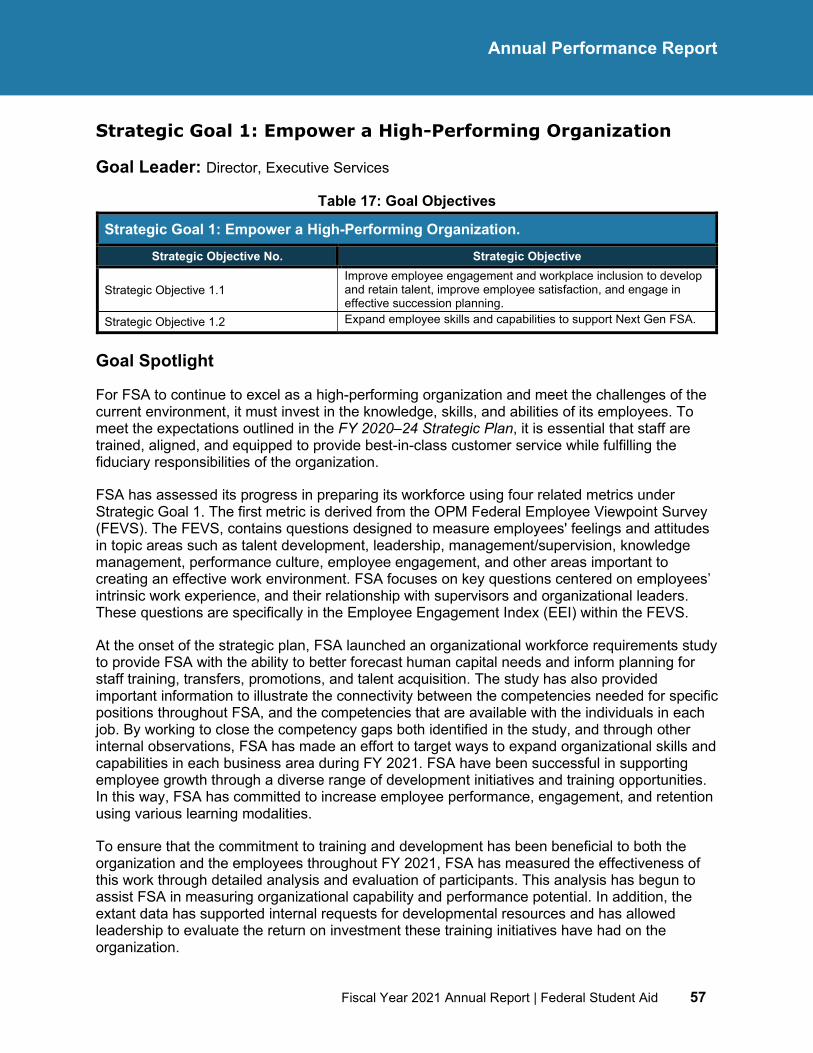
Fiscal Year 2021 Annual Report | Federal Student Aid 57
Annual Performance Report
Strategic Goal 1: Empower a High-Performing Organization
Goal Leader: Director, Executive Services
Table 17: Goal Objectives
Strategic Goal 1: Empower a High-Performing Organization. Strategic Objective No. Strategic Objective
Strategic Objective 1.1 Improve employee engagement and workplace inclusion to develop and retain talent, improve employee satisfaction, and engage in effective succession planning.
Strategic Objective 1.2 Expand employee skills and capabilities to support Next Gen FSA.
Goal Spotlight
For FSA to continue to excel as a high-performing organization and meet the challenges of the current environment, it must invest in the knowledge, skills, and abilities of its employees. To meet the expectations outlined in the FY 2020–24 Strategic Plan, it is essential that staff are trained, aligned, and equipped to provide best-in-class customer service while fulfilling the fiduciary responsibilities of the organization.
FSA has assessed its progress in preparing its workforce using four related metrics under Strategic Goal 1. The first metric is derived from the OPM Federal Employee Viewpoint Survey (FEVS). The FEVS, contains questions designed to measure employees' feelings and attitudes in topic areas such as talent development, leadership, management/supervision, knowledge management, performance culture, employee engagement, and other areas important to creating an effective work environment. FSA focuses on key questions centered on employees’ intrinsic work experience, and their relationship with supervisors and organizational leaders. These questions are specifically in the Employee Engagement Index (EEI) within the FEVS.
At the onset of the strategic plan, FSA launched an organizational workforce requirements study to provide FSA with the ability to better forecast human capital needs and inform planning for staff training, transfers, promotions, and talent acquisition. The study has also provided important information to illustrate the connectivity between the competencies needed for specific positions throughout FSA, and the competencies that are available with the individuals in each job. By working to close the competency gaps both identified in the study, and through other internal observations, FSA has made an effort to target ways to expand organizational skills and capabilities in each business area during FY 2021. FSA have been successful in supporting employee growth through a diverse range of development initiatives and training opportunities. In this way, FSA has committed to increase employee performance, engagement, and retention using various learning modalities.
To ensure that the commitment to training and development has been beneficial to both the organization and the employees throughout FY 2021, FSA has measured the effectiveness of this work through detailed analysis and evaluation of participants. This analysis has begun to assist FSA in measuring organizational capability and performance potential. In addition, the extant data has supported internal requests for developmental resources and has allowed leadership to evaluate the return on investment these training initiatives have had on the organization.
58 Fiscal Year 2021 Annual Report | Federal Student Aid
Annual Performance Report
Strategic Objective 1.1
Improve employee engagement and workplace inclusion to develop and retain talent, improve employee satisfaction, and engage in effective succession planning.
Overview
FSA remains committed to enabling its organizational success by working towards improvements in the provision of resources, staffing, training, and employee work-life balance. In conjunction with creating an environment with the appropriate tools and programs for staff, FSA is also striving to foster and support a diverse workforce where all employees feel included, connected, and engaged in its mission. In FY 2021, FSA focused on improving communication throughout the organization, recognizing employee accomplishments, and benchmarking employee engagement to promote a workplace conducive to both productivity and belonging.
The FEVS is a key tool for measuring employee engagement throughout the federal government and within FSA. The FY 2020 FEVS results were made available in January 2021 and FSA Directorates used the data to develop and execute FEVS action plans to engage employees.
FSA employees have utilized enhanced telework, since March 2020, due to the COVID-19 national emergency. In this remote work setting, FSA has focused on strengthening employee communication channels that provide information and promoting connections with colleagues and leadership. Communication channels provide information and feedback (e.g., The Source Employee Newsletter, FSA First Class, Management Services Regional Liaison Newsletter, FSA Communications emails). The FSA virtual photo share presentation, quarterly recognition awards, and the annual FSASSYS (employee-nominated) award ceremony provided opportunities for employees across the nation to be recognized and connected.
As stated, the leadership within FSA believe that workplace diversity, inclusion, and accessibility are necessary for any organization to reach its full potential. FSA has implemented programming that is aligned with the President's Executive Order 13985 on Advancing Racial Equity and Support for Underserved Communities Through the Federal Government, by hosting cultural and diversity observances (e.g., Asian Pacific Islander, Pride Month, COO’s Fitness Challenge, Wellness events, etc.) and discussing diversity, inclusion, and accessibility strategies in The Source employee newsletter. FSA also actively participated in the first ED In Action Annual Summit, sponsored by the ED Diversity and Inclusion Council.
FY 2021 Performance Summary and Analysis
There is one performance metric for this strategic objective. The FY 2021 FEVS survey score data was not available at the time of publication for this Annual Report. The goal for Strategic Objective 1.1 is an increase in the employee engagement score by 1–2% from the previous FEVS EEI. The FY 2020 FEVS score data became available in January 2021. In FY 2020, FSA exceeded its target with a 9% increase in the EEI from 61% to 70%.
Fiscal Year 2021 Annual Report | Federal Student Aid 59
Annual Performance Report
Key Successes and Opportunities
To achieve this objective, FSA first implemented a communication campaign to increase employee participation in the FEVS survey. The participation rate for FY 2020 increased from 60% to 72%, a 12% increase over the FY 2019 FEVS survey. FSA values the perspectives of new employees who were ineligible to participate in the OPM FEVS survey and worked with Human Resources and the union (American Federation of Government Employees (AFGE) Local 252) to survey new employees (hired November 2019 – December 2020) on questions similar to the FEVS survey.
FSA also held focus groups to better understand the results of the FEVS surveys and hear potential solutions to employee engagement challenges. These focus groups provided notable solutions, which led to creation of the Leadership Conversation series, a redesign of the new employee Onboarding program, monthly employee communication with The Source newsletter, and weekly communication with the “In Case You Missed It” email campaign.
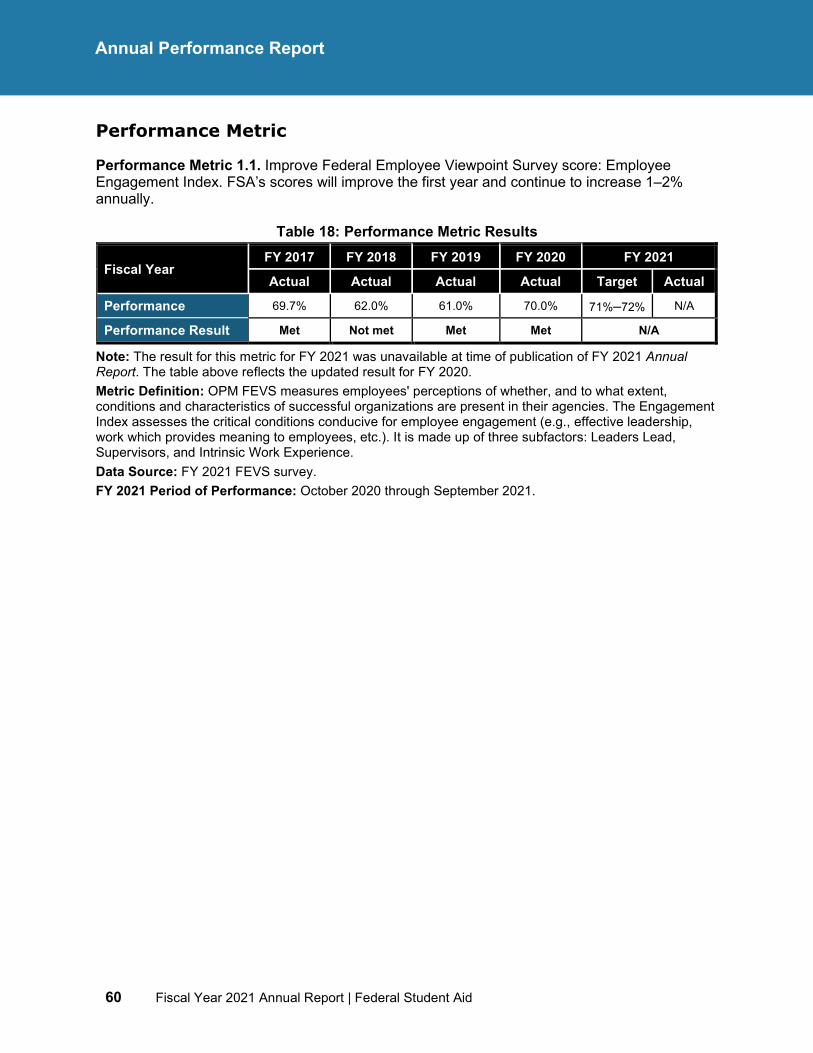
60 Fiscal Year 2021 Annual Report | Federal Student Aid
Annual Performance Report
Performance Metric
Performance Metric 1.1. Improve Federal Employee Viewpoint Survey score: Employee Engagement Index. FSA’s scores will improve the first year and continue to increase 1–2% annually.
Table 18: Performance Metric Results
Fiscal Year FY 2017 FY 2018 FY 2019 FY 2020 FY 2021
Actual Actual Actual Actual Target Actual
Performance 69.7% 62.0% 61.0% 70.0% 71%–72% N/A
Performance Result Met Not met Met Met N/A
Note: The result for this metric for FY 2021 was unavailable at time of publication of FY 2021 Annual Report. The table above reflects the updated result for FY 2020. Metric Definition: OPM FEVS measures employees' perceptions of whether, and to what extent, conditions and characteristics of successful organizations are present in their agencies. The Engagement Index assesses the critical conditions conducive for employee engagement (e.g., effective leadership, work which provides meaning to employees, etc.). It is made up of three subfactors: Leaders Lead, Supervisors, and Intrinsic Work Experience. Data Source: FY 2021 FEVS survey. FY 2021 Period of Performance: October 2020 through September 2021.
Fiscal Year 2021 Annual Report | Federal Student Aid 61
Annual Performance Report
Strategic Objective 1.2
Expand employee skills and capabilities to support Next Gen FSA.
Overview
FSA has progressed in the implementation of its human capital framework by identifying, assessing, and validating the required skill competencies to forecast future staffing needs based on organizational priorities and current workloads. The workforce study has successfully documented staffing needs by occupation and organization.
A highly skilled, engaged, and stable workforce is critical to providing outstanding customer service and meeting the agency’s mission. FSA implemented 23 more training and development initiatives compared to FY 2020 and trained approximately 62% of the workforce through either a virtual instructor-led or hybrid learning environment. In addition, FSA has implemented a strategic evaluation program to analyze the quality and benefits of the developmental opportunities and refine the Training and Development Plan. FSA’s overall Satisfaction Assessment Rating (SAR) exceeded the target by 11%.
FSA also redesigned its Onboarding program for new employees. In FY 2021, 20 weeklong or modified sessions were conducted for employees entering new roles. To support acclimating new employees to their new role, a continuous development component to Onboarding was added, which includes an enrichment series of remote learning opportunities to enhance personal and professional development.
A new sponsor component was added to the Onboarding program, to provide specific business area information, expectations, and acclimate new team members to the performance-based culture. Plans to enhance the sponsor component in FY 2022 include training and workshops on Individual Development Planning, Career Planning, Change Management, and Team-Building initiatives.
FY 2021 Performance Summary and Analysis
There are three performance metrics for this strategic objective. Two metrics met their annual targets, while one metric completed a baseline assessment in FY 2021, which will be used to set targets for future years.
Key Successes and Opportunities
The Workforce Requirements Study identified and measured more than 1,660 work processes and predictive staffing models. A comprehensive database of current and future authorized and required human capital positions (e.g., Table of Organization) is currently being updated and maintained.
FSA exceeded the training and development initiatives provided to employees as compared to FY 2020 by taking advantage of virtual instructor-led and hybrid learning formats and delivery methods. This resulted in the successful training of 62% of the workforce while in a telework posture for the entirety of the fiscal year. Approximately 18% of those trained were managers. In addition, several of the courses or programs delivered provided supervisory training credit to
62 Fiscal Year 2021 Annual Report | Federal Student Aid
Annual Performance Report
assist FSA managers in meeting the Department’s New and Experienced Supervisory Requirement Training as per the Department’s Human Capital Policy 412-1.
Not only did FSA measure its success by the number and percentage of trainings offered and taken by staff, but also by direct feedback from the employees on satisfaction. By also exceeding the baseline SAR of attended training, FSA has set a standard for employee expectations in FY 2022. To assist with the management of employee feedback, an external platform is now utilized to develop, track, administer, and analyze course evaluation data. This improvement has been vital in the collection and analysis of course data, particularly for virtual trainings, and will support improvements in training delivery going forward.
FSA held its second annual Employee Learning Week, which is a collaboration with the Department’s Talent and Development Division and Plain Language Liaison for the National Center for Education Research, to provide developmental opportunities to support the professional growth and development of FSA employees. The theme for this year’s initiative was “Taking Charge of Your Career”. The initiative was tremendously successful, with over 430 FSA employees participating, which contributed to 38% of FSA’s second quarter training total.
In FY 2021, FSA launched the Centralized Training Fund initiative, which resulted in the consolidation of training funds and a Training Review Team to oversee the allocation and distribution of training funds to meet workforce needs.
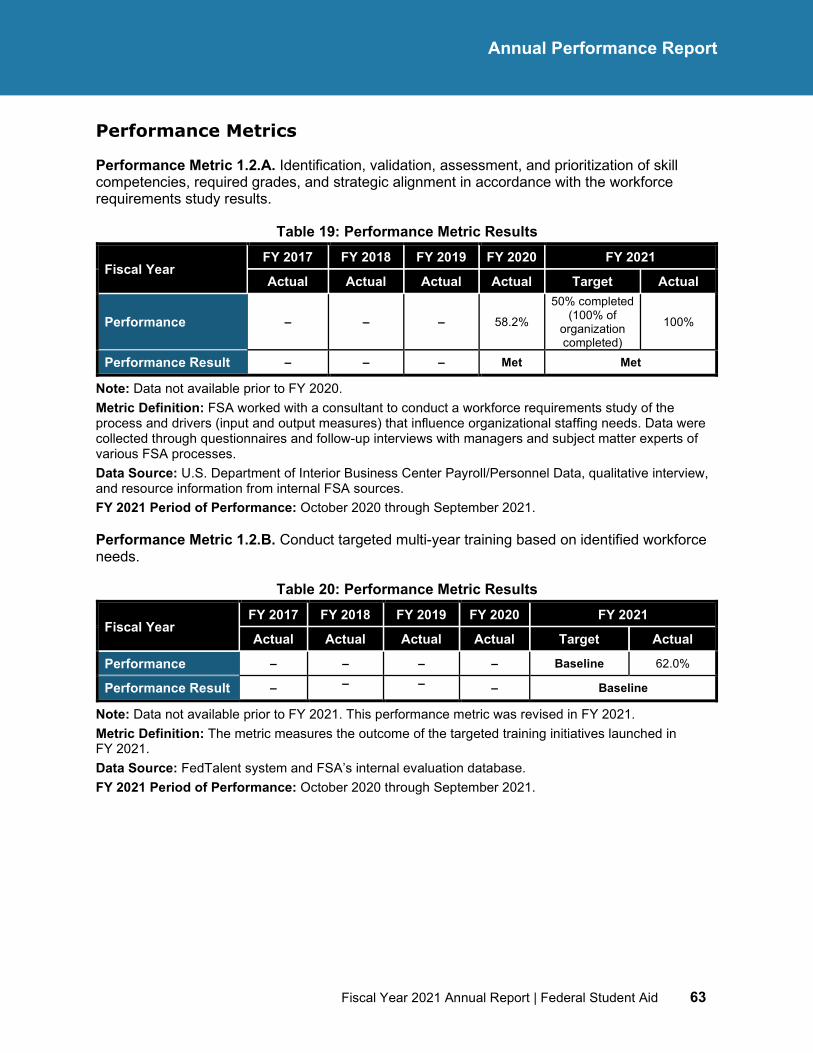
Fiscal Year 2021 Annual Report | Federal Student Aid 63
Annual Performance Report
Performance Metrics
Performance Metric 1.2.A. Identification, validation, assessment, and prioritization of skill competencies, required grades, and strategic alignment in accordance with the workforce requirements study results.
Table 19: Performance Metric Results
Fiscal Year FY 2017 FY 2018 FY 2019 FY 2020 FY 2021
Actual Actual Actual Actual Target Actual
Performance – – – 58.2%
50% completed (100% of
organization completed)
100%
Performance Result – – – Met Met
Note: Data not available prior to FY 2020. Metric Definition: FSA worked with a consultant to conduct a workforce requirements study of the process and drivers (input and output measures) that influence organizational staffing needs. Data were collected through questionnaires and follow-up interviews with managers and subject matter experts of various FSA processes. Data Source: U.S. Department of Interior Business Center Payroll/Personnel Data, qualitative interview, and resource information from internal FSA sources. FY 2021 Period of Performance: October 2020 through September 2021.
Performance Metric 1.2.B. Conduct targeted multi-year training based on identified workforce needs.
Table 20: Performance Metric Results
Fiscal Year FY 2017 FY 2018 FY 2019 FY 2020 FY 2021
Actual Actual Actual Actual Target Actual
Performance – – – – Baseline 62.0%
Performance Result – – – – Baseline
Note: Data not available prior to FY 2021. This performance metric was revised in FY 2021. Metric Definition: The metric measures the outcome of the targeted training initiatives launched in FY 2021. Data Source: FedTalent system and FSA’s internal evaluation database. FY 2021 Period of Performance: October 2020 through September 2021.
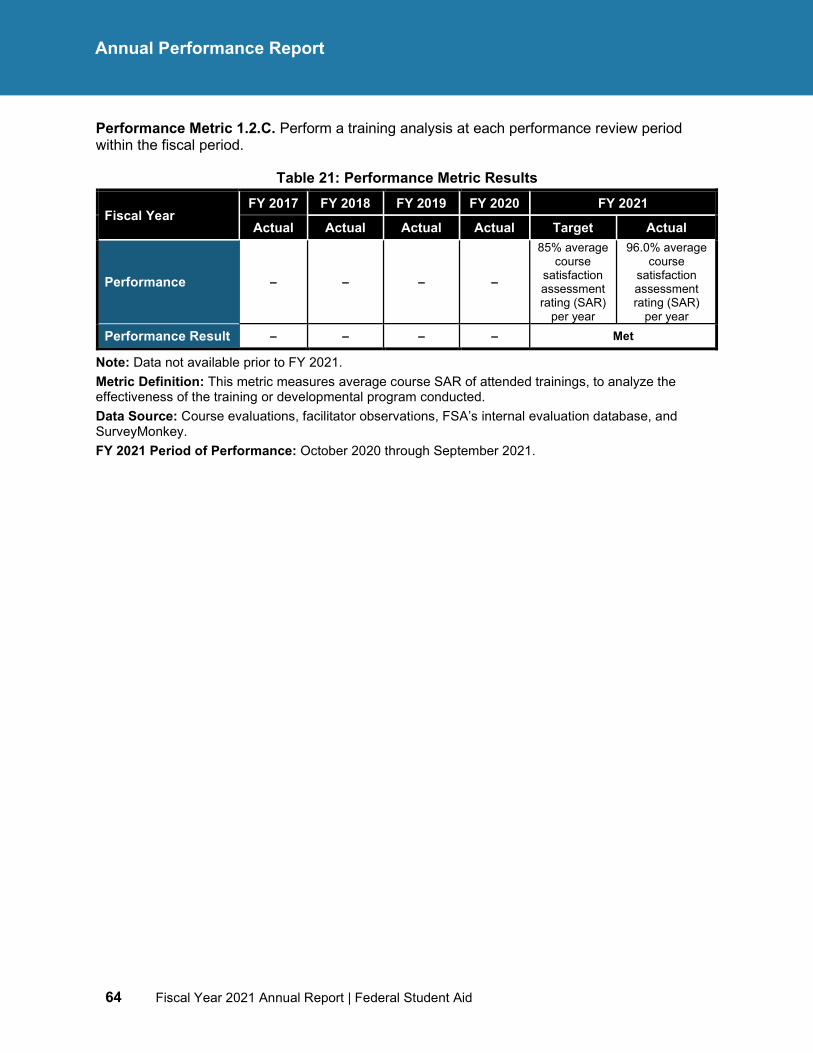
64 Fiscal Year 2021 Annual Report | Federal Student Aid
Annual Performance Report
Performance Metric 1.2.C. Perform a training analysis at each performance review period within the fiscal period.
Table 21: Performance Metric Results
Fiscal Year FY 2017 FY 2018 FY 2019 FY 2020 FY 2021
Actual Actual Actual Actual Target Actual
Performance – – – –
85% average course
satisfaction assessment rating (SAR)
per year
96.0% average course
satisfaction assessment rating (SAR)
per year Performance Result – – – – Met
Note: Data not available prior to FY 2021. Metric Definition: This metric measures average course SAR of attended trainings, to analyze the effectiveness of the training or developmental program conducted. Data Source: Course evaluations, facilitator observations, FSA’s internal evaluation database, and SurveyMonkey. FY 2021 Period of Performance: October 2020 through September 2021.
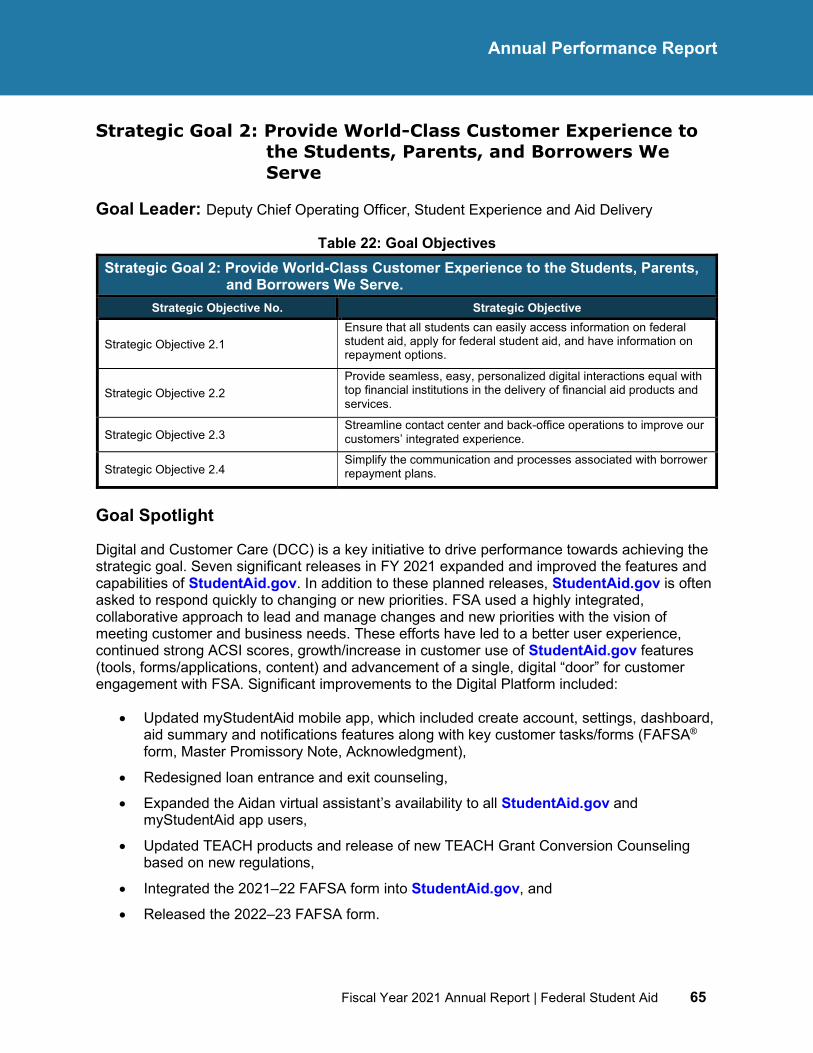
Fiscal Year 2021 Annual Report | Federal Student Aid 65
Annual Performance Report
Strategic Goal 2: Provide World-Class Customer Experience to the Students, Parents, and Borrowers We Serve
Goal Leader: Deputy Chief Operating Officer, Student Experience and Aid Delivery
Table 22: Goal Objectives Strategic Goal 2: Provide World-Class Customer Experience to the Students, Parents,
and Borrowers We Serve. Strategic Objective No. Strategic Objective
Strategic Objective 2.1 Ensure that all students can easily access information on federal student aid, apply for federal student aid, and have information on repayment options.
Strategic Objective 2.2 Provide seamless, easy, personalized digital interactions equal with top financial institutions in the delivery of financial aid products and services.
Strategic Objective 2.3 Streamline contact center and back-office operations to improve our customers’ integrated experience.
Strategic Objective 2.4 Simplify the communication and processes associated with borrower repayment plans.
Goal Spotlight
Digital and Customer Care (DCC) is a key initiative to drive performance towards achieving the strategic goal. Seven significant releases in FY 2021 expanded and improved the features and capabilities of StudentAid.gov. In addition to these planned releases, StudentAid.gov is often asked to respond quickly to changing or new priorities. FSA used a highly integrated, collaborative approach to lead and manage changes and new priorities with the vision of meeting customer and business needs. These efforts have led to a better user experience, continued strong ACSI scores, growth/increase in customer use of StudentAid.gov features (tools, forms/applications, content) and advancement of a single, digital “door” for customer engagement with FSA. Significant improvements to the Digital Platform included:
• Updated myStudentAid mobile app, which included create account, settings, dashboard, aid summary and notifications features along with key customer tasks/forms (FAFSA® form, Master Promissory Note, Acknowledgment),
• Redesigned loan entrance and exit counseling,
• Expanded the Aidan virtual assistant’s availability to all StudentAid.gov and myStudentAid app users,
• Updated TEACH products and release of new TEACH Grant Conversion Counseling based on new regulations,
• Integrated the 2021–22 FAFSA form into StudentAid.gov, and
• Released the 2022–23 FAFSA form.
66 Fiscal Year 2021 Annual Report | Federal Student Aid
Annual Performance Report
FSA onboarded several key communications within the Marketing Communications Platform (MCP). These communications enabled the organization to provide important information to its customers, such as filling out their FAFSA forms and resources within StudentAid.gov. In September 2021, FSA kicked off a digital campaign to help FSA communicate with borrowers about the upcoming return to repayment. The organization is seeking to raise awareness about FSA resources and information for this effort to help plan and prepare for what is expected to be a challenging transition.
Fiscal Year 2021 Annual Report | Federal Student Aid 67
Annual Performance Report
Strategic Objective 2.1
Ensure that all students can easily access information on federal student aid, apply for federal student aid, and have information on repayment options.
Overview
Prior to the DCC and Digital Platform efforts, customers had to navigate numerous FSA websites resulting in a disjointed and siloed experience. Leveraging a collaborative approach with a focus on human-centered design, the Digital Platform launched an integrated and improved StudentAid.gov website in December 2019, and an updated myStudentAid mobile app in December 2020. StudentAid.gov is FSA's primary customer-facing digital front door for students, parents, and borrowers who need be informed about, apply for, and manage their federal student aid. For this reason, StudentAid.gov plays a critical role in supporting the Department’s and FSA’s strategic goals and priorities. There were multiple technology releases in FY 2021 that expanded and improved the features and capabilities of StudentAid.gov. While delivering on planned releases and maintaining overall site operations, FSA also managed evolving administrative priorities which impacted information to be provided to customers while delivering on planned releases and maintaining overall site operations.
Getting students, parents, and counselors around the country focused on increasing completions of the FAFSA form for the 2021–22 academic year remains FSA’s top priority. Whether a student is attending a traditional four-year college or university, enrolling in a community college, or opting for a trade or vocational certification, the FAFSA form should be the first step forward for every high school senior in America. Since November 2020, FSA encouraged high-school seniors and their families to complete the 2021–22 FAFSA form. FSA worked with individual states, counselors, mentors, and college access professionals on initiatives to improve FAFSA completion rates. The organization posted social media posts related to the FAFSA form and published other digital content including helpful articles on StudentAid.gov. FSA engaged local media outlets to raise awareness about the importance of completing the FAFSA form. It is probable that the outreach efforts made by FSA and by colleges and universities to students in their freshman year were more successful due to COVID-19, as students were more of a captive audience than in previous years.
FY 2021 Performance Summary and Analysis
There are four performance metrics for this strategic objective. Two metrics met their annual targets, while two metrics did not meet their targets in FY 2021.
The 2.1.B metric target was not met. Although the gap in high school FAFSA filing for the first 12 months of the 2021–22 FAFSA filing was closed significantly (from 15.9% in November 2020 to 4.4% in September 2021), the gap was not entirely closed. This decrease is likely caused by the COVID-19 national emergency and the resulting impact of many high school seniors not attending school in person during the academic school year 2020–21. This led to FSA not meeting the goal of having 66.25% of high school seniors file their FAFSA forms during FY 2021.
68 Fiscal Year 2021 Annual Report | Federal Student Aid
Annual Performance Report
The target for the 2.1.C metric was not met. Failure to meet this metric target may be attributable, in part, to the release of the modernized myStudentAid mobile App. The new and improved myStudentAid mobile app was released in early December 2020, just a few months after the 2021–22 FAFSA form became available for submission. During this time, customers were directed to complete their FAFSA forms via the web which may have contributed to fewer forms being submitted via a mobile platform. Conditions are expected to return to normal in FY 2022 and therefore provide a more precise measurement moving forward.
Key Successes and Opportunities
Prior to the DCC and Digital Platform, FSA customers had to visit multiple, disconnected websites requiring multiple logins to get the information they needed. Inconsistent branding, a disjointed user experience, and information siloes made it difficult and confusing for customers to find what they were looking for and to take action. To improve customer experience, FSA initiated a human-centered focus to understand customer needs through field research, co-creation, and usability testing to inform its Digital Platform launch and continuous improvement. This initiative achieved the goal of one holistic DCC Design System with shared components to create a consistent user experience across web and mobile applications. As a result, a primary customer website for FSA information and services (excludes servicing functions) was developed, six websites were consolidated, and over 2,000 pages were consolidated.
StudentAid.gov supports customers and lets them take action throughout the student aid lifecycle. Because StudentAid.gov is FSA’s primary customer website, it must frequently be adapted to meet changing or new priorities. FSA successfully managed these changes and delivered on overall site improvements. The releases in FY 2021 have expanded specific capabilities of the website. The following are several highlights offered to assist borrowers:
• Redesign of the Public Service Loan Forgiveness (PSLF) Help Tool, and the Acknowledgment based on customer feedback and user experience best practices
• Integration of the borrower defense application
• Addition of the “borrow more” simulation to Loan Simulator
To engage with FAFSA filers effectively, FSA sends out emails each year to FAFSA filers who filed an application the year before. This year, 41 million emails were sent out to filers to remind them to file a renewal FAFSA form. These strategies enhanced outreach to local media outlets and to key states about the importance of FAFSA filing which positively impacted increases in the FAFSA filing results in these areas. Social media outreach continued to be a promising method for raising awareness as well. For much of this cycle, FAFSA filing by returning filers exceeded rates of filing for this population when compared to the previous year.
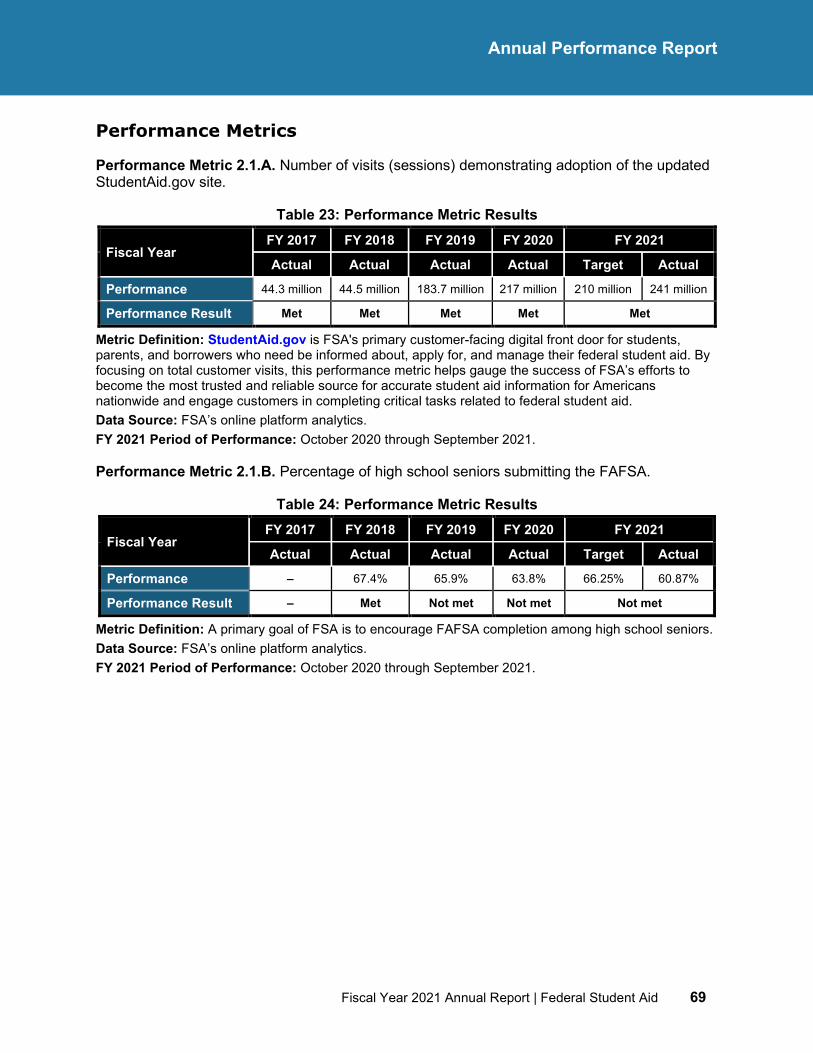
Fiscal Year 2021 Annual Report | Federal Student Aid 69
Annual Performance Report
Performance Metrics
Performance Metric 2.1.A. Number of visits (sessions) demonstrating adoption of the updated StudentAid.gov site.
Table 23: Performance Metric Results
Fiscal Year FY 2017 FY 2018 FY 2019 FY 2020 FY 2021
Actual Actual Actual Actual Target Actual
Performance 44.3 million 44.5 million 183.7 million 217 million 210 million 241 million
Performance Result Met Met Met Met Met
Metric Definition: StudentAid.gov is FSA's primary customer-facing digital front door for students, parents, and borrowers who need be informed about, apply for, and manage their federal student aid. By focusing on total customer visits, this performance metric helps gauge the success of FSA’s efforts to become the most trusted and reliable source for accurate student aid information for Americans nationwide and engage customers in completing critical tasks related to federal student aid. Data Source: FSA’s online platform analytics. FY 2021 Period of Performance: October 2020 through September 2021.
Performance Metric 2.1.B. Percentage of high school seniors submitting the FAFSA.
Table 24: Performance Metric Results
Fiscal Year FY 2017 FY 2018 FY 2019 FY 2020 FY 2021
Actual Actual Actual Actual Target Actual
Performance – 67.4% 65.9% 63.8% 66.25% 60.87%
Performance Result – Met Not met Not met Not met
Metric Definition: A primary goal of FSA is to encourage FAFSA completion among high school seniors. Data Source: FSA’s online platform analytics. FY 2021 Period of Performance: October 2020 through September 2021.
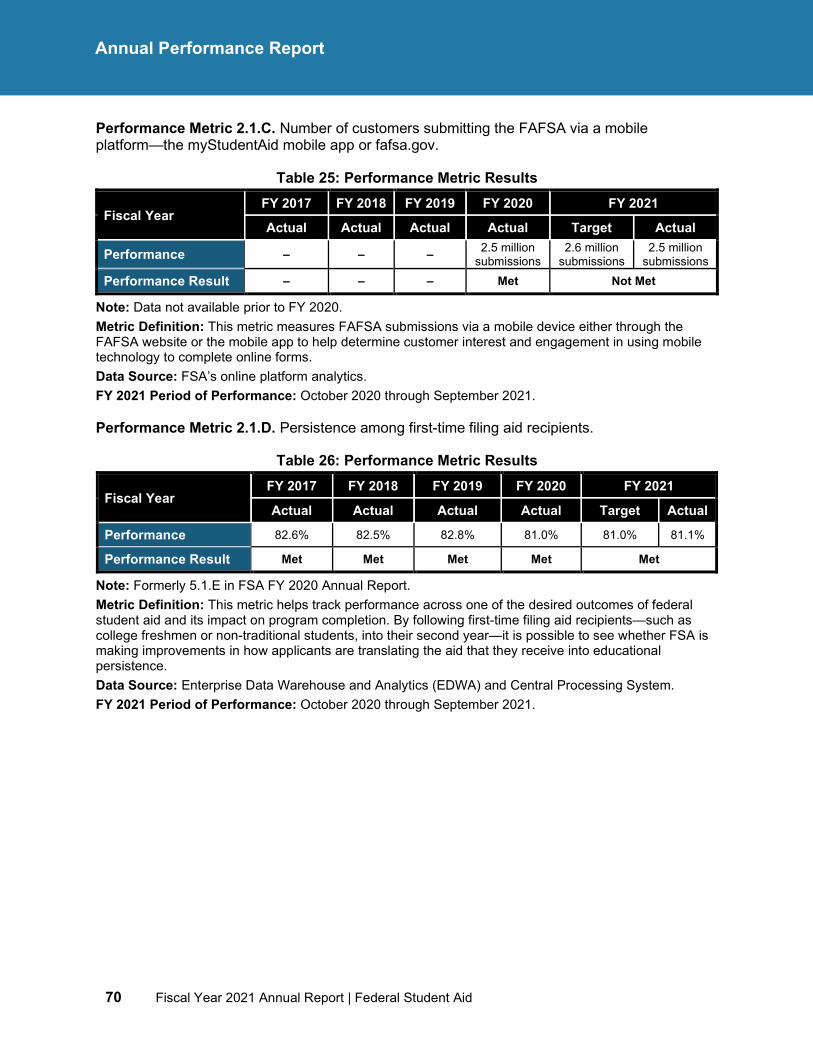
70 Fiscal Year 2021 Annual Report | Federal Student Aid
Annual Performance Report
Performance Metric 2.1.C. Number of customers submitting the FAFSA via a mobile platform—the myStudentAid mobile app or fafsa.gov.
Table 25: Performance Metric Results
Fiscal Year FY 2017 FY 2018 FY 2019 FY 2020 FY 2021
Actual Actual Actual Actual Target Actual
Performance – – – 2.5 million submissions
2.6 million submissions
2.5 million submissions
Performance Result – – – Met Not Met
Note: Data not available prior to FY 2020. Metric Definition: This metric measures FAFSA submissions via a mobile device either through the FAFSA website or the mobile app to help determine customer interest and engagement in using mobile technology to complete online forms. Data Source: FSA’s online platform analytics. FY 2021 Period of Performance: October 2020 through September 2021.
Performance Metric 2.1.D. Persistence among first-time filing aid recipients.
Table 26: Performance Metric Results
Fiscal Year FY 2017 FY 2018 FY 2019 FY 2020 FY 2021
Actual Actual Actual Actual Target Actual
Performance 82.6% 82.5% 82.8% 81.0% 81.0% 81.1%
Performance Result Met Met Met Met Met
Note: Formerly 5.1.E in FSA FY 2020 Annual Report. Metric Definition: This metric helps track performance across one of the desired outcomes of federal student aid and its impact on program completion. By following first-time filing aid recipients—such as college freshmen or non-traditional students, into their second year—it is possible to see whether FSA is making improvements in how applicants are translating the aid that they receive into educational persistence. Data Source: Enterprise Data Warehouse and Analytics (EDWA) and Central Processing System. FY 2021 Period of Performance: October 2020 through September 2021.
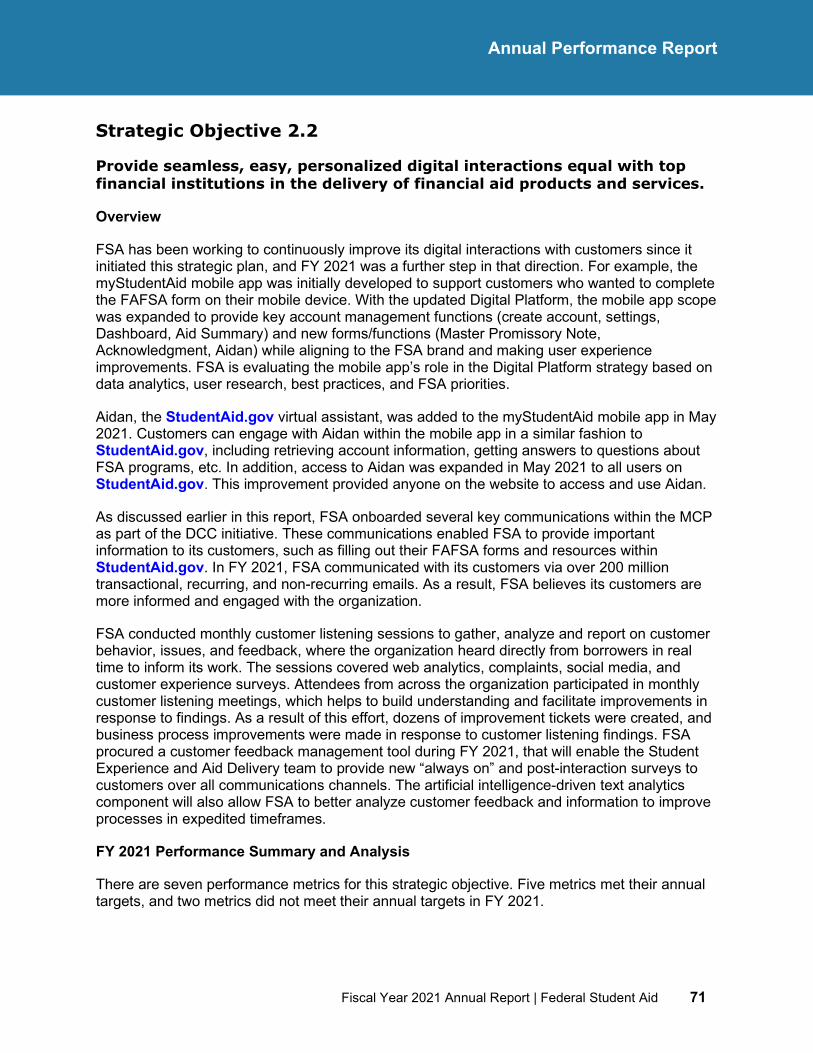
Fiscal Year 2021 Annual Report | Federal Student Aid 71
Annual Performance Report
Strategic Objective 2.2
Provide seamless, easy, personalized digital interactions equal with top financial institutions in the delivery of financial aid products and services.
Overview
FSA has been working to continuously improve its digital interactions with customers since it initiated this strategic plan, and FY 2021 was a further step in that direction. For example, the myStudentAid mobile app was initially developed to support customers who wanted to complete the FAFSA form on their mobile device. With the updated Digital Platform, the mobile app scope was expanded to provide key account management functions (create account, settings, Dashboard, Aid Summary) and new forms/functions (Master Promissory Note, Acknowledgment, Aidan) while aligning to the FSA brand and making user experience improvements. FSA is evaluating the mobile app’s role in the Digital Platform strategy based on data analytics, user research, best practices, and FSA priorities.
Aidan, the StudentAid.gov virtual assistant, was added to the myStudentAid mobile app in May 2021. Customers can engage with Aidan within the mobile app in a similar fashion to StudentAid.gov, including retrieving account information, getting answers to questions about FSA programs, etc. In addition, access to Aidan was expanded in May 2021 to all users on StudentAid.gov. This improvement provided anyone on the website to access and use Aidan.
As discussed earlier in this report, FSA onboarded several key communications within the MCP as part of the DCC initiative. These communications enabled FSA to provide important information to its customers, such as filling out their FAFSA forms and resources within StudentAid.gov. In FY 2021, FSA communicated with its customers via over 200 million transactional, recurring, and non-recurring emails. As a result, FSA believes its customers are more informed and engaged with the organization.
FSA conducted monthly customer listening sessions to gather, analyze and report on customer behavior, issues, and feedback, where the organization heard directly from borrowers in real time to inform its work. The sessions covered web analytics, complaints, social media, and customer experience surveys. Attendees from across the organization participated in monthly customer listening meetings, which helps to build understanding and facilitate improvements in response to findings. As a result of this effort, dozens of improvement tickets were created, and business process improvements were made in response to customer listening findings. FSA procured a customer feedback management tool during FY 2021, that will enable the Student Experience and Aid Delivery team to provide new “always on” and post-interaction surveys to customers over all communications channels. The artificial intelligence-driven text analytics component will also allow FSA to better analyze customer feedback and information to improve processes in expedited timeframes.
FY 2021 Performance Summary and Analysis
There are seven performance metrics for this strategic objective. Five metrics met their annual targets, and two metrics did not meet their annual targets in FY 2021.
72 Fiscal Year 2021 Annual Report | Federal Student Aid
Annual Performance Report
The target for the metric 2.2.F was not met. FY 2021 FSA’s weighted ACSI Life Cycle Survey Score for performance metric 2.2.F (formerly 2.2.G in 2020) of 71.4 fell short of the goal range of 73 through 75 by 1.6 points. This deficit is likely because of a slight change to the borrowers surveyed as part of the Multiple Servicer Survey associated with loan servicers. The Multiple Servicer Survey accounts for a major part of FSA’s weighted ACSI, so if that score drops, it impacts FSA’s ACSI. The FAFSA survey and In-School survey (drawn from federal student aid recipients) are also calculated within the ACSI score. The FAFSA survey was nearly as high as the FY 2020 score, and the In-School survey had an improved score, but these surveys account for less of the total weighted ACSI score.
The metric 2.2.G target was not met. The development of the customer satisfaction surveys for StudentAid.gov was completed and received OMB approval; however, the surveys won’t be implemented until November 2021 as part of the DCC 5.3 website release. The schedule for implementing the customer satisfaction surveys was adjusted to a later date to minimize risk to a successful FAFSA release in September 2021. The new surveys are expected to launch in November 2021, and FY 2022 will serve as a baseline year for customer satisfaction surveys on StudentAid.gov. Numerical targets will be incorporated in FY 2023.
Key Successes and Opportunities
In December 2020, the Dashboard and Aid Summary features were added to the myStudentAid mobile app. Customers who log in to the mobile app are presented with their personalized Dashboard, where they can view their current aid, loan balances, as well as additional details about their loans in their Aid Summary. The addition of Dashboard and Aid Summary to the myStudentAid mobile app aligned to the overall goal to provide customers with the ability to access federal student aid information, and to complete key tasks on the device of their choosing.
StudentAid.gov is FSA's primary customer-facing digital front door for students, parents, and borrowers who need to be informed about, apply for, and manage their federal student aid. FSA has continued to see steady growth in customers viewing their aid information on StudentAid.gov. As the administrative forbearance period ends, FSA anticipates an increase in customers logging in to view their aid information, and borrower exploration of repayment options.
Aidan, the StudentAid.gov virtual assistant, was added to the myStudentAid mobile app and expanded to all users on StudentAid.gov in May 2021. Previously, the tool was only available to logged in users. These improvements provided anyone on the app or website with access to and use of Aidan. With the growth in users generating additional data, the strategy to continue analyzing customer data to drive improvements with content directly based on customer needs has strengthened.
The Acknowledgment provides customers who are planning to accept a federal student loan with important information on borrowing, and their responsibility to repay the loan. The borrowers’ experience is customized based on whether they are a new borrower or have current loans. In May 2021, FSA redesigned the Acknowledgment to improve the customer experience based on user feedback and best practices. A new landing page provides customers with three options for a more personalized experience: (1) undergraduate student, (2) graduate student, and (3) parent of an undergraduate student. It was redesigned to present information in smaller,
Fiscal Year 2021 Annual Report | Federal Student Aid 73
Annual Performance Report
easy-to-understand learning modules. Additionally, the Acknowledgment was made available on the myStudentAid mobile app.
The MCP, as previously discussed, sent over 200 million emails in FY 2021 to students, parents, and borrowers. Delivery rates and brand recognition/authority continue to be key pillars that FSA looks out for as it continues to scale and deliver more emails via the tool. FSA is ensuring that data integrations and loading processes, as well as the internet protocol (IP) addresses for sending emails, are performing at optimal levels. As part of the DCC initiative, FSA onboarded several key communications within the MCP. These communications are critical for users as they contain information related to important actions the users need to take on FSA products. Communications included the StudentAid.gov site, FAFSA, and the PSLF Help Tool. In the last six months, FSA has onboarded FSA ID, PSLF Phase 2 emails for the PSLF Help Tool, Entrance and Exit Counseling, and updated TEACH grant communications. FSA has also developed recurring campaign emails as part of its proactive communications to its customers, including students, parents, and borrowers.
These communications enabled FSA to provide important information to its customers, such as filling out their FAFSA forms and resources within StudentAid.gov. These campaigns included FAFSA renewal campaigns (Winter and Fall), as well as upcoming communications that are automated based on certain behavioral criteria determined by FSA and resources. The biggest challenges were the number of email campaigns FSA was sending during the fiscal year along with increasing capacity on the platform. Thus, FSA increased the number of servers available for the platform which in turn increased the number of emails it can send out.
FSA conducted several improvements to include revamping email templates, improving data integrations between MCP and systems, as well as testing and optimization efforts to continuously improve its email communications for its borrowers. The testing and optimization efforts, and revamped template designs, have led to notable improvements to FSA’s engagement such as higher open and click rates. The revamped templates allowed the emails to match the brand and styling of StudentAid.gov and FSA, which enabled more trust and consistency as a trusted source of information. FSA’s priority is to continue onboarded communications within the MCP for transactional and recurring campaigns, update data integrations within the MCP to ensure faster data loading and execution, and additional data analysis to evaluate and improve communications based on past performance and industry benchmarks.
FSA recognized that more external communication is preferable so that its customers are up to date with clear and actionable next steps. Several processes are in place to ensure that the organization is sending all emails in an efficient manner:
• Monitoring of the data files, via internal alerts, within the system to make sure FSA is receiving the correct files for its transactional and campaign data loads.
• A team set up to monitor the IPs to make sure that FSA is aware of them being blacklisted to ensure that the organization solves it as soon as possible.
• Ramp-up plans for high volume campaigns in order to warm the IPs up for delivery and reduce volume load on the servers.
74 Fiscal Year 2021 Annual Report | Federal Student Aid
Annual Performance Report
Proactive monitoring of high priority campaigns, as well as the development of a health dashboard for the transactional campaigns are some ways of reducing risk from a delivery perspective. Continuing to develop and improve emails based on industry best standards and design best practices ensure that the organization is reducing the risk on its brand integrity for its communications.
The implementation of a customer feedback management software platform, and the development of OMB Circular A-11 compliant surveys, are the key organizational initiatives that will support this strategic objective. The target for this fiscal year was to complete survey development and implementation. The platform includes artificial intelligence-driven text analytics that will allow FSA to more easily mine feedback for trends and escalate any feedback that warrants action. The procurement of a customer feedback management software platform will greatly expand the capacity to both offer surveys across channels, and better analyze results in FY 2022. By putting in this work up-front and dedicating resources to improve it over time, FSA will be automating the analysis of unstructured feedback to get deeper, more relevant insight on customer sentiment, desires, and pain points from their open-ended survey feedback.
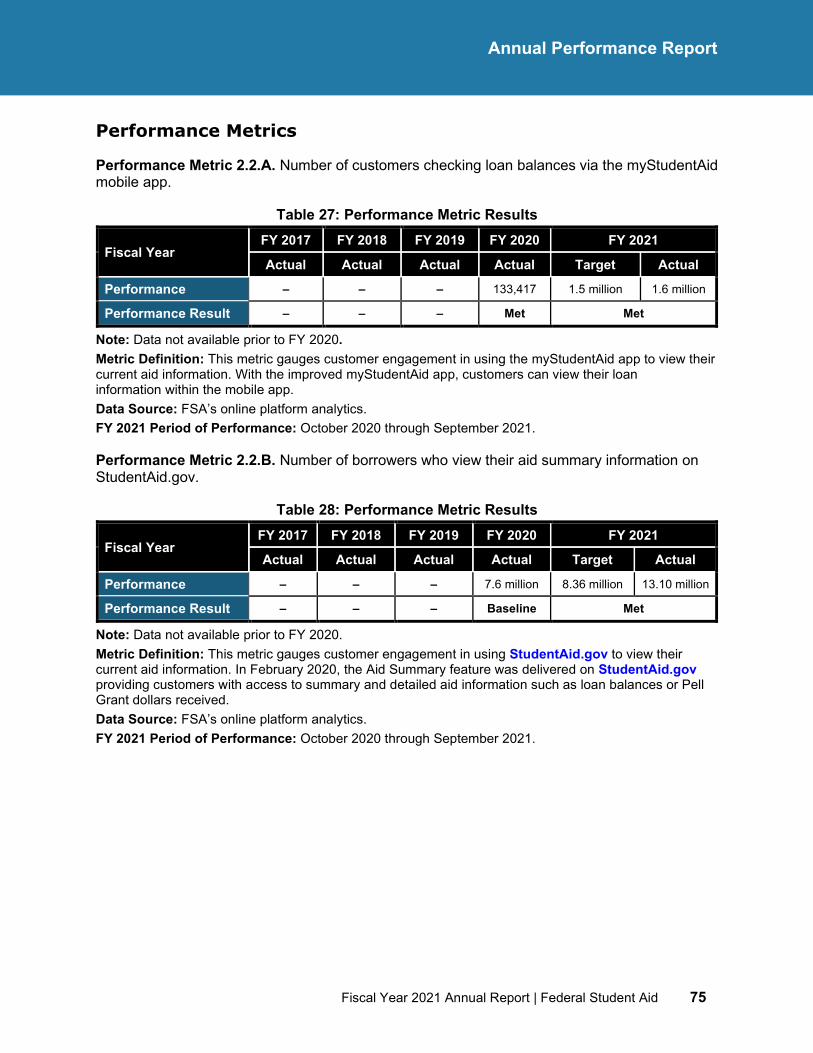
Fiscal Year 2021 Annual Report | Federal Student Aid 75
Annual Performance Report
Performance Metrics
Performance Metric 2.2.A. Number of customers checking loan balances via the myStudentAid mobile app.
Table 27: Performance Metric Results
Fiscal Year FY 2017 FY 2018 FY 2019 FY 2020 FY 2021
Actual Actual Actual Actual Target Actual
Performance – – – 133,417 1.5 million 1.6 million
Performance Result – – – Met Met
Note: Data not available prior to FY 2020. Metric Definition: This metric gauges customer engagement in using the myStudentAid app to view their current aid information. With the improved myStudentAid app, customers can view their loan information within the mobile app. Data Source: FSA’s online platform analytics. FY 2021 Period of Performance: October 2020 through September 2021.
Performance Metric 2.2.B. Number of borrowers who view their aid summary information on StudentAid.gov.
Table 28: Performance Metric Results
Fiscal Year FY 2017 FY 2018 FY 2019 FY 2020 FY 2021
Actual Actual Actual Actual Target Actual
Performance – – – 7.6 million 8.36 million 13.10 million
Performance Result – – – Baseline Met
Note: Data not available prior to FY 2020. Metric Definition: This metric gauges customer engagement in using StudentAid.gov to view their current aid information. In February 2020, the Aid Summary feature was delivered on StudentAid.gov providing customers with access to summary and detailed aid information such as loan balances or Pell Grant dollars received. Data Source: FSA’s online platform analytics. FY 2021 Period of Performance: October 2020 through September 2021.
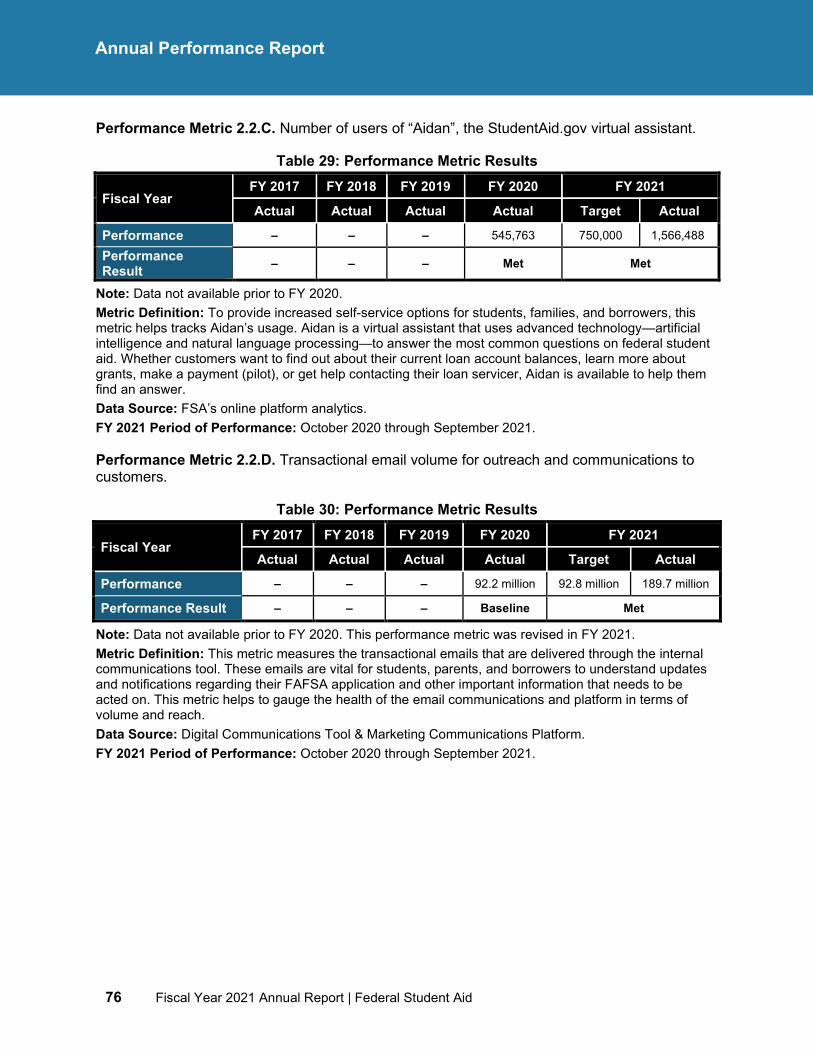
76 Fiscal Year 2021 Annual Report | Federal Student Aid
Annual Performance Report
Performance Metric 2.2.C. Number of users of “Aidan”, the StudentAid.gov virtual assistant.
Table 29: Performance Metric Results
Fiscal Year FY 2017 FY 2018 FY 2019 FY 2020 FY 2021
Actual Actual Actual Actual Target Actual
Performance – – – 545,763 750,000 1,566,488
Performance Result – – – Met Met
Note: Data not available prior to FY 2020. Metric Definition: To provide increased self-service options for students, families, and borrowers, this metric helps tracks Aidan’s usage. Aidan is a virtual assistant that uses advanced technology—artificial intelligence and natural language processing—to answer the most common questions on federal student aid. Whether customers want to find out about their current loan account balances, learn more about grants, make a payment (pilot), or get help contacting their loan servicer, Aidan is available to help them find an answer. Data Source: FSA’s online platform analytics. FY 2021 Period of Performance: October 2020 through September 2021.
Performance Metric 2.2.D. Transactional email volume for outreach and communications to customers.
Table 30: Performance Metric Results
Fiscal Year FY 2017 FY 2018 FY 2019 FY 2020 FY 2021
Actual Actual Actual Actual Target Actual
Performance – – – 92.2 million 92.8 million 189.7 million
Performance Result – – – Baseline Met
Note: Data not available prior to FY 2020. This performance metric was revised in FY 2021. Metric Definition: This metric measures the transactional emails that are delivered through the internal communications tool. These emails are vital for students, parents, and borrowers to understand updates and notifications regarding their FAFSA application and other important information that needs to be acted on. This metric helps to gauge the health of the email communications and platform in terms of volume and reach. Data Source: Digital Communications Tool & Marketing Communications Platform. FY 2021 Period of Performance: October 2020 through September 2021.
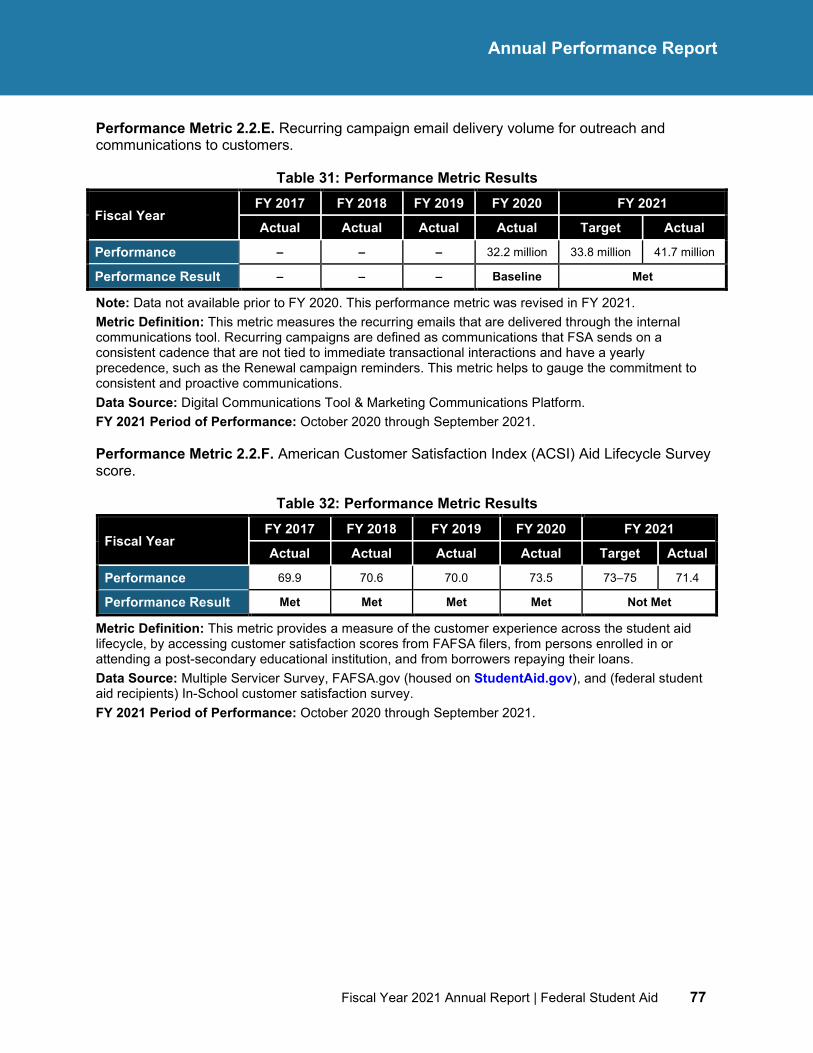
Fiscal Year 2021 Annual Report | Federal Student Aid 77
Annual Performance Report
Performance Metric 2.2.E. Recurring campaign email delivery volume for outreach and communications to customers.
Table 31: Performance Metric Results
Fiscal Year FY 2017 FY 2018 FY 2019 FY 2020 FY 2021
Actual Actual Actual Actual Target Actual
Performance – – – 32.2 million 33.8 million 41.7 million
Performance Result – – – Baseline Met
Note: Data not available prior to FY 2020. This performance metric was revised in FY 2021. Metric Definition: This metric measures the recurring emails that are delivered through the internal communications tool. Recurring campaigns are defined as communications that FSA sends on a consistent cadence that are not tied to immediate transactional interactions and have a yearly precedence, such as the Renewal campaign reminders. This metric helps to gauge the commitment to consistent and proactive communications. Data Source: Digital Communications Tool & Marketing Communications Platform. FY 2021 Period of Performance: October 2020 through September 2021.
Performance Metric 2.2.F. American Customer Satisfaction Index (ACSI) Aid Lifecycle Survey score.
Table 32: Performance Metric Results
Fiscal Year FY 2017 FY 2018 FY 2019 FY 2020 FY 2021
Actual Actual Actual Actual Target Actual
Performance 69.9 70.6 70.0 73.5 73–75 71.4
Performance Result Met Met Met Met Not Met
Metric Definition: This metric provides a measure of the customer experience across the student aid lifecycle, by accessing customer satisfaction scores from FAFSA filers, from persons enrolled in or attending a post-secondary educational institution, and from borrowers repaying their loans. Data Source: Multiple Servicer Survey, FAFSA.gov (housed on StudentAid.gov), and (federal student aid recipients) In-School customer satisfaction survey. FY 2021 Period of Performance: October 2020 through September 2021.
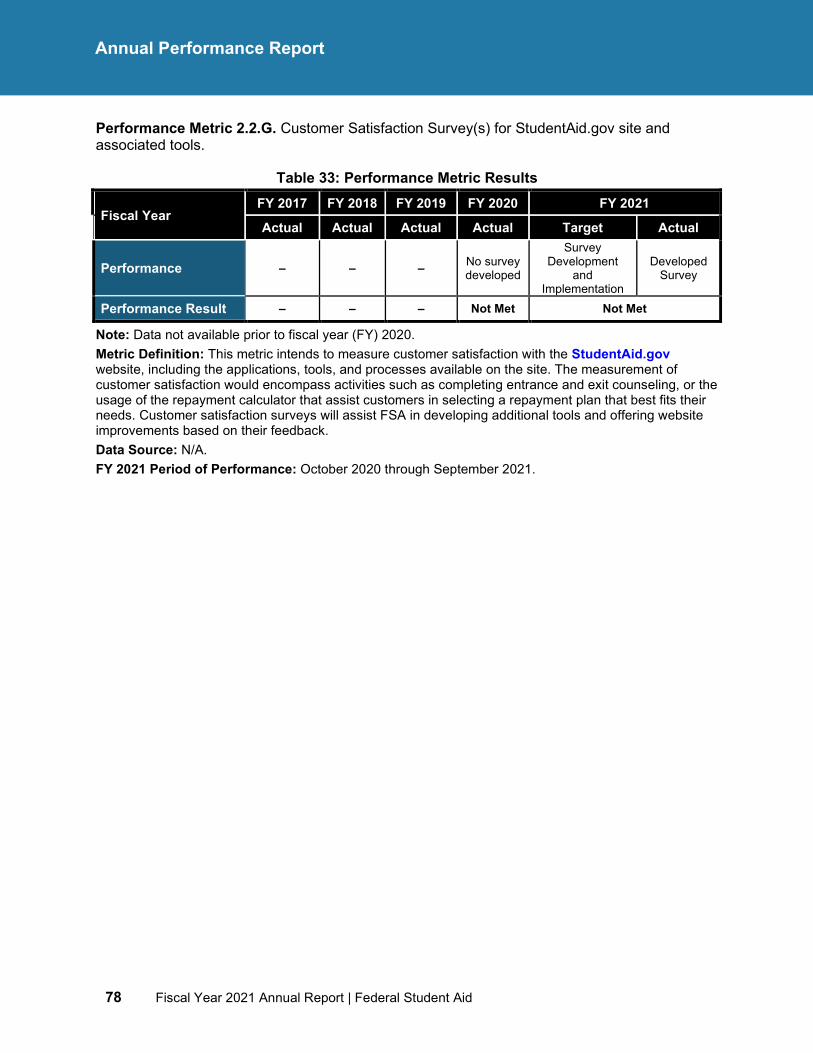
78 Fiscal Year 2021 Annual Report | Federal Student Aid
Annual Performance Report
Performance Metric 2.2.G. Customer Satisfaction Survey(s) for StudentAid.gov site and associated tools.
Table 33: Performance Metric Results
Fiscal Year FY 2017 FY 2018 FY 2019 FY 2020 FY 2021
Actual Actual Actual Actual Target Actual
Performance – – – No survey developed
Survey Development
and Implementation
Developed Survey
Performance Result – – – Not Met Not Met
Note: Data not available prior to fiscal year (FY) 2020. Metric Definition: This metric intends to measure customer satisfaction with the StudentAid.gov website, including the applications, tools, and processes available on the site. The measurement of customer satisfaction would encompass activities such as completing entrance and exit counseling, or the usage of the repayment calculator that assist customers in selecting a repayment plan that best fits their needs. Customer satisfaction surveys will assist FSA in developing additional tools and offering website improvements based on their feedback. Data Source: N/A. FY 2021 Period of Performance: October 2020 through September 2021.
Fiscal Year 2021 Annual Report | Federal Student Aid 79
Annual Performance Report
Strategic Objective 2.3
Streamline contact center and back-office operations to improve our customers’ integrated experience.
Overview
FSA is focused on supporting students, families, and borrowers as they navigate the financial aid process. Optimizing the customer service model throughout the student aid lifecycle is critical to this effort and adopting more service-oriented and streamlined approaches at the contact and loan servicing centers help improve the customer’s experience. Exceptional customer service will increase FSA’s ability to adapt to changing customer needs and ensure that customers easily understand the available options to make informed choices. The first step towards positive outcomes in this area is for loan servicers to provide prompt responses to incoming calls and expedited resolutions of questions. In FY 2021, FSA focused on mitigating risks for servicer operations, as it prepares to return millions of borrowers to repayment. This planning has led to the development of call center tools, technologies, and training to support the efficient management of future call volume. As programmatic and policy decisions are made and impact on this objective becomes clear, FSA will direct operational measures to continuously improve call center performance.
FY 2021 Performance Summary and Analysis
There are two performance metrics for this strategic objective. Both metrics met their annual targets in FY 2021.
Key Successes and Opportunities
There are several initiatives supporting these performance metrics including formalizing operational oversight, active monitoring of projected call volumes, and daily metric reporting from servicers. Since March 2020, inbound call volumes have been significantly lower due to the ongoing COVID-19 administrative forbearance. Call volume is expected to increase as FSA gets closer to returning to normal operations. During the payment pause, the organization analyzed existing servicer capabilities and identified areas for improvement. Some loan servicers improved capability, adding features such as interactive voice response call back and chat bots to handle inbound contacts. In FY 2022, FSA will monitor whether servicer system improvements positively impact its ability to handle the expected increase in incoming calls in the months after the administrative forbearance ends.
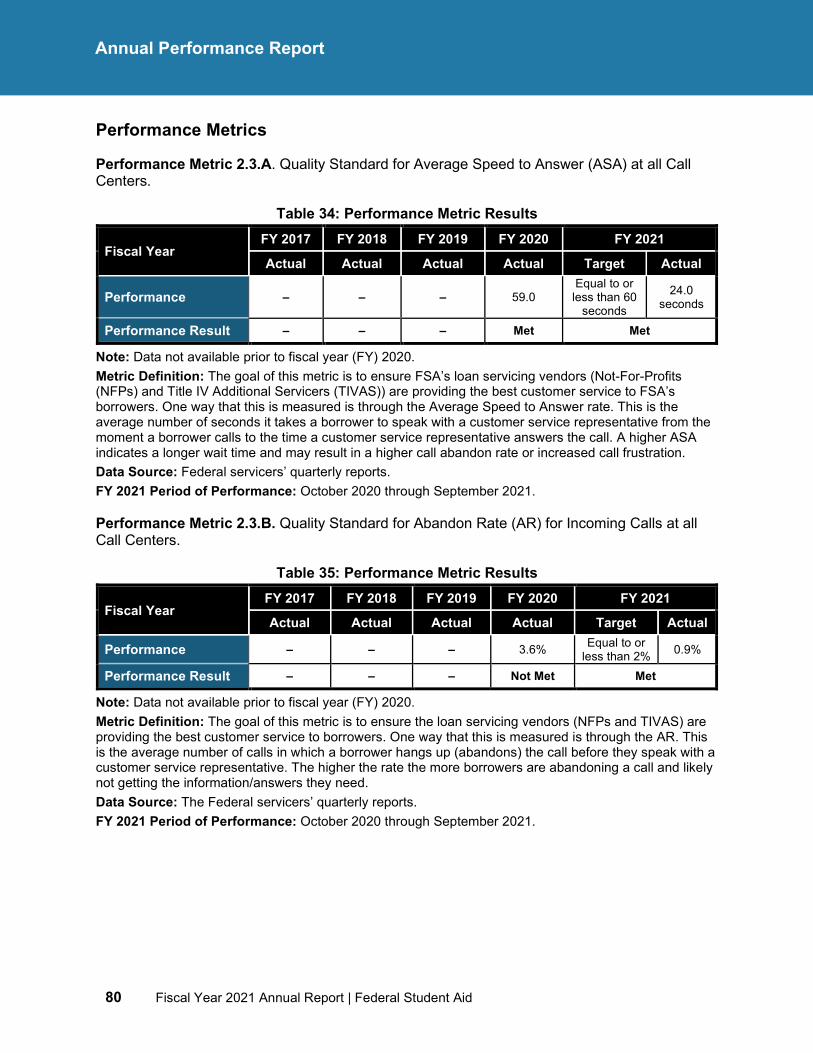
80 Fiscal Year 2021 Annual Report | Federal Student Aid
Annual Performance Report
Performance Metrics
Performance Metric 2.3.A. Quality Standard for Average Speed to Answer (ASA) at all Call Centers.
Table 34: Performance Metric Results
Fiscal Year FY 2017 FY 2018 FY 2019 FY 2020 FY 2021
Actual Actual Actual Actual Target Actual
Performance – – – 59.0 Equal to or less than 60
seconds
24.0 seconds
Performance Result – – – Met Met
Note: Data not available prior to fiscal year (FY) 2020. Metric Definition: The goal of this metric is to ensure FSA’s loan servicing vendors (Not-For-Profits (NFPs) and Title IV Additional Servicers (TIVAS)) are providing the best customer service to FSA’s borrowers. One way that this is measured is through the Average Speed to Answer rate. This is the average number of seconds it takes a borrower to speak with a customer service representative from the moment a borrower calls to the time a customer service representative answers the call. A higher ASA indicates a longer wait time and may result in a higher call abandon rate or increased call frustration. Data Source: Federal servicers’ quarterly reports. FY 2021 Period of Performance: October 2020 through September 2021.
Performance Metric 2.3.B. Quality Standard for Abandon Rate (AR) for Incoming Calls at all Call Centers.
Table 35: Performance Metric Results
Fiscal Year FY 2017 FY 2018 FY 2019 FY 2020 FY 2021
Actual Actual Actual Actual Target Actual
Performance – – – 3.6% Equal to or less than 2% 0.9%
Performance Result – – – Not Met Met
Note: Data not available prior to fiscal year (FY) 2020. Metric Definition: The goal of this metric is to ensure the loan servicing vendors (NFPs and TIVAS) are providing the best customer service to borrowers. One way that this is measured is through the AR. This is the average number of calls in which a borrower hangs up (abandons) the call before they speak with a customer service representative. The higher the rate the more borrowers are abandoning a call and likely not getting the information/answers they need. Data Source: The Federal servicers’ quarterly reports. FY 2021 Period of Performance: October 2020 through September 2021.
Fiscal Year 2021 Annual Report | Federal Student Aid 81
Annual Performance Report
Strategic Objective 2.4
Simplify the communication and processes associated with borrower repayment plans.
Overview
The DCC initiative is the foundational plan for simplifying communication and processes associated with borrower repayment plans and supports the performance metrics utilized for this strategic objective. In November 2020, FSA released a re-platformed PSLF Help Tool and introduced a new combined form. Additionally, Temporary Expanded Public Service Loan Forgiveness (TEPSLF) was added to the PSLF Help Tool. FSA also made adjustments within the PSLF Help Tool design and content to improve the borrower engagement with the Employer Eligibility Database. One of several priorities for improvement to the PSLF Help Tool is the addition of digital signature and submission capabilities. With the addition of the digital signature and submission capabilities, borrowers will have an improved experience that does not require them to print the form, manually sign, have their employer sign, and then submit the form to the servicer. With this improved experience, FSA expects the number of completed forms to increase and the risk of borrower complaints on the customer experience to be minimized.
FY 2021 Performance Summary and Analysis
There are three performance metrics for this strategic objective. One metric did not have a target due to the administrative forbearance period and a second metric did not have data at the time of publication. The third metric under this objective completed a baseline assessment in FY 2021. The baseline assessment will be used to set targets for future years.
The 2.4.B metric which captures the percentage of borrowers using the auto-debit feature for loan repayment could not be measured due to the CARES Act, which enabled the Department to automatically suspend payments on eligible student loans since March 13, 2020. This payment suspension, also known as the administrative forbearance, will end Jan. 31, 2022. FSA, as well as its Loan Servicers, will continue to promote auto-debit and other benefits (i.e., Income Driven Repayment) through its various methods of borrower communications as customers move out of the CARES Act forbearance status and back into repayment.
Key Successes and Opportunities
While the Make a Payment metric has been impacted by the administrative forbearance, FSA has seen a growth in payments over FY 2021. However, due to the unpredictability of the borrowers in repayment impacted by the administrative forbearance, no formal target for FY 2021 was set.
The administrative forbearance period has changed borrower behavior and may impact them in using auto-debit to make payments in the future. To respond to this potential behavioral change and to confirm that existing auto debit customers want to continue with automatic payments, FSA and its loan servicers have launched a coordinated engagement plan to encourage borrowers to sign-up or retain auto-debit arrangements.
82 Fiscal Year 2021 Annual Report | Federal Student Aid
Annual Performance Report
In November 2020, FSA released a re-platformed PSLF Help Tool and introduced a new combined form. Additionally, TEPSLF was added to the PSLF Help Tool. Borrowers engaged with the Employer Eligibility Database led to a high number of case creations for adjudication in the Customer Relationship Management. As a result of this, FSA made adjustments within the PSLF Help Tool design and content to improve the borrower engagement with the database.
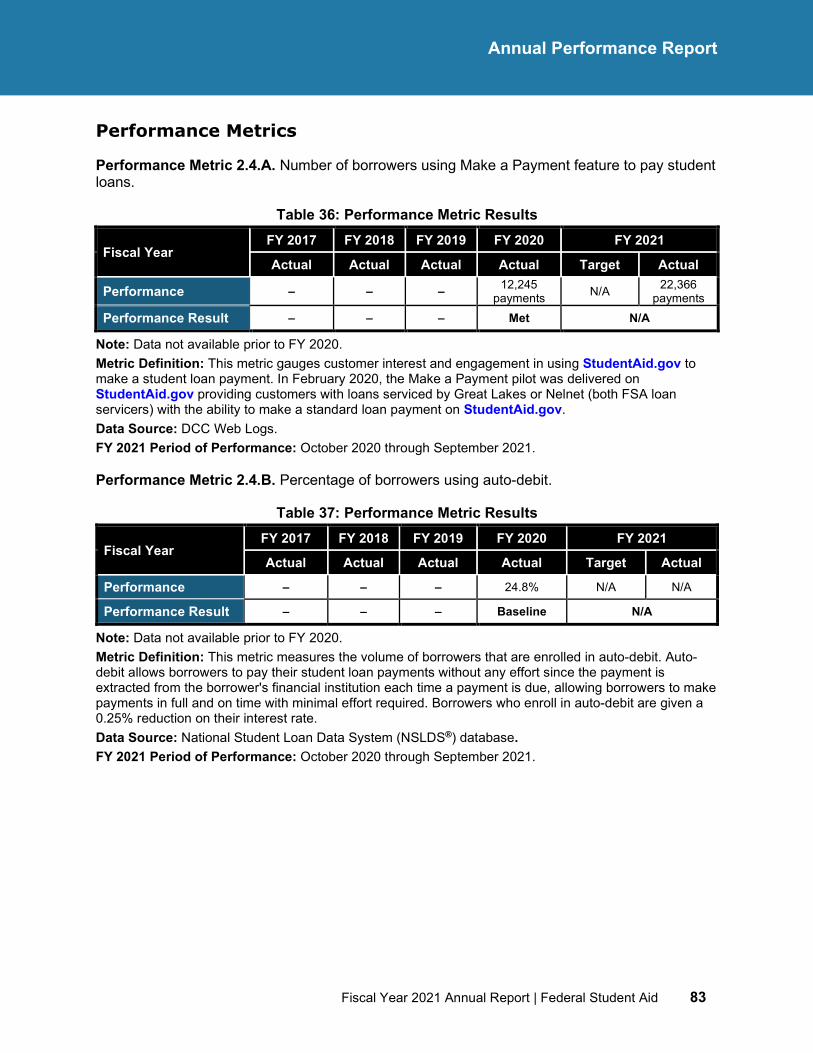
Fiscal Year 2021 Annual Report | Federal Student Aid 83
Annual Performance Report
Performance Metrics
Performance Metric 2.4.A. Number of borrowers using Make a Payment feature to pay student loans.
Table 36: Performance Metric Results
Fiscal Year FY 2017 FY 2018 FY 2019 FY 2020 FY 2021
Actual Actual Actual Actual Target Actual
Performance – – – 12,245 payments N/A 22,366
payments Performance Result – – – Met N/A
Note: Data not available prior to FY 2020. Metric Definition: This metric gauges customer interest and engagement in using StudentAid.gov to make a student loan payment. In February 2020, the Make a Payment pilot was delivered on StudentAid.gov providing customers with loans serviced by Great Lakes or Nelnet (both FSA loan servicers) with the ability to make a standard loan payment on StudentAid.gov. Data Source: DCC Web Logs. FY 2021 Period of Performance: October 2020 through September 2021.
Performance Metric 2.4.B. Percentage of borrowers using auto-debit.
Table 37: Performance Metric Results
Fiscal Year FY 2017 FY 2018 FY 2019 FY 2020 FY 2021
Actual Actual Actual Actual Target Actual
Performance – – – 24.8% N/A N/A
Performance Result – – – Baseline N/A
Note: Data not available prior to FY 2020. Metric Definition: This metric measures the volume of borrowers that are enrolled in auto-debit. Auto-debit allows borrowers to pay their student loan payments without any effort since the payment is extracted from the borrower's financial institution each time a payment is due, allowing borrowers to make payments in full and on time with minimal effort required. Borrowers who enroll in auto-debit are given a 0.25% reduction on their interest rate. Data Source: National Student Loan Data System (NSLDS®) database. FY 2021 Period of Performance: October 2020 through September 2021.
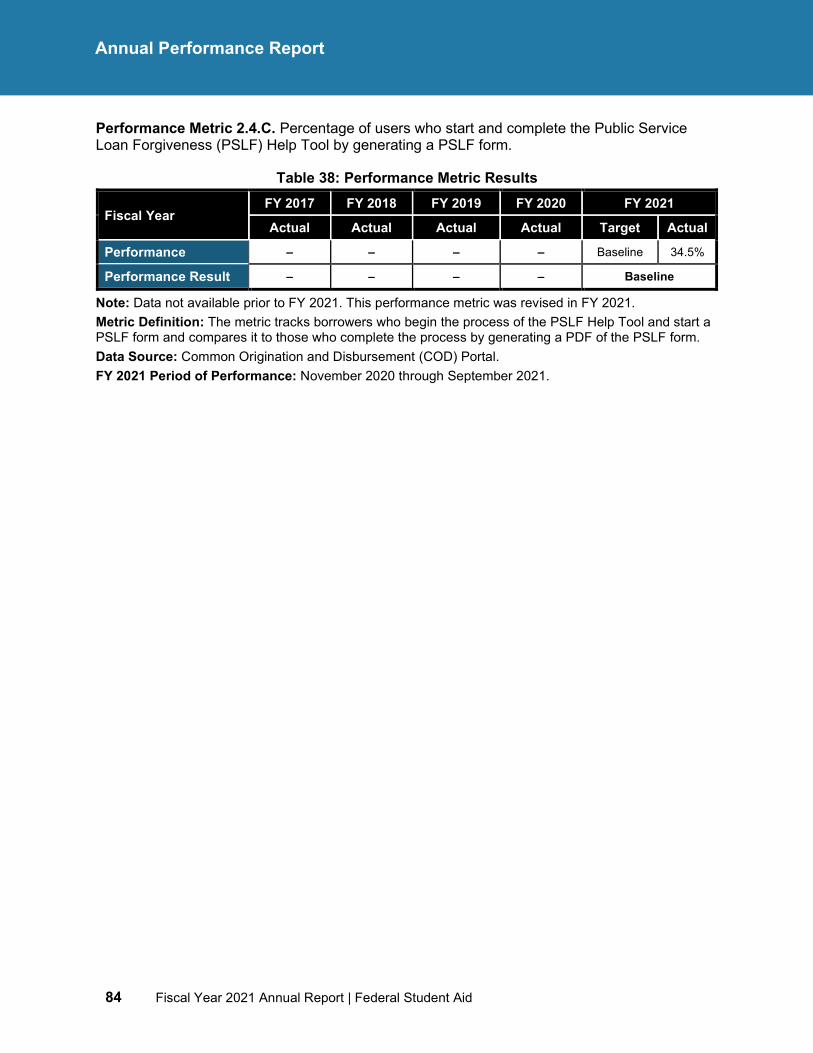
84 Fiscal Year 2021 Annual Report | Federal Student Aid
Annual Performance Report
Performance Metric 2.4.C. Percentage of users who start and complete the Public Service Loan Forgiveness (PSLF) Help Tool by generating a PSLF form.
Table 38: Performance Metric Results
Fiscal Year FY 2017 FY 2018 FY 2019 FY 2020 FY 2021
Actual Actual Actual Actual Target Actual
Performance – – – – Baseline 34.5%
Performance Result – – – – Baseline
Note: Data not available prior to FY 2021. This performance metric was revised in FY 2021. Metric Definition: The metric tracks borrowers who begin the process of the PSLF Help Tool and start a PSLF form and compares it to those who complete the process by generating a PDF of the PSLF form. Data Source: Common Origination and Disbursement (COD) Portal. FY 2021 Period of Performance: November 2020 through September 2021.
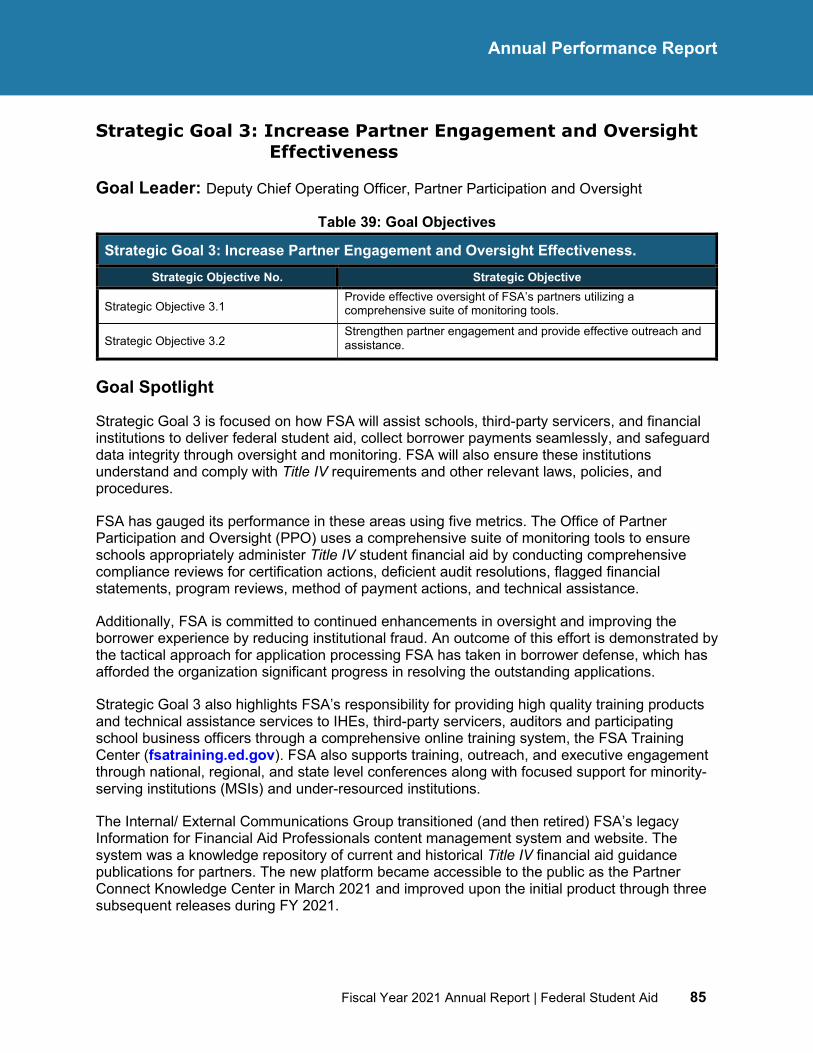
Fiscal Year 2021 Annual Report | Federal Student Aid 85
Annual Performance Report
Strategic Goal 3: Increase Partner Engagement and Oversight Effectiveness
Goal Leader: Deputy Chief Operating Officer, Partner Participation and Oversight
Table 39: Goal Objectives
Strategic Goal 3: Increase Partner Engagement and Oversight Effectiveness. Strategic Objective No. Strategic Objective
Strategic Objective 3.1 Provide effective oversight of FSA’s partners utilizing a comprehensive suite of monitoring tools.
Strategic Objective 3.2 Strengthen partner engagement and provide effective outreach and assistance.
Goal Spotlight
Strategic Goal 3 is focused on how FSA will assist schools, third-party servicers, and financial institutions to deliver federal student aid, collect borrower payments seamlessly, and safeguard data integrity through oversight and monitoring. FSA will also ensure these institutions understand and comply with Title IV requirements and other relevant laws, policies, and procedures.
FSA has gauged its performance in these areas using five metrics. The Office of Partner Participation and Oversight (PPO) uses a comprehensive suite of monitoring tools to ensure schools appropriately administer Title IV student financial aid by conducting comprehensive compliance reviews for certification actions, deficient audit resolutions, flagged financial statements, program reviews, method of payment actions, and technical assistance.
Additionally, FSA is committed to continued enhancements in oversight and improving the borrower experience by reducing institutional fraud. An outcome of this effort is demonstrated by the tactical approach for application processing FSA has taken in borrower defense, which has afforded the organization significant progress in resolving the outstanding applications.
Strategic Goal 3 also highlights FSA’s responsibility for providing high quality training products and technical assistance services to IHEs, third-party servicers, auditors and participating school business officers through a comprehensive online training system, the FSA Training Center (fsatraining.ed.gov). FSA also supports training, outreach, and executive engagement through national, regional, and state level conferences along with focused support for minority-serving institutions (MSIs) and under-resourced institutions.
The Internal/ External Communications Group transitioned (and then retired) FSA’s legacy Information for Financial Aid Professionals content management system and website. The system was a knowledge repository of current and historical Title IV financial aid guidance publications for partners. The new platform became accessible to the public as the Partner Connect Knowledge Center in March 2021 and improved upon the initial product through three subsequent releases during FY 2021.
86 Fiscal Year 2021 Annual Report | Federal Student Aid
Annual Performance Report
FSA has been responsive in relief efforts for schools through its communications, such as post-disaster emails which offered key reminders and information on the special resources available to schools and individuals that were impacted by natural disasters.
Fiscal Year 2021 Annual Report | Federal Student Aid 87
Annual Performance Report
Strategic Objective 3.1
Provide effective oversight of FSA’s partners utilizing a comprehensive suite of monitoring tools.
Overview
PPO performs oversight using a holistic suite of monitoring tools, including comprehensive compliance reviews to ensure a case management approach. FSA is also proactively working to prevent and address institutional fraud through oversight, compliance, and enforcement actions.
PPO continues to mature existing performance reporting dashboards and develop new data dashboards to empower employees, managers, and senior leaders to make data-driven decisions. During the COVID-19 national emergency, PPO had to adapt the compliance review process to be conducted virtually. These adapted processes and innovations will be assessed for future incorporation and to improve efficiency.
Borrower defense is a type of loan discharge based on a determination that the borrower’s school engaged in certain acts or omissions, generally misrepresentations, fraud, or breach of contract that unlawfully caused the borrower to enroll or continue enrollment at the school. FSA is committed to protecting students and borrowers by forgiving a portion or the entirety of their student loan obligations after conducing legal research and analysis of borrower defense claims. FSA is managing the borrower defense application process and successfully rebuilt and substantially improved collaboration with external partners to support the borrower defense fact finding process. Process and technology enhancements have also led to improved information sharing with borrower defense applicants, and FSA continues to look for improvements to the borrower defense process.
FY 2021 Performance Summary and Analysis
There are two performance metrics for this strategic objective. Metrics 3.1.A and 3.1.B met and exceeded annual metric targets.
Key Successes and Opportunities
As of Sept. 1, 2021, the School Eligibility and Oversight Service Group completed 3,692 comprehensive compliance reviews for 5,894 Title IV participating partners (62.6%); exceeding the goal of 60%. Although the target was met this fiscal year, recertification is a primary driver within the compliance review framework, and there is a possibility that the cadence of future recertifications will not align with future annual target goals. Current process improvements and tools executed in FY 2021 will be thoroughly analyzed to support maintaining or surpassing targets in this area.
The targets associated with borrower defense were met due to improved collaboration with external partners to support the fact finding process and the transition of internal staff from contract attorneys to term attorneys. The Borrower Defense Group’s (BDG) workflow is heavily influenced by external factors including pending litigation, a shifting regulatory framework, policy, and regulations. However, the staff continues to adapt to and overcome these factors. During FY 2020, BDG adjudicated 160,000 applications, exceeding its goal of 150,000
88 Fiscal Year 2021 Annual Report | Federal Student Aid
Annual Performance Report
applications. During FY 2021, BDG’s goal was to adjudicate 65,000 applications. There are several reasons to justify the goal adjustment. First, the cases remaining in BDG’s queue are among the most complicated and include the most evidence that needs to be considered, whereas the cases that BDG prioritized during FY 2020 often included a much smaller body of evidence or were covered by previously established protocols. Second, FSA leadership provided work distribution flexibility to BDG, allowing team members to fully engage in a robust fact finding process, which is necessary to adjudicate the remaining complex applications.
Staff levels in FY 2021 allowed BDG to finalize fact finding memoranda and legal analysis while simultaneously adjudicating cases in a timely manner. As a result, FSA adjudicated over 65,500 cases since October 1, 2020 — exceeding the goal of 65,000.
Fiscal Year 2021 Annual Report | Federal Student Aid 89
Annual Performance Report
Performance Metrics
Performance Metric 3.1.A. FSA will annually conduct an Institutional Review for its participating partners including schools, third-party servicers, and financial institutions.
Table 40: Performance Metric Results
Fiscal Year FY 2017 FY 2018 FY 2019 FY 2020 FY 2021
Actual Actual Actual Actual Target Actual
Performance – – – 51% of
partners reviewed
60% 62.6%
Performance Result – – – Met Met
Note: Data not available prior to FY 2020. Metric Definition: This metric measures the performance of holistic comprehensive compliance reviews of institutions relating to certification actions, deficient audit resolutions, flagged financial statements, program reviews, method of payment actions, and technical assistance. Data Source: Postsecondary Education Participants System. FY 2021 Period of Performance: October 2020 through September 2021.
Performance Metric 3.1.B. Number of Borrower Defense (BD) applications adjudicated (subject to existing BD regulations).
Table 41: Performance Metric Results
Fiscal Year FY 2017 FY 2018 FY 2019 FY 2020 FY 2021
Actual Actual Actual Actual Target Actual
Performance – – – 160,000 65,000 65,500
Performance Result – – – Met Met
Note: Data not available prior to FY 2020. Metric Definition: Borrower defense is a type of federal student loan forgiveness where borrowers may be eligible for forgiveness of their federal student loans if the relevant school attended misled the borrower or engaged in other misconduct in violation of certain laws. Data Source: Customer Engagement Management System. FY 2021 Period of Performance: October 2020 through September 2021.
90 Fiscal Year 2021 Annual Report | Federal Student Aid
Annual Performance Report
Strategic Objective 3.2
Strengthen partner engagement and provide effective outreach and assistance.
Overview
FSA has experienced an increased demand for training and support resources due to significant financial aid regulatory and policy changes. FSA provides training and technical assistance through virtual and in-person engagements via the FSA Training Center (fsatraining.ed.gov), the annual FSA Training Conference (FSATC), and state and regional professional association conferences. Additional training/outreach resources are focused on Minority-Serving and Under-Resourced schools and IHE Presidential leadership events. Technical assistance is also provided through the Ask-a-Fed service, Partner Connect/Common Origination and Disbursement (COD) customer service representatives, and the Partner Technical Assistance group. The pivot to an all-virtual environment due to the COVID national emergency provided an opportunity to increase stakeholder communication and awareness of service changes and increase in virtual offerings.
The expansion of FSA’s virtual content delivery allowed a larger group of schools with constrained travel budgets or staffing to attend the FSATC, state and regional conferences, and the statutorily mandated Fundamentals of Title IV Training. The attendance at FSA events increased significantly in the virtual environment, particularly with the FSATC hosting more than 15,000 participants in its first virtual session and providing support and resolving more than 2,900 individual technical assistance inquiries.
FSA conducted its annual “Ease of Doing Business” survey with its Title IV eligible school partners, which is also tracked under this objective. The FY 2021 Ease of Doing Business Score is an overall measure of post-secondary educational institution financial aid administrators’ assessment of their recent experience interacting with FSA (and its contractors) including telephone/email/chat/fax communication regarding FSA’s systems and products, and interactions with FSA’s policy group, training, compliance, and operations staff. The survey is conducted by CFI Group, an independent third-party survey company, and results are provided to the Department and FSA.
FY 2021 Performance Summary and Analysis
There are three performance metrics for this strategic objective. Metrics 3.2.B and 3.2.C met their annual metric targets. A revised metric 3.2.A completed a baseline assessment in FY 2021, which will be used to set targets for future years.
Key Successes and Opportunities
In FY 2021, 88% of all Title IV eligible institutions participated in training programs or technical assistance. The increase in participation has a direct correlation with the methodology used to provide information, as all training and technical assistance was delivered in a virtual format. There was an 18% increase in the training modules available in FY 2021 compared to FY 2020. The virtual environment removed cost, time, and staffing barriers to institutional participation in training, as well as strengthened FSA’s outreach efforts, resulting in increased participation. The
Fiscal Year 2021 Annual Report | Federal Student Aid 91
Annual Performance Report
flexibility that the virtual engagement provided FSA is illustrated in the following accomplishments:
• The Partner Engagement & Relationship Management Group (PERM) provided leadership and coordination for FSA/Department’s participation in the FY 2021 Historically Black College or University (HBCU) Annual Conference. There were 3,349 participants virtually attending the conference and more than 340 Presidents/Chancellors and senior level institutional administrators who participated in the FSA/Department session and live Q&A forum.
• The Minority-Servicing & Under-Resourced Schools Division (MSURSD) and PERM began virtual “Birds of a Feather” discussions with stakeholders from HBCU’s and other MSIs.
• The FSA Training Center (fsatraining.ed.gov) saw an additional 1,023 unique schools access on-demand training from 320 available training products. Among the 117 new training products developed for FY 2021 were modules, lessons, and videos for Precertification, FSA Basics, New Federal Aid Administrator staff, and Foreign Schools. An additional 166 products were updated and 75 were removed to reflect current policy guidance.
• FSA Training Officers developed and delivered virtual conference sessions to approximately 10,000 state and regional conference participants.
• Training and Information Services Group (TISG) collaborated with FSA’s Policy Implementation Office to deliver the first National Live “Federal Update” session in the fourth quarter of FY 2021 to 1,174 participants.
• FSATC attendance increased 200% in the virtual environment, and on-demand views of the FSATC sessions reached more than 94,000.
It will be necessary to continuously update existing training content as a result of policy changes and legislative initiatives, which will also require additional staff or contractual support for TISG staff. The deployment of an all-virtual strategy in FY 2021 was successful despite a shortage in staff resources. In FY 2022, additional assistance may be needed to support similar outcomes.
The enhancements to training and launch of Partner Connect Knowledge Center have positively impacted the Ease of Doing Business score, which showed a 4 point improvement from FY 2020. The greatest improvement was with the “ease of searching Knowledge Center” Score, which increased 12 points compared to FY 2020. Other key strengths identified by school partners (high scoring items) include:
• Assistance received from FSA
• Knowledge acquired from last training session presented by an FSA trainer
• Quality of assistance from FSA
• Compliance issue resolved fairly
FSA is committed to making improvements to its systems and communication with its partners and is currently developing new solutions for the NSLDS database and Postsecondary Education Participation System (PEPS).
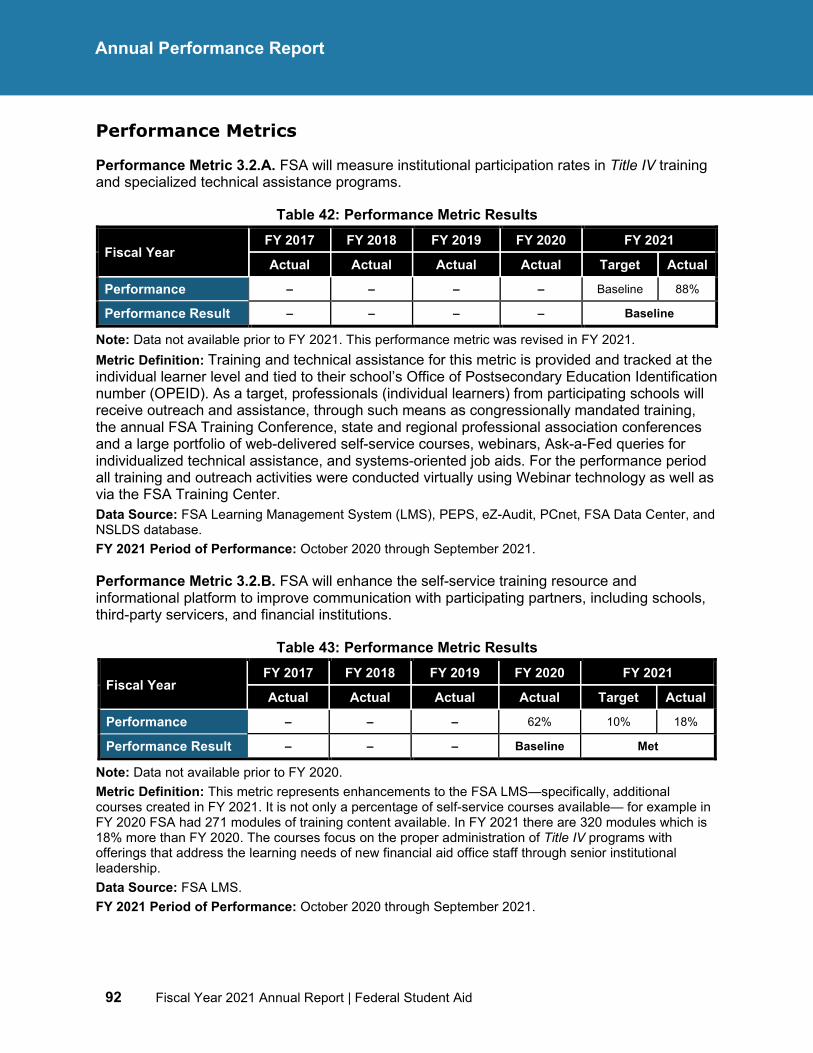
92 Fiscal Year 2021 Annual Report | Federal Student Aid
Annual Performance Report
Performance Metrics
Performance Metric 3.2.A. FSA will measure institutional participation rates in Title IV training and specialized technical assistance programs.
Table 42: Performance Metric Results
Fiscal Year FY 2017 FY 2018 FY 2019 FY 2020 FY 2021
Actual Actual Actual Actual Target Actual
Performance – – – – Baseline 88%
Performance Result – – – – Baseline
Note: Data not available prior to FY 2021. This performance metric was revised in FY 2021. Metric Definition: Training and technical assistance for this metric is provided and tracked at the individual learner level and tied to their school’s Office of Postsecondary Education Identification number (OPEID). As a target, professionals (individual learners) from participating schools will receive outreach and assistance, through such means as congressionally mandated training, the annual FSA Training Conference, state and regional professional association conferences and a large portfolio of web-delivered self-service courses, webinars, Ask-a-Fed queries for individualized technical assistance, and systems-oriented job aids. For the performance period all training and outreach activities were conducted virtually using Webinar technology as well as via the FSA Training Center. Data Source: FSA Learning Management System (LMS), PEPS, eZ-Audit, PCnet, FSA Data Center, and NSLDS database. FY 2021 Period of Performance: October 2020 through September 2021.
Performance Metric 3.2.B. FSA will enhance the self-service training resource and informational platform to improve communication with participating partners, including schools, third-party servicers, and financial institutions.
Table 43: Performance Metric Results
Fiscal Year FY 2017 FY 2018 FY 2019 FY 2020 FY 2021
Actual Actual Actual Actual Target Actual
Performance – – – 62% 10% 18%
Performance Result – – – Baseline Met
Note: Data not available prior to FY 2020. Metric Definition: This metric represents enhancements to the FSA LMS—specifically, additional courses created in FY 2021. It is not only a percentage of self-service courses available— for example in FY 2020 FSA had 271 modules of training content available. In FY 2021 there are 320 modules which is 18% more than FY 2020. The courses focus on the proper administration of Title IV programs with offerings that address the learning needs of new financial aid office staff through senior institutional leadership. Data Source: FSA LMS. FY 2021 Period of Performance: October 2020 through September 2021.
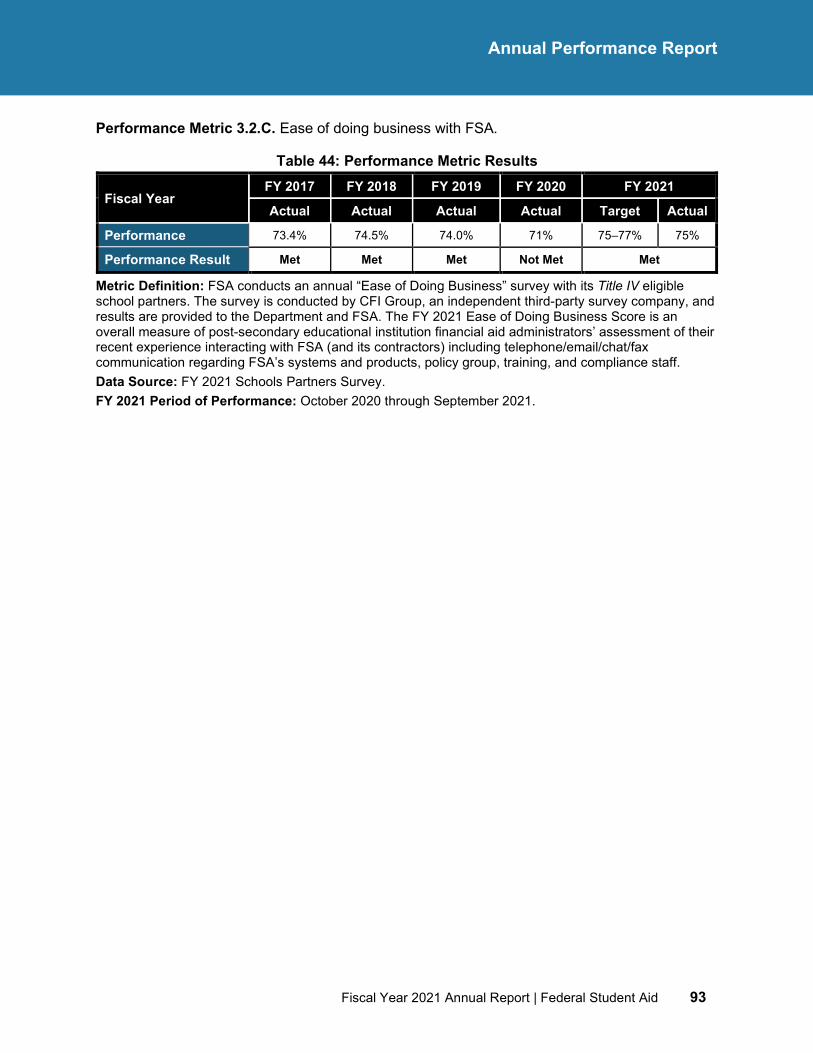
Fiscal Year 2021 Annual Report | Federal Student Aid 93
Annual Performance Report
Performance Metric 3.2.C. Ease of doing business with FSA.
Table 44: Performance Metric Results
Fiscal Year FY 2017 FY 2018 FY 2019 FY 2020 FY 2021
Actual Actual Actual Actual Target Actual
Performance 73.4% 74.5% 74.0% 71% 75–77% 75%
Performance Result Met Met Met Not Met Met
Metric Definition: FSA conducts an annual “Ease of Doing Business” survey with its Title IV eligible school partners. The survey is conducted by CFI Group, an independent third-party survey company, and results are provided to the Department and FSA. The FY 2021 Ease of Doing Business Score is an overall measure of post-secondary educational institution financial aid administrators’ assessment of their recent experience interacting with FSA (and its contractors) including telephone/email/chat/fax communication regarding FSA’s systems and products, policy group, training, and compliance staff. Data Source: FY 2021 Schools Partners Survey. FY 2021 Period of Performance: October 2020 through September 2021.
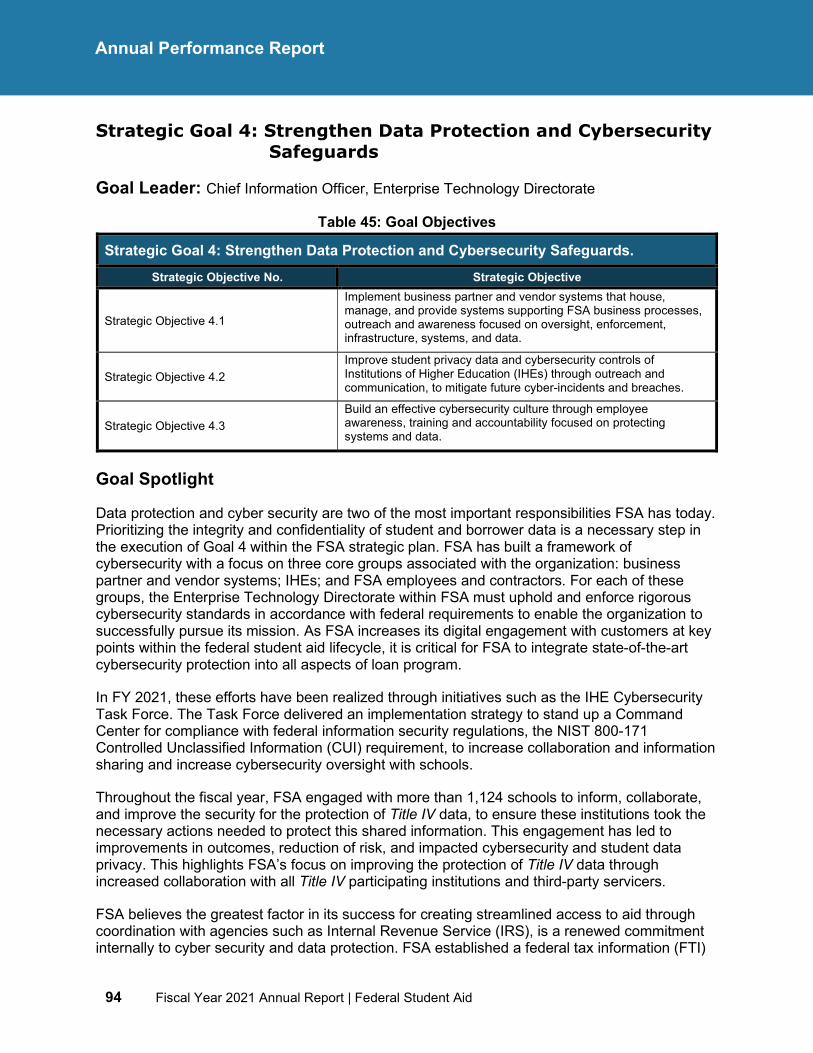
94 Fiscal Year 2021 Annual Report | Federal Student Aid
Annual Performance Report
Strategic Goal 4: Strengthen Data Protection and Cybersecurity Safeguards
Goal Leader: Chief Information Officer, Enterprise Technology Directorate
Table 45: Goal Objectives
Strategic Goal 4: Strengthen Data Protection and Cybersecurity Safeguards. Strategic Objective No. Strategic Objective
Strategic Objective 4.1
Implement business partner and vendor systems that house, manage, and provide systems supporting FSA business processes, outreach and awareness focused on oversight, enforcement, infrastructure, systems, and data.
Strategic Objective 4.2 Improve student privacy data and cybersecurity controls of Institutions of Higher Education (IHEs) through outreach and communication, to mitigate future cyber-incidents and breaches.
Strategic Objective 4.3 Build an effective cybersecurity culture through employee awareness, training and accountability focused on protecting systems and data.
Goal Spotlight
Data protection and cyber security are two of the most important responsibilities FSA has today. Prioritizing the integrity and confidentiality of student and borrower data is a necessary step in the execution of Goal 4 within the FSA strategic plan. FSA has built a framework of cybersecurity with a focus on three core groups associated with the organization: business partner and vendor systems; IHEs; and FSA employees and contractors. For each of these groups, the Enterprise Technology Directorate within FSA must uphold and enforce rigorous cybersecurity standards in accordance with federal requirements to enable the organization to successfully pursue its mission. As FSA increases its digital engagement with customers at key points within the federal student aid lifecycle, it is critical for FSA to integrate state-of-the-art cybersecurity protection into all aspects of loan program.
In FY 2021, these efforts have been realized through initiatives such as the IHE Cybersecurity Task Force. The Task Force delivered an implementation strategy to stand up a Command Center for compliance with federal information security regulations, the NIST 800-171 Controlled Unclassified Information (CUI) requirement, to increase collaboration and information sharing and increase cybersecurity oversight with schools.
Throughout the fiscal year, FSA engaged with more than 1,124 schools to inform, collaborate, and improve the security for the protection of Title IV data, to ensure these institutions took the necessary actions needed to protect this shared information. This engagement has led to improvements in outcomes, reduction of risk, and impacted cybersecurity and student data privacy. This highlights FSA’s focus on improving the protection of Title IV data through increased collaboration with all Title IV participating institutions and third-party servicers.
FSA believes the greatest factor in its success for creating streamlined access to aid through coordination with agencies such as Internal Revenue Service (IRS), is a renewed commitment internally to cyber security and data protection. FSA established a federal tax information (FTI)
Fiscal Year 2021 Annual Report | Federal Student Aid 95
Annual Performance Report
Safeguards Team which delivered the first assessment of FSA’s compliance and ability to deliver and operate secure systems managing IRS data (IRS Publication 1075). This is the first step in receiving tax information for FSA. The cybersecurity culture that has been created at FSA spans the organization and supports the continued efforts to mitigate risk while making technologically secure decisions in the areas of data sharing, data management, and cybersecurity.
96 Fiscal Year 2021 Annual Report | Federal Student Aid
Annual Performance Report
Strategic Objective 4.1
Implement business partner and vendor systems that house, manage, and provide systems supporting FSA business processes, outreach and awareness focused on oversight, enforcement, infrastructure, systems, and data.
Overview
The focus of this strategic objective is on FSA's efforts to increase support for partner institutions and coordination with vendors to provide improved cybersecurity services. This metric measures how well information systems are securely maintained, and the how the risks associated with compromises and breaches of sensitive information are controlled. This includes systems and services provided by the loan servicers — TIVAS and NFPs, ongoing Next Gen FSA initiative, and the existing legacy information systems.
The Department’s vulnerability management policy allows for vulnerabilities to be closed within a specified timeframe based on the criticality of the vulnerability. In accordance with the policy, FSA implemented a process to track known vulnerability closures by allowable remediation windows. This approach encouraged vendors to complete fixes within those remediation windows to avoid plans of action and milestone creation. This helps to ensure that FSA systems become more secure in a timelier manner.
In addition, FSA successfully set up the infrastructure and configured the Partner Connect solution. This initiative helped the Partner Connect platform deliver fast, quality web experiences to their end users while mitigating against edge attacks without compromising delivery and availability.
FY 2021 Performance Summary and Analysis
There is one performance measure for this strategic objective. FSA did not meet its annual target on this metric. In FY 2021 there were an increased number of business and partner systems enrolled in programs that provided a more real-time view of ongoing system security postures, i.e., Continuous Diagnostics and Mitigation (CDM), and ongoing security authorizations). Subsequently, FSA discovered a higher number of security findings with systems leading to a higher number of plans of action and milestone being created. Although the target was not met, the immediate identification of these issues affords FSA the opportunity to develop strategies to resolve them, and not allow any system to go unfixed and be susceptible to a potential breach in the future.
Fiscal Year 2021 Annual Report | Federal Student Aid 97
Annual Performance Report
Key Successes and Opportunities
The performance measure under this strategic objective is to increase partner/vendor cybersecurity effectiveness by reducing the total number of FSA system assessment findings by 20% per year. The increased number of systems enrolled and participating in the Ongoing Security Authorization program ensured that FSA had a closer to real time view of the maintenance of cybersecurity requirements implemented at the systems. The Ongoing Security Authorization is an assessment program that supports the Authorities to Operate (ATO). Additionally, for new systems being developed, ATOs were being granted for shorter durations and with strict stipulations that must be met to maintain that ATO in the future.
The key challenges facing this objective were to address the barriers to fully implement mitigating strategies and achieve expected targets, including updating contract language, communicating new or evolving cybersecurity laws and federal requirements, and creating more visibility into the real-time security posture of third-party service providers. FSA launched the following initiatives to respond to these challenges:
• Enrolled third party service providers in the CDM program,
• Added specific cybersecurity requirements language in contracts for all new systems and updated language in contracts for existing systems, and
• Ensured the appropriate number of subject matter experts support the cybersecurity of FSA systems.
All activities are anticipated to be completed by the end of FY 2022 Quarter 2 in accordance with Executive Order 14028 requirements on Improving the Nation’s Cybersecurity. The success of the information systems to manage risk is reflected in the Department's Cybersecurity Risk Framework Scorecard.
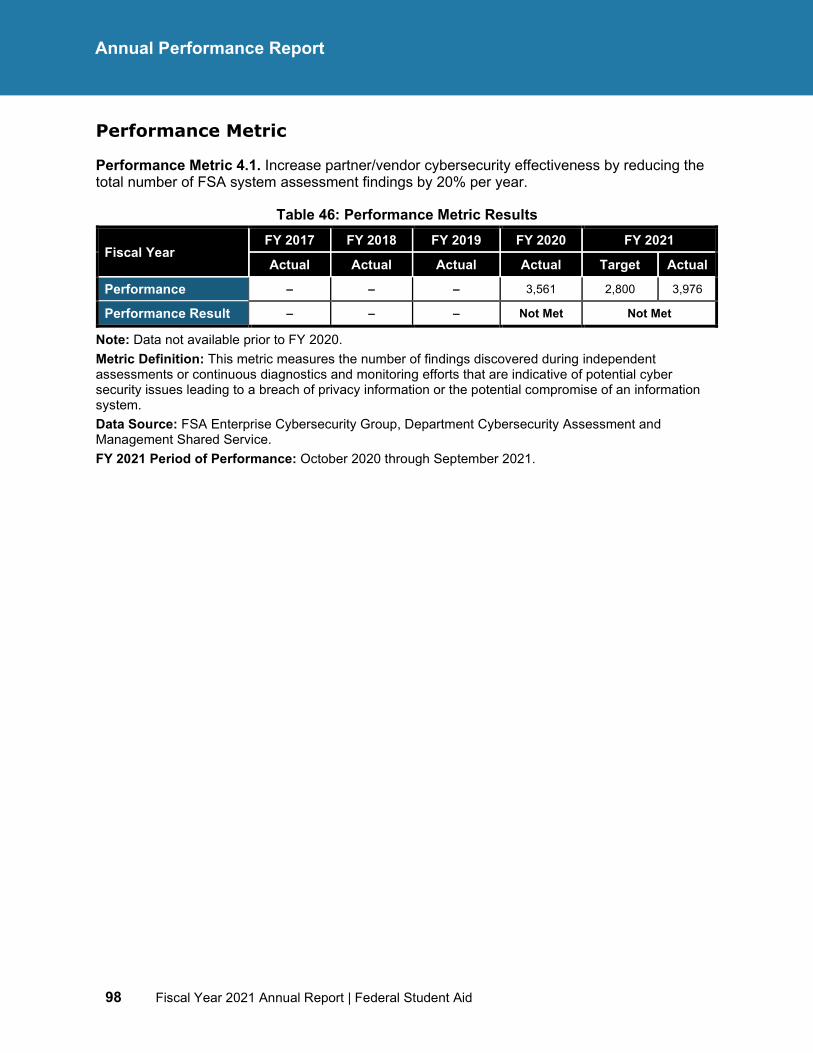
98 Fiscal Year 2021 Annual Report | Federal Student Aid
Annual Performance Report
Performance Metric
Performance Metric 4.1. Increase partner/vendor cybersecurity effectiveness by reducing the total number of FSA system assessment findings by 20% per year.
Table 46: Performance Metric Results
Fiscal Year FY 2017 FY 2018 FY 2019 FY 2020 FY 2021
Actual Actual Actual Actual Target Actual
Performance – – – 3,561 2,800 3,976
Performance Result – – – Not Met Not Met
Note: Data not available prior to FY 2020. Metric Definition: This metric measures the number of findings discovered during independent assessments or continuous diagnostics and monitoring efforts that are indicative of potential cyber security issues leading to a breach of privacy information or the potential compromise of an information system. Data Source: FSA Enterprise Cybersecurity Group, Department Cybersecurity Assessment and Management Shared Service. FY 2021 Period of Performance: October 2020 through September 2021.
Fiscal Year 2021 Annual Report | Federal Student Aid 99
Annual Performance Report
Strategic Objective 4.2
Improve student privacy data and cybersecurity controls of Institutions of Higher Education (IHEs) through outreach and communication, to mitigate future cyber-incidents and breaches.
Overview
To improve student privacy data and cybersecurity controls of IHEs, FSA’s strategy for 2021 was contacting IHEs and working with them to establish Corrective Action Plans (CAPs) to ensure compliance objectives were achieved. FSA’s strategy and operations have proven effective and have led to notable improvements in outcomes and risk reductions, which will impact cybersecurity and student data privacy now and in the future.
Faster remediation reduces the scope of the incident, improves student privacy and cybersecurity controls, leading to stronger data protection and cybersecurity safeguards. To support faster remediation, FSA provided Electronic Announcements and collaborated with IHEs to promote the protection of student data and ensure schools appropriately safeguard information. FSA implemented several actions to effectively communicate cybersecurity information for IHEs to enhance their cybersecurity posture, resulting in improved relationships with IHEs, support for their efforts to safeguard information, and a better understanding of the overall cybersecurity posture of IHEs within the education sector.
In addition, FSA delivered a proposed implementation plan to stand up a Command Center for compliance with NIST 800-171 CUI requirement. This plan will increase collaboration, information sharing, and cybersecurity oversight with schools.
FSA’s future improvements to the current strategies include:
• Alignment with the President's Executive Order 14028 on Improving the Nation's Cybersecurity issued on May 12, 2021, through formulating strategic and operational improvements to the Gramm-Leach-Bliley Act (GLBA) program in FY 2022.
• Deployment of information technology systems to improve interaction with IHEs. These improvements will provide better quality of service, enhance metrics, support trend analysis, and facilitate more effective communications.
• Collaboration with industry partners, Cybersecurity and Infrastructure Security Agency, and IHEs to improve cybersecurity posture of IHEs by establishing information security standards.
FY 2021 Performance Summary and Analysis
There are two performance metrics for this strategic objective. Both metrics met their annual targets in FY 2021.
Key Successes and Opportunities
FSA collaborates with IHEs to ensure CAPs are in place to address GLBA Audit non-compliance. FSA’s strategy for 2021, first year of operations, was to contact schools, inform
100 Fiscal Year 2021 Annual Report | Federal Student Aid
Annual Performance Report
them of the GLBA requirements, and track their progress as it collaborates with them on CAPs. Risk has been reduced with each cybersecurity requirement met and each CAP achieved. Last year, no schools were helped through this process and a year elapsed before an audit would show any improvement in compliance. Since April 2021, FSA has collaborated with 303 schools and 100 have met all the requirements.
While there are many backlogged GLBA compliance reports to review, and it will take time to allow schools to achieve compliance, FSA has found schools to be responsive and, in many instances, have already satisfied the GLBA Cybersecurity requirements. FSA’s strategy and operations have proven effective and have led to notable improvements in outcomes and risk reductions, which will impact cybersecurity and student data privacy now and in the future. The well-known increase in cybersecurity breaches, ransomware attacks, and supply-chain attacks are external factors beyond the scope of agency efforts which significantly increased the magnitude of the problem being addressed.
The goal of performance metric 4.2.B is to reduce incident reporting time at Institutions of Higher Education. FSA provides Electronic Announcements and collaborates with IHEs to promote the protection of student data and ensure schools appropriately safeguard information. Topics include ransomware, CUI & GLBA, email scams, and identity verification. In FY 2021, FSA implemented several actions to effectively communicate cybersecurity information for IHEs to enhance their cybersecurity posture, as follows:
• Published four Electronic Announcements to the Partner Connect Knowledge Center informing institutions of potentially impactful technology security alerts
• Provided technical assistance to 45 IHEs in response to breach incidents to cybersecurity safeguards
• Conducted 18 outreach engagements and activities regarding data privacy and the information technology security requirements of IHEs
• Launched Microsoft Exchange campaign targeting 647 Title IV institutions
• Established new oversight and compliance of GLBA audits relating to cybersecurity
As a result, FSA improved relationships with IHEs, supported their efforts to safeguard information, and gained a better understanding of the overall cybersecurity posture of IHEs within the education sector. To improve outcomes and communication, FSA is growing its contact database of IHE Chief Information Officers, Chief Information Security Officers, Information Technology (IT) Directors, and Compliance Officers through internal and external list acquisition.
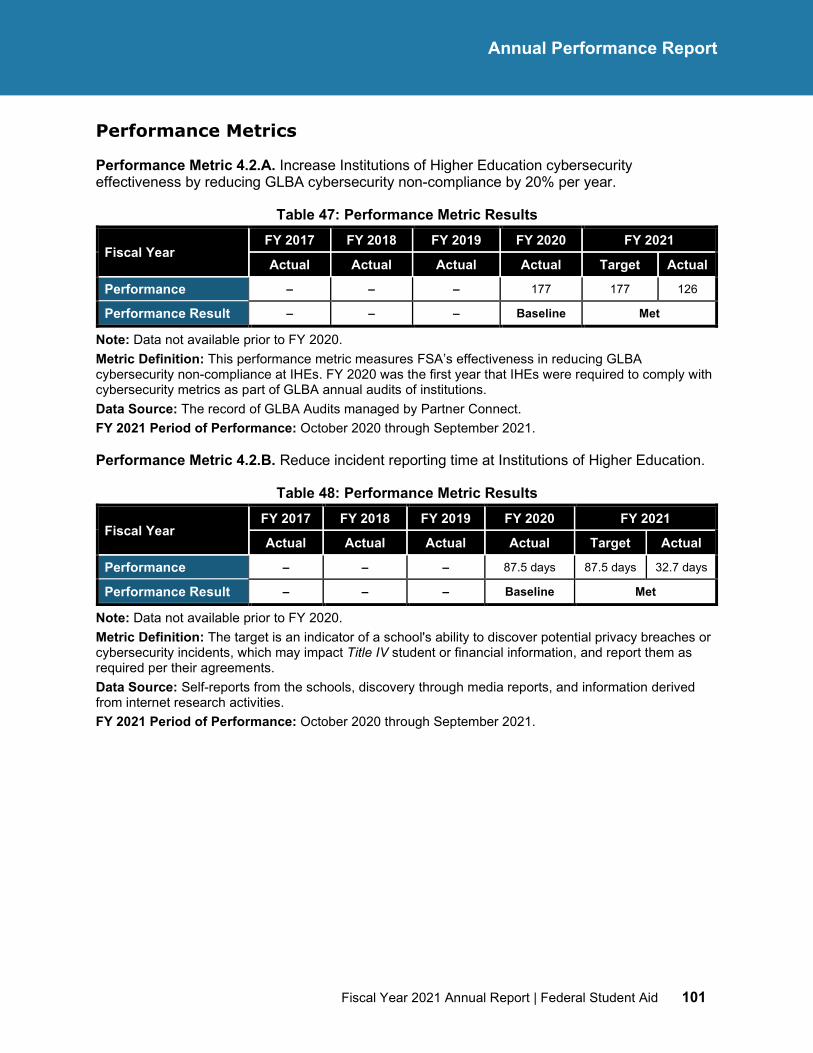
Fiscal Year 2021 Annual Report | Federal Student Aid 101
Annual Performance Report
Performance Metrics
Performance Metric 4.2.A. Increase Institutions of Higher Education cybersecurity effectiveness by reducing GLBA cybersecurity non-compliance by 20% per year.
Table 47: Performance Metric Results
Fiscal Year FY 2017 FY 2018 FY 2019 FY 2020 FY 2021
Actual Actual Actual Actual Target Actual
Performance – – – 177 177 126
Performance Result – – – Baseline Met
Note: Data not available prior to FY 2020. Metric Definition: This performance metric measures FSA’s effectiveness in reducing GLBA cybersecurity non-compliance at IHEs. FY 2020 was the first year that IHEs were required to comply with cybersecurity metrics as part of GLBA annual audits of institutions. Data Source: The record of GLBA Audits managed by Partner Connect. FY 2021 Period of Performance: October 2020 through September 2021.
Performance Metric 4.2.B. Reduce incident reporting time at Institutions of Higher Education.
Table 48: Performance Metric Results
Fiscal Year FY 2017 FY 2018 FY 2019 FY 2020 FY 2021
Actual Actual Actual Actual Target Actual
Performance – – – 87.5 days 87.5 days 32.7 days
Performance Result – – – Baseline Met
Note: Data not available prior to FY 2020. Metric Definition: The target is an indicator of a school's ability to discover potential privacy breaches or cybersecurity incidents, which may impact Title IV student or financial information, and report them as required per their agreements. Data Source: Self-reports from the schools, discovery through media reports, and information derived from internet research activities. FY 2021 Period of Performance: October 2020 through September 2021.
102 Fiscal Year 2021 Annual Report | Federal Student Aid
Annual Performance Report
Strategic Objective 4.3
Build an effective cybersecurity culture through employee awareness, training and accountability focused on protecting systems and data.
Overview
As cybercrime becomes more lucrative, the probability of cyber-attacks against FSA assets and employees will increase. It is important to understand the short-term and long-term effects cyberattacks can have against FSA’s business and develop a proactive strategy to deal with threat actors. FSA’s goal is to promote strong cybersecurity awareness among its employees and contractors, as well as provide information on how to avoid phishing emails and other scam tactics. In FY 2021, FSA educated staff on cyber threats faced and the importance of following procedures correctly.
In addition, FSA and the Department invested in situational awareness training. Overall, employees are becoming more aware when dealing with situations related to cybersecurity. While training helps to mitigate some threats, human error is also a factor needing mitigation. Human errors can be reduced by consistently improving safety nets through well documented processes and investing in comprehensive Data Leakage Prevention (DLP) security strategy and solutions.
FY 2021 Performance Summary and Analysis
There is one performance measure for this strategic objective. FSA did not meet its annual metric target. The metric result includes DLP of PII leakage, and Security Operations (SecOps) tickets due to employees failing to properly handle PII information, provided by the Department. In FY 2022, FSA plans to revise its measurement to introduce a more realistic approach to track this strategic objective to reflect ongoing changes in the environment, deployment of new tools to detect issues with PII, and the need to fine tune those tools at specific time frames within the fiscal year.
Key Successes and Opportunities
FSA collaborated with the Department to ensure Cybersecurity Awareness Training was provided to FSA. The collaboration extended into tracking employee performance during phishing exercises, and monitoring DLP metrics and Sec Ops tickets related to PII. FSA continuously promoted a culture of cybersecurity in its workplace, including training employees about safe online computing, emphasizing strong passwords, and placing a particular emphasis on tricks related to social engineering. The organization demonstrated positive resilience in the last 6 exercises, which means more users consistently reported the phishing as compared to susceptible users. Simulated phishing exercises were sent to 2,260 FSA user email accounts belonging to the Department. These email addresses included 1,442 employees and 818 contractors. 2,219 of 2,260 (98.2%) network users successfully passed cybersecurity awareness exercise #5 run in July 2021; FSA’s target was 90% pass or higher.
In addition, situational awareness was emphasized across the employee base to minimize cybersecurity incidents. To this end, throughout FY 2022, FSA will continue sending out helpful articles covering the latest type of threat, results of phishing exercises, useful tips, and
Fiscal Year 2021 Annual Report | Federal Student Aid 103
Annual Performance Report
discussing cybersecurity during all-employee meetings. FSA will also remind employees they are the first line of cyber defense and that they are essential to ensuring the confidentiality of sensitive business data. Overall, employees are becoming more aware when dealing with situations related to cybersecurity, and the approach to strengthening employee decision-making will expand through similar efforts in the next fiscal year.
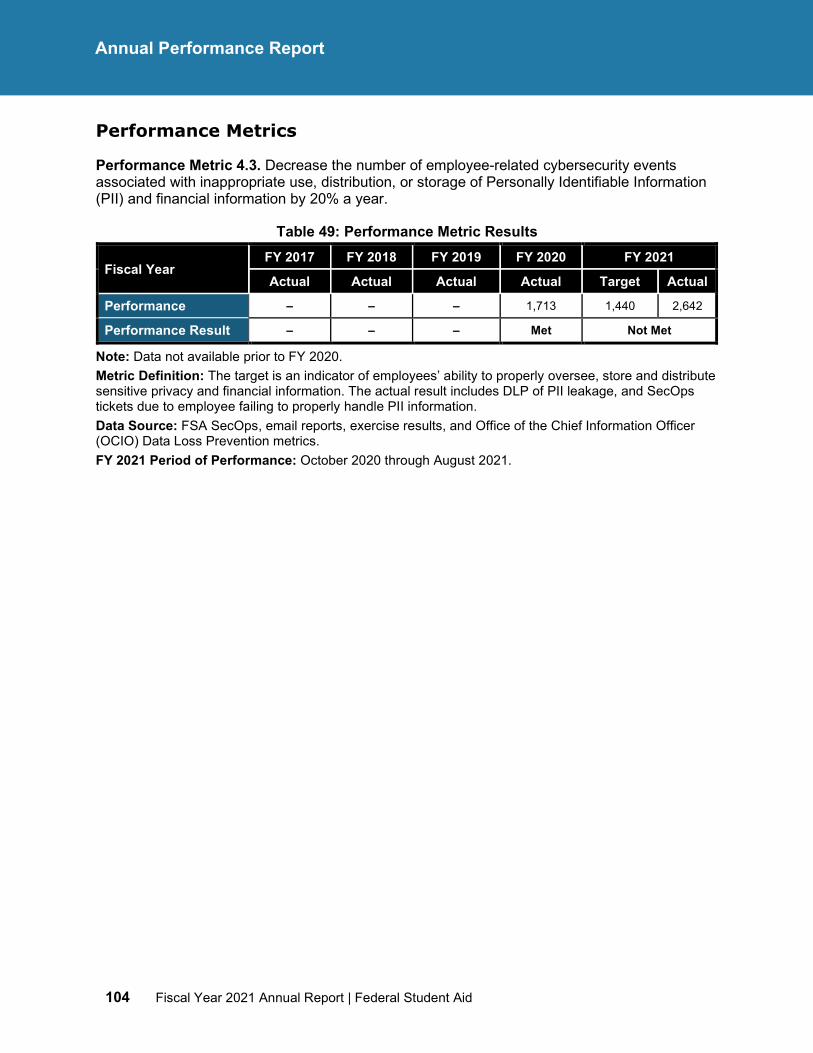
104 Fiscal Year 2021 Annual Report | Federal Student Aid
Annual Performance Report
Performance Metrics
Performance Metric 4.3. Decrease the number of employee-related cybersecurity events associated with inappropriate use, distribution, or storage of Personally Identifiable Information (PII) and financial information by 20% a year.
Table 49: Performance Metric Results
Fiscal Year FY 2017 FY 2018 FY 2019 FY 2020 FY 2021
Actual Actual Actual Actual Target Actual
Performance – – – 1,713 1,440 2,642
Performance Result – – – Met Not Met
Note: Data not available prior to FY 2020. Metric Definition: The target is an indicator of employees’ ability to properly oversee, store and distribute sensitive privacy and financial information. The actual result includes DLP of PII leakage, and SecOps tickets due to employee failing to properly handle PII information. Data Source: FSA SecOps, email reports, exercise results, and Office of the Chief Information Officer (OCIO) Data Loss Prevention metrics. FY 2021 Period of Performance: October 2020 through August 2021.
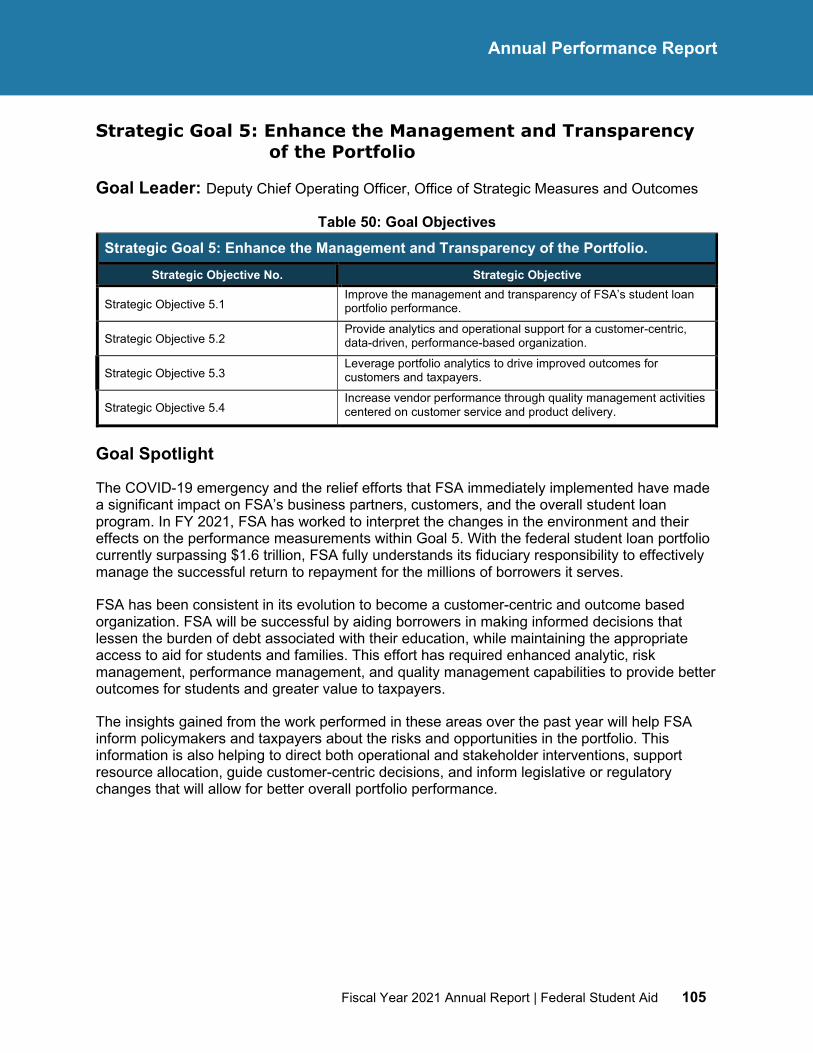
Fiscal Year 2021 Annual Report | Federal Student Aid 105
Annual Performance Report
Strategic Goal 5: Enhance the Management and Transparency of the Portfolio
Goal Leader: Deputy Chief Operating Officer, Office of Strategic Measures and Outcomes
Table 50: Goal Objectives Strategic Goal 5: Enhance the Management and Transparency of the Portfolio.
Strategic Objective No. Strategic Objective
Strategic Objective 5.1 Improve the management and transparency of FSA’s student loan portfolio performance.
Strategic Objective 5.2 Provide analytics and operational support for a customer-centric, data-driven, performance-based organization.
Strategic Objective 5.3 Leverage portfolio analytics to drive improved outcomes for customers and taxpayers.
Strategic Objective 5.4 Increase vendor performance through quality management activities centered on customer service and product delivery.
Goal Spotlight
The COVID-19 emergency and the relief efforts that FSA immediately implemented have made a significant impact on FSA’s business partners, customers, and the overall student loan program. In FY 2021, FSA has worked to interpret the changes in the environment and their effects on the performance measurements within Goal 5. With the federal student loan portfolio currently surpassing $1.6 trillion, FSA fully understands its fiduciary responsibility to effectively manage the successful return to repayment for the millions of borrowers it serves.
FSA has been consistent in its evolution to become a customer-centric and outcome based organization. FSA will be successful by aiding borrowers in making informed decisions that lessen the burden of debt associated with their education, while maintaining the appropriate access to aid for students and families. This effort has required enhanced analytic, risk management, performance management, and quality management capabilities to provide better outcomes for students and greater value to taxpayers.
The insights gained from the work performed in these areas over the past year will help FSA inform policymakers and taxpayers about the risks and opportunities in the portfolio. This information is also helping to direct both operational and stakeholder interventions, support resource allocation, guide customer-centric decisions, and inform legislative or regulatory changes that will allow for better overall portfolio performance.
106 Fiscal Year 2021 Annual Report | Federal Student Aid
Annual Performance Report
Strategic Objective 5.1
Improve the management and transparency of FSA’s student loan portfolio performance.
Overview
The FSA Data Center launched in FY 2009 and is considered the public, online repository of information about the federal student aid programs. The Data Center primarily consists of static Excel spreadsheets which are updated on a monthly, quarterly, and annual basis. Presently, FSA regularly publishes more than 70 data sets which offer a continuous level of transparency for both internal and external stakeholders in a timely manner with accurate, repeatable data reporting. By offering access to the information on-line, the Data Center affords stakeholders self-service opportunities to review and evaluate data about the Title IV programs. In the upcoming year, the Data Center will foster transparency of the loan program on two fronts: automation of running the existing reports and establishment of a public-facing dashboard that is more interactive than the Excel spreadsheets.
To further FSA’s accountability, stakeholders can also submit more specific data requests to FSA, and these requests are fulfilled and independently validated by a cross-organizational team which has been in place since FY 2013. Many data process requests are minor variations on the reports that are already published, and most of these ad hoc requests can potentially be addressed with the implementation of an interactive, self-service dashboard. Regarding the existing reports (and additional ones FSA may add to the Data Center over time), this growing suite of regular Data Center reports has been run manually with very limited disruption.
Continuous automation of specific data reports will generate increased benefits for an evolving stakeholder base who utilizes this information, including the potential of faster posting to the web site for each update. In FY 2021, FSA invested in analytical capabilities to further its goal of increasing the number of automated processes, resulting in the release of more frequent data sets. FSA has also explored new opportunities to improve the user experience with the Data Center by making it easier to navigate and combine existing data sets.
In regard to FSA’s improved management of the loan portfolio, there were few challenges greater than the on-going impact of the COVID-19 emergency on this objective and its associated metrics. For example, the administrative forbearance associated with the CARES Act legislation, also referred to as the payment pause, was extended several times during the fiscal year. To this end, since March 2020, most borrowers who were actively repaying their loans have had their loans moved to forbearance. Therefore, several of the calculated metrics under 5.1 and 5.3 are not currently representative, because they focus on loans in Active Repayment (current and past-due), while the majority of the loans are in forbearance, and most borrowers still paying are those with their loans in forbearance. As the return to repayment is initiated in FY 2022, FSA will utilize existing performance metrics to monitor changes in borrower behavior and repayment trends to support the Department with data and analysis in order to manage the student loan programs in the most efficient manner. Additionally, FSA has developed dedicated methods to monitor the unique circumstances of the early months when the return to repayment program begins.
Fiscal Year 2021 Annual Report | Federal Student Aid 107
Annual Performance Report
FY 2021 Performance Summary and Analysis
There are two performance metrics for this strategic objective. One metric met its annual target while the other metric could not provide representative data. This metric, 5.1.B, Outstanding Direct Loan Portfolio in Current Repayment Status, has an actual result of 100% because it focuses on active repayment. However, during the COVID-19 emergency, this metric has not generated representative or useful results, as the data is inconsequential due to the millions of borrowers currently in an administrative forbearance status. While this metric showed seven years of improvement prior to the pandemic, it will need to undergo a baseline assessment during FY 2022 and/or FY 2023, which will be used to set targets for future years.
Key Successes and Opportunities
In 2021, the Enterprise Data Office within FSA piloted a more robust self-service module to continue to expand and improve the FSA Data Center in alignment with stakeholder needs. In preparation for this initiative, FSA had direct engagement with institutional partners.
This effort has resulted in a contract acquisition at the close of the fiscal year. The contract will enable new interactive informational dashboards to be developed on StudentAid.gov during FY 2022. To further support the improvement of the information stakeholders receive, additional FSA staff have been trained to expedite both the validation and automation of Data Center reporting. FSA has also worked to reduce the timeline for creating monthly data tables, which provides subject matter experts within FSA with streamlined access to the data sets, allowing more time for analysis. This process improvement has allowed the FSA data team to compile, format and submit data reports into agency clearance for approval at a faster rate than previous years.
The Enterprise Data Directorate (EDD) refined the reports that will be run each month for return to repayment that it had begun during FY 2020 and partnered with other FSA offices and external vendors on leveraging data for borrower outreach campaigns. EDD is also participating operationally via FSA’s TEDI and always-on outreach campaigns. Transitioning 26 million forbearance borrowers into Active Repayment during the February 2022 timeframe will pose a significant operational and logistical challenge to FSA and, from a data standpoint, it will increase the difficulty to forecast expectations associated with the current performance metrics under this strategic objective.
To mitigate the impact of these changes on the analysis of performance, EDD began periodic crosscutting meetings with the FSA Risk Management and the Loan Servicing teams to ensure that targets and baselines could incorporate operational factors and changes. These meetings will help FSA to re-baseline metrics related to repayment, delinquency, and default after the return to repayment period begins. Several offices, including EDD, will have additional temporary metrics monitoring the return to repayment that can provide additional perspective for metrics such as 5.1.B Outstanding Direct Loan Portfolio in Current Repayment Status.
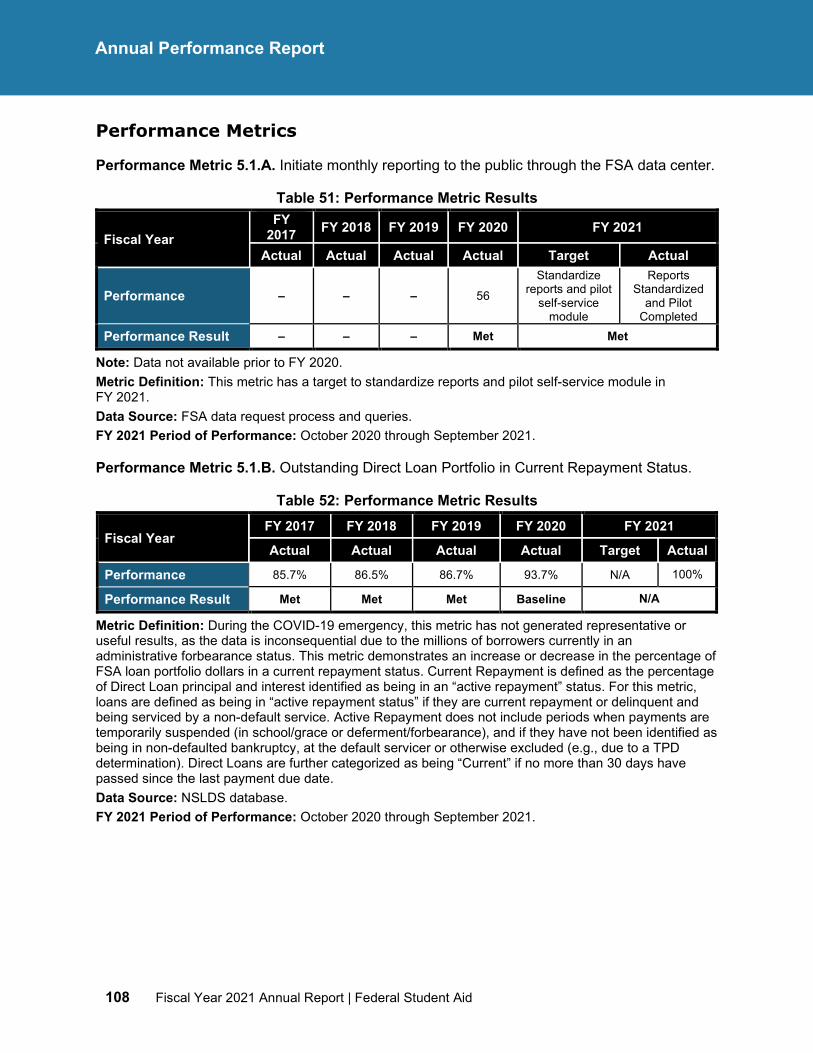
108 Fiscal Year 2021 Annual Report | Federal Student Aid
Annual Performance Report
Performance Metrics
Performance Metric 5.1.A. Initiate monthly reporting to the public through the FSA data center.
Table 51: Performance Metric Results
Fiscal Year FY
2017 FY 2018 FY 2019 FY 2020 FY 2021
Actual Actual Actual Actual Target Actual
Performance – – – 56
Standardize reports and pilot
self-service module
Reports Standardized
and Pilot Completed
Performance Result – – – Met Met
Note: Data not available prior to FY 2020. Metric Definition: This metric has a target to standardize reports and pilot self-service module in FY 2021. Data Source: FSA data request process and queries. FY 2021 Period of Performance: October 2020 through September 2021.
Performance Metric 5.1.B. Outstanding Direct Loan Portfolio in Current Repayment Status.
Table 52: Performance Metric Results
Fiscal Year FY 2017 FY 2018 FY 2019 FY 2020 FY 2021
Actual Actual Actual Actual Target Actual
Performance 85.7% 86.5% 86.7% 93.7% N/A 100%
Performance Result Met Met Met Baseline N/A
Metric Definition: During the COVID-19 emergency, this metric has not generated representative or useful results, as the data is inconsequential due to the millions of borrowers currently in an administrative forbearance status. This metric demonstrates an increase or decrease in the percentage of FSA loan portfolio dollars in a current repayment status. Current Repayment is defined as the percentage of Direct Loan principal and interest identified as being in an “active repayment” status. For this metric, loans are defined as being in “active repayment status” if they are current repayment or delinquent and being serviced by a non-default service. Active Repayment does not include periods when payments are temporarily suspended (in school/grace or deferment/forbearance), and if they have not been identified as being in non-defaulted bankruptcy, at the default servicer or otherwise excluded (e.g., due to a TPD determination). Direct Loans are further categorized as being “Current” if no more than 30 days have passed since the last payment due date. Data Source: NSLDS database. FY 2021 Period of Performance: October 2020 through September 2021.
Fiscal Year 2021 Annual Report | Federal Student Aid 109
Annual Performance Report
Strategic Objective 5.2
Provide analytics and operational support for a customer-centric, data-driven, performance-based organization.
Overview
In a continuous effort to improve service to borrowers and customers, support responsible borrowing, and encourage repayment, FSA recognized the need for enhanced analytical performance management and risk management capabilities to be built into its programming. As the student loan environment has evolved in response to the COVID-19 emergency, FSA increased this focus by more efficiently sharing information internally across the organization and driving data-driven decisions in support of better results for stakeholders. For this objective, FSA has worked throughout FY 2021 to enhance its Enterprise Risk Management (ERM) strategy and framework to enable risk-intelligent decision-making for improved portfolio and operational outcomes. FSA has also expanded the body of work associated with the timeline for implementation of the FUTURE Act, inclusive of the incorporation of the FAFSA Simplification Act, with the goal of easing the administrative burden to borrowers and increasing access to financial aid.
The ERM team works collaboratively with all business units so that risk reporting can be found at various levels in the organization and at different points in processes. This risk reporting seeks to integrate risk, strategy, and performance and provide transparency into these connections to better meet goals and objectives and fulfill FSA’s mission. ERM team members are embedded in significant organizational initiatives providing risk support from planning to execution.
For FSA, the ability to meet the implementation timeline of the FUTURE Act and FAFSA Simplification Act requires the prioritization of hiring employees who will support the implementation. In addition, the implementation also relies on FSA’s ability to identify the servicers and servicing backend systems that will be integrating with the FUTURE Act solutions. For example, the execution of the FUTURE Act Computer Matching Agreement is contingent on the Total and Permanent Disability (TPD) and Income Driven Repayment (IDR) back-end solution decisions. It is critical for standard operating procedures and changes to enterprise processes (e.g., changes to the Technology Acquisitions requirements, 1075 Authority to Operate process, budget approval process) to be documented and socialized throughout the organization.
The FAFSA Simulator was built and undergoing user acceptance testing when the FAFSA Simplification Act passed back in the first quarter of FY 2021. As a result, the implementation teams had to recalibrate their approach for gathering customer feedback and testing the changes to the FAFSA form.
The FUTURE Act team has worked across federal agencies to make progress to include ongoing discussions with the OMB and the Department on potential changes to the FUTURE Act provisions and with the IRS to clarify the confidentiality of Internal Revenue Code (IRC) 6103 (a)(3) and disclosure reporting/IRC 6103 (p)(3) for FSA and FSA’s partners. The FUTURE Act Direct Data Exchange interface (FA-DDX) launched in December 2020, which established a direct data connection with the IRS to request and receive FTI.
110 Fiscal Year 2021 Annual Report | Federal Student Aid
Annual Performance Report
FY 2021 Performance Summary and Analysis
There are two performance metrics for this strategic objective. Both metrics met their annual targets.
Key Successes and Opportunities
FSA’s goal is to eventually move the organization to be risk intelligent, where leadership continually demonstrates a strong commitment to risk management with a formal governance structure. Additionally, a risk intelligent organization has a formal risk appetite which has been communicated and risk assessment methodologies, tools, and templates are standardized, understood, and used throughout the organization. Inclusive within this framework, performance is measured against strategic goals and linked to key risk indicators. In FY 2021, the ERM team continued to provide enhanced training, tools, templates, and reports to increase the connection between risk, strategy, and performance. These enhanced products helped FSA to better manage risk across the enterprise and continue to move toward becoming a more risk intelligent organization. Some specific examples of ERM’s accomplishments in support of this performance metric include:
• Completed risk assessments, risk-based decision documents, and risk alerts to assist FSA in better understanding and managing risk to implement provisions of legislation more effectively (e.g., FUTURE Act and FAFSA Simplification Act), aimed at helping students apply for and receive federal financial aid
• Worked with key stakeholders across FSA to identify key risks and mitigation activities for all five of FSA’s strategic objectives, identified key risk indicators, and created corresponding dashboard reports to show both qualitative and quantitative risk information
• Worked collaboratively with FSA and Department stakeholders during the conduct of 28 FSA audits and 4 non-FSA audits. Tracked and managed closing evidence for 10 GAO and OIG audits across FSA
• Closed more than 5,300 OIG fraud referrals
• Collaborated with key FSA stakeholders to complete the design and identify requirements for the transition of the OIG fraud referral process to BPO vendors
In conjunction with efforts toward the timeline for FUTURE Act implementation, FSA accomplished the following in support of this metric:
• Completed high-level business and technical requirements for FUTURE Act TPD, IDR, and FAFSA solutions
• Established collaboration session with Management Services to track and coordinate the hiring of resources for the SABER initiative—incorporating the FUTURE Act and FAFSA Simplification Act
• Established and implemented a SABER Decision Governance Framework to escalate and resolve outstanding decisions and issues
• Awarded multiple contracts to begin the development of the applications and infrastructure that will manage and store FTI.
Fiscal Year 2021 Annual Report | Federal Student Aid 111
Annual Performance Report
• Released the Award Eligibility Determination solicitation, which will enable FSA to procure the new FAFSA backend system that will process FAFSA forms and determine aid eligibility for the 2024–25 award year
The Award Eligibility Determination solution will increase FSA’s agility, efficiency, stability, and security in delivering changes to students and families. It will also enable FSA to fully implement the FUTURE Act and FAFSA Simplification Act for the 2024–25 award year. The finalization of the FA-DDX interface is a critical milestone that allows for the secure flow of FTI from IRS to FSA, which will help to reduce the net cost of improper payments. FTI will also be leveraged to improve analyses and forecasts for estimating costs.
The implementation of both the FUTURE and FAFSA Simplification Acts will dramatically change the way students and families engage with FSA’s financial aid program. As FSA assists customers in transitioning back into a positive repayment posture at the close of the administrative forbearance period in FY 2022, it will be imperative that the provisions associated with this performance objective become fully implemented.
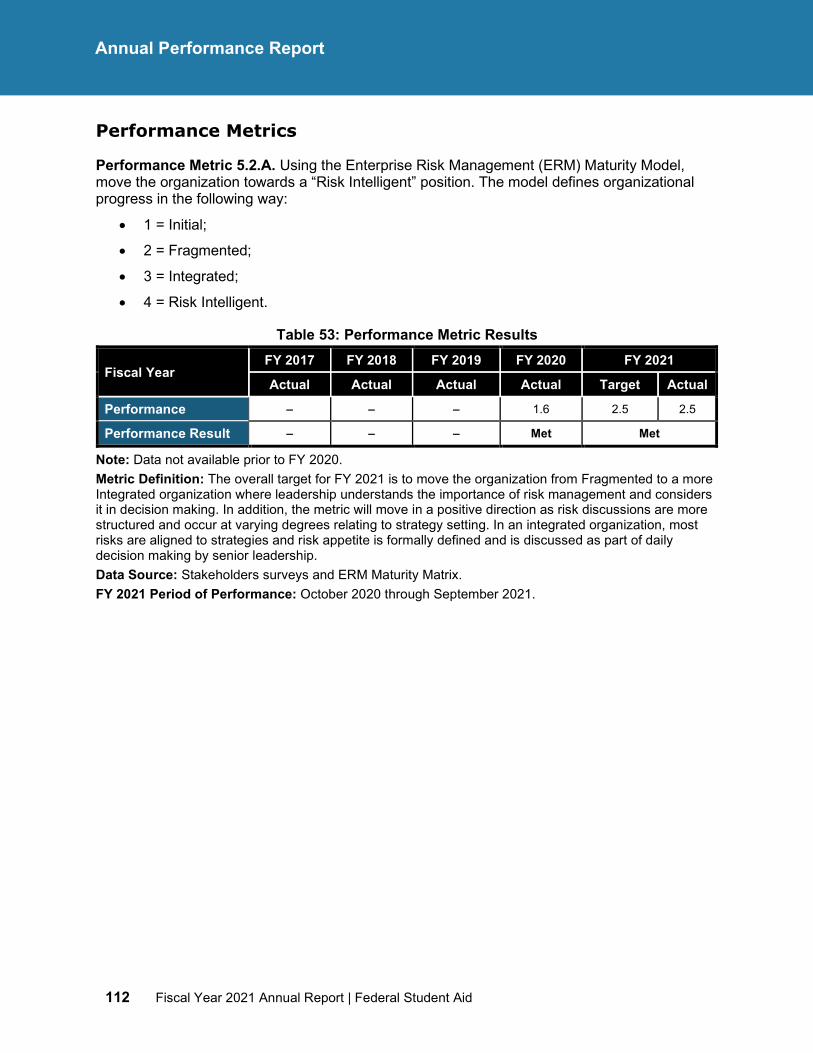
112 Fiscal Year 2021 Annual Report | Federal Student Aid
Annual Performance Report
Performance Metrics
Performance Metric 5.2.A. Using the Enterprise Risk Management (ERM) Maturity Model, move the organization towards a “Risk Intelligent” position. The model defines organizational progress in the following way:
• 1 = Initial;
• 2 = Fragmented;
• 3 = Integrated;
• 4 = Risk Intelligent.
Table 53: Performance Metric Results
Fiscal Year FY 2017 FY 2018 FY 2019 FY 2020 FY 2021
Actual Actual Actual Actual Target Actual
Performance – – – 1.6 2.5 2.5
Performance Result – – – Met Met
Note: Data not available prior to FY 2020. Metric Definition: The overall target for FY 2021 is to move the organization from Fragmented to a more Integrated organization where leadership understands the importance of risk management and considers it in decision making. In addition, the metric will move in a positive direction as risk discussions are more structured and occur at varying degrees relating to strategy setting. In an integrated organization, most risks are aligned to strategies and risk appetite is formally defined and is discussed as part of daily decision making by senior leadership. Data Source: Stakeholders surveys and ERM Maturity Matrix. FY 2021 Period of Performance: October 2020 through September 2021.
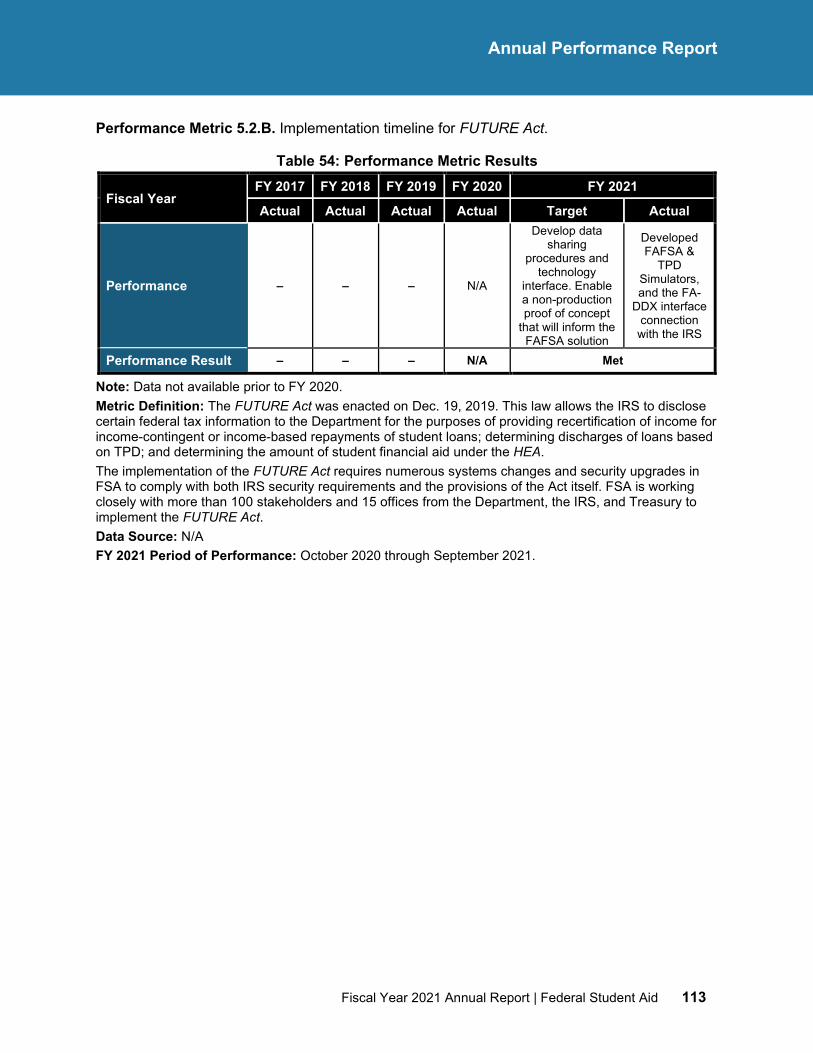
Fiscal Year 2021 Annual Report | Federal Student Aid 113
Annual Performance Report
Performance Metric 5.2.B. Implementation timeline for FUTURE Act.
Table 54: Performance Metric Results
Fiscal Year FY 2017 FY 2018 FY 2019 FY 2020 FY 2021
Actual Actual Actual Actual Target Actual
Performance – – – N/A
Develop data sharing
procedures and technology
interface. Enable a non-production proof of concept
that will inform the FAFSA solution
Developed FAFSA &
TPD Simulators, and the FA-
DDX interface connection with the IRS
Performance Result – – – N/A Met
Note: Data not available prior to FY 2020. Metric Definition: The FUTURE Act was enacted on Dec. 19, 2019. This law allows the IRS to disclose certain federal tax information to the Department for the purposes of providing recertification of income for income-contingent or income-based repayments of student loans; determining discharges of loans based on TPD; and determining the amount of student financial aid under the HEA. The implementation of the FUTURE Act requires numerous systems changes and security upgrades in FSA to comply with both IRS security requirements and the provisions of the Act itself. FSA is working closely with more than 100 stakeholders and 15 offices from the Department, the IRS, and Treasury to implement the FUTURE Act. Data Source: N/A FY 2021 Period of Performance: October 2020 through September 2021.
114 Fiscal Year 2021 Annual Report | Federal Student Aid
Annual Performance Report
Strategic Objective 5.3
Leverage portfolio analytics to drive improved outcomes for customers and taxpayers.
Overview
The purpose of this objective is to highlight FSA’s focus on providing data-driven analytics to support borrower decision-making and to demonstrate how targeted engagement can improve outcomes when interventions become necessary. Even with most of the student loan portfolio being in administrative forbearance, the Default Risk at Application model and Third-Party Debt Relief (TPDR) fraud interventions have been in operations throughout FY 2021. The Origination & Disbursement Default Risk model and “always-on” email campaign began operations in summer 2021. “Always-on” means the interventions are event-driven, such as at the point of FAFSA submission, a disbursement made, or a missed payment, and subsequently automated. This differs from a normal system notification (“We’ve received your FAFSA”). The intention in the development of the analytical models reflected under this objective is to assist FSA in offering proactive support and interventions to help improve overall student loan repayment, at different intervals within the student aid lifecycle (from initial borrower to repayment).
The usage of data analytics and risk modeling allows FSA to track customer trends more carefully to better improve its ability to understand customer challenges. Due to the current state of the portfolio as well as ongoing legal challenges to systematic telephone outreach to borrowers, FSA understands it must evaluate and strengthen the customer treatments that result from its analytics process. In addition, FSA must measure the effectiveness of the emails sent to borrowers and improve them based on customer needs. In this area, it is also necessary to continue to be innovative in communication by building out alternative methods such as text messages and push notifications to reach borrowers.
The COVID-19 emergency and the CARES Act’s relief benefits to borrowers with Department-managed loans have significantly impacted results for several performance metrics under this objective throughout FY 2021. Nearly all non-defaulted Direct Loans in active repayment as of the end of September 2021 are current (on time or less than 31 days delinquent). New loans have been originated as well since March 2020. Loans that leave the grace period during the COVID-19 emergency quickly move to forbearance after entering repayment; similarly, loans that re-enter active repayment during the pandemic from an in-school deferment then move to forbearance. Currently, approximately a half-million borrowers have asked that the servicer move their loans out of forbearance and into repayment; the servicer moves these loans back to forbearance should they then become delinquent. However, borrower payments from Department-serviced borrowers during the pandemic have been received from those borrowers who are in forbearance. Additionally, some borrowers are consolidating their loans during this period. These consolidated loans enter repayment within a month and then shift into mandatory administrative forbearance.
FSA has developed a detailed communications plan to remind borrowers of their obligation to resume payments. The organization is also working with oversight agencies and loan servicers to implement strategies to monitor the progress in returning loans into repayment and keeping them there after the administrative forbearance period ends.
Fiscal Year 2021 Annual Report | Federal Student Aid 115
Annual Performance Report
FY 2021 Performance Summary and Analysis
There are four performance metrics for this strategic objective. One metric met its annual target. Three metrics did not generate representative results due to the COVID-19 emergency. Two of these metrics, Default Rate by borrower count and Percent of Recipients > 90 days delinquent, are at 0% because they focus on Active Repayment. While these two metrics showed five and seven years of improvement prior to the pandemic, they will need to undergo a baseline assessment during FY 2022 and/or FY 2023, to enable FSA to set targets for future years. The third impacted metric, Percentage of borrowers who did not make the first three payments, was a new measure in the FY 2020–24 Strategic Plan. While this measure showed promising trends historically for the three years prior to the pandemic, it has never been baselined and thus will need to undergo similar steps to develop annual targets.
Key Successes and Opportunities
At different stages of the student aid lifecycle, such as application, disbursement, and repayment, different types of interventions are beneficial. In FY 2021, there are several examples where FSA has used analytics to positively impact borrowers:
• The TPDR technical proof of concept prevented borrowers from signing over their accounts to TPDR firms, or at minimum allowed the loan servicer to confirm these actions were being made at the borrower’s request.
• FSA has developed an always-on email campaign to mitigate delinquency when borrowers in forbearance return to repayment. The campaign is entitled TEDI. TEDI will communicate with borrowers when they miss payments and will send positive feedback to high-risk borrowers when they make payments as well.
• In utilizing the Default at Risk Application model, FSA has contacted 5.7 million applicants through email. The email open rate is approximately 51%, and the click-through rate is about 4%. This includes both always-on and notification interventions.
• The Default at Risk Origination and Disbursement model has assisted FSA in communicating to 1.9 million borrowers since going live over the summer. The email open rate is approximately 36%, and the click-through rate is about 4%. This includes both always-on and notification interventions.
In FY 2022, as customers move through the student aid lifecycle, additional data will become available to use for analytics. The models will subsequently be refined over time by their experience in operations. In addition, across the organization, the Enterprise Data Office subject matter experts will partner with internal stakeholders to finalize return to repayment and TEDI. This coordination will allow the team members to make any changes required by upcoming policy decisions.
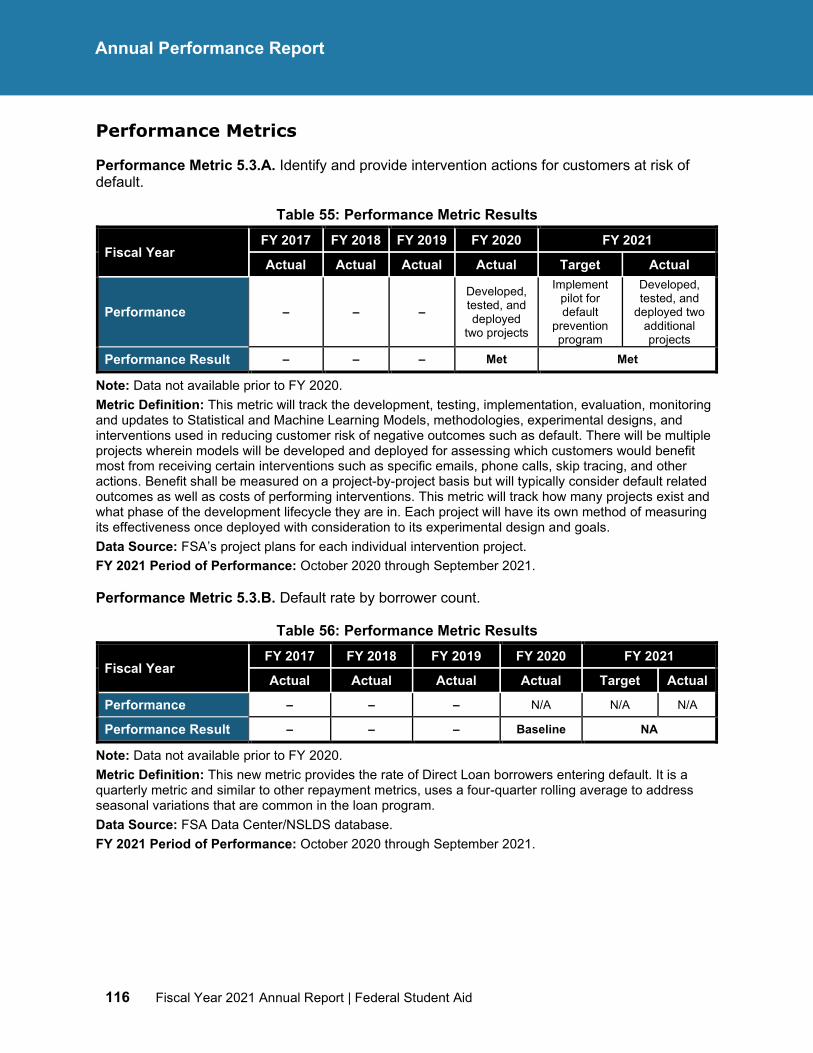
116 Fiscal Year 2021 Annual Report | Federal Student Aid
Annual Performance Report
Performance Metrics
Performance Metric 5.3.A. Identify and provide intervention actions for customers at risk of default.
Table 55: Performance Metric Results
Fiscal Year FY 2017 FY 2018 FY 2019 FY 2020 FY 2021
Actual Actual Actual Actual Target Actual
Performance – – – Developed, tested, and deployed
two projects
Implement pilot for default
prevention program
Developed, tested, and
deployed two additional projects
Performance Result – – – Met Met
Note: Data not available prior to FY 2020. Metric Definition: This metric will track the development, testing, implementation, evaluation, monitoring and updates to Statistical and Machine Learning Models, methodologies, experimental designs, and interventions used in reducing customer risk of negative outcomes such as default. There will be multiple projects wherein models will be developed and deployed for assessing which customers would benefit most from receiving certain interventions such as specific emails, phone calls, skip tracing, and other actions. Benefit shall be measured on a project-by-project basis but will typically consider default related outcomes as well as costs of performing interventions. This metric will track how many projects exist and what phase of the development lifecycle they are in. Each project will have its own method of measuring its effectiveness once deployed with consideration to its experimental design and goals. Data Source: FSA’s project plans for each individual intervention project. FY 2021 Period of Performance: October 2020 through September 2021.
Performance Metric 5.3.B. Default rate by borrower count.
Table 56: Performance Metric Results
Fiscal Year FY 2017 FY 2018 FY 2019 FY 2020 FY 2021
Actual Actual Actual Actual Target Actual
Performance – – – N/A N/A N/A
Performance Result – – – Baseline NA
Note: Data not available prior to FY 2020. Metric Definition: This new metric provides the rate of Direct Loan borrowers entering default. It is a quarterly metric and similar to other repayment metrics, uses a four-quarter rolling average to address seasonal variations that are common in the loan program. Data Source: FSA Data Center/NSLDS database. FY 2021 Period of Performance: October 2020 through September 2021.
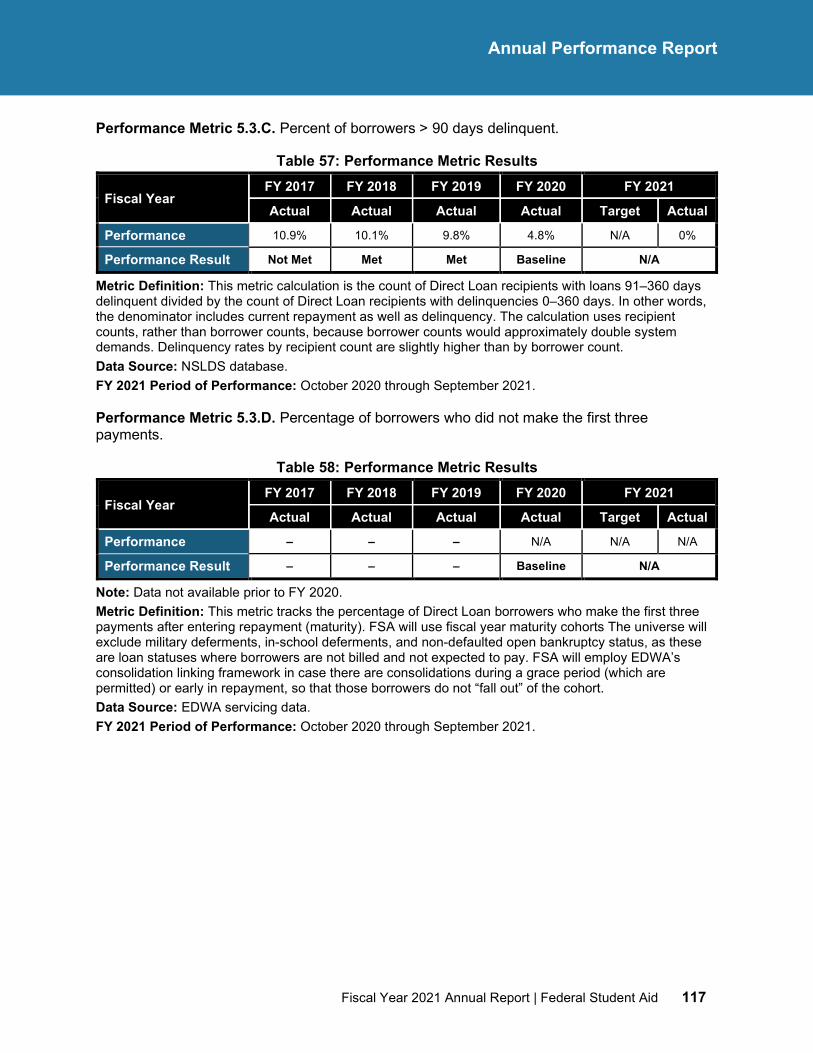
Fiscal Year 2021 Annual Report | Federal Student Aid 117
Annual Performance Report
Performance Metric 5.3.C. Percent of borrowers > 90 days delinquent.
Table 57: Performance Metric Results
Fiscal Year FY 2017 FY 2018 FY 2019 FY 2020 FY 2021
Actual Actual Actual Actual Target Actual
Performance 10.9% 10.1% 9.8% 4.8% N/A 0%
Performance Result Not Met Met Met Baseline N/A
Metric Definition: This metric calculation is the count of Direct Loan recipients with loans 91–360 days delinquent divided by the count of Direct Loan recipients with delinquencies 0–360 days. In other words, the denominator includes current repayment as well as delinquency. The calculation uses recipient counts, rather than borrower counts, because borrower counts would approximately double system demands. Delinquency rates by recipient count are slightly higher than by borrower count. Data Source: NSLDS database. FY 2021 Period of Performance: October 2020 through September 2021.
Performance Metric 5.3.D. Percentage of borrowers who did not make the first three payments.
Table 58: Performance Metric Results
Fiscal Year FY 2017 FY 2018 FY 2019 FY 2020 FY 2021
Actual Actual Actual Actual Target Actual
Performance – – – N/A N/A N/A
Performance Result – – – Baseline N/A
Note: Data not available prior to FY 2020. Metric Definition: This metric tracks the percentage of Direct Loan borrowers who make the first three payments after entering repayment (maturity). FSA will use fiscal year maturity cohorts The universe will exclude military deferments, in-school deferments, and non-defaulted open bankruptcy status, as these are loan statuses where borrowers are not billed and not expected to pay. FSA will employ EDWA’s consolidation linking framework in case there are consolidations during a grace period (which are permitted) or early in repayment, so that those borrowers do not “fall out” of the cohort. Data Source: EDWA servicing data. FY 2021 Period of Performance: October 2020 through September 2021.
118 Fiscal Year 2021 Annual Report | Federal Student Aid
Annual Performance Report
Strategic Objective 5.4
Increase vendor performance through quality management activities centered on customer service and product delivery.
Overview
FSA relies on a multitude of contracts and thousands of contract staff in its delivery of financial aid. Internal reviews and examinations provide a level of oversight which allows FSA to assess the performance of vendors, including loan servicers; track and monitor corrective actions; and serve as a reliable source to hold vendors accountable for substandard performance. In FY 2021, FSA has continued to monitor vendor performance through a stronger focus on key performance indicators and service level agreement metrics aimed at delivering more effective outcomes for students and greater value to taxpayers. Additionally, FSA has restructured how it identifies and enforces contract specifications when vendors need to improve on the delivery of services necessary to meet the outcomes for customers and taxpayers.
The objective is supported by the reviews and examinations performed by the Operational Improvement and Oversight (OIO) Directorate and the Vendor Oversight Group (VOG). OIO and VOG have worked in a collaborative manner throughout FY 2021 to progress towards the annual target at the end of the fiscal year. This effort led to a revision of the performance metric established under this objective to include:
• Broadening of the assessment category to include loan servicers and all vendors for potential review and examination
• Analysis of major indicators for compliance and customer service
• Tracking the percentage of contractually required performance metrics and industry standards for customer facing vendors
FSA aspires to drive more accountability within contract management when vendors fail to deliver the necessary outcomes for customers and taxpayers. The revised approach to vendor performance and quality management put forward in FY 2021 will improve transparency and collaboration within the organization which contributes to better outcomes for students and taxpayers.
FY 2021 Performance Summary and Analysis
There is one performance measure for this strategic objective. In FY 2021, VOG conducted six reviews of loan servicers which included analysis of how they managed specific tasks (e.g., transferring loans to another servicer) or the implementation of CARES Act provisions. This metric exceeded the annual metric target of three reviews to be completed. All six reviews are in the process of completing their final reports.
Key Successes and Opportunities
To successfully broaden and accomplish the objective, the collaborative oversight teams worked internally to gain knowledge into key FSA programs and processes assessed during their reviews. Within this process, the teams developed interview and research protocols to
Fiscal Year 2021 Annual Report | Federal Student Aid 119
Annual Performance Report
gauge performance both within FSA and the impact through external partners. Seven reviews of FSA programs were completed in FY 2021, offering more than 50 recommendations for improvements. Based on the success of this method of internal program review, OIO and VOG have developed a coordinated FY 2022 Work Plan which includes specific focus areas to be addressed. Based on the Work Plan, reviews will be conducted for the following focus areas:
• FSA’s acquisition processes
• Borrower’s return to repayment implementation process
• FSA system and access control processes
• Human resources process, practices, and procedures
• The assessment of the BPO
By establishing the aforementioned focus areas, FSA aims to hold itself accountable for delivering on its goals and fulfilling the obligations of its PBO distinction.
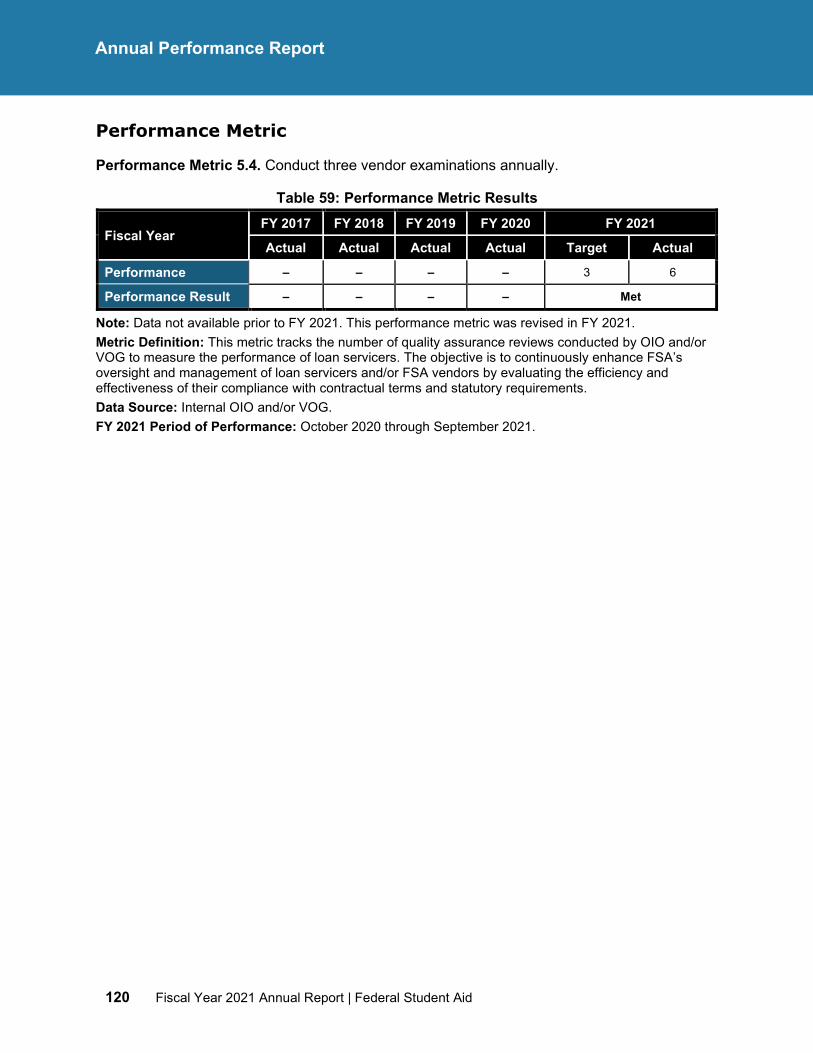
120 Fiscal Year 2021 Annual Report | Federal Student Aid
Annual Performance Report
Performance Metric
Performance Metric 5.4. Conduct three vendor examinations annually.
Table 59: Performance Metric Results
Fiscal Year FY 2017 FY 2018 FY 2019 FY 2020 FY 2021
Actual Actual Actual Actual Target Actual
Performance – – – – 3 6
Performance Result – – – – Met
Note: Data not available prior to FY 2021. This performance metric was revised in FY 2021. Metric Definition: This metric tracks the number of quality assurance reviews conducted by OIO and/or VOG to measure the performance of loan servicers. The objective is to continuously enhance FSA’s oversight and management of loan servicers and/or FSA vendors by evaluating the efficiency and effectiveness of their compliance with contractual terms and statutory requirements. Data Source: Internal OIO and/or VOG. FY 2021 Period of Performance: October 2020 through September 2021.
Fiscal Year 2021 Annual Report | Federal Student Aid 121
Fiscal Year 2021 Accomplishments of Federal Student Aid
Fiscal Year 2021 Accomplishments of Federal Student Aid
During FY 2021, FSA realized additional accomplishments that were not measured specifically by the performance metrics implemented to measure performance against the FY 2020–24 Strategic Plan. Although not measured by FSA performance metrics, these accomplishments are the result of initiatives FSA undertook to support the implementation of the strategic plan or legislative changes. This section describes FSA’s additional accomplishments.
FSA realized the following additional accomplishments in support of Strategic Goal 1: Empower a High-Performing Organization.
• FSA Management Services implemented a remote New Hire Orientation during the COVID-19 national emergency, for both internal and external hires, to acquire a comprehensive understanding of the mission, strategic initiatives, and collaborative culture of FSA. Changes to the program have included providing Train-the-Trainer sessions for presenters, an enhanced new employee resource portal, and efforts to increase new employee awareness of Title IV programs and systems. These efforts have resulted in a 93% satisfaction rate for the program.
• FSA Strategic Communications improved internal staff messaging by using feedback from employee and manager communication working groups. The improvements were illustrated through updates within The Source employee newsletter, a daily email series, and the “Week Ahead” communications, which improved staff experience on the Employee Share Library and FSA Landing Page during the COVID-19 emergency telework period.
• Facilities, Security, and Emergency Management (FSEM) instituted enhanced cleaning procedures for all high touch points in the building, in accordance with CDC guidelines to ensure the security and safety of FSA employees during the ongoing COVID-19 national emergency. In coordination with the General Services Administration and building management, FSEM installed new hand sanitation stations, along with new signage throughout the buildings, reminding employees of social distancing and mask wearing requirements.
• FSEM created an enhanced procedure for staff entering and exiting the building, by requiring check in/out at the front security desk. This information becomes very important for COVID-19 contact tracing procedures.
• FSEM developed and refined business processes for vetting contractors that resulted in processing 80% or more cases within 14 days or less, averaging 10 days or less for scheduling investigations in the third and fourth quarters of FY 2021, and decreasing submission quality rates to less than 2%, surpassing the government average of 2% and eliminating rework by FSA and the contractors. All activities enabled timely onboarding for contractor personnel to support the FSA mission and service for borrowers.
122 Fiscal Year 2021 Annual Report | Federal Student Aid
Fiscal Year 2021 Accomplishments of Federal Student Aid
FSA realized the following additional accomplishments in support of Strategic Goal 2: Provide World-Class Customer Experience to the Students, Parents, and Borrowers We Serve.
• By February 2021, FSA ensured all loan servicers were compliant with branding efforts, transitioning from a loan servicer-branded design to a light touch FSA co-branded loan servicing model in alignment with Next Gen initiatives and in support of borrower conversions.
• FSA created the FSA Electronic Questionnaires for Investigations Processing (e-QIP) platform to better track and monitor FSA contractor requests. All loan-servicing contractors were successfully migrated to the new e-QIP platform in three phases. Comprehensive training materials and multiple training sessions were provided for 119 contractor staff initiators and approximately 50 FSA Contracting Officer’s Representatives. This migration has greatly improved FSA’s ability to anticipate and manage inbound workload, shift priorities as necessary for peaks, and increase vendor accountability during the contractor vetting process.
• FSA administered the shutdown of CornerStone, a federal loan servicer since January 2012. Approximately 1.1 million borrowers were successfully relocated to another servicer with minimal borrower impact or complaints.
• In July 2021, it was announced that FSA would begin waiving verification of most FAFSA Institutional Student Information Record information, with very limited exceptions, in view of challenges and barriers resulting from the ongoing national emergency produced by the pandemic. This positive development helps ensure students have the most straightforward path to getting the financial aid they need to pursue further education by providing over 2 million FAFSA filers relief from verification.
FSA realized the following additional accomplishments in support of Strategic Goal 3: Increase Partner Engagement and Oversight Effectiveness.
• PPO’s managed-systems supported the award of more than $120 billion in federal student aid during the 2019–20 award year.
• In July 2021, the Department announced that it will further expand access to higher education in prisons by inviting new schools to participate in the Second Chance Pell experiment, which invests in students who are incarcerated by allowing approved schools to support those students through Federal Pell Grant funds. By inviting more schools to participate, the Department will allow up to 200 two- and four-year colleges and universities to offer prison-education programs through the Second Chance Pell experiment. FSA will assist in the administration of this program.
• During FY 2021, Partner Eligibility and Oversight Services (PEOS) Directorate supported the fulfillment of more than 120 Freedom of Information Act (FOIA) requests with a greater than 99% on-time fulfillment rate, and PEOS also provided responses to approximately 80 control mail responses to inquiries submitted to senior Department officials by the public and by members of Congress.
• The PEOS Performance Management Group released the FY 2022 National Standards for the five core business processes including Financial Analysis, Compliance Audit Resolution, Program Review, Eligibility, and Method of Payment. Additionally, the Performance Management Group resolved more than 340 internal Operational Support
Fiscal Year 2021 Annual Report | Federal Student Aid 123
Fiscal Year 2021 Accomplishments of Federal Student Aid
Branch Action Requests; answered 145 technical questions from the field which led to 24 accepted recommendations for procedural updates; processed more than 230 Financial Responsibility Notifications submitted; and more than 360 Letter of Credit documents submitted on behalf of institutions of higher education.
• PPO provided ongoing support, information, technical assistance, and other resources to students, institutions, and borrowers impacted by an upsurge of natural disasters across the southern and midwestern states, California, and the East Coast, including proactive communications before the disasters struck and communications following the disaster; technical and operational assistance; regulatory and administrative relief and reporting flexibilities. PPO issued over 8,000 emails to aid in the recovery efforts of over 4,000 institutions, enrolling more than 3 million students.
• The MSURSD provides technical assistance and training to MSIs. This year based on a statistical analysis of MSIs and a predetermined set of data (compliance) points, the MSURSD group was able to lower the number of MSIs with severe compliance issues to the lowest number (22 out of 823 schools) in nine years.
• MSURSD prepared and conducted a Spring/Summer Workshop series for MSIs that addressed the top ten audit findings and institutional compliance with Title IV regulations. FSA had 2,734 participants for the workshop series.
• PPO successfully calculated and released the FY 2018 Draft and Official Cohort Default Rates (CDRs) in September 2021 for guaranty agencies, lenders, and nearly 6,000 IHEs. CDRs serve as a valuable compliance tool for FSA to assess school participation in the Direct Loan and Federal Pell Grant Programs. Publication of the CDRs further allows schools to submit appeals for various factors and adjustments to their CDRs, for which FSA also successfully adjudicated more than 90 CDR appeals this fiscal year.
FSA realized the following additional accomplishments in support of Strategic Goal 4: Strengthen Data Protection and Cybersecurity Safeguards.
• Migrated the NSLDS mainframe data to a new platform, resulting in improved functionality and system security.
• Awarded two cybersecurity blanket purchase agreement call orders for more than $108 million to ensure continuity of mission-critical cybersecurity support for FSA.
• Delivered and implemented the Correspondence Management System, and a Clery Act Tracking System version 1.3 to support institutional compliance.
• Streamlined former Information Resource Program Elements and developed new IT Contract Requirements, reducing the administrative burden and providing a streamlined set of requirements for completing IT Contract procurements for the enterprise.
FSA realized the following additional accomplishments in support of Strategic Goal 5: Enhance the Management and Transparency of the Portfolio.
• Implemented Enterprise-wide Data Management and Analytics Platform Services which provides FSA with master data management and, during FY 2022, will integrate the data warehouse with a reengineered NSLDS database plus a state-of-the-art data lake.
124 Fiscal Year 2021 Annual Report | Federal Student Aid
Fiscal Year 2021 Accomplishments of Federal Student Aid
• Worked with various FSA stakeholders and subject matter experts to draft a Borrower Awareness Toolkit and assist in the development of a Public Service Announcement TPDR video. Developed processes to manage over 2,700 TPDR companies and assigned over 80 companies for research and analysis.
• Drafted Suspicious Activity Report to streamline the review of TPDR companies and referral to enforcement agencies and completed 83 reports on TPDR companies for alleged fraudulent activity.
• Awarded multiple contracts to begin the development of the applications and infrastructure that will manage and store FTI. These contracts include systems and applications that will leverage FTI to perform analyses, forecasts, and process improvements related to the IDR, FAFSA, and TPD programs.
• Successfully removed the Subsidized Usage Limit Applies (SULA) requirement, pursuant to changes in the FAFSA Simplification Act. This removal provides future students the benefits of not having to consider the potential loss of subsidized interest choices when making course decisions. The removal of SULA will benefit institutions by reducing paperwork burden by an estimated 12,904 hours, saving $1.2 million of wages at a rate of $93.74 per hour, representing the $46.87 median hourly wage for postsecondary administrators doubled to capture benefits and overhead.
• Established a bi-weekly Safeguards IRS meeting to increase communication efforts between FSA and the IRS. This forum is used to resolve questions, clarify Publication 1075 safeguards requirements, and strengthen the relationship between FSA and the IRS.
• Supported the Department’s Small Business Utilization goal of 14% by contributing more than 9% in eligible dollars spent through contract acquisition with small businesses. The FSA Acquisitions Team consisting of Contracting Officers, Business Unit’s Program Managers and Subject Matter Experts are actively partnering with the Department’s Office of Small and Disadvantaged Business Utilization to track all small business opportunities and continue to contribute to this effort in FY 2022.
• Received 367 new FOIA requests and closed 368 requests and received 1,252 new Privacy Act requests and closed 1,096 requests.
Fiscal Year 2021 Annual Report | Federal Student Aid 125
Additional Reporting Requirements
Additional Required Reporting (Unaudited)
126 Fiscal Year 2021 Annual Report | Federal Student Aid
Additional Required Reporting
This page is intentionally left blank
Fiscal Year 2021 Annual Report | Federal Student Aid 127
Additional Reporting Requirements
Overview of Additional Required Reporting
Additional Required Reporting includes the additional reporting requirements mandated by the HEA. These reports, specifically required in to be included in the Annual Report are listed below.
• Legislative and Regulatory Recommendations: This report details legislative and regulatory recommendations that FSA provided to the Department in support of the Department’s regulatory activities.
• Annual Bonus Awards: This report discusses executive compensation at FSA in compliance with the legislative requirements under the PBO legislation that created FSA.
• Report of the Federal Student Aid Ombudsman: The report discusses the FSA Ombudsman’s activities in accomplishing its statutory mission of addressing complaints about Title IV financial aid programs.
128 Fiscal Year 2021 Annual Report | Federal Student Aid
Additional Required Reporting
Legislative and Regulatory Recommendations
One of FSA’s mission responsibilities under the law is to provide input on legislative proposals from Congress and from the Administration and to support the Department’s regulatory activity. FSA also may suggest legislative or regulatory changes for consideration by the Department’s senior policy officials. These recommendations customarily center on improving and simplifying the Title IV federal student assistance programs for FSA customers, minimizing administrative costs, and improving program integrity. FSA’s recommendations inform the Department’s policymaking process, including its activities and decisions related to each year’s budget process. FSA provides this input and recommendations by direct contact with colleagues in the various policy offices within the Department, including the Office of the Under Secretary, the Office of Postsecondary Education, and the Office of Planning, Evaluation and Policy Development at both the senior policy level and at the staff level. During the past year, FSA provided specific recommendations to policy officials on several issues, including:
• Developing guidance and providing regulatory flexibility and relief for the purpose of assisting students, borrowers, institutions of higher education, and others affected by natural disasters, including the COVID-19 pandemic and the CARES Act,
• Interpreting the provisions of the Consolidated Appropriations Act, 2021, which makes significant changes to the requirements for completing the FAFSA®; determining a student’s eligibility for federal student aid; and calculating Federal Pell Grants,
• Interpreting the provisions of the Stop Student Debt Relief Scams (STOP) Act,
• Ending the prohibition on Federal Pell Grants for students incarcerated in federal and state penal institutions and developing regulations for the Department’s and states’ approval of prison education programs, and
• Supporting the Department’s negotiated rulemaking efforts related to closed school discharges and discharges for TPD; PSLF; income contingent repayment; and borrower defense to repayment.
Fiscal Year 2021 Annual Report | Federal Student Aid 129
Report of the Federal Student Aid Ombudsman
Annual Bonus Awards
As required by the HEA, the Annual Report includes performance ratings and related awards for FSA senior managers and Senior Executive Service (SES) staff. Included in this section are the number of senior managers and SES staff on board as of the end of FY 2021. However, because FY 2021 performance results were not finalized at the time this report was prepared, the section discusses FY 2020 performance results.
At the end of FY 2021, there were 118 FSA senior managers and 3 SES members. The FSA Executive Committee contained 13 of the 118 senior managers and 1 SES member. As members of the FSA Executive Committee, these senior managers reported directly to the COO. The remaining 105 senior managers and 2 SES staff served in a variety of senior positions and capacities within FSA.
The following section discusses FY 2020 performance results.
For performance year 2020, the COO received a rating of Exceptional Results and a performance bonus of $59,190 for his work at FSA.
There were also FY 2020 performance ratings and awards for five senior managers who were members of the FSA Executive Committee. The composition of those rated included: four senior managers achieved a performance rating of Exceptional Results; and one achieved a performance rating of High Results. The composition of ratings for the five SES members not on the FSA Executive Committee were as follows: one SES member achieved a performance rating of Exceptional Results, three SES members achieved a performance rating of High Results, and one SES member was not eligible to receive a performance rating.
Award amounts for the FSA Executive Committee ranged from approximately $15,000 to $25,000, depending on the performance rating of each individual. Only individuals with performance ratings of High Results Achieved or Exceptional Results achieved were eligible for performance-based awards.
The composition of ratings for the 97 senior managers who did not serve on the FSA Executive Committee last year were as follows: 50 senior managers achieved a performance rating of Exceptional Results; 41 achieved a performance rating of High Results; and 6 achieved a performance rating of Results Achieved.
Award amounts for those senior managers achieving an Exceptional Results rating ranged from $3,579 to $15,000 with a median award of $8,241. Award amounts for those achieving a High Results rating ranged from $1,034 to $9,500 with a median award of $5,352.
For additional information, please refer to: Higher Education Amendments 1998/sec141
Report of the Federal Student Aid Ombudsman
130 Fiscal Year 2021 Annual Report | Federal Student Aid
Report of the Federal Student Aid Ombudsman
Established by the HEA, the Ombudsman began operations on Sept. 30, 1999. The Ombudsman is responsible for resolving complaints regarding Title IV financial aid programs. Pursuant to the HEA, the Ombudsman compiles and analyzes data on borrower complaints and makes appropriate recommendations. Additionally, the Ombudsman is required to describe the activities and evaluate the effectiveness of the role during the preceding year.
The Ombudsman Group oversees all cases received by FSA through its Feedback Center, as well as complaints referred by Members of Congress, the Department, the Consumer Financial Protection Bureau, and other stakeholders. The Ombudsman Group uses a collaborative approach in working with institutions of higher education, lenders, guaranty agencies, loan servicers, and other participants in the student loan programs to resolve issues in accordance with applicable law.
Summary of All Cases Received in Fiscal Year 2021
The primary method by which students, student loan borrowers, and other users submit complaints or raise issues to FSA is through its Feedback Center.15 Feedback Center submissions include general inquiries, complaints, allegations of suspicious activity, disputes, and positive feedback, collectively referred to as “cases.”16 During FY 2021, FSA received 46,497 cases. Case types are defined as follows:
General Inquiry Cases involving general federal student aid questions .
Complaint Cases in which there is an expression of dissatisfaction with the federal financial aid experience.
Suspicious Activity Cases alleging suspected fraud during the federal financial aid process.
Disputes Cases handled directly by the Ombudsman Group.
Positive Feedback Cases providing compliments about Title IV programs, program participants, FSA staff, and/or FSA vendors.
15 U.S. Department of Education, FSA, Feedback Center, https://studentaid.gov/feedback-center/ (last accessed Oct. 4, 2021). 16 FSA’s Feedback Center was launched in July 2016 in response to President Obama’s Student Aid Bill of Rights. See Memorandum on a Student Aid Bill of Rights to Help Ensure Affordable Student Loan Repayment, 2015 Daily Comp. Pres. Doc. 3 (March 10, 2015), https://www.govinfo.gov/content/pkg/DCPD-201500165/pdf/DCPD-201500165.pdf.
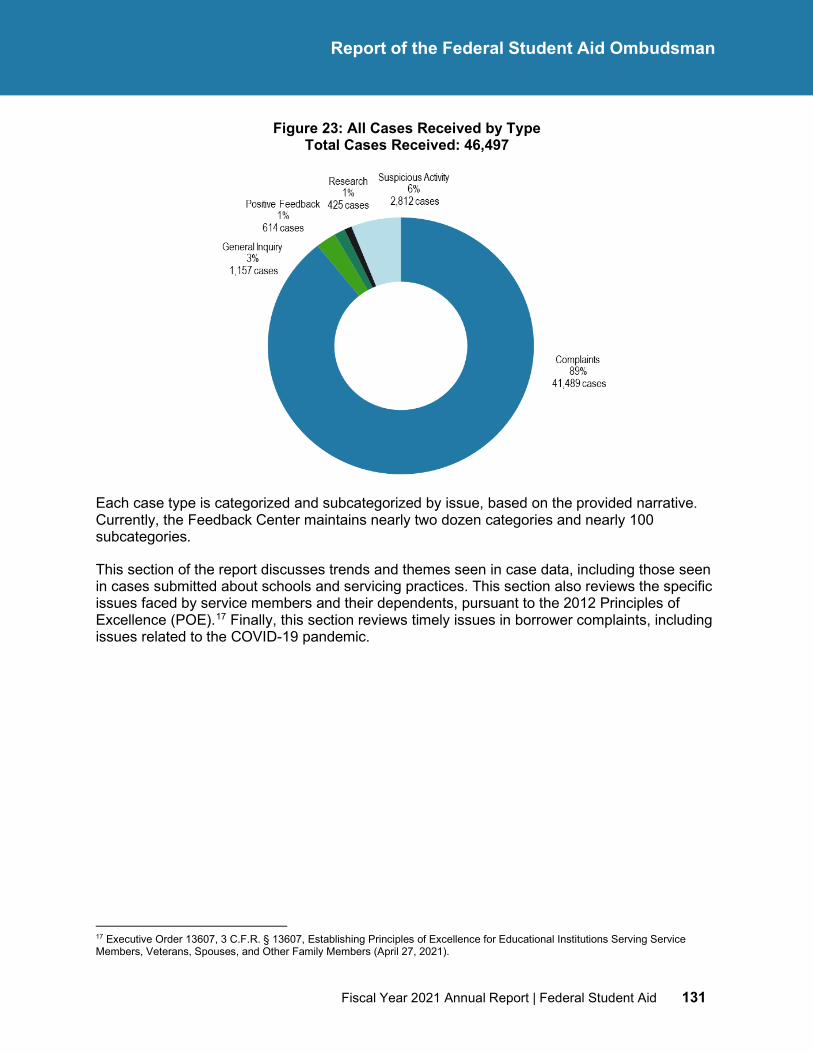
Report of the Federal Student Aid Ombudsman
Fiscal Year 2021 Annual Report | Federal Student Aid 131
Figure 23: All Cases Received by Type Total Cases Received: 46,497
Each case type is categorized and subcategorized by issue, based on the provided narrative. Currently, the Feedback Center maintains nearly two dozen categories and nearly 100 subcategories.
This section of the report discusses trends and themes seen in case data, including those seen in cases submitted about schools and servicing practices. This section also reviews the specific issues faced by service members and their dependents, pursuant to the 2012 Principles of Excellence (POE).17 Finally, this section reviews timely issues in borrower complaints, including issues related to the COVID-19 pandemic.
17 Executive Order 13607, 3 C.F.R. § 13607, Establishing Principles of Excellence for Educational Institutions Serving Service Members, Veterans, Spouses, and Other Family Members (April 27, 2021).
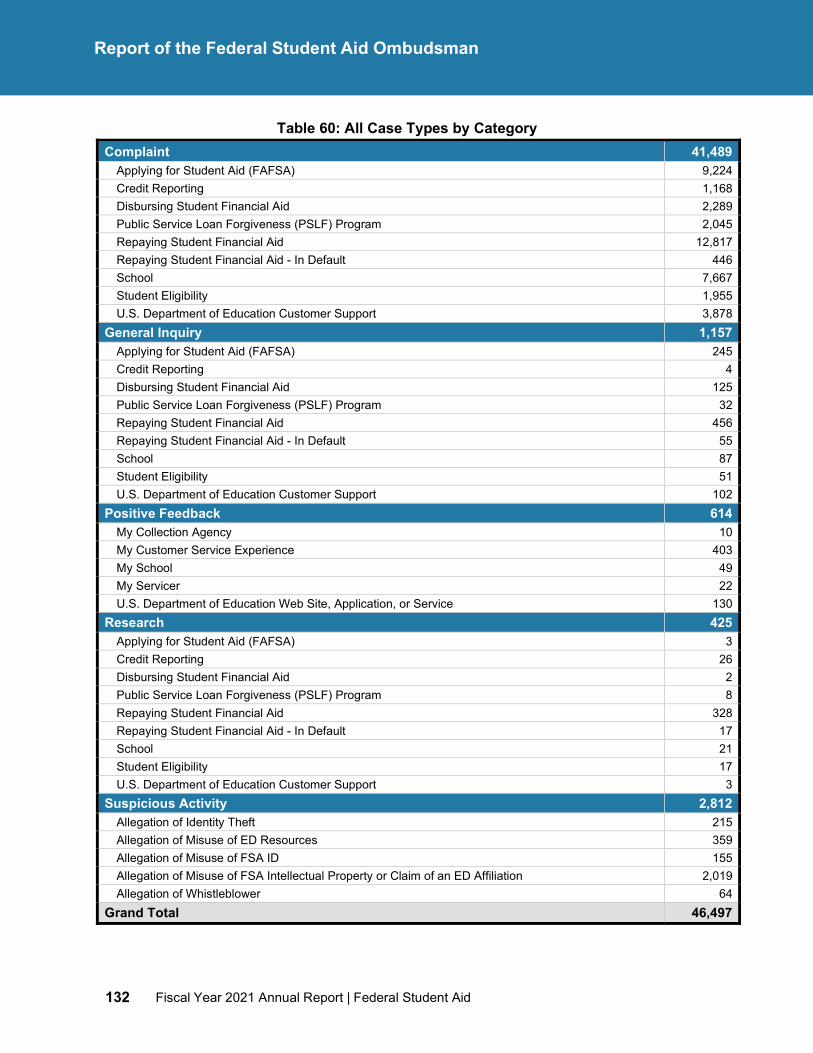
Report of the Federal Student Aid Ombudsman
132 Fiscal Year 2021 Annual Report | Federal Student Aid
Table 60: All Case Types by Category Complaint 41,489
Applying for Student Aid (FAFSA) 9,224 Credit Reporting 1,168 Disbursing Student Financial Aid 2,289 Public Service Loan Forgiveness (PSLF) Program 2,045 Repaying Student Financial Aid 12,817 Repaying Student Financial Aid - In Default 446 School 7,667 Student Eligibility 1,955 U.S. Department of Education Customer Support 3,878
General Inquiry 1,157 Applying for Student Aid (FAFSA) 245 Credit Reporting 4 Disbursing Student Financial Aid 125 Public Service Loan Forgiveness (PSLF) Program 32 Repaying Student Financial Aid 456 Repaying Student Financial Aid - In Default 55 School 87 Student Eligibility 51 U.S. Department of Education Customer Support 102
Positive Feedback 614 My Collection Agency 10 My Customer Service Experience 403 My School 49 My Servicer 22 U.S. Department of Education Web Site, Application, or Service 130
Research 425 Applying for Student Aid (FAFSA) 3 Credit Reporting 26 Disbursing Student Financial Aid 2 Public Service Loan Forgiveness (PSLF) Program 8 Repaying Student Financial Aid 328 Repaying Student Financial Aid - In Default 17 School 21 Student Eligibility 17 U.S. Department of Education Customer Support 3
Suspicious Activity 2,812 Allegation of Identity Theft 215 Allegation of Misuse of ED Resources 359 Allegation of Misuse of FSA ID 155 Allegation of Misuse of FSA Intellectual Property or Claim of an ED Affiliation 2,019 Allegation of Whistleblower 64
Grand Total 46,497
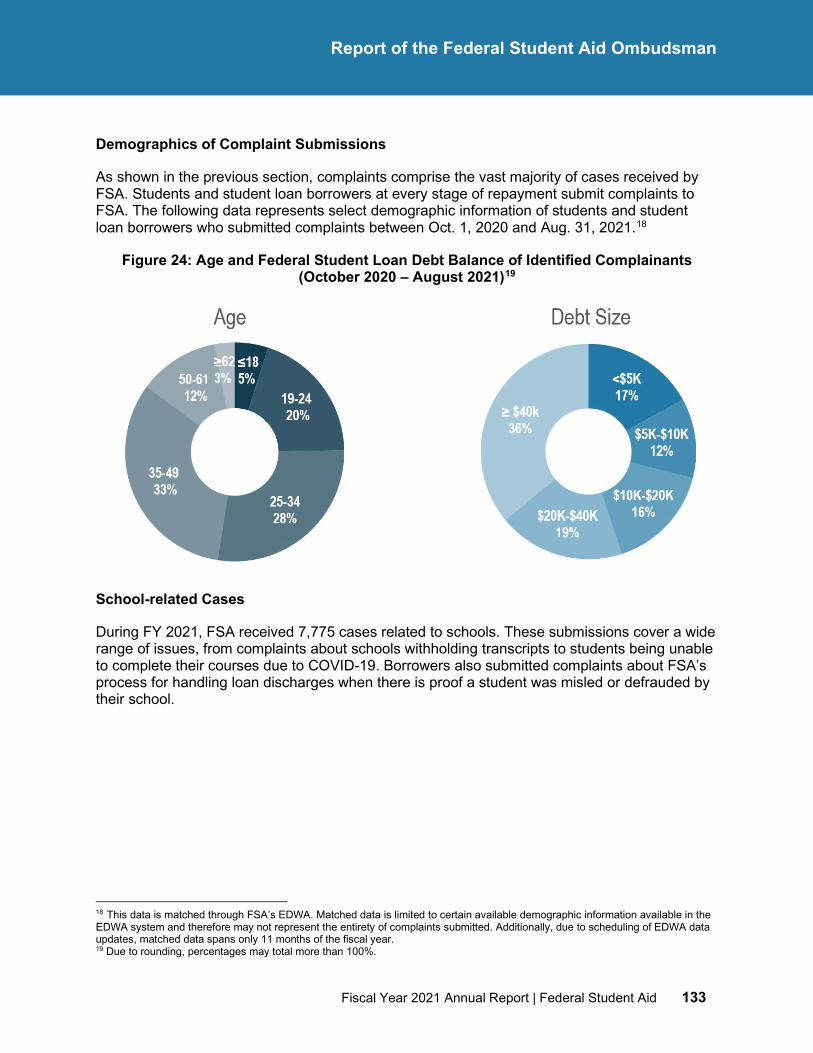
Fiscal Year 2021 Annual Report | Federal Student Aid 133
Report of the Federal Student Aid Ombudsman
Demographics of Complaint Submissions
As shown in the previous section, complaints comprise the vast majority of cases received by FSA. Students and student loan borrowers at every stage of repayment submit complaints to FSA. The following data represents select demographic information of students and student loan borrowers who submitted complaints between Oct. 1, 2020 and Aug. 31, 2021.18
Figure 24: Age and Federal Student Loan Debt Balance of Identified Complainants (October 2020 – August 2021)19
School-related Cases
During FY 2021, FSA received 7,775 cases related to schools. These submissions cover a wide range of issues, from complaints about schools withholding transcripts to students being unable to complete their courses due to COVID-19. Borrowers also submitted complaints about FSA’s process for handling loan discharges when there is proof a student was misled or defrauded by their school.
18 This data is matched through FSA’s EDWA. Matched data is limited to certain available demographic information available in the EDWA system and therefore may not represent the entirety of complaints submitted. Additionally, due to scheduling of EDWA data updates, matched data spans only 11 months of the fiscal year. 19 Due to rounding, percentages may total more than 100%.
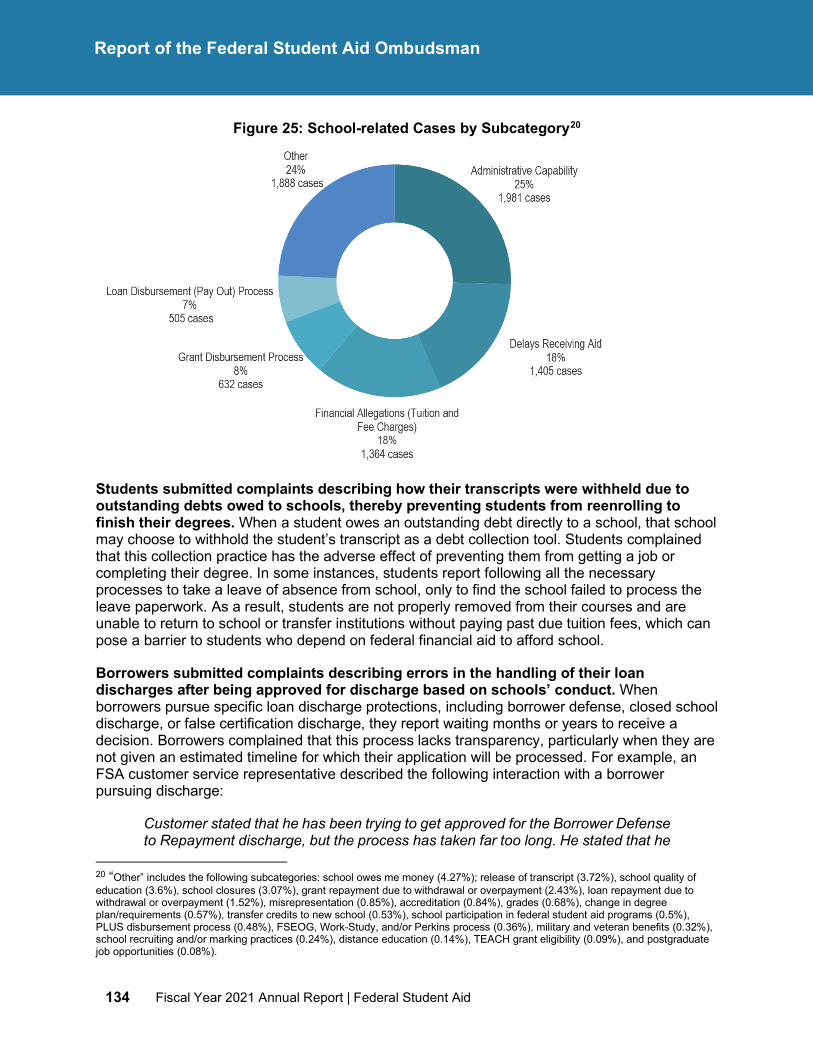
134 Fiscal Year 2021 Annual Report | Federal Student Aid
Report of the Federal Student Aid Ombudsman
Figure 25: School-related Cases by Subcategory20
Students submitted complaints describing how their transcripts were withheld due to outstanding debts owed to schools, thereby preventing students from reenrolling to finish their degrees. When a student owes an outstanding debt directly to a school, that school may choose to withhold the student’s transcript as a debt collection tool. Students complained that this collection practice has the adverse effect of preventing them from getting a job or completing their degree. In some instances, students report following all the necessary processes to take a leave of absence from school, only to find the school failed to process the leave paperwork. As a result, students are not properly removed from their courses and are unable to return to school or transfer institutions without paying past due tuition fees, which can pose a barrier to students who depend on federal financial aid to afford school.
Borrowers submitted complaints describing errors in the handling of their loan discharges after being approved for discharge based on schools’ conduct. When borrowers pursue specific loan discharge protections, including borrower defense, closed school discharge, or false certification discharge, they report waiting months or years to receive a decision. Borrowers complained that this process lacks transparency, particularly when they are not given an estimated timeline for which their application will be processed. For example, an FSA customer service representative described the following interaction with a borrower pursuing discharge:
Customer stated that he has been trying to get approved for the Borrower Defense to Repayment discharge, but the process has taken far too long. He stated that he
20 “Other” includes the following subcategories: school owes me money (4.27%); release of transcript (3.72%), school quality of education (3.6%), school closures (3.07%), grant repayment due to withdrawal or overpayment (2.43%), loan repayment due to withdrawal or overpayment (1.52%), misrepresentation (0.85%), accreditation (0.84%), grades (0.68%), change in degree plan/requirements (0.57%), transfer credits to new school (0.53%), school participation in federal student aid programs (0.5%), PLUS disbursement process (0.48%), FSEOG, Work-Study, and/or Perkins process (0.36%), military and veteran benefits (0.32%), school recruiting and/or marking practices (0.24%), distance education (0.14%), TEACH grant eligibility (0.09%), and postgraduate job opportunities (0.08%).
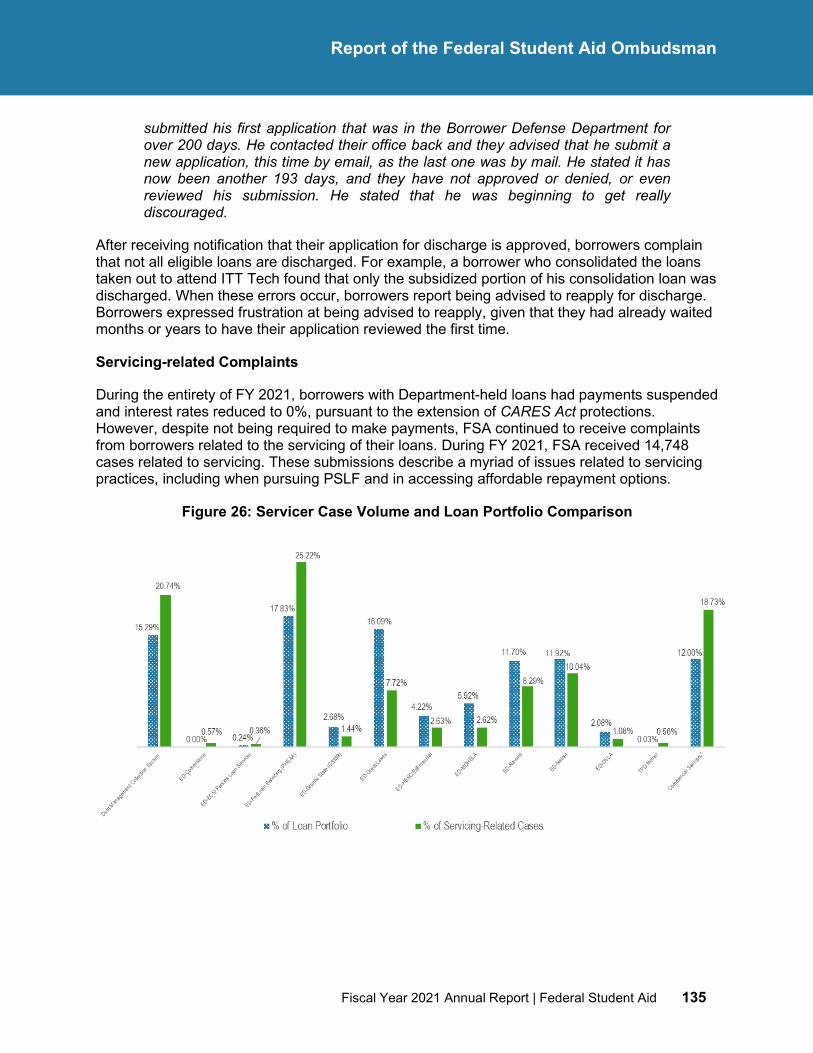
Fiscal Year 2021 Annual Report | Federal Student Aid 135
Report of the Federal Student Aid Ombudsman
submitted his first application that was in the Borrower Defense Department for over 200 days. He contacted their office back and they advised that he submit a new application, this time by email, as the last one was by mail. He stated it has now been another 193 days, and they have not approved or denied, or even reviewed his submission. He stated that he was beginning to get really discouraged.
After receiving notification that their application for discharge is approved, borrowers complain that not all eligible loans are discharged. For example, a borrower who consolidated the loans taken out to attend ITT Tech found that only the subsidized portion of his consolidation loan was discharged. When these errors occur, borrowers report being advised to reapply for discharge. Borrowers expressed frustration at being advised to reapply, given that they had already waited months or years to have their application reviewed the first time.
Servicing-related Complaints
During the entirety of FY 2021, borrowers with Department-held loans had payments suspended and interest rates reduced to 0%, pursuant to the extension of CARES Act protections. However, despite not being required to make payments, FSA continued to receive complaints from borrowers related to the servicing of their loans. During FY 2021, FSA received 14,748 cases related to servicing. These submissions describe a myriad of issues related to servicing practices, including when pursuing PSLF and in accessing affordable repayment options.
Figure 26: Servicer Case Volume and Loan Portfolio Comparison
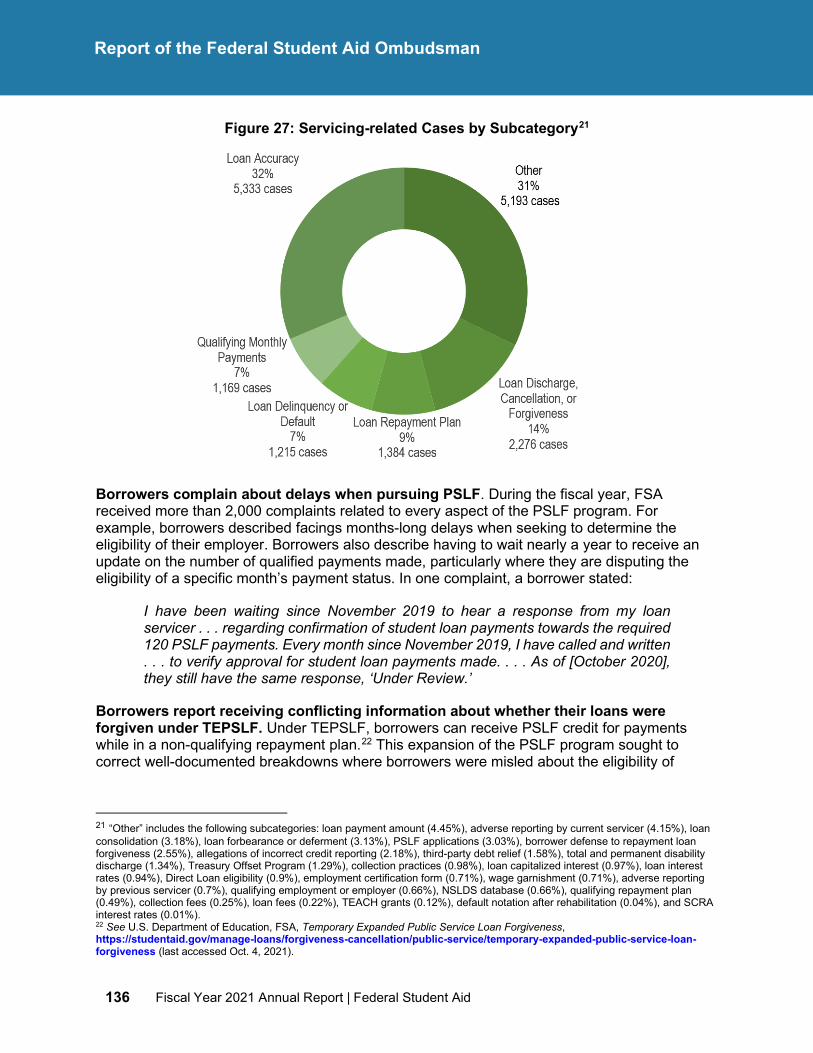
136 Fiscal Year 2021 Annual Report | Federal Student Aid
Report of the Federal Student Aid Ombudsman
Figure 27: Servicing-related Cases by Subcategory21
Borrowers complain about delays when pursuing PSLF. During the fiscal year, FSA received more than 2,000 complaints related to every aspect of the PSLF program. For example, borrowers described facings months-long delays when seeking to determine the eligibility of their employer. Borrowers also describe having to wait nearly a year to receive an update on the number of qualified payments made, particularly where they are disputing the eligibility of a specific month’s payment status. In one complaint, a borrower stated:
I have been waiting since November 2019 to hear a response from my loan servicer . . . regarding confirmation of student loan payments towards the required 120 PSLF payments. Every month since November 2019, I have called and written . . . to verify approval for student loan payments made. . . . As of [October 2020], they still have the same response, ‘Under Review.’
Borrowers report receiving conflicting information about whether their loans were forgiven under TEPSLF. Under TEPSLF, borrowers can receive PSLF credit for payments while in a non-qualifying repayment plan.22 This expansion of the PSLF program sought to correct well-documented breakdowns where borrowers were misled about the eligibility of
21 “Other” includes the following subcategories: loan payment amount (4.45%), adverse reporting by current servicer (4.15%), loan consolidation (3.18%), loan forbearance or deferment (3.13%), PSLF applications (3.03%), borrower defense to repayment loan forgiveness (2.55%), allegations of incorrect credit reporting (2.18%), third-party debt relief (1.58%), total and permanent disability discharge (1.34%), Treasury Offset Program (1.29%), collection practices (0.98%), loan capitalized interest (0.97%), loan interest rates (0.94%), Direct Loan eligibility (0.9%), employment certification form (0.71%), wage garnishment (0.71%), adverse reporting by previous servicer (0.7%), qualifying employment or employer (0.66%), NSLDS database (0.66%), qualifying repayment plan (0.49%), collection fees (0.25%), loan fees (0.22%), TEACH grants (0.12%), default notation after rehabilitation (0.04%), and SCRA interest rates (0.01%). 22 See U.S. Department of Education, FSA, Temporary Expanded Public Service Loan Forgiveness, https://studentaid.gov/manage-loans/forgiveness-cancellation/public-service/temporary-expanded-public-service-loan-forgiveness (last accessed Oct. 4, 2021).
Fiscal Year 2021 Annual Report | Federal Student Aid 137
Report of the Federal Student Aid Ombudsman
certain repayment plans.23 However, complaints show that borrowers often receive conflicting information when pursuing TEPSLF, including after their loans are seemingly discharged. As one borrower describes:
The whole process has been grueling. I first applied in April but wasn’t approved until August because two of my prior loan servicers . . . misclassified payments in various ways. It took a close investigation from one of the reps at [my current servicer] to finally identify the problem and fix it. Then it turned out I actually qualified for TEPSLF in November 2019. . . . I received a letter from [my servicer] detailing all of my payments and showing that I had met the qualifications for TEPSLF. . . . I received letters stating that my TEPSLF application was approved . . . [then] I received a letter stating that my TEPSLF application was not approved and ‘you do not qualify for loan forgiveness under TEPSLF.’ . . . It’s certainly unsettling to receive this latest letter, even if it was some kind of technical issue.
Borrowers with commercially held FFEL program loans in default submitted complaints describing how they did not receive adequate information about how to get out of default. Complaints received during FY 2021 shed light on how guaranty agencies may fail to facilitate protections that are available to borrowers under law. A borrower in default has a right to rehabilitate his or her loans to return to good standing.24 This process requires enrolling in a rehabilitation plan and making nine payments — a process that is facilitated by guaranty agencies when borrowers owe commercial FFEL program loans. However, borrowers complain that they often receive incorrect or conflicting information about how to enroll in a rehabilitation plan. Borrowers complain that when trying to enroll, guaranty agencies lose paperwork, miscalculate payments, or misapply payments, often resulting in a borrower remaining in default for longer than necessary.
Borrowers complained that they received inconsistent and inaccurate information about how to have a defaulted debt cured in CAIVRS, which often results in them missing out on options to pursue financial security. All defaulted federal student loans are reported to the Credit Alert Verification Reporting System (CAIVRS), a database operated by the Department of Housing and Urban Development that reflects all defaulted debt owed to the federal government. Unlike credit history, where a defaulted debt is only reported for seven years, CAIVRS records are maintained indefinitely until the debt is cured (returned to good standing). When consumers seek to take out a federally backed loans, such as a Department of Veterans Affairs (VA) mortgage or Federal Housing Administration (FHA) mortgage, CAIVRS is cross-referenced before the new loan can close. Where defaulted student loans are outstanding, a borrower will be denied additional government-backed loans — even if it is long after the debt is removed from the borrower’s credit history.
Borrowers often report not learning of the CAIVRS hurdle until mere days before closing on their mortgage, leaving them scrambling for answers about how to cure their defaulted student loans.
23 See, e.g., Consumer Financial Protection Bureau, Staying on track while giving back: The cost of student loan servicing breakdowns for people serving their communities (June 22, 2017), https://www.consumerfinance.gov/data-research/research-reports/staying-track-while-giving-back-cost-student-loan-servicing-breakdowns-people-serving-their-communities/. 24 See Consumer Financial Protection Bureau, Annual report of the CFPB Student Loan Ombudsman: Transition from default to an income-driven repayment plan (October 2016), https://files.consumerfinance.gov/f/documents/102016_cfpb_Transmittal_DFA_1035_Student_Loan_Ombudsman_Report.pdf.
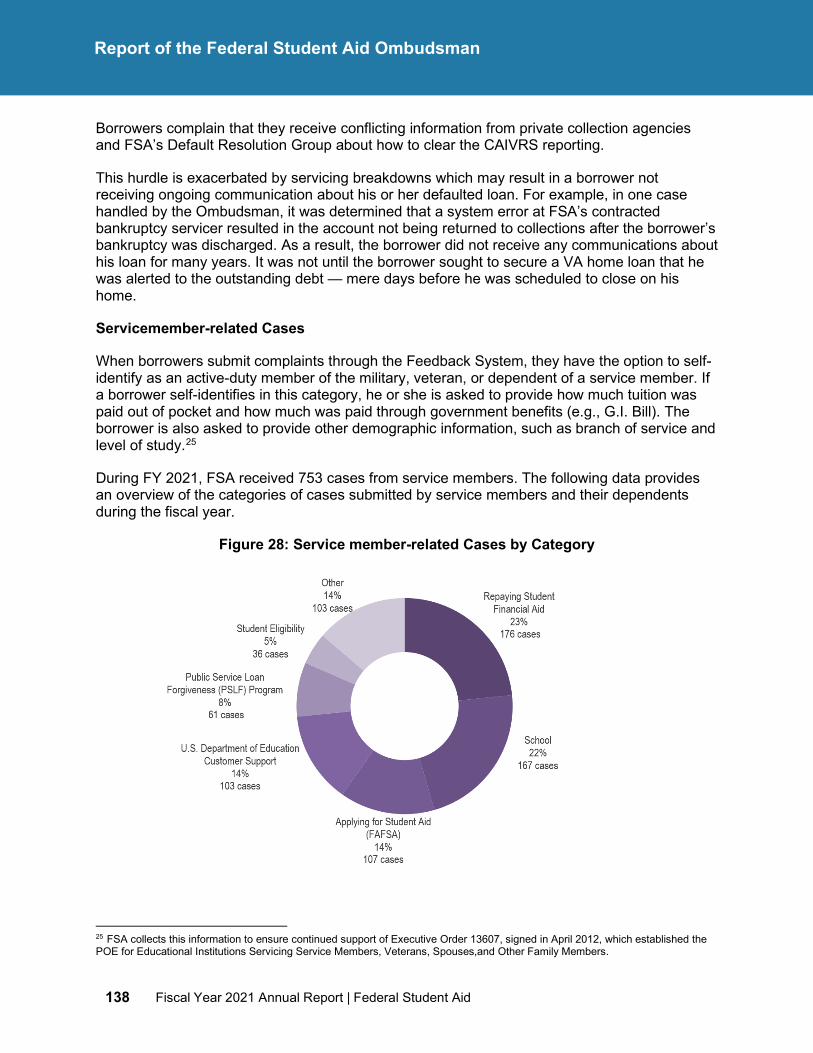
138 Fiscal Year 2021 Annual Report | Federal Student Aid
Report of the Federal Student Aid Ombudsman
Borrowers complain that they receive conflicting information from private collection agencies and FSA’s Default Resolution Group about how to clear the CAIVRS reporting.
This hurdle is exacerbated by servicing breakdowns which may result in a borrower not receiving ongoing communication about his or her defaulted loan. For example, in one case handled by the Ombudsman, it was determined that a system error at FSA’s contracted bankruptcy servicer resulted in the account not being returned to collections after the borrower’s bankruptcy was discharged. As a result, the borrower did not receive any communications about his loan for many years. It was not until the borrower sought to secure a VA home loan that he was alerted to the outstanding debt — mere days before he was scheduled to close on his home.
Servicemember-related Cases
When borrowers submit complaints through the Feedback System, they have the option to self-identify as an active-duty member of the military, veteran, or dependent of a service member. If a borrower self-identifies in this category, he or she is asked to provide how much tuition was paid out of pocket and how much was paid through government benefits (e.g., G.I. Bill). The borrower is also asked to provide other demographic information, such as branch of service and level of study.25
During FY 2021, FSA received 753 cases from service members. The following data provides an overview of the categories of cases submitted by service members and their dependents during the fiscal year.
Figure 28: Service member-related Cases by Category
25 FSA collects this information to ensure continued support of Executive Order 13607, signed in April 2012, which established the POE for Educational Institutions Servicing Service Members, Veterans, Spouses, and Other Family Members.
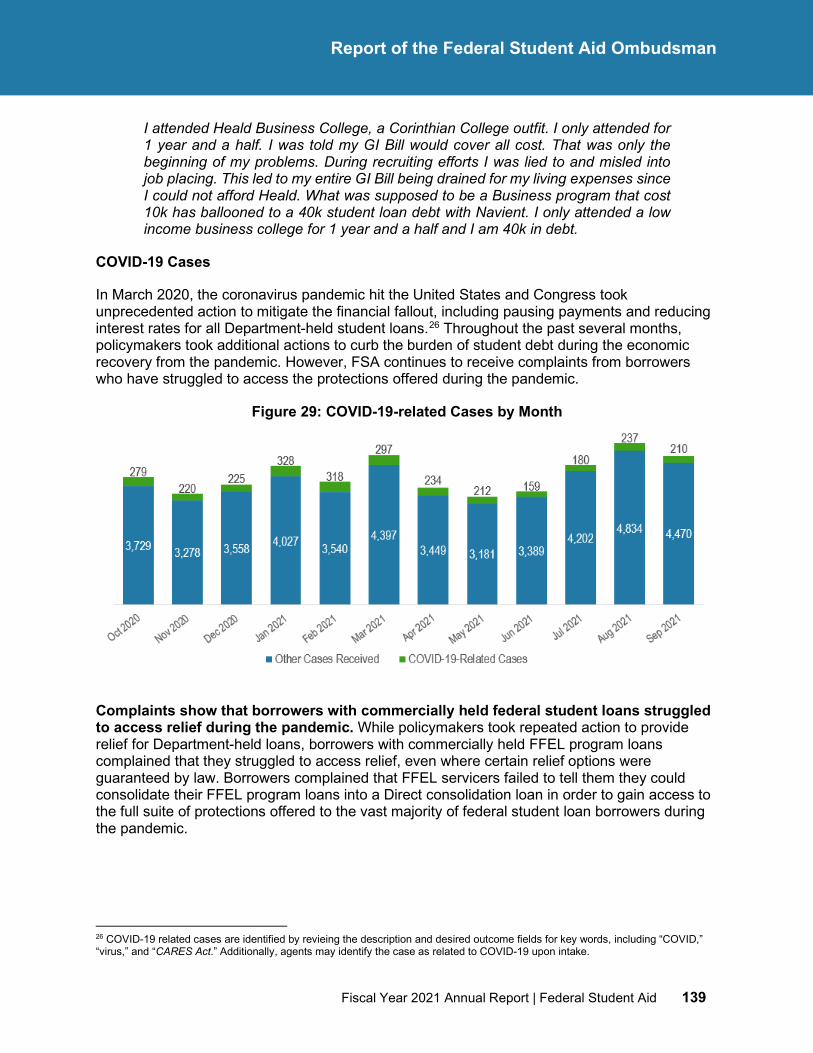
Fiscal Year 2021 Annual Report | Federal Student Aid 139
Report of the Federal Student Aid Ombudsman
I attended Heald Business College, a Corinthian College outfit. I only attended for 1 year and a half. I was told my GI Bill would cover all cost. That was only the beginning of my problems. During recruiting efforts I was lied to and misled into job placing. This led to my entire GI Bill being drained for my living expenses since I could not afford Heald. What was supposed to be a Business program that cost 10k has ballooned to a 40k student loan debt with Navient. I only attended a low income business college for 1 year and a half and I am 40k in debt.
COVID-19 Cases
In March 2020, the coronavirus pandemic hit the United States and Congress took unprecedented action to mitigate the financial fallout, including pausing payments and reducing interest rates for all Department-held student loans.26 Throughout the past several months, policymakers took additional actions to curb the burden of student debt during the economic recovery from the pandemic. However, FSA continues to receive complaints from borrowers who have struggled to access the protections offered during the pandemic.
Figure 29: COVID-19-related Cases by Month
Complaints show that borrowers with commercially held federal student loans struggled to access relief during the pandemic. While policymakers took repeated action to provide relief for Department-held loans, borrowers with commercially held FFEL program loans complained that they struggled to access relief, even where certain relief options were guaranteed by law. Borrowers complained that FFEL servicers failed to tell them they could consolidate their FFEL program loans into a Direct consolidation loan in order to gain access to the full suite of protections offered to the vast majority of federal student loan borrowers during the pandemic.
26 COVID-19 related cases are identified by revieing the description and desired outcome fields for key words, including “COVID,” “virus,” and “CARES Act.” Additionally, agents may identify the case as related to COVID-19 upon intake.
140 Fiscal Year 2021 Annual Report | Federal Student Aid
Report of the Federal Student Aid Ombudsman
In March 2021, the Department announced that guaranty agencies must suspend involuntary collection of payments against defaulted borrowers.27 Despite this directive, borrowers with defaulted commercially held FFEL program loans complained that garnishments continued. For example, one borrower who submitted a complaint in August 2021 described the financial distress she faced from the continued garnishment:
I would like to find out how to get a refund . . . on the wage garnishments that have been taken out of my paycheck. It is almost $6,000. . . . I understand they should not be taking these funds and I would like them back. It was hard to live before they started taking about $700-$800 a month out of my paycheck.
Third-party Debt Relief
FSA continues to receive complaints about TPDR companies — private companies that provide (or claim to provide) student loan management services for a fee. Some of the services they charge for, such as loan consolidation, can be managed by the borrowers themselves or by FSA contractors at no cost.28 Additionally, many TPDR companies make deceptive promises about loan forgiveness, misrepresent any affiliation with the federal government, or otherwise mislead borrowers about the services the company will provide.
Case data shows an increase in the number of borrowers contacting FSA regarding TPDR companies, many of whom do not realize that they have been defrauded until after they have paid large sums of money to these companies. During FY 2021, FSA received 3,081 complaints about TPDR companies. Complaints demonstrate that TPDR companies aggressively contact borrowers via social media, phone calls, emails, and text messages. These companies often demand large sums of money upfront and request borrowers’ FSA ID and login information. After securing this information, TPDR companies often change the borrower’s FSA login information, resulting in the borrower not being advised about any changes to their loan status. TPDR companies also encourage borrowers to disregard any correspondence from their servicer. Borrowers complain that after questioning the company’s legitimacy, they can be threatened, and companies may obtain and use borrowers’ financial information without their consent.
FSA categorizes cases about TPDR generally as Suspicious Activity/Allegation of Misuse of FSA Intellectual Property or Claim of a Department Affiliation. The following data represents an increase in TPDR-related complaints during the fiscal year — a notable trend given the ongoing payment pause for most federal student loan borrowers.
27 See U.S. Department of Education, Department of Education Announces Expansion of COVID-19 Emergency Flexibilities to Additional Federal Student Loans in Default (March 30, 2021), https://www.ed.gov/news/press-releases/department-education-announces-expansion-covid-19-emergency-flexibilities-additional-federal-student-loans-default; see also U.S. Department of Education, Expansion of Collections Pause to Defaulted FFEL Program Loans Managed by Guaranty Agencies, GEN-21-03 (May 12, 2021, updated May 24, 2021), https://fsapartners.ed.gov/knowledge-center/library/dear-colleague-letters/2021-05-12/expansion-collections-pause-defaulted-ffel-program-loans-managed-guaranty-agencies-updated-may-24-2021#. 28 See U.S. Department of Education, FSA, Avoiding Student Aid Scams, https://studentaid.gov/resources/scams (last accessed Oct. 7, 2021).
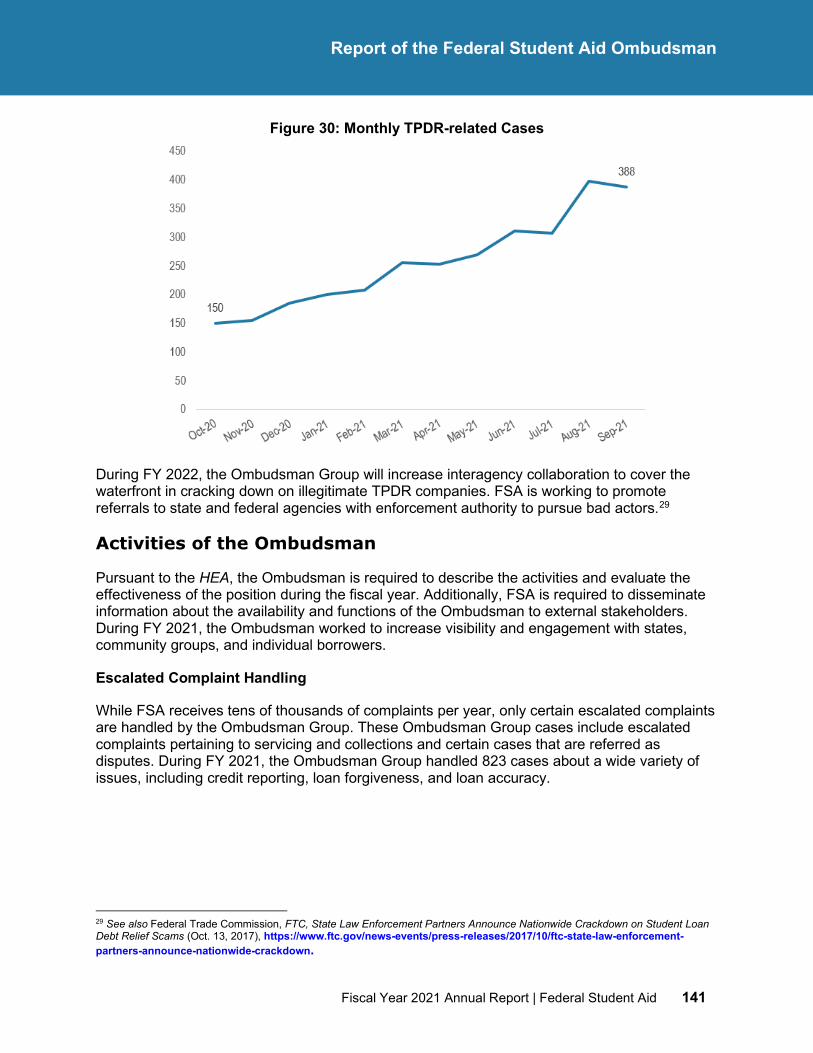
Fiscal Year 2021 Annual Report | Federal Student Aid 141
Report of the Federal Student Aid Ombudsman
Figure 30: Monthly TPDR-related Cases
During FY 2022, the Ombudsman Group will increase interagency collaboration to cover the waterfront in cracking down on illegitimate TPDR companies. FSA is working to promote referrals to state and federal agencies with enforcement authority to pursue bad actors.29
Activities of the Ombudsman
Pursuant to the HEA, the Ombudsman is required to describe the activities and evaluate the effectiveness of the position during the fiscal year. Additionally, FSA is required to disseminate information about the availability and functions of the Ombudsman to external stakeholders. During FY 2021, the Ombudsman worked to increase visibility and engagement with states, community groups, and individual borrowers.
Escalated Complaint Handling
While FSA receives tens of thousands of complaints per year, only certain escalated complaints are handled by the Ombudsman Group. These Ombudsman Group cases include escalated complaints pertaining to servicing and collections and certain cases that are referred as disputes. During FY 2021, the Ombudsman Group handled 823 cases about a wide variety of issues, including credit reporting, loan forgiveness, and loan accuracy.
29 See also Federal Trade Commission, FTC, State Law Enforcement Partners Announce Nationwide Crackdown on Student Loan Debt Relief Scams (Oct. 13, 2017), https://www.ftc.gov/news-events/press-releases/2017/10/ftc-state-law-enforcement-partners-announce-nationwide-crackdown.
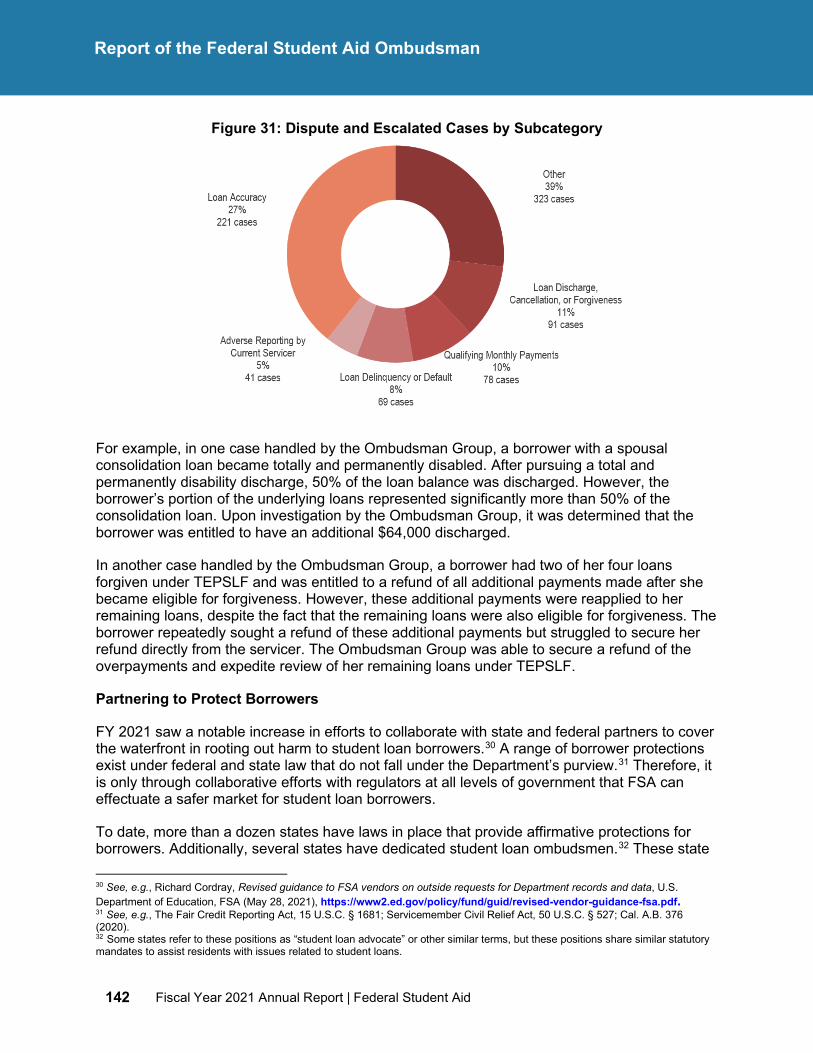
142 Fiscal Year 2021 Annual Report | Federal Student Aid
Report of the Federal Student Aid Ombudsman
Figure 31: Dispute and Escalated Cases by Subcategory
For example, in one case handled by the Ombudsman Group, a borrower with a spousal consolidation loan became totally and permanently disabled. After pursuing a total and permanently disability discharge, 50% of the loan balance was discharged. However, the borrower’s portion of the underlying loans represented significantly more than 50% of the consolidation loan. Upon investigation by the Ombudsman Group, it was determined that the borrower was entitled to have an additional $64,000 discharged.
In another case handled by the Ombudsman Group, a borrower had two of her four loans forgiven under TEPSLF and was entitled to a refund of all additional payments made after she became eligible for forgiveness. However, these additional payments were reapplied to her remaining loans, despite the fact that the remaining loans were also eligible for forgiveness. The borrower repeatedly sought a refund of these additional payments but struggled to secure her refund directly from the servicer. The Ombudsman Group was able to secure a refund of the overpayments and expedite review of her remaining loans under TEPSLF.
Partnering to Protect Borrowers
FY 2021 saw a notable increase in efforts to collaborate with state and federal partners to cover the waterfront in rooting out harm to student loan borrowers.30 A range of borrower protections exist under federal and state law that do not fall under the Department’s purview.31 Therefore, it is only through collaborative efforts with regulators at all levels of government that FSA can effectuate a safer market for student loan borrowers.
To date, more than a dozen states have laws in place that provide affirmative protections for borrowers. Additionally, several states have dedicated student loan ombudsmen.32 These state
30 See, e.g., Richard Cordray, Revised guidance to FSA vendors on outside requests for Department records and data, U.S. Department of Education, FSA (May 28, 2021), https://www2.ed.gov/policy/fund/guid/revised-vendor-guidance-fsa.pdf. 31 See, e.g., The Fair Credit Reporting Act, 15 U.S.C. § 1681; Servicemember Civil Relief Act, 50 U.S.C. § 527; Cal. A.B. 376 (2020). 32 Some states refer to these positions as “student loan advocate” or other similar terms, but these positions share similar statutory mandates to assist residents with issues related to student loans.
Fiscal Year 2021 Annual Report | Federal Student Aid 143
Report of the Federal Student Aid Ombudsman
officials are critical partners to FSA, including the Ombudsman, and help identify breakdowns in the delivery of Title IV programs and protections.33
During FY 2021, the Ombudsman Group handled several complaints referred by state ombudsmen. These complaints covered a variety of issues, including third-party debt relief scams, repayment relief for commercial FFEL Program loans during the COVID-19 pandemic, and qualifying for TEPSLF. State ombudsmen also expressed frustration when seeking to navigate the process for sharing borrower information covered under the Privacy Act. The FSA Ombudsman is currently working with other FSA business units to develop means by which state officials can access the NSLDS® database, similar to the functionality offered to college financial aid officers.
In FY 2022, the Ombudsman will kick off efforts to convene state ombudsmen for ongoing roundtable discussions, with a particular emphasis on promoting coordinated outreach and oversight during Return to Repayment.
External Stakeholder Engagement
During the fourth quarter of FY 2021, the Ombudsman began a new initiative designed to build relationships within communities and promote the Ombudsman Group as a trusted resource for students and borrowers. The Ombudsman met with a variety of stakeholders, including community groups, legal aid and other direct service providers, national advocacy organizations, civil rights groups, labor unions, and organizations representing servicemembers and veterans. Each constituency offered a unique perspective on the challenges borrowers face when seeking to navigate student loan repayment, including when trying to access certain rights and protections guaranteed under federal law.
For example, legal aid providers discussed the problems borrowers face when seeking to end administrative wage garnishment. These providers noted that this involuntary collection process seizes more money than borrowers would be required to pay under some income-driven repayment plans, and the fallout of the system bears down disproportionately on low-income borrowers and borrowers of color.34 Legal aid providers described the breakdowns their clients face when seeking hearings to suspend garnishment, stemming from a seemingly arbitrary decision-making process and little oversight of contractors conducting the hearing process.
Consumer advocates expressed concerns about the impending return to repayment, describing how the pandemic exposed systemic issues in the federal student loan market, such as inconsistent practices among servicers and incomplete information about available protections from customer service representatives. Advocates called for more robust oversight of student loan servicers and collectors, more accountability for vendors, and more coordination between FSA and federal and state law enforcement agencies. Consumer advocates also called for building out an “on-ramp” for returning to repayment to allow borrowers to transition back to making payments without the risk of a payment cliff if they cannot immediately enroll in an affordable repayment plan.
33 See also Letter from Richard Cordray to the Virginia State Corporation Commission, BFI-2021-00007 (Aug. 16, 2021), https://scc.virginia.gov/docketsearch/DOCS/5g8j01!.PDF. 34 See Deanne Loonin, Illusory Due Process: The Broken Student Loan Hearing System, 11 U.C. Irvine L. Rev. 173 (2020), https://scholarship.law.uci.edu/cgi/viewcontent.cgi?article=1467&context=ucilr.
144 Fiscal Year 2021 Annual Report | Federal Student Aid
Report of the Federal Student Aid Ombudsman
In FY 2022, the Ombudsman will continue building out relationships with stakeholders across the country, with an emphasis on providing streamlined support for student loan borrowers during the return to repayment transition. Additionally, the Ombudsman will further solicit feedback about the effectiveness Title IV programs to share with FSA leadership and inform recommendations.
Direct Borrower Engagement
During the fourth quarter of FY 2021, the Ombudsman began efforts to improve borrowers’ customer experience around the referral of complaints. Historically, borrowers have expressed frustration around being shuffled between offices within FSA and across other federal agencies. Borrowers lamented having to reexplain their issue each time they spoke to a new point of contact, further exacerbating their dissatisfaction with their Title IV program experience. In response to this frustration, the Ombudsman Group is prioritizing back-end coordination within FSA and among federal and state agencies that receive borrower complaints. Under this approach, the Ombudsman Group will coordinate directly with stakeholders that receive borrower complaints and work to resolve the complaint without the borrower having to submit the same concern across multiple agencies.
Additionally, the Ombudsman is working with other offices within FSA to build out a direct-to-borrower information campaign promoting awareness of the availability of the Ombudsman. The goal of this campaign will be to explain to borrowers the purpose of the Ombudsman Group and promote channels through which borrowers can reach out if they experience problems with their Title IV aid.
Ombudsman Recommendations
The following recommendations are made by the Ombudsman in accordance with the authority provided under the HEA and informed by thousands of borrower complaints received throughout the year.
The Department should reevaluate the financial sustainability of the FFEL program and recall the entirety of the defaulted FFEL portfolio. The dwindling FFEL program is becoming increasingly unsustainable, with contraction exacerbated by limited repayment protections and questionable servicing practices.35 As discussed, the pandemic has shed light on the disparities in repayment faced by borrowers with commercial FFEL program loans, as compared to Direct Loan borrowers, particularly when borrowers’ loans are in default. Under law, the Secretary retains the authority to recall from a guaranty agency any loan where “the federal fiscal interest so requires.”36 Complaints received throughout the fiscal year demonstrate that guaranty agencies are ill-equipped to act in the best interest of the borrower.37 In fact, as previously described, the largest guaranty agencies have aggravated the financial distress of the most vulnerable borrowers during the pandemic by continuing to garnish wages. Accordingly, the
35 See, e.g., Consumer Financial Protection Bureau, Supervisory Highlights COVID-19 Prioritized Assessments Special Edition, Issue. 23, Winter 2021 (January 2021), https://files.consumerfinance.gov/f/documents/cfpb_supervisory-highlights_issue-23_2021-01.pdf. 36 20 U.S.C. § 1078(c)(8). 37 See also Petition to Enforce Civil Investigative Demand and Supporting Memorandum, Consumer Financial Protection Bureau v. Educational Credit Management Corporation. (0:21-mc-00019) (Mar. 4, 2021) (alleging that ECMC kept borrowers in default for at least 65 days before providing borrowers with options to cure the default in an effort to maximize collection fees).
Fiscal Year 2021 Annual Report | Federal Student Aid 145
Report of the Federal Student Aid Ombudsman
Department should rescind all defaulted commercial FFEL program loans to ensure borrowers are able to access critical repayment protections.
Policymakers should extend PSLF protections to borrowers enrolled in alternative repayment plans. For years, law enforcement officials, regulators, and advocates have documented the widespread issues with the PSLF program. For example, at the beginning of FY 2022, the Department took action to provide PSLF protections to the borrowers working in public service who had been disproportionately affected by the pandemic, many of whom may not have been properly advised by their servicer about how to get on track for loan forgiveness.38To address these issues, policymakers have occasionally intervened to expand relief for borrowers by waiving certain requirements of the program. These interventions, while necessary, are time limited, and therefore may not be available to all borrowers who have been harmed by poor servicing practices.39
Complaints show that servicers have historically enrolled borrowers into alternative repayment plans without disclosing that these plans are ineligible for PSLF. In many instances, borrowers under these plans pay more than they would otherwise pay under a standard plan or an income-driven repayment plan — both of which are qualified repayment plans under the PSLF program. Since October 2017, more than 20,000 borrowers have been denied TEPSLF because some numbers of payments were made under an ineligible repayment plan.40
Congress should consider expanding PSLF-eligible repayment plans to include alternative repayment plans to better effectuate the intent of the program and provide relief to borrowers who made payments while serving their communities.
The Department should limit CAIVRS reporting after seven years of furnishing. As previously discussed, FSA requires vendors to report defaulted student loan borrowers to CAIVRS—a database of all defaulted debt owed to the federal government. Complaints show that CAIVRS often serves to resurrect debts long after traditional credit bureaus stop reporting, and long after any private market debt would have been written off. This practice disproportionately affects historically marginalized consumers — the very people intended to benefit from federally backed mortgages. In effect, CAIVRS ensures leverage to collect on defaulted debts owed by the most financially vulnerable borrowers.41 CAIVRS remains in the arsenal of extraordinary collection tools of the federal government, which also includes no statute of limitations for wage garnishment or tax offsets. As the Department works to close the
38 See U.S. Department of Education, U.S. Department of Education Announces Transformational Changes to the Public Service Loan Forgiveness Program, Will Put Over 550,000 Public Service Workers Closer to Loan Forgiveness (Oct. 6, 2021), https://www.ed.gov/news/press-releases/us-department-education-announces-transformational-changes-public-service-loan-forgiveness-program-will-put-over-550000-public-service-workers-closer-loan-forgiveness; see also Temporary Expanded Public Service Loan Forgiveness, Consolidated Appropriations Act of 2018. 38 The FY 2021 expansion of PSLF eligibility is available through October 2022. TEPSLF is available until allotted funds are exhausted. 39 The FY 2021 expansion of PSLF eligibility is available through October 2022. TEPSLF is available until allotted funds are exhausted. 40 Alternative repayment, which collectively includes Alternative Fixed Payment, Alternative Fixed Term, Alternative Graduated, and Alternative Negative Amortization, is an ineligible repayment plan under TEPSLF. 41 Consumers of federally backed mortgages — for which the underwriting process triggers the review of CAIVRS—are more likely to be consumers of color, have smaller down payments, and have higher debt-to-income ratios than consumers of conventional mortgages. See Consumer Financial Protection Bureau, Data Point: 2019 Mortgage Market Activity and Trends (June 2020), https://files.consumerfinance.gov/f/documents/cfpb_2019-mortgage-market-activity-trends_report.pdf.
146 Fiscal Year 2021 Annual Report | Federal Student Aid
Report of the Federal Student Aid Ombudsman
disparities among defaulted borrowers, it should also consider limiting CAIVRS reporting to align with industry-standard furnishing practices and cease reporting, for instance, after seven years.

Fiscal Year 2021 Annual Report | Federal Student Aid 147
Financial Section
Financial Section
148 Fiscal Year 2021 Annual Report | Federal Student Aid
Financial Section
This page is intentionally left blank
Fiscal Year 2021 Annual Report | Federal Student Aid 149
Overview of the Financial Section
Overview of the Financial Section
This section provides a financial presentation of FSA’s stewardship and accountability for its resources. The audited financial statements are followed by the accompanying notes to the financial statements, required supplementary information, and the Independent Auditors’ Report. The subsections are listed and briefly discussed below:
• Financial Statements: The Financial Statements consist of the following comparative statements: Balance Sheet, Statement of Net Cost, Statement of Changes in Net Position and Statement of Budgetary Resources.
• Notes to the Financial Statements: The Notes to the Financial Statements provide a description of significant accounting policies and detailed information on select financial statement line items. The Notes also include information that supports the computation of the various financial statement activities.
• Required Supplementary Information (Unaudited): The unaudited Required Supplementary Information presents the Combining Statements of Budgetary Resources by Program.
• Independent Auditors’ Report: The Independent Auditors’ Report presents the combined audit report issued by the Independent Auditors. Included in the combined audit report are the Report on the Financial Statements, the Report on Internal Control, and the Report on Compliance and Other Matters. The subsection also includes the Office of Inspector General Audit Transmittal Letter, Management’s Response to the Audit, and the Auditors’ Response to Management’s Response.
150 Fiscal Year 2021 Annual Report | Federal Student Aid
Financial Statements
Financial Statements
FSA prepares the following statements: the Consolidated Balance Sheets, the Consolidated Statements of Net Cost, the Consolidated Statements of Changes in Net Position, and the Combining Statements of Budgetary Resources. These statements are prepared pursuant to the requirements of the Chief Financial Officers Act of 1990, the Government Management Reform Act, and OMB Circular A-136; and demonstrate FSA’s accountability and stewardship of the resources entrusted to it.
Below is a brief description of the principal financial statements included in this section:
• Consolidated Balance Sheets: The Consolidated Balance Sheets present, as of a specific time, the amount of resources FSA has to use or distribute (assets), the amounts owed by FSA (liabilities) and the difference between the two (net position).
• Consolidated Statements of Net Cost: The Consolidated Statements of Net Cost present the annual cost of agency operations. The gross cost less any offsetting revenue is used to determine the net cost.
• Consolidated Statements of Changes in Net Position: The Consolidated Statements of Changes in Net Position report the accounting activities, including changes to Cumulative Results of Operations and Unexpended Appropriations that caused the change in net position during the reporting period.
• Combining Statements of Budgetary Resources: The Combining Statements of Budgetary Resources report the budgetary resources that were made available to FSA, the status of those resources at fiscal year-end, along with the outlays of budgetary resources.
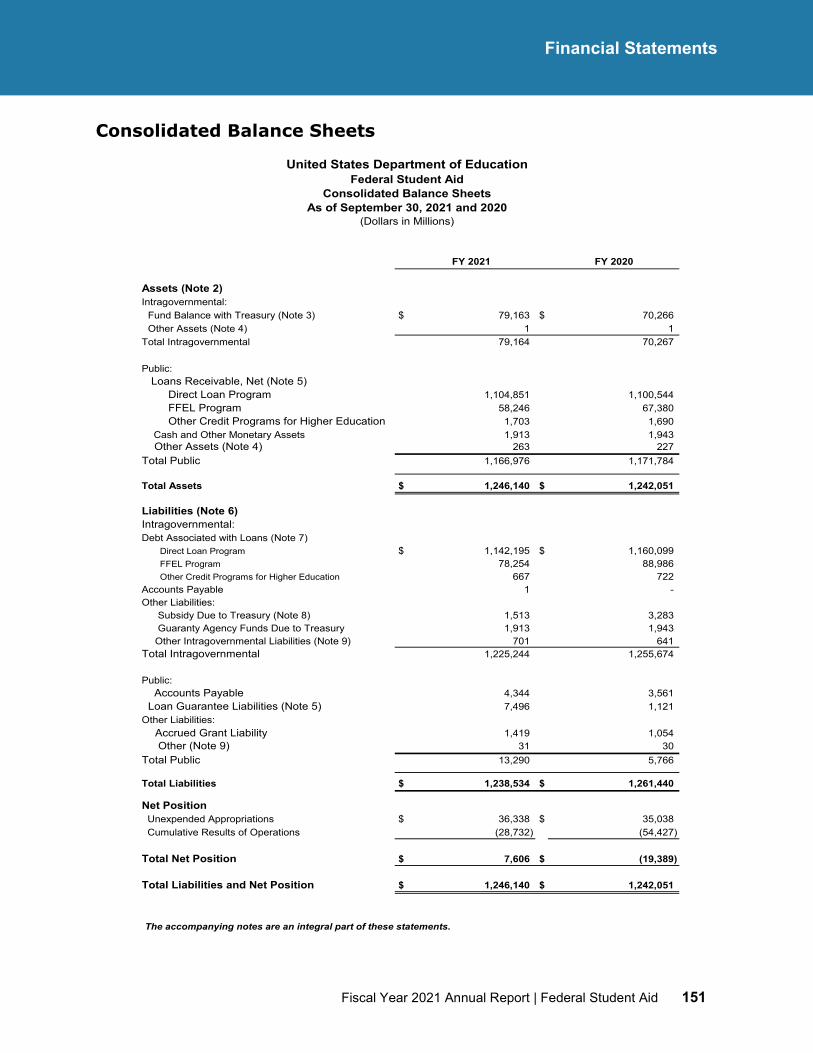
Bala
Fiscal Year 2021 Annual Report | Federal Student Aid 151
Financial Statements
Consolidated Balance Sheets
FY 2021 FY 2020
Assets (Note 2)Intragovernmental:
01Fund Balance with Treasury (Note 3) $ 79,163 $ 70,26601Other Assets (Note 4) 1 1Total Intragovernmental 79,164 70,267
Public: Loans Receivable, Net (Note 5)
02 Direct Loan Program 1,104,851 1,100,54402 FFEL Program 58,246 67,38002 Other Credit Programs for Higher Education 1,703 1,69002 Cash and Other Monetary Assets 1,913 1,94302 Other Assets (Note 4) 263 227Total Public 1,166,976 1,171,784
Total Assets $ 1,246,140 $ 1,242,051
Liabilities (Note 6)Intragovernmental:
0Debt Associated with Loans (Note 7)03 Direct Loan Program $ 1,142,195 $ 1,160,09903 FFEL Program 78,254 88,98603 Other Credit Programs for Higher Education 667 7220Accounts Payable 1 - Other Liabilities:
03 Subsidy Due to Treasury (Note 8) 1,513 3,28303 Guaranty Agency Funds Due to Treasury 1,913 1,94303 Other Intragovernmental Liabilities (Note 9) 701 641Total Intragovernmental 1,225,244 1,255,674
Public:0 Accounts Payable 4,344 3,56104Loan Guarantee Liabilities (Note 5) 7,496 1,121Other Liabilities:
04 Accrued Grant Liability 1,419 1,05404 Other (Note 9) 31 30Total Public 13,290 5,766
Total Liabilities $ 1,238,534 $ 1,261,440
Net Position0 Unexpended Appropriations $ 36,338 $ 35,0380 Cumulative Results of Operations (28,732) (54,427)
Total Net Position $ 7,606 $ (19,389)
Total Liabilities and Net Position $ 1,246,140 $ 1,242,051
0 0The accompanying notes are an integral part of these statements.
United States Department of EducationFederal Student Aid
Consolidated Balance SheetsAs of September 30, 2021 and 2020
(Dollars in Millions)
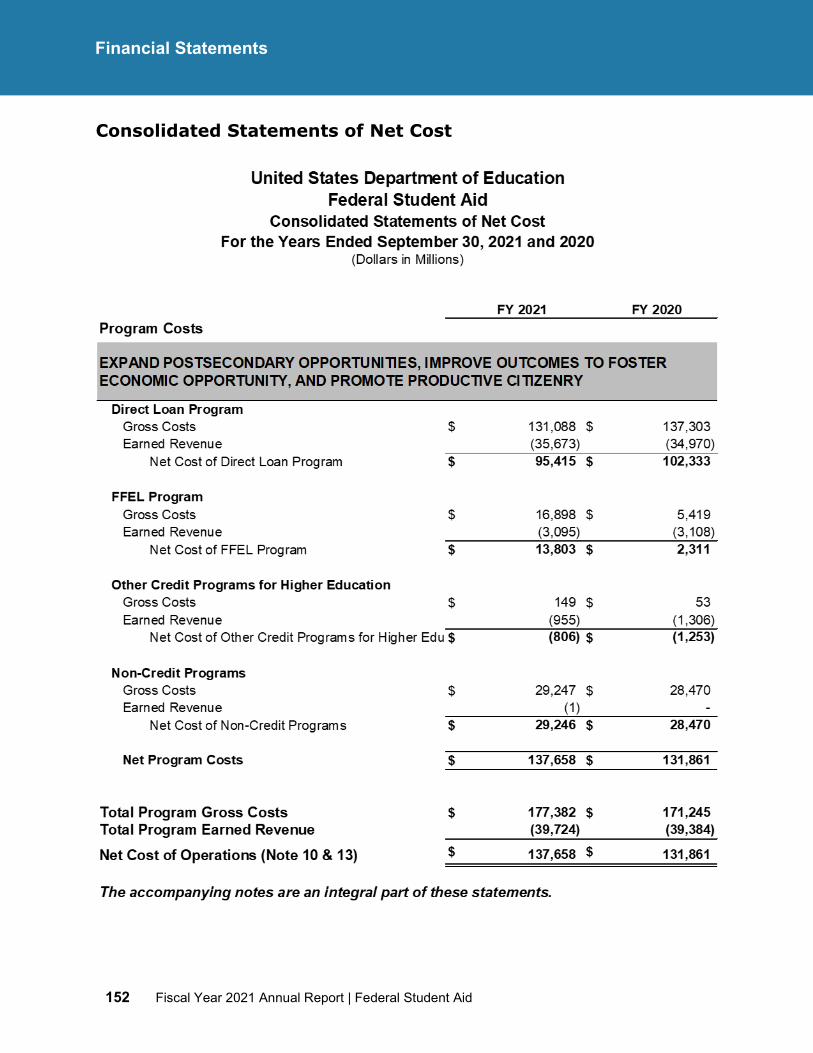
152 Fiscal Year 2021 Annual Report | Federal Student Aid
Financial Statements
Consolidated Statements of Net Cost
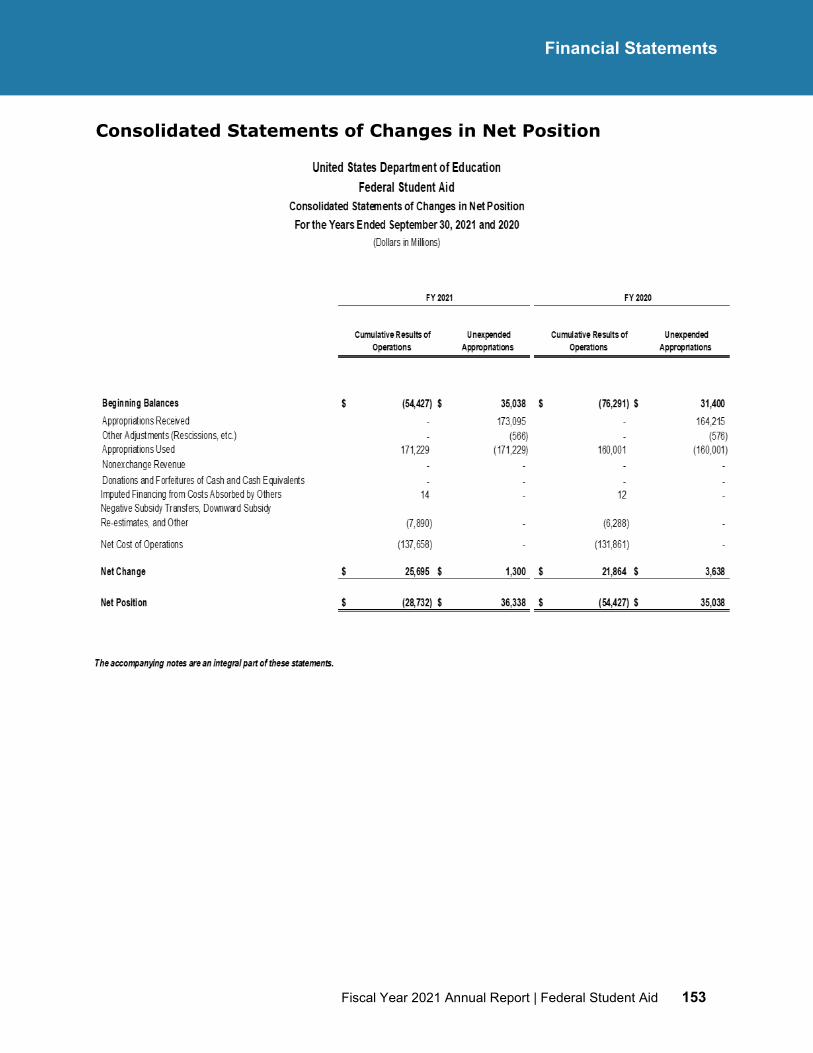
Fiscal Year 2021 Annual Report | Federal Student Aid 153
Financial Statements
Consolidated Statements of Changes in Net Position
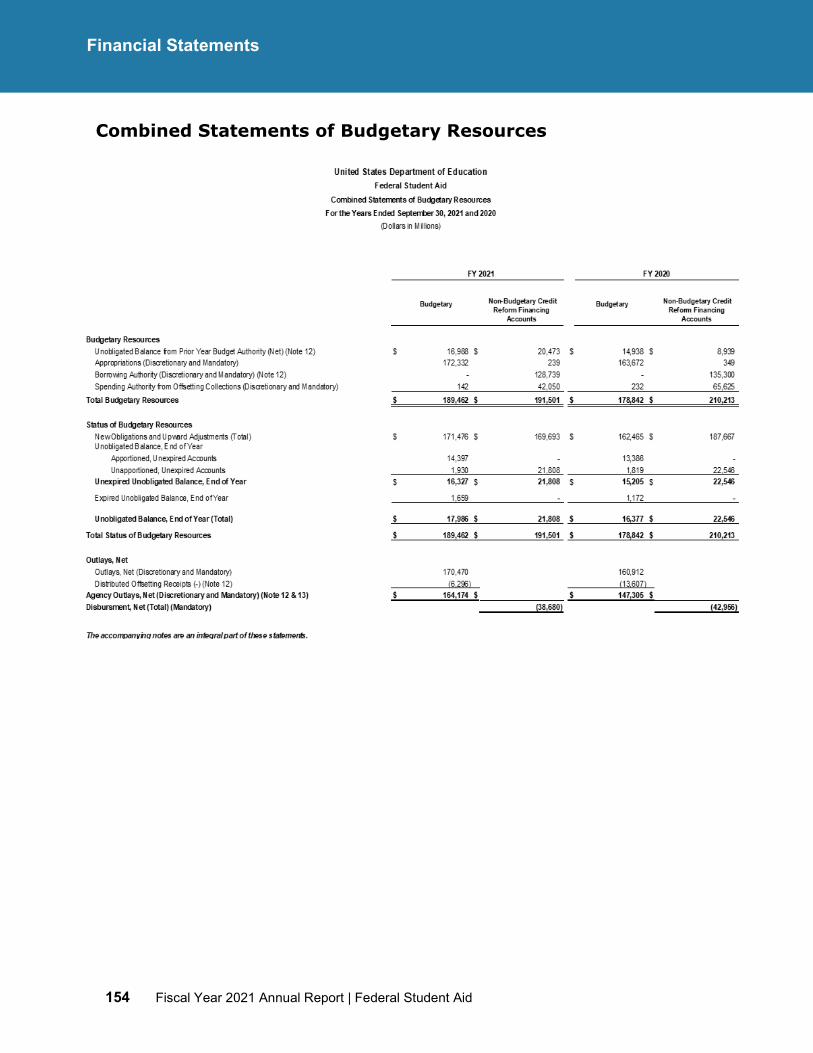
154 Fiscal Year 2021 Annual Report | Federal Student Aid
Financial Statements
Combined Statements of Budgetary Resources
Fiscal Year 2021 Annual Report | Federal Student Aid 155
Notes to the Financial Statements
Notes to the Financial Statements
Note 1. Summary of Significant Accounting Policies
Note 2. Non-entity Assets
Note 3. Fund Balance with Treasury
Note 4. Other Assets
Note 5. Loan Receivables, Net and Loan Guarantee Liabilities
Note 6. Liabilities Not Covered by Budgetary Resources
Note 7. Debt Associated with Loans
Note 8. Subsidy Due to Treasury General Fund
Note 9. Other Liabilities
Note 10. Net Cost
Note 11. COVID-19 Activity
Note 12. Statements of Budgetary Resources
Note 13. Reconciliation of Net Cost to Net Outlays
Note 14. Commitments and Contingencies
Note 15. Subsequent Event
156 Fiscal Year 2021 Annual Report | Federal Student Aid
Notes to the Financial Statements
Notes to the Financial Statements for the Years Ended, September 30, 2021 and 2020
Note 1. Summary of Significant Accounting Policies
Reporting Entity and Programs
Federal Student Aid (FSA) was created as a Performance Based Organization (PBO) within the U.S. Department of Education (the Department) in 1998, as a result of amendments to the Higher Education Act of 1965 (HEA), from previously existing Department student financial assistance program offices. FSA operates under the PBO mandate to develop a management structure driven by strong incentives to manage for results. FSA’s primary goal is to assist lower-income and middle-income students in overcoming the financial barriers that make it difficult to attend and complete postsecondary education.
FSA is a component of the U.S. Government. For this reason, some of the assets and liabilities reported by FSA may be eliminated for government-wide reporting. These financial statements should be read with the realization that they are for a component of the U.S. Government.
Federal Student Loan Programs. FSA and the Department administer the William D. Ford Federal Direct Loan (Direct Loan) Program, the Federal Family Education Loan (FFEL) Program, the Health Education Assistance Loan program (HEAL), and the Federal Perkins Loan program to help students and their families finance the costs of postsecondary education. A Direct Loan is any debt instrument issued to the public by the federal government. A FFEL loan guarantee is a guarantee, insurance, or other pledge with respect to the payment of all or part of the principal or interest on any debt obligation of a non-federal borrower to a non-federal lender.
The Direct Loan Program, added to the HEA in 1993 by the Student Loan Reform Act of 1993, authorizes FSA to make loans through participating schools to eligible undergraduate and graduate students and their parents. The Direct Loan Program offers four types of loans: Stafford, Unsubsidized Stafford, Parent Loan for Undergraduate Students (PLUS), and Consolidation. Evidence of financial need is required for an undergraduate student to receive a subsidized Stafford loan. The other three loan programs are available to borrowers at all income levels. Loans can be used only to meet qualified educational expenses.
The FFEL Program, authorized by the HEA, operates through state and private nonprofit guaranty agencies that provide loan guarantees on loans made by private lenders to eligible students. The SAFRA Act, which was included in the Health Care and Education Reconciliation Act of 2010 (HCERA), stated that no new FFEL loans would be made effective July 1, 2010. FFEL Program receivables include defaulted FFEL loans and acquired FFEL loans. Acquired FFEL loans include student loan assets acquired using temporary authority provided in the Ensuring Continued Access to Student Loans Act of 2008 (ECASLA). ECASLA gave FSA temporary authority to purchase FFEL loans and participation interests in those loans. FSA implemented three activities under this authority: loan purchase commitments; purchases of loan participation interests; and a put, or forward purchase commitment, with an Asset-Backed Commercial Paper (ABCP) Conduit. This authority expired after September 30, 2010; as a result, loan purchase commitments and purchases of loan participation interests concluded.
MM
Fiscal Year 2021 Annual Report | Federal Student Aid 157
Notes to the Financial Statements
However, under the terms of the Put Agreement with the conduit, ABCP Conduit activity ceased operations in January 2014. (See Notes 5 and 10)
Grant Programs. FSA and the Department manage numerous grant programs, which provide financial aid, that in most cases does not need to be repaid to students with financial need. The largest of these programs is the Federal Pell Grant (Pell Grant) program, which provides need- based grants to low-income undergraduate and certain post baccalaureate students that promotes access to postsecondary education. Other grant programs include Federal Work- Study Program, Federal Supplemental Educational Opportunity Grants (FSEOG), Teacher Education Assistance for College and Higher Education (TEACH) Grants, and Iraq and Afghanistan Service grants. (See Note 10)
COVID-19. COVID-19 relief legislation and administrative actions provided support for student loan borrowers primarily by suspending nearly all federal loan payments until January 31, 2022, interest free. FSA also stopped all federal wage garnishments and collection actions for borrowers with federally held loans in default. Funding for the student loan repayment was provided through indefinite appropriations. (See Notes 5 and 11)
Other regulatory flexibilities and incentives provided to help students through COVID-19 include:
• Federal Supplemental Educational Opportunity Grants to provide emergency aid to students.
• Work-study payments, which will continue even if students can no longer work on-site.
• Pell Grants, financial aid, and loans originated for the spring 2020 term, which students who have had to leave college campuses will not have to pay back. Moreover, none of this aid will count against students’ financial aid lifetime limits.
• Waiving satisfactory academic progress requirements to help ensure that students do not lose academic standing and the ability to receive federal financial student aid.
• Tax credits that incentivize employers to help pay for student loans.
Basis of Accounting and Presentation
These financial statements were prepared to report the financial position, net cost of operations, changes in net position, and budgetary resources of FSA as required by the Chief Financial Officers Act of 1990 and the Government Management Reform Act of 1994. The financial statements were prepared from the books and records of the Department and FSA, in accordance with Generally Accepted Accounting Principles (GAAP) accepted in the United States for federal entities, issued by the Federal Accounting Standards Advisory Board (FASAB), and the Office of Management and Budget (OMB) Circular No. A-136, Financial Reporting Requirements, as revised. These financial statements are different from the financial reports prepared by the Department pursuant to OMB directives that are used to monitor and control FSA’s use of budgetary resources.
The accounting structure of federal agencies is designed to reflect both accrual and budgetary accounting transactions. Under the accrual method of accounting, revenues are recognized when earned and expenses are recognized when a liability is incurred, without regard to receipt
158 Fiscal Year 2021 Annual Report | Federal Student Aid
Notes to the Financial Statements
or payment of cash. Budgetary accounting facilitates compliance with legal constraints and controls over the use of federal funds.
Transactions and balances among FSA funds have been eliminated from the consolidated financial statements.
Accounting standards require all reporting entities to disclose that accounting standard practices allow certain presentations and disclosures to be modified, if needed, to prevent the disclosure of classified information.
Accounting for Federal Credit Programs
FSA’s accounting for its loan and loan guarantees is based on the requirements of the Federal Credit Reform Act of 1990 (FCRA). The purpose of the FCRA is to record the lifetime subsidy cost of Direct Loans and loan guarantees, in present value terms, at the time the loan is disbursed (subsidy). Components of subsidy costs for loans and guarantees include defaults (net of recoveries); contractual payments to third-party, private loan collectors who receive a set percentage of amounts collected; and, as an offset, origination and other fees collected. For Direct Loans, the difference between interest rates incurred by FSA on its borrowings from the U.S. Department of Treasury (Treasury) and interest rates charged to particular borrowers is also subsidized (or may provide an offset to subsidy if FSA’s rate is less).
Under the FCRA, subsidy cost is estimated using the net present value of future cash flows to and from FSA. In accordance with the FCRA, credit programs either estimate a subsidy cost to the government (a “positive” subsidy), breakeven (zero subsidy cost), or estimate a negative subsidy cost. Negative subsidy occurs when the estimated cost of providing loans to borrowers from Treasury borrowing, collection costs and loan forgiveness is less than the value of collections from borrowers for interest and fees, in present value terms.
Subsidy cost is an estimate of the present value cost of providing Direct Loans but excludes the administrative costs of issuing and servicing the loans. FSA estimates subsidy expense using a set of econometric and financial models, as well as cash flow models.
FSA estimates subsidy costs annually for new loans disbursed in the current year; updates to the previous cost estimates for outstanding loans disbursed in prior years (subsidy re-estimates); and updates to previous cost estimates based on new legislation or other government actions that change the terms of existing loans (loan modifications) that alter the estimated subsidy cost and the present value of outstanding loans. Loan modifications can also include modification adjustment gains and losses to account for the difference between the discount rate used to calculate the cost of the modification and the interest rate at which the cohort pays or earns interest.
The subsidy cost of Direct Loan and loan guarantee programs are budgeted and tracked by the fiscal year in which the loan award is made, or the funds committed. Such a grouping of loans or guarantees is referred to as a “cohort.” A cohort is a grouping of Direct Loans obligated or loan guarantees committed by a program in the same year even if disbursements occur in subsequent years.
In order to account for the change in the net present value of the loan portfolio over time, the subsidy cost is amortized each year. Amortization accounts for the differences in interest rates,
MM
Fiscal Year 2021 Annual Report | Federal Student Aid 159
Notes to the Financial Statements
accruals, and cash flows over the life of a cohort, ensuring that cost is reflected in subsidy estimates and re-estimates. Amortization of subsidy is calculated as the difference between interest received from borrowers and Treasury (on uninvested funds) and interest paid to Treasury on borrowings.
The FCRA establishes the use of financing, program, and Treasury General Fund receipt accounts for loan guarantees committed and Direct Loans obligated after September 30, 1991.
• Financing accounts borrow funds from Treasury, make Direct Loan disbursements, collect fees from lenders and borrowers, pay claims on guaranteed loans, collect principal and interest from borrowers, earn interest from Treasury on any uninvested funds, and transfer excess subsidy to Treasury General Fund receipt accounts. Financing accounts are presented separately in the combined statements of budgetary resources (SBR) as non-budgetary credit reform accounts to allow for a clear distinction from all other budgetary accounts. This facilitates reconciliation of the SBR to the Budget of the United States Government.
• Program accounts receive and obligate appropriations to cover the positive subsidy cost of a Direct Loan or loan guarantee when the loan is approved and disburses the subsidy cost to the financing account when the loan is issued. Program accounts also receive appropriations for administrative expenses.
• Treasury General Fund receipt accounts receive amounts paid from financing accounts when there are negative subsidies for new loan disbursements or downward re-estimates of the subsidy cost of existing loans. (See Notes 12 and 13)
FSA records an obligation each year for Direct Loan awards to be made in a fiscal year based on estimates of schools’ receipt of aid applications. FSA advances funds to schools based on these estimates. Promissory notes are signed when schools reach individual agreements with borrowers and the schools subsequently report each disbursement of advanced funds to FSA. A new promissory note is usually not required for students in the second or later year of study.
Half of all loan awards are issued in the fourth quarter of the fiscal year. Loans awarded are typically disbursed in multiple installments over an academic period. As a result, loans may be disbursed over multiple fiscal years. Loan awards may not be fully disbursed due to students leaving or transferring to other schools. FSA’s obligation estimate may also not reflect the actual amount of awards made. Based on historical averages, FSA expects approximately 8.9 percent of the amount obligated for new loan awards will not be disbursed.
When a loan is placed in deferment or forbearance, loan repayment is temporarily suspended with the length of postponement different for each borrower. Interest accrues while a loan is in deferment or forbearance. Loans are cancelled if a person dies, meets disability requirements, or occasionally through the bankruptcy courts. Loans are also cancelled through the Public Service Loan Forgiveness (PSLF) program, which forgives the remaining balance on a Direct Loan after 120 qualifying monthly payments are made. These payments must be made under a qualifying repayment plan while working full-time for a qualifying employer. In addition, FSA offers the Pay As You Earn (PAYE) program. This student loan repayment program is designed to help borrowers who struggle to make their normal student loan payments. The plan allows payments to be limited to 10 percent of discretionary income if qualifications are met. Under the
160 Fiscal Year 2021 Annual Report | Federal Student Aid
Notes to the Financial Statements
PAYE program, if all requirements are met, forgiveness of the remaining balance of a student loan is possible after 20 years of payments.
Budgetary Resources
Budgetary resources are amounts available to enter into new obligations and to liquidate them. FSA’s budgetary resources include unobligated balances of resources from prior years and new resources, which include appropriations, authority to borrow from Treasury, and spending authority from collections.
Borrowing authority is an indefinite budgetary resource authorized under the FCRA. This resource, when realized, finances the unsubsidized portion of the Direct Loan, FFEL, and other loan programs. In addition, borrowing authority is requested to cover the cost of the initial loan disbursement as well as any related negative subsidy to be transferred to Treasury General Fund receipt accounts. Treasury prescribes the terms and conditions of borrowing authority and lends to the financing account amounts as appropriate. Amounts borrowed, but not yet disbursed, are included in uninvested funds and earn interest. Treasury uses the same weighted average interest rates for both the interest charged on borrowed funds and the interest earned on uninvested funds. Treasury sets a different fixed interest rate to be used for each loan cohort once the loans are substantially disbursed. FSA may carry forward borrowing authority to future fiscal years if cohorts are disbursing loans. All borrowings from Treasury are effective on October 1 of the current fiscal year, regardless of when FSA borrowed the funds, except for amounts borrowed to make annual interest payments.
Authority to borrow from Treasury provides most of the funding for disbursements made under the Direct Loan program, FFEL, and other loan programs. Subsidy and administrative costs of the programs are funded by appropriations. Borrowings are repaid using collections from borrowers, fees, and interest on uninvested funds.
Unobligated balances represent the cumulative amount of budgetary resources that are not obligated and that remain available for obligation under law, unless otherwise restricted. Resources expiring at the end of the fiscal year remain available for five years, but only for upward adjustments of prior-year obligations, after which they are canceled and may not be used. Resources that have not expired at year-end are available for new obligations, as well as upward adjustments of prior-year obligations. Funds are appropriated on an annual, multiyear, or no-year basis. Appropriated funds expire on the last day of availability and are no longer available for new obligations. Amounts in expired funds are unavailable for new obligations but may be used to adjust previously established obligations.
Permanent Indefinite Budget Authority. The Direct Loan, FFEL, and other loan programs have permanent indefinite budget authority through legislation. Parts B, Federal Family Education Loan Program, and D, Federal Direct Student Loan, of the HEA pertain to the existence, purpose, and availability of permanent indefinite budget authority for these programs.
Reauthorization of Legislation. Funds for most FSA programs are authorized, by statute, to be appropriated for a specified number of years, with an automatic one-year extension available under Section 422 of the General Education Provisions Act. Congress may continue to appropriate funds after the expiration of the statutory authorization period, effectively reauthorizing the program through the appropriations process. The current President’s Budget
MM
Fiscal Year 2021 Annual Report | Federal Student Aid 161
Notes to the Financial Statements
presumes all programs continue in accordance with congressional budgeting rules. (See Note 12)
Entity and Non-Entity Assets
Assets are classified as either entity or non-entity assets. Entity assets are those that FSA has authority to use for its operations. Non-entity assets are those held by FSA but not available for use in its operations. FSA non-entity assets are offset by liabilities to third parties and have no impact on net position. FSA combines its entity and non-entity assets on the balance sheets and discloses its non-entity assets in the notes. (See Note 2)
Fund Balance with Treasury
The Fund Balance with Treasury includes amounts available to pay current liabilities and finance authorized purchases, as well as funds restricted until future appropriations are received. Treasury processes cash receipts and cash disbursements for FSA. FSA’s records are reconciled with Treasury’s records. (See Note 3)
Accounts Receivable
Accounts receivable are amounts due to FSA from the public and other federal agencies. Receivables from the public result from overpayments to recipients of grants and other financial assistance programs, and disputed costs resulting from audits of educational assistance programs. Amounts due from federal agencies result from reimbursable agreements entered into by FSA with other agencies to provide various goods and services. Accounts receivable are reduced to net realizable value by an allowance for uncollectible amounts. The estimate of an allowance for loss on uncollectible accounts is based on FSA’s experience in the collection of receivables and an analysis of the outstanding balances. (See Note 4)
Cash and Other Monetary Assets
Cash and other monetary assets are the federal government’s interest in the program assets held by state and nonprofit FFEL Program guaranty agencies (guaranty agencies’ federal funds). Section 422A of the HEA required FFEL guaranty agencies to establish federal student loan reserve funds. Guaranty agencies’ federal funds include initial federal start-up funds, receipts of federal reinsurance payments, insurance premiums, guaranty agency share of collections on defaulted loans, investment income, administrative cost allowances, and other assets.
The balance of guaranty agencies’ federal funds represents consolidated reserve balances of the 20 guaranty agencies based on the guaranty agency financial reports that each agency submits annually to FSA. Although FSA and the guaranty agencies operate on different fiscal years, all guaranty agencies are subject to an annual audit. A year-end valuation adjustment is made to adjust FSA’s balances to comply with federal accounting principles and disclose funds held outside of Treasury.
Guaranty agencies’ federal funds are classified as non-entity assets with the public and are offset by a corresponding liability due to Treasury on FSA’s balance sheets. The funds are held by the guaranty agencies but can only be used for certain specific purposes listed in FSA’s regulations. The guaranty agencies’ federal funds are the property of the U.S. and are reflected
162 Fiscal Year 2021 Annual Report | Federal Student Aid
Notes to the Financial Statements
in the Budget of the United States Government. Payments made to FSA from guaranty agencies’ federal funds through a statutory recall or agency closures represent capital transfers and are returned to Treasury’s General Fund. (See Note 2)
Loan Receivables, Net and Loan Guarantee Liabilities
The financial statements reflect FSA’s estimate of the long-term subsidy cost of direct and guaranteed loans in accordance with the FCRA. Loans and interest receivable are valued at their gross amounts less an allowance for the present value of amounts not expected to be recovered, and thus having to be subsidized —called an “allowance for subsidy.” The difference between the gross amount and the allowance for subsidy is the present value of the cash flows to, and from, FSA that are expected from receivables over their projected lives. Similarly, liabilities for loan guarantees are valued at the present value of the cash outflows from FSA less the present value of related inflows. The estimated present value of net long-term cash outflows of FSA for subsidized costs is net of recoveries, interest supplements, and offsetting fees.
The loan guarantee liabilities presents the net present value of all future cash flows from currently insured FFEL loans, including claim payments, interest assistance, allowance payments, and recoveries from assigned loans. Guaranteed loans that default are initially turned over to guaranty agencies for collection. Defaulted FFEL loans are accounted for as assets and reported at their net present value, similar to Direct Loans, although they are legally not direct student loans. Credit program receivables, net includes defaulted FFEL loans owned by FSA and held by FSA or guaranty agencies. In most cases, after approximately four years, defaulted guaranteed loans not in repayment are turned over by the guaranty agencies to FSA for collection.
FFEL Program receivables include purchased loans and other interests acquired under an expired program. The cash flows related to these receivables include collections on purchased loans and other activities, including transfers of re-estimated subsidy. The cash flows of these authorities also include inflows and outflows associated with the underlying or purchased loans and other related activities, including any positive or negative subsidy transfers.
Capitalization of interest occurs as a result of various initiatives such as loan consolidations. As a result, interest receivable is reduced, and loan principal is increased. (See Note 5)
Property and Equipment, Net and Leases
FSA has very limited acquisition costs associated with buildings, furniture, and equipment as all federal and contractor staff are housed in leased buildings. The Department and FSA also lease information technology and telecommunications equipment, as part of a contractor-owned, contractor-operated services contract. Lease payments associated with this equipment have been determined to be operating leases and, as such, are expensed as incurred. The noncancellable lease term is one year, with the Department holding the right to extend the lease term by exercising additional one-year options. (See Note 4)
Liabilities
Liabilities represent actual and estimated amounts to be paid as a result of transactions or events that have already occurred.
MM
Fiscal Year 2021 Annual Report | Federal Student Aid 163
Notes to the Financial Statements
• Liabilities are classified as covered by budgetary resources if budgetary resources are available to pay them. Credit program liabilities funded by permanent indefinite appropriations are also considered covered by budgetary resources.
• Liabilities are classified as not covered by budgetary resources when congressional action is needed before they can be paid. Although future appropriations to fund these liabilities are likely, it is not certain that appropriations will be enacted to fund these liabilities.
• Liabilities not requiring appropriated budgetary resources include those related to deposit funds, Subsidy Due to Treasury General Fund for Future Liquidating Account Collections (pre-1992 loan guarantee programs), and Federal Perkins Loan program balances due to be repaid to the Treasury General Fund (See Note 6).
Debt Associated with Loans
FSA borrows from Treasury to provide funding for the Direct Loan, FFEL, and other credit programs for higher education. The liability to Treasury from borrowings represents unpaid principal at year-end. FSA repays the principal based on available fund balances. Interest rates are based on the corresponding rate for 10-year Treasury securities and are set for those borrowings supporting each cohort of loans once the loans for that cohort are substantially disbursed. Interest is paid to Treasury on September 30. (See Note 7)
Subsidy Due to Treasury
FSA must transfer to the Treasury General Fund all excess funding resulting from downward re- estimates of credit program loans that are subject to FCRA requirements. This excess funding is included in the liability for subsidy due to Treasury and will be transferred to Treasury in the succeeding fiscal year upon receipt of authority from OMB. Subsidy due to Treasury also includes future liquidating account collections (estimated collections in excess of estimated outlays) for FSA’s pre-1992 FFEL and HEAL loans that, when collected, will also be transferred to the Treasury General Fund. (See Note 8)
Accounts Payable
Accounts payable include amounts owed by FSA for goods and services received from other entities and scheduled payments transmitted but not yet processed. Accounts payable to the public primarily consists of in-process grant and loan disbursements, including an accrued liability for schools that have disbursed loans before requesting funds. (See Note 9)
Accrued Grant Liability
Some grant recipients incur allowable expenditures as of the end of an accounting period but have not been reimbursed by FSA. FSA accrues a liability for these allowable expenditures. The amount is estimated using statistical sampling of unliquidated balances. (See Note 9)
Personnel Compensation and Other Employee Benefits
Annual, Sick, and Other Leave. The liability for annual leave, compensatory time off, and other vested leave is accrued when earned and reduced when taken. Each year, the accrued annual
164 Fiscal Year 2021 Annual Report | Federal Student Aid
Notes to the Financial Statements
leave account balance is adjusted to reflect current pay rates. Sick leave and other types of nonvested leave are expensed as taken. Annual leave earned but not taken, within established limits, is funded from future financing sources.
Retirement Plans and Other Retirement Benefits. Employees participate in either the Civil Service Retirement System (CSRS), a defined benefit plan, or the Federal Employees Retirement System (FERS), a defined benefit and contribution plan. For CSRS employees, FSA contributes a fixed percentage of pay.
FERS consists of Social Security, a basic annuity plan, and the Thrift Savings Plan. FSA and the employee contribute to Social Security and the basic annuity plan at rates prescribed by law. In addition, FSA is required to contribute to the Thrift Savings Plan a minimum of 1 percent per year of the basic pay of employees covered by this system, match voluntary employee contributions up to 3 percent of the employee’s basic pay, and match one-half of contributions between 3 percent and 5 percent of the employee’s basic pay. For FERS employees, FSA also contributes the employer’s share of Medicare.
Contributions for CSRS, FERS, and other retirement benefits are insufficient to fund the programs fully and are subsidized by the Office of Personnel Management (OPM). FSA imputes its share of the OPM subsidy, using cost factors provided by OPM, and reports the full cost of the programs related to its employees in FSA’s Statements of Net Cost. These OPM imputed costs are offset by imputed financing sources from costs absorbed by others in FSA’s Statements of Changes in Net Position.
Federal Employees’ Compensation Act. The Federal Employees’ Compensation Act (FECA) (Pub. L. 103-3) provides income and medical cost protection to covered federal civilian employees injured on the job, to employees who have incurred work-related occupational diseases, and to beneficiaries of employees whose deaths are attributable to job-related injuries or occupational diseases. The FECA program is administered by the U.S. Department of Labor (DOL), which pays valid claims and subsequently seeks reimbursement from FSA for these paid claims.
The FECA liability consists of two elements. The first element, accrued FECA liability, is based on claims paid by DOL but not yet reimbursed by FSA. FSA reimburses DOL for claims as funds are appropriated for this purpose. In general, there is a two- to three-year period between payment by DOL and reimbursement to DOL by FSA. As a result, FSA recognizes an intragovernmental liability, not covered by budgetary resources, for the claims paid by DOL that will be reimbursed by FSA.
The second element, actuarial FECA liability, is the estimated liability for future benefit payments and is recorded as a liability with the public, not covered by budgetary resources. The actuarial FECA liability includes the expected liability for death, disability, medical, and miscellaneous costs for approved compensation cases. DOL determines the actuarial FECA liability annually, as of September 30, using an actuarial method that considers historical benefit payment patterns, wage inflation factors, medical inflation factors, and other variables. The projected annual benefit payments are discounted to present value. (See Notes 6 and 9)
MM
Fiscal Year 2021 Annual Report | Federal Student Aid 165
Notes to the Financial Statements
Imputed Costs
Services are received from other federal entities at no cost or at a cost less than the full cost to FSA. Consistent with accounting standards, certain costs of the providing entity that are not fully reimbursed by FSA are recognized as imputed cost in the Statements of Net Cost and are offset by imputed revenue in the Statements of Changes in Net Position. Such imputed costs and revenues relate to employee benefits. However, unreimbursed costs of services other than those related to employee benefits are not included in FSA’s financial statements.
Net Cost
Net cost consists of gross costs and earned revenue. Major components of FSA’s net costs include credit program subsidy expense, credit program interest revenue and expense, and grant expenses. Administrative overhead costs are allocated to loan and non-credit programs based on number of applications processed, number of loans serviced, dollar amount of loan originations, cost of school compliance actions, and the cost to collect defaulted loans. (See Note 10)
Credit Program Subsidy Expense. Subsidy expense is an estimate of the present value cost of providing loans, excluding the administrative costs of issuing and servicing the loans. To estimate subsidy expense, FSA must project lifetime cash flows associated with loans disbursed in a specific fiscal year (i.e., the loan cohort). FSA projects these lifetime cash flows using a set of econometric and financial models, as well as cash flow models. FSA estimates subsidy expenses annually for new loans disbursed in the current year; updates the previous cost estimates for outstanding loans disbursed in prior years (subsidy re-estimates); and updates previous cost estimates based on changes to terms of existing loans (loan modifications). Loan modifications include actions resulting from new legislation or from the exercise of administrative discretion under existing law, which directly or indirectly alters the estimated subsidy cost of outstanding Direct Loans (or Direct Loan obligations). The change in book value of Direct Loans resulting from a modification and the cost of modification will normally differ due to the use of different discount rates or the use of different measurement methods. Any difference between the change in book value and the cost of modification is recognized as a modification adjustment transfer gain or a modification adjustment transfer loss. (See Notes 5 and 10) Credit Program Interest Revenue and Expense. FSA recognizes interest revenue from the public when interest is accrued on Direct Loan Program loans, defaulted and acquired FFEL loans, and outstanding principal for other loan programs. Interest due from borrowers is accrued at least monthly and is satisfied upon collection or capitalization into the loan principal. Federal interest revenue is recognized on the unused fund balances with Treasury in the financing accounts. Federal interest expense is recognized monthly on the outstanding borrowing from Treasury (debt) used to finance Direct Loan and loan guarantee programs. Accrued interest to Treasury is paid on September 30. The interest rate for federal interest expense is the same as the rate used for federal interest revenue. Interest expense equals interest revenue plus administrative fees accrued for all credit programs due to subsidy amortization. Subsidy amortization is required by the FCRA and accounts for the difference between interest expense and revenue cash flows. For
166 Fiscal Year 2021 Annual Report | Federal Student Aid
Notes to the Financial Statements
Direct Loans, the allowance for subsidy is adjusted with the offset to interest revenue. For guaranteed loans, the liability for loan guarantees is adjusted with the offset to interest expense. (See Note 10)
Net Position
Net position consists of unexpended appropriations and cumulative results of operations. Unexpended appropriations include undelivered orders and unobligated balances, except for federal credit financing and liquidating funds and trust funds. Cumulative results of operations represent the net difference since inception between (1) expenses and (2) revenues and financing sources.
Taxes
FSA is a federal entity and is not subject to federal, state, or local taxes. Therefore, no provision for income taxes is recorded.
Use of Estimates
FSA and Department management are required to make certain estimates while preparing consolidated financial statements in conformity with GAAP. These estimates are reflected in the assets, liabilities, net cost, and net position of the financial statements and may differ from actual results. FSA’s estimates are based on management’s best knowledge of current events, best available data, economic assumptions, historical experiences, and other assumptions that are believed to be reasonable under the circumstances. Significant estimates reported on the financial statements include: allocation of administrative overhead costs; allowance for subsidy and subsidy expense for direct, defaulted guaranteed and acquired loans; the liability for loan guarantees; and grant liability and advance accruals. (See Notes 4, 5, 9, and 10)
FSA’s estimates for credit reform programs are calculated using a series of assumption models that are updated using a statistically valid sample of National Student Loan Data System (NSLDS®) data, data from the Debt Management and Collection System (DMCS), and economic assumptions provided by the Office of Management and Budget. Actual results may differ from those assumptions and estimates. Differences between actual results and these estimates may occur in the valuation of credit program receivables and liabilities for loan guarantees under guidelines in the FCRA. FSA recognizes the sensitivity of credit reform modeling. Slight changes in modeling methodology or data used to derive assumptions can produce largely varied results. FSA therefore continually reviews its model factors and statistical modeling techniques to reflect the most accurate credit program costs possible in its annual financial statements. FSA updates its assumption models in accordance with its model update plan, which takes into consideration statutory or new program requirements, major changes to the model structure or methodology, and data updates. This level of granularity in the modeling methodology is essential to the financial reporting and budgeting processes so that FSA can forecast the costs of various program options when making policy decisions. (See Note 5)
Reclassifications
The following reclassifications were made to the prior year financial statements and notes to conform to the current year presentation. These changes had no effect on total assets, liabilities and net position, net cost of operations, or budgetary resources.
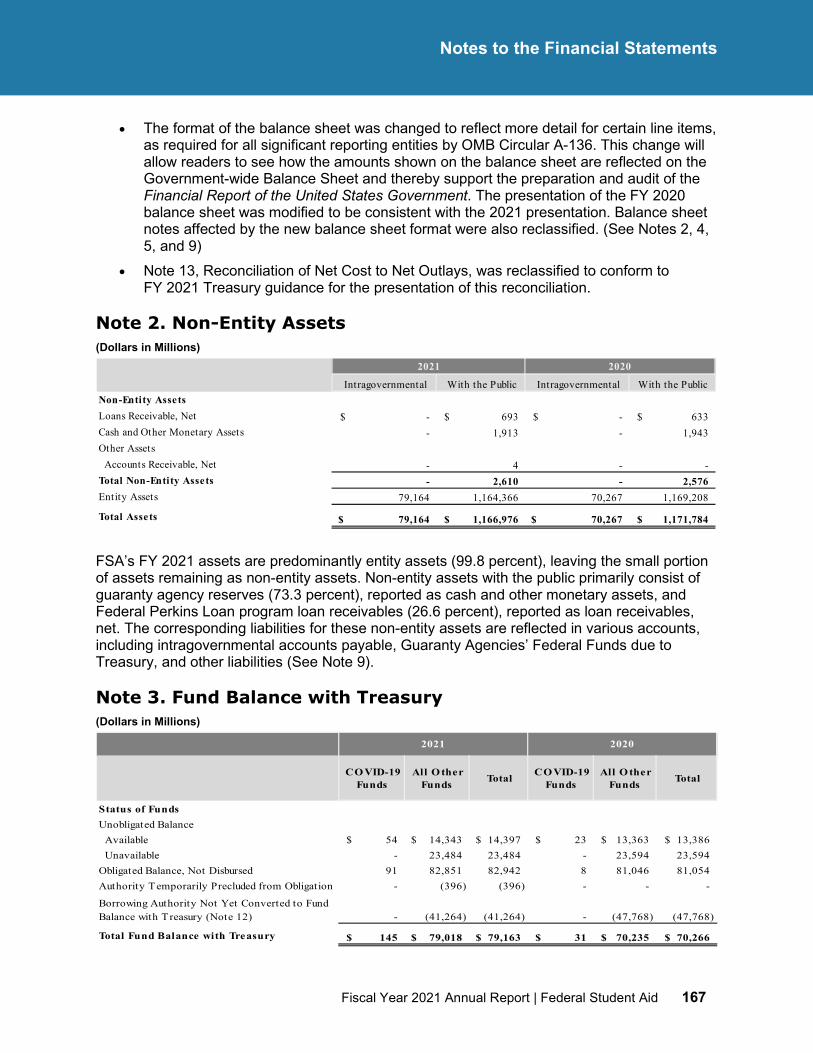
MM
Fiscal Year 2021 Annual Report | Federal Student Aid 167
Notes to the Financial Statements
• The format of the balance sheet was changed to reflect more detail for certain line items, as required for all significant reporting entities by OMB Circular A-136. This change will allow readers to see how the amounts shown on the balance sheet are reflected on the Government-wide Balance Sheet and thereby support the preparation and audit of the Financial Report of the United States Government. The presentation of the FY 2020 balance sheet was modified to be consistent with the 2021 presentation. Balance sheet notes affected by the new balance sheet format were also reclassified. (See Notes 2, 4, 5, and 9)
• Note 13, Reconciliation of Net Cost to Net Outlays, was reclassified to conform to FY 2021 Treasury guidance for the presentation of this reconciliation.
Note 2. Non-Entity Assets (Dollars in Millions)
FSA’s FY 2021 assets are predominantly entity assets (99.8 percent), leaving the small portion of assets remaining as non-entity assets. Non-entity assets with the public primarily consist of guaranty agency reserves (73.3 percent), reported as cash and other monetary assets, and Federal Perkins Loan program loan receivables (26.6 percent), reported as loan receivables, net. The corresponding liabilities for these non-entity assets are reflected in various accounts, including intragovernmental accounts payable, Guaranty Agencies’ Federal Funds due to Treasury, and other liabilities (See Note 9).
Note 3. Fund Balance with Treasury (Dollars in Millions)
Intragovernmental With the Public Intragovernmental With the Public Non-Entity AssetsLoans Receivable, Net -$ 693$ -$ 633$ Cash and Other Monetary Assets - 1,913 - 1,943 Other Assets Accounts Receivable, Net - 4 - - Total Non-Entity Assets - 2,610 - 2,576 Entity Assets 79,164 1,164,366 70,267 1,169,208
Total Assets 79,164$ 1,166,976$ 70,267$ 1,171,784$
2021 2020
CO VID-19 Funds
All O ther Funds Total CO VID-19
Funds All O ther
Funds Total
Status of FundsUnobligated Balance Available 54$ 14,343$ 14,397$ 23$ 13,363$ 13,386$ Unavailable - 23,484 23,484 - 23,594 23,594 Obligated Balance, Not Disbursed 91 82,851 82,942 8 81,046 81,054 Authority Temporarily Precluded from Obligation - (396) (396) - - -
Borrowing Authority Not Yet Converted to Fund Balance with Treasury (Note 12) - (41,264) (41,264) - (47,768) (47,768)
Total Fund Balance with Treasury 145$ 79,018$ 79,163$ 31$ 70,235$ 70,266$
2021 2020
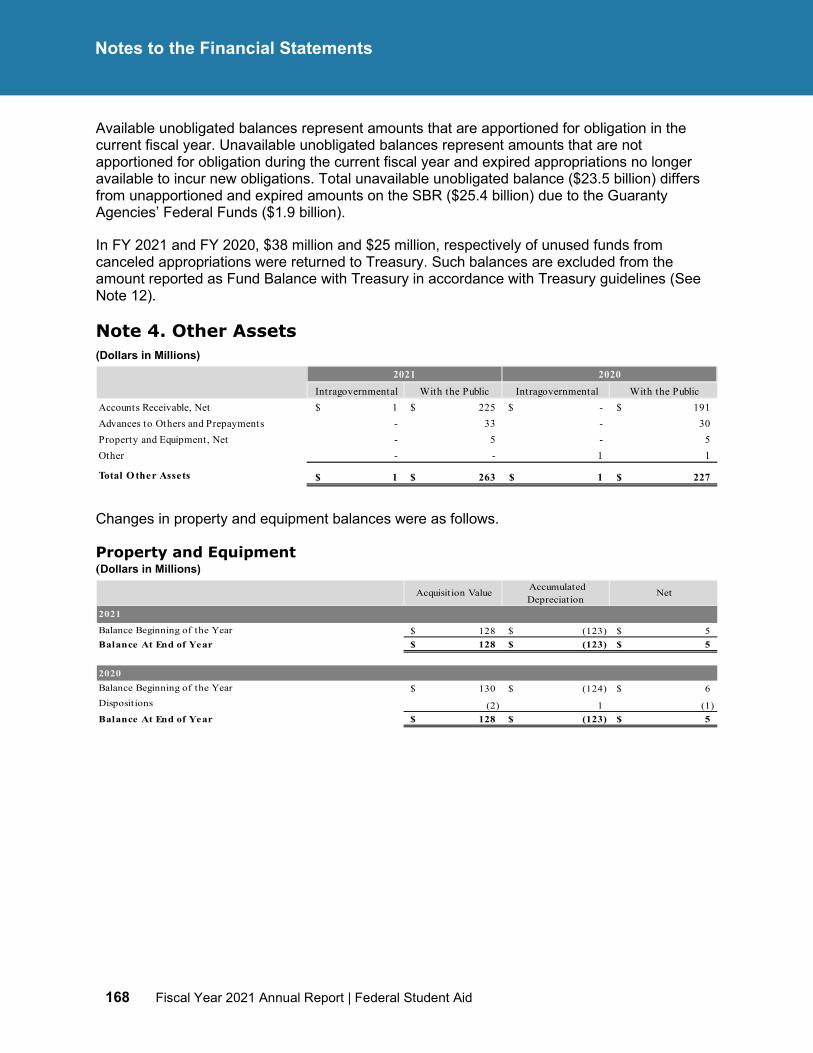
168 Fiscal Year 2021 Annual Report | Federal Student Aid
Notes to the Financial Statements
Available unobligated balances represent amounts that are apportioned for obligation in the current fiscal year. Unavailable unobligated balances represent amounts that are not apportioned for obligation during the current fiscal year and expired appropriations no longer available to incur new obligations. Total unavailable unobligated balance ($23.5 billion) differs from unapportioned and expired amounts on the SBR ($25.4 billion) due to the Guaranty Agencies’ Federal Funds ($1.9 billion).
In FY 2021 and FY 2020, $38 million and $25 million, respectively of unused funds from canceled appropriations were returned to Treasury. Such balances are excluded from the amount reported as Fund Balance with Treasury in accordance with Treasury guidelines (See Note 12).
Note 4. Other Assets (Dollars in Millions)
Changes in property and equipment balances were as follows.
Property and Equipment (Dollars in Millions)
Intragovernmental With the Public Intragovernmental With the Public Accounts Receivable, Net 1$ 225$ -$ 191$ Advances to Others and Prepayments - 33 - 30 Property and Equipment, Net - 5 - 5 Other - - 1 1
Total O ther Assets 1$ 263$ 1$ 227$
2021 2020
Acquisition Value AccumulatedDepreciation
Net
Balance Beginning of the Year 128$ (123)$ 5$ Balance At End of Year 128$ (123)$ 5$
Balance Beginning of the Year 130$ (124)$ 6$ Dispositions (2) 1 (1) Balance At End of Year 128$ (123)$ 5$
2021
2020
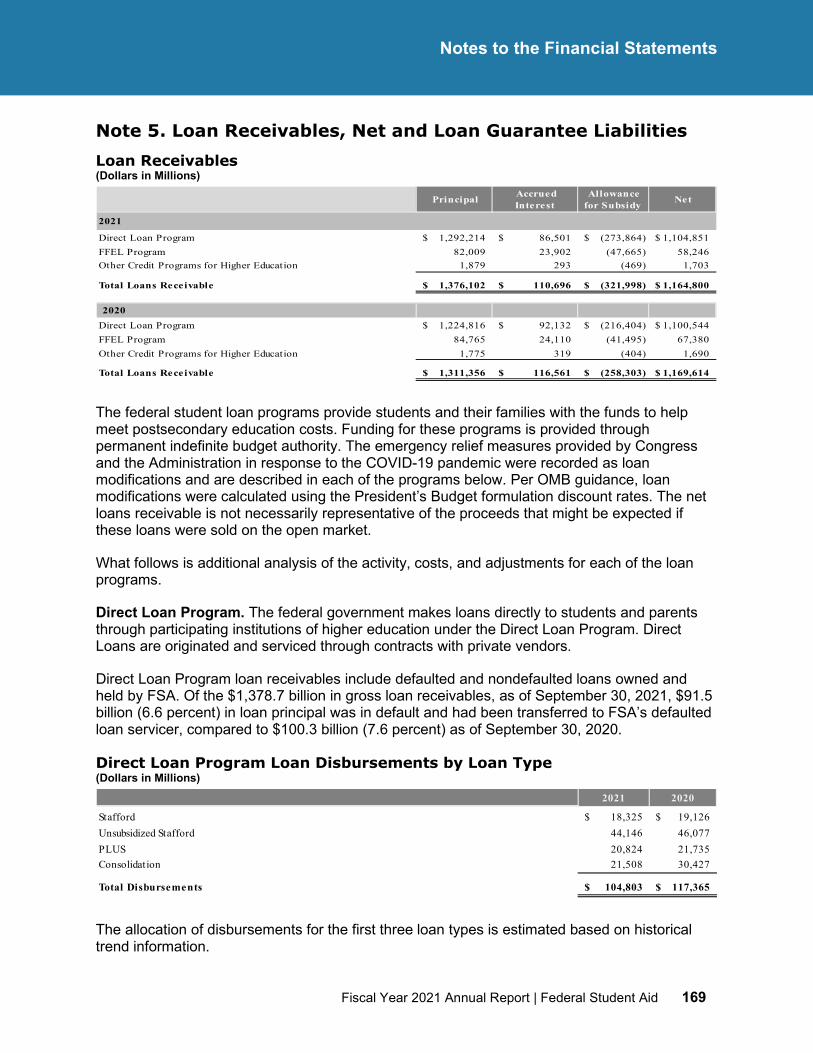
MM
Fiscal Year 2021 Annual Report | Federal Student Aid 169
Notes to the Financial Statements
Note 5. Loan Receivables, Net and Loan Guarantee Liabilities Loan Receivables (Dollars in Millions)
The federal student loan programs provide students and their families with the funds to help meet postsecondary education costs. Funding for these programs is provided through permanent indefinite budget authority. The emergency relief measures provided by Congress and the Administration in response to the COVID-19 pandemic were recorded as loan modifications and are described in each of the programs below. Per OMB guidance, loan modifications were calculated using the President’s Budget formulation discount rates. The net loans receivable is not necessarily representative of the proceeds that might be expected if these loans were sold on the open market.
What follows is additional analysis of the activity, costs, and adjustments for each of the loan programs.
Direct Loan Program. The federal government makes loans directly to students and parents through participating institutions of higher education under the Direct Loan Program. Direct Loans are originated and serviced through contracts with private vendors.
Direct Loan Program loan receivables include defaulted and nondefaulted loans owned and held by FSA. Of the $1,378.7 billion in gross loan receivables, as of September 30, 2021, $91.5 billion (6.6 percent) in loan principal was in default and had been transferred to FSA’s defaulted loan servicer, compared to $100.3 billion (7.6 percent) as of September 30, 2020.
Direct Loan Program Loan Disbursements by Loan Type (Dollars in Millions)
The allocation of disbursements for the first three loan types is estimated based on historical trend information.
Principal AccruedInterest
Allowance for Subsidy Net
2021
Direct Loan Program 1,292,214$ 86,501$ (273,864)$ 1,104,851$ FFEL Program 82,009 23,902 (47,665) 58,246 Other Credit Programs for Higher Education 1,879 293 (469) 1,703
Total Loans Receivable 1,376,102$ 110,696$ (321,998)$ 1,164,800$
2020Direct Loan Program 1,224,816$ 92,132$ (216,404)$ 1,100,544$ FFEL Program 84,765 24,110 (41,495) 67,380 Other Credit Programs for Higher Education 1,775 319 (404) 1,690
Total Loans Receivable 1,311,356$ 116,561$ (258,303)$ 1,169,614$
2021 2020
Stafford 18,325$ 19,126$ Unsubsidized Stafford 44,146 46,077 PLUS 20,824 21,735 Consolidation 21,508 30,427
Total Disbursements 104,803$ 117,365$
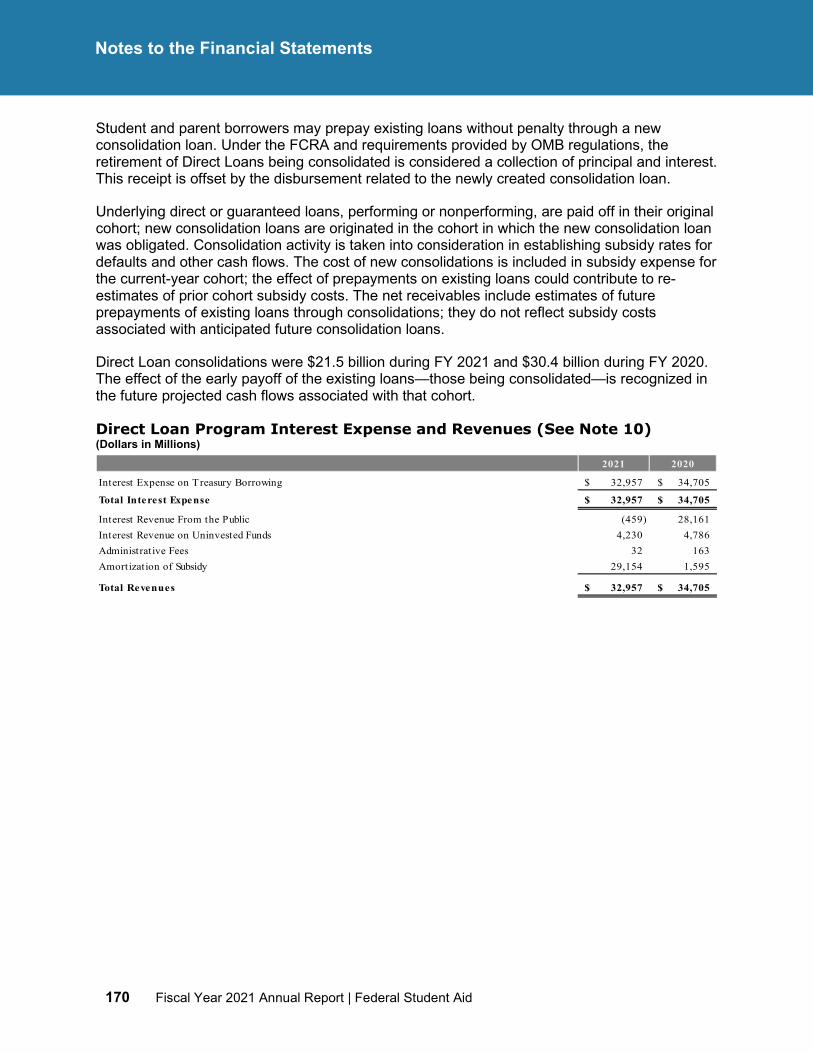
170 Fiscal Year 2021 Annual Report | Federal Student Aid
Notes to the Financial Statements
Student and parent borrowers may prepay existing loans without penalty through a new consolidation loan. Under the FCRA and requirements provided by OMB regulations, the retirement of Direct Loans being consolidated is considered a collection of principal and interest. This receipt is offset by the disbursement related to the newly created consolidation loan.
Underlying direct or guaranteed loans, performing or nonperforming, are paid off in their original cohort; new consolidation loans are originated in the cohort in which the new consolidation loan was obligated. Consolidation activity is taken into consideration in establishing subsidy rates for defaults and other cash flows. The cost of new consolidations is included in subsidy expense for the current-year cohort; the effect of prepayments on existing loans could contribute to re- estimates of prior cohort subsidy costs. The net receivables include estimates of future prepayments of existing loans through consolidations; they do not reflect subsidy costs associated with anticipated future consolidation loans.
Direct Loan consolidations were $21.5 billion during FY 2021 and $30.4 billion during FY 2020. The effect of the early payoff of the existing loans—those being consolidated—is recognized in the future projected cash flows associated with that cohort.
Direct Loan Program Interest Expense and Revenues (See Note 10) (Dollars in Millions)
2021 2020
Interest Expense on Treasury Borrowing 32,957$ 34,705$
Total Interest Expense 32,957$ 34,705$
Interest Revenue From the Public (459) 28,161 Interest Revenue on Uninvested Funds 4,230 4,786 Administrative Fees 32 163 Amortization of Subsidy 29,154 1,595
Total Revenues 32,957$ 34,705$
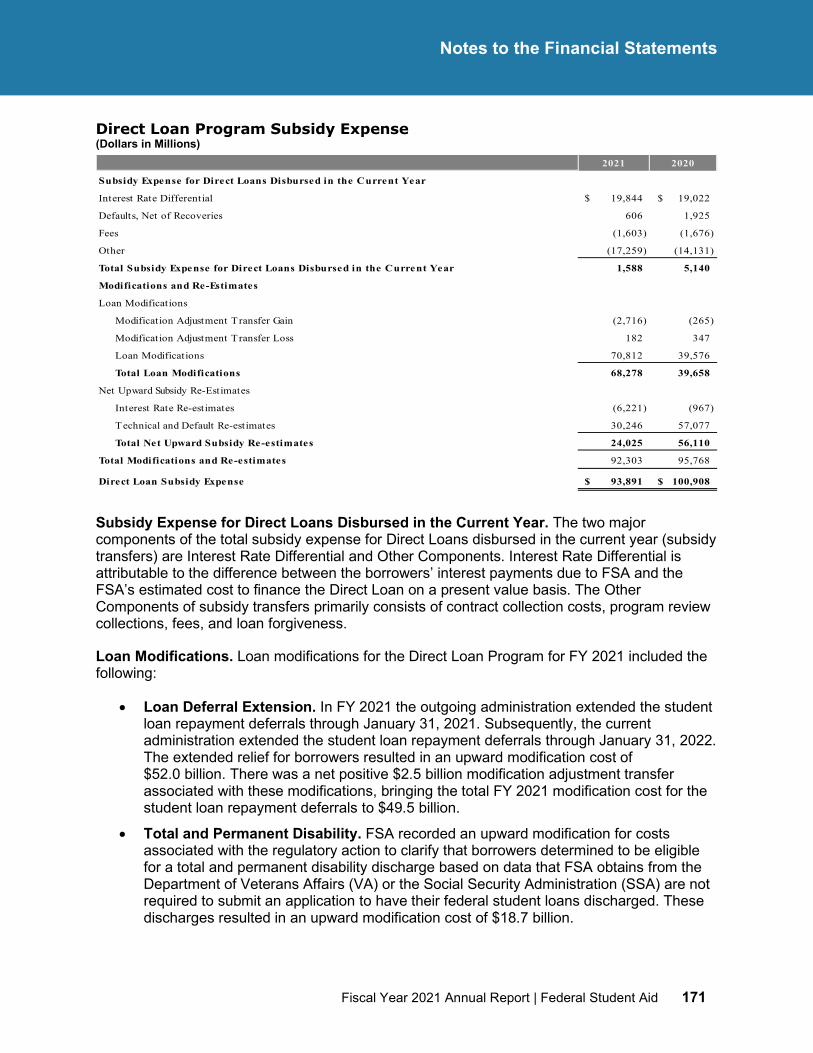
MM
Fiscal Year 2021 Annual Report | Federal Student Aid 171
Notes to the Financial Statements
Direct Loan Program Subsidy Expense (Dollars in Millions)
Subsidy Expense for Direct Loans Disbursed in the Current Year. The two major components of the total subsidy expense for Direct Loans disbursed in the current year (subsidy transfers) are Interest Rate Differential and Other Components. Interest Rate Differential is attributable to the difference between the borrowers’ interest payments due to FSA and the FSA’s estimated cost to finance the Direct Loan on a present value basis. The Other Components of subsidy transfers primarily consists of contract collection costs, program review collections, fees, and loan forgiveness.
Loan Modifications. Loan modifications for the Direct Loan Program for FY 2021 included the following:
• Loan Deferral Extension. In FY 2021 the outgoing administration extended the student loan repayment deferrals through January 31, 2021. Subsequently, the current administration extended the student loan repayment deferrals through January 31, 2022. The extended relief for borrowers resulted in an upward modification cost of $52.0 billion. There was a net positive $2.5 billion modification adjustment transfer associated with these modifications, bringing the total FY 2021 modification cost for the student loan repayment deferrals to $49.5 billion.
• Total and Permanent Disability. FSA recorded an upward modification for costs associated with the regulatory action to clarify that borrowers determined to be eligible for a total and permanent disability discharge based on data that FSA obtains from the Department of Veterans Affairs (VA) or the Social Security Administration (SSA) are not required to submit an application to have their federal student loans discharged. These discharges resulted in an upward modification cost of $18.7 billion.
2021 2020
Subsidy Expense for Direct Loans Disbursed in the Current Year
Interest Rate Differential 19,844$ 19,022$
Defaults, Net of Recoveries 606 1,925
Fees (1,603) (1,676)
Other (17,259) (14,131)
Total Subsidy Expense for Direct Loans Disbursed in the Current Year 1,588 5,140
Modifications and Re-Estimates
Loan Modifications
Modification Adjustment Transfer Gain (2,716) (265)
Modification Adjustment Transfer Loss 182 347
Loan Modifications 70,812 39,576
Total Loan Modifications 68,278 39,658
Net Upward Subsidy Re-Estimates
Interest Rate Re-estimates (6,221) (967)
Technical and Default Re-estimates 30,246 57,077
Total Net Upward Subsidy Re-estimates 24,025 56,110
Total Modifications and Re-estimates 92,303 95,768
Direct Loan Subsidy Expense 93,891$ 100,908$
172 Fiscal Year 2021 Annual Report | Federal Student Aid
Notes to the Financial Statements
• Faith-Based Final Rule. FSA recorded an upward modification to reflect the cost of updated program regulations that permit borrowers who work for employers that engage in religious instruction, worship services, or proselytizing to qualify for Public Service Loan Forgiveness so long as they meet the applicable standards. These updated regulations resulted in an upward modification cost of $0.1 billion.
Net Upward Subsidy Re-Estimates for All Prior Year Loan Cohorts. The Direct Loan Program subsidy re-estimate increased subsidy expense in FY 2021 by $24.0 billion. Re-estimated costs only include cohorts that are 90 percent disbursed (i.e., cohort years 1994–2020). The re-estimate reflects the assumption updates and other changes described below.
In addition to the major assumption updates described below, the re-estimate reflects several other assumption updates, including loan volume, disbursement, and enter repayment rates.
• Death, Disability, and Bankruptcy (DDB). FSA updated the data and made a technical change to extend the window for a DDB event to occur from 15 to 30 years. Those claims were included in the estimates of DDB rates previously, but the extended timeframe allows for a more realistic sense of their timing. The combined effect of these updates led to a new upward re-estimate of $3.2 billion.
• Income-Driven Repayment (IDR) Model Changes. FSA completed a standard IDR data update to reflect the immediate prior cycle for interest rates, defaults, prepayments, contract collection costs, and DDB. The DDB update includes adjustments for the Total Permanent Disability (TPD) regulation that resulted in increased disability rates related to the expanded opt-out process with SSA to match borrowers within the IDR model. In addition, actual data on borrower incomes was analyzed using the NSLDS data. The number of actual incomes for 2019 was very low due to impacts from the COVID-19 pandemic, which led to stable income calibration results compared to last year’s level of 35 percent. Payments in FY 2020 were adjusted to account for voluntary payments made by students during the payment pause as seen in the FSA data. The combined effect of these updates led to a net upward re-estimate of $22.4 billion.
• Deferment and Forbearance. FSA updated actual deferment and forbearance rates for FY 2020 and calibrated FY 2021 and FY 2022 rates using data from FSA on borrower payments made during the period of repayment deferral. The combined effect of these changes led to a net downward re-estimate of $4.8 billion.
• Collections. FSA updated the data and calibrated FY 2021 collection rates to reflect the extension of the repayment deferral. The combined effect of these changes led to a net upward re-estimate of $1.5 billion.
• Default. In addition to the adjustments for the extension of the student loan repayment deferrals, FSA updated the data and incorporated actual unemployment rates from the Bureau of Labor Statistics and projected unemployment rates from OMB. The combined effect of these changes led to a net downward re-estimate of $6.4 billion.
• Repayment Plan Selection. FSA incorporated new repayment plan data that showed a continuing increase in IDR plan usage. This update led to an upward re-estimate of $0.7 billion.
• 2020 Cohort Assumption Changes. The technical re-estimate cannot reflect the impacts of certain assumption changes applicable to the current year loan cohort until
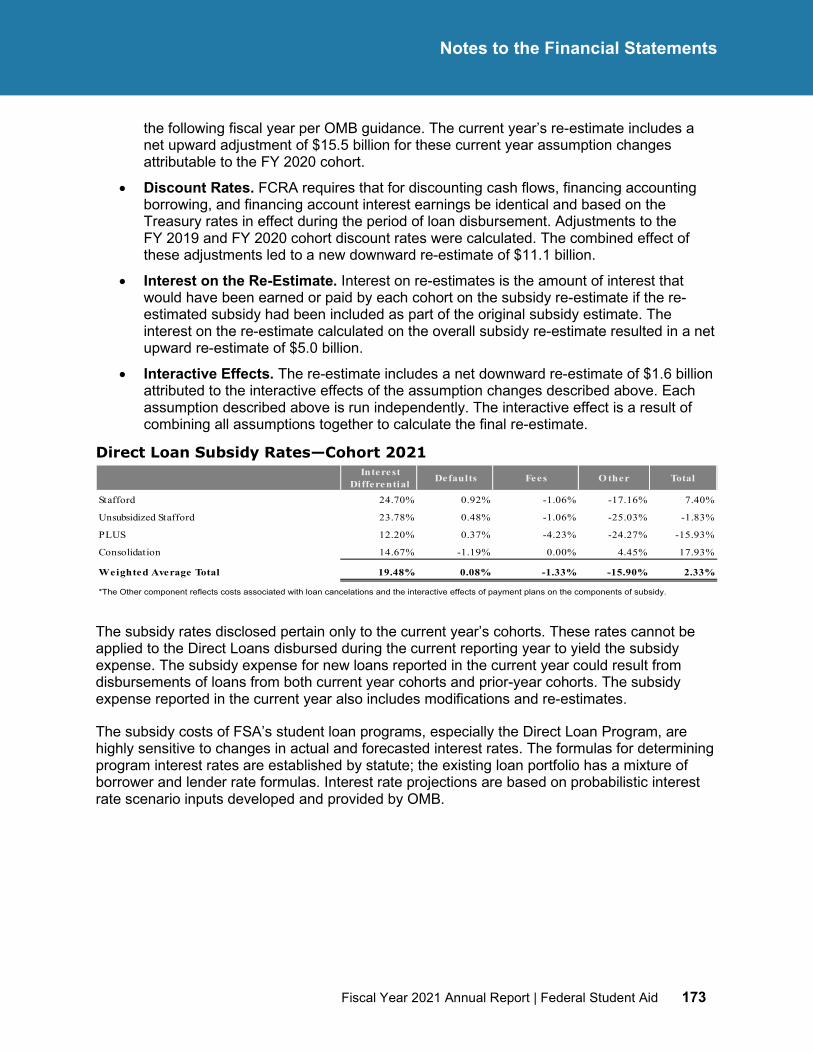
MM
Fiscal Year 2021 Annual Report | Federal Student Aid 173
Notes to the Financial Statements
the following fiscal year per OMB guidance. The current year’s re-estimate includes a net upward adjustment of $15.5 billion for these current year assumption changes attributable to the FY 2020 cohort.
• Discount Rates. FCRA requires that for discounting cash flows, financing accounting borrowing, and financing account interest earnings be identical and based on the Treasury rates in effect during the period of loan disbursement. Adjustments to the FY 2019 and FY 2020 cohort discount rates were calculated. The combined effect of these adjustments led to a new downward re-estimate of $11.1 billion.
• Interest on the Re-Estimate. Interest on re-estimates is the amount of interest that would have been earned or paid by each cohort on the subsidy re-estimate if the re-estimated subsidy had been included as part of the original subsidy estimate. The interest on the re-estimate calculated on the overall subsidy re-estimate resulted in a net upward re-estimate of $5.0 billion.
• Interactive Effects. The re-estimate includes a net downward re-estimate of $1.6 billion attributed to the interactive effects of the assumption changes described above. Each assumption described above is run independently. The interactive effect is a result of combining all assumptions together to calculate the final re-estimate.
Direct Loan Subsidy Rates—Cohort 2021
The subsidy rates disclosed pertain only to the current year’s cohorts. These rates cannot be applied to the Direct Loans disbursed during the current reporting year to yield the subsidy expense. The subsidy expense for new loans reported in the current year could result from disbursements of loans from both current year cohorts and prior-year cohorts. The subsidy expense reported in the current year also includes modifications and re-estimates.
The subsidy costs of FSA’s student loan programs, especially the Direct Loan Program, are highly sensitive to changes in actual and forecasted interest rates. The formulas for determining program interest rates are established by statute; the existing loan portfolio has a mixture of borrower and lender rate formulas. Interest rate projections are based on probabilistic interest rate scenario inputs developed and provided by OMB.
Interest Differential Defaults Fees O ther Total
Stafford 24.70% 0.92% -1.06% -17.16% 7.40%
Unsubsidized Stafford 23.78% 0.48% -1.06% -25.03% -1.83%
PLUS 12.20% 0.37% -4.23% -24.27% -15.93%
Consolidation 14.67% -1.19% 0.00% 4.45% 17.93%
Weighted Average Total 19.48% 0.08% -1.33% -15.90% 2.33%
*The Other component reflects costs associated with loan cancelations and the interactive effects of payment plans on the components of subsidy.
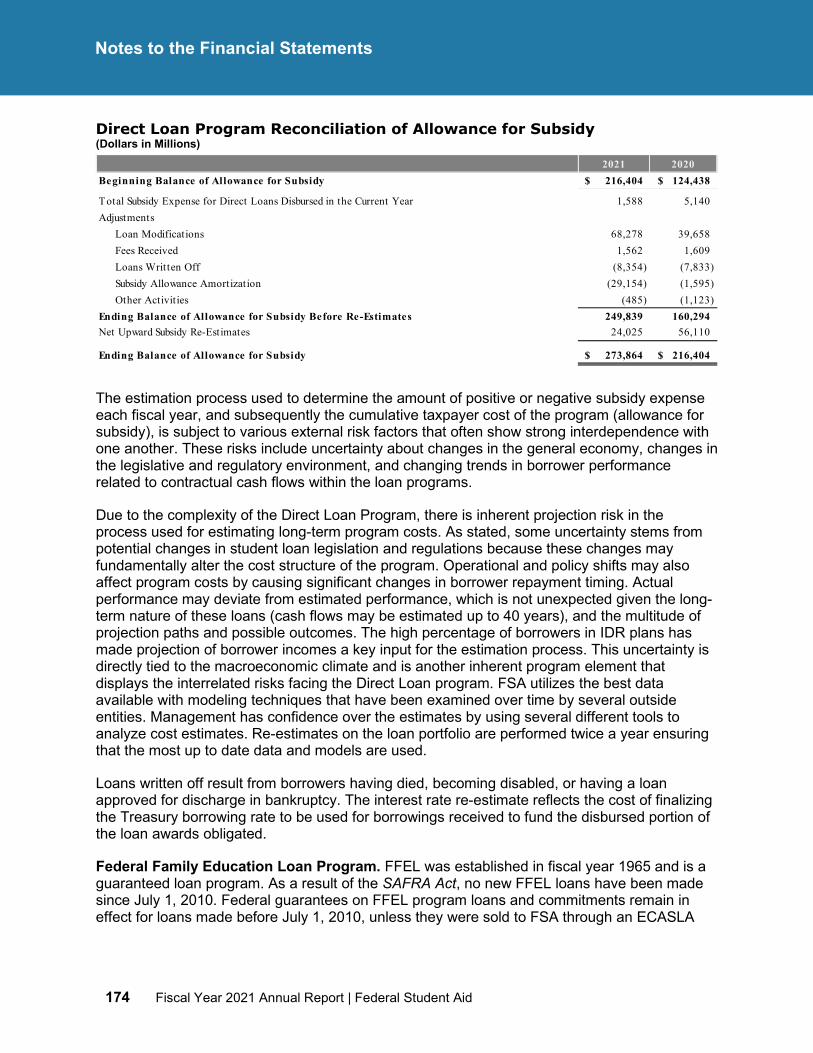
174 Fiscal Year 2021 Annual Report | Federal Student Aid
Notes to the Financial Statements
Direct Loan Program Reconciliation of Allowance for Subsidy (Dollars in Millions)
The estimation process used to determine the amount of positive or negative subsidy expense each fiscal year, and subsequently the cumulative taxpayer cost of the program (allowance for subsidy), is subject to various external risk factors that often show strong interdependence with one another. These risks include uncertainty about changes in the general economy, changes in the legislative and regulatory environment, and changing trends in borrower performance related to contractual cash flows within the loan programs.
Due to the complexity of the Direct Loan Program, there is inherent projection risk in the process used for estimating long-term program costs. As stated, some uncertainty stems from potential changes in student loan legislation and regulations because these changes may fundamentally alter the cost structure of the program. Operational and policy shifts may also affect program costs by causing significant changes in borrower repayment timing. Actual performance may deviate from estimated performance, which is not unexpected given the long-term nature of these loans (cash flows may be estimated up to 40 years), and the multitude of projection paths and possible outcomes. The high percentage of borrowers in IDR plans has made projection of borrower incomes a key input for the estimation process. This uncertainty is directly tied to the macroeconomic climate and is another inherent program element that displays the interrelated risks facing the Direct Loan program. FSA utilizes the best data available with modeling techniques that have been examined over time by several outside entities. Management has confidence over the estimates by using several different tools to analyze cost estimates. Re-estimates on the loan portfolio are performed twice a year ensuring that the most up to date data and models are used.
Loans written off result from borrowers having died, becoming disabled, or having a loan approved for discharge in bankruptcy. The interest rate re-estimate reflects the cost of finalizing the Treasury borrowing rate to be used for borrowings received to fund the disbursed portion of the loan awards obligated.
Federal Family Education Loan Program. FFEL was established in fiscal year 1965 and is a guaranteed loan program. As a result of the SAFRA Act, no new FFEL loans have been made since July 1, 2010. Federal guarantees on FFEL program loans and commitments remain in effect for loans made before July 1, 2010, unless they were sold to FSA through an ECASLA
2021 2020Beginning Balance of Allowance for Subsidy 216,404$ 124,438$
Total Subsidy Expense for Direct Loans Disbursed in the Current Year 1,588 5,140 Adjustments
Loan Modifications 68,278 39,658 Fees Received 1,562 1,609 Loans Written Off (8,354) (7,833) Subsidy Allowance Amortization (29,154) (1,595) Other Activities (485) (1,123)
Ending Balance of Allowance for Subsidy Before Re-Estimates 249,839 160,294 Net Upward Subsidy Re-Estimates 24,025 56,110
Ending Balance of Allowance for Subsidy 273,864$ 216,404$
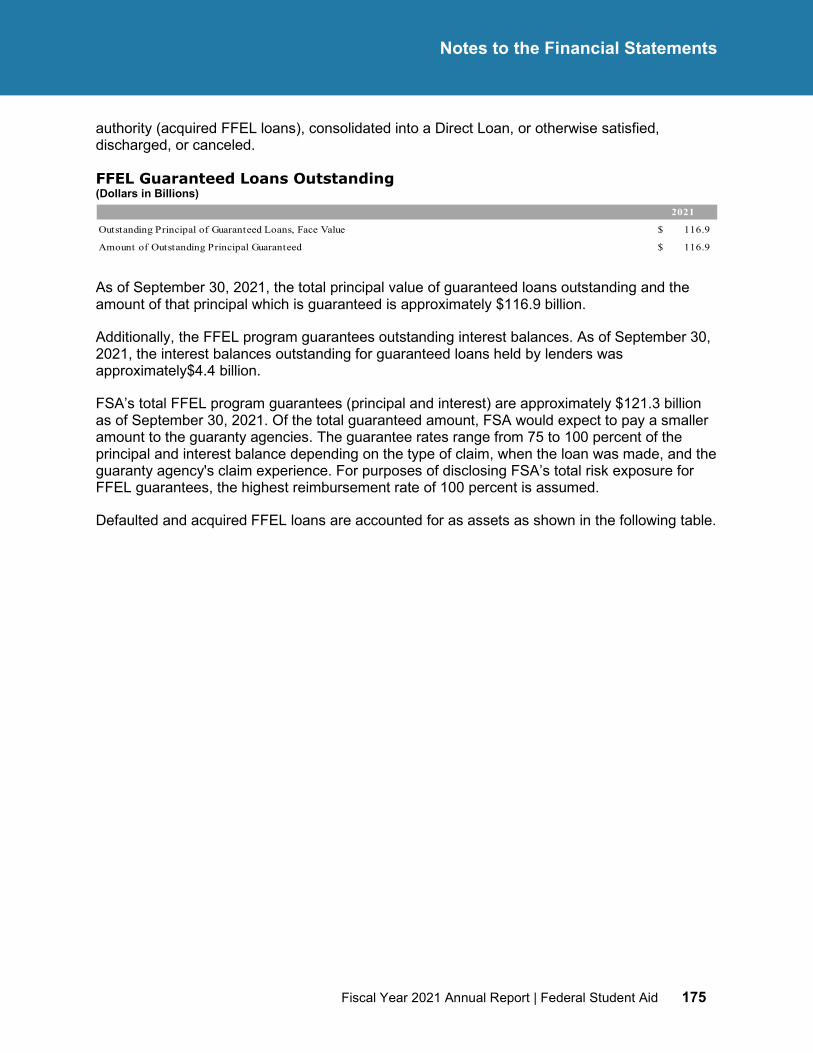
MM
Fiscal Year 2021 Annual Report | Federal Student Aid 175
Notes to the Financial Statements
authority (acquired FFEL loans), consolidated into a Direct Loan, or otherwise satisfied, discharged, or canceled.
FFEL Guaranteed Loans Outstanding (Dollars in Billions)
As of September 30, 2021, the total principal value of guaranteed loans outstanding and the amount of that principal which is guaranteed is approximately $116.9 billion.
Additionally, the FFEL program guarantees outstanding interest balances. As of September 30, 2021, the interest balances outstanding for guaranteed loans held by lenders was approximately$4.4 billion.
FSA’s total FFEL program guarantees (principal and interest) are approximately $121.3 billion as of September 30, 2021. Of the total guaranteed amount, FSA would expect to pay a smaller amount to the guaranty agencies. The guarantee rates range from 75 to 100 percent of the principal and interest balance depending on the type of claim, when the loan was made, and the guaranty agency's claim experience. For purposes of disclosing FSA’s total risk exposure for FFEL guarantees, the highest reimbursement rate of 100 percent is assumed.
Defaulted and acquired FFEL loans are accounted for as assets as shown in the following table.
2021
Outstanding Principal of Guaranteed Loans, Face Value 116.9$
Amount of Outstanding Principal Guaranteed 116.9$
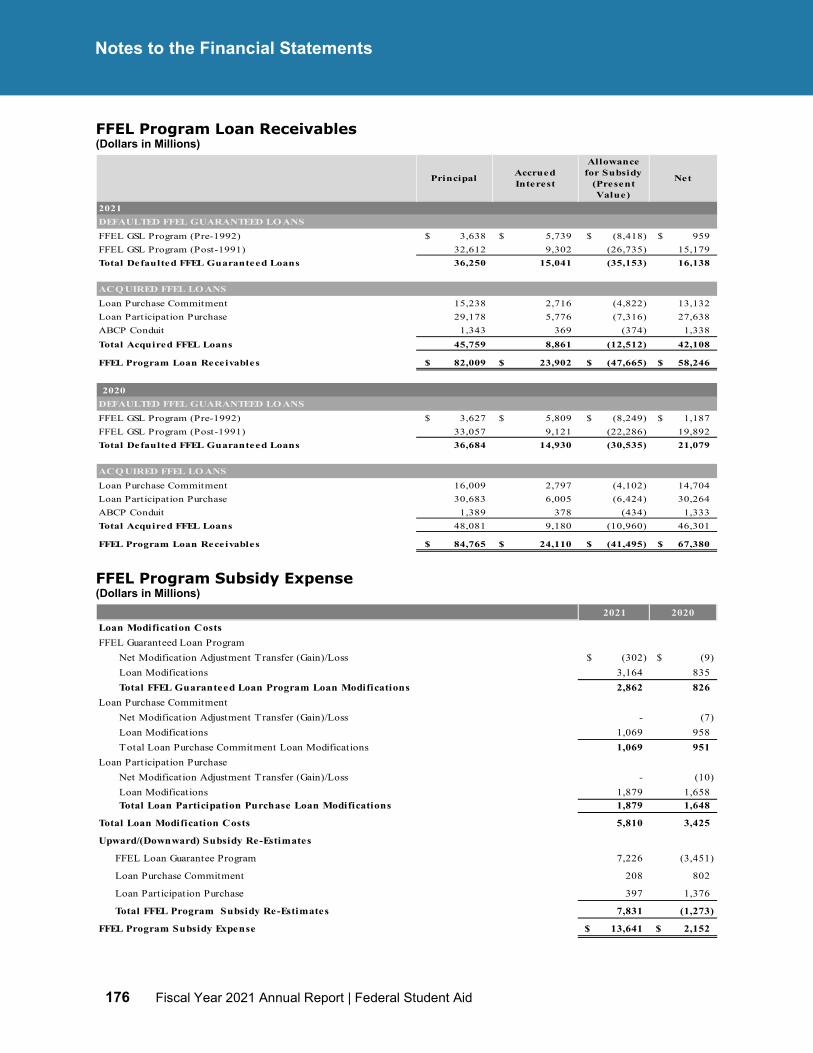
176 Fiscal Year 2021 Annual Report | Federal Student Aid
Notes to the Financial Statements
FFEL Program Loan Receivables (Dollars in Millions)
FFEL Program Subsidy Expense (Dollars in Millions)
Principal AccruedInterest
Allowance for Subsidy
(Present Value)
Net
2021DEFAULTED FFEL GUARANTEED LO ANSFFEL GSL Program (Pre-1992) 3,638$ 5,739$ (8,418)$ 959$ FFEL GSL Program (Post-1991) 32,612 9,302 (26,735) 15,179 Total Defaulted FFEL Guaranteed Loans 36,250 15,041 (35,153) 16,138
ACQ UIRED FFEL LO ANSLoan Purchase Commitment 15,238 2,716 (4,822) 13,132 Loan Participation Purchase 29,178 5,776 (7,316) 27,638 ABCP Conduit 1,343 369 (374) 1,338 Total Acquired FFEL Loans 45,759 8,861 (12,512) 42,108
FFEL Program Loan Receivables 82,009$ 23,902$ (47,665)$ 58,246$
2020DEFAULTED FFEL GUARANTEED LO ANSFFEL GSL Program (Pre-1992) 3,627$ 5,809$ (8,249)$ 1,187$ FFEL GSL Program (Post-1991) 33,057 9,121 (22,286) 19,892 Total Defaulted FFEL Guaranteed Loans 36,684 14,930 (30,535) 21,079
ACQ UIRED FFEL LO ANSLoan Purchase Commitment 16,009 2,797 (4,102) 14,704 Loan Participation Purchase 30,683 6,005 (6,424) 30,264 ABCP Conduit 1,389 378 (434) 1,333 Total Acquired FFEL Loans 48,081 9,180 (10,960) 46,301
FFEL Program Loan Receivables 84,765$ 24,110$ (41,495)$ 67,380$
2021 2020Loan Modification CostsFFEL Guaranteed Loan Program
Net Modification Adjustment Transfer (Gain)/Loss (302)$ (9)$ Loan Modifications 3,164 835 Total FFEL Guaranteed Loan Program Loan Modifications 2,862 826
Loan Purchase CommitmentNet Modification Adjustment Transfer (Gain)/Loss - (7) Loan Modifications 1,069 958 Total Loan Purchase Commitment Loan Modifications 1,069 951
Loan Participation PurchaseNet Modification Adjustment Transfer (Gain)/Loss - (10) Loan Modifications 1,879 1,658 Total Loan Participation Purchase Loan Modifications 1,879 1,648
Total Loan Modification Costs 5,810 3,425
Upward/(Downward) Subsidy Re-Estimates
FFEL Loan Guarantee Program 7,226 (3,451)
Loan Purchase Commitment 208 802
Loan Participation Purchase 397 1,376
Total FFEL Program Subsidy Re-Estimates 7,831 (1,273)
FFEL Program Subsidy Expense 13,641$ 2,152$

MM
Fiscal Year 2021 Annual Report | Federal Student Aid 177
Notes to the Financial Statements
Loan Modifications. Loan modifications for the FFEL Loan program for FY 2021 included the following:
• Loan Deferral Extension. In FY 2021 the outgoing administration extended the student loan repayment deferrals through January 31, 2021. Subsequently, the current administration extended the student loan repayment deferrals through January 31, 2022. The extended relief for borrowers resulted in an upward modification cost of $3.9 billion. There was a net positive $0.3 billion modification adjustment transfer associated with these modifications, bringing the total FY 2021 modification cost for the student loan repayment deferrals to $3.6 billion.
• Total and Permanent Disability. FSA recorded an upward modification for costs associated with the regulatory action to clarify that borrowers determined to be eligible for a total and permanent disability discharge based on data that FSA obtains from the VA or the SSA are not required to submit an application to have their Federal student loans discharged. These discharges resulted in an upward modification cost of $2.2 billion.
Net Upward/(Downward) Subsidy Re-estimates. The FFEL subsidy re-estimate increased subsidy expense in FY 2021 by $7.8 billion. The net upward re-estimates in these programs were due primarily to updated collection and default rates.
Reconciliation of Liabilities for Loan Guarantees (Dollars in Millions)
Other activity includes negative special allowance collections, collections on defaulted FFEL loans, guaranty agency expenses, and loan cancellations due to death, disability, or bankruptcy.
2021 2020
Beginning Balance of Post-1991 FFEL Loan Guarantee Liability 884$ 5,205$
Adjustments
Loan Modifications 2,862 826
Interest Supplements Paid (348) (757)
Loan Modifications (2,613) (4,285)
Fees Received 1,014 1,215
Interest on Accumulation on the Liability Balance (863) (1,064)
Other Activities (910) 3,195
Net Upward/(Downward) Subsidy Re-Estimates 7,226 (3,451)
Ending Balance of Post-1991 FFEL Loan Guarantee Liability 7,252 884
Pre-1992 FFEL Liquidating Account Liability for Loan Guarantees - 1
FFEL Liabilities for Loan Guarantees 7,252 885
HEAL Liabilit ies for Loan Guarantees 244 238
Total Liabilities for Loan Guarantees 7,496$ 1,123$
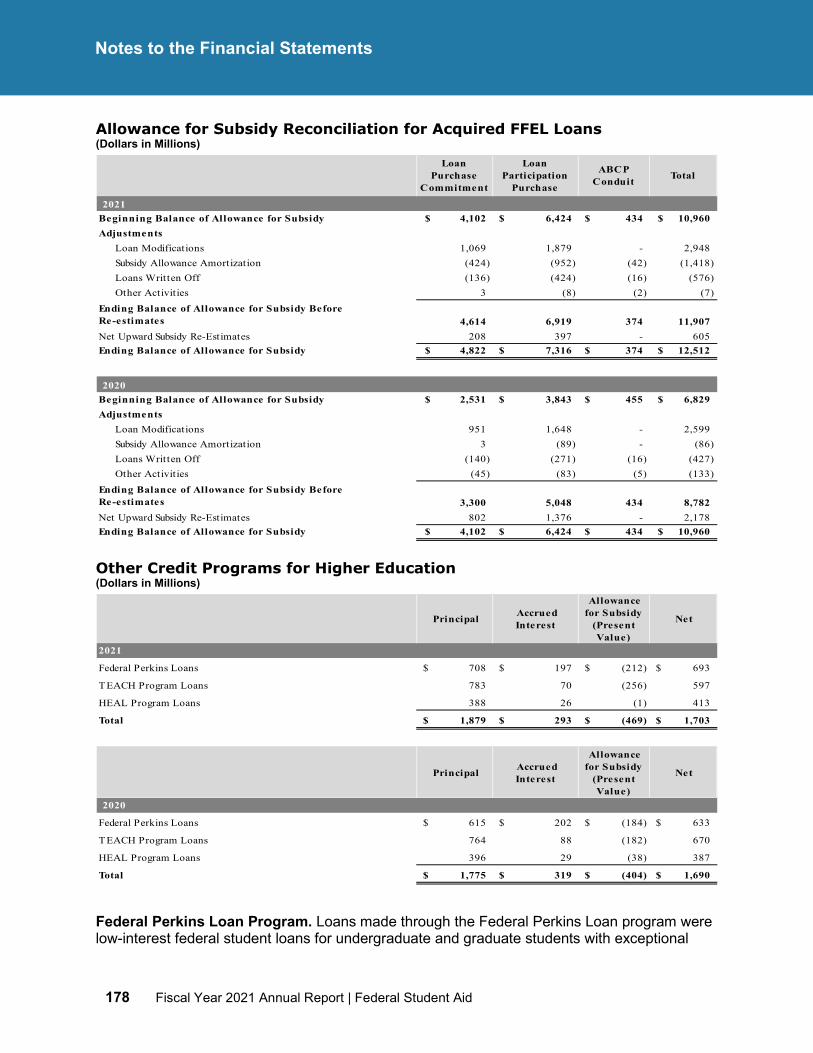
178 Fiscal Year 2021 Annual Report | Federal Student Aid
Notes to the Financial Statements
Allowance for Subsidy Reconciliation for Acquired FFEL Loans (Dollars in Millions)
Other Credit Programs for Higher Education (Dollars in Millions)
Federal Perkins Loan Program. Loans made through the Federal Perkins Loan program were low-interest federal student loans for undergraduate and graduate students with exceptional
Loan Purchase
Commitment
Loan Participation
Purchase
ABCP Conduit Total
2021Beginning Balance of Allowance for Subsidy 4,102$ 6,424$ 434$ 10,960$ Adjustments
Loan Modifications 1,069 1,879 - 2,948 Subsidy Allowance Amortization (424) (952) (42) (1,418) Loans Written Off (136) (424) (16) (576) Other Activities 3 (8) (2) (7)
4,614 6,919 374 11,907 Net Upward Subsidy Re-Estimates 208 397 - 605 Ending Balance of Allowance for Subsidy 4,822$ 7,316$ 374$ 12,512$
2020Beginning Balance of Allowance for Subsidy 2,531$ 3,843$ 455$ 6,829$ Adjustments
Loan Modifications 951 1,648 - 2,599 Subsidy Allowance Amortization 3 (89) - (86) Loans Written Off (140) (271) (16) (427) Other Activities (45) (83) (5) (133)
3,300 5,048 434 8,782 Net Upward Subsidy Re-Estimates 802 1,376 - 2,178 Ending Balance of Allowance for Subsidy 4,102$ 6,424$ 434$ 10,960$
Ending Balance of Allowance for Subsidy Before Re-estimates
Ending Balance of Allowance for Subsidy Before Re-estimates
Principal Accrued Interest
Allowance for Subsidy
(Present Value)
Net
2021
Federal Perkins Loans 708$ 197$ (212)$ 693$
TEACH Program Loans 783 70 (256) 597
HEAL Program Loans 388 26 (1) 413
Total 1,879$ 293$ (469)$ 1,703$
Principal Accrued Interest
Allowance for Subsidy
(Present Value)
Net
2020
Federal Perkins Loans 615$ 202$ (184)$ 633$
TEACH Program Loans 764 88 (182) 670
HEAL Program Loans 396 29 (38) 387
Total 1,775$ 319$ (404)$ 1,690$
MM
Fiscal Year 2021 Annual Report | Federal Student Aid 179
Notes to the Financial Statements
financial needs. Schools made these Perkins loans to their students and are responsible for servicing the loans throughout the repayment term. Borrowers who undertake certain public, military, or teaching service employment are eligible to have all or part of their loans cancelled.
The Perkins Loan program was a revolving loan program where the loan repayments collected from former students were used to make new loans to current students. FSA provided most of the capital used by schools to make these loans to eligible students. Participating schools provided the remaining program funding. In some statutorily defined cases, funds were provided by FSA to reimburse schools for loan cancellations. The above schedule includes only Perkins loans that were assigned to FSA when schools discontinued their participation in the program. For these assigned Perkins loans, collections of principal, interest, and fees, net of amounts paid to cover contract collection costs totaled $79 million and $38 million for FY 2021 and FY 2020, respectively.
The Federal Perkins Loan Program Extension Act of 2015 (Extension Act) eliminated the authorization for schools to make new Perkins loan disbursements as of September 30, 2017, and ended all Perkins loan disbursements by June 30, 2018. Before the authority for new Perkins loans ended, collections made by the schools would go back into each school’s Perkins fund to be used to make more loans. Schools are required to return to FSA the federal share of any excess beyond what is needed (excess liquid capital).
Schools are not required to liquidate and close out their programs now that no new Perkins loans are being made. Schools continue to take in collections and are required to return the federal share of the capital that is collected to FSA on an annual basis. Schools returned $850 million and $1,279 million to FSA in FY 2021 and FY 2020, respectively, for the federal share of collected cash.
Schools will continue to service outstanding Perkins loans to recover the money they contributed to their Perkins funds for as long as it is feasible to do so or until the eventual wind- down of their portfolios. Schools that liquidate and close out their programs must transfer any outstanding portfolio to FSA and liquidate any final cash. Most recent data from the 2021-2022 reporting year shows a $3.3 billion outstanding principal balance on Perkins loans held by schools, and FSA’s equity interest on this portfolio is $2.8 billion.
The amounts collected by FSA annually for defaulted Perkins loans and for the return of the federal share of schools’ Perkins capital contributions are returned to the Treasury General Fund (See Note 12)
TEACH Grant Program. FSA awards annual grants of up to $4,000 to eligible undergraduate and graduate students who agree to serve as full-time mathematics, science, foreign language, bilingual education, special education, or reading teachers at high-need schools for four years within eight years of graduation. The maximum lifetime grant for students is $16,000 for undergraduate programs and $8,000 for graduate programs. For students failing to fulfill the service requirement, the grants are converted to Direct Unsubsidized Stafford Loans. The program is operated as a loan program under the FCRA for budget and accounting purposes since grants can be converted to Direct Loans. In FY 2021 the outgoing administration extended the student loan repayment deferrals through January 31, 2021. Subsequently, the current administration extended the student loan repayment deferrals through January 31, 2022. The extended relief for borrowers resulted in an upward modification cost of $21 million. FSA also recorded an upward modification to reflect the cost of updated program regulations to improve
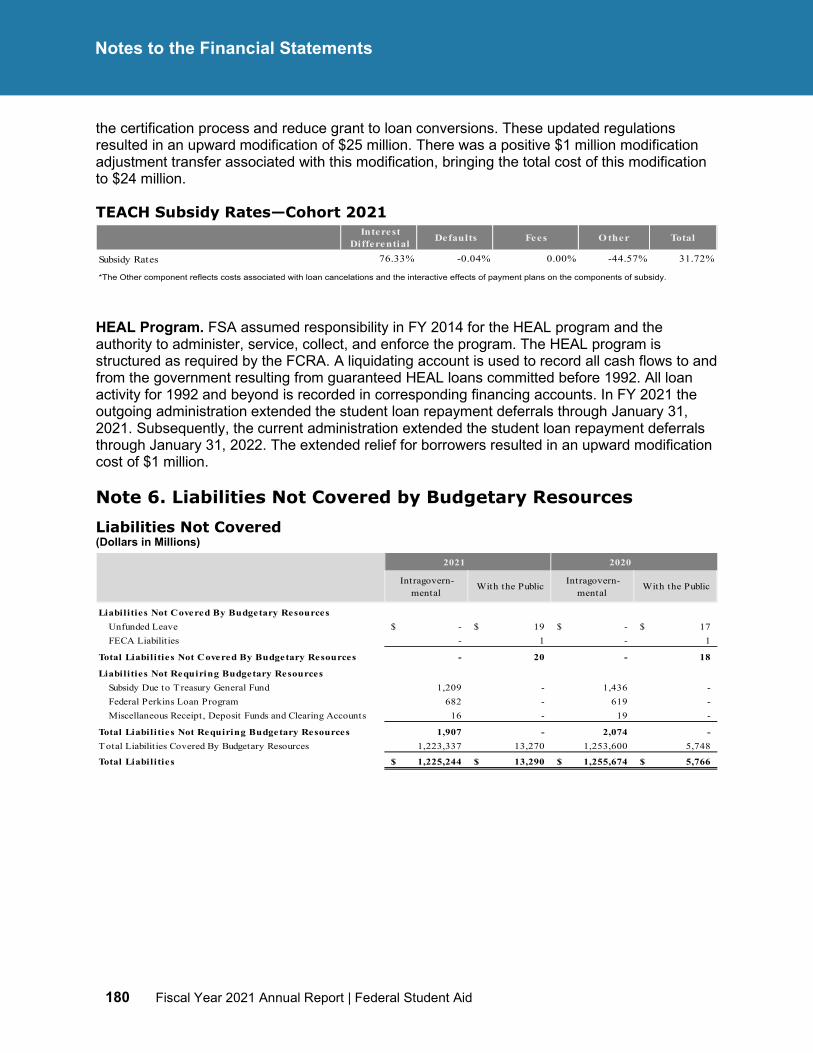
180 Fiscal Year 2021 Annual Report | Federal Student Aid
Notes to the Financial Statements
the certification process and reduce grant to loan conversions. These updated regulations resulted in an upward modification of $25 million. There was a positive $1 million modification adjustment transfer associated with this modification, bringing the total cost of this modification to $24 million.
TEACH Subsidy Rates—Cohort 2021
HEAL Program. FSA assumed responsibility in FY 2014 for the HEAL program and the authority to administer, service, collect, and enforce the program. The HEAL program is structured as required by the FCRA. A liquidating account is used to record all cash flows to and from the government resulting from guaranteed HEAL loans committed before 1992. All loan activity for 1992 and beyond is recorded in corresponding financing accounts. In FY 2021 the outgoing administration extended the student loan repayment deferrals through January 31, 2021. Subsequently, the current administration extended the student loan repayment deferrals through January 31, 2022. The extended relief for borrowers resulted in an upward modification cost of $1 million.
Note 6. Liabilities Not Covered by Budgetary Resources Liabilities Not Covered (Dollars in Millions)
Interest Differential Defaults Fees O ther Total
Subsidy Rates 76.33% -0.04% 0.00% -44.57% 31.72%
*The Other component reflects costs associated with loan cancelations and the interactive effects of payment plans on the components of subsidy.
2021 2020
Intragovern-mental
With the Public Intragovern-mental
With the Public
Liabilities Not Covered By Budgetary ResourcesUnfunded Leave -$ 19$ -$ 17$ FECA Liabilit ies - 1 - 1
Total Liabilities Not Covered By Budgetary Resources - 20 - 18
Liabilities Not Requiring Budgetary ResourcesSubsidy Due to Treasury General Fund 1,209 - 1,436 - Federal Perkins Loan Program 682 - 619 - Miscellaneous Receipt, Deposit Funds and Clearing Accounts 16 - 19 -
Total Liabilities Not Requiring Budgetary Resources 1,907 - 2,074 - Total Liabilit ies Covered By Budgetary Resources 1,223,337 13,270 1,253,600 5,748
Total Liabilities 1,225,244$ 13,290$ 1,255,674$ 5,766$
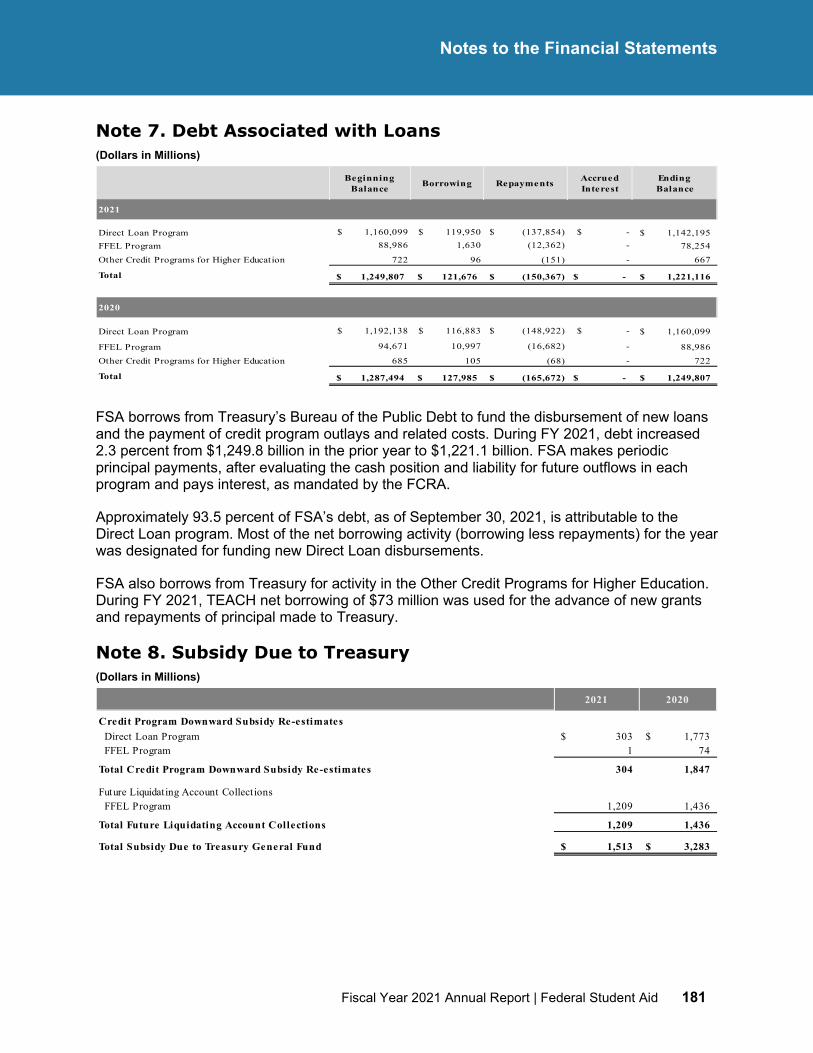
MM
Fiscal Year 2021 Annual Report | Federal Student Aid 181
Notes to the Financial Statements
Note 7. Debt Associated with Loans (Dollars in Millions)
FSA borrows from Treasury’s Bureau of the Public Debt to fund the disbursement of new loans and the payment of credit program outlays and related costs. During FY 2021, debt increased 2.3 percent from $1,249.8 billion in the prior year to $1,221.1 billion. FSA makes periodic principal payments, after evaluating the cash position and liability for future outflows in each program and pays interest, as mandated by the FCRA.
Approximately 93.5 percent of FSA’s debt, as of September 30, 2021, is attributable to the Direct Loan program. Most of the net borrowing activity (borrowing less repayments) for the year was designated for funding new Direct Loan disbursements.
FSA also borrows from Treasury for activity in the Other Credit Programs for Higher Education. During FY 2021, TEACH net borrowing of $73 million was used for the advance of new grants and repayments of principal made to Treasury.
Note 8. Subsidy Due to Treasury (Dollars in Millions)
Beginning Balance Borrowing Repayments Accrued
InterestEnding
Balance
$ 1,160,099 $ 119,950 $ (137,854) $ - 1,142,195$ 88,986 1,630 (12,362) - 78,254
Other Credit Programs for Higher Education 722 96 (151) - 667
1,249,807$ 121,676$ (150,367)$ -$ 1,221,116$
$ 1,192,138 $ 116,883 $ (148,922) $ - 1,160,099$
94,671 10,997 (16,682) - 88,986 Other Credit Programs for Higher Education 685 105 (68) - 722
1,287,494$ 127,985$ (165,672)$ -$ 1,249,807$
2020
Direct Loan Program
FFEL Program
Total
2021
Direct Loan ProgramFFEL Program
Total
2021 2020
Credit Program Downward Subsidy Re-estimates Direct Loan Program 303$ 1,773$ FFEL Program 1 74
Total Credit Program Downward Subsidy Re-estimates 304 1,847
Future Liquidating Account Collections FFEL Program 1,209 1,436
Total Future Liquidating Account Collections 1,209 1,436
Total Subsidy Due to Treasury General Fund 1,513$ 3,283$
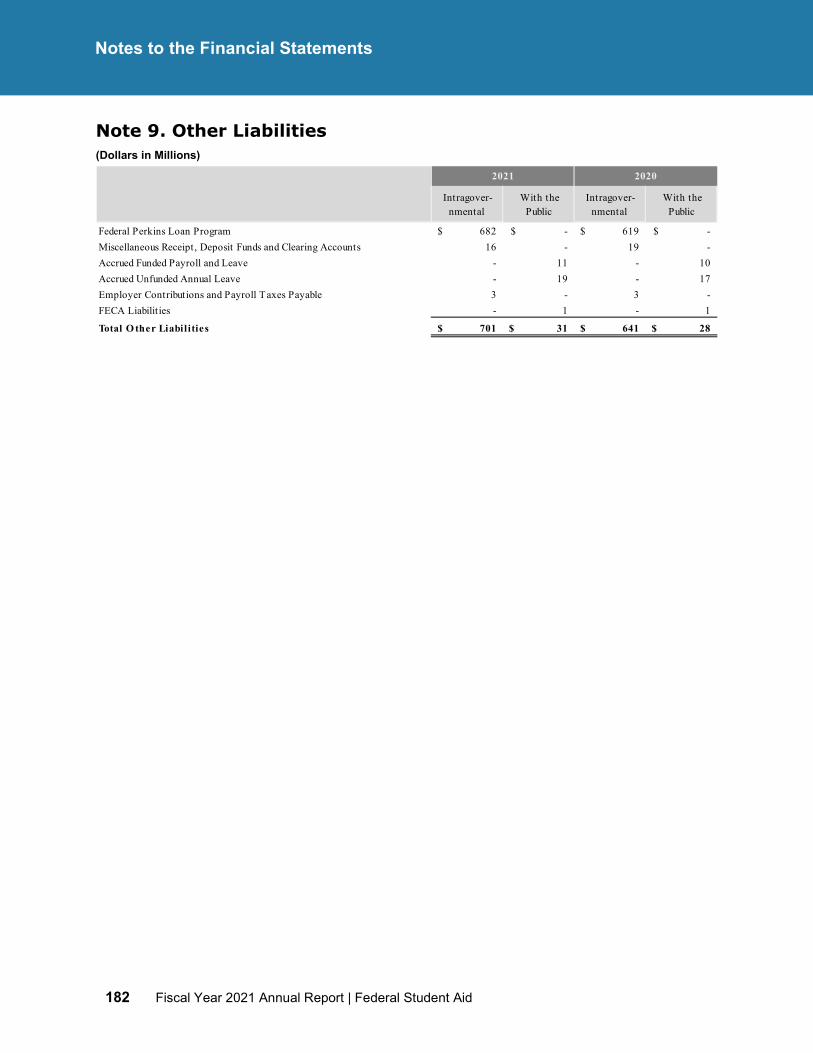
182 Fiscal Year 2021 Annual Report | Federal Student Aid
Notes to the Financial Statements
Note 9. Other Liabilities (Dollars in Millions)
Intragover-nmental
With the Public
Intragover-nmental
With the Public
Federal Perkins Loan Program 682$ -$ 619$ -$ Miscellaneous Receipt, Deposit Funds and Clearing Accounts 16 - 19 - Accrued Funded Payroll and Leave - 11 - 10 Accrued Unfunded Annual Leave - 19 - 17 Employer Contributions and Payroll Taxes Payable 3 - 3 - FECA Liabilit ies - 1 - 1
Total O ther Liabilities 701$ 31$ 641$ 28$
2021 2020
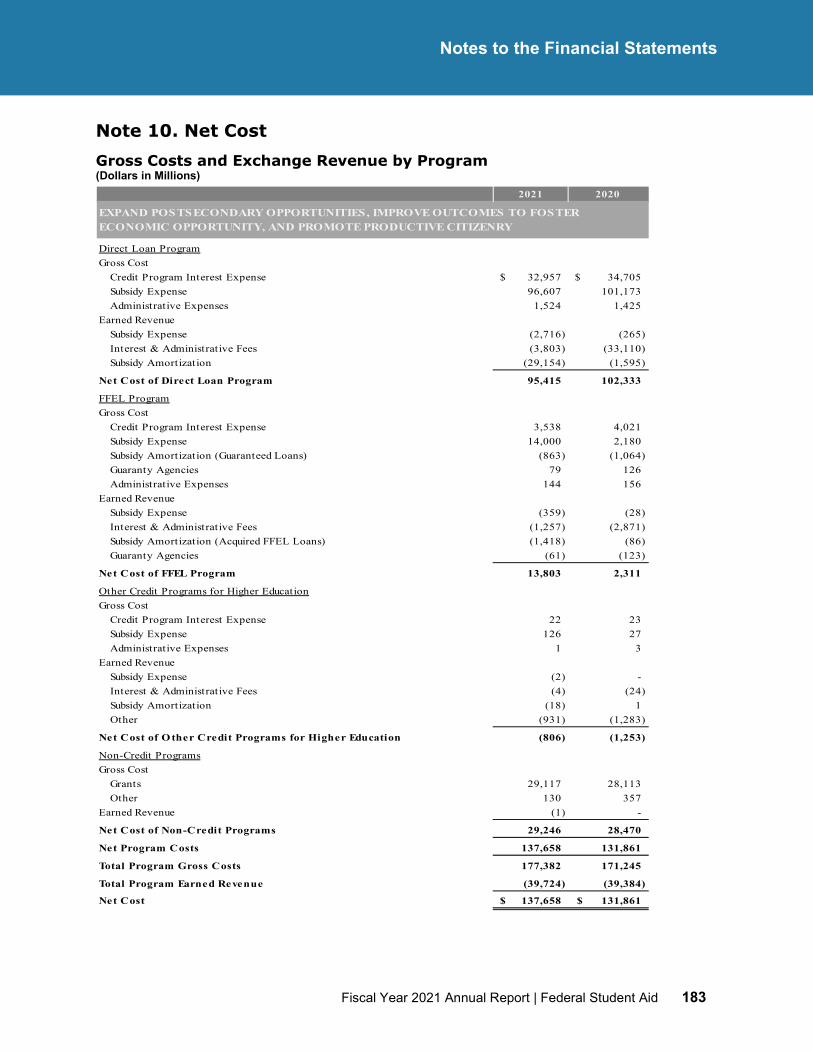
MM
Fiscal Year 2021 Annual Report | Federal Student Aid 183
Notes to the Financial Statements
Note 10. Net Cost Gross Costs and Exchange Revenue by Program (Dollars in Millions)
2021 2020
Direct Loan ProgramGross Cost
Credit Program Interest Expense 32,957$ 34,705$ Subsidy Expense 96,607 101,173 Administrative Expenses 1,524 1,425
Earned RevenueSubsidy Expense (2,716) (265) Interest & Administrative Fees (3,803) (33,110) Subsidy Amortization (29,154) (1,595)
Net Cost of Direct Loan Program 95,415 102,333
FFEL ProgramGross Cost
Credit Program Interest Expense 3,538 4,021 Subsidy Expense 14,000 2,180 Subsidy Amortization (Guaranteed Loans) (863) (1,064) Guaranty Agencies 79 126 Administrative Expenses 144 156
Earned RevenueSubsidy Expense (359) (28) Interest & Administrative Fees (1,257) (2,871) Subsidy Amortization (Acquired FFEL Loans) (1,418) (86) Guaranty Agencies (61) (123)
Net Cost of FFEL Program 13,803 2,311
Other Credit Programs for Higher EducationGross Cost
Credit Program Interest Expense 22 23 Subsidy Expense 126 27 Administrative Expenses 1 3
Earned RevenueSubsidy Expense (2) - Interest & Administrative Fees (4) (24) Subsidy Amortization (18) 1 Other (931) (1,283)
Net Cost of O ther Credit Programs for Higher Education (806) (1,253)
Non-Credit ProgramsGross Cost
Grants 29,117 28,113 Other 130 357
Earned Revenue (1) -
Net Cost of Non-Credit Programs 29,246 28,470
Net Program Costs 137,658 131,861
Total Program Gross Costs 177,382 171,245
Total Program Earned Revenue (39,724) (39,384)
Net Cost 137,658$ 131,861$
EXPAND POSTSECONDARY OPPORTUNITIES, IMPROVE OUTCOMES TO FOSTER ECONOMIC OPPORTUNITY, AND PROMOTE PRODUCTIVE CITIZENRY
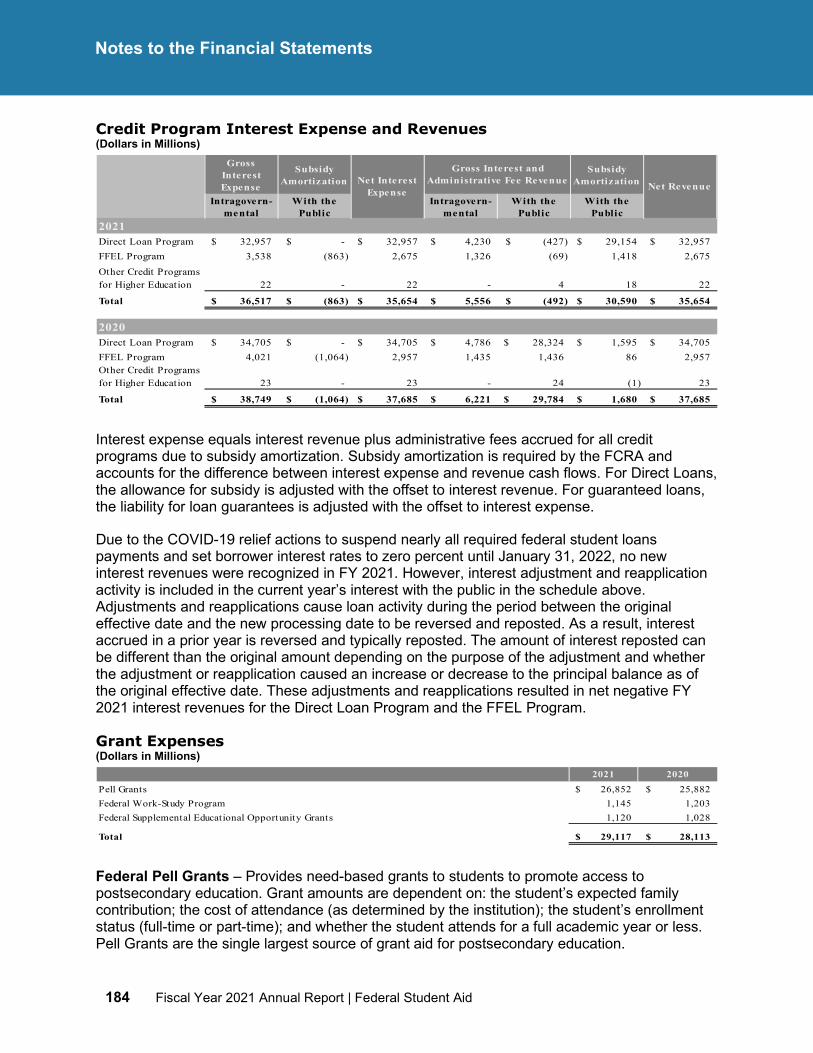
184 Fiscal Year 2021 Annual Report | Federal Student Aid
Notes to the Financial Statements
Credit Program Interest Expense and Revenues (Dollars in Millions)
Interest expense equals interest revenue plus administrative fees accrued for all credit programs due to subsidy amortization. Subsidy amortization is required by the FCRA and accounts for the difference between interest expense and revenue cash flows. For Direct Loans, the allowance for subsidy is adjusted with the offset to interest revenue. For guaranteed loans, the liability for loan guarantees is adjusted with the offset to interest expense.
Due to the COVID-19 relief actions to suspend nearly all required federal student loans payments and set borrower interest rates to zero percent until January 31, 2022, no new interest revenues were recognized in FY 2021. However, interest adjustment and reapplication activity is included in the current year’s interest with the public in the schedule above. Adjustments and reapplications cause loan activity during the period between the original effective date and the new processing date to be reversed and reposted. As a result, interest accrued in a prior year is reversed and typically reposted. The amount of interest reposted can be different than the original amount depending on the purpose of the adjustment and whether the adjustment or reapplication caused an increase or decrease to the principal balance as of the original effective date. These adjustments and reapplications resulted in net negative FY 2021 interest revenues for the Direct Loan Program and the FFEL Program.
Grant Expenses (Dollars in Millions)
Federal Pell Grants – Provides need-based grants to students to promote access to postsecondary education. Grant amounts are dependent on: the student’s expected family contribution; the cost of attendance (as determined by the institution); the student’s enrollment status (full-time or part-time); and whether the student attends for a full academic year or less. Pell Grants are the single largest source of grant aid for postsecondary education.
Gross Interest Expense
Subsidy Amortization
Subsidy Amortization
Intragovern-mental
With the Public
Intragovern-mental
With the Public
With the Public
2021Direct Loan Program 32,957$ -$ 32,957$ 4,230$ (427)$ 29,154$ 32,957$ FFEL Program 3,538 (863) 2,675 1,326 (69) 1,418 2,675 Other Credit Programs for Higher Education 22 - 22 - 4 18 22
Total 36,517$ (863)$ 35,654$ 5,556$ (492)$ 30,590$ 35,654$
2020Direct Loan Program 34,705$ -$ 34,705$ 4,786$ 28,324$ 1,595$ 34,705$ FFEL Program 4,021 (1,064) 2,957 1,435 1,436 86 2,957 Other Credit Programs for Higher Education 23 - 23 - 24 (1) 23
Total 38,749$ (1,064)$ 37,685$ 6,221$ 29,784$ 1,680$ 37,685$
Net Interest Expense
Gross Interest and Administrative Fee Revenue Net Revenue
2021 202026,852$ 25,882$
1,145 1,203 1,120 1,028
Total 29,117$ 28,113$
Federal Supplemental Educational Opportunity Grants
Pell GrantsFederal Work-Study Program
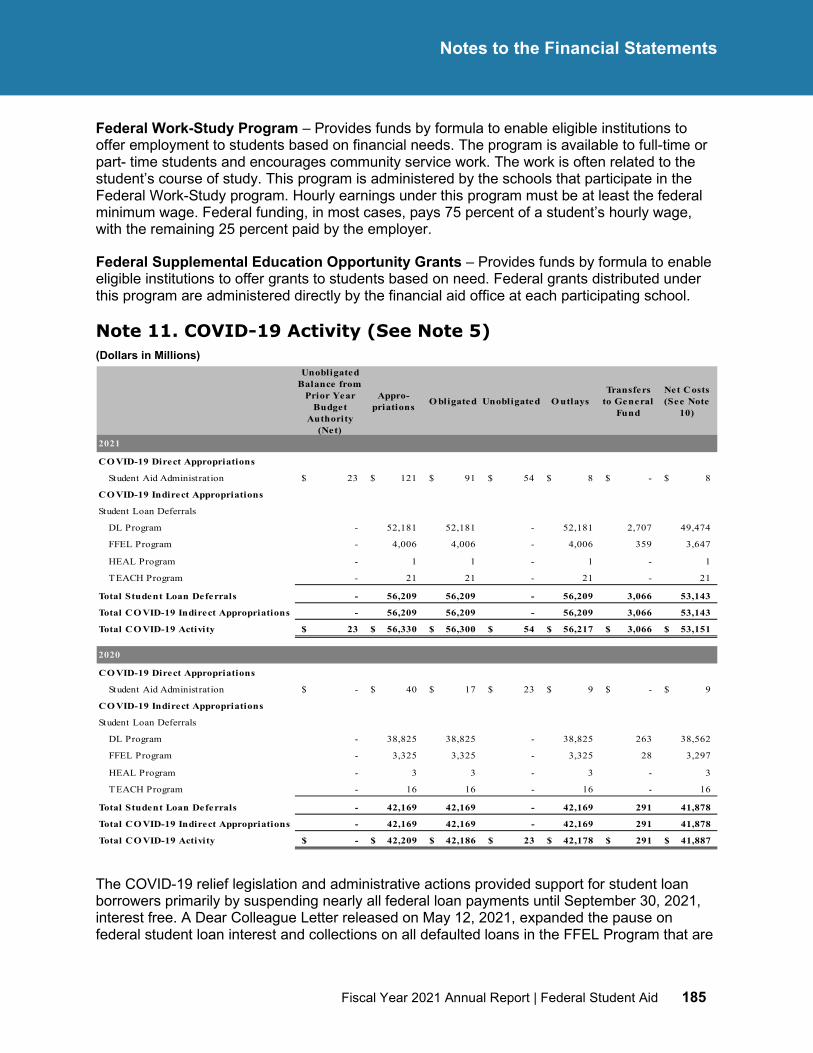
MM
Fiscal Year 2021 Annual Report | Federal Student Aid 185
Notes to the Financial Statements
Federal Work-Study Program – Provides funds by formula to enable eligible institutions to offer employment to students based on financial needs. The program is available to full-time or part- time students and encourages community service work. The work is often related to the student’s course of study. This program is administered by the schools that participate in the Federal Work-Study program. Hourly earnings under this program must be at least the federal minimum wage. Federal funding, in most cases, pays 75 percent of a student’s hourly wage, with the remaining 25 percent paid by the employer.
Federal Supplemental Education Opportunity Grants – Provides funds by formula to enable eligible institutions to offer grants to students based on need. Federal grants distributed under this program are administered directly by the financial aid office at each participating school.
Note 11. COVID-19 Activity (See Note 5) (Dollars in Millions)
The COVID-19 relief legislation and administrative actions provided support for student loan borrowers primarily by suspending nearly all federal loan payments until September 30, 2021, interest free. A Dear Colleague Letter released on May 12, 2021, expanded the pause on federal student loan interest and collections on all defaulted loans in the FFEL Program that are
Unobligated Balance from
Prior Year Budget
Authority (Net)
Appro-priations O bligated Unobligated O utlays
Transfers to General
Fund
Net Costs(See Note
10)
CO VID-19 Direct Appropriations
Student Aid Administration 23$ 121$ 91$ 54$ 8$ -$ 8$
CO VID-19 Indirect Appropriations
Student Loan Deferrals
DL Program - 52,181 52,181 - 52,181 2,707 49,474
FFEL Program - 4,006 4,006 - 4,006 359 3,647
HEAL Program - 1 1 - 1 - 1
TEACH Program - 21 21 - 21 - 21
Total Student Loan Deferrals - 56,209 56,209 - 56,209 3,066 53,143
Total CO VID-19 Indirect Appropriations - 56,209 56,209 - 56,209 3,066 53,143
Total CO VID-19 Activity 23$ 56,330$ 56,300$ 54$ 56,217$ 3,066$ 53,151$
CO VID-19 Direct Appropriations
Student Aid Administration -$ 40$ 17$ 23$ 9$ -$ 9$
CO VID-19 Indirect Appropriations
Student Loan Deferrals
DL Program - 38,825 38,825 - 38,825 263 38,562
FFEL Program - 3,325 3,325 - 3,325 28 3,297
HEAL Program - 3 3 - 3 - 3
TEACH Program - 16 16 - 16 - 16
Total Student Loan Deferrals - 42,169 42,169 - 42,169 291 41,878
Total CO VID-19 Indirect Appropriations - 42,169 42,169 - 42,169 291 41,878
Total CO VID-19 Activity -$ 42,209$ 42,186$ 23$ 42,178$ 291$ 41,887$
2020
2021
186 Fiscal Year 2021 Annual Report | Federal Student Aid
Notes to the Financial Statements
managed by guaranty agencies, retroactive to March 2020. FSA authorized guaranty agencies to reimburse themselves from the Federal Fund for lost revenue that they will realize because of these actions. However, that reimbursement will only cover the share of what a guaranty agency might have reasonably collected during the pandemic but for the suspension.
Funding for student loan repayment deferrals was provided through FY 2020 and FY 2021 indefinite appropriations totaling $42.2 billion and $56.2 billion, respectively. Cost impacts of the student loan repayment deferrals were recorded as loan modifications in FY 2020 ($41.9 billion) and FY 2021 ($53.1 billion). These COVID-19 loan modifications are a component of subsidy expense that reduced the overall credit program loan receivable balances. (see Note 5)
In addition to suspending student loan repayments, other COVID-19 relief provided to student loan borrowers included the following:
• FSA stopped all federal wage garnishments and collection actions for borrowers with federally held loans in default.
• FSA provided relief for certain borrowers who received student loan discharges due to total and permanent disability. Unless it is through a process with the VA, borrowers receiving this discharge are, by regulation, subject to a three-year monitoring period during which they must provide FSA with information about their earnings from employment. Per regulation, borrowers whose earnings exceed certain thresholds and borrowers who do not meet certain other criteria will have their loans reinstated. FSA provided relief to ensure no borrowers are at risk of having their loans reinstated, meaning they would have to repay their debt—for failure to provide earnings information during the COVID-19 emergency. This change was made retroactive to March 13, 2020, the start of the COVID-19 national emergency.
• FSA requested a waiver from the Small Business Administration to immediately help nearly 30,000 small business owners in the Paycheck Protection program who faced difficulties because they were delinquent or in default on a federal student loan.
Note 12. Statements of Budgetary Resources
The SBR compares budgetary resources with the status of those resources. As of September 30, 2021, budgetary resources were $381.0 billion and net agency outlays were $164.2 billion. As of September 30, 2020, budgetary resources were $389.1 billion and net agency outlays were $104.4 billion.
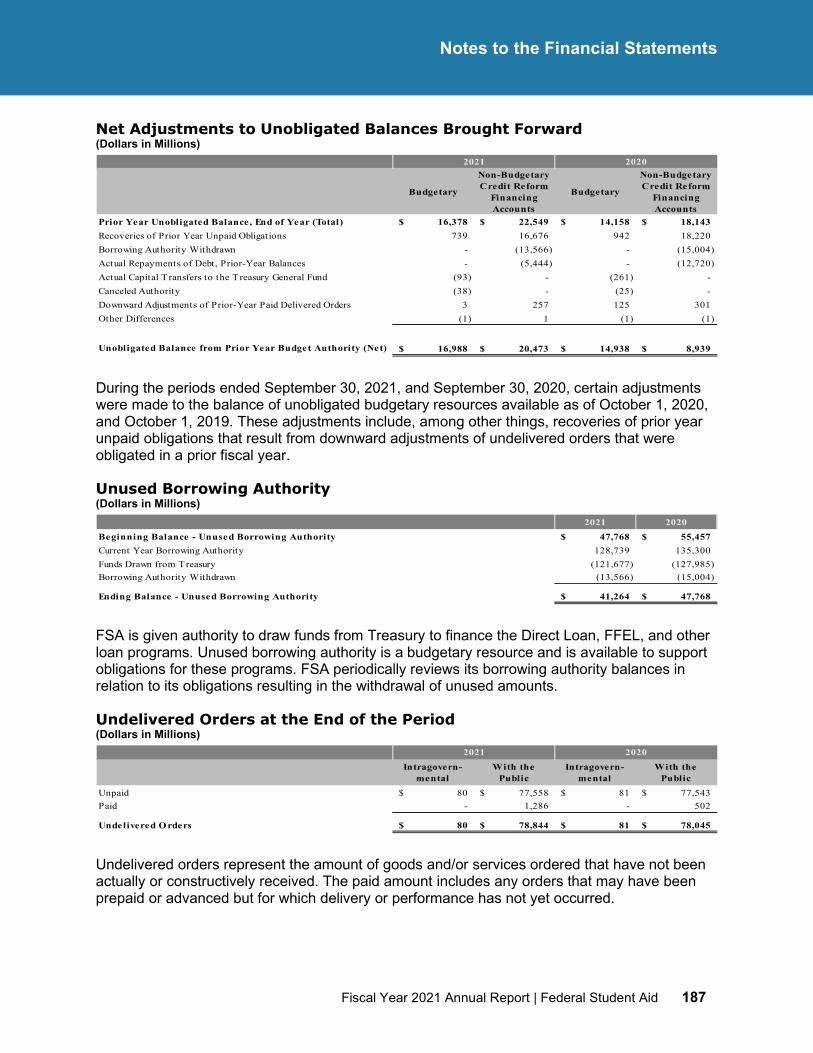
MM
Fiscal Year 2021 Annual Report | Federal Student Aid 187
Notes to the Financial Statements
Net Adjustments to Unobligated Balances Brought Forward (Dollars in Millions)
During the periods ended September 30, 2021, and September 30, 2020, certain adjustments were made to the balance of unobligated budgetary resources available as of October 1, 2020, and October 1, 2019. These adjustments include, among other things, recoveries of prior year unpaid obligations that result from downward adjustments of undelivered orders that were obligated in a prior fiscal year.
Unused Borrowing Authority (Dollars in Millions)
FSA is given authority to draw funds from Treasury to finance the Direct Loan, FFEL, and other loan programs. Unused borrowing authority is a budgetary resource and is available to support obligations for these programs. FSA periodically reviews its borrowing authority balances in relation to its obligations resulting in the withdrawal of unused amounts.
Undelivered Orders at the End of the Period (Dollars in Millions)
Undelivered orders represent the amount of goods and/or services ordered that have not been actually or constructively received. The paid amount includes any orders that may have been prepaid or advanced but for which delivery or performance has not yet occurred.
Budgetary
Non-Budgetary Credit Reform
Financing Accounts
Budgetary
Non-Budgetary Credit Reform
Financing Accounts
Prior Year Unobligated Balance, End of Year (Total) 16,378$ 22,549$ 14,158$ 18,143$ Recoveries of Prior Year Unpaid Obligations 739 16,676 942 18,220 Borrowing Authority Withdrawn - (13,566) - (15,004) Actual Repayments of Debt, Prior-Year Balances - (5,444) - (12,720) Actual Capital Transfers to the Treasury General Fund (93) - (261) - Canceled Authority (38) - (25) - Downward Adjustments of Prior-Year Paid Delivered Orders 3 257 125 301 Other Differences (1) 1 (1) (1)
16,988$ 20,473$ 14,938$ 8,939$
2021 2020
Unobligated Balance from Prior Year Budget Authority (Net)
2021 2020Beginning Balance - Unused Borrowing Authority 47,768$ 55,457$ Current Year Borrowing Authority 128,739 135,300 Funds Drawn from Treasury (121,677) (127,985) Borrowing Authority Withdrawn (13,566) (15,004)
Ending Balance - Unused Borrowing Authority 41,264$ 47,768$
Intragovern-mental
With the Public
Intragovern-mental
With the Public
Unpaid 80$ 77,558$ 81$ 77,543$ Paid - 1,286 - 502
Undelivered O rders 80$ 78,844$ 81$ 78,045$
2021 2020
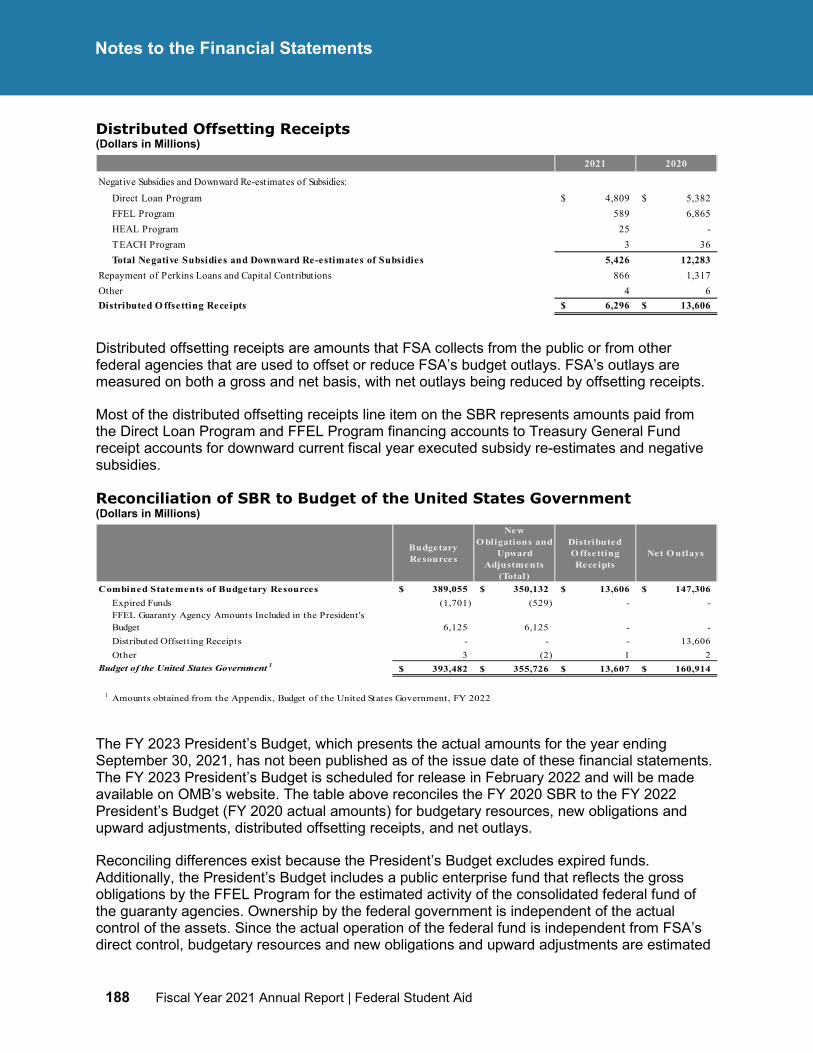
188 Fiscal Year 2021 Annual Report | Federal Student Aid
Notes to the Financial Statements
Distributed Offsetting Receipts (Dollars in Millions)
Distributed offsetting receipts are amounts that FSA collects from the public or from other federal agencies that are used to offset or reduce FSA’s budget outlays. FSA’s outlays are measured on both a gross and net basis, with net outlays being reduced by offsetting receipts.
Most of the distributed offsetting receipts line item on the SBR represents amounts paid from the Direct Loan Program and FFEL Program financing accounts to Treasury General Fund receipt accounts for downward current fiscal year executed subsidy re-estimates and negative subsidies.
Reconciliation of SBR to Budget of the United States Government (Dollars in Millions)
The FY 2023 President’s Budget, which presents the actual amounts for the year ending September 30, 2021, has not been published as of the issue date of these financial statements. The FY 2023 President’s Budget is scheduled for release in February 2022 and will be made available on OMB’s website. The table above reconciles the FY 2020 SBR to the FY 2022 President’s Budget (FY 2020 actual amounts) for budgetary resources, new obligations and upward adjustments, distributed offsetting receipts, and net outlays.
Reconciling differences exist because the President’s Budget excludes expired funds. Additionally, the President’s Budget includes a public enterprise fund that reflects the gross obligations by the FFEL Program for the estimated activity of the consolidated federal fund of the guaranty agencies. Ownership by the federal government is independent of the actual control of the assets. Since the actual operation of the federal fund is independent from FSA’s direct control, budgetary resources and new obligations and upward adjustments are estimated
2021 2020
Negative Subsidies and Downward Re-estimates of Subsidies:Direct Loan Program 4,809$ 5,382$ FFEL Program 589 6,865 HEAL Program 25 - TEACH Program 3 36 Total Negative Subsidies and Downward Re-estimates of Subsidies 5,426 12,283
Repayment of Perkins Loans and Capital Contributions 866 1,317 Other 4 6 Distributed O ffsetting Receipts 6,296$ 13,606$
Budgetary Resources
New O bligations and
Upward Adjustments
(Total)
Distributed O ffsetting Receipts
Net O utlays
Combined Statements of Budgetary Resources 389,055$ 350,132$ 13,606$ 147,306$ Expired Funds (1,701) (529) - - FFEL Guaranty Agency Amounts Included in the President 's Budget 6,125 6,125 - - Distributed Offsetting Receipts - - - 13,606 Other 3 (2) 1 2
Budget of the United States Government 1 393,482$ 355,726$ 13,607$ 160,914$
1 Amounts obtained from the Appendix, Budget of the United States Government, FY 2022
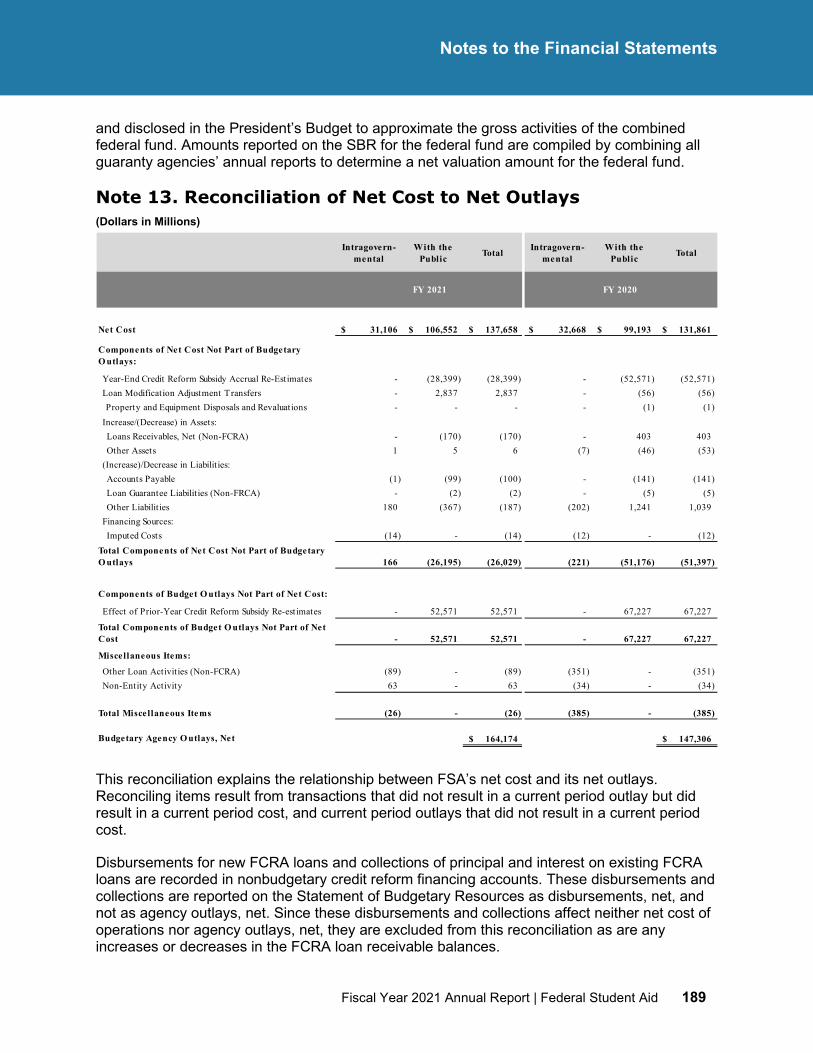
MM
Fiscal Year 2021 Annual Report | Federal Student Aid 189
Notes to the Financial Statements
and disclosed in the President’s Budget to approximate the gross activities of the combined federal fund. Amounts reported on the SBR for the federal fund are compiled by combining all guaranty agencies’ annual reports to determine a net valuation amount for the federal fund.
Note 13. Reconciliation of Net Cost to Net Outlays (Dollars in Millions)
This reconciliation explains the relationship between FSA’s net cost and its net outlays. Reconciling items result from transactions that did not result in a current period outlay but did result in a current period cost, and current period outlays that did not result in a current period cost.
Disbursements for new FCRA loans and collections of principal and interest on existing FCRA loans are recorded in nonbudgetary credit reform financing accounts. These disbursements and collections are reported on the Statement of Budgetary Resources as disbursements, net, and not as agency outlays, net. Since these disbursements and collections affect neither net cost of operations nor agency outlays, net, they are excluded from this reconciliation as are any increases or decreases in the FCRA loan receivable balances.
Intragovern-mental
With thePublic Total Intragovern-
mentalWith the
Public Total
31,106$ 106,552$ 137,658$ 32,668$ 99,193$ 131,861$
- (28,399) (28,399) - (52,571) (52,571) - 2,837 2,837 - (56) (56)
Property and Equipment Disposals and Revaluations - - - - (1) (1)
Loans Receivables, Net (Non-FCRA) - (170) (170) - 403 403 Other Assets 1 5 6 (7) (46) (53)
Accounts Payable (1) (99) (100) - (141) (141) Loan Guarantee Liabilit ies (Non-FRCA) - (2) (2) - (5) (5) Other Liabilit ies 180 (367) (187) (202) 1,241 1,039
Imputed Costs (14) - (14) (12) - (12)
166 (26,195) (26,029) (221) (51,176) (51,397)
Effect of Prior-Year Credit Reform Subsidy Re-estimates - 52,571 52,571 - 67,227 67,227
- 52,571 52,571 - 67,227 67,227
Other Loan Activities (Non-FCRA) (89) - (89) (351) - (351) Non-Entity Activity 63 - 63 (34) - (34)
(26) - (26) (385) - (385)
164,174$ 147,306$
Total Miscellaneous Items
Budgetary Agency O utlays, Net
Financing Sources:
Total Components of Net Cost Not Part of Budgetary O utlays
Components of Budget O utlays Not Part of Net Cost:
Total Components of Budget O utlays Not Part of Net Cost
Miscellaneous Items:
(Increase)/Decrease in Liabilit ies:
FY 2021 FY 2020
Net Cost
Components of Net Cost Not Part of Budgetary O utlays:
Year-End Credit Reform Subsidy Accrual Re-EstimatesLoan Modification Adjustment Transfers
Increase/(Decrease) in Assets:
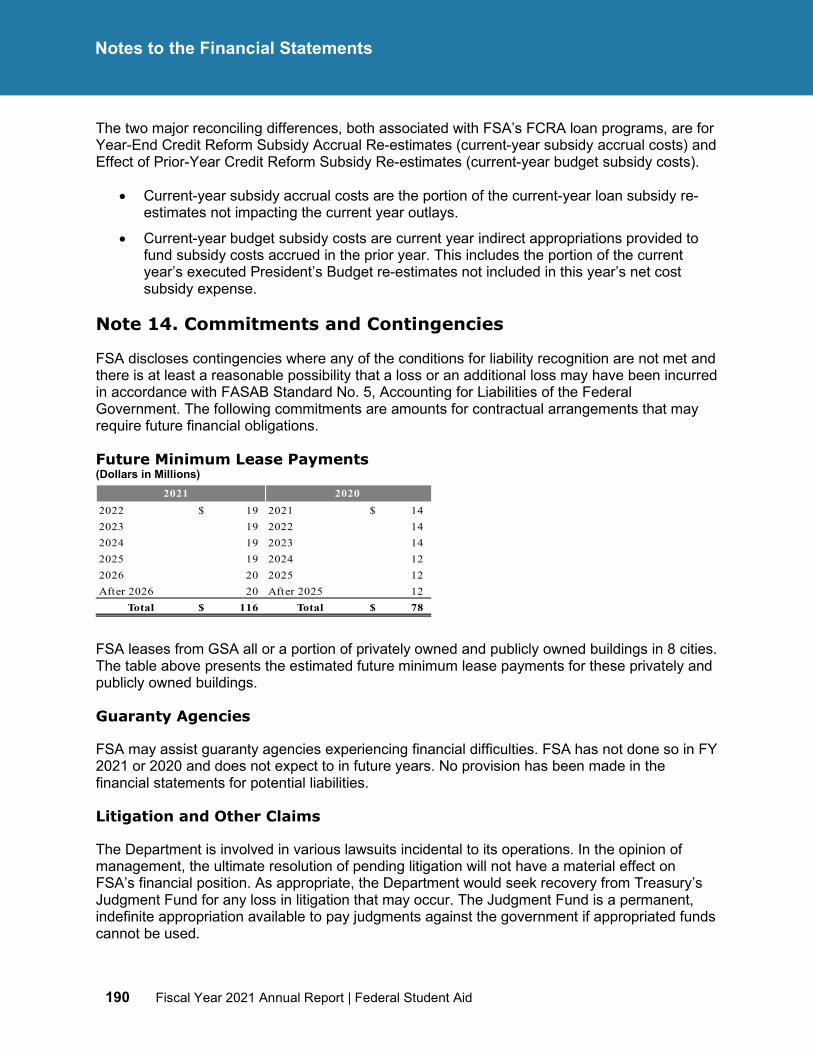
190 Fiscal Year 2021 Annual Report | Federal Student Aid
Notes to the Financial Statements
The two major reconciling differences, both associated with FSA’s FCRA loan programs, are for Year-End Credit Reform Subsidy Accrual Re-estimates (current-year subsidy accrual costs) and Effect of Prior-Year Credit Reform Subsidy Re-estimates (current-year budget subsidy costs).
• Current-year subsidy accrual costs are the portion of the current-year loan subsidy re-estimates not impacting the current year outlays.
• Current-year budget subsidy costs are current year indirect appropriations provided to fund subsidy costs accrued in the prior year. This includes the portion of the current year’s executed President’s Budget re-estimates not included in this year’s net cost subsidy expense.
Note 14. Commitments and Contingencies
FSA discloses contingencies where any of the conditions for liability recognition are not met and there is at least a reasonable possibility that a loss or an additional loss may have been incurred in accordance with FASAB Standard No. 5, Accounting for Liabilities of the Federal Government. The following commitments are amounts for contractual arrangements that may require future financial obligations.
Future Minimum Lease Payments (Dollars in Millions)
FSA leases from GSA all or a portion of privately owned and publicly owned buildings in 8 cities. The table above presents the estimated future minimum lease payments for these privately and publicly owned buildings.
Guaranty Agencies
FSA may assist guaranty agencies experiencing financial difficulties. FSA has not done so in FY 2021 or 2020 and does not expect to in future years. No provision has been made in the financial statements for potential liabilities.
Litigation and Other Claims
The Department is involved in various lawsuits incidental to its operations. In the opinion of management, the ultimate resolution of pending litigation will not have a material effect on FSA’s financial position. As appropriate, the Department would seek recovery from Treasury’s Judgment Fund for any loss in litigation that may occur. The Judgment Fund is a permanent, indefinite appropriation available to pay judgments against the government if appropriated funds cannot be used.
2021 20202022 19$ 2021 14$ 2023 19 2022 14 2024 19 2023 14 2025 19 2024 12 2026 20 2025 12 After 2026 20 After 2025 12 Total 116$ Total 78$
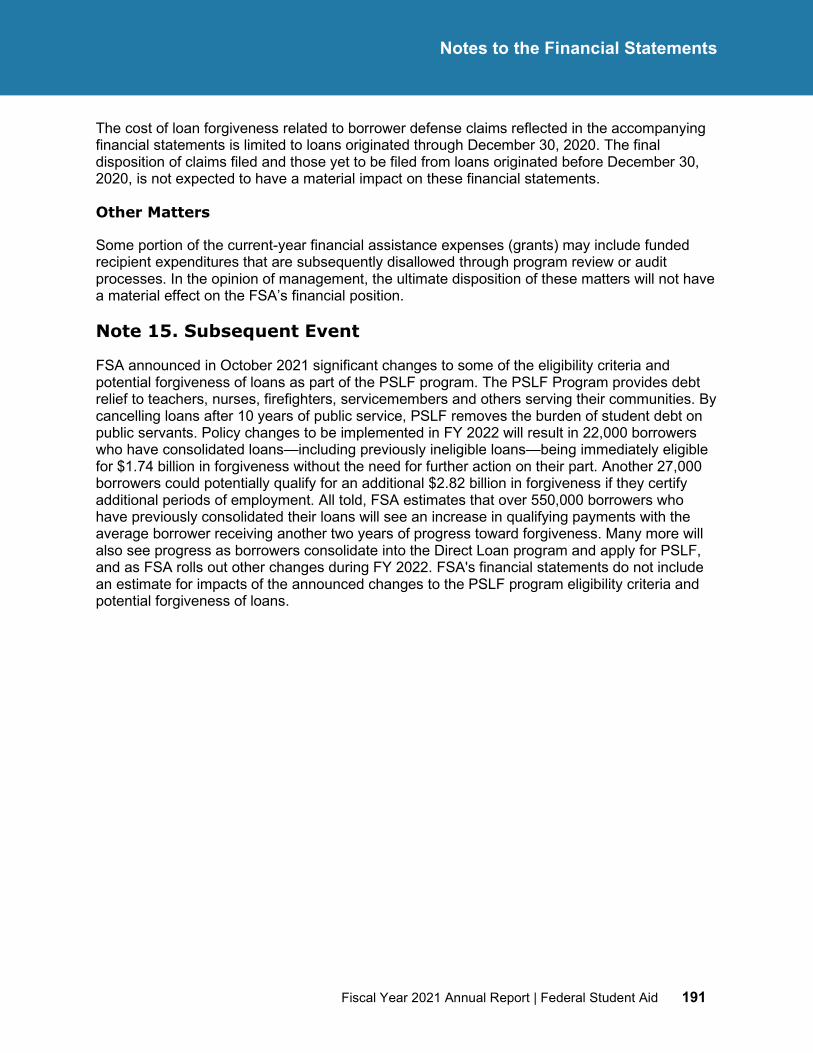
MM
Fiscal Year 2021 Annual Report | Federal Student Aid 191
Notes to the Financial Statements
The cost of loan forgiveness related to borrower defense claims reflected in the accompanying financial statements is limited to loans originated through December 30, 2020. The final disposition of claims filed and those yet to be filed from loans originated before December 30, 2020, is not expected to have a material impact on these financial statements.
Other Matters
Some portion of the current-year financial assistance expenses (grants) may include funded recipient expenditures that are subsequently disallowed through program review or audit processes. In the opinion of management, the ultimate disposition of these matters will not have a material effect on the FSA’s financial position.
Note 15. Subsequent Event
FSA announced in October 2021 significant changes to some of the eligibility criteria and potential forgiveness of loans as part of the PSLF program. The PSLF Program provides debt relief to teachers, nurses, firefighters, servicemembers and others serving their communities. By cancelling loans after 10 years of public service, PSLF removes the burden of student debt on public servants. Policy changes to be implemented in FY 2022 will result in 22,000 borrowers who have consolidated loans—including previously ineligible loans—being immediately eligible for $1.74 billion in forgiveness without the need for further action on their part. Another 27,000 borrowers could potentially qualify for an additional $2.82 billion in forgiveness if they certify additional periods of employment. All told, FSA estimates that over 550,000 borrowers who have previously consolidated their loans will see an increase in qualifying payments with the average borrower receiving another two years of progress toward forgiveness. Many more will also see progress as borrowers consolidate into the Direct Loan program and apply for PSLF, and as FSA rolls out other changes during FY 2022. FSA's financial statements do not include an estimate for impacts of the announced changes to the PSLF program eligibility criteria and potential forgiveness of loans.
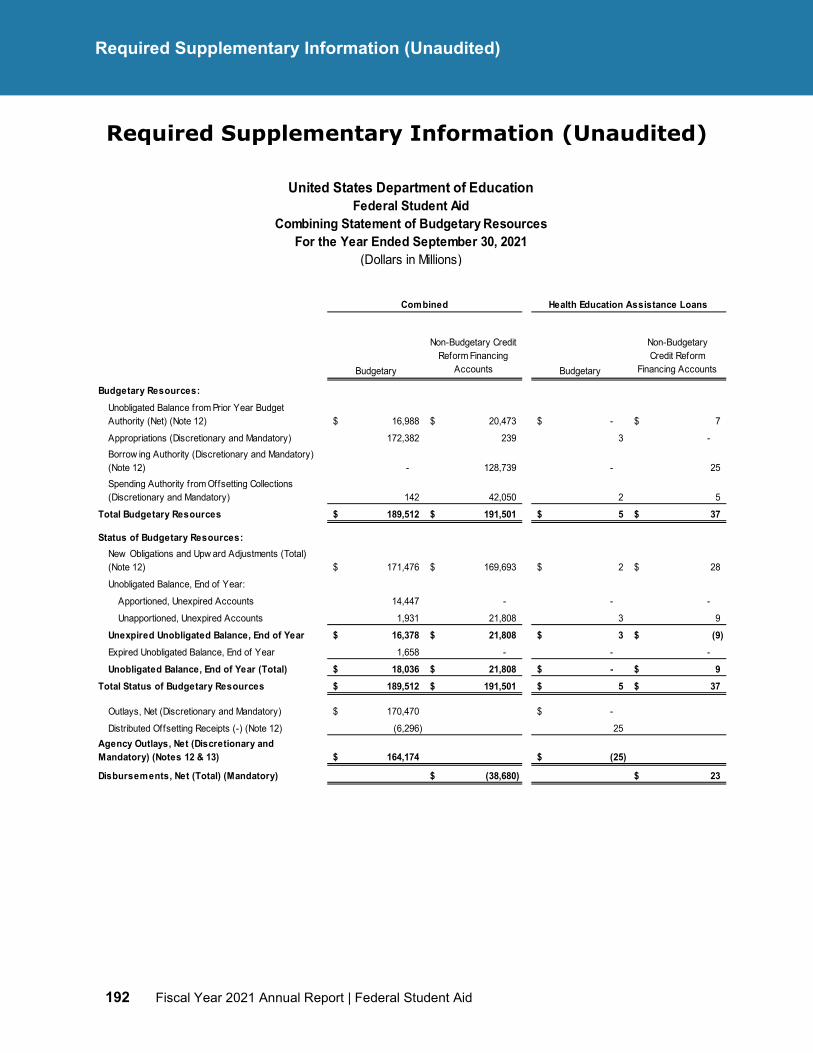
192 Fiscal Year 2021 Annual Report | Federal Student Aid
Required Supplementary Information (Unaudited)
Required Supplementary Information (Unaudited)
Budgetary
Non-Budgetary Credit Reform Financing
Accounts Budgetary
Non-Budgetary Credit Reform
Financing Accounts
16,988$ 20,473$ -$ 7$
172,382 239 3 -
- 128,739 - 25
142 42,050 2 5
189,512$ 191,501$ 5$ 37$
171,476$ 169,693$ 2$ 28$
Apportioned, Unexpired Accounts 14,447 - - -
Unapportioned, Unexpired Accounts 1,931 21,808 3 9
16,378$ 21,808$ 3$ (9)$ 1,658 - - -
18,036$ 21,808$ -$ 9$ 189,512$ 191,501$ 5$ 37$
170,470$ -$
(6,296) 25
164,174$ (25)$
(38,680)$ 23$
United States Department of EducationFederal Student Aid
Combining Statement of Budgetary ResourcesFor the Year Ended September 30, 2021
(Dollars in Millions)
Combined Health Education Assistance Loans
Budgetary Resources:
New Obligations and Upw ard Adjustments (Total) (Note 12)
Unobligated Balance, End of Year:
Unexpired Unobligated Balance, End of YearExpired Unobligated Balance, End of Year
Unobligated Balance, End of Year (Total)Total Status of Budgetary Resources
Unobligated Balance from Prior Year Budget Authority (Net) (Note 12)
Appropriations (Discretionary and Mandatory)
Total Budgetary Resources
Borrow ing Authority (Discretionary and Mandatory) (Note 12)Spending Authority from Offsetting Collections (Discretionary and Mandatory)
Status of Budgetary Resources:
Outlays, Net (Discretionary and Mandatory)
Distributed Offsetting Receipts (-) (Note 12)Agency Outlays, Net (Discretionary and Mandatory) (Notes 12 & 13)
Disbursements, Net (Total) (Mandatory)
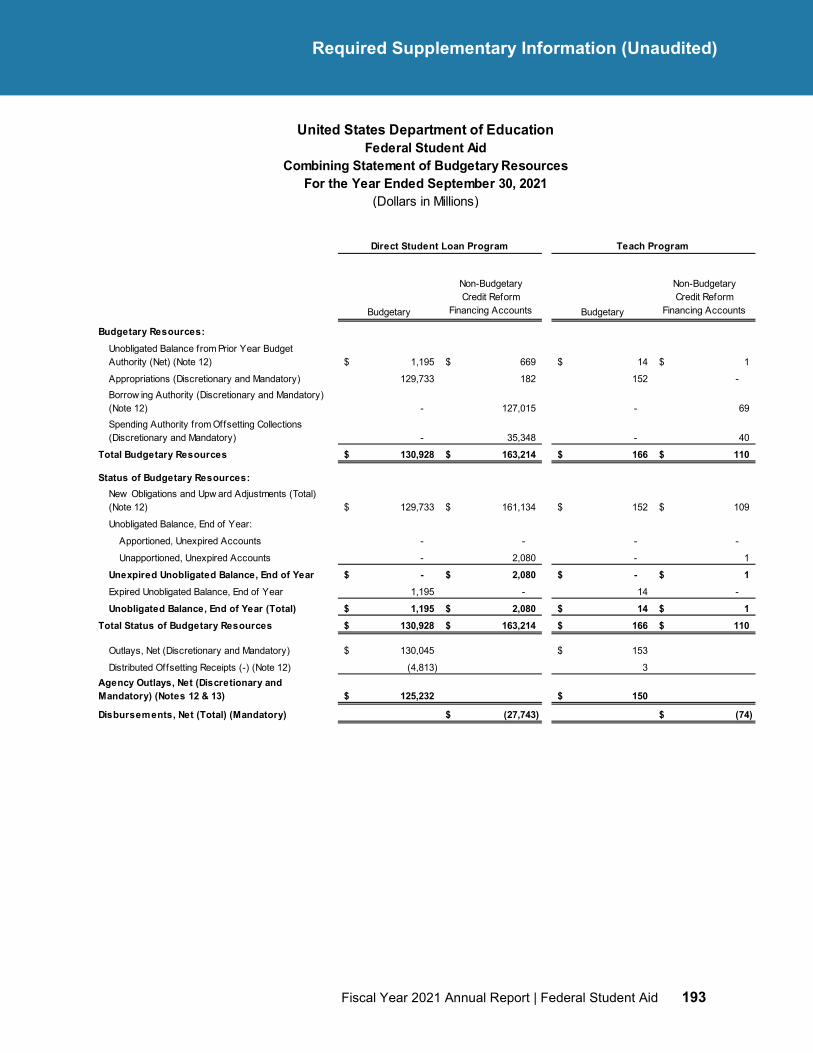
MM
Fiscal Year 2021 Annual Report | Federal Student Aid 193
Required Supplementary Information (Unaudited)
Budgetary
Non-Budgetary Credit Reform
Financing Accounts Budgetary
Non-Budgetary Credit Reform
Financing Accounts
1,195$ 669$ 14$ 1$
129,733 182 152 -
- 127,015 - 69
- 35,348 - 40
130,928$ 163,214$ 166$ 110$
129,733$ 161,134$ 152$ 109$
Apportioned, Unexpired Accounts - - - -
Unapportioned, Unexpired Accounts - 2,080 - 1
-$ 2,080$ -$ 1$ 1,195 - 14 -
1,195$ 2,080$ 14$ 1$ 130,928$ 163,214$ 166$ 110$
130,045$ 153$
(4,813) 3
125,232$ 150$
(27,743)$ (74)$
Direct Student Loan Program Teach Program
United States Department of EducationFederal Student Aid
Combining Statement of Budgetary ResourcesFor the Year Ended September 30, 2021
(Dollars in Millions)
Status of Budgetary Resources:New Obligations and Upw ard Adjustments (Total) (Note 12)
Unobligated Balance, End of Year:
Unexpired Unobligated Balance, End of Year
Budgetary Resources:Unobligated Balance from Prior Year Budget Authority (Net) (Note 12)
Appropriations (Discretionary and Mandatory)Borrow ing Authority (Discretionary and Mandatory) (Note 12)Spending Authority from Offsetting Collections (Discretionary and Mandatory)
Total Budgetary Resources
Total Status of Budgetary Resources
Outlays, Net (Discretionary and Mandatory)
Distributed Offsetting Receipts (-) (Note 12)
Expired Unobligated Balance, End of Year
Unobligated Balance, End of Year (Total)
Agency Outlays, Net (Discretionary and Mandatory) (Notes 12 & 13)
Disbursements, Net (Total) (Mandatory)
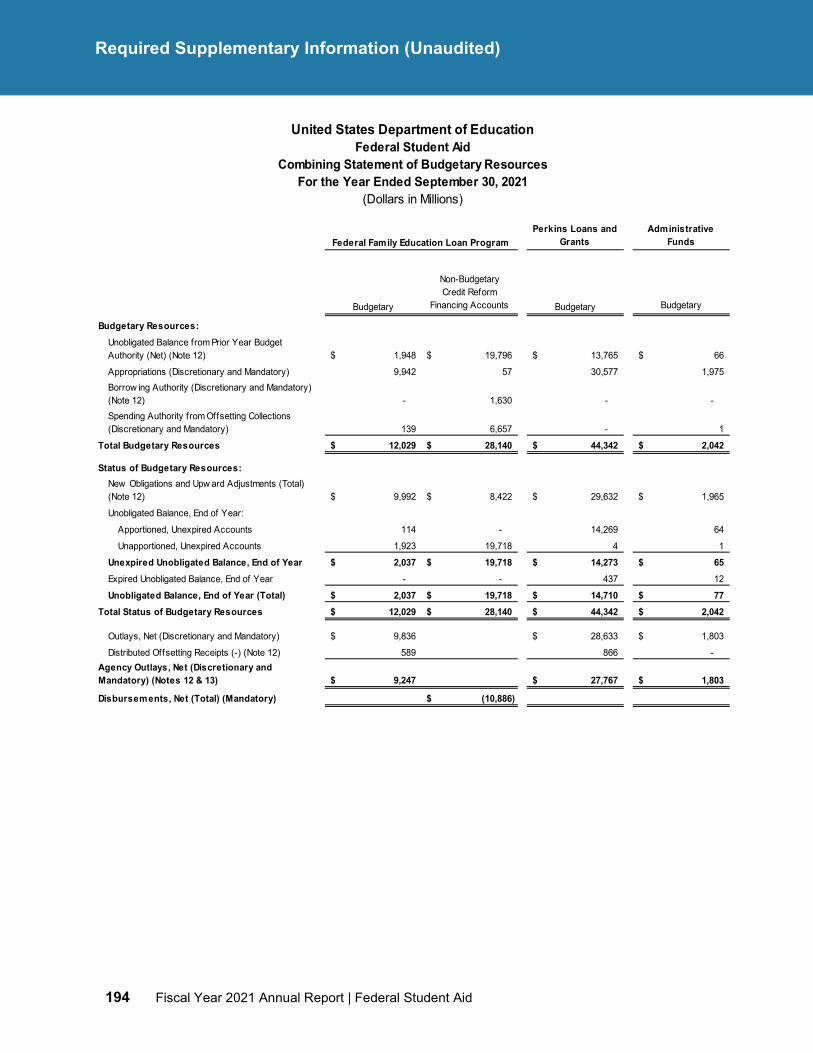
194 Fiscal Year 2021 Annual Report | Federal Student Aid
Required Supplementary Information (Unaudited)
Perkins Loans and Grants
Administrative Funds
Budgetary
Non-Budgetary Credit Reform
Financing Accounts Budgetary Budgetary
1,948$ 19,796$ 13,765$ 66$
9,942 57 30,577 1,975
- 1,630 - -
139 6,657 - 1
12,029$ 28,140$ 44,342$ 2,042$
9,992$ 8,422$ 29,632$ 1,965$
Apportioned, Unexpired Accounts 114 - 14,269 64
Unapportioned, Unexpired Accounts 1,923 19,718 4 1
2,037$ 19,718$ 14,273$ 65$ - - 437 12
2,037$ 19,718$ 14,710$ 77$ 12,029$ 28,140$ 44,342$ 2,042$
9,836$ 28,633$ 1,803$
589 866 -
9,247$ 27,767$ 1,803$
(10,886)$
Federal Family Education Loan Program
United States Department of Education
(Dollars in Millions)For the Year Ended September 30, 2021
Combining Statement of Budgetary ResourcesFederal Student Aid
Budgetary Resources:Unobligated Balance from Prior Year Budget Authority (Net) (Note 12)
Appropriations (Discretionary and Mandatory)Borrow ing Authority (Discretionary and Mandatory) (Note 12)Spending Authority from Offsetting Collections (Discretionary and Mandatory)
Total Budgetary Resources
Status of Budgetary Resources:New Obligations and Upw ard Adjustments (Total) (Note 12)
Unobligated Balance, End of Year:
Unexpired Unobligated Balance, End of YearExpired Unobligated Balance, End of Year
Unobligated Balance, End of Year (Total)Total Status of Budgetary Resources
Outlays, Net (Discretionary and Mandatory)
Distributed Offsetting Receipts (-) (Note 12)Agency Outlays, Net (Discretionary and Mandatory) (Notes 12 & 13)
Disbursements, Net (Total) (Mandatory)
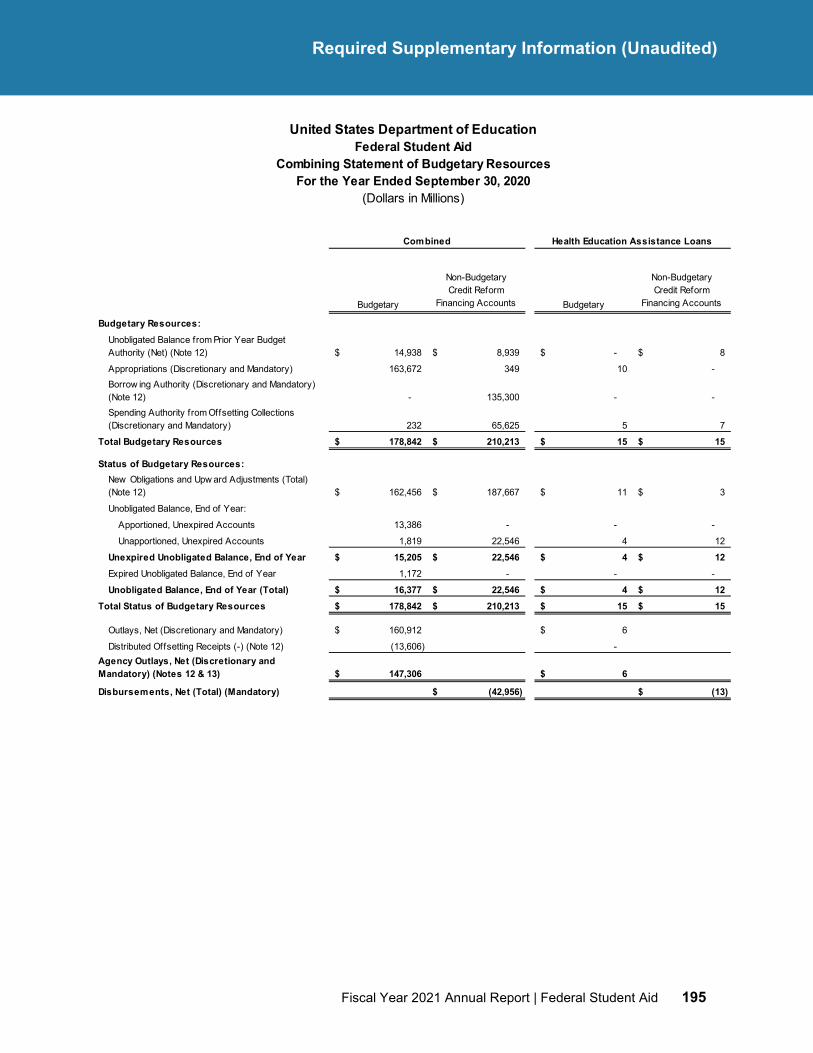
MM
Fiscal Year 2021 Annual Report | Federal Student Aid 195
Required Supplementary Information (Unaudited)
Budgetary
Non-Budgetary Credit Reform
Financing Accounts Budgetary
Non-Budgetary Credit Reform
Financing Accounts
14,938$ 8,939$ -$ 8$
163,672 349 10 -
- 135,300 - -
232 65,625 5 7
178,842$ 210,213$ 15$ 15$
162,456$ 187,667$ 11$ 3$
Apportioned, Unexpired Accounts 13,386 - - -
Unapportioned, Unexpired Accounts 1,819 22,546 4 12
15,205$ 22,546$ 4$ 12$ 1,172 - - -
16,377$ 22,546$ 4$ 12$ 178,842$ 210,213$ 15$ 15$
160,912$ 6$
(13,606) -
147,306$ 6$
(42,956)$ (13)$
Combining Statement of Budgetary ResourcesFor the Year Ended September 30, 2020
Combined Health Education Assistance Loans
(Dollars in Millions)
Budgetary Resources:Unobligated Balance from Prior Year Budget Authority (Net) (Note 12)
United States Department of EducationFederal Student Aid
Spending Authority from Offsetting Collections (Discretionary and Mandatory)
Total Budgetary Resources
Appropriations (Discretionary and Mandatory)Borrow ing Authority (Discretionary and Mandatory) (Note 12)
Unobligated Balance, End of Year:
Unexpired Unobligated Balance, End of Year
Status of Budgetary Resources:New Obligations and Upw ard Adjustments (Total) (Note 12)
Total Status of Budgetary Resources
Outlays, Net (Discretionary and Mandatory)
Expired Unobligated Balance, End of Year
Unobligated Balance, End of Year (Total)
Disbursements, Net (Total) (Mandatory)
Distributed Offsetting Receipts (-) (Note 12)Agency Outlays, Net (Discretionary and Mandatory) (Notes 12 & 13)
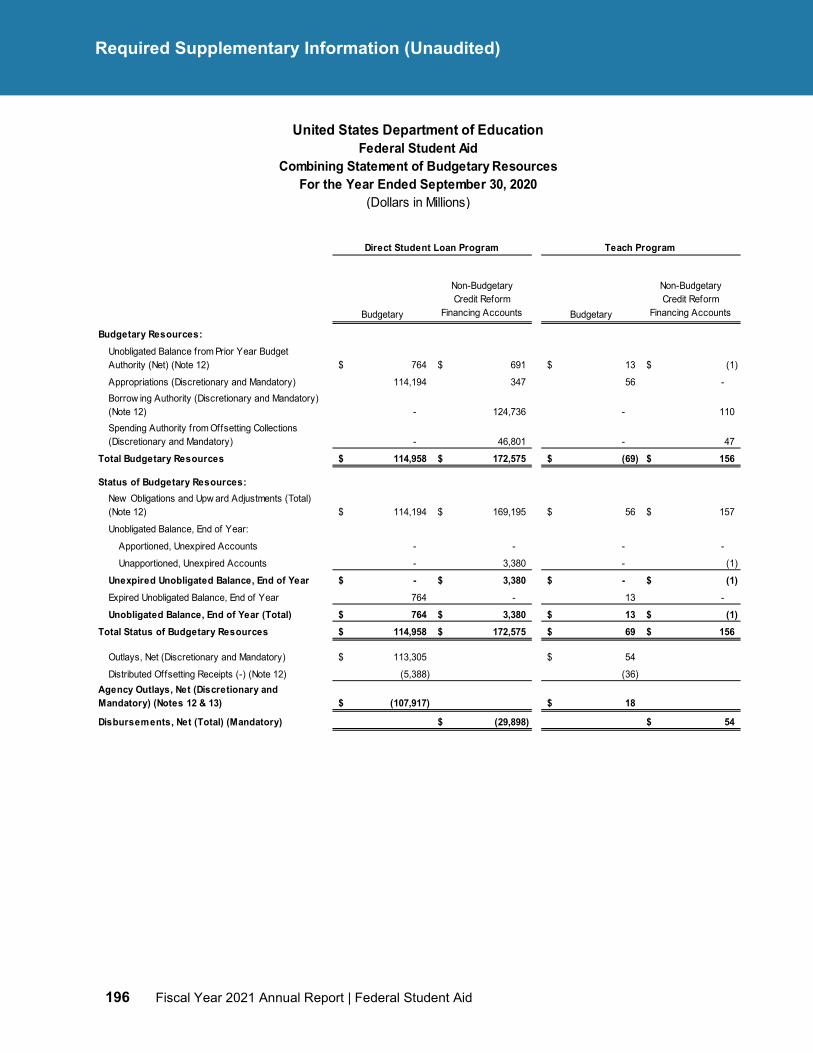
196 Fiscal Year 2021 Annual Report | Federal Student Aid
Required Supplementary Information (Unaudited)
Budgetary
Non-Budgetary Credit Reform
Financing Accounts Budgetary
Non-Budgetary Credit Reform
Financing Accounts
764$ 691$ 13$ (1)$
114,194 347 56 -
- 124,736 - 110
- 46,801 - 47
114,958$ 172,575$ (69)$ 156$
114,194$ 169,195$ 56$ 157$
Apportioned, Unexpired Accounts - - - -
Unapportioned, Unexpired Accounts - 3,380 - (1)
-$ 3,380$ -$ (1)$ 764 - 13 -
764$ 3,380$ 13$ (1)$ 114,958$ 172,575$ 69$ 156$
113,305$ 54$
(5,388) (36)
(107,917)$ 18$
(29,898)$ 54$
Combining Statement of Budgetary ResourcesFor the Year Ended September 30, 2020
Direct Student Loan Program Teach Program
(Dollars in Millions)
Budgetary Resources:Unobligated Balance from Prior Year Budget Authority (Net) (Note 12)
United States Department of EducationFederal Student Aid
Spending Authority from Offsetting Collections (Discretionary and Mandatory)
Total Budgetary Resources
Appropriations (Discretionary and Mandatory)Borrow ing Authority (Discretionary and Mandatory) (Note 12)
Unobligated Balance, End of Year:
Unexpired Unobligated Balance, End of Year
Status of Budgetary Resources:New Obligations and Upw ard Adjustments (Total) (Note 12)
Total Status of Budgetary Resources
Outlays, Net (Discretionary and Mandatory)
Expired Unobligated Balance, End of Year
Unobligated Balance, End of Year (Total)
Disbursements, Net (Total) (Mandatory)
Distributed Offsetting Receipts (-) (Note 12)Agency Outlays, Net (Discretionary and Mandatory) (Notes 12 & 13)
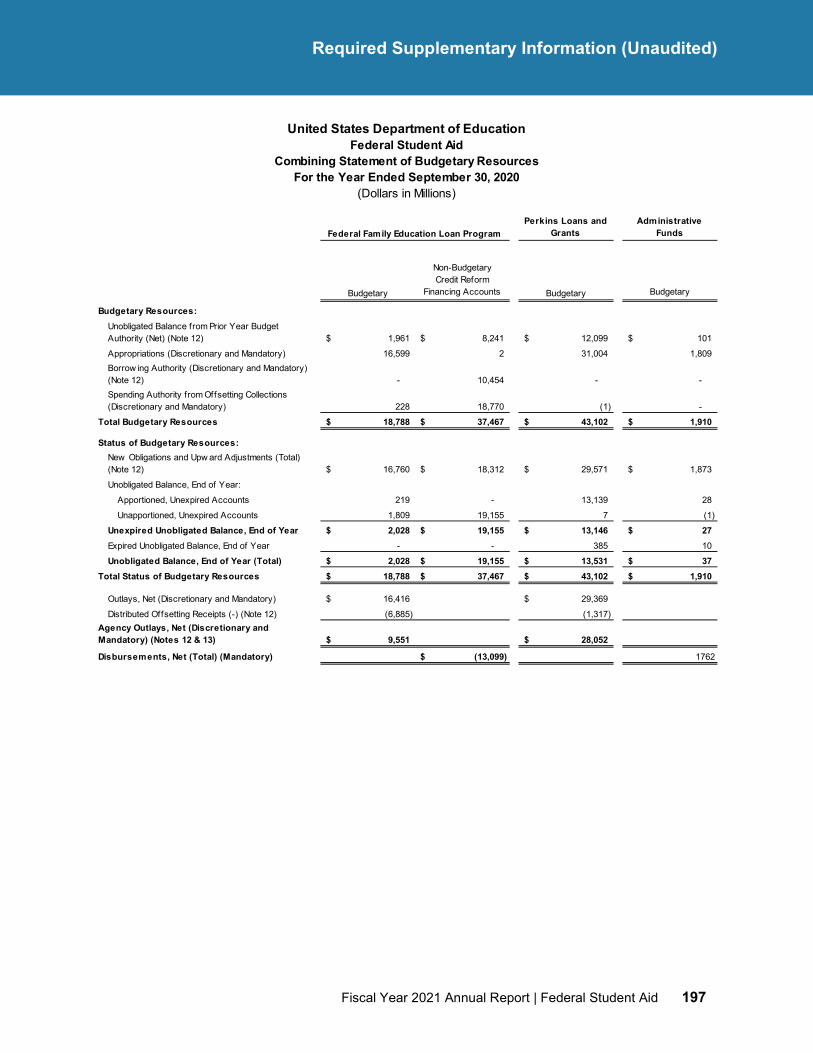
MM
Fiscal Year 2021 Annual Report | Federal Student Aid 197
Required Supplementary Information (Unaudited)
Perkins Loans and Grants
Administrative Funds
Budgetary
Non-Budgetary Credit Reform
Financing Accounts Budgetary Budgetary
1,961$ 8,241$ 12,099$ 101$
16,599 2 31,004 1,809
- 10,454 - -
228 18,770 (1) -
18,788$ 37,467$ 43,102$ 1,910$
16,760$ 18,312$ 29,571$ 1,873$
Apportioned, Unexpired Accounts 219 - 13,139 28
Unapportioned, Unexpired Accounts 1,809 19,155 7 (1)
2,028$ 19,155$ 13,146$ 27$ - - 385 10
2,028$ 19,155$ 13,531$ 37$ 18,788$ 37,467$ 43,102$ 1,910$
16,416$ 29,369$
(6,885) (1,317)
9,551$ 28,052$
(13,099)$ 1762
Combining Statement of Budgetary ResourcesFor the Year Ended September 30, 2020
Federal Family Education Loan Program
(Dollars in Millions)
Budgetary Resources:Unobligated Balance from Prior Year Budget Authority (Net) (Note 12)
United States Department of EducationFederal Student Aid
Spending Authority from Offsetting Collections (Discretionary and Mandatory)
Total Budgetary Resources
Appropriations (Discretionary and Mandatory)Borrow ing Authority (Discretionary and Mandatory) (Note 12)
Unobligated Balance, End of Year:
Unexpired Unobligated Balance, End of Year
Status of Budgetary Resources:New Obligations and Upw ard Adjustments (Total) (Note 12)
Total Status of Budgetary Resources
Outlays, Net (Discretionary and Mandatory)
Expired Unobligated Balance, End of Year
Unobligated Balance, End of Year (Total)
Disbursements, Net (Total) (Mandatory)
Distributed Offsetting Receipts (-) (Note 12)Agency Outlays, Net (Discretionary and Mandatory) (Notes 12 & 13)
198 Fiscal Year 2021 Annual Report | Federal Student Aid
Required Supplementary Information (Unaudited)
This page is intentionally left blank
Fiscal Year 2021 Annual Report | Federal Student Aid 199
Independent Auditors’ Report
Independent Auditors’ Report
Office of Inspector General Audit Transmittal
200 Fiscal Year 2021 Annual Report | Federal Student Aid
Independent Auditors’ Report
Fiscal Year 2021 Annual Report | Federal Student Aid 201
Independent Auditors’ Report
Independent Auditors’ Report
202 Fiscal Year 2021 Annual Report | Federal Student Aid
Independent Auditors’ Report
Fiscal Year 2021 Annual Report | Federal Student Aid 203
Independent Auditors’ Report
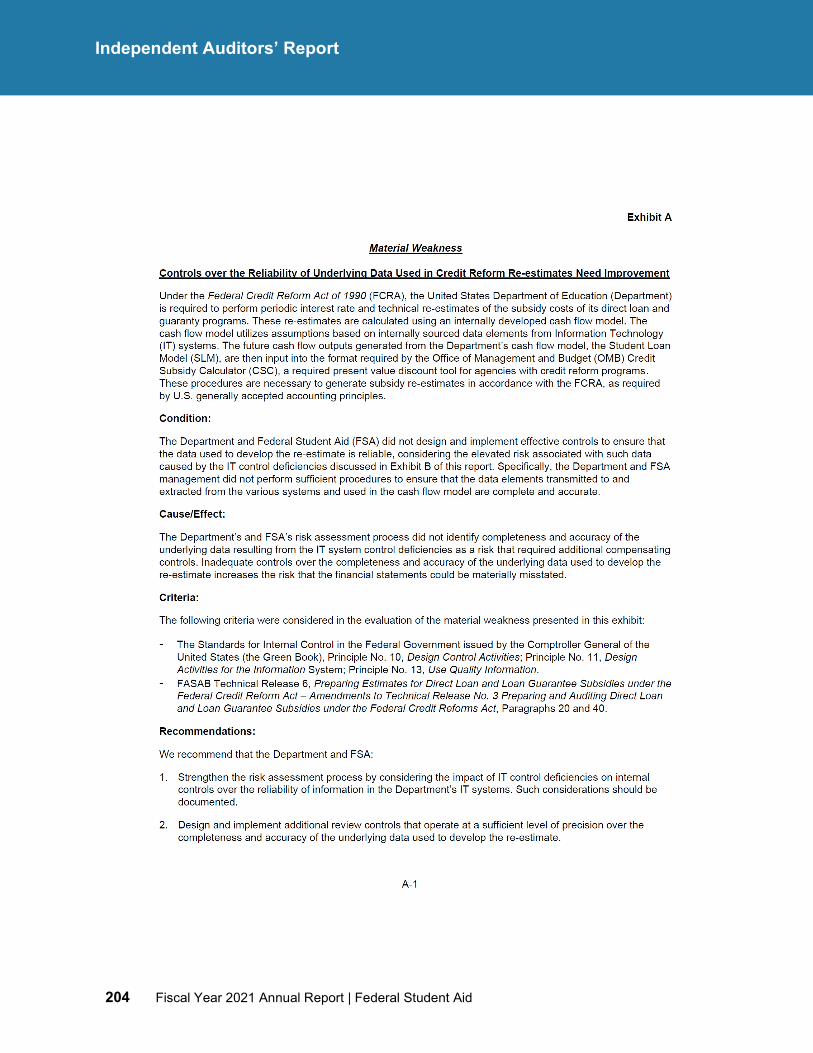
204 Fiscal Year 2021 Annual Report | Federal Student Aid
Independent Auditors’ Report
Fiscal Year 2021 Annual Report | Federal Student Aid 205
Independent Auditors’ Report
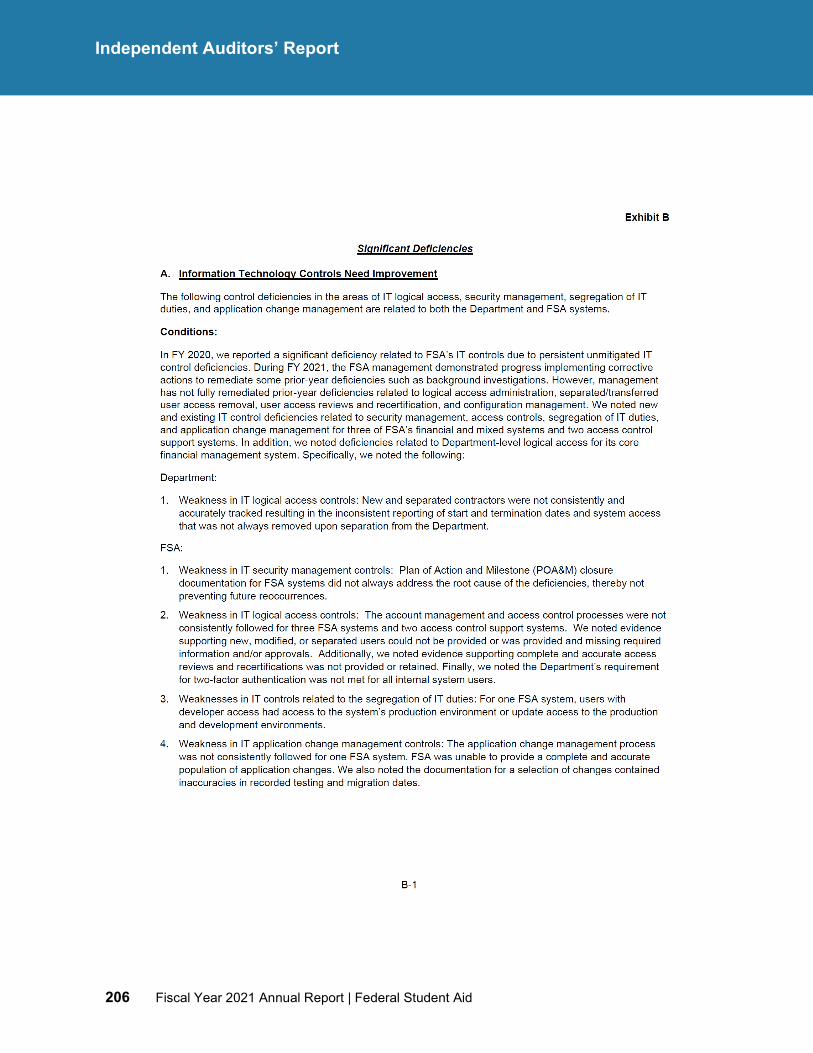
206 Fiscal Year 2021 Annual Report | Federal Student Aid
Independent Auditors’ Report
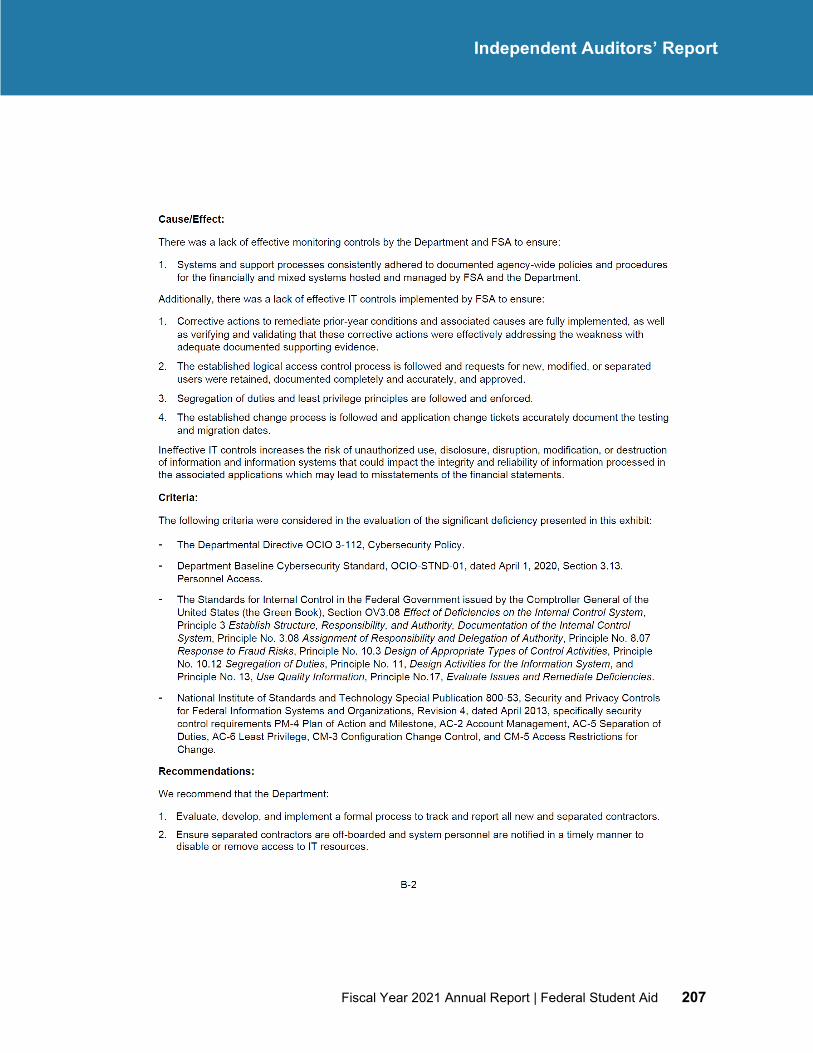
Fiscal Year 2021 Annual Report | Federal Student Aid 207
Independent Auditors’ Report
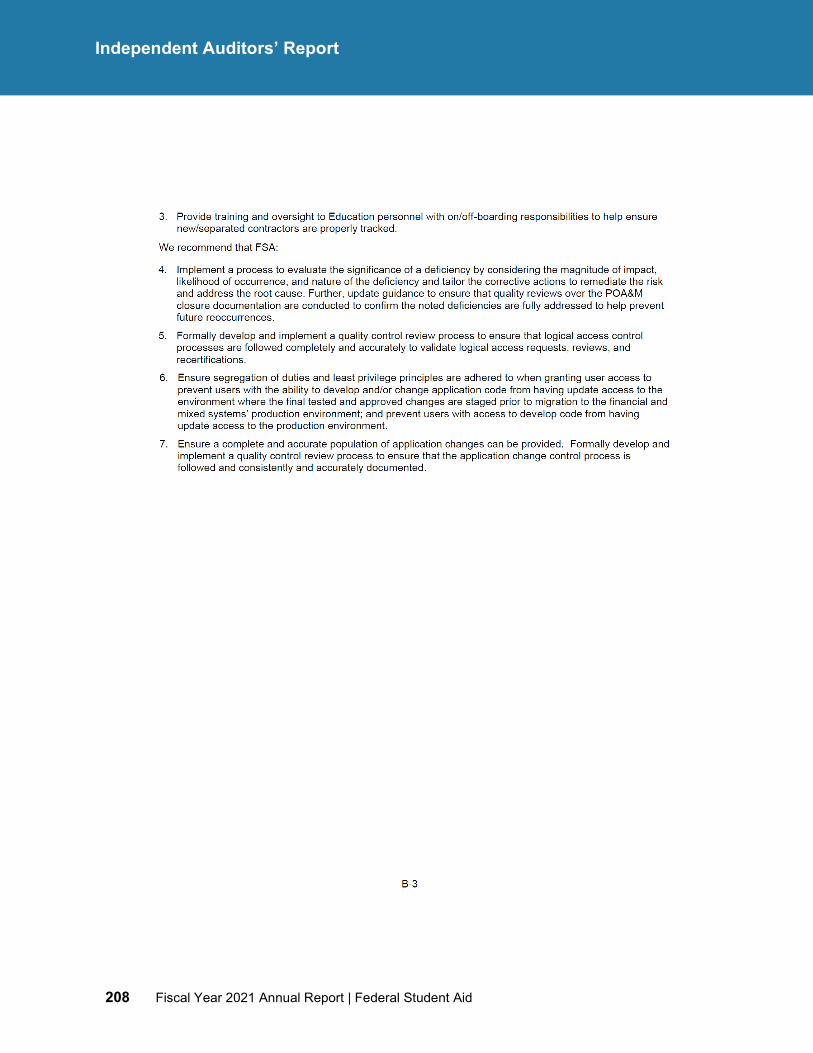
208 Fiscal Year 2021 Annual Report | Federal Student Aid
Independent Auditors’ Report
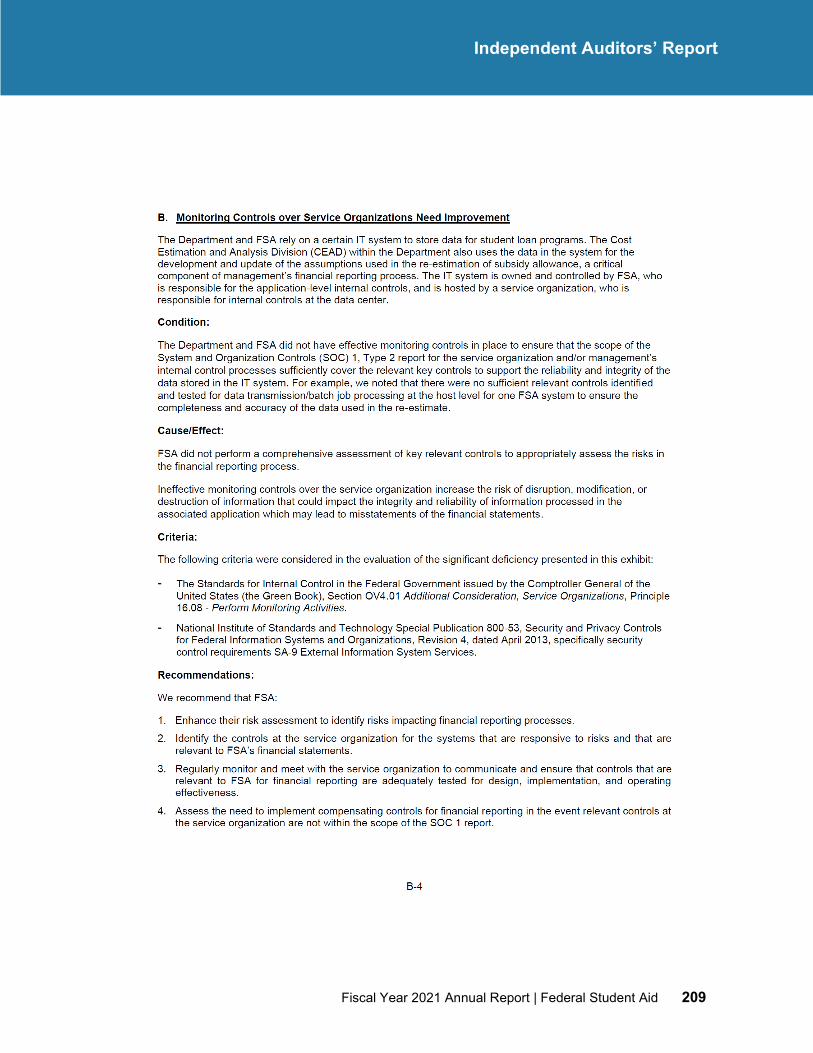
Fiscal Year 2021 Annual Report | Federal Student Aid 209
Independent Auditors’ Report
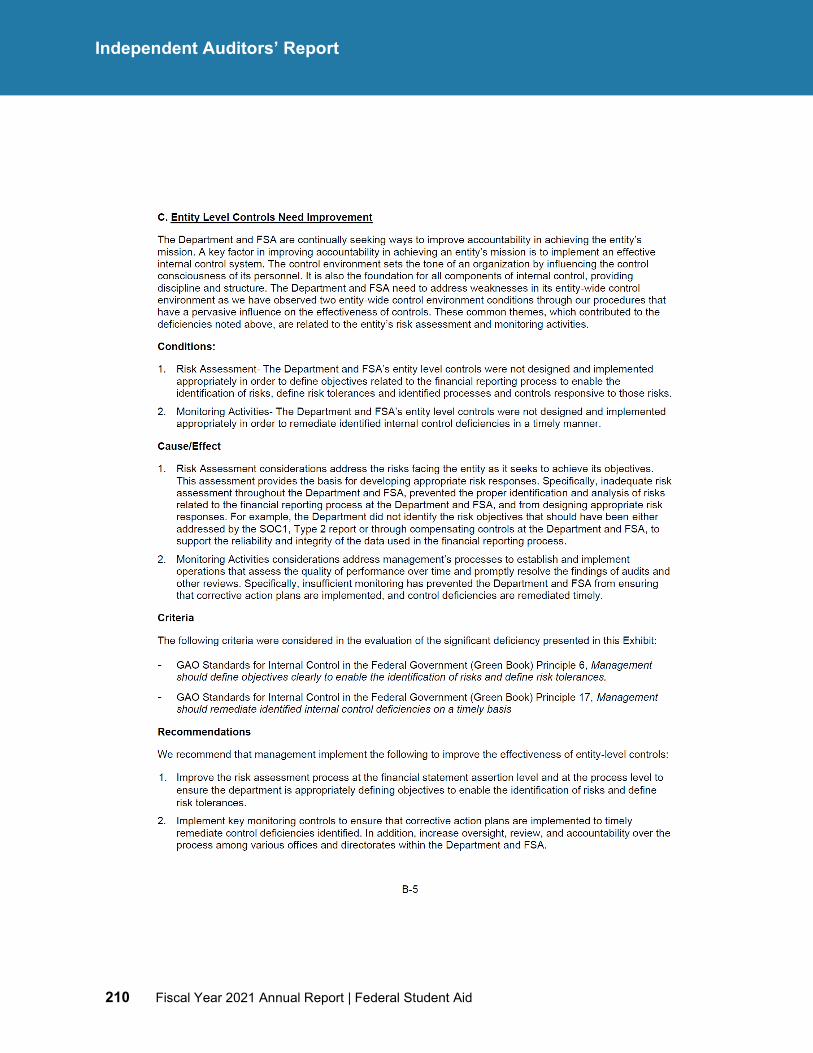
210 Fiscal Year 2021 Annual Report | Federal Student Aid
Independent Auditors’ Report
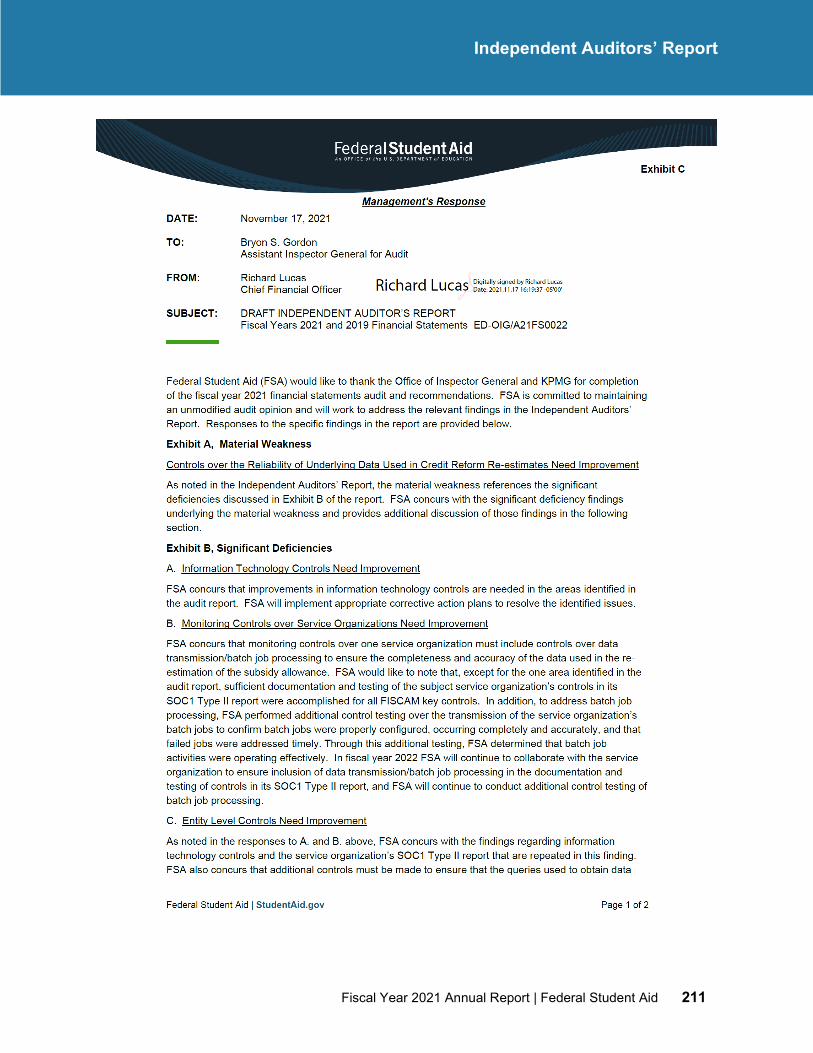
Fiscal Year 2021 Annual Report | Federal Student Aid 211
Independent Auditors’ Report
212 Fiscal Year 2021 Annual Report | Federal Student Aid
Independent Auditors’ Report
Fiscal Year 2021 Annual Report | Federal Student Aid 213
Other Information
Other Information (Unaudited)
214 Fiscal Year 2021 Annual Report | Federal Student Aid
Other Information
This page is intentionally left blank.
Fiscal Year 2021 Annual Report | Federal Student Aid 215
Other Information
Other Information
Summary of Financial Statement Audit and Management Assurances
Summary of Financial Statement Audit
Audit Opinion: Unmodified
Restatement: No
Material Weaknesses (See below)
Table 61: Material Weaknesses
Material Weaknesses Beginning Balance New Resolved Consolidated Ending
Balance Total Material Weaknesses 1 0 0 0 1
For details on the management assurances related to the FSA programs, please refer to the Analysis of Systems, Controls and Legal Compliance discussion in the Management’s Discussion and Analysis section of this document as well as the Summary of Financial Statement Audit and Management Assurances located in the Other Information section of the Department’s AFR.
Management Challenges
For details on FSA Management Challenges, please refer to the Office of Inspector General’s Management Challenges for FY 2021 Executive Summary found in the Other Information section located within the Department’s AFR.
Payment Integrity
Payment Integrity Information Act Reporting
The Payment Integrity Information Act of 2019 (Pub. L. 116-117) requires federal agencies to report information annually on improper payments and unknown payments to the President and Congress. For improper payment and unknown payment information, FSA’s activities are part of an overall Departmental integrated reporting effort and reported on paymentaccuracy.gov.
In FY 2021, the Federal Pell Grant and Direct Loan Programs are the FSA programs identified as susceptible to significant improper payments and OMB designated high priority programs. FSA continues to place additional emphasis on these important programs as required by OMB guidance to ensure payment integrity and minimize improper payments and unknown payments. Details on FSA’s Federal Pell Grant and Direct Loan sampling and estimation methodologies, improper payment and unknown payment estimates, root causes, and corrective actions can be found at paymentaccuracy.gov.
216 Fiscal Year 2021 Annual Report | Federal Student Aid
Other Information
This page is intentionally left blank.

Fiscal Year 2021 Annual Report | Federal Student Aid 217
Appendices
Appendices
218 Fiscal Year 2021 Annual Report | Federal Student Aid
Appendices
This page is intentionally left blank.
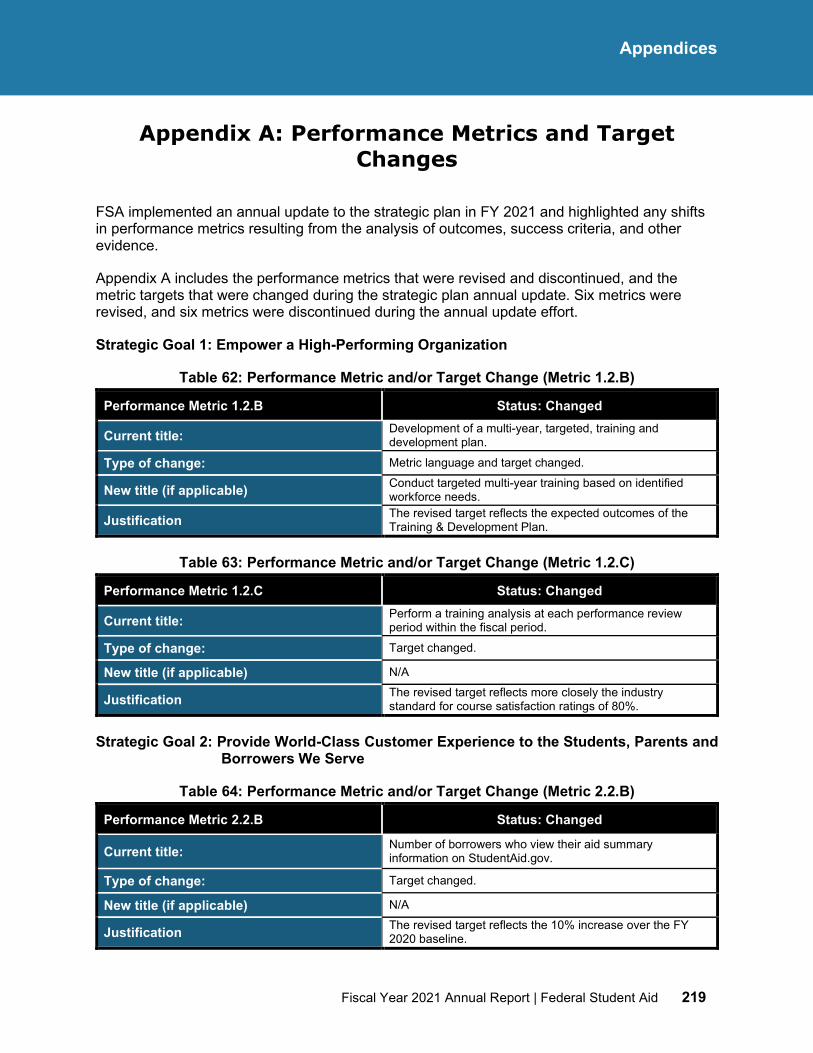
Fiscal Year 2021 Annual Report | Federal Student Aid 219
Appendices
Appendix A: Performance Metrics and Target Changes
FSA implemented an annual update to the strategic plan in FY 2021 and highlighted any shifts in performance metrics resulting from the analysis of outcomes, success criteria, and other evidence.
Appendix A includes the performance metrics that were revised and discontinued, and the metric targets that were changed during the strategic plan annual update. Six metrics were revised, and six metrics were discontinued during the annual update effort.
Strategic Goal 1: Empower a High-Performing Organization
Table 62: Performance Metric and/or Target Change (Metric 1.2.B)
Performance Metric 1.2.B Status: Changed
Current title: Development of a multi-year, targeted, training and development plan.
Type of change: Metric language and target changed.
New title (if applicable) Conduct targeted multi-year training based on identified workforce needs.
Justification The revised target reflects the expected outcomes of the Training & Development Plan.
Table 63: Performance Metric and/or Target Change (Metric 1.2.C)
Performance Metric 1.2.C Status: Changed
Current title: Perform a training analysis at each performance review period within the fiscal period.
Type of change: Target changed.
New title (if applicable) N/A
Justification The revised target reflects more closely the industry standard for course satisfaction ratings of 80%.
Strategic Goal 2: Provide World-Class Customer Experience to the Students, Parents and Borrowers We Serve
Table 64: Performance Metric and/or Target Change (Metric 2.2.B)
Performance Metric 2.2.B Status: Changed
Current title: Number of borrowers who view their aid summary information on StudentAid.gov.
Type of change: Target changed.
New title (if applicable) N/A
Justification The revised target reflects the 10% increase over the FY 2020 baseline.
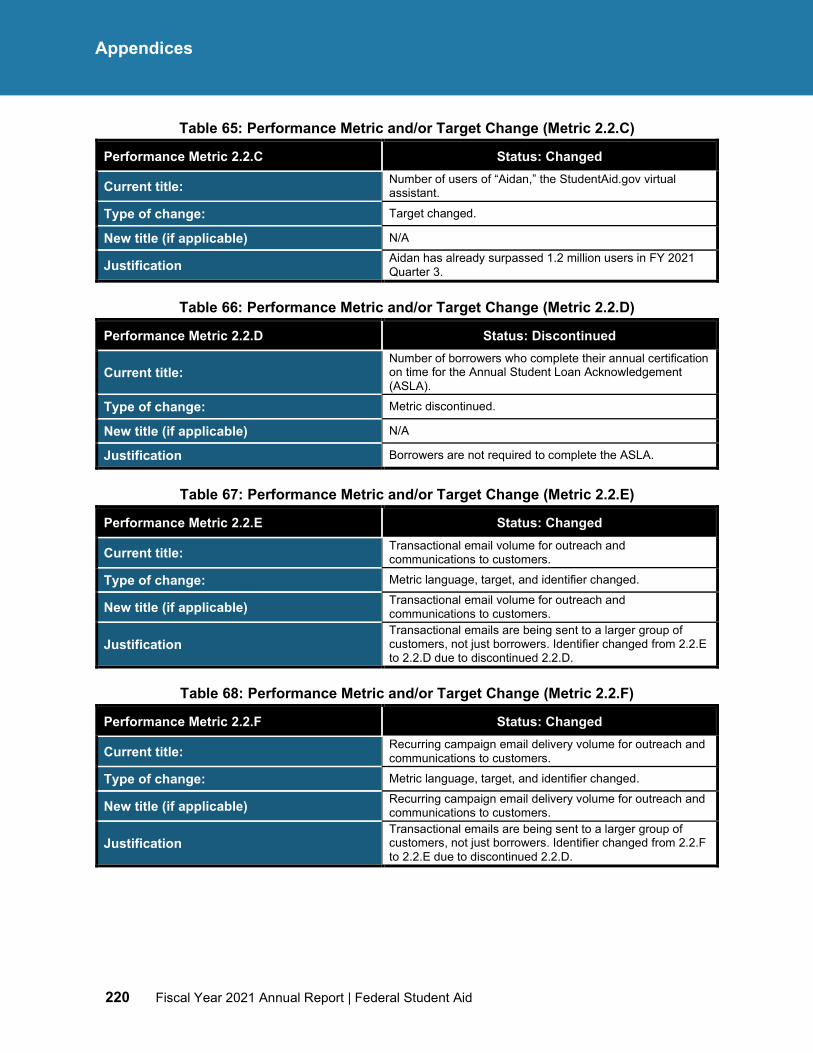
220 Fiscal Year 2021 Annual Report | Federal Student Aid
Appendices
Table 65: Performance Metric and/or Target Change (Metric 2.2.C)
Performance Metric 2.2.C Status: Changed
Current title: Number of users of “Aidan,” the StudentAid.gov virtual assistant.
Type of change: Target changed.
New title (if applicable) N/A
Justification Aidan has already surpassed 1.2 million users in FY 2021 Quarter 3.
Table 66: Performance Metric and/or Target Change (Metric 2.2.D)
Performance Metric 2.2.D Status: Discontinued
Current title: Number of borrowers who complete their annual certification on time for the Annual Student Loan Acknowledgement (ASLA).
Type of change: Metric discontinued.
New title (if applicable) N/A
Justification Borrowers are not required to complete the ASLA.
Table 67: Performance Metric and/or Target Change (Metric 2.2.E)
Performance Metric 2.2.E Status: Changed
Current title: Transactional email volume for outreach and communications to customers.
Type of change: Metric language, target, and identifier changed.
New title (if applicable) Transactional email volume for outreach and communications to customers.
Justification Transactional emails are being sent to a larger group of customers, not just borrowers. Identifier changed from 2.2.E to 2.2.D due to discontinued 2.2.D.
Table 68: Performance Metric and/or Target Change (Metric 2.2.F)
Performance Metric 2.2.F Status: Changed
Current title: Recurring campaign email delivery volume for outreach and communications to customers.
Type of change: Metric language, target, and identifier changed.
New title (if applicable) Recurring campaign email delivery volume for outreach and communications to customers.
Justification Transactional emails are being sent to a larger group of customers, not just borrowers. Identifier changed from 2.2.F to 2.2.E due to discontinued 2.2.D.
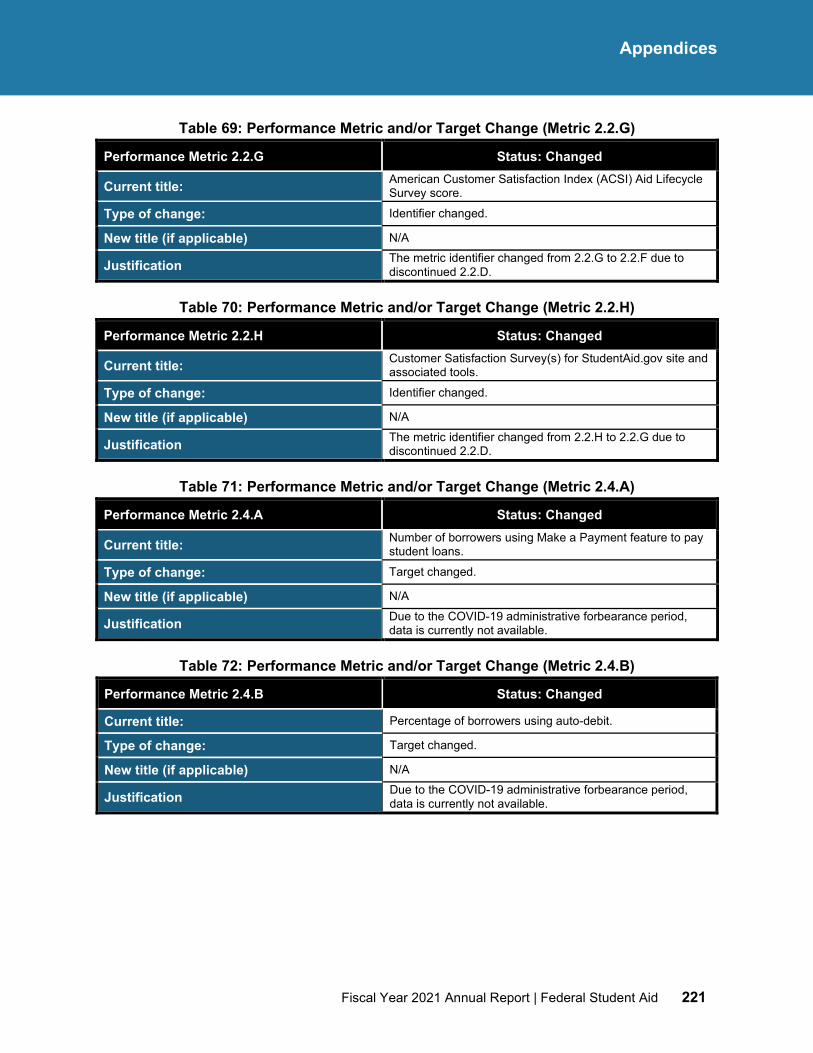
Fiscal Year 2021 Annual Report | Federal Student Aid 221
Appendices
Table 69: Performance Metric and/or Target Change (Metric 2.2.G)
Performance Metric 2.2.G Status: Changed
Current title: American Customer Satisfaction Index (ACSI) Aid Lifecycle Survey score.
Type of change: Identifier changed.
New title (if applicable) N/A
Justification The metric identifier changed from 2.2.G to 2.2.F due to discontinued 2.2.D.
Table 70: Performance Metric and/or Target Change (Metric 2.2.H)
Performance Metric 2.2.H Status: Changed
Current title: Customer Satisfaction Survey(s) for StudentAid.gov site and associated tools.
Type of change: Identifier changed.
New title (if applicable) N/A
Justification The metric identifier changed from 2.2.H to 2.2.G due to discontinued 2.2.D.
Table 71: Performance Metric and/or Target Change (Metric 2.4.A)
Performance Metric 2.4.A Status: Changed
Current title: Number of borrowers using Make a Payment feature to pay student loans.
Type of change: Target changed.
New title (if applicable) N/A
Justification Due to the COVID-19 administrative forbearance period, data is currently not available.
Table 72: Performance Metric and/or Target Change (Metric 2.4.B)
Performance Metric 2.4.B Status: Changed
Current title: Percentage of borrowers using auto-debit.
Type of change: Target changed.
New title (if applicable) N/A
Justification Due to the COVID-19 administrative forbearance period, data is currently not available.
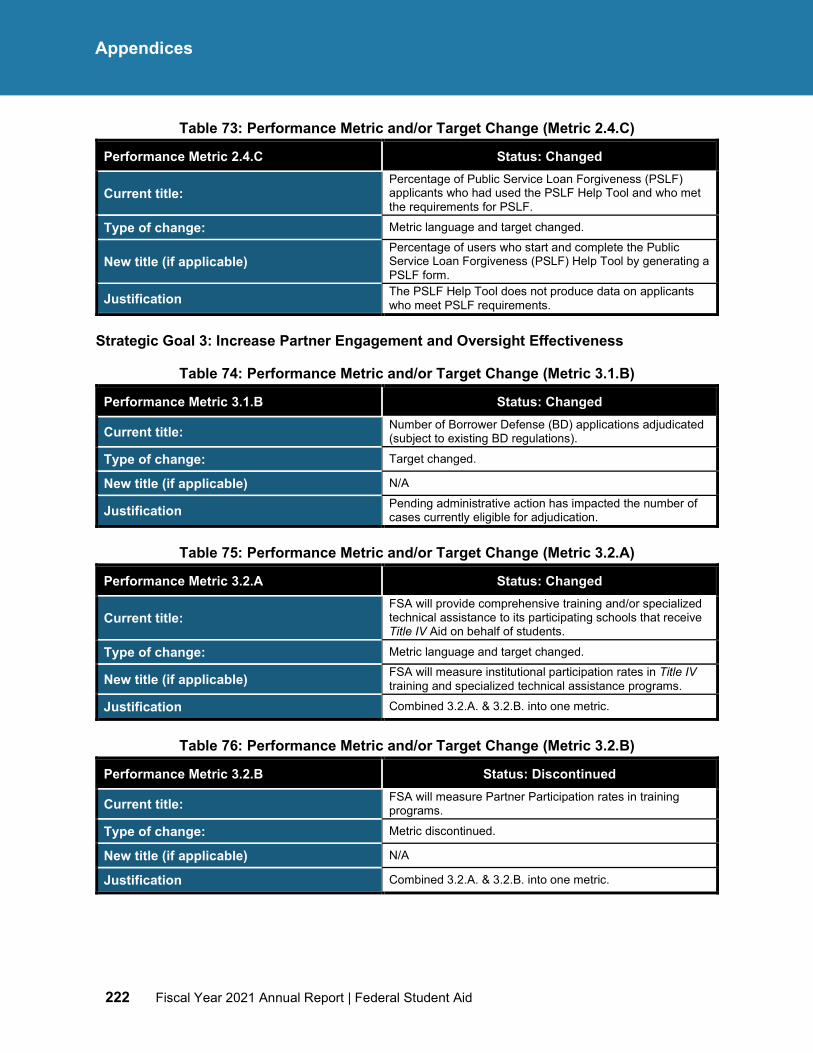
222 Fiscal Year 2021 Annual Report | Federal Student Aid
Appendices
Table 73: Performance Metric and/or Target Change (Metric 2.4.C)
Performance Metric 2.4.C Status: Changed
Current title: Percentage of Public Service Loan Forgiveness (PSLF) applicants who had used the PSLF Help Tool and who met the requirements for PSLF.
Type of change: Metric language and target changed.
New title (if applicable) Percentage of users who start and complete the Public Service Loan Forgiveness (PSLF) Help Tool by generating a PSLF form.
Justification The PSLF Help Tool does not produce data on applicants who meet PSLF requirements.
Strategic Goal 3: Increase Partner Engagement and Oversight Effectiveness
Table 74: Performance Metric and/or Target Change (Metric 3.1.B)
Performance Metric 3.1.B Status: Changed
Current title: Number of Borrower Defense (BD) applications adjudicated (subject to existing BD regulations).
Type of change: Target changed.
New title (if applicable) N/A
Justification Pending administrative action has impacted the number of cases currently eligible for adjudication.
Table 75: Performance Metric and/or Target Change (Metric 3.2.A)
Performance Metric 3.2.A Status: Changed
Current title: FSA will provide comprehensive training and/or specialized technical assistance to its participating schools that receive Title IV Aid on behalf of students.
Type of change: Metric language and target changed.
New title (if applicable) FSA will measure institutional participation rates in Title IV training and specialized technical assistance programs.
Justification Combined 3.2.A. & 3.2.B. into one metric.
Table 76: Performance Metric and/or Target Change (Metric 3.2.B)
Performance Metric 3.2.B Status: Discontinued
Current title: FSA will measure Partner Participation rates in training programs.
Type of change: Metric discontinued.
New title (if applicable) N/A
Justification Combined 3.2.A. & 3.2.B. into one metric.
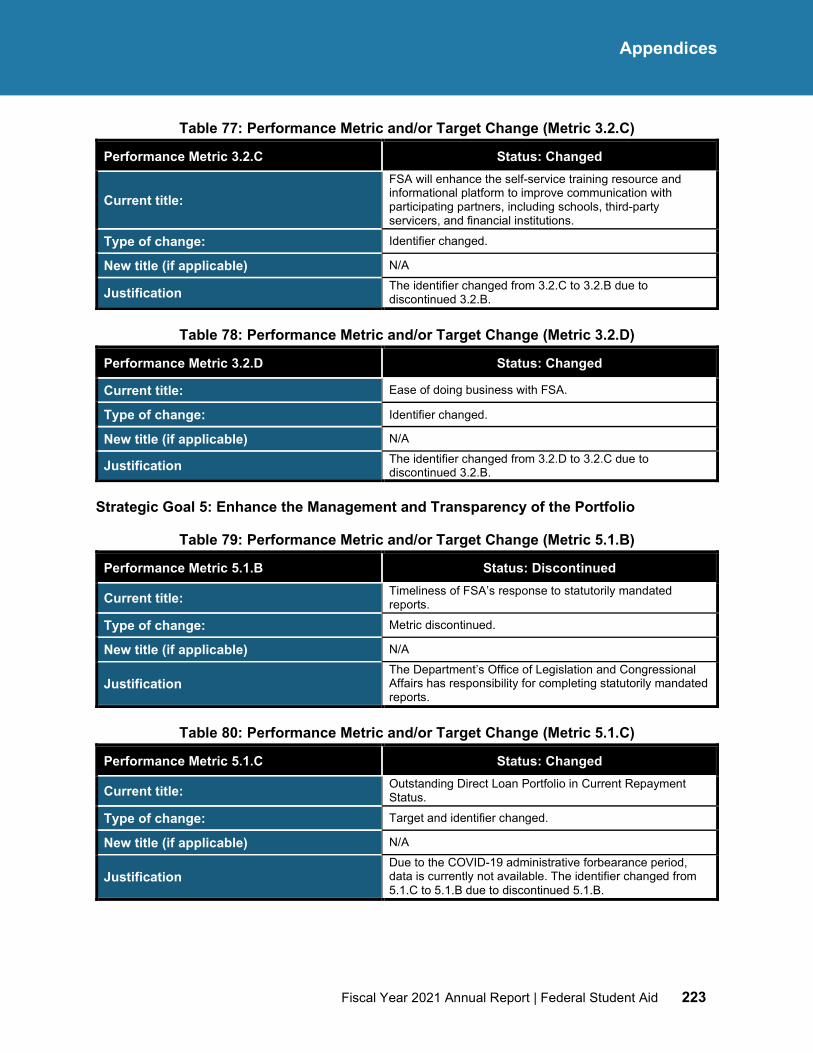
Fiscal Year 2021 Annual Report | Federal Student Aid 223
Appendices
Table 77: Performance Metric and/or Target Change (Metric 3.2.C)
Performance Metric 3.2.C Status: Changed
Current title: FSA will enhance the self-service training resource and informational platform to improve communication with participating partners, including schools, third-party servicers, and financial institutions.
Type of change: Identifier changed.
New title (if applicable) N/A
Justification The identifier changed from 3.2.C to 3.2.B due to discontinued 3.2.B.
Table 78: Performance Metric and/or Target Change (Metric 3.2.D)
Performance Metric 3.2.D Status: Changed
Current title: Ease of doing business with FSA.
Type of change: Identifier changed.
New title (if applicable) N/A
Justification The identifier changed from 3.2.D to 3.2.C due to discontinued 3.2.B.
Strategic Goal 5: Enhance the Management and Transparency of the Portfolio
Table 79: Performance Metric and/or Target Change (Metric 5.1.B)
Performance Metric 5.1.B Status: Discontinued
Current title: Timeliness of FSA’s response to statutorily mandated reports.
Type of change: Metric discontinued.
New title (if applicable) N/A
Justification The Department’s Office of Legislation and Congressional Affairs has responsibility for completing statutorily mandated reports.
Table 80: Performance Metric and/or Target Change (Metric 5.1.C)
Performance Metric 5.1.C Status: Changed
Current title: Outstanding Direct Loan Portfolio in Current Repayment Status.
Type of change: Target and identifier changed.
New title (if applicable) N/A
Justification Due to the COVID-19 administrative forbearance period, data is currently not available. The identifier changed from 5.1.C to 5.1.B due to discontinued 5.1.B.
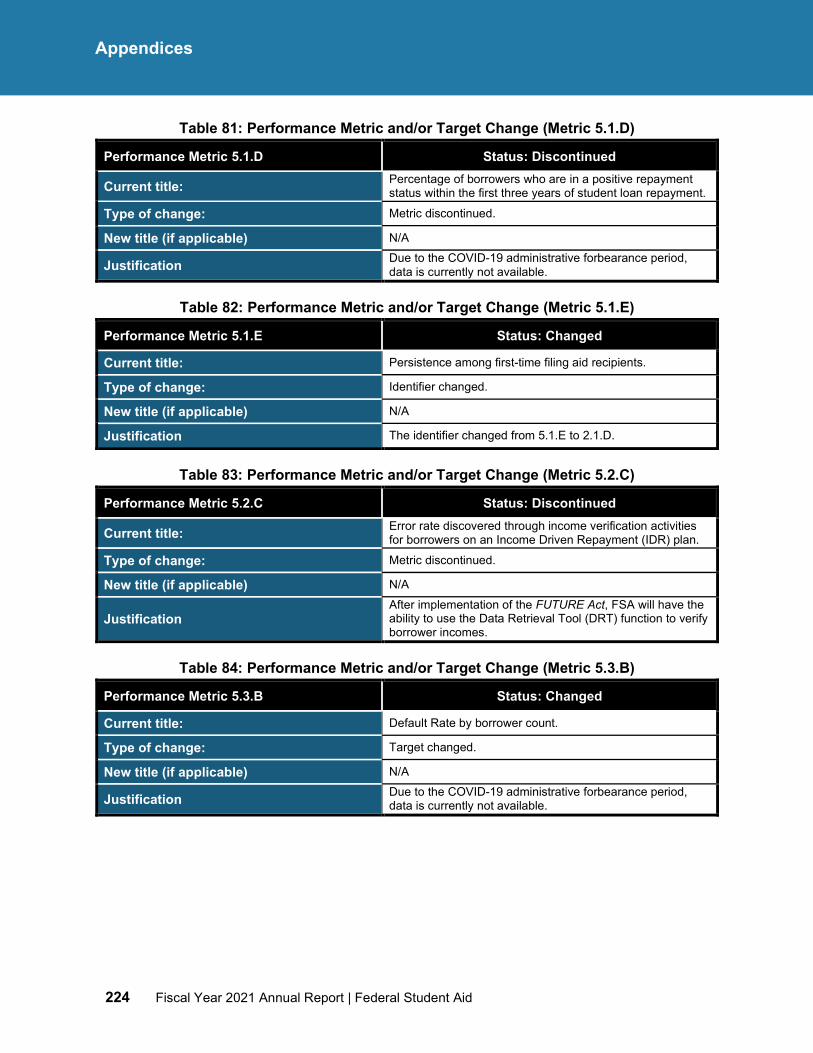
224 Fiscal Year 2021 Annual Report | Federal Student Aid
Appendices
Table 81: Performance Metric and/or Target Change (Metric 5.1.D)
Performance Metric 5.1.D Status: Discontinued
Current title: Percentage of borrowers who are in a positive repayment status within the first three years of student loan repayment.
Type of change: Metric discontinued.
New title (if applicable) N/A
Justification Due to the COVID-19 administrative forbearance period, data is currently not available.
Table 82: Performance Metric and/or Target Change (Metric 5.1.E)
Performance Metric 5.1.E Status: Changed
Current title: Persistence among first-time filing aid recipients.
Type of change: Identifier changed.
New title (if applicable) N/A
Justification The identifier changed from 5.1.E to 2.1.D.
Table 83: Performance Metric and/or Target Change (Metric 5.2.C)
Performance Metric 5.2.C Status: Discontinued
Current title: Error rate discovered through income verification activities for borrowers on an Income Driven Repayment (IDR) plan.
Type of change: Metric discontinued.
New title (if applicable) N/A
Justification After implementation of the FUTURE Act, FSA will have the ability to use the Data Retrieval Tool (DRT) function to verify borrower incomes.
Table 84: Performance Metric and/or Target Change (Metric 5.3.B)
Performance Metric 5.3.B Status: Changed
Current title: Default Rate by borrower count.
Type of change: Target changed.
New title (if applicable) N/A
Justification Due to the COVID-19 administrative forbearance period, data is currently not available.
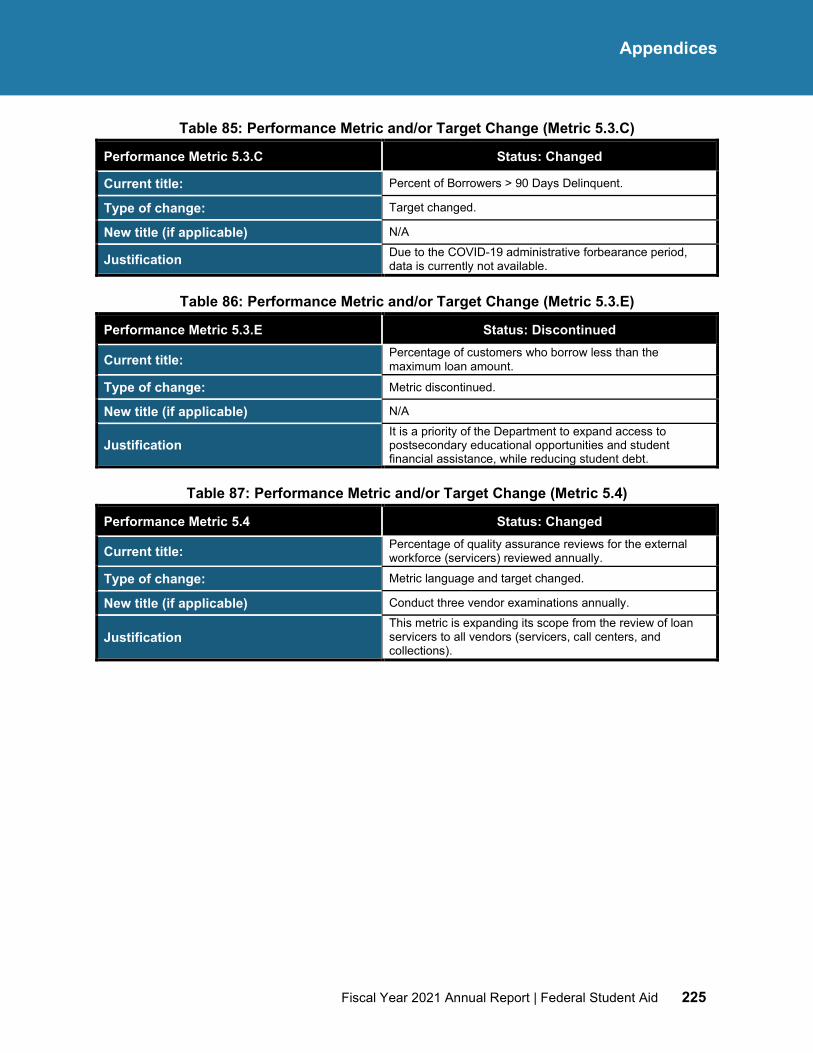
Fiscal Year 2021 Annual Report | Federal Student Aid 225
Appendices
Table 85: Performance Metric and/or Target Change (Metric 5.3.C)
Performance Metric 5.3.C Status: Changed
Current title: Percent of Borrowers > 90 Days Delinquent.
Type of change: Target changed.
New title (if applicable) N/A
Justification Due to the COVID-19 administrative forbearance period, data is currently not available.
Table 86: Performance Metric and/or Target Change (Metric 5.3.E)
Performance Metric 5.3.E Status: Discontinued
Current title: Percentage of customers who borrow less than the maximum loan amount.
Type of change: Metric discontinued.
New title (if applicable) N/A
Justification It is a priority of the Department to expand access to postsecondary educational opportunities and student financial assistance, while reducing student debt.
Table 87: Performance Metric and/or Target Change (Metric 5.4)
Performance Metric 5.4 Status: Changed
Current title: Percentage of quality assurance reviews for the external workforce (servicers) reviewed annually.
Type of change: Metric language and target changed.
New title (if applicable) Conduct three vendor examinations annually.
Justification This metric is expanding its scope from the review of loan servicers to all vendors (servicers, call centers, and collections).
226 Fiscal Year 2021 Annual Report | Federal Student Aid
Appendices
This page is intentionally left blank.
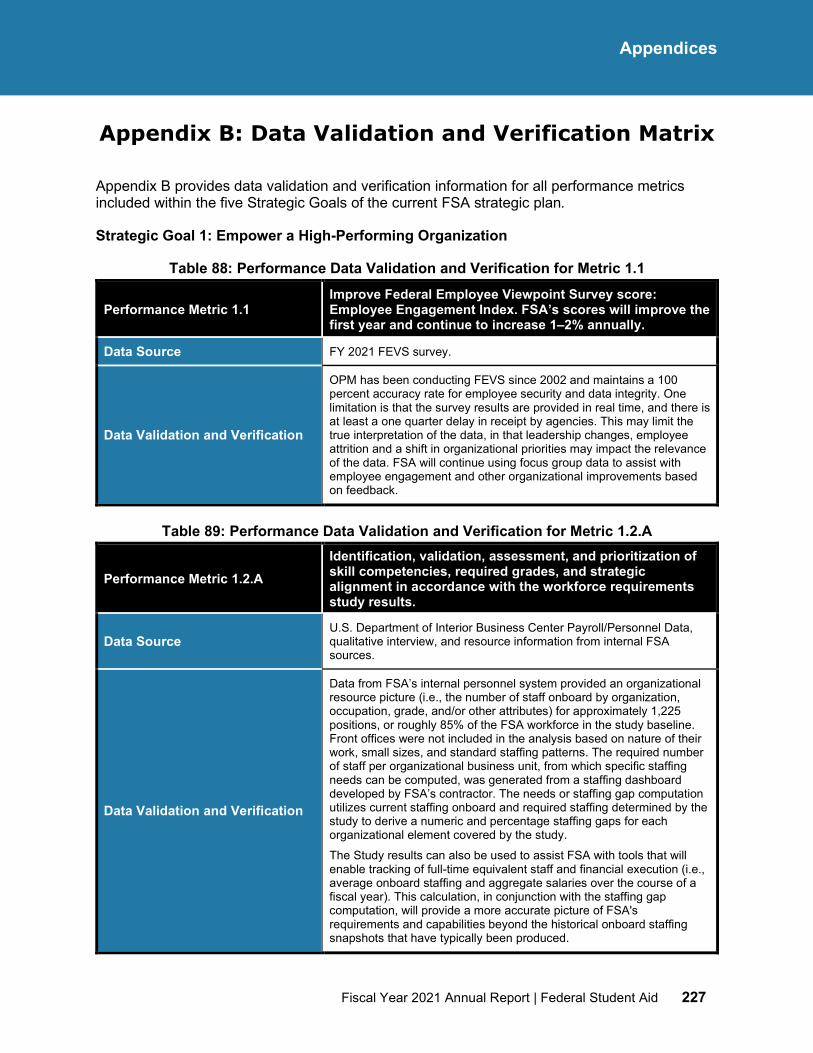
Fiscal Year 2021 Annual Report | Federal Student Aid 227
Appendices
Appendix B: Data Validation and Verification Matrix
Appendix B provides data validation and verification information for all performance metrics included within the five Strategic Goals of the current FSA strategic plan.
Strategic Goal 1: Empower a High-Performing Organization
Table 88: Performance Data Validation and Verification for Metric 1.1
Performance Metric 1.1 Improve Federal Employee Viewpoint Survey score: Employee Engagement Index. FSA’s scores will improve the first year and continue to increase 1–2% annually.
Data Source FY 2021 FEVS survey.
Data Validation and Verification
OPM has been conducting FEVS since 2002 and maintains a 100 percent accuracy rate for employee security and data integrity. One limitation is that the survey results are provided in real time, and there is at least a one quarter delay in receipt by agencies. This may limit the true interpretation of the data, in that leadership changes, employee attrition and a shift in organizational priorities may impact the relevance of the data. FSA will continue using focus group data to assist with employee engagement and other organizational improvements based on feedback.
Table 89: Performance Data Validation and Verification for Metric 1.2.A
Performance Metric 1.2.A Identification, validation, assessment, and prioritization of skill competencies, required grades, and strategic alignment in accordance with the workforce requirements study results.
Data Source U.S. Department of Interior Business Center Payroll/Personnel Data, qualitative interview, and resource information from internal FSA sources.
Data Validation and Verification
Data from FSA’s internal personnel system provided an organizational resource picture (i.e., the number of staff onboard by organization, occupation, grade, and/or other attributes) for approximately 1,225 positions, or roughly 85% of the FSA workforce in the study baseline. Front offices were not included in the analysis based on nature of their work, small sizes, and standard staffing patterns. The required number of staff per organizational business unit, from which specific staffing needs can be computed, was generated from a staffing dashboard developed by FSA’s contractor. The needs or staffing gap computation utilizes current staffing onboard and required staffing determined by the study to derive a numeric and percentage staffing gaps for each organizational element covered by the study.
The Study results can also be used to assist FSA with tools that will enable tracking of full-time equivalent staff and financial execution (i.e., average onboard staffing and aggregate salaries over the course of a fiscal year). This calculation, in conjunction with the staffing gap computation, will provide a more accurate picture of FSA's requirements and capabilities beyond the historical onboard staffing snapshots that have typically been produced.
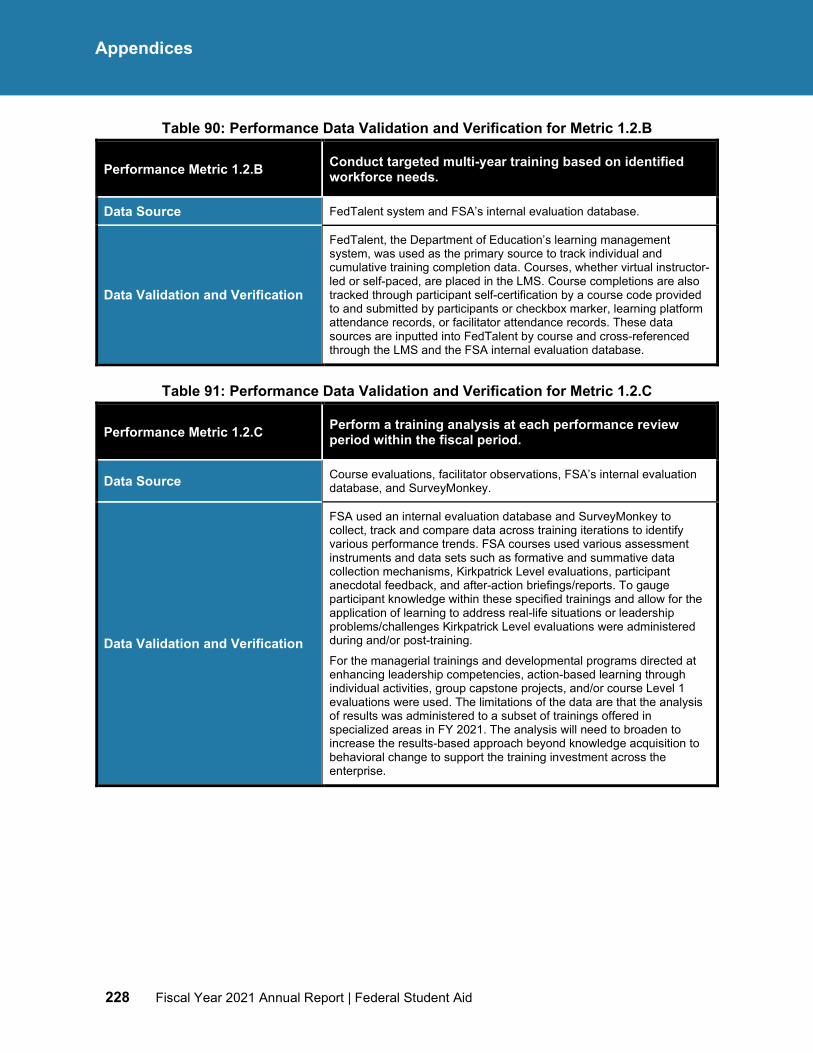
228 Fiscal Year 2021 Annual Report | Federal Student Aid
Appendices
Table 90: Performance Data Validation and Verification for Metric 1.2.B
Performance Metric 1.2.B Conduct targeted multi-year training based on identified workforce needs.
Data Source FedTalent system and FSA’s internal evaluation database.
Data Validation and Verification
FedTalent, the Department of Education’s learning management system, was used as the primary source to track individual and cumulative training completion data. Courses, whether virtual instructor-led or self-paced, are placed in the LMS. Course completions are also tracked through participant self-certification by a course code provided to and submitted by participants or checkbox marker, learning platform attendance records, or facilitator attendance records. These data sources are inputted into FedTalent by course and cross-referenced through the LMS and the FSA internal evaluation database.
Table 91: Performance Data Validation and Verification for Metric 1.2.C
Performance Metric 1.2.C Perform a training analysis at each performance review period within the fiscal period.
Data Source Course evaluations, facilitator observations, FSA’s internal evaluation database, and SurveyMonkey.
Data Validation and Verification
FSA used an internal evaluation database and SurveyMonkey to collect, track and compare data across training iterations to identify various performance trends. FSA courses used various assessment instruments and data sets such as formative and summative data collection mechanisms, Kirkpatrick Level evaluations, participant anecdotal feedback, and after-action briefings/reports. To gauge participant knowledge within these specified trainings and allow for the application of learning to address real-life situations or leadership problems/challenges Kirkpatrick Level evaluations were administered during and/or post-training.
For the managerial trainings and developmental programs directed at enhancing leadership competencies, action-based learning through individual activities, group capstone projects, and/or course Level 1 evaluations were used. The limitations of the data are that the analysis of results was administered to a subset of trainings offered in specialized areas in FY 2021. The analysis will need to broaden to increase the results-based approach beyond knowledge acquisition to behavioral change to support the training investment across the enterprise.
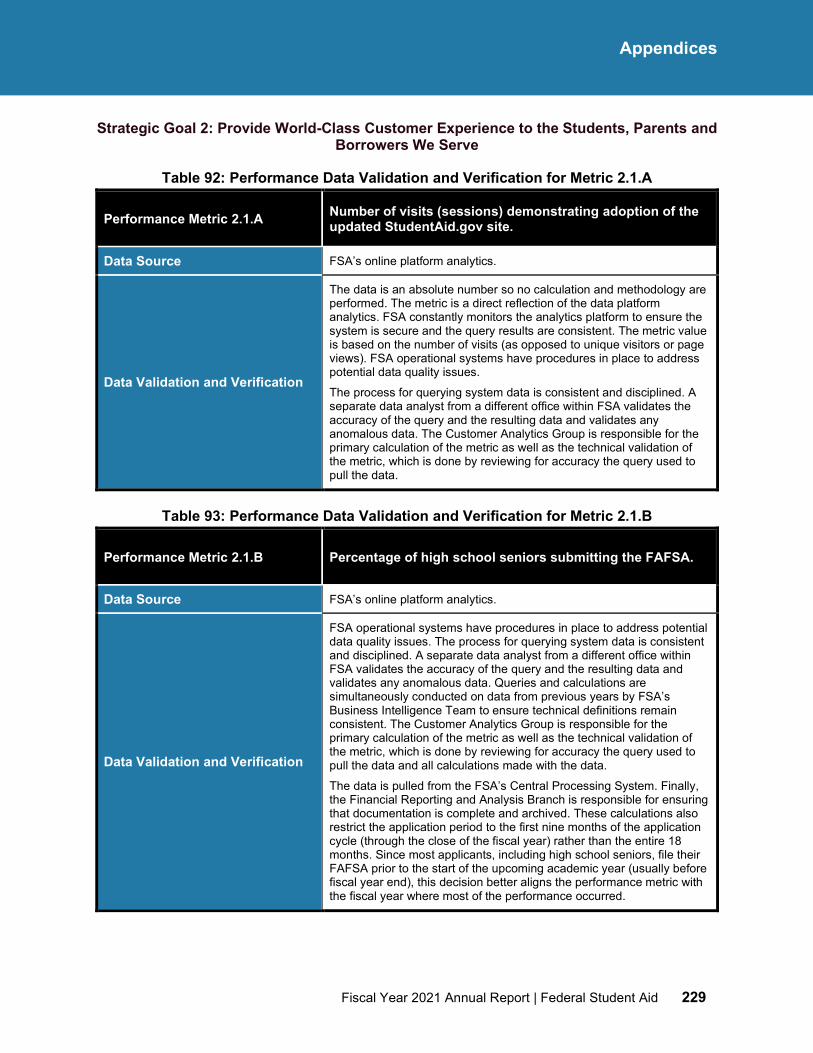
Fiscal Year 2021 Annual Report | Federal Student Aid 229
Appendices
Strategic Goal 2: Provide World-Class Customer Experience to the Students, Parents and Borrowers We Serve
Table 92: Performance Data Validation and Verification for Metric 2.1.A
Performance Metric 2.1.A Number of visits (sessions) demonstrating adoption of the updated StudentAid.gov site.
Data Source FSA’s online platform analytics.
Data Validation and Verification
The data is an absolute number so no calculation and methodology are performed. The metric is a direct reflection of the data platform analytics. FSA constantly monitors the analytics platform to ensure the system is secure and the query results are consistent. The metric value is based on the number of visits (as opposed to unique visitors or page views). FSA operational systems have procedures in place to address potential data quality issues.
The process for querying system data is consistent and disciplined. A separate data analyst from a different office within FSA validates the accuracy of the query and the resulting data and validates any anomalous data. The Customer Analytics Group is responsible for the primary calculation of the metric as well as the technical validation of the metric, which is done by reviewing for accuracy the query used to pull the data.
Table 93: Performance Data Validation and Verification for Metric 2.1.B
Performance Metric 2.1.B Percentage of high school seniors submitting the FAFSA.
Data Source FSA’s online platform analytics.
Data Validation and Verification
FSA operational systems have procedures in place to address potential data quality issues. The process for querying system data is consistent and disciplined. A separate data analyst from a different office within FSA validates the accuracy of the query and the resulting data and validates any anomalous data. Queries and calculations are simultaneously conducted on data from previous years by FSA’s Business Intelligence Team to ensure technical definitions remain consistent. The Customer Analytics Group is responsible for the primary calculation of the metric as well as the technical validation of the metric, which is done by reviewing for accuracy the query used to pull the data and all calculations made with the data.
The data is pulled from the FSA’s Central Processing System. Finally, the Financial Reporting and Analysis Branch is responsible for ensuring that documentation is complete and archived. These calculations also restrict the application period to the first nine months of the application cycle (through the close of the fiscal year) rather than the entire 18 months. Since most applicants, including high school seniors, file their FAFSA prior to the start of the upcoming academic year (usually before fiscal year end), this decision better aligns the performance metric with the fiscal year where most of the performance occurred.
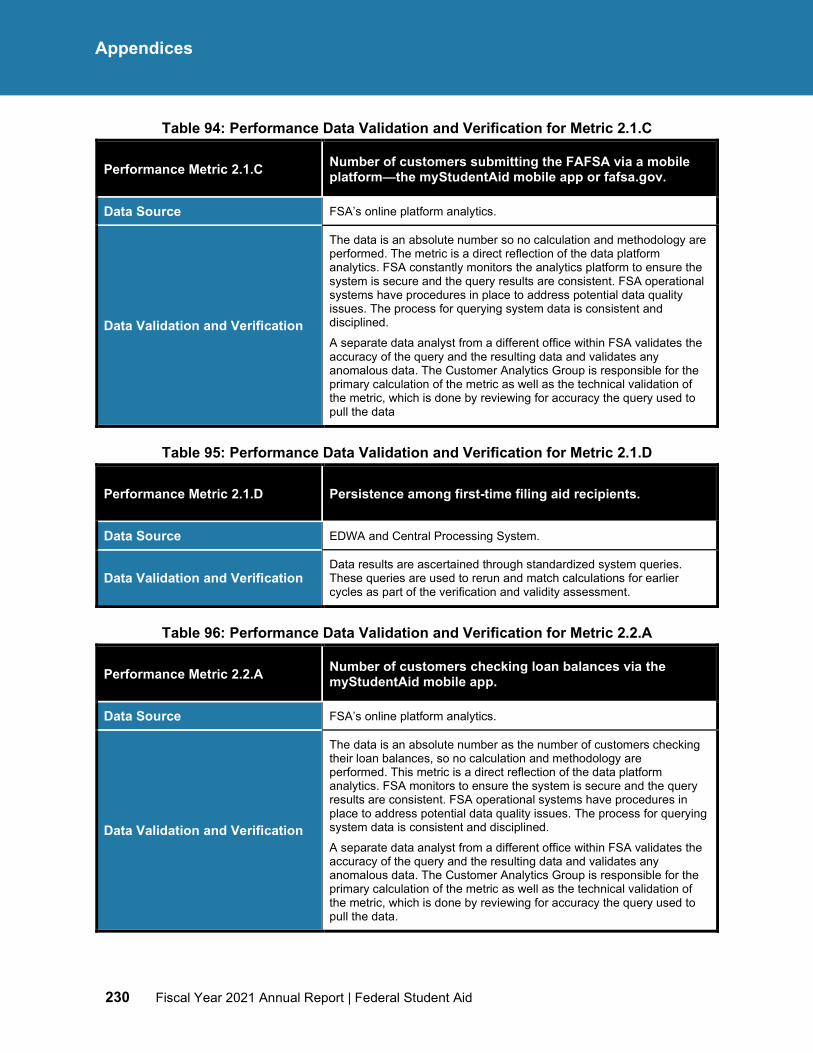
230 Fiscal Year 2021 Annual Report | Federal Student Aid
Appendices
Table 94: Performance Data Validation and Verification for Metric 2.1.C
Performance Metric 2.1.C Number of customers submitting the FAFSA via a mobile platform—the myStudentAid mobile app or fafsa.gov.
Data Source FSA’s online platform analytics.
Data Validation and Verification
The data is an absolute number so no calculation and methodology are performed. The metric is a direct reflection of the data platform analytics. FSA constantly monitors the analytics platform to ensure the system is secure and the query results are consistent. FSA operational systems have procedures in place to address potential data quality issues. The process for querying system data is consistent and disciplined.
A separate data analyst from a different office within FSA validates the accuracy of the query and the resulting data and validates any anomalous data. The Customer Analytics Group is responsible for the primary calculation of the metric as well as the technical validation of the metric, which is done by reviewing for accuracy the query used to pull the data
Table 95: Performance Data Validation and Verification for Metric 2.1.D
Performance Metric 2.1.D Persistence among first-time filing aid recipients.
Data Source EDWA and Central Processing System.
Data Validation and Verification Data results are ascertained through standardized system queries. These queries are used to rerun and match calculations for earlier cycles as part of the verification and validity assessment.
Table 96: Performance Data Validation and Verification for Metric 2.2.A
Performance Metric 2.2.A Number of customers checking loan balances via the myStudentAid mobile app.
Data Source FSA’s online platform analytics.
Data Validation and Verification
The data is an absolute number as the number of customers checking their loan balances, so no calculation and methodology are performed. This metric is a direct reflection of the data platform analytics. FSA monitors to ensure the system is secure and the query results are consistent. FSA operational systems have procedures in place to address potential data quality issues. The process for querying system data is consistent and disciplined.
A separate data analyst from a different office within FSA validates the accuracy of the query and the resulting data and validates any anomalous data. The Customer Analytics Group is responsible for the primary calculation of the metric as well as the technical validation of the metric, which is done by reviewing for accuracy the query used to pull the data.
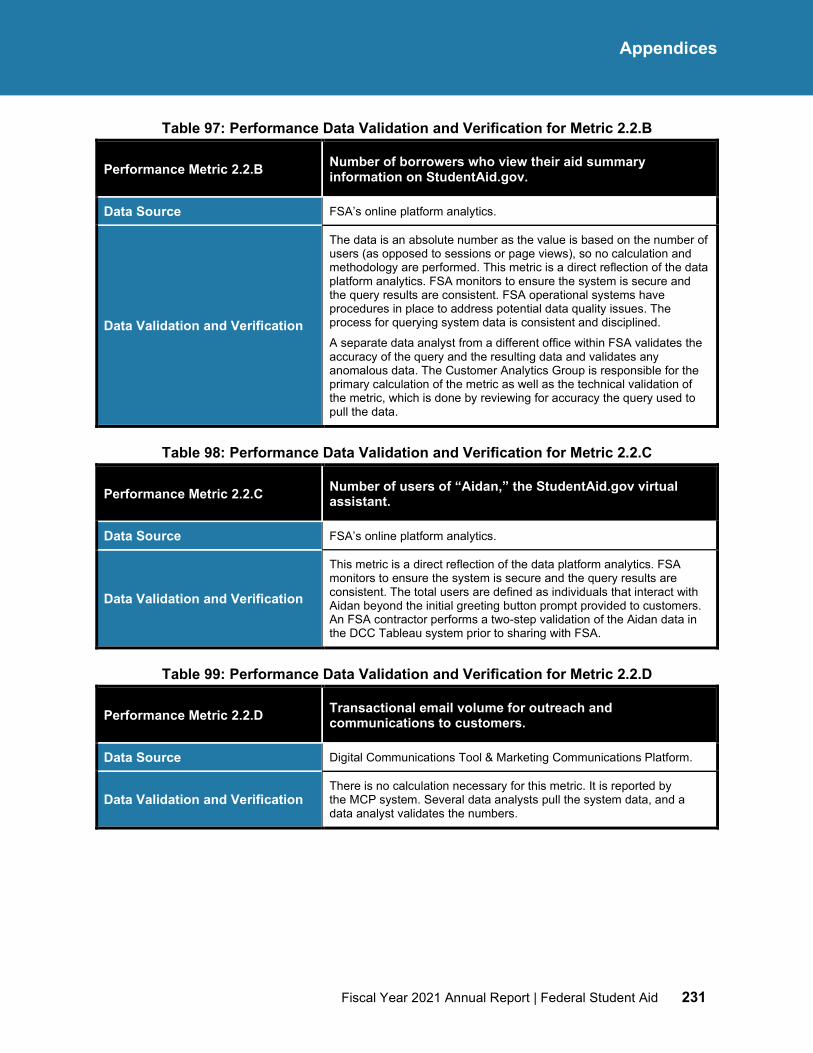
Fiscal Year 2021 Annual Report | Federal Student Aid 231
Appendices
Table 97: Performance Data Validation and Verification for Metric 2.2.B
Performance Metric 2.2.B Number of borrowers who view their aid summary information on StudentAid.gov.
Data Source FSA’s online platform analytics.
Data Validation and Verification
The data is an absolute number as the value is based on the number of users (as opposed to sessions or page views), so no calculation and methodology are performed. This metric is a direct reflection of the data platform analytics. FSA monitors to ensure the system is secure and the query results are consistent. FSA operational systems have procedures in place to address potential data quality issues. The process for querying system data is consistent and disciplined.
A separate data analyst from a different office within FSA validates the accuracy of the query and the resulting data and validates any anomalous data. The Customer Analytics Group is responsible for the primary calculation of the metric as well as the technical validation of the metric, which is done by reviewing for accuracy the query used to pull the data.
Table 98: Performance Data Validation and Verification for Metric 2.2.C
Performance Metric 2.2.C Number of users of “Aidan,” the StudentAid.gov virtual assistant.
Data Source FSA’s online platform analytics.
Data Validation and Verification
This metric is a direct reflection of the data platform analytics. FSA monitors to ensure the system is secure and the query results are consistent. The total users are defined as individuals that interact with Aidan beyond the initial greeting button prompt provided to customers. An FSA contractor performs a two-step validation of the Aidan data in the DCC Tableau system prior to sharing with FSA.
Table 99: Performance Data Validation and Verification for Metric 2.2.D
Performance Metric 2.2.D Transactional email volume for outreach and communications to customers.
Data Source Digital Communications Tool & Marketing Communications Platform.
Data Validation and Verification There is no calculation necessary for this metric. It is reported by the MCP system. Several data analysts pull the system data, and a data analyst validates the numbers.
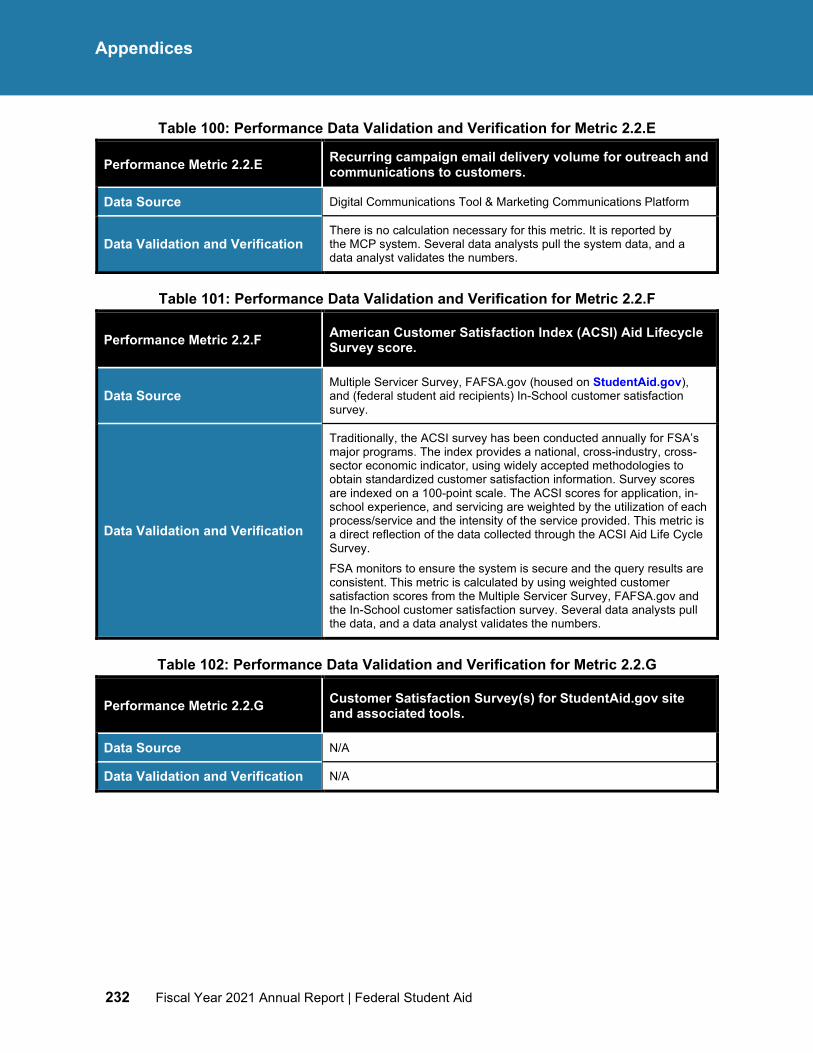
232 Fiscal Year 2021 Annual Report | Federal Student Aid
Appendices
Table 100: Performance Data Validation and Verification for Metric 2.2.E
Performance Metric 2.2.E Recurring campaign email delivery volume for outreach and communications to customers.
Data Source Digital Communications Tool & Marketing Communications Platform
Data Validation and Verification There is no calculation necessary for this metric. It is reported by the MCP system. Several data analysts pull the system data, and a data analyst validates the numbers.
Table 101: Performance Data Validation and Verification for Metric 2.2.F
Performance Metric 2.2.F American Customer Satisfaction Index (ACSI) Aid Lifecycle Survey score.
Data Source Multiple Servicer Survey, FAFSA.gov (housed on StudentAid.gov), and (federal student aid recipients) In-School customer satisfaction survey.
Data Validation and Verification
Traditionally, the ACSI survey has been conducted annually for FSA’s major programs. The index provides a national, cross-industry, cross-sector economic indicator, using widely accepted methodologies to obtain standardized customer satisfaction information. Survey scores are indexed on a 100-point scale. The ACSI scores for application, in-school experience, and servicing are weighted by the utilization of each process/service and the intensity of the service provided. This metric is a direct reflection of the data collected through the ACSI Aid Life Cycle Survey. FSA monitors to ensure the system is secure and the query results are consistent. This metric is calculated by using weighted customer satisfaction scores from the Multiple Servicer Survey, FAFSA.gov and the In-School customer satisfaction survey. Several data analysts pull the data, and a data analyst validates the numbers.
Table 102: Performance Data Validation and Verification for Metric 2.2.G
Performance Metric 2.2.G Customer Satisfaction Survey(s) for StudentAid.gov site and associated tools.
Data Source N/A
Data Validation and Verification N/A
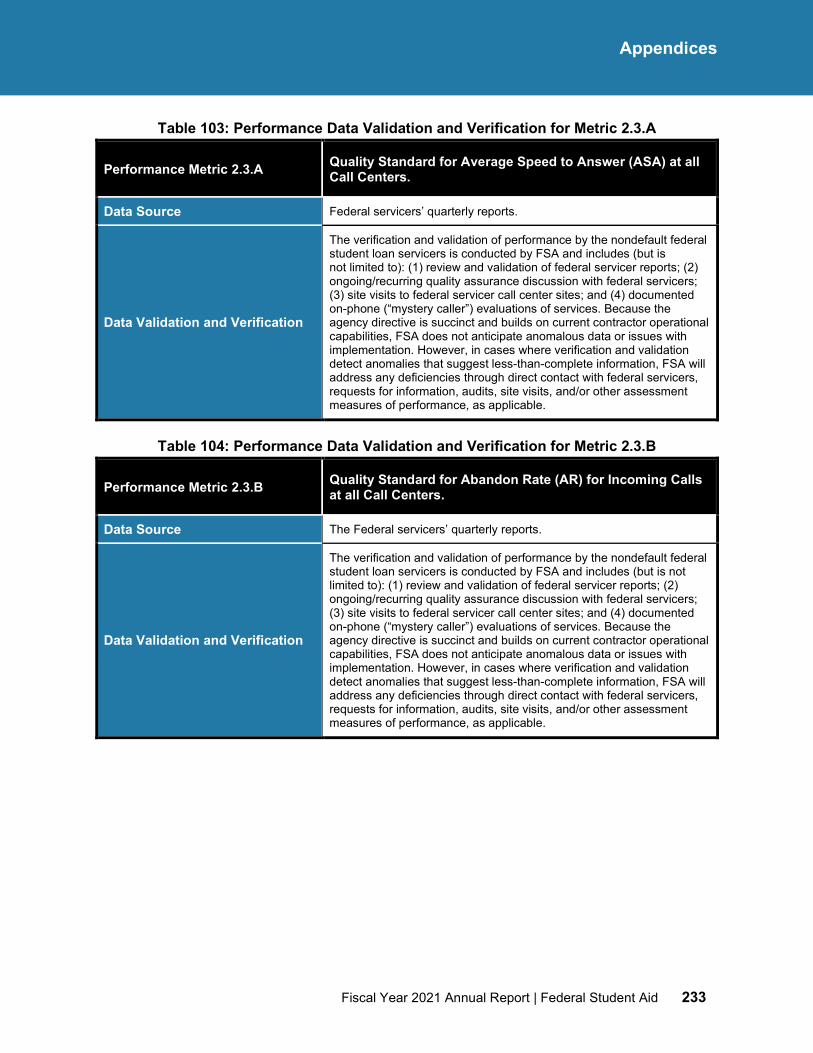
Fiscal Year 2021 Annual Report | Federal Student Aid 233
Appendices
Table 103: Performance Data Validation and Verification for Metric 2.3.A
Performance Metric 2.3.A Quality Standard for Average Speed to Answer (ASA) at all Call Centers.
Data Source Federal servicers’ quarterly reports.
Data Validation and Verification
The verification and validation of performance by the nondefault federal student loan servicers is conducted by FSA and includes (but is not limited to): (1) review and validation of federal servicer reports; (2) ongoing/recurring quality assurance discussion with federal servicers; (3) site visits to federal servicer call center sites; and (4) documented on-phone (“mystery caller”) evaluations of services. Because the agency directive is succinct and builds on current contractor operational capabilities, FSA does not anticipate anomalous data or issues with implementation. However, in cases where verification and validation detect anomalies that suggest less-than-complete information, FSA will address any deficiencies through direct contact with federal servicers, requests for information, audits, site visits, and/or other assessment measures of performance, as applicable.
Table 104: Performance Data Validation and Verification for Metric 2.3.B
Performance Metric 2.3.B Quality Standard for Abandon Rate (AR) for Incoming Calls at all Call Centers.
Data Source The Federal servicers’ quarterly reports.
Data Validation and Verification
The verification and validation of performance by the nondefault federal student loan servicers is conducted by FSA and includes (but is not limited to): (1) review and validation of federal servicer reports; (2) ongoing/recurring quality assurance discussion with federal servicers; (3) site visits to federal servicer call center sites; and (4) documented on-phone (“mystery caller”) evaluations of services. Because the agency directive is succinct and builds on current contractor operational capabilities, FSA does not anticipate anomalous data or issues with implementation. However, in cases where verification and validation detect anomalies that suggest less-than-complete information, FSA will address any deficiencies through direct contact with federal servicers, requests for information, audits, site visits, and/or other assessment measures of performance, as applicable.
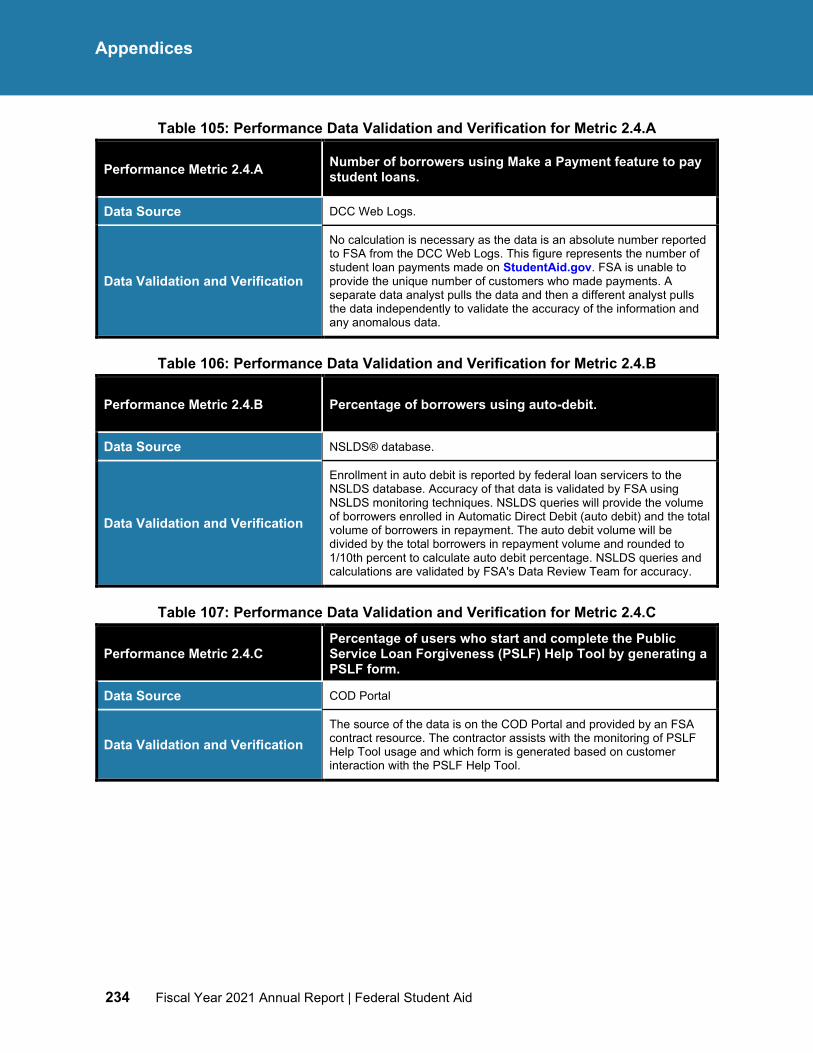
234 Fiscal Year 2021 Annual Report | Federal Student Aid
Appendices
Table 105: Performance Data Validation and Verification for Metric 2.4.A
Performance Metric 2.4.A Number of borrowers using Make a Payment feature to pay student loans.
Data Source DCC Web Logs.
Data Validation and Verification
No calculation is necessary as the data is an absolute number reported to FSA from the DCC Web Logs. This figure represents the number of student loan payments made on StudentAid.gov. FSA is unable to provide the unique number of customers who made payments. A separate data analyst pulls the data and then a different analyst pulls the data independently to validate the accuracy of the information and any anomalous data.
Table 106: Performance Data Validation and Verification for Metric 2.4.B
Performance Metric 2.4.B Percentage of borrowers using auto-debit.
Data Source NSLDS® database.
Data Validation and Verification
Enrollment in auto debit is reported by federal loan servicers to the NSLDS database. Accuracy of that data is validated by FSA using NSLDS monitoring techniques. NSLDS queries will provide the volume of borrowers enrolled in Automatic Direct Debit (auto debit) and the total volume of borrowers in repayment. The auto debit volume will be divided by the total borrowers in repayment volume and rounded to 1/10th percent to calculate auto debit percentage. NSLDS queries and calculations are validated by FSA's Data Review Team for accuracy.
Table 107: Performance Data Validation and Verification for Metric 2.4.C
Performance Metric 2.4.C Percentage of users who start and complete the Public Service Loan Forgiveness (PSLF) Help Tool by generating a PSLF form.
Data Source COD Portal
Data Validation and Verification The source of the data is on the COD Portal and provided by an FSA contract resource. The contractor assists with the monitoring of PSLF Help Tool usage and which form is generated based on customer interaction with the PSLF Help Tool.
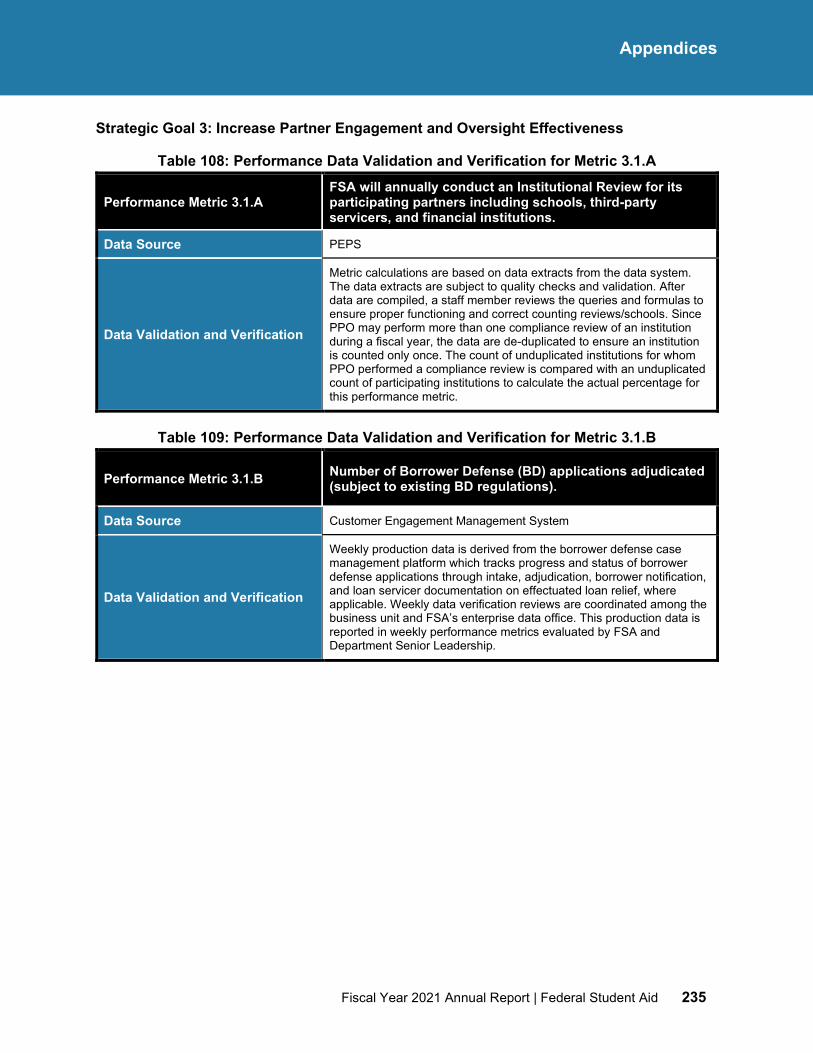
Fiscal Year 2021 Annual Report | Federal Student Aid 235
Appendices
Strategic Goal 3: Increase Partner Engagement and Oversight Effectiveness
Table 108: Performance Data Validation and Verification for Metric 3.1.A
Performance Metric 3.1.A FSA will annually conduct an Institutional Review for its participating partners including schools, third-party servicers, and financial institutions.
Data Source PEPS
Data Validation and Verification
Metric calculations are based on data extracts from the data system. The data extracts are subject to quality checks and validation. After data are compiled, a staff member reviews the queries and formulas to ensure proper functioning and correct counting reviews/schools. Since PPO may perform more than one compliance review of an institution during a fiscal year, the data are de-duplicated to ensure an institution is counted only once. The count of unduplicated institutions for whom PPO performed a compliance review is compared with an unduplicated count of participating institutions to calculate the actual percentage for this performance metric.
Table 109: Performance Data Validation and Verification for Metric 3.1.B
Performance Metric 3.1.B Number of Borrower Defense (BD) applications adjudicated (subject to existing BD regulations).
Data Source Customer Engagement Management System
Data Validation and Verification
Weekly production data is derived from the borrower defense case management platform which tracks progress and status of borrower defense applications through intake, adjudication, borrower notification, and loan servicer documentation on effectuated loan relief, where applicable. Weekly data verification reviews are coordinated among the business unit and FSA’s enterprise data office. This production data is reported in weekly performance metrics evaluated by FSA and Department Senior Leadership.
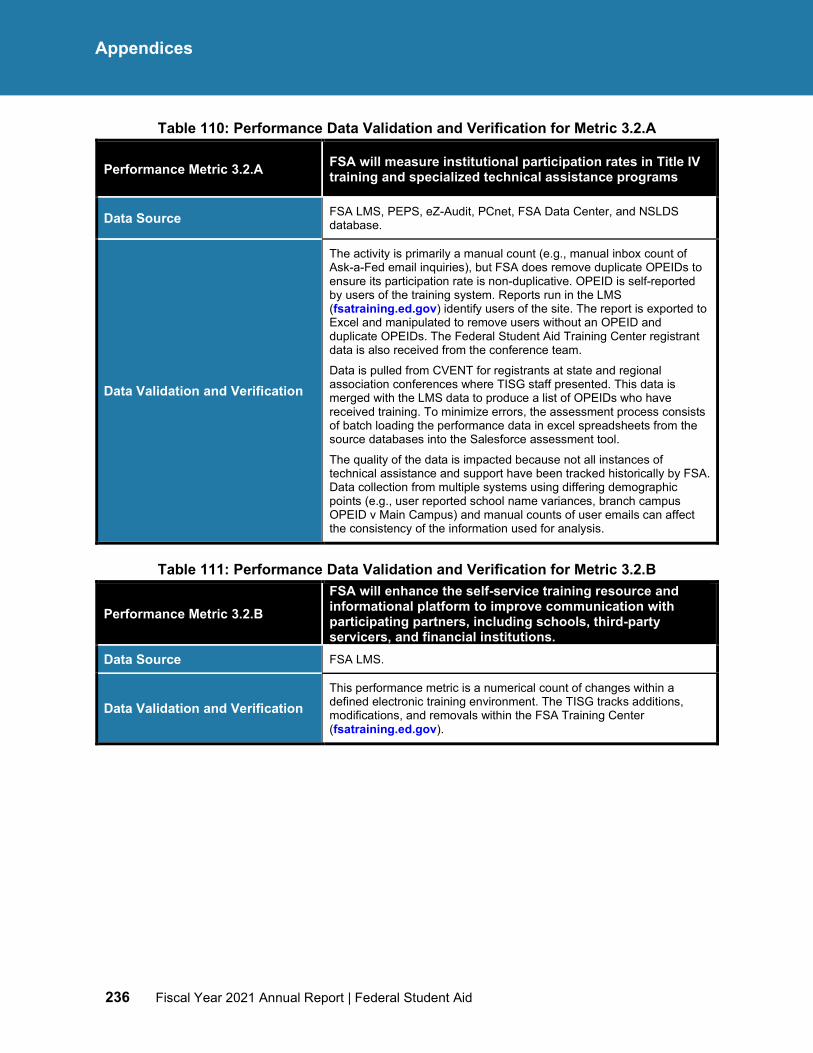
236 Fiscal Year 2021 Annual Report | Federal Student Aid
Appendices
Table 110: Performance Data Validation and Verification for Metric 3.2.A
Performance Metric 3.2.A FSA will measure institutional participation rates in Title IV training and specialized technical assistance programs
Data Source FSA LMS, PEPS, eZ-Audit, PCnet, FSA Data Center, and NSLDS database.
Data Validation and Verification
The activity is primarily a manual count (e.g., manual inbox count of Ask-a-Fed email inquiries), but FSA does remove duplicate OPEIDs to ensure its participation rate is non-duplicative. OPEID is self-reported by users of the training system. Reports run in the LMS (fsatraining.ed.gov) identify users of the site. The report is exported to Excel and manipulated to remove users without an OPEID and duplicate OPEIDs. The Federal Student Aid Training Center registrant data is also received from the conference team.
Data is pulled from CVENT for registrants at state and regional association conferences where TISG staff presented. This data is merged with the LMS data to produce a list of OPEIDs who have received training. To minimize errors, the assessment process consists of batch loading the performance data in excel spreadsheets from the source databases into the Salesforce assessment tool.
The quality of the data is impacted because not all instances of technical assistance and support have been tracked historically by FSA. Data collection from multiple systems using differing demographic points (e.g., user reported school name variances, branch campus OPEID v Main Campus) and manual counts of user emails can affect the consistency of the information used for analysis.
Table 111: Performance Data Validation and Verification for Metric 3.2.B
Performance Metric 3.2.B FSA will enhance the self-service training resource and informational platform to improve communication with participating partners, including schools, third-party servicers, and financial institutions.
Data Source FSA LMS.
Data Validation and Verification This performance metric is a numerical count of changes within a defined electronic training environment. The TISG tracks additions, modifications, and removals within the FSA Training Center (fsatraining.ed.gov).
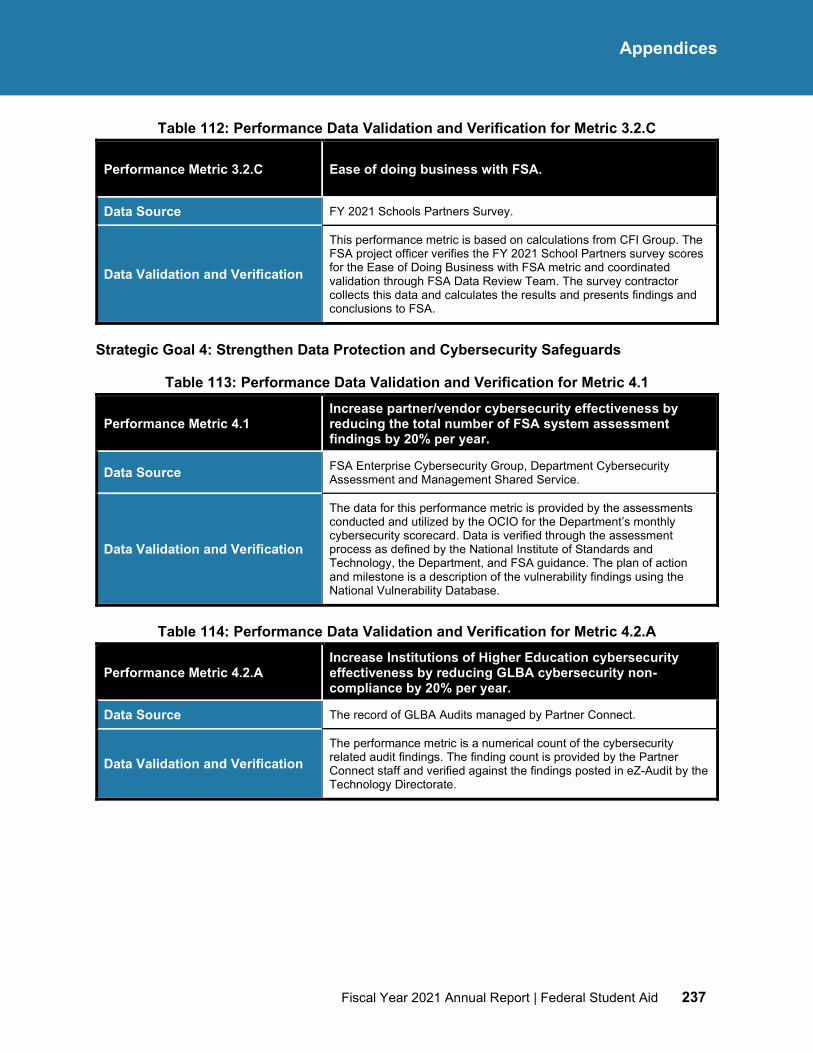
Fiscal Year 2021 Annual Report | Federal Student Aid 237
Appendices
Table 112: Performance Data Validation and Verification for Metric 3.2.C
Performance Metric 3.2.C Ease of doing business with FSA.
Data Source FY 2021 Schools Partners Survey.
Data Validation and Verification
This performance metric is based on calculations from CFI Group. The FSA project officer verifies the FY 2021 School Partners survey scores for the Ease of Doing Business with FSA metric and coordinated validation through FSA Data Review Team. The survey contractor collects this data and calculates the results and presents findings and conclusions to FSA.
Strategic Goal 4: Strengthen Data Protection and Cybersecurity Safeguards
Table 113: Performance Data Validation and Verification for Metric 4.1
Performance Metric 4.1 Increase partner/vendor cybersecurity effectiveness by reducing the total number of FSA system assessment findings by 20% per year.
Data Source FSA Enterprise Cybersecurity Group, Department Cybersecurity Assessment and Management Shared Service.
Data Validation and Verification
The data for this performance metric is provided by the assessments conducted and utilized by the OCIO for the Department’s monthly cybersecurity scorecard. Data is verified through the assessment process as defined by the National Institute of Standards and Technology, the Department, and FSA guidance. The plan of action and milestone is a description of the vulnerability findings using the National Vulnerability Database.
Table 114: Performance Data Validation and Verification for Metric 4.2.A
Performance Metric 4.2.A Increase Institutions of Higher Education cybersecurity effectiveness by reducing GLBA cybersecurity non-compliance by 20% per year.
Data Source The record of GLBA Audits managed by Partner Connect.
Data Validation and Verification The performance metric is a numerical count of the cybersecurity related audit findings. The finding count is provided by the Partner Connect staff and verified against the findings posted in eZ-Audit by the Technology Directorate.
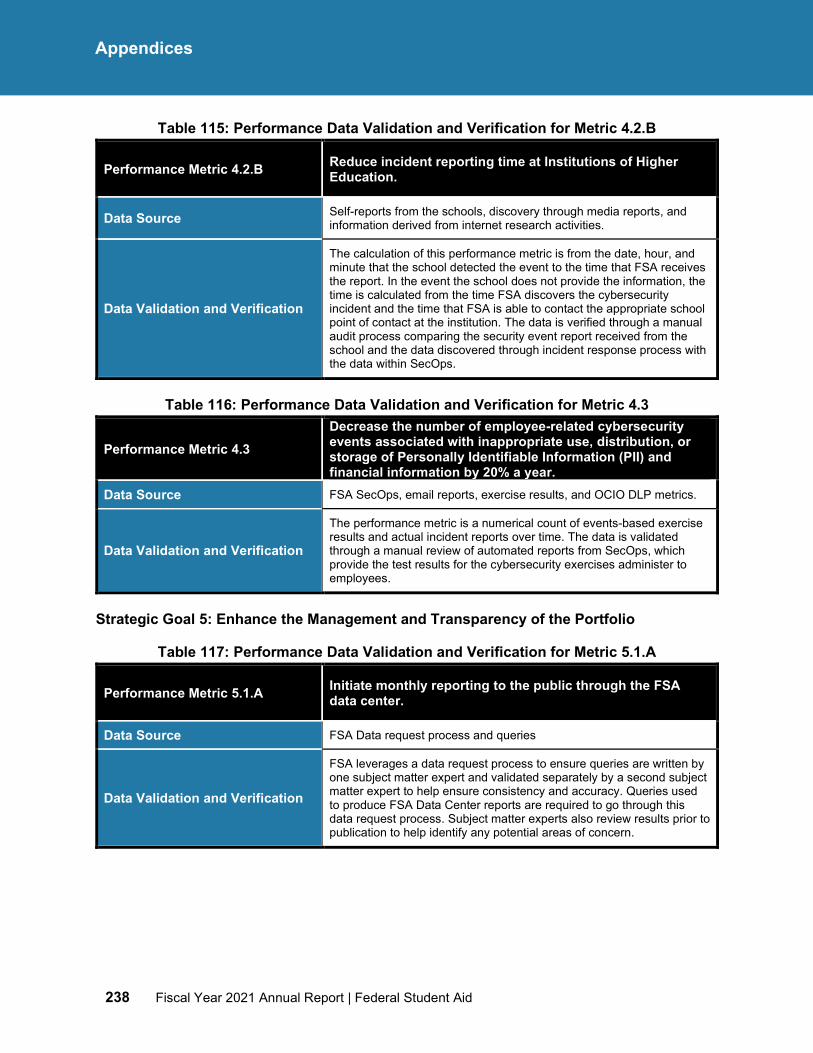
238 Fiscal Year 2021 Annual Report | Federal Student Aid
Appendices
Table 115: Performance Data Validation and Verification for Metric 4.2.B
Performance Metric 4.2.B Reduce incident reporting time at Institutions of Higher Education.
Data Source Self-reports from the schools, discovery through media reports, and information derived from internet research activities.
Data Validation and Verification
The calculation of this performance metric is from the date, hour, and minute that the school detected the event to the time that FSA receives the report. In the event the school does not provide the information, the time is calculated from the time FSA discovers the cybersecurity incident and the time that FSA is able to contact the appropriate school point of contact at the institution. The data is verified through a manual audit process comparing the security event report received from the school and the data discovered through incident response process with the data within SecOps.
Table 116: Performance Data Validation and Verification for Metric 4.3
Performance Metric 4.3 Decrease the number of employee-related cybersecurity events associated with inappropriate use, distribution, or storage of Personally Identifiable Information (PII) and financial information by 20% a year.
Data Source FSA SecOps, email reports, exercise results, and OCIO DLP metrics.
Data Validation and Verification
The performance metric is a numerical count of events-based exercise results and actual incident reports over time. The data is validated through a manual review of automated reports from SecOps, which provide the test results for the cybersecurity exercises administer to employees.
Strategic Goal 5: Enhance the Management and Transparency of the Portfolio
Table 117: Performance Data Validation and Verification for Metric 5.1.A
Performance Metric 5.1.A Initiate monthly reporting to the public through the FSA data center.
Data Source FSA Data request process and queries
Data Validation and Verification
FSA leverages a data request process to ensure queries are written by one subject matter expert and validated separately by a second subject matter expert to help ensure consistency and accuracy. Queries used to produce FSA Data Center reports are required to go through this data request process. Subject matter experts also review results prior to publication to help identify any potential areas of concern.
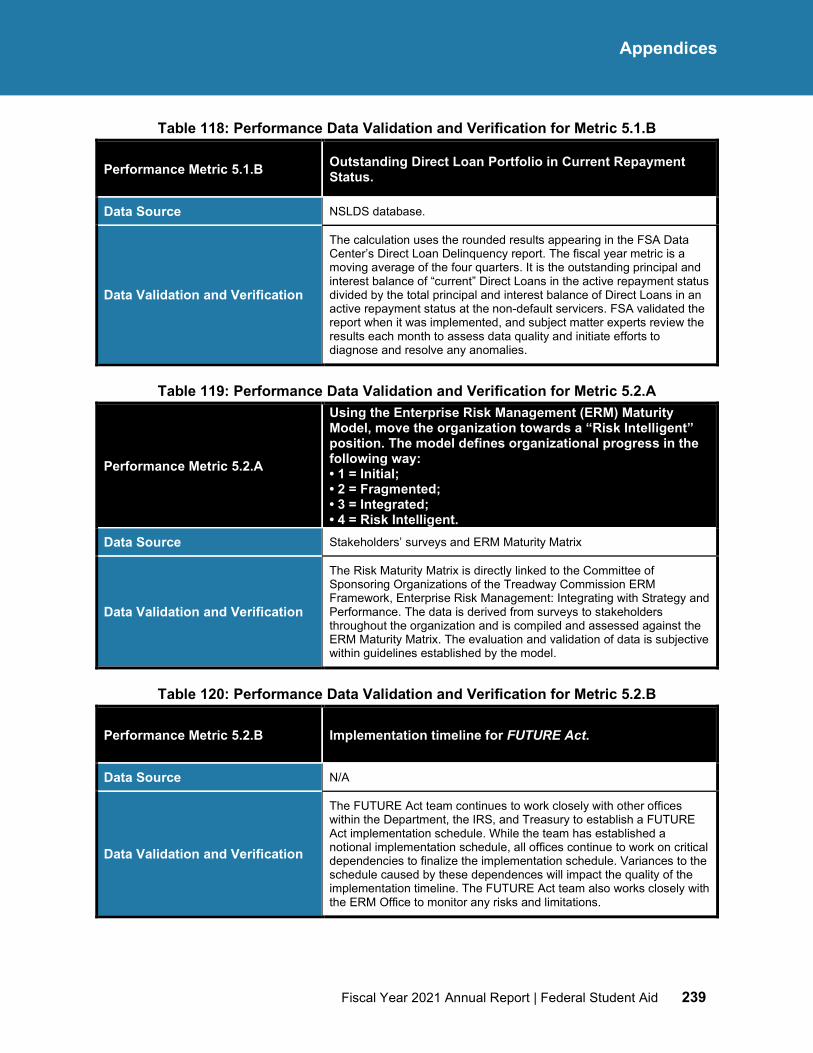
Fiscal Year 2021 Annual Report | Federal Student Aid 239
Appendices
Table 118: Performance Data Validation and Verification for Metric 5.1.B
Performance Metric 5.1.B Outstanding Direct Loan Portfolio in Current Repayment Status.
Data Source NSLDS database.
Data Validation and Verification
The calculation uses the rounded results appearing in the FSA Data Center’s Direct Loan Delinquency report. The fiscal year metric is a moving average of the four quarters. It is the outstanding principal and interest balance of “current” Direct Loans in the active repayment status divided by the total principal and interest balance of Direct Loans in an active repayment status at the non-default servicers. FSA validated the report when it was implemented, and subject matter experts review the results each month to assess data quality and initiate efforts to diagnose and resolve any anomalies.
Table 119: Performance Data Validation and Verification for Metric 5.2.A
Performance Metric 5.2.A
Using the Enterprise Risk Management (ERM) Maturity Model, move the organization towards a “Risk Intelligent” position. The model defines organizational progress in the following way: • 1 = Initial; • 2 = Fragmented; • 3 = Integrated; • 4 = Risk Intelligent.
Data Source Stakeholders’ surveys and ERM Maturity Matrix
Data Validation and Verification
The Risk Maturity Matrix is directly linked to the Committee of Sponsoring Organizations of the Treadway Commission ERM Framework, Enterprise Risk Management: Integrating with Strategy and Performance. The data is derived from surveys to stakeholders throughout the organization and is compiled and assessed against the ERM Maturity Matrix. The evaluation and validation of data is subjective within guidelines established by the model.
Table 120: Performance Data Validation and Verification for Metric 5.2.B
Performance Metric 5.2.B Implementation timeline for FUTURE Act.
Data Source N/A
Data Validation and Verification
The FUTURE Act team continues to work closely with other offices within the Department, the IRS, and Treasury to establish a FUTURE Act implementation schedule. While the team has established a notional implementation schedule, all offices continue to work on critical dependencies to finalize the implementation schedule. Variances to the schedule caused by these dependences will impact the quality of the implementation timeline. The FUTURE Act team also works closely with the ERM Office to monitor any risks and limitations.
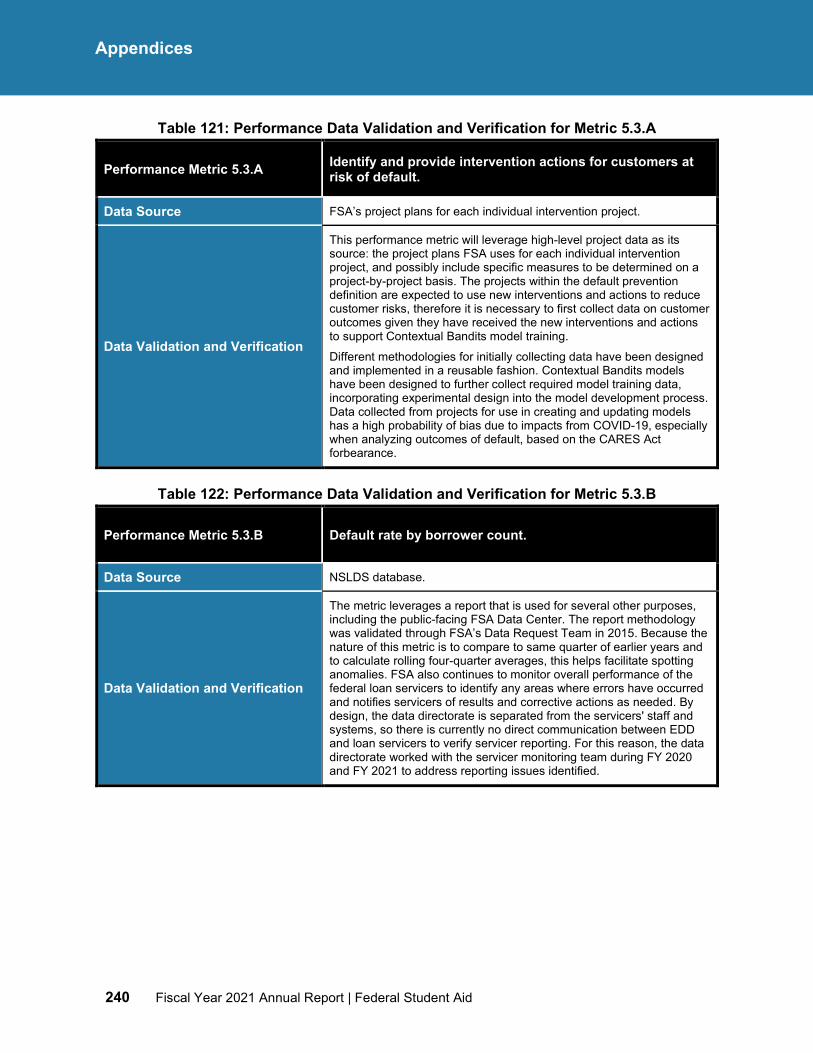
240 Fiscal Year 2021 Annual Report | Federal Student Aid
Appendices
Table 121: Performance Data Validation and Verification for Metric 5.3.A
Performance Metric 5.3.A Identify and provide intervention actions for customers at risk of default.
Data Source FSA’s project plans for each individual intervention project.
Data Validation and Verification
This performance metric will leverage high-level project data as its source: the project plans FSA uses for each individual intervention project, and possibly include specific measures to be determined on a project-by-project basis. The projects within the default prevention definition are expected to use new interventions and actions to reduce customer risks, therefore it is necessary to first collect data on customer outcomes given they have received the new interventions and actions to support Contextual Bandits model training.
Different methodologies for initially collecting data have been designed and implemented in a reusable fashion. Contextual Bandits models have been designed to further collect required model training data, incorporating experimental design into the model development process. Data collected from projects for use in creating and updating models has a high probability of bias due to impacts from COVID-19, especially when analyzing outcomes of default, based on the CARES Act forbearance.
Table 122: Performance Data Validation and Verification for Metric 5.3.B
Performance Metric 5.3.B Default rate by borrower count.
Data Source NSLDS database.
Data Validation and Verification
The metric leverages a report that is used for several other purposes, including the public-facing FSA Data Center. The report methodology was validated through FSA’s Data Request Team in 2015. Because the nature of this metric is to compare to same quarter of earlier years and to calculate rolling four-quarter averages, this helps facilitate spotting anomalies. FSA also continues to monitor overall performance of the federal loan servicers to identify any areas where errors have occurred and notifies servicers of results and corrective actions as needed. By design, the data directorate is separated from the servicers' staff and systems, so there is currently no direct communication between EDD and loan servicers to verify servicer reporting. For this reason, the data directorate worked with the servicer monitoring team during FY 2020 and FY 2021 to address reporting issues identified.
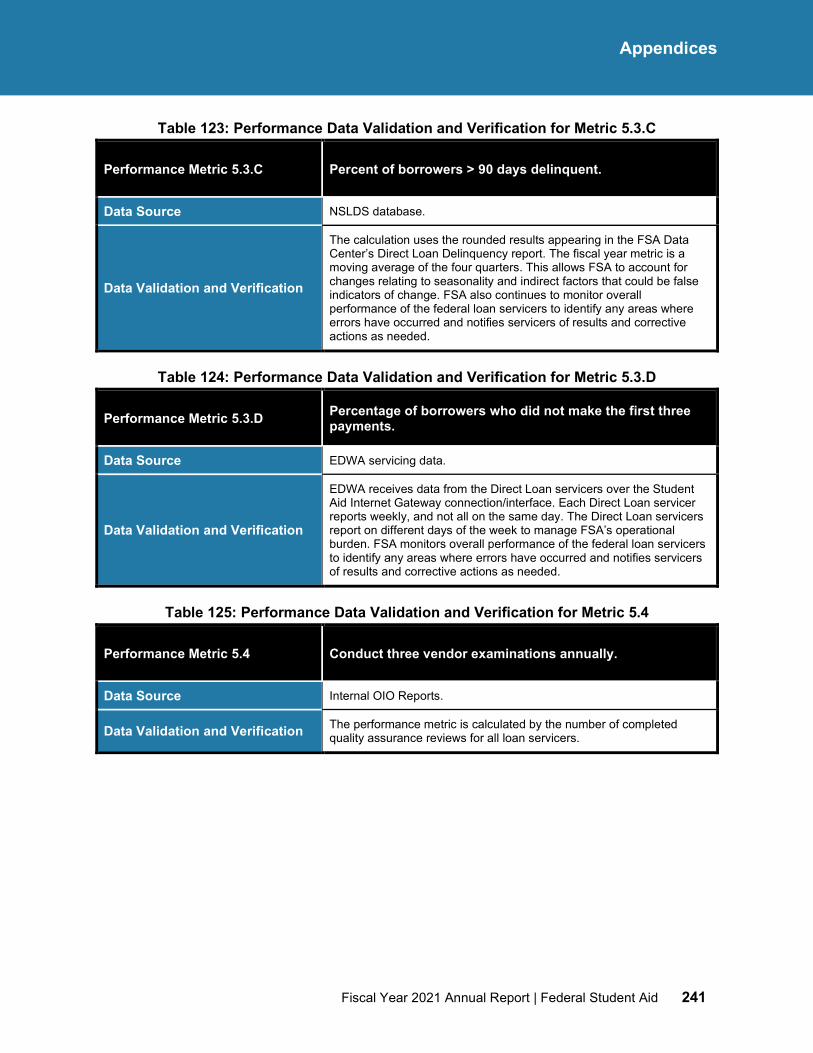
Fiscal Year 2021 Annual Report | Federal Student Aid 241
Appendices
Table 123: Performance Data Validation and Verification for Metric 5.3.C
Performance Metric 5.3.C Percent of borrowers > 90 days delinquent.
Data Source NSLDS database.
Data Validation and Verification
The calculation uses the rounded results appearing in the FSA Data Center’s Direct Loan Delinquency report. The fiscal year metric is a moving average of the four quarters. This allows FSA to account for changes relating to seasonality and indirect factors that could be false indicators of change. FSA also continues to monitor overall performance of the federal loan servicers to identify any areas where errors have occurred and notifies servicers of results and corrective actions as needed.
Table 124: Performance Data Validation and Verification for Metric 5.3.D
Performance Metric 5.3.D Percentage of borrowers who did not make the first three payments.
Data Source EDWA servicing data.
Data Validation and Verification
EDWA receives data from the Direct Loan servicers over the Student Aid Internet Gateway connection/interface. Each Direct Loan servicer reports weekly, and not all on the same day. The Direct Loan servicers report on different days of the week to manage FSA’s operational burden. FSA monitors overall performance of the federal loan servicers to identify any areas where errors have occurred and notifies servicers of results and corrective actions as needed.
Table 125: Performance Data Validation and Verification for Metric 5.4
Performance Metric 5.4 Conduct three vendor examinations annually.
Data Source Internal OIO Reports.
Data Validation and Verification The performance metric is calculated by the number of completed quality assurance reviews for all loan servicers.
242 Fiscal Year 2021 Annual Report | Federal Student Aid
Appendices
This page is intentionally left blank
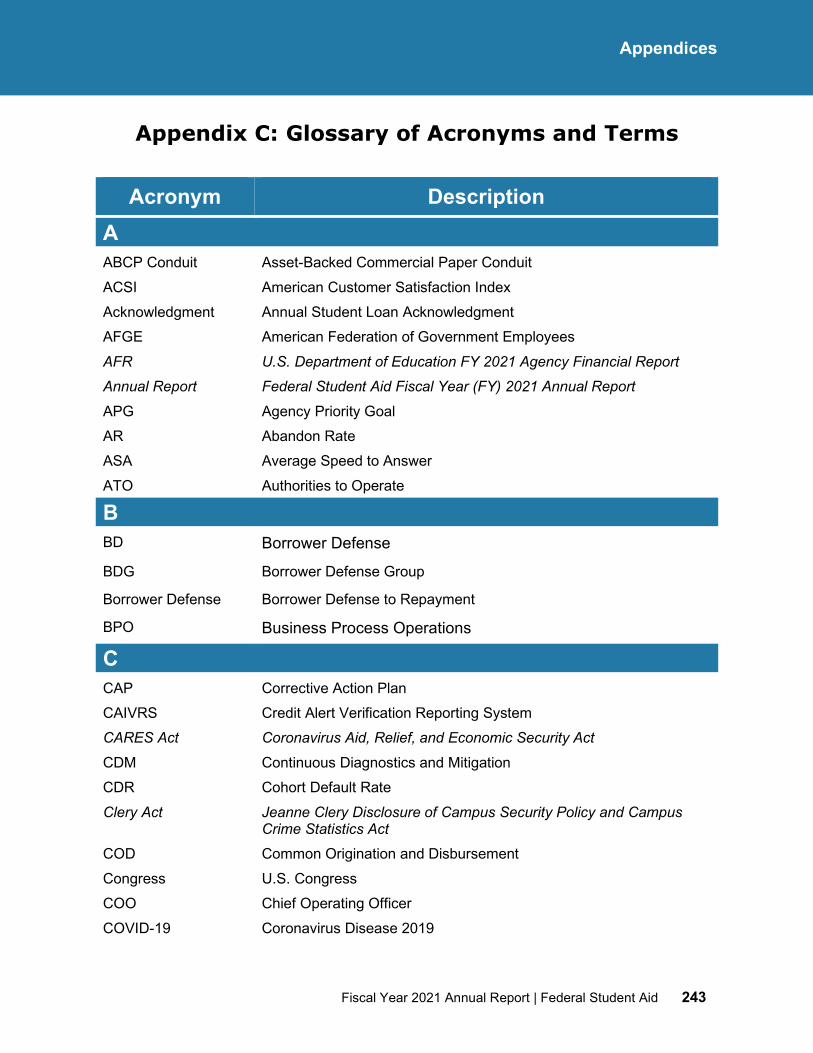
Fiscal Year 2021 Annual Report | Federal Student Aid 243
Appendices
Appendix C: Glossary of Acronyms and Terms
Acronym Description A ABCP Conduit Asset-Backed Commercial Paper Conduit ACSI American Customer Satisfaction Index Acknowledgment Annual Student Loan Acknowledgment AFGE American Federation of Government Employees AFR U.S. Department of Education FY 2021 Agency Financial Report
Annual Report Federal Student Aid Fiscal Year (FY) 2021 Annual Report APG Agency Priority Goal AR Abandon Rate ASA Average Speed to Answer ATO Authorities to Operate
B BD Borrower Defense
BDG Borrower Defense Group
Borrower Defense Borrower Defense to Repayment
BPO Business Process Operations
C
CAP Corrective Action Plan CAIVRS Credit Alert Verification Reporting System
CARES Act Coronavirus Aid, Relief, and Economic Security Act
CDM Continuous Diagnostics and Mitigation CDR Cohort Default Rate Clery Act Jeanne Clery Disclosure of Campus Security Policy and Campus
Crime Statistics Act COD Common Origination and Disbursement Congress U.S. Congress COO Chief Operating Officer COVID-19 Coronavirus Disease 2019
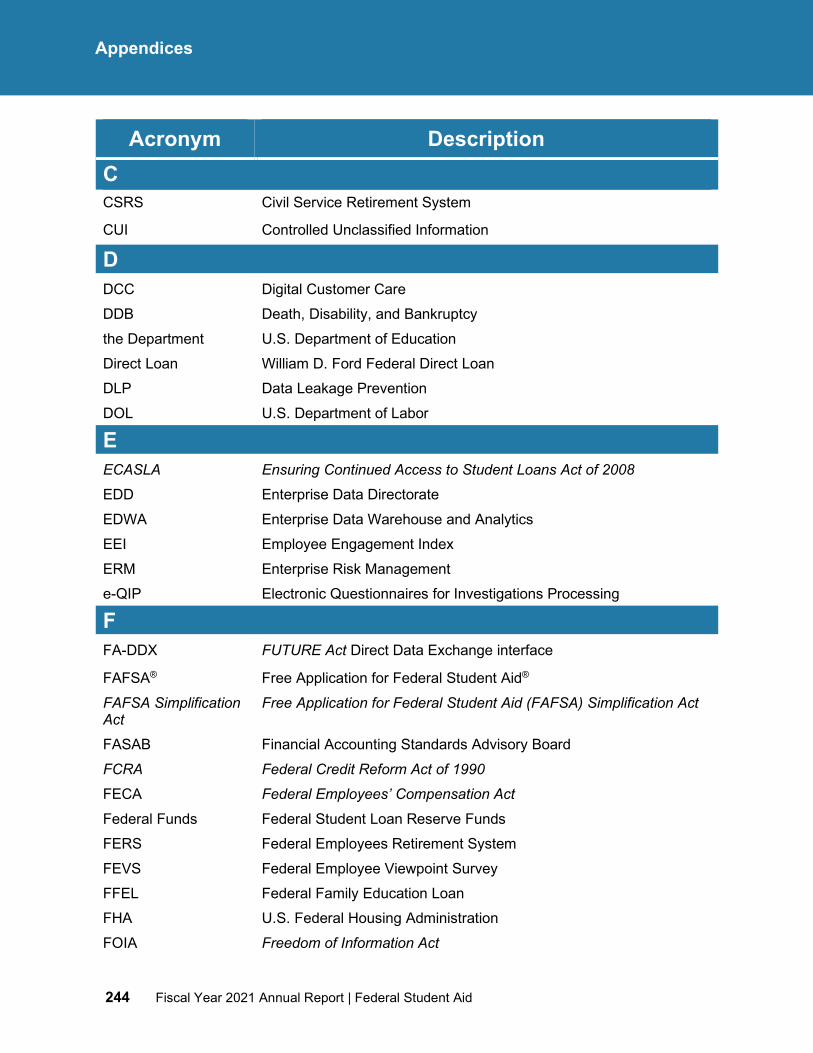
244 Fiscal Year 2021 Annual Report | Federal Student Aid
Appendices
Acronym Description C
CSRS Civil Service Retirement System
CUI Controlled Unclassified Information
D
DCC Digital Customer Care DDB Death, Disability, and Bankruptcy the Department U.S. Department of Education Direct Loan William D. Ford Federal Direct Loan DLP Data Leakage Prevention DOL U.S. Department of Labor
E
ECASLA Ensuring Continued Access to Student Loans Act of 2008
EDD Enterprise Data Directorate EDWA Enterprise Data Warehouse and Analytics EEI Employee Engagement Index ERM Enterprise Risk Management e-QIP Electronic Questionnaires for Investigations Processing
F
FA-DDX FUTURE Act Direct Data Exchange interface
FAFSA® Free Application for Federal Student Aid® FAFSA Simplification Act
Free Application for Federal Student Aid (FAFSA) Simplification Act
FASAB Financial Accounting Standards Advisory Board FCRA Federal Credit Reform Act of 1990
FECA Federal Employees’ Compensation Act Federal Funds Federal Student Loan Reserve Funds FERS Federal Employees Retirement System FEVS Federal Employee Viewpoint Survey FFEL Federal Family Education Loan FHA U.S. Federal Housing Administration FOIA Freedom of Information Act
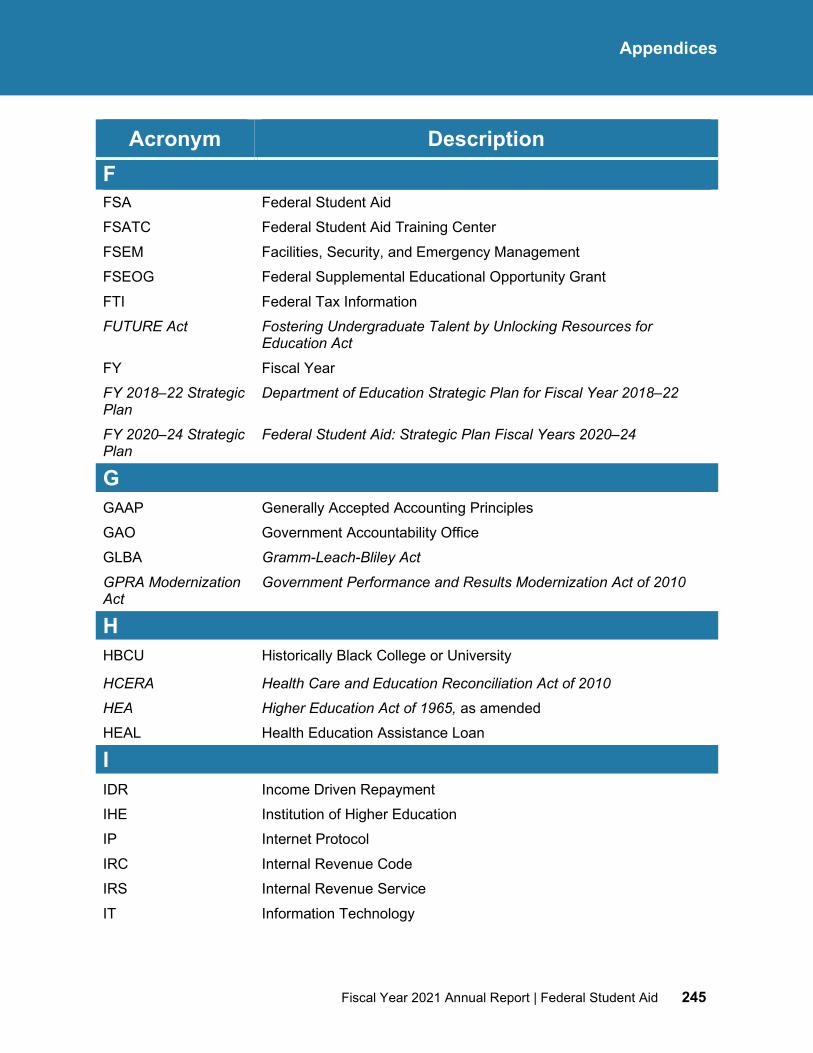
Fiscal Year 2021 Annual Report | Federal Student Aid 245
Appendices
Acronym Description F
FSA Federal Student Aid FSATC Federal Student Aid Training Center FSEM Facilities, Security, and Emergency Management FSEOG Federal Supplemental Educational Opportunity Grant FTI Federal Tax Information FUTURE Act Fostering Undergraduate Talent by Unlocking Resources for
Education Act
FY Fiscal Year FY 2018–22 Strategic Plan
Department of Education Strategic Plan for Fiscal Year 2018–22
FY 2020–24 Strategic Plan
Federal Student Aid: Strategic Plan Fiscal Years 2020–24
G
GAAP Generally Accepted Accounting Principles GAO Government Accountability Office GLBA Gramm-Leach-Bliley Act
GPRA Modernization Act
Government Performance and Results Modernization Act of 2010
H
HBCU Historically Black College or University
HCERA Health Care and Education Reconciliation Act of 2010
HEA Higher Education Act of 1965, as amended
HEAL Health Education Assistance Loan
I IDR Income Driven Repayment IHE Institution of Higher Education IP Internet Protocol IRC Internal Revenue Code IRS Internal Revenue Service IT Information Technology
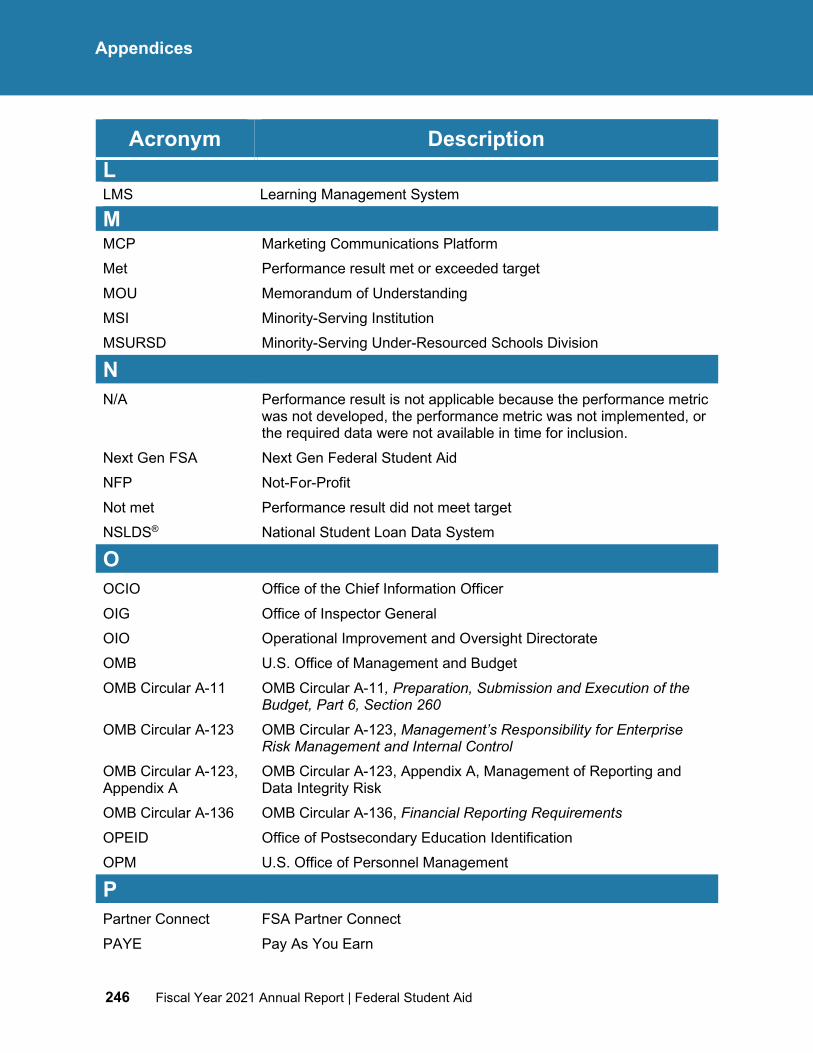
246 Fiscal Year 2021 Annual Report | Federal Student Aid
Appendices
Acronym Description L LMS Learning Management System
M MCP Marketing Communications Platform Met Performance result met or exceeded target MOU Memorandum of Understanding MSI Minority-Serving Institution MSURSD Minority-Serving Under-Resourced Schools Division
N
N/A Performance result is not applicable because the performance metric was not developed, the performance metric was not implemented, or the required data were not available in time for inclusion.
Next Gen FSA Next Gen Federal Student Aid NFP Not-For-Profit Not met Performance result did not meet target NSLDS® National Student Loan Data System
O
OCIO Office of the Chief Information Officer OIG Office of Inspector General OIO Operational Improvement and Oversight Directorate OMB U.S. Office of Management and Budget OMB Circular A-11 OMB Circular A-11, Preparation, Submission and Execution of the
Budget, Part 6, Section 260 OMB Circular A-123 OMB Circular A-123, Management’s Responsibility for Enterprise
Risk Management and Internal Control OMB Circular A-123, Appendix A
OMB Circular A-123, Appendix A, Management of Reporting and Data Integrity Risk
OMB Circular A-136 OMB Circular A-136, Financial Reporting Requirements OPEID Office of Postsecondary Education Identification OPM U.S. Office of Personnel Management
P
Partner Connect FSA Partner Connect PAYE Pay As You Earn
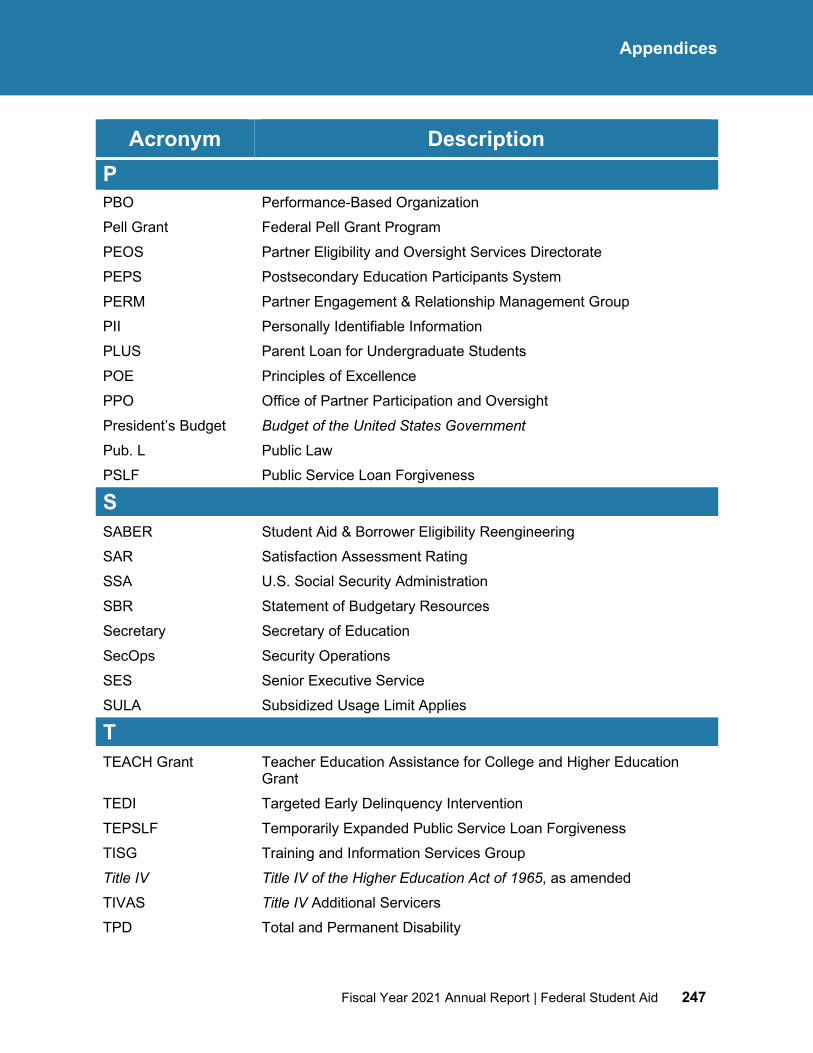
Fiscal Year 2021 Annual Report | Federal Student Aid 247
Appendices
Acronym Description P
PBO Performance-Based Organization Pell Grant Federal Pell Grant Program PEOS Partner Eligibility and Oversight Services Directorate PEPS Postsecondary Education Participants System PERM Partner Engagement & Relationship Management Group PII Personally Identifiable Information PLUS Parent Loan for Undergraduate Students POE Principles of Excellence PPO Office of Partner Participation and Oversight President’s Budget Budget of the United States Government Pub. L Public Law PSLF Public Service Loan Forgiveness
S SABER Student Aid & Borrower Eligibility Reengineering SAR Satisfaction Assessment Rating SSA U.S. Social Security Administration SBR Statement of Budgetary Resources Secretary Secretary of Education SecOps Security Operations SES Senior Executive Service SULA Subsidized Usage Limit Applies
T TEACH Grant Teacher Education Assistance for College and Higher Education
Grant TEDI Targeted Early Delinquency Intervention TEPSLF Temporarily Expanded Public Service Loan Forgiveness TISG Training and Information Services Group Title IV Title IV of the Higher Education Act of 1965, as amended TIVAS Title IV Additional Servicers TPD Total and Permanent Disability
248 Fiscal Year 2021 Annual Report | Federal Student Aid
Appendices
Acronym Description T
TPDR Third-Party Debt Relief Treasury U.S. Department of the Treasury
U U.S. United States
V VA U.S. Department of Veterans Affairs
VOG Vendor Oversight Group
Fiscal Year 2021 Annual Report | Federal Student Aid 249
Appendices
Appendix D: Availability of the FSA Report
The Federal Student Aid Fiscal Year 2021 Annual Report and the Annual Reports from prior years are available on the following websites:
• FSA: StudentAid.gov/strategic-planning-reporting
• The Department: http://www.ed.gov/about/reports/annual/index.html
The Federal Student Aid: Strategic Plan, Fiscal Years 2020–24 and prior years’ strategic plans are also available at StudentAid.gov/strategic-planning-reporting.
Stay connected to Federal Student Aid through social media:
• Visit the FSA website: StudentAid.gov
• Like FSA on Facebook : Facebook.com/federalstudentaid
• Follow FSA on Twitter : @FAFSA
• Follow FSA on LinkedIn : linkedin.com/company/federalstudentaid
• Find FSA on YouTube : YouTube.com/user/federalstudentaid
Acknowledgments The FSA FY 2021 Annual Report was prepared with the energies and talents of many Federal Student Aid employees. To these dedicated individuals, the Chief Operating Officer and Chief Financial Officer would like to offer their sincere appreciation and recognition.
In particular, we would like to recognize the following Federal Student Aid offices for their contributions:
• Finance Directorate.
• Strategic Planning and Reporting Directorate.
• Office of the Ombudsman.
• Office of Strategic Communications.
• COO Front Office.
We also offer our sincerest thanks and acknowledgement to the staff of the following other offices within the Department of Education for their contributions:
• Office of Finance and Operations.
• Budget Service.
• Office of the Secretary.
• Office of Legislation and Congressional Affairs.
• Office of Chief Information Officer.
We would also like to acknowledge the Office of Inspector General and KPMG LLP for the professional manner in which they conducted the audit of the FY 2021 Financial Statements.
The Federal Student Aid FY 2021 Annual Report
Federal Student Aid A Principal Office of the U.S. Department of Education
Finance Directorate November 2021