Embed Size (px)
Citation preview
Dairy CooperativeGrowth Challenges:Technology, Ingredients (Proteins)and Equity Financing
Research Report 206
United StatesDepartment ofAgriculture
Abstract Filtration separates milk components for use as ingredients in new products or newmanufacturing processes. Technology developments in filtration and new manufactur-ing processes are certain to shape the future of the dairy industry. Some ingredients,such as milk protein concentrate (MPC), casein and caseinate, are almost all importeddue to lower prices in foreign markets. When domestic production becomes economi-cally feasible, cooperatives are potential producers of milk protein ingredients, espe-cially in the West region. Research and development, product development and mar-keting, acquiring manufacturing and processing technology and equity financing arecooperatives’ major challenges. A brief historical review of tomatoes shows how tech-nology has caused profound changes to an industry that strikingly resembles milk.
Key Words: Filtration, process technology, dairy ingredients, milk protein concentrate,cooperatives, equity, tomatoes.
Dairy Cooperative Growth Challenges: Technology, Ingredients (Proteins) and EquityFinancing
K. Charles LingAgricultural Economist
Research Report 206
May 2005
Preface This report is intended to provide member-producers of dairy cooperatives informationon recent technology developments and technology on the horizon. These develop-ments will create new uses for milk, new dairy ingredients, new products, and newmanufacturing processes and will open up new opportunities for the growth of the dairyindustry. Along with the new opportunities come challenges.
This report identifies four major challenges: research and development, product devel-opment and marketing, acquiring manufacturing and processing technology and equityfinancing. Each of the four challenges is discussed at some length, with equity financ-ing occupying a separate section.
In this report, an italic name in parentheses denotes the literature that is referred to bythe text. All statistics cited were up-to-date as of Jan. 14, 2005. Milk-equivalent wascalculated on a milk-protein basis. Mention of company and brand names does notsignify endorsement over other companies’ products and services.
i
Contents Highlights . . . . . . . . . . . . . . . . . . . . . . . . . . . . . . . . . . . . . . . . . . . . . . . . . . . . . . . . .iv
Introduction . . . . . . . . . . . . . . . . . . . . . . . . . . . . . . . . . . . . . . . . . . . . . . . . . . . . . . . .1
Filtration Technology . . . . . . . . . . . . . . . . . . . . . . . . . . . . . . . . . . . . . . . . . . . . . . . . .1
What is filtration? . . . . . . . . . . . . . . . . . . . . . . . . . . . . . . . . . . . . . . . . . . . . . . .1Advent of ultrafiltration . . . . . . . . . . . . . . . . . . . . . . . . . . . . . . . . . . . . . . . . . . .1Milk protein concentrate . . . . . . . . . . . . . . . . . . . . . . . . . . . . . . . . . . . . . . . . . .3MPC co-precipitates and other milk protein products . . . . . . . . . . . . . . . . . . .3
Process Technology . . . . . . . . . . . . . . . . . . . . . . . . . . . . . . . . . . . . . . . . . . . . . . . . .3
Dairy Ingredients—Milk Proteins . . . . . . . . . . . . . . . . . . . . . . . . . . . . . . . . . . . . . . . .4
Milk proteins . . . . . . . . . . . . . . . . . . . . . . . . . . . . . . . . . . . . . . . . . . . . . . . . . . .4Milk proteins are mostly imported . . . . . . . . . . . . . . . . . . . . . . . . . . . . . . . . . .4Magnitude of milk protein imports . . . . . . . . . . . . . . . . . . . . . . . . . . . . . . . . . .4Effects of milk protein imports on milk prices . . . . . . . . . . . . . . . . . . . . . . . . . .6No incentives to produce milk protein products . . . . . . . . . . . . . . . . . . . . . . . .9Relative value of casein to nonfat dry milk . . . . . . . . . . . . . . . . . . . . . . . . . . .10
Protein Ingredient Production Prospects . . . . . . . . . . . . . . . . . . . . . . . . . . . . . . . .10
Some advantages of domestic production . . . . . . . . . . . . . . . . . . . . . . . . . . .12Location of protein ingredient plants . . . . . . . . . . . . . . . . . . . . . . . . . . . . . . .12Location of end-users . . . . . . . . . . . . . . . . . . . . . . . . . . . . . . . . . . . . . . . . . .15Regional specialization of milk use . . . . . . . . . . . . . . . . . . . . . . . . . . . . . . . .15
Roles of Dairy Cooperatives . . . . . . . . . . . . . . . . . . . . . . . . . . . . . . . . . . . . . . . . . .16
Augmented first-handler role . . . . . . . . . . . . . . . . . . . . . . . . . . . . . . . . . . . . .16Cooperatives are potential producers of milk protein ingredients . . . . . . . . .16Cooperatives as end-users of milk ingredients . . . . . . . . . . . . . . . . . . . . . . .16
Dairy Cooperatives’ Challenges . . . . . . . . . . . . . . . . . . . . . . . . . . . . . . . . . . . . . . .16
Research and development . . . . . . . . . . . . . . . . . . . . . . . . . . . . . . . . . . . . . .17Product development and marketing . . . . . . . . . . . . . . . . . . . . . . . . . . . . . . .17Acquiring manufacturing and processing technology . . . . . . . . . . . . . . . . . .17
The Ultimate Challenge—Equity Financing . . . . . . . . . . . . . . . . . . . . . . . . . . . . . .18
Unique equity financing of cooperatives . . . . . . . . . . . . . . . . . . . . . . . . . . . .18Financing challenges . . . . . . . . . . . . . . . . . . . . . . . . . . . . . . . . . . . . . . . . . . .19Equity financing alternatives . . . . . . . . . . . . . . . . . . . . . . . . . . . . . . . . . . . . .19
Conclusion . . . . . . . . . . . . . . . . . . . . . . . . . . . . . . . . . . . . . . . . . . . . . . . . . . . . . . .21
Epilogue: Parallel to Processing Tomato Industry . . . . . . . . . . . . . . . . . . . . . . . . .21
References . . . . . . . . . . . . . . . . . . . . . . . . . . . . . . . . . . . . . . . . . . . . . . . . . . . . . . .24
ii
Contents References on Tomatoes . . . . . . . . . . . . . . . . . . . . . . . . . . . . . . . . . . . . . . . . . . . .26
List of Figures
Figure 1—Estimated protein content in the imports of milk protein products . . . . . . . . . . . . . . . . . . . . . . . . . . . . . . . . . . . . . . .8
Figure 2—Estimated protein content in the U.S. production and USDA net removals of nonfat dry milk, and in the imports of milk protein products . . . . . . . . . . . . . . . . . . . . . . . . . . .8
List of Tables
Table 1—Composition of milk . . . . . . . . . . . . . . . . . . . . . . . . . . . . . . . . . . . . .2
Table 2—U.S. whey products and exports . . . . . . . . . . . . . . . . . . . . . . . . . . . .5
Table 3—U.S. share of world whey exports . . . . . . . . . . . . . . . . . . . . . . . . . . .6
Table 4—Estimated protein content in the consumption imports of milk protein concentrates, casein and caseinates, and in the U.S. production and USDA net removals of nonfat dry milk, thousand pounds of protein . . . . . . . . . . . . . . . . . . .7
Table 5—U.S. dried casein production (skim milk or buttermilk product) and imports . . . . . . . . . . . . . . . . . . . . . . . . . . . . . . . . . . . . .9
Table 6—Casein and nonfat dry milk prices, 1935-56, and 1996-2003 . . . . .11
Table 7—Production of nonfat dry milk for human consumption, milk production and milk production costs and returns, by region. . . . . . . . . . . . . . . . . . . . . . . . . . . . . . . . . . . . . . .13
Table 8—Milk production by State and region, 10-year changes . . . . . . . . . .14
Table 9—Tomatoes for fresh market, production by State, average 1951-60 and 2003 . . . . . . . . . . . . . . . . . . . . . . . . . . . . . . . . . . . . . .22
Table 10—Tomatoes for processing, production by State, selected years 1951-2003 (tons) . . . . . . . . . . . . . . . . . . . . . . . . .23
iii
Highlights Two aspects of modern technology are going to be very important for the future of thedairy industry. One is the filtration technology of fractionizing milk components. Theother is the process technology of making dairy products using dairy-based ingredientswith small amount of fresh milk. Wider adoption of these technologies will cause fur-ther restructuring of the milk industry. This presents dairy cooperatives with many chal-lenges and potentially rewarding opportunities.
Filtration is the use of semi-permeable membranes to separate and “harvest” milkcomponents for uses as ingredients in various foods, beverages and nutritional andpharmaceutical applications. Milk protein concentrate (MPC) is one such ingredient. Inthe future, further technological advances may turn milk plants into milk “refineries”that could fractionate milk components into all kinds of desired dairy ingredients.
On the other hand, advances in new manufacturing process technology may allow theuse of dairy ingredients with small amount of fresh milk in the manufacture of dairyproducts. An example is a patented “wheyless process” for production of mozzarellacheese. This process enables the manufacture of cheese from nonperishable or shelf-stable dried dairy ingredients. This allows flexibility in the location of cheese manufac-turing facilities as handling and/or transporting large quantities of fresh milk is notrequired. Also, the need for refrigerated storage of the fresh milk would be minimal.Several other wheyless-process patents also have been recently granted for makingvarious other dairy products from dry ingredients.
Among dairy ingredients that are of particular current interest to dairy producers areMPC, MPC/casein, casein and caseinates. Until recently, there was no domestic pro-duction of MPC, casein and caseinates in the United States. Milk prices are such thatdomestic production of these products can not compete with imports. (Other proteinproducts, such as whey protein concentrate (WPC) and other whey products, competevery well with foreign production because whey price is not regulated.)
Other than price, domestic milk-protein production may have some advantages overimports, such as fresher protein products at a lower transportation cost to customers,better customer services due to proximity to end-users, and ability to supply proteinproducts in wet form or caseinates made from fresh milk.
Based on the profitability of milk production, the West is the region that is most certainto see continued growth in milk production and could support new plant capacity. Thisis the region where new milk-protein plants should be located, if they were to be built.In fact, the first plants in the United States for MPC production are located in Tempe,A.Z. and Portales, N.M.
One of the important functions of dairy cooperatives is supply- balancing and last-resort processing of surplus milk. Making milk protein ingredients would be an alterna-tive outlet for such milk. Dairy cooperatives are certainly going to play a prominent rolein a milk-protein ingredient sector if it becomes economically feasible to produce suchproducts domestically.
Cooperatives also are end-users of dairy ingredients. Some cooperatives have beenmaking nontraditional dairy or related products to satisfy consumers’ shifting demandor to have a complete line of products to offer customers. In most cases, the nontradi-tional products are dairy-based, and dairy ingredients constitute the major share of themanufacturing inputs.
iv
Highlights In a future that is driven by technology, dairy cooperatives face many challenges. Chiefamong them are: (1) research and development, (2) product development and market-ing, (3) acquiring manufacturing and process technology, and (4) equity financing.
Research and development is the foundation of manufacturing and processing tech-nology, product development and marketing. Through check-off dollars, dairy farmershave funded many research projects that provide information pertaining to the devel-opment of process technology and new product development. However, only through acooperative’s own proprietary research and development efforts can it identify andhave a full grasp of its market niches and bring the new products to the market.
New products may be developed by modifying the flavors, taste, colors, forms, pack-aging or shelf-life of existing products, or by fortifying them for desired functionality.Product development also refers to using dairy ingredients (or dairy products as ingre-dients) to develop or improve foods and beverages.
Marketing new consumer products requires market research, test marketing, advertis-ing and promotion, consumer education, shelf-space acquisition, merchandising, andservicing the products. In marketing new dairy ingredients, the challenge is to provideend-users (processors) with information on the attributes, the functionality, and theapplication of the ingredients.
Machinery and equipment are the embodiment of manufacturing technology.Cooperatives usually acquire new manufacturing technology through buying newmachinery and equipment. However, as the scale of dairy plants grows larger, the costof building a new plant with new machinery and equipment is substantial. The plantalso requires a large milk volume to sustain the operations.
To differentiate value-added products and gain competitive advantages, cooperativesalso must devote adequate resources to develop or acquire the process technologyand adopt new ways to manufacture or package them or enhance the particular attrib-utes of the products. The other aspect of processing technology development is find-ing new ways to make existing products, such as the wheyless process for makingmozzarella cheese.
To meet all these challenges requires adequate financing—the ultimate challenge. Adairy cooperative’s debt financing may work much the same way as any business. Itsequity financing, however, is unique and may have one or more of these features: (1)common stock held by cooperative members (usually of nominal value), (2) retainedpatronage as net savings allocated to members based on patronage but retained foroperations, (3) capital retains that are milk payments but are withheld at a certain rateper hundredweight of milk, and (4) retained earnings that are earned on non-memberbusiness. Members must treat retained patronage and capital retains as income for taxpurposes. They are revolved back to members after a certain period of time.
In lieu of retained patronage and capital retains, a cooperative may have a base capi-tal plan. Under the plan, a target base-capital level is established at a rate per hun-dredweight of milk marketed during a representative period. This should provide anadequate level of equity capital.
v
Highlights The challenge of managing a cooperative’s unique way of equity financing comes fromthree directions. Members want as little retains and as short a revolving period as pos-sible, while the cooperative needs an adequate amount of capital for operations andthe lending institutions require the cooperative to maintain a certain level of equity.
The base capital plan may be viewed as a compromise among the three conflictinginterests. Under the plan, once the prescribed base capital level is attained, a membercan expect to receive all allocated patronage earnings in cash. The cooperative wouldhave an adequate level of capital to operate with, and the base capital would have acertain degree of permanency that helps relieve lending institutions’ concern aboutrisk.
From 1997 to 2002, average cooperative equity increased by 3 cents per hundred-weight, while assets increased by 97 cents and liabilities increased by 95 cents perhundredweight. Contributions by cooperative member-producers to the increased capi-tal needs were minimal and cooperative growth was mostly financed by debts.
Various alternative equity financing methods have been used to reduce cooperativemembers’ fiscal burden and investment risks: public stock corporations, limited liabilitycompanies (LLC), joint ventures, and new-generation cooperatives.
It is difficult to operate a public stock corporation or LLC on a cooperative basisbecause of one or more of the following: (1) Investors have problems with one-person,one-vote democratic control of cooperatives; (2) Producers support the cooperative’sbusiness by patronizing it; investors do not; (3) With investor capital, the cooperative islikely to lose Capper-Volstead status; (4) In a dairy cooperative, the distinctionbetween milk pay prices and premiums, on one hand, and profits on the other, is notclear-cut, and the conflicts between producers and investors may be very difficult toreconcile; and (5) There are fundamental conflicts between benefits for member-pro-ducers and investors’ focus on returns on investment.
The new-generation cooperative model has its strengths, but its characteristics alsohave created a host of problems. Only the joint-venture model seems to have worked.Many recent joint ventures formed by cooperatives with other cooperatives or firms areorganized as LLCs. On the marketing side, a joint-venture LLC may be used by acooperative and its partner to develop and market certain dairy products. The coopera-tive supplies milk to the LLC while the partner supplies technical and marketing know-how. The joint-venture partners share the financing and the risk of the business activi-ties of the LLC. This organizational model reduces the financing burden and riskexposure of cooperative members, while a market outlet for milk is secured.
The promising rewards of adapting to new technology can be exciting, but the neces-sary industry adjustment can be challenging for dairy farmers and their cooperatives.Success will depend on adequate member equity capital, well thought-out strategicplans, and research and development.
vi
Highlights The evolution of the milk industry has a striking resemblance to the developments inthe tomato industry. Like milk, tomatoes have two use categories. Tomatoes for freshmarket are produced in every State in the Nation, while production of tomatoes for pro-cessing is highly concentrated, mostly in California. Improvements in bulk storage andtransportation technology have created the situation in which Midwest and Easternprocessors serve as final fabricators of processing tomatoes grown and partiallyprocessed in California. In essence, the tomato industry has developed into two sepa-rate sectors—fresh market and the processing sector—each with its specific varietiesof tomatoes and distinctive characteristics. While the milk industry has not been differ-entiated to such extremes, the evolution of the tomato industry provides some food forthought as milk producers ponder the future.
vii
Dairy Cooperative Growth Challenges:Technology, Ingredients (Proteins) and Equity Financing
Introduction
The growth and the future of dairy farmingdepend on expanding the market for milk and milk-based products. The market for traditional dairy prod-ucts, of course, remains very important. Uses of milkcomponents as ingredients in new products that meetthe needs and the lifestyles of active and aging popula-tion sectors would further open up new outlets formilk. Technology will likely drive this growth.
There are two aspects of modern technology thatare going to be very important for the future of thedairy industry. One is the filtration technology of frac-tionizing milk components for use as ingredients invarious foods, beverages and nutritional and pharma-ceutical applications. The other is the processing tech-nology of making dairy products using mostly dairy-based ingredients with small amount of fresh milk.
Advances in the technology of producing andprocessing milk have resulted in major milk produc-tion growth in the western United States. Wider adop-tion of the filtration technology and the new process-ing technology will cause further restructuring of themilk industry. This presents dairy cooperatives withmany challenges and potentially rewarding opportuni-ties.
Filtration TechnologyMilk is a complex mixture of water, carbohy-
drates (lactose), fat, protein, minerals and vitamins(table 1). Advances in filtration technology allow milkto be fractionized into its basic components. Based onthe characteristics and functionality of the compo-nents, they may then be used as ingredients in formu-las to create final products.
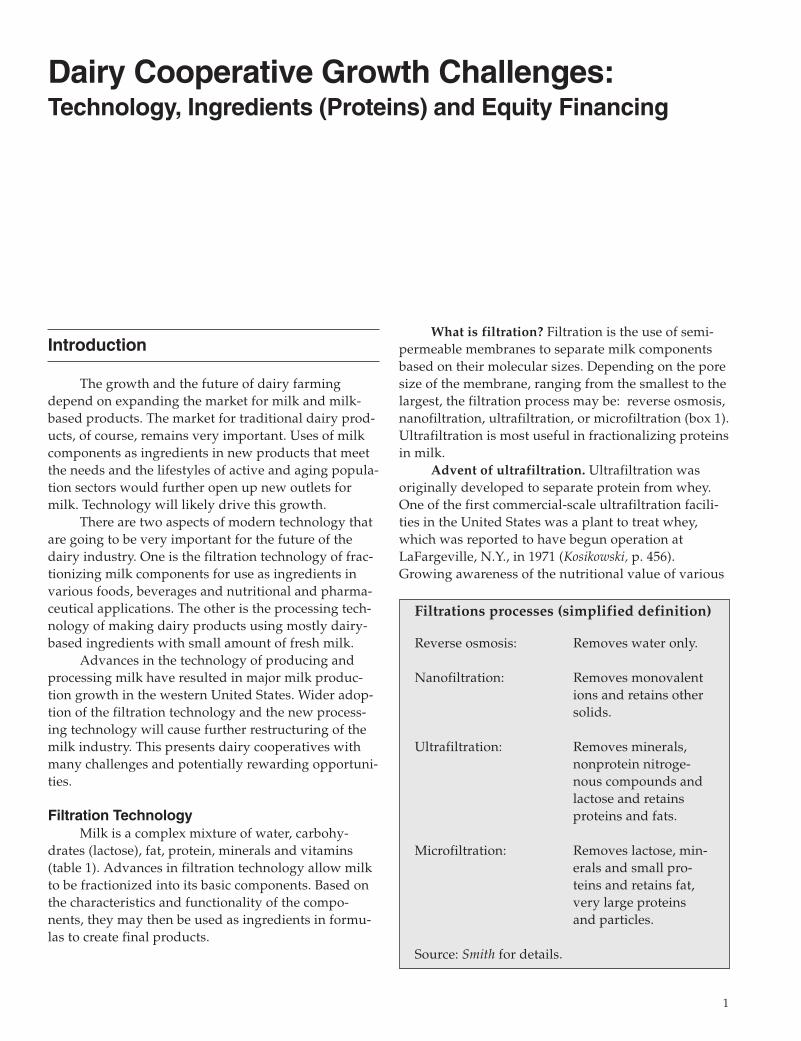
What is filtration? Filtration is the use of semi-permeable membranes to separate milk componentsbased on their molecular sizes. Depending on the poresize of the membrane, ranging from the smallest to thelargest, the filtration process may be: reverse osmosis,nanofiltration, ultrafiltration, or microfiltration (box 1).Ultrafiltration is most useful in fractionalizing proteinsin milk.
Advent of ultrafiltration. Ultrafiltration wasoriginally developed to separate protein from whey.One of the first commercial-scale ultrafiltration facili-ties in the United States was a plant to treat whey,which was reported to have begun operation atLaFargeville, N.Y., in 1971 (Kosikowski, p. 456).Growing awareness of the nutritional value of various
1
Filtrations processes (simplified definition)
Reverse osmosis: Removes water only.
Nanofiltration: Removes monovalentions and retains othersolids.
Ultrafiltration: Removes minerals,nonprotein nitroge-nous compounds andlactose and retainsproteins and fats.
Microfiltration: Removes lactose, min-erals and small pro-teins and retains fat,very large proteinsand particles.
Source: Smith for details.
whey proteins led to further advancement of the filtra-tion technology. An example is a recently reported set-up incorporating five filtering-process steps to frac-tionize whey within a closed loop membraneultrafiltration system for harvesting valuable wheyproteins (beta-lactoglobulin, serum albumin, IgG,alpha-lactalbumin…., etc.). Whey concentrates are nowused in a variety of commercial products, includingbody-building complexes, bakery goods, and frozenfood additives. In recent years, whey proteins havealso become valuable in nutraceutical and biopharma-ceutical applications (Koph).
Two French scientists in 1969 originated the con-cept that enabled ultrafiltration of milk to become a
continuous tool for cheesemaking (Kosikowski, p. 510).The ultrafiltration process for milk was developed inthe 1970s (United States General Accounting Office(GAO)). In the United States, ultrafiltration of milk isan acceptable in-plant procedure during the manufac-ture of standardized cheeses— cheeses that are cov-ered by the standards of identity regulations. (A list ofthe cheeses can be found in GAO, Appendix I. The reg-ulations may be found at the United States Food andDrug Administration (FDA) Web site).
In 1996, FDA allowed an exception to its standardfor Cheddar cheese in a pilot project to make cheesefrom ultra-filtered milk. Milk was ultra-filtered on afarm in New Mexico, then shipped to Bongards
2
Table 1—Composition of milk
Percent
Water 87.4
Carbohydrates 4.8l Lactose (principal proportion)l Glucose, galactose, oligosaccharides and others (minor quantities)
Milk fat 3.7 l The most complex of lipids—More than 400 different fatty acids
and fatty acid derivatives, including CLA (conjugated linoleic acid)l Fat-soluble vitamins A, D, E and K.
Protein 3.4 l Casein (2.8 percent):
Alpha-caseinBeta-caseinGamma-caseinKappa-casein
l Whey protein (0.6 percent):Beta-lactoglobulinAlpha-lactalbuminSerum albuminImmunoglobulins (IgA, IgG, IgM)Protease peptones,LactoferrinTransferrin
l Nonprotein nitrogenous compounds (traces)
Minerals, trace elements and salts 0.7———
Total 100.0
Sources: National Dairy Council and Chandan.
Creamery in Minnesota for making Cheddar cheese.The process was permitted as long as the cheese pro-duced met the criterion that it was nutritionally, physi-cally, and chemically the same as cheese produced tra-ditionally (GAO, pp. 1 and 12; also Cessna, APPENDIXB, for standard cheeses with alternate make proce-dures). In December 2004, FDA issued a temporarypermit to Wells’ Dairy, Inc., for market testing cottagecheese made using fluid ultra-filtered skim milk (FDA,2004).
Milk protein concentrate. Ultra-filtered milkfrom the in-plant or on-farm process is in wet form. Upto two-thirds of the liquid components of the milk(mainly water) is removed to greatly reduce the cost oftransporting the ultra-filtered milk to market or reducethe amount of whey in cheesemaking (GAO, p.13).When the ultra-filtered milk (usually skim milk) isdried into powder, it is known as milk protein concen-trate (MPC). MPC contains unaltered forms of milkprotein (both casein and whey protein).
In the first half of the 1980s, Hungary commer-cialized the first MPC (Dairy Australia, p. 23). The tech-nology continued to evolve and commercial applica-tions of MPC took off as its functionality became betterunderstood. (See, e.g. Smith; also Hendrickx, sheets 7-10, for a description of functionality and applications.For applications, see Dairy Australia, Appendix F.)
In dairy applications, MPC is preferred to nonfatdry milk for standardizing the protein level in the milkfor making cheese products. MPC has a higher proteincontent (ranging from 42 percent to greater than 80percent) than nonfat dry milk (which averages about35 percent protein) and a correspondingly lower lac-tose level. Less lactose generates less whey and, as aresult, cheese production is more efficient (Jesse). In2002, 62 percent of all MPC imports were used in mak-ing cheese products (United States InternationalCommerce Commission, USITC Publication 3692, p 7-3).
MPC can also be used in a wide variety of non-dairy applications, such as in sports drinks and bars,nutritional food products, nutraceutical foods, etc.(See, e.g. Dairy Australia, pp. 15, 25 and 71; Childs;Frierott; and GAO, Appendix IV). “Specialty nutrition”applications used 24 percent of all MPC imports in2002 (USITC Publication 3692, p.7-3).
MPC can be custom-formulated according to therequired protein content level of the end-users. WhileMPC is made through the ultrafiltration process, lowerprotein content MPC can also be formulated by blend-ing casein and nonfat dry milk.
MPC co-precipitates and other milk proteinproducts. Other than by filtration, some MPC may be
made by the precipitation process, where calcium chlo-ride or dilute acid is added to skim milk and the solu-tion is then heated to precipitate both casein and wheyprotein. The co-precipitates contain 89 to 94 percentprotein (Smith). (The USITC Harmonized TariffSchedule classifies these MPC co-precipitates underthe same heading as casein and caseinates, HTS 3501.)
Other concentrated milk protein products ofinterest include casein and caseinates. Casein containsaround 90 percent protein and is made by addingeither acid or rennet to skim milk. Addition of acid orrennet to milk causes casein (but not whey protein) tojoin together and separate from other components.Caseinate is produced by neutralizing acid/rennetcasein with alkali and then drying the resulting prod-uct. The alkali treatment makes caseinate more solublethan casein (Smith). Production of casein dates back toat least early 1900s, primarily for nonfood uses. Duringthe post-World War II era, developments in food tech-nology changed the uses of casein and caseinates fromalmost entirely nonfood to mostly food (Manchester, p.238).
Process TechnologyAdvances in new manufacturing process technol-
ogy may allow the use of mostly dairy ingredients andsmall amounts of fresh milk in the manufacture ofdairy products. An example is a patent (No. 6,372,268)recently issued by the United States Patent andTrademark Office, “Wheyless process for production ofnatural mozzarella cheese.” The patent abstract states:
“The present invention provides a wheylessprocess for preparing natural mozzarella cheeseusing dry dairy ingredients. This process enablesthe manufacture of cheese from non-perishable orshelf-stable ingredients such as dried milk pro-tein concentrate and anhydrous milkfat. Thisenables greater flexibility in the location of cheesemanufacturing facilities as handling and/ortransporting large quantities of fresh milk is notrequired. Also, in utilizing such a process, theneed for refrigerated storage of the fresh milkwould be minimal. The dry dairy ingredientsused in the present invention comprise milk pro-tein concentrates and blends of milk protein con-centrates with up to about 50 percent of a seconddry dairy ingredient selected from the group con-sisting of whey protein concentrate, whey proteinisolate, calcium caseinate, sodium caseinate, ren-net casein, acid casein, nonfat dry milk, and mix-tures thereof.”
3
(Author’s note: Whether the resulting productcan be marketed as “mozzarella cheese” is subject toregulation by FDA’s standards of identity.)
Several other wheyless process patents also havebeen granted for making various dairy products fromdry ingredients. The proliferation of this type of manu-facturing process technology using dry ingredients isgoing to alter the dairy landscape in a profound way.A plant making “cheese” (or other dairy products)from mostly dry ingredients can then be located any-where, with no need to be close to dairy farms. Theplant would no longer need to deal with producerpayrolls, milk hauling, weather-induced intake vari-ability, seasonality of milk production and composi-tion, seasonal inventories of cheese, etc. This develop-ment will have great implications for milk producersand their cooperatives, especially in regard to coopera-tives’ roles in the supply chain.
Dairy Ingredients—Milk ProteinsFiltration technology is very useful in “harvest-
ing” the components in milk. It is conceivable that fur-ther technological advances may someday turn milkplants into milk “refineries” that could fractionate milkcomponents into all kinds of desired dairy ingredients(Dairy Management, Inc., 2002). The filtration technolo-gy that incorporates five filtering-process steps to frac-tionize whey within a closed loop membrane ultrafil-tration system for harvesting valuable whey proteins(Koph, cited earlier) could be a precursor of more com-plete systems for fractionalizing milk components.
Milk proteins. The list of dairy ingredients couldbe very long (ingredients included in American DairyProducts Institute and Chandan are just the more famil-iar ones). Of particular interest to dairy farmers (andthe focus of this section) are protein products such asmilk protein concentrate (MPC), casein, and caseinates.The United States has relied on imports to satisfydemand for these products. However, growing importvolumes of milk protein products over the past decadehave heightened milk producers’ concerns that theyare displacing commercial uses of U.S.-produced non-fat dry milk.
Other protein products, such as whey proteinconcentrate (WPC), are produced with a technologysimilar to that used in producing MPC. However,unlike skim milk that is used to produce MPC andcasein and is subject to administered prices, whey is abyproduct of cheese production and is not subject toprice regulation. Without price being regulated,domestically produced whey products compete verywell with foreign production and are not currently a
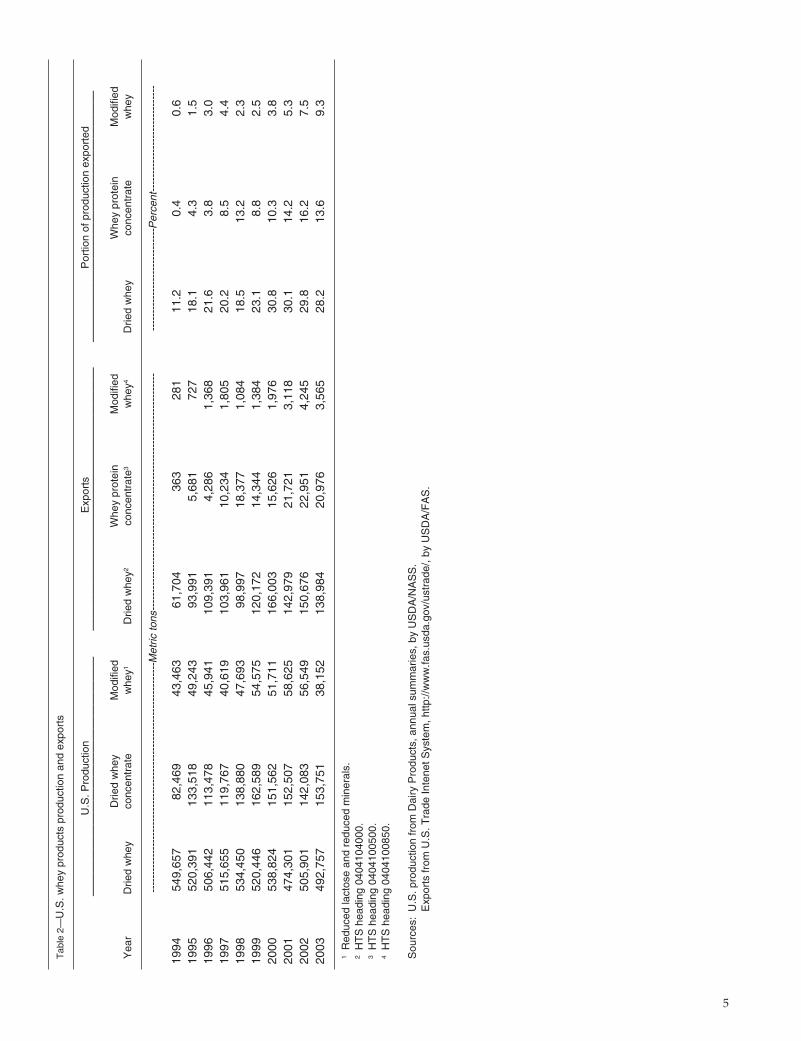
pressing concern for milk producers. During the past10 years, substantial amounts of dried whey, wheyprotein concentrate, and modified whey have beenexported (table 2). According to the Food andAgricultural Organization of the United Nations, theU.S. share of world whey exports grew from 8 percentin 1994 to nearly 15 percent in 2002, before droppingback to 13 percent in 2003 (table 3).
Milk proteins are mostly imported. Until recent-ly, there was no domestic production of MPC, casein,and caseinates in the United States. Milk prices aresuch that domestic production of these products cannot compete with imports, which—besides beinglower-priced—pay very low import duties or no tariffsat all.
There have been some recent efforts at startingthe domestic production of the concentrated milk pro-tein products. A facility with an annual productioncapacity of 16,000 metric tons of MPC-70 (the numberfollowing MPC denotes protein content, 70 percentprotein in this case) equivalent product was completedin Portales, N.M., by DairiConcepts, a joint venturebetween two cooperatives, Dairy Farmers of Americaand Fonterra (of New Zealand) (Kozak, et al).Commercial operations started in July 2003 (Parsons).This followed on the start-up of MPC production(ranging from MPC-40 to PMC-70) by UnitedDairymen of Arizona,Tempe, A.Z., about 6 monthsearlier.
Beginning in June 2002, USDA has operated aprogram for the sale, at a discount, of Government-owned nonfat dry milk that has been in storage formore than 24 months to processors for casein orcaseinate production. By the end of 2004, the activityin this program totaled nearly 42.7 million pounds ofnonfat dry milk (AMS). (A similar program in 1986and 1987 totaled only about one-half million pounds.)However, some claimed that protein products notmade from fresh milk are less desirable in their senso-ry quality (e.g. Frierott).
Magnitude of milk protein imports. Followingone set of conversion factors used by USITC, MPC onaverage may contain 65 percent protein; milk proteinconcentrate/casein (MPC imports in the same classifi-cation with casein and caseinates) may contain 90 per-cent protein; casein may contain 87 percent protein;and caseinates may contain 91 percent protein (USITCPublication 3692, p. 3-33). These conversion factorswere used to calculate the volumes of protein con-tained in the imports of MPC, casein and caseinates asshown in table 4.
4
5
Tab
le 2
—U
.S. w
hey
prod
ucts
pro
duct
ion
and
expo
rts
U.S
. Pro
duct
ion
Exp
orts
Por
tion
of p
rodu
ctio
n ex
port
ed—
——
——
——
——
——
——
——
——
——
——
——
——
——
——
——
——
——
——
——
——
——
——
——
——
——
——
——
——
——
——
——
Drie
d w
hey
Mod
ified
Whe
y pr
otei
nM
odifi
edW
hey
prot
ein
Mod
ified
Yea
rD
ried
whe
yco
ncen
trat
ew
hey1
Drie
d w
hey2
conc
entr
ate3
whe
y4D
ried
whe
yco
ncen
trat
ew
hey
----
----
----
----
----
----
----
----
----
----
----
----
----
----
----
----
-Met
ric to
ns--
----
----
----
----
----
----
----
----
----
----
----
----
----
----
----
----
---
----
----
----
----
----
----
---P
erce
nt--
----
----
----
----
----
----
----
1994
549,
657
82,4
6943
,463
61,7
0436
328
111
.20.
40.
6 19
9552
0,39
113
3,51
849
,243
93,9
915,
681
727
18.1
4.3
1.5
1996
506,
442
113,
478
45,9
4110
9,39
14,
286
1,36
821
.63.
83.
0 19
9751
5,65
511
9,76
740
,619
103,
961
10,2
341,
805
20.2
8.5
4.4
1998
534,
450
138,
880
47,6
9398
,997
18,3
771,
084
18.5
13.2
2.3
1999
520,
446
162,
589
54,5
7512
0,17
214
,344
1,38
423
.18.
82.
5 20
0053
8,82
415
1,56
251
,711
166,
003
15,6
261,
976
30.8
10.3
3.8
2001
474,
301
152,
507
58,6
2514
2,97
921
,721
3,11
830
.114
.25.
3 20
0250
5,90
114
2,08
356
,549
150,
676
22,9
514,
245
29.8
16.2
7.5
2003
492,
757
153,
751
38,1
5213
8,98
420
,976
3,56
528
.213
.69.
3
1R
educ
ed la
ctos
e an
d re
duce
d m
iner
als.
2H
TS
hea
ding
040
4104
000.
3H
TS
hea
ding
040
4100
500.
4H
TS
hea
ding
040
4100
850.
Sou
rces
:U
.S. p
rodu
ctio
n fr
om D
airy
Pro
duct
s, a
nnua
l sum
mar
ies,
by
US
DA
/NA
SS
.E
xpor
ts fr
om U
.S. T
rade
Inte
net S
yste
m, h
ttp://
ww
w.fa
s.us
da.g
ov/u
stra
de/,
by U
SD
A/F
AS
.
Between 1989 and 2003, MPC protein importsincreased 22-fold, and MPC/casein protein importsincreased fourfold. While casein imports (excludingcasein glues) were rather flat (increased only 6 percent)over the time period, imports of protein contained incaseinates more than doubled (table 4). The volume ofprotein contained in imported MPC, casein, andcaseinates, increased from 165 million pounds in 1989to 279 million pounds in 2003, an increase of 69 per-cent.
One way to look at the magnitude of milk proteinimports is to compare it to the protein level containedin U.S. nonfat dry milk production. Again, followingthe conversion factor used by USITC, nonfat dry milkaverages around 36 percent milk protein (USITCPublication 3692, p. 3-33). Protein contained in the U.S.nonfat dry milk production increased 82 percent, from315 million pounds in 1989 to 572 million pounds in2003.
During the 15-year period, total protein importswere equivalent to 52 percent of the protein containedin the U.S. nonfat dry milk production. By comparison,USDA net removals of nonfat dry milk (removed bypurchases under the Price Support Program and bybonuses under the Dairy Export Incentive Program)averaged 30 percent of production. Thus, the volumeof milk protein imports exceeded USDA net removalsby 74 percent over the 15 years. Imports exceededUSDA net removals every year except 2002 (table 4).
The magnitude of each category of milk proteinimports may be better visualized in figure 1. While
imports of casein, caseinates, and MPC/casein showgradual increase over the 15-year period, MPC importsincreased tremendously since 1995, peaking in 2000.
As a result, total milk protein imports peaked in2000 (figure 2). Although imports were lower than theprevious year in 2001 and 2002, the volume increasedagain in 2003. It may be inferred from the linear trendline (Y=9,127.8x+147,800;R2=0.7781) that total milkprotein imports grew at a rate of 9 million pounds peryear during the 1989-2003 period (a growth rate equiv-alent to 273 million pounds of milk per year). Figure 2also shows that milk protein imports exceededGovernment net removals every year except in 2002.
Effects of milk protein imports on milk prices.The extent to which milk protein imports havedepressed milk prices depends on how much theimports have displaced nonfat dry milk in variousapplications. The USITC report estimated that import-ed milk protein products may have displaced approxi-mately 318 million pounds of U.S.-produced milk pro-tein, equivalent to 883 million pounds of domesticnonfat dry milk (using a conversion factor of 36 per-cent) in 1998-2002. It further estimated that 34 percentof the growth in the Commodity Credit Corporation(CCC) stocks (equivalent to 353 million pounds) ofnonfat dry milk between 1996 and 2002 may be attrib-uted to the increase in milk protein imports during thetime period (USITC Publication 3692, chapters 7 and 9).
The accumulation of nonfat dry milk stocksincreased the outlays of the price support program andmay have been the impetus causing adjustments to thebutter/powder tilt in the CCC purchase prices. OnMay 31, 2001, CCC purchase price for nonfat dry milkwas adjusted downward by 10.32 cents, to $0.9000 perpound, and the purchase price was further reduced by10 cents, to $.8000 per pound on November 15, 2002.
Because of the substantial amount of CCC nonfatdry milk purchases in recent years, the support pur-chase price in essence sets the price of nonfat dry milk.Given the pricing formula in use in the Federal MilkMarket Orders (FMMO), the nonfat dry milk price inturn determines the Class II and Class IV skim milkprices. During those months when the advanced ClassIV price is the Class I price mover, the nonfat dry milkalso determines the Class I skim price. To the extentthat milk protein imports aggravated the nonfat drymilk surplus situation and helped tilt the powder sup-port purchase price downward, they certainly hadadverse impacts on the farm milk prices. (Jesse, pp.12-17, for a detailed discussion)
Milk protein imports also lower the cost of stan-dardizing the protein level in the milk for making
6
Table 3—U.S. share of world whey1 exports
Year U.S. exports World exports U.S. share
----------- Metric tons ----------- Percent
1994 63,104 808,097 7.8 1995 100,971 820,490 12.3 1996 115,339 907,633 12.7 1997 116,942 956,687 12.2 1998 120,512 955,725 12.6 1999 136,125 993,908 13.7 2000 198,992 1,213,397 16.42001 168,717 1,190,409 14.22002 178,240 1,225,622 14.52003 164,954 1,310,592 12.6
1 Whey and modified whey, whether or not concentrated orcontaining added sugar or other sweetening matter
Source: Food and Agricultural Organization of the United Nations,FAO Statistical Databases.
7
Tab
le 4
—E
stim
ated
pro
tein
co
nte
nt1
in t
he
con
sum
pti
on
imp
ort
s o
f m
ilk p
rote
in c
on
cen
trat
es, c
asei
n a
nd
cas
ein
ates
, an
d in
th
e U
.S. p
rod
uct
ion
and
US
DA
net
rem
ova
ls o
f n
on
fat
dry
milk
, th
ou
san
d p
ou
nd
s o
f p
rote
in
US
DA
net
Impo
rts
vsre
mov
als
vs.
prot
ein
inpr
otei
n in
Milk
pro
tein
Non
fat d
ryN
onfa
t dry
U.S
.non
fat
U.S
.non
fat
Milk
pro
tein
cenc
entr
ates
/m
ilk, U
.S.
milk
, US
DA
dry
milk
dry
milk
Yea
rco
ncen
trat
es2
case
in3
Cas
ein
Cas
eina
tes
Tot
al im
port
spr
oduc
tion
net r
emov
als
prod
uctio
npr
oduc
tion
----
----
----
----
----
----
----
----
----
----
----
----
----
----
----
-- T
hous
and
poun
ds o
f pro
tein
---
----
----
----
----
----
----
----
----
----
----
----
----
----
----
---
----
----
Per
cent
---
----
-
1989
2,16
54,
840
125,
422
32,9
07
165,
333
314,
880
-
52.5
-
1990
1,15
3 5,
681
132,
396
32,2
8317
1,51
4 31
6,51
6 42
,407
54
.213
.4
1991
1,60
8 7,
345
131,
954
33,6
62
174,
568
315,
909
97,0
36
55.3
30
.7
1992
5,63
66,
961
143,
127
33,5
3918
9,26
231
3,96
449
,220
60.3
15.7
1993
8,34
06,
737
115,
975
33,9
9616
5,04
934
3,61
510
9,56
348
.031
.9
1994
17,2
0913
,467
131,
076
41,8
2120
3,57
244
3,10
810
4,41
345
.923
.6
1995
10,4
425,
972
126,
218
49,3
2319
1,95
544
3,87
810
9,72
443
.224
.7
1996
20,4
297,
673
132,
662
51,1
2021
1,88
538
2,23
820
,606
55.4
5.4
1997
24,3
5822
,607
124,
720
52,0
8322
3,76
743
8,32
210
7,27
751
.124
.5
1998
41,4
5521
,666
135,
018
60,0
4325
8,18
240
8,73
811
7,50
263
.228
.7
1999
64,3
0819
,260
126,
901
65,2
2527
5,69
448
9,47
819
4,60
856
.339
.8
2000
75,8
4623
,654
142,
260
67,9
8430
9,74
352
2,63
024
9,32
659
.347
.7
2001
40,7
9613
,759
118,
182
76,7
0524
9,44
150
8,96
017
8,50
949
.035
.1
2002
48,1
8615
,506
110,
323
69,6
1424
3,62
957
4,53
829
5,83
542
.451
.5
2003
50,8
6725
,344
133,
195
69,3
3427
8,74
057
2,05
523
1,88
148
.740
.5––
––––
––––
––––
––––
––––
––––
––––
–––
––––
–––
––––
–––
––––
––
Ave
rage
27,5
2013
,365
128,
629
51,3
0922
0,82
242
5,92
212
7,19
4 51
.84
29.9
4
1F
acto
rs u
sed
to c
onve
rt p
rodu
cts
to p
rote
in: m
ilk p
rote
in c
once
ntra
te, 6
5%; m
ilk p
rote
in c
once
ntra
te/c
asei
n, 9
0%; c
asei
n, 8
7%; c
asei
nate
s, 9
1%; a
nd n
onfa
t dry
milk
, 36%
. (A
dopt
ed fr
omIT
C, p
. 3-3
3.)
2M
ilk p
rote
in c
once
ntra
te im
port
ed u
nder
HT
S 0
4049
0100
0.3
Milk
pro
tein
con
cent
rate
impo
rted
und
er H
TS
350
1101
000.
4W
eigh
ted
aver
age
Sou
rces
: C
onsu
mpt
ion
impo
rts
of m
ilk p
rote
in c
once
ntra
tes,
cas
ein
and
case
inat
es a
re c
ompi
led
from
U.S
. Tra
de In
tern
et S
yste
m, F
orei
gn A
gric
ultu
ral S
ervi
ce, U
SD
A, h
ttp://
ww
w.fa
s.us
da.g
ov/u
stra
de/.
Non
fat d
ry m
ilkpr
oduc
tion
is fr
om D
airy
Pro
ducs
, ann
ual s
umm
arie
s, v
ario
us is
sues
, Nat
ioan
l Agr
icul
tura
l Sta
tistic
s S
ervi
ce, U
SD
A.
US
DA
net
rem
oval
s da
ta is
from
Liv
esto
ck, D
airy
, and
Pou
ltry
Out
look
, Apr
il 27
, 200
4, a
ndD
airy
Yea
rboo
k, E
cono
mic
Res
earc
h S
ervi
ce, U
SD
A, h
ttp://
ww
w.e
rs.u
sda.
gov/
publ
icat
ions
/ldp/
.
8
Figure 1—Estimated protein content in imported milk protein products
Thousand pounds
1500,000
140,000
130,000
120,000
110,000
100,000
90,000
80,000
70,000
60,000
50,000
40,000
30,000
20,000
10,000
0
Protein in casein
Protein in caseinates
Protein in milk proteinconcentrate
Protein in milk proteinconcentrate/casein
1989 1990 1991 1992 1993 1994 1995 1996 1997 1998 1999 2000 2001 2002 2003
Figure 2—Estimated protein content in U.S. production and USDA net removals of nonfat milk, and in importsof milk protein products
Thousand pounds
600,000
500,000
400,000
300,000
200,000
100,000
0
Protein in nonfat dry milk,U.S. production
Total milk proteinimports
Protein in nonfat dry milk,USDA net removals
1989 1990 1991 1992 1993 1994 1995 1996 1997 1998 1999 2000 2001 2002 2003
y = 9127.8x + 147800R2 = 0.7781
cheese. A plant may use nonfat dry milk for standard-ization, the price of which has been tilted downward.Or it may use less expensive imported milk protein(USITC survey showed that 62 percent of MPCimports were used in processed cheese production in2002). Either way, the cheese plant would have lowerinput cost, and the lower input cost would shift thecheese supply curve downward and outward andresult in lower cheese prices. Although cheese prod-ucts made with MPC are outside FDA’s standards ofidentity, their lower prices would lower the price levelof all cheeses due to substitution effects. Again, giventhe FMMO price formula, lower cheese prices wouldmean lower Class III prices. And in those monthswhen the advanced Class III price is the Class I pricemover, lower cheese price means lower Class I price.
So, when nonfat dry milk is displaced by milkprotein imports, lower milk prices will be the result.This is simple economics—everything else being equal,the more the supply, the lower the price. The questionis: how much lower? Estimates vary. The USITCreport estimated that as a result of the 2001 tilt adjust-ment, farm prices of milk dropped by 44 cents perhundredweight, while the 2002 tilt adjustment causedthe farm price of milk to be lowered by 29 cents perhundredweight (USITC Publication 3692, chapter 9).
No incentives to produce milk protein products.With all the demand for MPC, casein and caseinatesbeing satisfied by imports, a pertinent question is whyis there no domestic production for import substitu-tion (until recent start-ups)?
While the technology for the commercial produc-tion of MPC was only developed two decades or soago, casein production has a much longer history—theUnited States did produce casein prior to 1970. Severalfactors led to the cessation of casein production in thiscountry. They are the same reasons why the U.S. dairyindustry is reluctant to invest in MPC production. Abrief review of these factors is useful information forassessing the current situation (more details can befound in Manchester and in Ling, et al).
The United States produced 35.3 million poundsof dry casein in 1931 (table 5). Casein productionpeaked at 67.5 million pounds in 1937. It returned to arelatively “normal” level the following year andstayed relatively stable until 1942, when 42.3 millionpounds was produced. Production then dropped to18.4 million pounds in 1943 and, by and large, wasmaintained at around that level until 1951 (except forthe one-year surge in 1947). It then dropped to 7.5 mil-lion pounds in 1952 and further declined to 2.5 millionpounds in 1956, the last year the production figure was
9
Table 5—U.S. dried casein production (skim milk orbuttermilk product) and imports
Year Production Imports Total
------------------Thousand pounds------------------
1931 35,335 3,503 38,8381932 24,428 1,201 25,6291933 24,087 8,142 32,2291934 37,331 1,491 38,8221935 37,638 3,230 40,8681936 46,140 16,209 62,3491937 67,467 5,210 72,6771938 48,549 417 48,9661939 40,878 15,832 56,7101940 46,616 24,523 71,1391941 47,346 41,518 88,8641942 42,268 16,819 59,0871943 18,386 28,052 46,4381944 15,264 47,225 62,4891945 12,333 51,610 63,9431946 18,319 45,346 63,6651947 35,831 20,887 56,7181948 14,372 40,585 54,9571949 18,348 33,061 51,4091950 18,531 54,552 73,0831951 21,620 43,386 65,0061952 7,482 56,836 64,3181953 5,532 74,246 79,7781954 5,175 59,833 65,0081955 3,147 74,480 77,6271956 2,533 70,674 73,2071957 (1) 74,604 - 1958 (1) 91,265 - 1959 (1) 94,459 - 1960 (1) 92,155 -
1961-70Average (1) 105,959 -
1 Fewer than 3 plants since 1957 until 1970, the last year reportedby the Agricultural Statistics, 1972. Since then, no data has beenreported ("-" denotes no data).
Sources: Agricultural Statistics, various years
reported in USDA’s Agricultural Statistics. Thereafteruntil 1970, Agricultural Statistics (1972) showed fewerthan 3 plants made casein and no production volumewas reported. Subsequently, the data series wasdropped altogether.
Both casein and nonfat dry milk use skim milk asthe raw material for production. This, in effect, dictatesthat in order to compete for milk supply, casein andnonfat dry milk enterprises must be equally profitableper hundredweight of skim milk. However, since thelate 1930s, government programs have provided incen-tives for the production of nonfat dry milk but notcasein.
War-time (World War II) programs providedincentives to processors to operate (then) large-scale,state-of-the-art plants to produce nonfat dry milk. Thecasein industry could not match the profitability ofmaking nonfat dry milk and was neglected. After thewar, the casein industry could not resume the pre-warlevel of production and could not justify new invest-ment in the sector.
Since 1949, the Milk Price Support Programspecifically offers to purchase nonfat dry milk, but notcasein. The support purchase price incorporates a“make allowance” that ensures an average manufac-turer of nonfat dry milk can recover the processingcost. Market security provided by the Milk PriceSupport Program ensures that nonfat dry milk produc-tion is almost without market risk. This enablesprocessors to invest, with confidence, in nonfat drymilk plants that are of very large scale and very effi-cient and incur low unit-manufacturing cost. This, con-ceivably, widens the profitability gap between the twoproducts.
In addition, import tariff systems, to a largeextent, shield nonfat dry milk from import competi-tion, while casein, caseinates, and MPC are not accord-ed such protection and have to compete with low-costforeign production.
Thus, public policy provides incentives (guaran-teed margins and a guaranteed market with low risk)to nonfat dry milk production. No such incentives forcasein production or for the recent advent of milk pro-tein concentrate production.
Relative value of casein to nonfat dry milk.Another factor inhibiting ventures into the productionof casein, caseinates or milk protein concentrate maybe the uncertainty concerning the results of gettinginto competition with foreign production. The milkused in producing these protein products is usuallyconsidered “surplus” milk. Some farmers say thatinternational competition could drive down the price
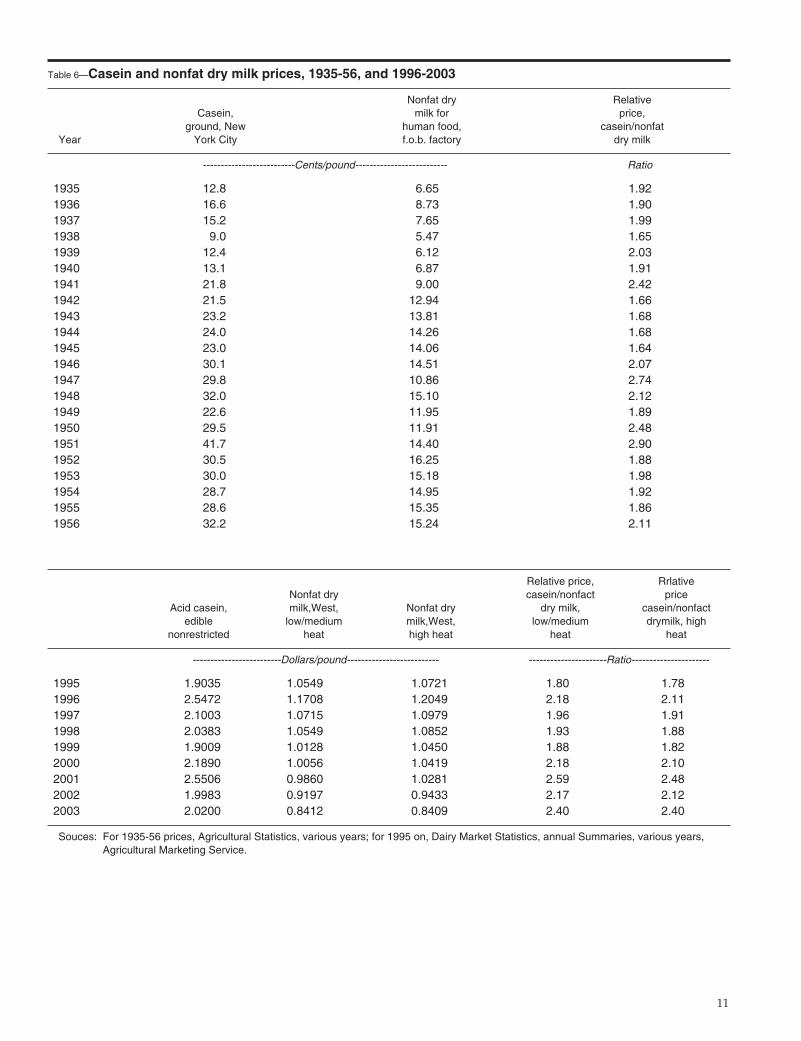
of milk or products to next to nothing—“racing for thebottom,” in their words. However, an examination ofthe history of casein and nonfat dry milk prices doesnot validate such apprehension (table 6).
During the 22-year period of 1935-56, whendomestic casein was produced, the ratio of casein pricerelative to nonfat dry milk price ranged between 1.64and 2.90. During the last nine years (1995-2003), whenthere was no domestic casein production and all caseinwas imported, the ratio of casein price relative tolow/medium-heat nonfat dry milk price was between1.80 and 2.59. The ratio was between 1.78 and 2.48 ifhigh-heat nonfat dry milk price is considered. (1995was the first year when the two most recent consistentprice series for [low/medium-heat and high-heat] non-fat dry milk used in table 6 became established.)
The casein and nonfat dry milk covered in thetwo time periods may not be identical. Nevertheless,the rather stable relative price of casein to nonfat drymilk—when there was domestic casein production andno price support for nonfat dry milk and when allcasein was imported and nonfat dry milk was support-ed—suggests that the prices of casein and nonfat drymilk did reflect the component values of the two prod-ucts. This may serve to refute the notion that produc-ing casein domestically would amount to competingwith foreign suppliers, the result being prices racing tothe bottom—as long as nonfat dry milk has marketvalue.
Protein Ingredient Production ProspectsThe prospects of producing protein ingredients in
the United States should be assessed against the fol-lowing backdrop:
l Technological advances will continue to devisenew and better ways of harvesting milk com-ponents for uses as dairy ingredients in anever-expanding array of food, beverages, phar-maceuticals, and other products.
l Among the dairy ingredients that concerndairy farmers the most are protein products,including casein, caseinates and milk proteinconcentrate. These milk protein products haveall been imported, although there were twodomestic startups of MPC production in 2003.
l Manufacturing process technology invariablylooks for more efficient and economical waysto make dairy products. Technology, such asthe wheyless process of making various non-
10
11
Table 6—Casein and nonfat dry milk prices, 1935-56, and 1996-2003
Nonfat dry Relative Casein, milk for price,
ground, New human food, casein/nonfatYear York City f.o.b. factory dry milk
--------------------------Cents/pound-------------------------- Ratio
1935 12.8 6.65 1.921936 16.6 8.73 1.901937 15.2 7.65 1.991938 9.0 5.47 1.651939 12.4 6.12 2.031940 13.1 6.87 1.911941 21.8 9.00 2.421942 21.5 12.94 1.661943 23.2 13.81 1.681944 24.0 14.26 1.681945 23.0 14.06 1.641946 30.1 14.51 2.071947 29.8 10.86 2.741948 32.0 15.10 2.121949 22.6 11.95 1.891950 29.5 11.91 2.481951 41.7 14.40 2.901952 30.5 16.25 1.881953 30.0 15.18 1.981954 28.7 14.95 1.921955 28.6 15.35 1.861956 32.2 15.24 2.11
Relative price, RrlativeNonfat dry casein/nonfact price
Acid casein, milk,West, Nonfat dry dry milk, casein/nonfactedible low/medium milk,West, low/medium drymilk, high
nonrestricted heat high heat heat heat
-------------------------Dollars/pound-------------------------- ----------------------Ratio----------------------
1995 1.9035 1.0549 1.0721 1.80 1.781996 2.5472 1.1708 1.2049 2.18 2.111997 2.1003 1.0715 1.0979 1.96 1.911998 2.0383 1.0549 1.0852 1.93 1.881999 1.9009 1.0128 1.0450 1.88 1.822000 2.1890 1.0056 1.0419 2.18 2.102001 2.5506 0.9860 1.0281 2.59 2.482002 1.9983 0.9197 0.9433 2.17 2.122003 2.0200 0.8412 0.8409 2.40 2.40
Souces: For 1935-56 prices, Agricultural Statistics, various years; for 1995 on, Dairy Market Statistics, annual Summaries, various years,Agricultural Marketing Service.
standard products (or permissible standardproducts), tends to promote use of dry ingredi-ents and has many advantages over the con-ventional method of using fresh milk as themain input. Milk protein products—such ascasein, caseinates, and milk protein concen-trate—are ideal ingredients for this kind oftechnology due to their properties and func-tionalities.
l Between 1989 and 2003, imports of milk protein(in casein, caseinates, and milk protein concen-trate) grew at an annual rate of 9 millionpounds of protein (273 million pounds of milkequivalent). In 2003, total imports of these pro-tein products were 279 million pounds (8.5 bil-lion pounds of milk equivalent). More importsof these protein products can be expected withthe advances of the manufacturing processtechnology.
It seems that the U.S. dairy industry would wantto supply at least a share of a market that uses 8.5 bil-lion pounds of milk and grows at a rate of 273 millionpounds a year. If so, somehow a way must be found tomake it economically feasible to venture into the pro-duction of protein products such as casein, caseinates,and milk protein concentrate. For this to happen, aprocessor’s return from the protein products produc-tion per hundredweight of skim milk must be at leastequal to the return from drying the same amount ofskim milk into nonfat dry milk because both enterpris-es use skim milk as the raw material.
As explained earlier, largely due to the incentivesprovided by the Milk Price Support Program, produc-ing nonfat dry milk has a higher return than process-ing protein products and is free of market risk. Toequalize the return, some incentives would have to beprovided to the would-be processors of the proteinproducts. There are many proposals as to how thiscould be achieved, such as production subsidies orimport restrictions, but their discussion is beyond thescope of this report. (See the proposal by National MilkProducers Federation. For a thorough review of the tradeissue, see USITC Publication 3692.)
Some advantages of domestic production. Whencomparing returns from domestic production of milkprotein products vs. imports, foreign supplies have aprice advantage over domestic production. However,the comparison also should take into account thatdomestic production may have advantages overimports in other aspects:
l Domestic production would supply fresherprotein products at a lower transportation costto customers than imports.
l Proximity to end-users would enable domesticprotein producers to provide better servicesand have closer interactions with customersregarding their changing needs.
l Some end-users may prefer to use the proteinproducts in the fresh, wet form without havingthem dried and then reconstituted for furtherprocessing. Domestic producers would be in agood position to supply these accounts.
l Some end-users may prefer caseinates madefrom fresh milk, rather than caseinates madefrom further processing of imported casein.
Location of protein ingredient plants. Both non-fat dry milk and milk protein ingredient products useskim milk as the main raw material for production.Therefore like nonfat dry milk plants, the logical loca-tion for new protein ingredient plants should be aregion where an abundant and growing volume ofmilk needing last-resort handling is available.
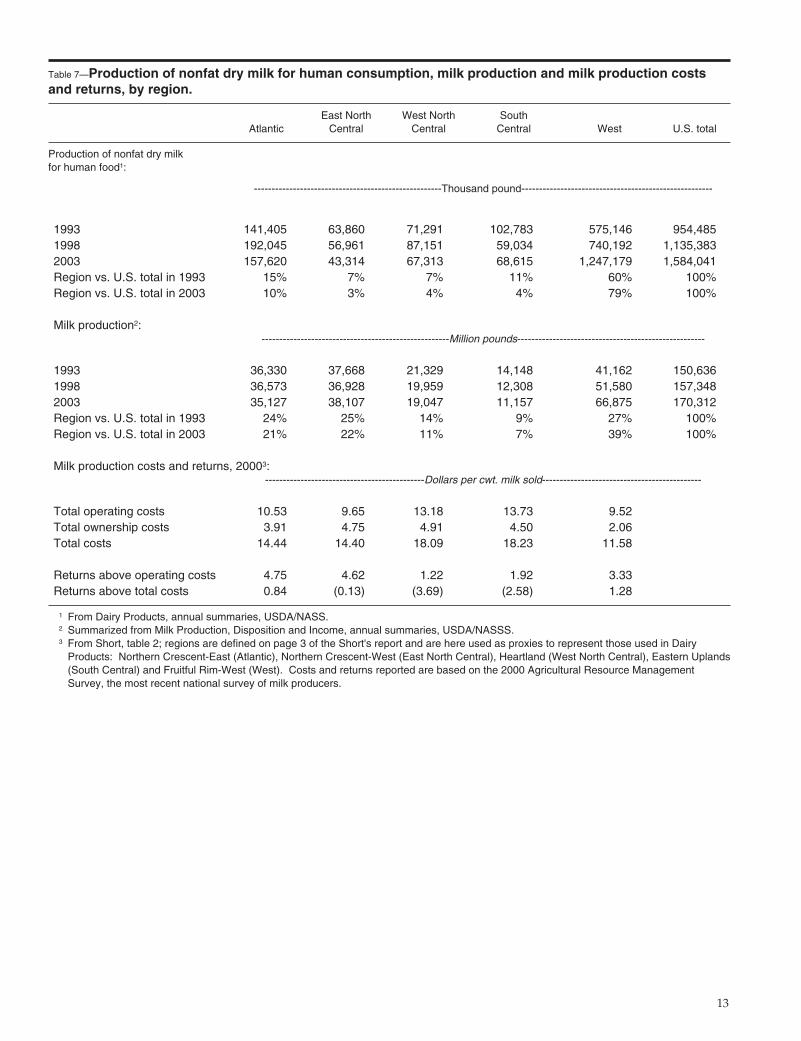
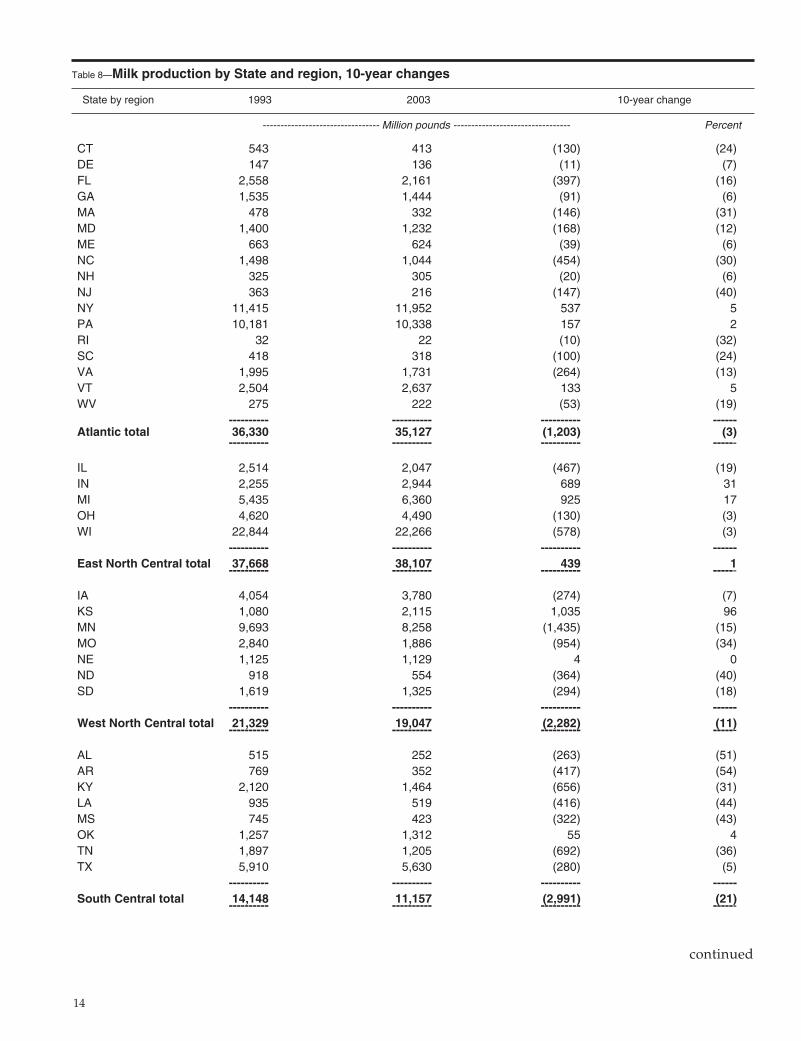
In the 10 years since 1993, nonfat dry milk pro-duction in the West more than doubled (increased 117percent) to 1.25 billion pounds in 2003, or 79 percent ofthe U.S. total (table 7; table 8 for regions). Productionin other regions, except the Atlantic, declined. Theincrease in the Atlantic region was 11 percent in 10years.
Likewise, milk production has seen major growthin the West during the same period, increasing by 25.7billion pounds (or 62 percent), to 67 billion pounds.The volume accounted for 39 percent of U.S. total milkproduction in 2003. The East North Central was theonly other region to show milk production increase,but only by 400 million pounds in 10 years. Theremaining three regions all showed decreases in milkproduction.
The trend is likely to continue, as indicated bythe costs and returns of milk production (table 7). Milkproducers in the West had the lowest operating costs,the lowest ownership costs and, therefore, the lowesttotal costs among the five regions in 2000, the year ofthe most recent national survey of milk producers.Although their returns above operating costs, at $3.33per hundredweight, were the median of the five
12
13
Table 7—Production of nonfat dry milk for human consumption, milk production and milk production costsand returns, by region.
East North West North South Atlantic Central Central Central West U.S. total
Production of nonfat dry milk for human food1:
-----------------------------------------------------Thousand pound------------------------------------------------------
1993 141,405 63,860 71,291 102,783 575,146 954,485 1998 192,045 56,961 87,151 59,034 740,192 1,135,383 2003 157,620 43,314 67,313 68,615 1,247,179 1,584,041 Region vs. U.S. total in 1993 15% 7% 7% 11% 60% 100%Region vs. U.S. total in 2003 10% 3% 4% 4% 79% 100%
Milk production2:-----------------------------------------------------Million pounds-----------------------------------------------------
1993 36,330 37,668 21,329 14,148 41,162 150,636 1998 36,573 36,928 19,959 12,308 51,580 157,348 2003 35,127 38,107 19,047 11,157 66,875 170,312 Region vs. U.S. total in 1993 24% 25% 14% 9% 27% 100%Region vs. U.S. total in 2003 21% 22% 11% 7% 39% 100%
Milk production costs and returns, 20003:---------------------------------------------Dollars per cwt. milk sold---------------------------------------------
Total operating costs 10.53 9.65 13.18 13.73 9.52 Total ownership costs 3.91 4.75 4.91 4.50 2.06 Total costs 14.44 14.40 18.09 18.23 11.58
Returns above operating costs 4.75 4.62 1.22 1.92 3.33 Returns above total costs 0.84 (0.13) (3.69) (2.58) 1.28
1 From Dairy Products, annual summaries, USDA/NASS.2 Summarized from Milk Production, Disposition and Income, annual summaries, USDA/NASSS.3 From Short, table 2; regions are defined on page 3 of the Short's report and are here used as proxies to represent those used in Dairy
Products: Northern Crescent-East (Atlantic), Northern Crescent-West (East North Central), Heartland (West North Central), Eastern Uplands(South Central) and Fruitful Rim-West (West). Costs and returns reported are based on the 2000 Agricultural Resource ManagementSurvey, the most recent national survey of milk producers.
14
Table 8—Milk production by State and region, 10-year changes
State by region 1993 2003 10-year change
--------------------------------- Million pounds --------------------------------- Percent
CT 543 413 (130) (24)DE 147 136 (11) (7)FL 2,558 2,161 (397) (16)GA 1,535 1,444 (91) (6)MA 478 332 (146) (31)MD 1,400 1,232 (168) (12)ME 663 624 (39) (6)NC 1,498 1,044 (454) (30)NH 325 305 (20) (6)NJ 363 216 (147) (40)NY 11,415 11,952 537 5PA 10,181 10,338 157 2RI 32 22 (10) (32)SC 418 318 (100) (24)VA 1,995 1,731 (264) (13)VT 2,504 2,637 133 5WV 275 222 (53) (19)
---------- ---------- ---------- ------Atlantic total 36,330 35,127 (1,203) (3)
---------- ---------- ---------- ------
IL 2,514 2,047 (467) (19)IN 2,255 2,944 689 31MI 5,435 6,360 925 17OH 4,620 4,490 (130) (3)WI 22,844 22,266 (578) (3)
---------- ---------- ---------- ------East North Central total 37,668 38,107 439 1---------- ---------- ---------- ------
IA 4,054 3,780 (274) (7)KS 1,080 2,115 1,035 96MN 9,693 8,258 (1,435) (15)MO 2,840 1,886 (954) (34)NE 1,125 1,129 4 0ND 918 554 (364) (40)SD 1,619 1,325 (294) (18)
---------- ---------- ---------- ------West North Central total 21,329 19,047 (2,282) (11)---------- ---------- ---------- ------
AL 515 252 (263) (51)AR 769 352 (417) (54)KY 2,120 1,464 (656) (31)LA 935 519 (416) (44)MS 745 423 (322) (43)OK 1,257 1,312 55 4TN 1,897 1,205 (692) (36)TX 5,910 5,630 (280) (5)
---------- ---------- ---------- ------South Central total 14,148 11,157 (2,991) (21)---------- ---------- ---------- ------
continued
regions, the West was the most profitable region interms of returns above total costs, at $1.28 per hun-dredweight (Short).
The returns above operating costs were all posi-tive in the other four regions, and these returns in theAtlantic and the East North Central regions were evenhigher than in the West. But the high ownership costsin the four regions resulted in only the Atlantic regionhaving positive returns above total costs, at 84 centsper hundredweight. The East North Central regioncould hardly break even, while the West North Centraland the South Central regions had substantial losses.
In the short run, dairying is sustainable for theexisting farmers in all regions. For the long term, somedairy farmers in the West North Central and the SouthCentral regions may find it difficult to justify investingin expansion or replacement of obsolete major farmstructures or equipment, and milk production in thetwo regions most likely will continue to decline. Milkproduction in the Atlantic and the East Central regionsmay or may not grow. Farmers in the Atlantic regionmay or may not find the 84 cents per hundredweightmargin high enough to induce production expansion,while in the East North Central, they may be able toovercome the small losses and improve their long-termmilk production prospect. Thus, the West is the regionthat is most certain to see continued growth in milkproduction that would support new plant capacity.
In fact, the growth in milk production in the Westrequires that every year the region have new plantcapacity capable of handling at least 7 million poundsof milk a day. This is the region (especially California,Idaho and New Mexico) where new milk proteinplants should be located, if they were to be built. Infact, the first two plants in the United States for MPCproduction are located in this region.
Location of end-users. End-users of milk proteiningredients, such as manufacturers of dairy productsusing wheyless process, would have much flexibilityin locating their plants. The manufacturing processwould use dried or shelf-stable dairy ingredients andsome, but probably not a large volume of, fresh milk.Manufacturers would look to locate their plants whereit is most convenient and at the least transportationcost to receive the ingredients (including milk) andserve customers. In other words, the plants do nothave to be in or near milk-producing areas.
Regional specialization of milk use. Because theWest has abundant and growing milk production, it isthe region where new capacities for making commodi-ty dairy products have been located in recent years.The advent of milk protein ingredient productionwould accentuate the trend.
In the regions outside the West, milk productionis generally holding steady, if not in decline. The milk-use trend shows demand mainly for fluid purposes
15
Table 8—Milk production by State and region, 10-year changes (continued)
State by region 1993 2003 10-year change
--------------------------------- Million pounds --------------------------------- Percent
AK 12 17 5 40AZ 1,876 3,454 1,578 84CA 22,924 35,437 12,513 55CO 1,454 2,177 723 50HI 142 92 (50) (35)ID 3,229 8,774 5,545 172MT 307 346 39 13NV 348 485 137 39NM 2,766 6,666 3,900 141OR 1,692 2,177 485 29UT 1,332 1,615 283 21WA 4,980 5,581 601 12WY 100 54 (46) (46)
---------- ---------- ---------- ------West total 41,162 66,875 25,713 62---------- ---------- ---------- ------
Source: Milk Production, Disposition and Income, annual summaries, USDA/NASS.
and for making traditional (standard) dairy products.There still would be nonfat dry milk plants in theseregions, mostly for last-resort processing and milksupply balancing. There may be sufficient milk volumein States such as Kansas, Michigan, Indiana and NewYork to support some new milk-protein ingredientproduction facilities. But they probably would be anenterprise within a dairy plant’s operations for servingcustomers in the local areas rather than large scale,stand-alone plants that could take full advantage ofthe economies of scale.
Roles of Dairy CooperativesIf the growth of the industry is going be driven
by the new technologies involving manufacturingingredients and making products using alternativemethods, then how do cooperatives fit into the schemeof things?
Augmented first-handler role. Dairy coopera-tives would continue to be the first-handlers, market-ing members’ milk to fluid and other processors andmanufacturing the remaining volume into variousproducts in their own plants. Even more of the first-handler functions may fall on cooperatives if end-usersof dry milk ingredients adopt wheyless processes anddo not need much fresh milk, thus having the optionof not having to locate their plants close to dairyfarms. These end-users most likely would not want todeal with milk procurement, field services, producerpayrolls, milk hauling, weather-induced intake vari-ability, and seasonality of milk production and compo-sition.
Besides marketing milk, dairy cooperatives’ first-handler role also includes marketing dairy productsproduced in their plants as dairy ingredients to foodmanufacturers. These include fluid skim, cream, con-densed products, mixes, UF milk, nonfat dry milk, but-ter or cheese for further processing. In the future itwould also include milk proteins.
Cooperatives are potential producers of milkprotein ingredients. One important function of dairycooperatives is supply balancing and last-resort pro-cessing of surplus milk, usually carried out in nonfatdry milk plants (or butter-powder plants) owned andoperated by dairy cooperatives. Making milk proteiningredients would be an alternative outlet for suchmilk. Dairy cooperatives are certainly going to play aprominent role in a milk protein ingredient sector if itbecomes economically feasible to produce such prod-ucts domestically.
In 2002, dairy cooperatives owned and operated43 dry milk plants and marketed 86 percent of the
Nation’s nonfat dry milk (Ling, 2004). As milk produc-tion continues to grow, more nonfat dry milk plantsmust be built to handle the “last-resort” volume,unless alternative uses of the milk could be found.Making milk protein ingredients requires a high vol-ume of skim milk as the input and would be a promis-ing alternative. As a matter of fact, dairy cooperativeshave been actively exploring the feasibility of makingsuch alternative products (Ling, et al), and two havetaken the step towards actual production. The Tempe,A.Z. plant is owned and operated by United Dairymenof Arizona, and the MPC/ingredient plant in Portales,N.M. is a joint venture of Dairy Farmers of America.California Dairies also has studied the feasibility ofmaking milk protein concentrate (Cotta; Kozak, et al).More such efforts by dairy cooperatives are likely inthe future.
Cooperatives as end-users of milk ingredients.Besides marketing members’ milk and making milkingredients for further processing, many dairy cooper-atives also use milk and milk ingredients to produceend-products for the wholesale market, food serviceindustry, or the consumer market. These end-productsare usually standard traditional dairy products.
However, some cooperatives have been makingnontraditional dairy or related products to satisfy con-sumers’ shifting demand or to have a complete line ofdairy and related products to offer customers. In mostcases, the nontraditional products are dairy-based, anddairy ingredients constitute the major share of themanufacturing inputs. They are seldom far afield fromthe dairy base, because it would be difficult for a dairycooperative to justify to its milk producer-members therationale of using their precious equities to marketproducts other than milk and milk products.
When cooperatives have ventured into uncon-ventional or trendy new products—such as niche bev-erages, sports drinks, nutritional food products, ornutraceutical foods, etc.—they often have relied onjoint-venture partners who have the technical know-how to make and market the products and to share thesubstantial market risk. The main purpose of coopera-tives in these ventures is to sell milk or milk ingredi-ents.
Dairy Cooperatives’ ChallengesIn a future that is driven by technology, dairy coopera-tives face many challenges. Chief among them are:
l Research and development.l Product development and marketing.
16
l Acquiring manufacturing and process technology.
l Equity Financing.
Research and development. Research and devel-opment is the foundation of manufacturing andprocess technology, product development and market-ing. Through check-off dollars, dairy farmers havefunded many research projects that provide informa-tion pertaining to the development of process technol-ogy. Many other projects have actually resulted in newor improved products being developed by applyingthe attributes of various dairy ingredients (DairyManagement Inc., 2004).
Valuable as they are, however, such genericefforts by dairy farmers need to be complemented byresearch and development work of individual coopera-tives or processors in the final stages of new productformulation. Only through its own research and devel-opment efforts can a cooperative (or processor) identi-fy and have a full grasp of its market niches and devel-op the products to satisfy the customers’ demand. (Fora look at one firm’s research and development, seeUSITC Hearing Proceedings and Dairy CompaniesAssociation of New Zealand.)
Product development and marketing. Everyyear, hundreds of new dairy products are introducedto the consumer market by processors, including coop-eratives. In 2003, a total of 794 new products (butter,cheese, milk, yogurt, ice cream/frozen yogurt, andother frozen desserts) debuted. The number of newproducts was 874 in 2002 (Prepared Foods).
New products may be developed by modifyingthe flavors, taste, colors, forms, packaging or shelf-lifeof existing products, or by fortifying them for desiredfunctionality. Some may be the organic versions of theproducts. Genuinely new varieties of specialty cheeseor products also have been introduced (Roberts, Jr.). Inmany areas of the country, efforts by dairy farmers toadd value to milk have produced many kinds of arti-san/farmstead cheeses, yogurts, and other dairy prod-ucts.
Product development also refers to using dairyingredients (or dairy products as ingredients) to devel-op or improve foods and beverages. Successful devel-opment of dairy ingredients depends on finding ways(or helping customers to find ways) to apply the func-tionality and health benefits of the ingredients in theformulation of new products. (See Haines for somerecent development.)
Developing new products is only the first step inopening up new markets for the dairy industry.
Consumer acceptance of newly developed dairy prod-ucts or new products that are formulated to exploit thefunctionality of dairy ingredients is vital to ultimatesuccess.
Marketing new consumer products requires mar-ket research, test marketing, advertising and promo-tion, consumer education, shelf space acquisition (pos-sibly by paying slotting fees to retailers to putproducts on the shelf), merchandizing, and servicingthe products. Although the rewards of developing andmarketing new consumer products may be substantial,the risks involved also may be great.
In marketing new dairy ingredients, the chal-lenge is to provide end-users (processors) with infor-mation on the attributes and functionality of an ingre-dient. Such information must be scientificallydocumented. The marketer also must be ready to servethe needs of the processors. For example, the marketermay have to show the processors, or work with them,on the best way to use the ingredient in formulatingend products and the best way to process the endproducts.
Acquiring manufacturing and processing tech-nology. Machinery and equipment are the embodi-ment of manufacturing technology. Cooperatives usu-ally acquire new manufacturing technology by buyingnew machinery and equipment. However, as the scaleof dairy plants grows larger, the cost of building a newplant with new machinery and equipment is substan-tial. The challenge is whether dairy cooperatives couldafford the new plant, both in financial terms and interms of milk volume that is needed to sustain theoperations, to keep up with technology advancement.This is a particular challenge for cooperatives thatengage in processing commodity dairy products. (Seebox 2 for examples of the required milk volumes andcosts of some recent plants.)
To differentiate value-added products and gaincompetitive advantages, cooperatives, like otherprocessors, adopt new ways to manufacture or pack-age them or enhance the particular attributes of theproducts (nutritional benefits, functionality, flavors,shelf life, etc.). Such undertakings often require modi-fying the manufacturing or packaging process. Thechallenge for cooperatives is to devote adequateresources to develop or acquire the process technology.
The other aspect of process technology develop-ment is finding new ways to make existing products.An example is the wheyless process for the productionof “mozzarella cheese” cited earlier in this report.
17

The Ultimate Challenge—Equity FinancingAll of this—building new plants, buying new
equipment, developing and modifying manufacturingprocesses, developing and marketing new products,and engaging in research and development to competein a technology-driven industry—requires adequatefinancing.
Unique equity financing of cooperatives. Thereare two broad sources of financing: debt financing(borrowing) and equity financing. A dairy coopera-tive’s debt financing may work much the same way asany business. Its equity financing, however, is uniqueand may have the following features:
l Common stock: Some cooperatives may issuecommon stock to cooperative membershipwhich is usually of nominal value.
l Retained patronages: Net savings that are allo-cated to members based on patronage but areretained to finance the cooperative’s operationsafter paying members the cash portion.Members must treat the entire allocated patron-ages as income for tax purposes. Cooperativesusually revolve retained patronage back tomembers after a certain period of time.
l Capital retains: Money that is withheld at acertain rate per hundredweight of milk tofinance the cooperative’s operations. Membersmust treat capital retains as income for tax pur-poses. Capital retains are also revolved back tomembers after a certain period of time.
l Base capital plan: Under the plan, a target basecapital level is established at a rate per hun-dredweight of milk marketed during a repre-sentative period. This provides an adequatelevel of equity capital for the operations of thecooperative. The base capital may be funded byretained patronage and/or capital retains, or byother means of member contribution. Once amember attains the prescribed base capitallevel, patronage earnings allocated to the mem-ber are paid in cash.
l Retained earnings: Retained net savings thatare earned on non-member business. (A coop-erative may jeopardize its Capper-Volstead sta-tus if its non-member business is more than 50percent of the total.)
18
Milk volume and the costs of some newcooperative plants
A new plant for making Cheddar cheese in 640-pound block packages is being built in Clovis,New Mexico, at a cost of $190 million. When fullyoperational, the plant will process 2.4 billionpounds of milk a year, or about 7 million poundsof milk a day (Dairy Farmers of America). Also, twonew mozzarella cheese plants in California willeach have a capacity of 6 million pounds of milk aday when in full operation (Dairy Foods, Vol. 104,No. 2 and Vol. 105, No. 4).
A new butter churn commissioned in 2003 inWashington has a capacity of 28,000 pounds of but-ter per hour (Northwest Dairy Association). Thatamount of butter is equivalent to the butterfat con-tained in 625,000 pounds of milk per hour or 5 mil-lion pounds of milk in an 8-hour day.
A plant capable of handling 5 million poundsof milk a day to make nonfat dry milk and MPC isestimated to cost more than $108 million (Cotta). Astate-of-the-art “green-field” (instead of add-ons)nonfat dry milk plant would handle 5 millionpounds of milk a day and would cost about $70million.
On the other hand, plants that engage in mak-ing “value-added” products (vs. commodity prod-ucts) are usually of smaller scale, although theymay be similarly expensive. An example is a blockcheddar cheese plant with a capacity of 1.6 millionpounds of milk a day that was completed in late2001 in Oregon at a cost of $50 million (Phillips).Another example is a cooperative organized by agroup of Amish dairy farmers in northern Iowaand southern Minnesota five years ago. It hasinvested more than $1 million in a plant that has acapacity of processing about 20,000 pounds of milkdaily into specialty blue cheese (Perkins).
For an example of a milk-protein fraction plant,Fonterra, a New Zealand cooperative, startedlactoferrin production in September 2004 in a newplant in Hautapu, New Zealand, that cost $15 mil-lion (Fonterra News).
Financing challenges. Managing the coopera-tive’s unique way of equity financing is a constantchallenge that is three-pronged:
l Member-producers—Members must treat theretained patronages, when allocated, as incomefor tax purposes. The same applies to capitalretains. Although the retains are revolved backto members as permitted by cooperative earn-ings, their value is heavily discounted becausethe revolving period is usually several years orlonger. The retains also compete with the capi-tal needs on the farm. It is only natural thatmembers want as little retains and as short arevolving period as possible.
l Cooperative operations—Cooperatives requirean adequate level of capital to finance theiroperations and satisfy the covenants of lendinginstitutions. This capital need is in conflict withmembers’ desire of having little retains and ashort revolving period.
l Lending institutions—To lower the risk of loanexposure, lending institutions usually require acooperative to maintain a certain level of equityvis-à-vis its assets and have ample workingcapital for operations. This again runs counterto members’ desire for as little retains as possi-ble. Furthermore, because cooperatives usuallyrevolve retains to members after a certain peri-od of time, some lending institutions may notconsider member equity as permanent capitaland would rather cooperatives have as long arevolving period as possible. (This is one rea-son why cooperatives need special lendinginstitutions that understand the cooperativeform of business.)
The base capital plan may be viewed as a com-promise among the three conflicting interests. Underthe plan, a target base capital level that would ade-quately finance a cooperative’s operations is estab-lished. An advantage of the plan is that once the pre-scribed base capital level is attained, a member canexpect to receive all allocated patronage earnings incash. Furthermore, base capital is revolved only after amember is retired from the cooperative. This givesbase capital a certain degree of permanency that helpsrelieve the risk concerns of lending institutions. Thedecision-making process of setting the base capital
level may be easier for members to understand andmay help allay members’ anxieties over whether allthe capital retained by the cooperative is necessary.
Equity financing alternatives. In 2002, equity perhundredweight of milk averaged $2.10 for coopera-tives that responded to a marketing operations surveyby USDA Rural Business-Cooperative Service(Liebrand). For that same year, the survey showed thatmilk volume per member-producer was 2.3 millionpounds (Ling). Therefore, average equity per member-producer was $48,000 (rounded). This was an increaseof 60 percent from $30,000 in 1997, based on the find-ings from the same survey conducted 5 years earlierthat equity per hundredweight was $2.07 and milk permember-producer was 1.4 million pounds.
It is noteworthy that the 60-percent increase inequity per member-producer from 1997 to 2002 wasalmost entirely attributable to the 59-percent increasein per-producer milk volume. On a per hundredweightbasis, the equity needed to market members’ milkbarely changed in 5 years. It increased by about 1 per-cent, from $2.07 in 1997 to $2.10 in 2002.
However, during the same 5-year period, cooper-ative assets per hundredweight of member milkincreased by 97 cents (18 percent) from $5.25 to $6.22,while cooperative liabilities increased by 95 cents perhundredweight (30 percent) from $3.18 to $4.13. On aper hundredweight basis, almost all increases in capi-tal needs of cooperatives were from debt financing.Contribution by cooperative member-producers to theincreased capital needs was close to nothing.Cooperative growth was mostly financed by debts.
Depending on the type of operations a coopera-tive is engaged in, its equity per hundredweight mayvary widely from the average. In 2002, although theaverage was $2.10, equity in bargaining cooperativeswas only 27 cents per hundredweight; commoditymanufacturing cooperatives, $1.60; niche marketingcooperatives, $5.80; and diversified and fluid-process-ing cooperatives, $2.80. Nevertheless, the fact remainsthat financing cooperative operations is a major finan-cial commitment for all member-producers.
There have been various alternative equityfinancing methods proposed for reducing cooperativemembers’ fiscal burden and investment risks. Exceptfor the joint-venture model, none of the alternatives isparticularly useful for dairy cooperatives.
l Public stock corporation—Cooperatives may beorganized as a stock corporation and sell someor all stock to the public. The idea is to attractinvestors’ capital into the cooperative to lessen
19
the financial burden of member-producers.And, if the business performs well, stockwould appreciate in value and member-pro-ducers have an efficient stock market to cashin.
However, it is difficult to operate a publicstock corporation on a cooperative basisbecause of one or all of the following: (1)Investors would have problems with operatingthe corporation on a cooperative basis, espe-cially its one-person-one-vote democratic con-trol; (2) Producers support the cooperative’sbusiness by patronizing it while investors donot; (3) With investor capital, the cooperativeis likely to lose its Capper-Volstead status; (4)In a dairy cooperative, the distinction betweenmilk pay prices and premiums on the onehand and profits on the other is not clear-cut,and the conflicts between producers andinvestors may be very difficult to reconcile;and (5) There are fundamental conflictsbetween benefits for member-producers andinvestors’ focus on returns on investment.
There was one known case of public offeringof a dairy cooperative’s common stock. InApril 1988, a dairy cooperative converted itsfluid business subsidiary into a publicly trad-ed stock company with the idea of usinginvestor financing and stock as tools forexpansion and growth, while maintaining themajority ownership of the business (FarmerCooperatives). However, by the end of 1991, thecooperative bought back all outstanding stockfrom minority owners.
l Some cooperatives may issue preferred securi-ties or bonds to tap non-member capital. Butthese usually carry a fixed interest rate and donot have bearing on ownership issues andshould be considered as debts rather than equi-ty capital.
l Limited liability company (LLC)—An LLC is astate-approved, unincorporated association,just like a partnership except that it protects itsowners and agents from personal liability fordebts and other obligations of the LLC.Earnings pass through to the owners (no non-qualified retains) and enjoy single tax treat-ment. An LLC may operate on a cooperative
basis. Or it may allocate earnings and lossesand assign votes among themselves as they seefit (Frederick).
The LLC form of business organization becamepopular after tax rules over them were modi-fied in 1997. Some producers perceive the flex-ibility provided by an LLC as a vehicle for tap-ping outside capital. However, thecombination of producers and investors in anLLC would encounter the same issues as in apublicly traded corporation that attempts tooperate on a cooperative basis. There is nodairy cooperative known to have been orga-nized as an LLC.
l Joint venture—The LLC may be a useful modelfor established cooperatives to form joint ven-tures with other cooperatives or with otherfirms. On the marketing side, a joint ventureLLC may be used by a cooperative and its part-ner to develop and market certain dairy prod-ucts. The cooperative supplies the milk and thepartner its technical and marketing know-howto the LLC.
The joint-venture partners share the financingand the risk of the business activities of theLLC. This organizational model reduces coop-erative members’ financing burden and riskexposure, while a market outlet for milk issecured.
Many recent joint ventures formed by coopera-tives with other business entities are organizedas LLCs.
l “New-generation” cooperative—A new-gener-ation cooperative usually requires significantequity investment as a prerequisite to member-ship and delivery right, in order to ensure thatan adequate level of capital is raised and theplant capacity is fully utilized. The deliveryright is in the form of equity shares that can besold to other eligible producers at prices agreedto by the buyer and seller, subject to theapproval of the board of directors. The trans-ferable delivery right is appealing to membersbecause it allows them to cash in any increasein the value of their cooperative upon retire-ment.
20

Interest in new-generation cooperatives surgedin the 1980s and 1990s, largely in response tothe market condition prevailing during thattime period. Cooperative development leadersbelieved that this form of cooperative organi-zation would solve the problem of depressedfarm income by engaging in value-added pro-cessing.
The new-generation cooperative model has itsstrengths, but its characteristics also have cre-ated a host of problems. After the turn of the21st century, the so-called fever for it hascooled down substantially. (For a succinct eval-uation of new generation cooperatives, seeTorgerson.)
There was only one dairy cooperative knownto have been organized using the new-genera-tion model. In 1995, Dakota Dairy Specialtieswas established to make specialty cheese(Campbell, 1995). But its remote location, thecapital investment needed to renovate its plantand the skill required to make and market spe-cialty cheese posed major problems, and thenew-generation model proved no help. It suf-fered the same fate as Hebron CooperativeCreamery, the struggling cooperative it wasformed to replace. By 1999, Dakota DairySpecialties ceased to operate.
ConclusionTechnology opens up opportunities for using milk anddairy ingredients in new ways and in new products.Along with its advances, dairy industry dynamismalso evolves. The promising rewards of adapting tonew technology could be exciting but the necessaryindustry adjustment could be challenging to dairyfarmers and their cooperatives. This report suggeststhat success depends upon:
l Adequate member equity capital.l Well thought-out business strategy and plans
that focus on the core business of marketingmilk, milk products and milk-based ingredi-ents.
l Identification of new products and marketsthrough research and development.
Epilogue: Parallel to Processing TomatoIndustry
Advances in technology have caused milk pro-duction to undergo dramatic changes and induced thewestward production expansion (table 7; also seeBlayney). The abundant milk supply in the West makesthe region most conducive to manufacturing commod-ity dairy products. The West has become the majorsupplier of milk-based ingredients (commodity dairyproducts and, potentially, fractionalized components)for further processing across the United States, whilethe traditional dairy regions now mostly provide freshmilk to satisfy the demand of the fluid market and thedemand of the manufacturing sector that makescheese, butter and other value-added or niche dairyproducts. The evolution of the milk industry has astriking resemblance to the development in the tomatoindustry.
Like milk, tomatoes are produced in every Statein the Nation and have two use categories: tomatoesfor fresh market and tomatoes for processing (ERS).
In 2003, commercial-scale production of field-grown tomatoes for fresh market was reported in 17States, a decrease from 32 States in the 1950s. (Cherry,grape, tomatillo and the fast-expanding production ofgreenhouse tomatoes are excluded from reporting.)However, production increased 70 percent over thetime period. Florida, with 43 percent of the Nation’sproduction in 2003, was the leading producer of fresh-market tomatoes, followed by California’s 28 percent(table 9). Fresh-market tomatoes are hand-picked andsold on the open market, at prices that are far higherthan tomatoes for processing.
In contrast, production of tomatoes for process-ing is highly concentrated in California, usually undercontracts between growers and processors. The Statehas accounted for around 95 percent of the Nation’sproduction since the mid-1990s (table 10). In 2003, onlysix other States were reported to have some significantbut very minor shares of production. This is a far cryfrom the 1950s, when the production of 33 States wasreported and California’s share was 55 percent. Threebroad categories of technological advances changedthe landscape: (1) Development of tomato varietiesthat were able to withstand the rigors of machine har-vesting and bulk handling; (2) development of amechanical harvester; and (3) development of bulkstorage of tomato products.
Efforts to develop a variety of tomato able towithstand the rigors of machine harvesting and bulkhandling started in the late 1940s in California, fol-lowed by the development of a mechanical harvester.
21
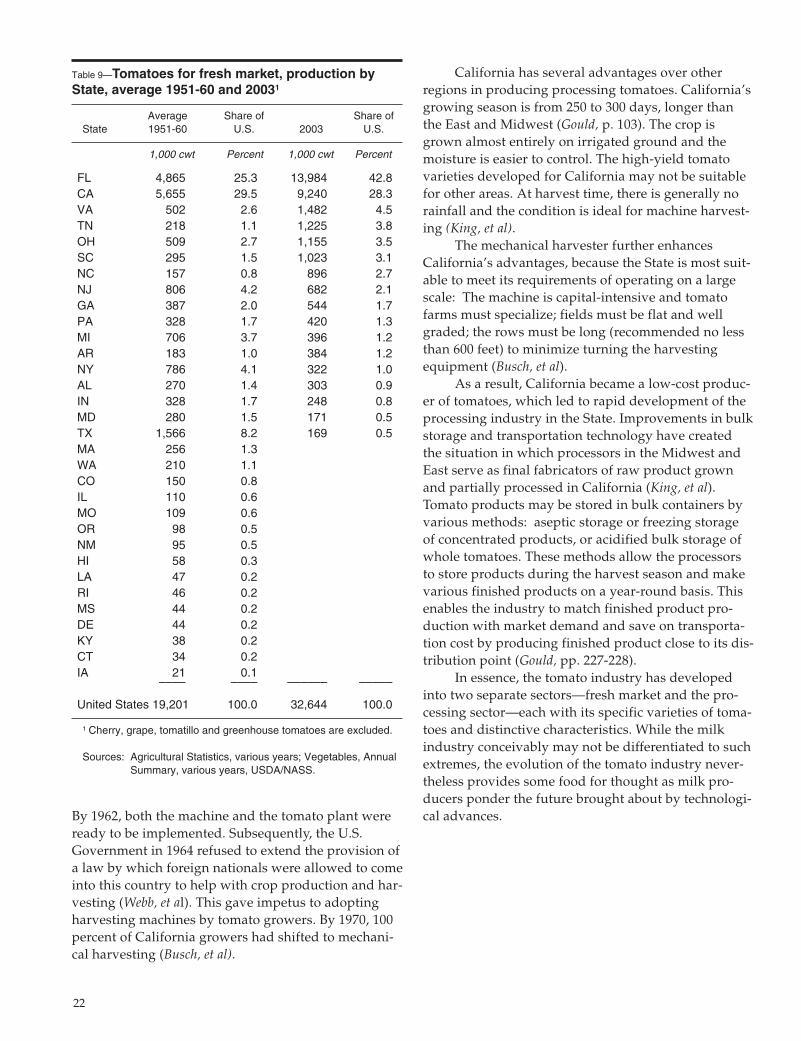
By 1962, both the machine and the tomato plant wereready to be implemented. Subsequently, the U.S.Government in 1964 refused to extend the provision ofa law by which foreign nationals were allowed to comeinto this country to help with crop production and har-vesting (Webb, et al). This gave impetus to adoptingharvesting machines by tomato growers. By 1970, 100percent of California growers had shifted to mechani-cal harvesting (Busch, et al).
California has several advantages over otherregions in producing processing tomatoes. California’sgrowing season is from 250 to 300 days, longer thanthe East and Midwest (Gould, p. 103). The crop isgrown almost entirely on irrigated ground and themoisture is easier to control. The high-yield tomatovarieties developed for California may not be suitablefor other areas. At harvest time, there is generally norainfall and the condition is ideal for machine harvest-ing (King, et al).
The mechanical harvester further enhancesCalifornia’s advantages, because the State is most suit-able to meet its requirements of operating on a largescale: The machine is capital-intensive and tomatofarms must specialize; fields must be flat and wellgraded; the rows must be long (recommended no lessthan 600 feet) to minimize turning the harvestingequipment (Busch, et al).
As a result, California became a low-cost produc-er of tomatoes, which led to rapid development of theprocessing industry in the State. Improvements in bulkstorage and transportation technology have createdthe situation in which processors in the Midwest andEast serve as final fabricators of raw product grownand partially processed in California (King, et al).Tomato products may be stored in bulk containers byvarious methods: aseptic storage or freezing storageof concentrated products, or acidified bulk storage ofwhole tomatoes. These methods allow the processorsto store products during the harvest season and makevarious finished products on a year-round basis. Thisenables the industry to match finished product pro-duction with market demand and save on transporta-tion cost by producing finished product close to its dis-tribution point (Gould, pp. 227-228).
In essence, the tomato industry has developedinto two separate sectors—fresh market and the pro-cessing sector—each with its specific varieties of toma-toes and distinctive characteristics. While the milkindustry conceivably may not be differentiated to suchextremes, the evolution of the tomato industry never-theless provides some food for thought as milk pro-ducers ponder the future brought about by technologi-cal advances.
22
Table 9—Tomatoes for fresh market, production byState, average 1951-60 and 20031
Average Share of Share ofState 1951-60 U.S. 2003 U.S.
1,000 cwt Percent 1,000 cwt Percent
FL 4,865 25.3 13,984 42.8CA 5,655 29.5 9,240 28.3VA 502 2.6 1,482 4.5TN 218 1.1 1,225 3.8OH 509 2.7 1,155 3.5SC 295 1.5 1,023 3.1NC 157 0.8 896 2.7NJ 806 4.2 682 2.1GA 387 2.0 544 1.7PA 328 1.7 420 1.3MI 706 3.7 396 1.2AR 183 1.0 384 1.2NY 786 4.1 322 1.0AL 270 1.4 303 0.9IN 328 1.7 248 0.8MD 280 1.5 171 0.5TX 1,566 8.2 169 0.5MA 256 1.3WA 210 1.1CO 150 0.8IL 110 0.6MO 109 0.6OR 98 0.5NM 95 0.5HI 58 0.3LA 47 0.2RI 46 0.2MS 44 0.2DE 44 0.2KY 38 0.2CT 34 0.2IA 21 0.1
–––– –––– –––––– –––––
United States 19,201 100.0 32,644 100.0
1 Cherry, grape, tomatillo and greenhouse tomatoes are excluded.
Sources: Agricultural Statistics, various years; Vegetables, AnnualSummary, various years, USDA/NASS.
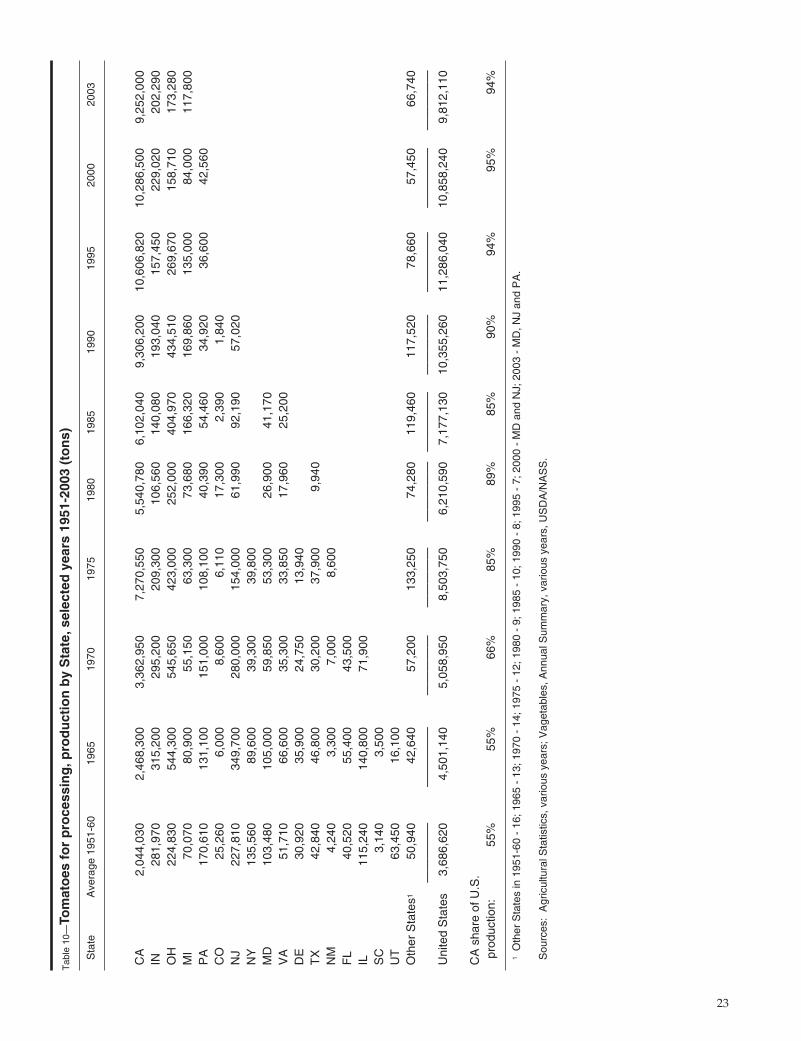
23
Tab
le 1
0—To
mat
oes
fo
r p
roce
ssin
g, p
rod
uct
ion
by
Sta
te, s
elec
ted
yea
rs 1
951-
2003
(to
ns)
Sta
teA
vera
ge 1
951-
6019
6519
7019
7519
8019
8519
9019
9520
0020
03
CA
2,04
4,03
02,
468,
300
3,36
2,95
07,
270,
550
5,54
0,78
06,
102,
040
9,30
6,20
010
,606
,820
10,2
86,5
009,
252,
000
IN28
1,97
031
5,20
029
5,20
020
9,30
010
6,56
014
0,08
019
3,04
015
7,45
022
9,02
020
2,29
0 O
H22
4,83
054
4,30
054
5,65
042
3,00
025
2,00
040
4,97
043
4,51
026
9,67
015
8,71
017
3,28
0 M
I70
,070
80,9
0055
,150
63,3
0073
,680
166,
320
169,
860
135,
000
84,0
0011
7,80
0 P
A17
0,61
013
1,10
015
1,00
010
8,10
040
,390
54,4
6034
,920
36,6
0042
,560
CO
25,2
606,
000
8,60
06,
110
17,3
002,
390
1,84
0N
J22
7,81
034
9,70
028
0,00
015
4,00
061
,990
92,1
9057
,020
N
Y13
5,56
089
,600
39,3
00
39,8
00
MD
103,
480
105,
000
59,8
5053
,300
26,9
0041
,170
V
A51
,710
66,6
0035
,300
33,8
5017
,960
25,2
00
DE
30,9
2035
,900
24,7
5013
,940
T
X42
,840
46,8
0030
,200
37,9
009,
940
NM
4,24
03,
300
7,00
08,
600
FL
40,5
2055
,400
43,5
00
IL11
5,24
014
0,80
071
,900
S
C3,
140
3,50
0 U
T63
,450
16,1
00
Oth
er S
tate
s150
,940
42,6
4057
,200
133,
250
74,2
8011
9,46
011
7,52
078
,660
57,4
5066
,740
—
——
——
——
——
——
——
——
——
——
——
——
——
——
——
——
——
——
——
——
——
——
——
——
——
—U
nite
d S
tate
s3,
686,
620
4,50
1,14
05,
058,
950
8,50
3,75
06,
210,
590
7,17
7,13
010
,355
,260
11,2
86,0
4010
,858
,240
9,81
2,11
0
CA
sha
re o
f U.S
. pr
oduc
tion:
55%
55%
66%
85%
89%
85%
90%
94%
95%
94%
1O
ther
Sta
tes
in 1
951-
60 -
16;
196
5 -
13; 1
970
- 14
; 197
5 -
12; 1
980
- 9;
198
5 -
10; 1
990
- 8;
199
5 -
7; 2
000
- M
D a
nd N
J; 2
003
- M
D, N
J an
d P
A.
Sou
rces
: A
gric
ultu
ral S
tatis
tics,
var
ious
yea
rs; V
aget
able
s, A
nnua
l Sum
mar
y, v
ario
us y
ears
, US
DA
/NA
SS
.
References
American Dairy Products Institute. IngredientDescription Brochure, 2002,http://www.adpi.org/publications.asp?start=8.
Blayney, Don P. The Changing Landscape of U.S. MilkProduction, United States Department ofAgriculture, Economic Research Service,Statistical Bulleting Number 978, June 2002.
Campbell, Dan. “Temperature Rising: Co-op FeverStill Sizzling Across North Dakota,” FarmerCooperatives, United States Department ofAgriculture, August 1995, pp. 10-16.
Cessna, Jerry. Milk Protein Products and RelatedGovernment Policy Issues, Agricultural MarketingService, USDA, February 2004.
Chandan, Ramesh. Dairy-Based Ingredients, EaganPress, St, Paul, M.N., 1997.
Childs, Terry (Fonterra (USA)). Statement before theInternational Trade Commission, ConcerningInvestigation No. 332-453, Conditions of Competitionfor Milk Protein Products in the U.S. Market,December 11, 2003.
Cotta, Richard. Testimony of California Dairies, Inc.Before the United States International TradeCommission Concerning Investigation No. 332-453,Conditions of Competition for Milk Protein Productsin the United States, December 11, 2003.
Dairy Australia. Pre-hearing Brief, regarding UnitedStates International Trade Commission Investigation#332-453, Conditions of Competition for Milk ProteinProducts in the United States, December 1, 2003.
Dairy Companies Association of New Zealand. Post-hearing Brief, in the Matter of Conditions ofCompetition for Milk Protein Products in the U.S.Market, United States International TradeCommission Investigation No. 332-453, December23, 2003 p. 3.
Dairy Farmers of America. “DFA Breaks Ground onJoint Venture,” DFA Leader, March 2004, p. 1.
Dairy Foods. “Leprino Starts Production in Lemoore,”Dairy Foods, Volume 104, Number 2, February2003, p. 11.
———————. “LO’L Tulare Plant to DoubleCapacity,” Dairy Foods, Volume 105, Number 4,April 2004, p. 10.
Dairy Management Inc. “Whey Points The Way ToMore Effectively Using Milk As A RawMaterial,” Dairy Dimensions, Volume 5, Issue 3,2002, pp. 5-6.
———————. Dairy Research and Applications forYour Business, 1998-2004 Program Overview, 2004.
Farmer Cooperatives. “LOL Resumes Stock Sales,”Farmer Cooperatives, United States Department ofAgriculture, May 1988, p. 22.
Fonterra News. “Fonterra Plant Advances Value-AddManufacturing Technology,” Fonterra News,October 19, 2004.
Frederick, Donald A. “The ABCs of LLCs: LimitedLiability Companies Offer New Option for RuralBusinesses,” Rural Cooperatives, United StatesDepartment of Agriculture, July/August 1997.
Frierott, John (Slim-Fast Foods Company). Testimonybefore the International Trade Commission,Concerning Investigation No. 332-453, Conditions ofCompetition for Milk Protein Products in the U.S.Market, December 11, 2003.
Haines, Bill. “New Directions in New Dairy,” PreparedFoods, January 2004, pp.97-104.
Hendrickx, Toine (DMV International). Statement beforethe United States International Trade Commission,Concerning Investigation No. 332-453, Conditions ofCompetition for Milk Protein Products in the U.S.Market, December 11, 2003.
Jesse, Ed. U.S. Imports of Concentrated Milk Proteins:What We Know and Don’t Know? Marketing andPolicy Paper No. 80, Department of Agriculturaland Applied Economics, College of Agriculturaland Life Sciences, University of Wisconsin-Madison, February 2003.
24
Koph, Henry. “Closed Loop Filtration Leads toUntapped Markets,” Dairy Foods, Volume 104,Number 5, May 2003, pp. 35-39.
Kosikowski, Frank V. Cheese and Fermented Milk Foods,second edition, 3rd printing with revisions, F. V.Kosikowski and Associates, Brooktondale, NewYork, 1982.
Kozak, Jerome and Peter Vitaliano (National MilkProducers Federation). Post-hearing Submission ofthe Milk Producer Community to the InternationalTrade Commission, Concerning Investigation No.332-453, Conditions of Competition for Milk ProteinProducts in the U.S. Market, January 15, 2004.
Liebrand, Carolyn. Financial Profile of DairyCooperatives, 2002, United States Department ofAgriculture, Rural Business-Cooperative Service,RBS Research Report #203, September, 2004.
Ling, K. Charles, and Andrew J. McAloon. TheFeasibility of Producing Casein in the United States,a United States Department of Agriculture, RuralBusiness-Cooperative Service technical assistancereport to the National Milk ProducersFederation, October 1999.
Ling, K. Charles. Marketing Operations of DairyCooperatives, 2002, United States Department ofAgriculture, Rural Business-Cooperative Service,RBS Research Report #201, February, 2004.
Manchester, Alden C. The Public Role in the DairyEconomy: Why and How Governments Intervene inthe Milk Business, Westview Press, Boulder, CO.,1983.
National Dairy Council. Newer Knowledge of DairyFoods,http://www.nationaldairycouncil.org/nutri-tion/products/milk.asp?page=4.
National Milk Producers Federation. U.S. DairyProteins Program, a proposal submitted to the U.S.Department of Agriculture, May 14, 2003.
Northwest Dairy Association. “Issaquah Plant BoastsLargest Butter Churn in U.S.,” The Dairy Producer,August 2004.
Parsons, Cecilia. “Milk Protein Concentrates NowProduced in New Mexico,” Dairy Foods, Volume105, Number 1, January 2004.
Perkins, Jerry. “Cheese Helps Preserve A Way of Life,”Des Moines Register, October 3, 2004.
Phillips, David. “A Model of Consistency: ColumbiaRiver Processing, a Subsidiary of TillamookCheese,” Dairy Foods, Volume 103, Number 2,February 2002.
Prepared Foods. “Dairy Products Scorecard—NewProduct Trends,” Prepared Foods, April 2004.
Roberts, Jr., William A. “Defining Dairy,” PreparedFoods, March 2003, pp.33-36.
Short, Sara D. Characteristics and Production Costs ofU.S. Dairy Operations, USDA Economic ResearchService, Statistical Bulletin Number 974-6,February 2004.
Smith, Karen E. “Background on Milk ProteinProducts,” Wisconsin Center for Dairy Research,August 2001, in Dairy Proteins, Wisconsin Centerfor Dairy Research and the Wisconsin MilkMarketing Board, http://www.cdr.wisc.edu/.
Torgerson, Randall E. “A Critical Look at New-Generation Cooperatives,” Rural Cooperatives,United States Department of Agriculture,January/February 2001, pp.15-19.
United States Department of Agriculture, AgriculturalMarketing Service (AMS). Dairy Market News,various weekly issues.
United States Food and Drug Administration (FDA).21 C.F.R., Part 133: Cheese and Related CheeseProducts, (commonly known as standards ofidentity), http://www.fda.gov/, and enter “21C.F.R., Part 133” to search.
———————. “Cottage Cheese Deviating FromIdentity Standard: Temporary Permit for MarketTesting,” Federal Register, Vol. 69, No. 236,December 9, 2004.
25
United States General Accounting Office (GAO). DairyProducts: Imports, Domestic Production, andRegulation of Ultra-filtered Milk, GAO-01-326,Washington, DC, March 5, 2001.
United States International Trade Commission(USITC). Conditions of Competition for Milk ProteinProducts in the U.S. Market, Investigation No. 332-453, USITC Publication 3692, May 2004.
———————. Hearing Proceedings, in the Matter ofConditions of Competition for Milk ProteinProducts in the U.S. Market, Investigation No.332-453, December 11, 2003, pp. 365-370.
United States Patent and Trademark Office (USPTO).United States Patent 6,372,268, Silver, et al.“Wheyless Process for Production of NaturalMozzarella Cheese,” April 16, 2002. Search bypatent number at http://www.uspto.gov/.
References on Tomatoes
Busch, Lawrence, William B. Lacy, Jeffrey Burkhardt,and Laura R. Lacy. Plants, Power, and Profit: Socialand Ethical Consequences of the New Biotechnologies,Basil Blackwell, Inc., Cambridge, Massachusetts,1991, chapter 5.
United States Department of Agriculture, EconomicResearch Service (ERS). Tomatoes: Background,http://www.ers.usda.gov/Briefing/Tomatoes/,November 19, 2004.
Gould, Wilbur A. Tomato Production, Processing andTechnology, CTI Publications, Inc., Baltimore,Maryland, 1992.
King, Gordon A., E. V. Jesse and B. C. French. EconomicTrends in the Processing Tomato Industry,University of California-Davis, Department ofAgricultural Economics, August, 1973. (GianniniFoundation Information Series No. 73-4).
Webb, Raymond E. and W. M. Bruce. “Redesigning theTomato for Mechanized Production,” TheYearbook of Agriculture 1968, United StatesDepartment of Agriculture, pp. 103-107.
26
U.S. Department of AgricultureRural Business–Cooperative ServiceStop 3250
Washington, D.C. 20250-3250
Rural Business–Cooperative Service (RBS) provides research,
management, and educational assistance to cooperatives to
strengthen the economic position of farmers and other rural
residents. It works directly with cooperative leaders and
Federal and State agencies to improve organization,
leadership, and operation of cooperatives and to give guidance
to further development.
The cooperative segment of RBS (1) helps farmers and other
rural residents develop cooperatives to obtain supplies and
services at lower cost and to get better prices for products they
sell; (2) advises rural residents on developing existing
resources through cooperative action to enhance rural living;
(3) helps cooperatives improve services and operating
efficiency; (4) informs members, directors, employees, and the
public on how cooperatives work and benefit their members
and their communities; and (5) encourages international
cooperative programs. RBS also publishes research and
educational materials and issues Rural Cooperatives magazine.
The U.S. Department of Agriculture (USDA) prohibits
discrimination in all its programs and activities on the basis of
race, color, national origin, sex, religion, age, disability,
political beliefs, sexual orientation, and marital or family
status. (Not all prohibited bases apply to all programs.)
Persons with disabilities who require alternative means for
communication of program information (braille, large print,
audiotape, etc.) should contact USDA’s TARGET Center at
(202) 720-2600 (voice and TDD).
To file a complaint of discrimination, write USDA, Director,
Office of Civil Rights, Room 326-W, Whitten Building, 14th and
Independence Avenue, SW, Washington, D.C. 20250-9410 or
call (202) 720-5964 (voice or TDD). USDA is an equal
opportunity provider and employer.

U.S. Department of AgricultureRural Business–Cooperative ServiceStop 3250
Washington, D.C. 20250-3250
Rural Business–Cooperative Service (RBS) provides research,
management, and educational assistance to cooperatives to
strengthen the economic position of farmers and other rural
residents. It works directly with cooperative leaders and
Federal and State agencies to improve organization,
leadership, and operation of cooperatives and to give guidance
to further development.
The cooperative segment of RBS (1) helps farmers and other
rural residents develop cooperatives to obtain supplies and
services at lower cost and to get better prices for products they
sell; (2) advises rural residents on developing existing
resources through cooperative action to enhance rural living;
(3) helps cooperatives improve services and operating
efficiency; (4) informs members, directors, employees, and the
public on how cooperatives work and benefit their members
and their communities; and (5) encourages international
cooperative programs. RBS also publishes research and
educational materials and issues Rural Cooperatives magazine.
The U.S. Department of Agriculture (USDA) prohibits
discrimination in all its programs and activities on the basis of
race, color, national origin, gender, religion, age, disability,
political beliefs, sexual orientation, and marital or family
status. (Not all prohibited bases apply to all programs.)
Persons with disabilities who require alternative means for
communication of program information (braille, large print,
audiotape, etc.) should contact USDA’s TARGET Center at
(202) 720-2600 (voice and TDD).
To file a complaint of discrimination, write USDA, Director,
Office of Civil Rights, Room 326-W, Whitten Building, 14th and
Independence Avenue, SW, Washington, D.C. 20250-9410 or
call (202) 720-5964 (voice or TDD). USDA is an equal
opportunity provider and employer.

United StatesDepartment ofAgriculture
Rural Business–CooperativeService
RBS ResearchReport 000


![[T. Franks, M. Kay, Smith L. E. D.] Water Economi(BookSee.org)](https://img.pdfslide.us/doc/110x75/577c82431a28abe054b01e8d/t-franks-m-kay-smith-l-e-d-water-economibookseeorg.jpg)